An Index of Early Left Ventricular Filling That Combined With Pulsed Doppler Peak E Velocity May...
7
An Index of Early Left Ventricular Filling That Combined With Pulsed Doppler Peak E Velocity May Estimate Capillary Wedge Pressure MARIO J. GARCIA, MD, FACC, MIGUEL A. ARES, MD, CRAIG ASHER, MD, LEONARDO RODRIGUEZ, MD, PIETER VANDERVOORT, MD, JAMES D. THOMAS, MD, FACC Cleveland, Ohio Objectives. This study sought to determine the applicability of the combined information obtained from transmitral Doppler flow and color M-mode Doppler flow propagation velocities for estimating pulmonary capillary wedge pressure. Background. Although Doppler-derived measurements of left ventricular (LV) filling have been applied to determine left atrial pressure, their accuracy has been limited by the variable effect of ventricular relaxation in these indexes. Recently, flow propagation velocity measured by color M-mode Doppler echocardiography has been suggested as an index of ventricular relaxation. Methods. We studied 45 patients admitted to the intensive care unit who underwent invasive hemodynamic monitoring. We mea- sured peak early (E) and late (A) transmitral Doppler velocities, E/A ratio and flow propagation velocity (v p ) and compared them by linear regression with pulmonary capillary wedge pressure (p w ). Results. We found a modest positive correlation between p w and E (r 5 0.62, p < 0.001) and the E/A ratio (r 5 0.52, p < 0.001) and a negative correlation between p w and v p (r 520.34, p 5 0.02). By stepwise linear regression, only E and v p were statistically signif- icant predictors of p w . However, the E/v p ratio provided the best estimate of p w (r 5 0.80, p < 0.001; p w 5 5.27 3 [E/v p ] 1 4.6, SEE 3.1 mm Hg). Conclusions. The ratio of component velocity (E) over the color M-mode propagation velocity during early LV filling, by correct- ing for the effect of LV relaxation, provides a better estimate of p w than standard measurements of transmitral Doppler flow. (J Am Coll Cardiol 1997;29:448 –54) q1997 by the American College of Cardiology Doppler echocardiography has been used to estimate diastolic function noninvasively. Several indexes obtained from the transmitral pulsed Doppler flow, including peak velocities of early (E) and late (A) filling, the E/A ratio, E wave accelera- tion and deceleration rates and isovolumetric relaxation time, have been used to characterize patterns of impaired diastolic filling (1–3). Doppler-derived measurements of left ventricular (LV) filling have also been shown (4 – 8) to provide estimates of LV filling pressure in selected groups of patients with cardiac disease. Because these indexes are also determined by ventricular relaxation (9), they may be inaccurate in estimating left atrial pressure if the rate of relaxation is unknown. Recently, color M-mode Doppler echocardiography has been shown (10 –13) to provide unique information about ventricu- lar relaxation. The propagation velocity of transmitral flow during early ventricular filling (v p ), or the time difference between maximal velocity at the apex level and at the mitral leaflet tips, measured by color M-mode Doppler, has been proved to be related to the time constant of isovolumetric LV relaxation (tau) (10,11); v p has also shown a moderate corre- lation with LV ejection fraction, and in an animal model proved to be independent of left atrial pressure and heart rate (11,12). The present study therefore sought to 1) evaluate the relation between transmitral flow filling velocity patterns and pulmonary capillary wedge pressure (p w ) in a large heteroge- neous group of patients; and 2) test the hypothesis that p w could be more accurately estimated by the E/v p ratio because mitral flow peak early filling velocity (E) is directly related to p w and inversely related to tau (9,14 –16), whereas v p has been shown (10) to be inversely related to tau. Methods Study group. We enrolled 65 consecutive patients who were admitted to the intensive care unit at our institution (Cleveland Clinic) and were able to provide written informed consent. Patients were included if they were in normal sinus rhythm and had a balloon-tipped pulmonary artery catheter From the Veterans Affairs Medical Center, White River Junction, Vermont; Dartmouth Medical School and the Cardiovascular Imaging Center, Department of Cardiology of The Cleveland Clinic Foundation, Cleveland, Ohio. This study was supported in part by Grant-in-Aid 93-13880 from the American Heart Association, Dallas, Texas (Dr. Thomas). Dr. Ares was supported by a scholar- ship from Fondo de Investigaciones Sanitarias, Madrid, Spain. It was presented in part at the 44th Annual Scientific Session of the American College of Cardiology, New Orleans, Louisiana, March 1995. Manuscript received May 21, 1996; revised manuscript received August 13, 1996, accepted October 9, 1996. Address for correspondence: Dr. James D. Thomas, Department of Cardi- ology, Desk F-15, The Cleveland Clinic Foundation, 9500 Euclid Avenue, Cleveland, Ohio 44195. E-mail: [email protected]. JACC Vol. 29, No. 2 February 1997:448 –54 448 q1997 by the American College of Cardiology 0735-1097/97/$17.00 Published by Elsevier Science Inc. PII S0735-1097(96)00496-2
-
Upload
independent -
Category
Documents
-
view
5 -
download
0
Transcript of An Index of Early Left Ventricular Filling That Combined With Pulsed Doppler Peak E Velocity May...
An Index of Early Left Ventricular Filling That Combined WithPulsed Doppler Peak E Velocity May Estimate CapillaryWedge Pressure
MARIO J. GARCIA, MD, FACC, MIGUEL A. ARES, MD, CRAIG ASHER, MD,LEONARDO RODRIGUEZ, MD, PIETER VANDERVOORT, MD, JAMES D. THOMAS, MD, FACC
Cleveland, Ohio
Objectives. This study sought to determine the applicability ofthe combined information obtained from transmitral Dopplerflow and color M-mode Doppler flow propagation velocities forestimating pulmonary capillary wedge pressure.Background. Although Doppler-derived measurements of left
ventricular (LV) filling have been applied to determine left atrialpressure, their accuracy has been limited by the variable effect ofventricular relaxation in these indexes. Recently, flow propagationvelocity measured by color M-mode Doppler echocardiographyhas been suggested as an index of ventricular relaxation.Methods.We studied 45 patients admitted to the intensive care
unit who underwent invasive hemodynamic monitoring. We mea-sured peak early (E) and late (A) transmitral Doppler velocities,E/A ratio and flow propagation velocity (vp) and compared themby linear regression with pulmonary capillary wedge pressure (pw).
Results.We found a modest positive correlation between pw andE (r5 0.62, p < 0.001) and the E/A ratio (r5 0.52, p < 0.001) anda negative correlation between pw and vp (r5 20.34, p5 0.02). Bystepwise linear regression, only E and vp were statistically signif-icant predictors of pw. However, the E/vp ratio provided the bestestimate of pw (r5 0.80, p < 0.001; pw 5 5.273 [E/vp]1 4.6, SEE3.1 mm Hg).Conclusions. The ratio of component velocity (E) over the color
M-mode propagation velocity during early LV filling, by correct-ing for the effect of LV relaxation, provides a better estimate of pwthan standard measurements of transmitral Doppler flow.
(J Am Coll Cardiol 1997;29:448–54)q1997 by the American College of Cardiology
Doppler echocardiography has been used to estimate diastolicfunction noninvasively. Several indexes obtained from thetransmitral pulsed Doppler flow, including peak velocities ofearly (E) and late (A) filling, the E/A ratio, E wave accelera-tion and deceleration rates and isovolumetric relaxation time,have been used to characterize patterns of impaired diastolicfilling (1–3). Doppler-derived measurements of left ventricular(LV) filling have also been shown (4–8) to provide estimatesof LV filling pressure in selected groups of patients withcardiac disease. Because these indexes are also determined byventricular relaxation (9), they may be inaccurate in estimatingleft atrial pressure if the rate of relaxation is unknown.Recently, color M-mode Doppler echocardiography has been
shown (10–13) to provide unique information about ventricu-lar relaxation. The propagation velocity of transmitral flowduring early ventricular filling (vp), or the time differencebetween maximal velocity at the apex level and at the mitralleaflet tips, measured by color M-mode Doppler, has beenproved to be related to the time constant of isovolumetric LVrelaxation (tau) (10,11); vp has also shown a moderate corre-lation with LV ejection fraction, and in an animal model provedto be independent of left atrial pressure and heart rate (11,12).The present study therefore sought to 1) evaluate the
relation between transmitral flow filling velocity patterns andpulmonary capillary wedge pressure (pw) in a large heteroge-neous group of patients; and 2) test the hypothesis that pwcould be more accurately estimated by the E/vp ratio becausemitral flow peak early filling velocity (E) is directly related topw and inversely related to tau (9,14–16), whereas vp has beenshown (10) to be inversely related to tau.
MethodsStudy group. We enrolled 65 consecutive patients who
were admitted to the intensive care unit at our institution(Cleveland Clinic) and were able to provide written informedconsent. Patients were included if they were in normal sinusrhythm and had a balloon-tipped pulmonary artery catheter
From the Veterans Affairs Medical Center, White River Junction, Vermont;Dartmouth Medical School and the Cardiovascular Imaging Center, Departmentof Cardiology of The Cleveland Clinic Foundation, Cleveland, Ohio. This studywas supported in part by Grant-in-Aid 93-13880 from the American HeartAssociation, Dallas, Texas (Dr. Thomas). Dr. Ares was supported by a scholar-ship from Fondo de Investigaciones Sanitarias, Madrid, Spain. It was presentedin part at the 44th Annual Scientific Session of the American College ofCardiology, New Orleans, Louisiana, March 1995.
Manuscript received May 21, 1996; revised manuscript received August 13,1996, accepted October 9, 1996.
Address for correspondence: Dr. James D. Thomas, Department of Cardi-ology, Desk F-15, The Cleveland Clinic Foundation, 9500 Euclid Avenue,Cleveland, Ohio 44195. E-mail: [email protected].
JACC Vol. 29, No. 2February 1997:448–54
448
q1997 by the American College of Cardiology 0735-1097/97/$17.00Published by Elsevier Science Inc. PII S0735-1097(96)00496-2
(Swan-Ganz) with an adequate position confirmed by chestX-ray film and had technically adequate pw tracings. Fourpatients with first-degree atrioventricular block were excludedbecause a distinct separation could not be established betweenthe E and A waves in the pulsed Doppler or color M-modetracings, or both. Two patients with a prosthetic mitral valve,four with severe mitral regurgitation, two with functionalmitral stenosis and eight with inadequate echocardiographicimages were also excluded. The remaining 45 patients (mean[6SD] age 65 6 14 years, range 26 to 85) formed our studygroup. In 22 patients the primary diagnosis was an acuteischemic event; 5 had congestive heart failure secondary toidiopathic dilated cardiomyopathy; 3 had aortic valve disease;3 had peripheral vascular surgery; 5 had trauma; and 7 hadsepsis. Clinical and echocardiographic characteristics are sum-marized in Table 1.Doppler ultrasound examination. All patients were exam-
ined at bedside by two-dimensional guided transthoracicpulsed and color Doppler using a Sonos 1500 ultrasoundmachine (Hewlett-Packard Company). Recordings were ac-quired with a 2- or 2.5-MHz Doppler transducer placed at thecardiac apical window. Left ventricular ejection fraction was
determined using the area–length method from two-dimensionalechocardiographic images obtained from the apical four-chamberview. Doppler recordings were obtained from the same viewwith the pulsed sample volume placed at the tips of the mitralleaflets. Transmitral flow velocities were recorded at a hori-zontal speed of 100 mm/s using a minimized high pass filter. Aminimum of 6 beats were stored first in a memory loop andthen transferred to a 650-MB magneto-optical disk. From thesame echocardiographic window, the color Doppler sector map ofthe mitral inflow was displayed, and fine adjustments were madeto obtain the longest column of color flow from themitral annulusto the apex. AnM-mode cursor was positioned through the centerof the flow, avoiding boundary regions and aligning the cursor inthe same direction of the inflow jet. The color M-mode spectrawere displayed on the video screen at 100 mm/s. In all cases, colorgain was set at subsaturation levels, using the same map and colorprocessing filters. At least 6 cardiac cycles were also recorded andstored on optical disc media and video tape.Determination of pw. We estimated pw from tracings ob-
tained by means of a pulmonary artery catheter (Swan-Ganz),after confirming position in a middle-lobe central pulmonaryartery by chest X-ray film and gradually inflating the tipballoon until the typical wedge tracing was obtained. Allmeasurements were obtained at end-expiration after carefulcalibration and within 5 min of the Doppler examination.Pulsed and color Doppler measurements. Measurements
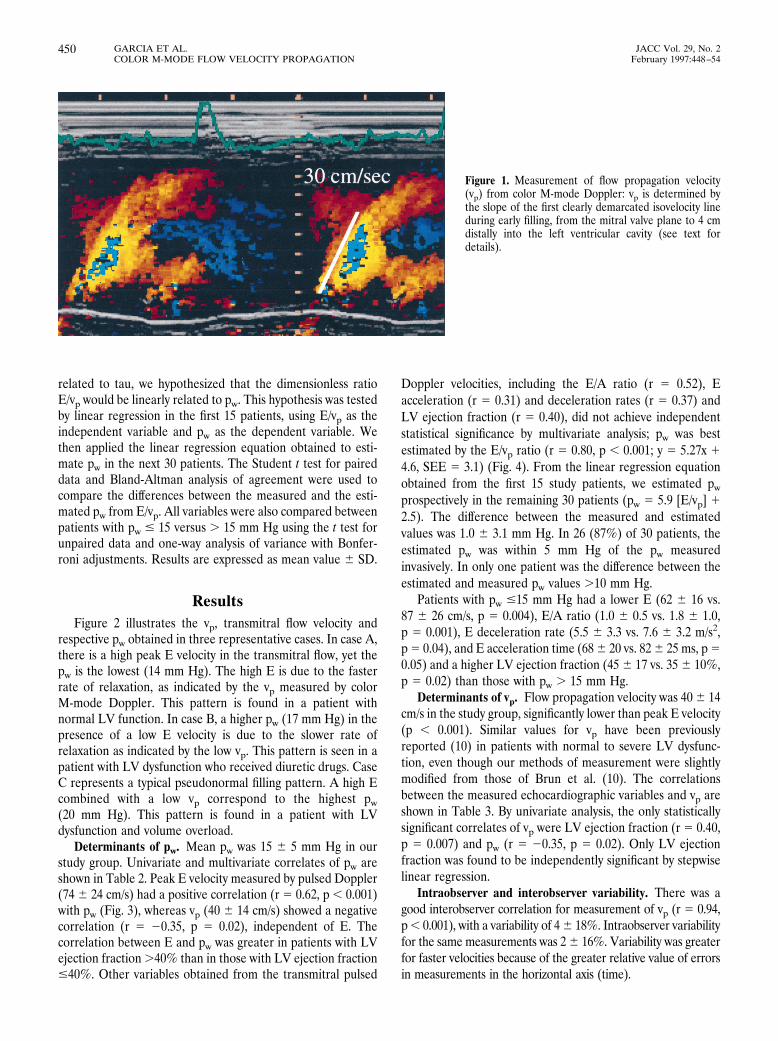
were done off-line in a workstation (Nova Microsonics) by twoindependent observers (M.J.G., M.A.A.) who had no knowl-edge of the hemodynamic data. Peak early mitral velocity (Ewave) was measured and averaged for all beats. We alsomeasured the color M-mode Doppler flow propagation (vp)velocity in all consecutive beats as the slope of the first aliasingvelocity (45 cm/s) during early filling, from the mitral valveplane to 4 cm distally into the LV cavity (Fig. 1). Thisrepresents a modification of the method previously describedby Brun et al. (10), who measured the slope of the transition nocolor/color because we found that the latter could not beuniformly seen in all cases. When peak E was ,0.45 cm/s, andthere was no aliasing, we adopted the first well demarcatedisovelocity slope of the second phase of early filling. It has beenproposed by other investigators (11) that the first phase of earlyfilling represents isovolumetric flow in the apical regions of theleft ventricle. We averaged the results of all beats measured ineach subject and then compared and averaged the results ob-tained by both observers independently. Intraobserver and inter-observer variability was calculated for color M-mode propagationvelocity measurements.Data analysis. For all patients, peak E velocity was com-
pared with vp by paired t tests and linear regression. Therelation between pw and E, the E/A ratio, E acceleration anddeceleration times and rates, LV ejection fraction and vp weretested with linear regression. Stepwise multilinear regressionanalysis was used to test the independent additive predictivevalue of each of these variables. Because E has been showntheoretically (14) and empirically (15,16) to be linearly relatedto pw/tau, whereas vp has been shown (10) to be inversely
Abbreviations and Acronyms
A 5 late transmitral Doppler filling velocityE 5 early transmitral Doppler filling velocityLV 5 left ventricularpw 5 pulmonary capillary wedge pressuretau 5 time constant of isovolumetric left ventricular relaxationvp 5 flow propagation velocity
Table 1. Clinical and Echocardiographic Characteristics of 45Study Patients
Age (yr) 65 6 13Male 26 (58%)Primary diagnosisMI/unstable angina 22Dilated cardiomyopathy 5Aortic valve disease 3Peripheral vascular surgery 3Trauma 5Sepsis 7
pw (mm Hg) 15 6 5Transmitral Doppler velocityE (cm/s) 74 6 24E/A 1.3 6 0.9E acceleration rate (m/s) 1,081 6 507E acceleration time (ms) 74 6 24E deceleration rate (m/s2) 648 6 336E deceleration time (ms) 135 6 57
vp (cm/s) 40 6 14LVEF (%) 40 6 15
Data presented are mean value 6 SD or number (%) of patients. E 5 peakearly transmitral Doppler flow velocity; E/A5 early/atrial transmitral Doppler flowvelocity ratio; LVEF 5 left ventricular ejection fraction; pw 5 pulmonary capillarywedge pressure; vp 5 flow propagation velocity; MI 5 myocardial infarction.
449JACC Vol. 29, No. 2 GARCIA ET AL.February 1997:448–54 COLOR M-MODE FLOW VELOCITY PROPAGATION
related to tau, we hypothesized that the dimensionless ratioE/vp would be linearly related to pw. This hypothesis was testedby linear regression in the first 15 patients, using E/vp as theindependent variable and pw as the dependent variable. Wethen applied the linear regression equation obtained to esti-mate pw in the next 30 patients. The Student t test for paireddata and Bland-Altman analysis of agreement were used tocompare the differences between the measured and the esti-mated pw from E/vp. All variables were also compared betweenpatients with pw # 15 versus . 15 mm Hg using the t test forunpaired data and one-way analysis of variance with Bonfer-roni adjustments. Results are expressed as mean value 6 SD.
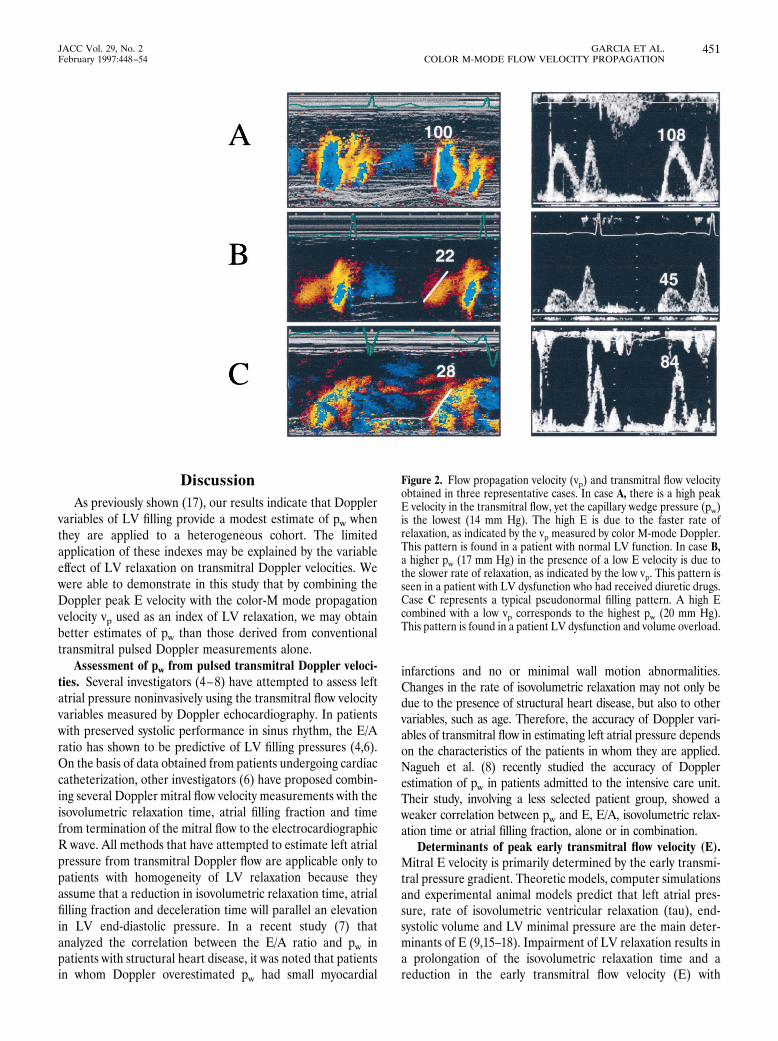
ResultsFigure 2 illustrates the vp, transmitral flow velocity and
respective pw obtained in three representative cases. In case A,there is a high peak E velocity in the transmitral flow, yet thepw is the lowest (14 mm Hg). The high E is due to the fasterrate of relaxation, as indicated by the vp measured by colorM-mode Doppler. This pattern is found in a patient withnormal LV function. In case B, a higher pw (17 mm Hg) in thepresence of a low E velocity is due to the slower rate ofrelaxation as indicated by the low vp. This pattern is seen in apatient with LV dysfunction who received diuretic drugs. CaseC represents a typical pseudonormal filling pattern. A high Ecombined with a low vp correspond to the highest pw(20 mm Hg). This pattern is found in a patient with LVdysfunction and volume overload.Determinants of pw. Mean pw was 15 6 5 mm Hg in our
study group. Univariate and multivariate correlates of pw areshown in Table 2. Peak E velocity measured by pulsed Doppler(74 6 24 cm/s) had a positive correlation (r 5 0.62, p , 0.001)with pw (Fig. 3), whereas vp (40 6 14 cm/s) showed a negativecorrelation (r 5 20.35, p 5 0.02), independent of E. Thecorrelation between E and pw was greater in patients with LVejection fraction.40% than in those with LV ejection fraction#40%. Other variables obtained from the transmitral pulsed
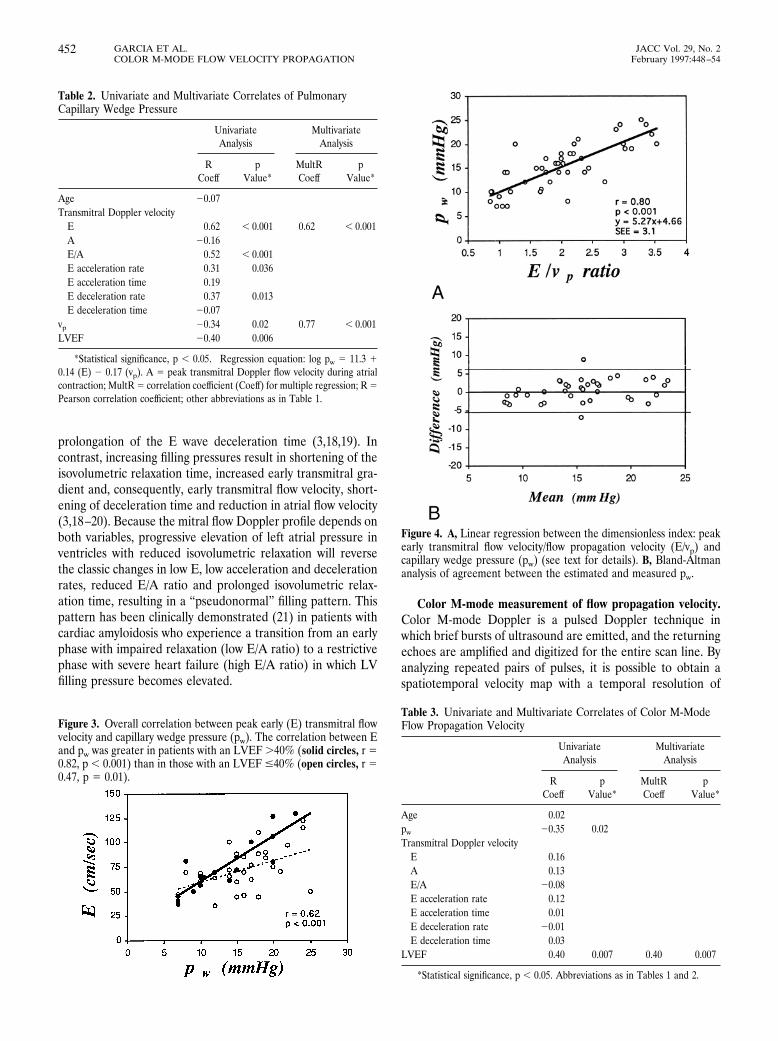
Doppler velocities, including the E/A ratio (r 5 0.52), Eacceleration (r 5 0.31) and deceleration rates (r 5 0.37) andLV ejection fraction (r 5 0.40), did not achieve independentstatistical significance by multivariate analysis; pw was bestestimated by the E/vp ratio (r 5 0.80, p , 0.001; y 5 5.27x 14.6, SEE 5 3.1) (Fig. 4). From the linear regression equationobtained from the first 15 study patients, we estimated pwprospectively in the remaining 30 patients (pw 5 5.9 [E/vp] 12.5). The difference between the measured and estimatedvalues was 1.0 6 3.1 mm Hg. In 26 (87%) of 30 patients, theestimated pw was within 5 mm Hg of the pw measuredinvasively. In only one patient was the difference between theestimated and measured pw values .10 mm Hg.Patients with pw #15 mm Hg had a lower E (62 6 16 vs.
87 6 26 cm/s, p 5 0.004), E/A ratio (1.0 6 0.5 vs. 1.8 6 1.0,p 5 0.001), E deceleration rate (5.5 6 3.3 vs. 7.6 6 3.2 m/s2,p5 0.04), and E acceleration time (686 20 vs. 826 25 ms, p50.05) and a higher LV ejection fraction (45 6 17 vs. 35 6 10%,p 5 0.02) than those with pw . 15 mm Hg.Determinants of vp. Flow propagation velocity was 406 14
cm/s in the study group, significantly lower than peak E velocity(p , 0.001). Similar values for vp have been previouslyreported (10) in patients with normal to severe LV dysfunc-tion, even though our methods of measurement were slightlymodified from those of Brun et al. (10). The correlationsbetween the measured echocardiographic variables and vp areshown in Table 3. By univariate analysis, the only statisticallysignificant correlates of vp were LV ejection fraction (r 5 0.40,p 5 0.007) and pw (r 5 20.35, p 5 0.02). Only LV ejectionfraction was found to be independently significant by stepwiselinear regression.Intraobserver and interobserver variability. There was a
good interobserver correlation for measurement of vp (r 5 0.94,p, 0.001), with a variability of 46 18%. Intraobserver variabilityfor the same measurements was 26 16%. Variability was greaterfor faster velocities because of the greater relative value of errorsin measurements in the horizontal axis (time).
Figure 1. Measurement of flow propagation velocity(vp) from color M-mode Doppler: vp is determined bythe slope of the first clearly demarcated isovelocity lineduring early filling, from the mitral valve plane to 4 cmdistally into the left ventricular cavity (see text fordetails).
450 GARCIA ET AL. JACC Vol. 29, No. 2COLOR M-MODE FLOW VELOCITY PROPAGATION February 1997:448–54
DiscussionAs previously shown (17), our results indicate that Doppler
variables of LV filling provide a modest estimate of pw whenthey are applied to a heterogeneous cohort. The limitedapplication of these indexes may be explained by the variableeffect of LV relaxation on transmitral Doppler velocities. Wewere able to demonstrate in this study that by combining theDoppler peak E velocity with the color-M mode propagationvelocity vp used as an index of LV relaxation, we may obtainbetter estimates of pw than those derived from conventionaltransmitral pulsed Doppler measurements alone.Assessment of pw from pulsed transmitral Doppler veloci-
ties. Several investigators (4–8) have attempted to assess leftatrial pressure noninvasively using the transmitral flow velocityvariables measured by Doppler echocardiography. In patientswith preserved systolic performance in sinus rhythm, the E/Aratio has shown to be predictive of LV filling pressures (4,6).On the basis of data obtained from patients undergoing cardiaccatheterization, other investigators (6) have proposed combin-ing several Doppler mitral flow velocity measurements with theisovolumetric relaxation time, atrial filling fraction and timefrom termination of the mitral flow to the electrocardiographicR wave. All methods that have attempted to estimate left atrialpressure from transmitral Doppler flow are applicable only topatients with homogeneity of LV relaxation because theyassume that a reduction in isovolumetric relaxation time, atrialfilling fraction and deceleration time will parallel an elevationin LV end-diastolic pressure. In a recent study (7) thatanalyzed the correlation between the E/A ratio and pw inpatients with structural heart disease, it was noted that patientsin whom Doppler overestimated pw had small myocardial
infarctions and no or minimal wall motion abnormalities.Changes in the rate of isovolumetric relaxation may not only bedue to the presence of structural heart disease, but also to othervariables, such as age. Therefore, the accuracy of Doppler vari-ables of transmitral flow in estimating left atrial pressure dependson the characteristics of the patients in whom they are applied.Nagueh et al. (8) recently studied the accuracy of Dopplerestimation of pw in patients admitted to the intensive care unit.Their study, involving a less selected patient group, showed aweaker correlation between pw and E, E/A, isovolumetric relax-ation time or atrial filling fraction, alone or in combination.Determinants of peak early transmitral flow velocity (E).
Mitral E velocity is primarily determined by the early transmi-tral pressure gradient. Theoretic models, computer simulationsand experimental animal models predict that left atrial pres-sure, rate of isovolumetric ventricular relaxation (tau), end-systolic volume and LV minimal pressure are the main deter-minants of E (9,15–18). Impairment of LV relaxation results ina prolongation of the isovolumetric relaxation time and areduction in the early transmitral flow velocity (E) with
Figure 2. Flow propagation velocity (vp) and transmitral flow velocityobtained in three representative cases. In case A, there is a high peakE velocity in the transmitral flow, yet the capillary wedge pressure (pw)is the lowest (14 mm Hg). The high E is due to the faster rate ofrelaxation, as indicated by the vp measured by color M-mode Doppler.This pattern is found in a patient with normal LV function. In case B,a higher pw (17 mm Hg) in the presence of a low E velocity is due tothe slower rate of relaxation, as indicated by the low vp. This pattern isseen in a patient with LV dysfunction who had received diuretic drugs.Case C represents a typical pseudonormal filling pattern. A high Ecombined with a low vp corresponds to the highest pw (20 mm Hg).This pattern is found in a patient LV dysfunction and volume overload.
451JACC Vol. 29, No. 2 GARCIA ET AL.February 1997:448–54 COLOR M-MODE FLOW VELOCITY PROPAGATION
prolongation of the E wave deceleration time (3,18,19). Incontrast, increasing filling pressures result in shortening of theisovolumetric relaxation time, increased early transmitral gra-dient and, consequently, early transmitral flow velocity, short-ening of deceleration time and reduction in atrial flow velocity(3,18–20). Because the mitral flow Doppler profile depends onboth variables, progressive elevation of left atrial pressure inventricles with reduced isovolumetric relaxation will reversethe classic changes in low E, low acceleration and decelerationrates, reduced E/A ratio and prolonged isovolumetric relax-ation time, resulting in a “pseudonormal” filling pattern. Thispattern has been clinically demonstrated (21) in patients withcardiac amyloidosis who experience a transition from an earlyphase with impaired relaxation (low E/A ratio) to a restrictivephase with severe heart failure (high E/A ratio) in which LVfilling pressure becomes elevated.
Color M-mode measurement of flow propagation velocity.Color M-mode Doppler is a pulsed Doppler technique inwhich brief bursts of ultrasound are emitted, and the returningechoes are amplified and digitized for the entire scan line. Byanalyzing repeated pairs of pulses, it is possible to obtain aspatiotemporal velocity map with a temporal resolution of
Figure 3. Overall correlation between peak early (E) transmitral flowvelocity and capillary wedge pressure (pw). The correlation between Eand pw was greater in patients with an LVEF .40% (solid circles, r 50.82, p , 0.001) than in those with an LVEF #40% (open circles, r 50.47, p 5 0.01).
Figure 4. A, Linear regression between the dimensionless index: peakearly transmitral flow velocity/flow propagation velocity (E/vp) andcapillary wedge pressure (pw) (see text for details). B, Bland-Altmananalysis of agreement between the estimated and measured pw.
Table 2. Univariate and Multivariate Correlates of PulmonaryCapillary Wedge Pressure
UnivariateAnalysis
MultivariateAnalysis
RCoeff
pValue*
MultRCoeff
pValue*
Age 20.07Transmitral Doppler velocityE 0.62 , 0.001 0.62 , 0.001A 20.16E/A 0.52 , 0.001E acceleration rate 0.31 0.036E acceleration time 0.19E deceleration rate 0.37 0.013E deceleration time 20.07
vp 20.34 0.02 0.77† , 0.001LVEF 20.40 0.006
*Statistical significance, p , 0.05. †Regression equation: log pw 5 11.3 10.14 (E) 2 0.17 (vp). A 5 peak transmitral Doppler flow velocity during atrialcontraction; MultR5 correlation coefficient (Coeff) for multiple regression; R5Pearson correlation coefficient; other abbreviations as in Table 1.
Table 3. Univariate and Multivariate Correlates of Color M-ModeFlow Propagation Velocity
UnivariateAnalysis
MultivariateAnalysis
RCoeff
pValue*
MultRCoeff
pValue*
Age 0.02pw 20.35 0.02Transmitral Doppler velocityE 0.16A 0.13E/A 20.08E acceleration rate 0.12E acceleration time 0.01E deceleration rate 20.01E deceleration time 0.03
LVEF 0.40 0.007 0.40 0.007
*Statistical significance, p , 0.05. Abbreviations as in Tables 1 and 2.
452 GARCIA ET AL. JACC Vol. 29, No. 2COLOR M-MODE FLOW VELOCITY PROPAGATION February 1997:448–54
5 ms, a spatial resolution ,1 mm and a velocity measurementwith an average error ,5 cm/s. Using digital processing,numerical velocity values can be obtained in addition to spatialand temporal information (22). A major difference existsbetween color M-mode Doppler and normal pulsed Doppler.Whereas normal pulsed Doppler permits us to obtain infor-mation on time and velocity at a fixed spatial point, colorM-mode Doppler allows the acquisition of information onvelocity, time and space along an entire cursor line. There aretwo general color Doppler M-mode indexes reported in pub-lished reports. In the first approach, vp is determined by theslope of the flow wave front; the tracing of the slope is donemanually and uses the transition between no color and color(10). In the second method, the time delay between maximalvelocity at the mitral leaflet tips and ventricular apex has beenproposed (11) to overcome the difficulties of manually mea-suring vp by using dedicated computer software to decode themaximal velocities at various points along the LV inflow tract.In our study we measured vp with certain modifications that tryto overcome the difficulties noted previously. When the leadingedge of the second phase of early filling was irregular, wemeasured the contour of the first isovelocity line that producedan uninterrupted contour. When there were two phases ofearly filling, we traced the slope of the second phase becausethe initial slope is thought to reflect movement of the bloodalready within the ventricle before diastole. Applying these twocriteria yielded reasonable interobserver and intraobservervariability in vp. Color M-mode vp has been shown to correlatewell with the tau (10,11) and moderately with LV ejectionfraction in patients with coronary artery disease (12). Twomechanisms that determine vp have been proposed, namely thepresence of intraventricular pressure gradients (23) and theformation of vortexes (24–27). Courtois and Ludbrook (28)proposed that intraventricular gradients result from activemyocardial events, suggesting a model of diastolic functionthat treats the apex as a prominent source of recoil during earlydiastole, contributing to the process of filling by activelydrawing blood from the mid and basal levels of the heart intothe apical region. In their carefully obtained tracings, theyshow a consistent apex–base gradient in pressure during earlyfilling in the left ventricle. Using pulsed Doppler echocardiog-raphy, Thomas et al. (29) found that peak E velocity increasesin the normal left ventricle and reaches its maximum closer tothe apex, whereas the highest peak A velocity occurs near themitral leaflet tips. However, in dilated hypocontractile ventri-cles, peak E velocity decreases as it travels toward the apex. Insituations associated with pathologic nonhomogeneity, such asischemia, the outward movement of normal segments would bebalanced for an inward movement of ischemic segments (30)during isovolumetric relaxation (31), resulting in a decrease inthe rate of isovolumetric relaxation and the loss of mechanicalsuction during early filling (32). In vitro experiments haverecently shown (33) that increasing suction force results in afaster vp. Vortex formation may explain why flow peak Evelocity may be higher than vp. Steen and Steen (33), in an invitro model of a left ventricle, demonstrated that the peak
velocity of the fluid particles may be twice as high as thepropagation velocity of the wave. Their observation is ex-plained by the hydrodynamic principles of flow in a vortex ring,in which the fluid velocity in the center of the ring exceeds thepropagation velocity because of intrinsic circulation of fluidaround the axis of the ring. Vorticity is generated by shearbetween inflowing blood and the stationary blood already inthe ventricle. Vortex formation increases in smaller mitralorifice sizes and dilated ventricles, resulting in a slower vp.Beppu et al. (27) showed that in dogs with normal LV function,contrast medium injected into the left atrium reaches the apexquickly and with little vortex formation, whereas in those withapical akinesia or dyskinesia, the contrast medium does notreach the apex within one diastole, but turns upward to theoutflow tract in the middle of the cavity. In summary, normalventricles, because of smaller size, higher suction force andhigher relative mitral orifice size have a faster vp than ventri-cles with abnormal relaxation. It is unknown whether inhumans vp may be influenced by loading conditions in the samemanner as conventional Doppler indexes. However, a recentstudy (34) showed that patients with abnormal LV relaxation,E/A ratio ,1 and normal pw had a low vp similar to those withabnormal LV relaxation, E/A ratio .1 and elevated pw,indicating that vp is not “pseudonormalized” by the elevationin left atrial pressure.Estimation of pw from combined Doppler indexes. As
previously indicated, left atrial pressure and LV relaxation arethe main determinants of peak E velocity. Left ventricularrelaxation during early diastole is best characterized by tau,with lower values for tau indicating faster rates of relaxation.Studies in patients with normal LV function and in patientswith pressure overload hypertrophy (35,36) demonstrated thatthis index is not affected by modest changes in loading condi-tions. A positive linear relation between E and left atrialpressure and a negative but still linear inverse relation betweenE and tau have been shown in animal experiments. Becausethere is a strong (negative) linear correlation between vp andtau, we substituted vp } 1/tau in E } pw/tau to yield E } pw 3vp and then rearranged pw } E/vp.Limitations of the study. We used pw as an estimate of left
atrial pressure. Several factors may affect the relation betweenpw and direct left atrial pressure, particularly in patients whoare critically ill, such as incomplete occlusion by the air-filledballoon, regional variations in the pulmonary vasculature,underestimation due to air in the fluid-filled catheters orinaccurate calibration. It is possible that error in left atrialpressure estimation may account for the lack of a strongercorrelation of our data.We did not consider the effects of variables, such as peak
LV systolic pressure and left atrial compliance, both shown toaffect left atrial pressure and peak E wave velocity in computerand animal models. Left ventricular geometry (dilated spher-ical vs. nondilated or conical ventricular shapes) and mitral valveorifice diameter could also affect vp (32). Vortex formation ismore likely with smaller orifice sizes, resulting in slower vp.Most of our patients had abnormal LV function because
453JACC Vol. 29, No. 2 GARCIA ET AL.February 1997:448–54 COLOR M-MODE FLOW VELOCITY PROPAGATION
invasive hemodynamic monitoring is rarely performed in pa-tients with normal hearts. Including more patients with normalLV function would most likely worsen the relation betweenpeak E velocity and pw because higher E may be seen withnormal or low pw. Theoretically, the correlation between E/vpand pw should be maintained because vp is high in patients withabnormal LV function.
References1. Labovitz AJ, Pearson AC. Evaluation of left ventricular diastolic function:clinical relevance and recent Doppler echocardiographic insights.Am Heart J 1987;114:836–51.
2. Pearson AC, Labovitz AJ, Mrosek D, Williams GA, Kennedy HL. Assess-ment of diastolic function in normal and hypertrophied hearts: comparisonof Doppler echoardiography and M-mode echocardiography. Am Heart J1987;113:1417–25.
3. Appleton CP, Hatle L, Popp RL. Relation of transmitral flow velocitypatterns to left ventricular diastolic function: new insights from a combinedhemodynamic and Doppler echocardiographic study. J Am Coll Cardiol1988;12:426–40.
4. Vanoverschelde J-LJ, Raphael DA, Robert AR, Cosyns JR. Left ventricularfilling in dilated cardiomyopathy: relation to functional class and hemody-namics. J Am Coll Cardiol 1990;15:1288–95.
5. Stork TV, Muller RM, Piske GJ, Ewert CO, Hochrein H. Noninvasivemeasurement of left ventricular filling pressures by means of transmitralpulsed Doppler ultrasound. Am J Cardiol 1989;64:655–60.
6. Mulvagh S, Quinones MA, Kleiman NS, Cheirif J, Zoghbi WA. Estimationof left ventricular end-diastolic pressure from Doppler transmitral flowvelocity in cardiac patients independent of systolic performance. J Am CollCardiol 1992;20:112–9.
7. Vanoverschelde JL, Robert AR, Gerbaux A, Michel X, Hanet C, Wijns W.Noninvasive estimation of pulmonary arterial wedge pressure with Dopplertransmitral flow velocity pattern in patients with known heart disease. Am JCardiol 1995;75:383–9.
8. Nagueh SF, Kopelen HA, Zoghbi WA. Feasibility and accuracy of Dopplerechocardiographic estimation of pulmonary artery occlusive pressure in theintensive care unit. Am J Cardiol 1995;75:1256–62.
9. Ishida Y, Meisner JS, Tsujioka K, et al. Left ventricular filling dynamics:influence of left ventricular relaxation and left atrial pressure. Circulation1986;74:187–96.
10. Brun P, Tribouilloy C, Duval AM, et al. Left ventricular flow propagationduring early filling is related to wall relaxation: a color M-mode Doppleranalysis. J Am Coll Cardiol 1992;20:420–32.
11. Stugaard M, Smiseth OA, Risoe C, Ihlen H. Intraventricular early diastolicfilling during acute myocardial ischemia: assessment by multigated colorM-mode Doppler. Circulation 1993;88:2705–13.
12. Stugaard M, Brodahl U, Torp H, Ihlen H. Abnormalities of left ventricularfilling in patients with coronary artery disease: assessment by colour M-modeDoppler technique. Eur Heart J 1994;15:318–27.
13. Stugaard M, Risoe C, Ihlen H, Smiseth OA. Intracavitary filling pattern inthe failing left ventricle assessed by color M-mode Doppler echocardiogra-phy. J Am Coll Cardiol 1994;24:663–70.
14. Thomas JD, Weyman AE. Echocardiographic Doppler evaluation of leftventricular diastolic function: physics and physiology. Circulation 1990;84:977–90.
15. Thomas JD, Choong CY, Flachskampf F, Weyman AE. Analysis of the earlytransmitral Doppler velocity curve: effect of primary physiologic changes andcompensatory preload adjustment. J Am Coll Cardiol 1990;16:644–55.
16. Choong CY, Abascal VM, Thomas JD, Guerrero JL, McGlew S, WeymanAE. Combined influence of ventricular loading and relaxation on thetransmitral flow velocity profile in dogs measured by Doppler echocardiog-raphy. Circulation 1988;78:672–83.
17. Choong CY, Herrman HC, Weyman AE, Fifer MA. Preload dependence of
Doppler-derived indexes of left ventricular diastolic function in humans.J Am Coll Cardiol 1987;10:800–8.
18. Myreng Y, Smiseth OA. Assessment of left ventricular relaxation by Dopplerechocardiography: comparison of isovolumic relaxation time and transmitralflow velocities with time constant of isovolumic relaxation. Circulation1990;81:260–6.
19. Miyatake K, Okamoto M, Kinoshita N, et al. Augmentation of atrialcontribution to left ventricular inflow with aging as assessed by intracardiacDoppler flowmetry. Am J Cardiol 1984;53:586–9.
20. Thomas JD, Flachskampf FA, Chen C, et al. Isovolumic relaxation timevaries predictably with its time constant and aortic and left atrial pressures:implications for the noninvasive evaluation of ventricular relaxation.Am Heart J 1992;124:1305–13.
21. Klein AL, Hatle LK, Burstow DJ, et al. Doppler characterization of leftvenrtricular diastolic function in cardiac amyloidosis. J Am Coll Cardiol1989;13:1017–26.
22. Thomas JD, Greenberg NL, Vandervoort PM, Aghassi DS, Hunt BF. Digitalanalysis of transmitral color Doppler M-mode data: a potential new ap-proach to the noninvasive assessment of diastolic function. Comput Cardio1992;631–4.
23. Ling D, Rankin JS, Edwards CH, McHale PA, Anderson RW. Regionaldiastolic mechanics of the left ventricle in the conscious dog. Am J Physiol1979;236:H323–30.
24. McQueen DM, Peskin CS, Yellin EL. Fluid dynamics of the mitral valve:physiologic aspects of a mathematical model. Am J Physiol 1982;242:H1095–110.
25. Wieting DW, Stripling TE. Dynamics and fluid dynamics of the mitral valve.In: Duran C, Angel WW, Johnson AD, Oury JH, editors. Recent Advancesin Mitral Valve Disease. London: Butterworth, 1984:13–6.
26. Walker PG, Cranney GB, Scheidegger MB, Waseleski G, Pohost GM,Yoganathan AP. Semiautomated method for noise reduction and back-ground phase error correction in MR phase velocity data. J Magnet ResonImag 1993;3:521–30.
27. Beppu S, Izumi S, Miyatake K, et al. Abnormal blood pathways in leftventricular cavity in acute myocardial infarction: experimental observationswith special reference regional wall motion abnormality and hemostasis.Circulation 1988;78:157–64.
28. Courtois M, Ludbrook PA. Intraventricular pressure transients duringrelaxation and filling. In: Gaasch WH, LeWinter M.M, editors. Left Ven-tricular Diastolic Dysfunction and Heart Failure. Philadelphia: Lea &Febiger, 1994:150–66.
29. Thomas JD, Vandervoort PM, Greenberg NL, Ares MA, Adams MS.Application of color Doppler M-mode echocardiography in the assessmentof ventricular diastolic function: analysis of the spatiotemporal velocitydistribution. In: Ingels NB Jr, editor. Systolic and Diastolic Function of theHeart. Amsterdam: IOS Press, 1996:149–56.
30. Gibson DG. Angiographic and echocardiographic evaluation of segmentalleft ventricular disease. In: Gaasch WH, LeWinter M.M, editors. LeftVentricular Diastolic Dysfunction and Heart Failure. Philadelphia: Lea &Febiger, 1994:325–44.
31. Sasayama S, Nonogi H, Fujita M, et al. Analysis of asynchronous wall motionby regional pressure-length loops in patients with coronary artery disease.J Am Coll Cardiol 1984;4:259–67.
32. Lew WY, Rasmussen CM. Influence of nonuniformity on rate of leftventricular pressure fall in the dog. Am J Physiol 1989;256:H222–32.
33. Steen T, Steen S. Filling of a model left ventricle studied by colour M modeDoppler. Cardiovasc Res 1994;28:1821–7.
34. Takatsuji H, Mikami T, Urasawa K, et al. A new approach for evaluation ofleft ventricular diastolic function: Spatial and temporal analysis of leftventricular filling flow propagation by color M-mode Doppler echocardiog-raphy. J Am Coll Cardiol 1996;27:365–71.
35. Starling MR, Montgomery DG, Mancini GBJ, Walsh RA. Load indepen-dence of the rate of isovolumic relaxation in man. Circulation 1987;76:1274–81.
36. Varma SK, Owen RM, Smucker ML, Feldman MD. Is t a preload-independent measure of isovolumic relaxation? Circulation 1989;80:1557–65.
454 GARCIA ET AL. JACC Vol. 29, No. 2COLOR M-MODE FLOW VELOCITY PROPAGATION February 1997:448–54