Transcriptional control of nutrient partitioning during rice grain filling
12
Plant Biotechnology Journal (2003) 1, pp. 59–70 © 2003 Blackwell Publishing Ltd 59 Blackwell Science, Ltd Transcriptional control of nutrient partitioning during rice grain filling Tong Zhu*, Paul Budworth, Wenqiong Chen, Nicholas Provart 1 , Hur-Song Chang, Sonia Guimil, Wenpei Su, Bram Estes, Guangzhou Zou 2 and Xun Wang Torrey Mesa Research Institute, Syngenta Research and Technology, 3115 Merryfield Row, San Diego, CA 92121, USA Summary Cereal grains accumulate carbohydrates, storage proteins and fatty acids via different pathways during their development. Many genes that participate in nutrient partitioning during grain filling and that affect starch quality have been identified. To understand how the expression of these genes is coordinated during grain development, a genomic approach to surveying the participation and interactions of all the pathways is necessary. Using recently published rice genome information, we designed a rice GeneChip microarray that covers half the rice genome. By monitoring the expression of 21 000 genes in parallel, we identified genes involved in the grain filling process and found that the expression of genes involved in different pathways is coordinately controlled in a synchronized fashion during grain filling. Interestingly, a known promoter element in genes encoding seed storage proteins, AACA, is statistically over-represented among the 269 genes in different pathways with diverse functions that are significantly up-regulated during grain filling. By expression pattern matching, a group of transcription factors that have the potential to interact with this element was identified. We also found that most genes in the starch biosynthetic pathway show multiple distinct spatial and temporal expression patterns, suggesting that different isoforms of a given enzyme are expressed in different tissues and at different developmental stages. Our results reveal key regulatory machinery and provide an opportunity for modifying multiple pathways by manipulating key regulatory elements for improving grain quality and quantity. Received 6 September 2002; revised 23 September 2002; accepted 1 October 2002. * Correspondence (fax +1 858 812 1097; e-mail [email protected]) Present addresses: 1 Department of Botany, University of Toronto, 25 Willcocks Street, Toronto, Ontario, M5S 3B2, Canada; 2 ActivX Biosciences, 11025 N. Torrey Pines Road, La Jolla, CA 92037, USA . Keywords: gene expression, grain development, microarray, Oryza sativa, regulatory elements. Introduction The most important economic characteristics of agricultural grain crops are their yield, nutritional characteristics and culi- nary quality. Yield and nutritional value are mostly deter- mined by the synthesis and storage of carbohydrates, proteins and minerals during grain filling, and culinary quality is affected by the interaction of various enzymes to produce the final structure of the starch at the molecular and granule levels. The manipulation of these pathways can result in significant improvements in nutritional value (Mazur et al., 1999; Ye et al., 2000). For example, reducing the amount of even one enzyme in the starch biosynthetic pathway (granule-bound starch synthase) can dramatically affect the culinary quality (Singh et al., 2000; Umemoto et al., 1995), resulting in softer, less sticky cooked rice. Many genes that participate in nutrient partitioning during grain filling and that affect starch quality have been identified in rice and other cereals (e.g. Umemoto et al., 1995). How- ever, these genes and their transcriptional controls are poorly understood, especially in cereal grains. Major biological processes such as cereal grain filling are believed to require a close coordination of gene expression among many important pathways. However, direct experi- mental evidence for this hypothesis has been lacking due to the absence of genomic sequence information and func- tional genomic technologies. To prove this hypothesis and to identify key regulators in grain development, a parallel examination of gene expression on a genome scale is necessary. Recent studies have examined gene expression
-
Upload
syngentabiotech -
Category
Documents
-
view
2 -
download
0
Transcript of Transcriptional control of nutrient partitioning during rice grain filling
Plant Biotechnology Journal
(2003)
1
pp 59ndash70
copy 2003 Blackwell Publishing Ltd
59
Blackwell Science Ltd
Transcriptional control of nutrient partitioning during rice grain filling
Tong Zhu Paul Budworth Wenqiong Chen Nicholas Provart
1
Hur-Song Chang Sonia Guimil Wenpei Su Bram Estes Guangzhou Zou
2
and Xun Wang
Torrey Mesa Research Institute Syngenta Research and Technology 3115 Merryfield Row San Diego CA 92121 USA
Summary
Cereal grains accumulate carbohydrates storage proteins and fatty acids via different
pathways during their development Many genes that participate in nutrient partitioning
during grain filling and that affect starch quality have been identified To understand how
the expression of these genes is coordinated during grain development a genomic
approach to surveying the participation and interactions of all the pathways is necessary
Using recently published rice genome information we designed a rice GeneChip
microarray that covers half the rice genome By monitoring the expression of 21 000
genes in parallel we identified genes involved in the grain filling process and found that
the expression of genes involved in different pathways is coordinately controlled in a
synchronized fashion during grain filling Interestingly a known promoter element in
genes encoding seed storage proteins AACA is statistically over-represented among the
269 genes in different pathways with diverse functions that are significantly up-regulated
during grain filling By expression pattern matching a group of transcription factors that
have the potential to interact with this element was identified We also found that most
genes in the starch biosynthetic pathway show multiple distinct spatial and temporal
expression patterns suggesting that different isoforms of a given enzyme are expressed
in different tissues and at different developmental stages Our results reveal key
regulatory machinery and provide an opportunity for modifying multiple pathways by
manipulating key regulatory elements for improving grain quality and quantity
Received 6 September 2002 revised 23 September 2002 accepted 1 October 2002
Correspondence
(fax +1 858 812 1097 e-mail tongzhusyngentacom)Present addresses
1
Department of Botany University of Toronto 25 Willcocks Street Toronto Ontario M5S 3B2 Canada
2
ActivX Biosciences 11025 N Torrey Pines Road La Jolla CA 92037 USA
Keywords
gene expression grain
development microarray
Oryza sativa
regulatory elements
Introduction
The most important economic characteristics of agricultural
grain crops are their yield nutritional characteristics and culi-
nary quality Yield and nutritional value are mostly deter-
mined by the synthesis and storage of carbohydrates
proteins and minerals during grain filling and culinary
quality is affected by the interaction of various enzymes to
produce the final structure of the starch at the molecular
and granule levels The manipulation of these pathways
can result in significant improvements in nutritional value
(Mazur
et al
1999 Ye
et al
2000) For example reducing
the amount of even one enzyme in the starch biosynthetic
pathway (granule-bound starch synthase) can dramatically
affect the culinary quality (Singh
et al
2000 Umemoto
et al
1995) resulting in softer less sticky cooked rice Many
genes that participate in nutrient partitioning during grain
filling and that affect starch quality have been identified
in rice and other cereals (eg Umemoto
et al
1995) How-
ever these genes and their transcriptional controls are
poorly understood especially in cereal grains
Major biological processes such as cereal grain filling are
believed to require a close coordination of gene expression
among many important pathways However direct experi-
mental evidence for this hypothesis has been lacking due to
the absence of genomic sequence information and func-
tional genomic technologies To prove this hypothesis and
to identify key regulators in grain development a parallel
examination of gene expression on a genome scale is
necessary Recent studies have examined gene expression
Tong Zhu
et al
copy Blackwell Publishing Ltd
Plant Biotechnology Journal
(2003)
1
59ndash70
60
in developing
Arabidopsis
seeds identified many important
genes and demonstrated the complexity of the process
(Girke
et al
2000 Ruuska
et al
2002 Zhu
et al
2001)
However the dramatic differences between
Arabidopsis
and
cereal crops in seed structure developmental process and
storage reserves make the application of these findings to
cereal grains difficult
The recent publication of the rice genome provides us
with not only a genetic blueprint but also an opportunity
for studying functional genomics in rice and other cereal
crops (Goff
et al
2002 Yu
et al
2002) Using rice genome
sequence information (Goff
et al
2002) we developed a
GeneChip genome array to identify genes with the potential
to be involved in rice grain development by examining the
expression of 21 000 genes during rice plant development
Special attention was paid to the regulation of major path-
ways associated with grain filling These pathways determine
nutrient partitioning and as a consequence control the
composition and accumulation of nutrients thus affecting
yield nutritional characteristics and culinary quality of the
grain
Results and discussion
Design of the rice GeneChip genome microarray
The rice GeneChip genome array was designed based on the
sequenced genome of Nipponbare rice (Goff
et al
2002)
Gene sequences were selected based on computational
prediction as previously described (Goff
et al
2002) and with
reference to matching expressed sequence tags (ESTs) and
protein sequences Predicted open reading frames from the
assembly were confirmed by B
LAST
search against the G
EN-
B
ANK
EST database and S
WISS
P
ROT
protein database Thus
genes represented on the array included some with known
functions some whose functions are predicted by DNA
sequence analysis and some predicted with a match to EST
or protein sequences Redundant sequences and introns
were eliminated computationally
The rice GeneChip microarray uses 25-mer oligonucle-
otides with sequences corresponding to the 3
prime
sequence of
open reading frames as probes These oligonucleotide probe
sequences were selected according to the standard array
design procedure (Lipshultz
et al
1999 Lockhart
et al
1996) To increase the capacity of the GeneChip genome
array so that probes for a complex genome such as that of
rice could be accommodated in a single array a novel design
consisting of only perfect matched probes and a 20
micro
m
feature size was used The new design allows 16 probes for
each of the 21 000 rice genes to be represented on a single
array The signal distribution was calculated and outliers
were identified for each probe set The expression level of a
gene was calculated from the median hybridization signal
on the probes in the corresponding probe set excluding
outliers The absolute call (present or P marginal or M and
absent or A) was based on the expression level and the
noise background associated with each probe The sensitivity
of detection was found to be 1 300 000 and the dynamic
range was gt 500-fold based on spike experiments (data
not shown) Reproducibility studies using labelled samples
prepared in parallel from identical rice total RNA indicated
that the data obtained with the rice microarray are highly
reproducible with a false-positive rate of less than 05 at
twofold change level (Supplemental Figure 1)
Selection of grain filling genes
The mRNA expression levels of 21 000 genes in 33 rice
samples including 17 from various stages of grain filling
(Table 1) were investigated following the protocol illustrated
in Figure 1 Briefly from the 21 000 rice genes we first
identified 491 genes whose products are presumably involved
in or associated with three major pathways of nutrient
partitioning the synthesis and transport of carbohydrates
proteins and fatty acids based on their sequence annotation
(Goff
et al
2002) and functional classification We realize
that gene annotation based on sequence homology alone
cannot be relied upon as evidence that a gene is involved in
a particular pathway especially if the annotation is based
on multiple rounds of automated annotation (Goff
et al
2002 Yu
et al
2002) However the functions of many genes
in the list have been verified experimentally according to
previous reports
Cluster analysis of the expression patterns of these 491
genes identified 98 that are preferentially expressed during
grain development Using these genes as bait we searched
21 000 genes for those with similar grain-preferential expres-
sion patterns using pattern matching based on a correlation
among 33 samples An additional 171 genes with a high
correlation to the bait (
r
= 085) were identified Thus we
considered these 269 genes to be lsquograin filling genesrsquo
(Supplemental Table 1)
To exclude the possibility that the 98 grain filling genes
were identified by random chance a bootstrap analysis was
employed where the same number of genes were randomly
selected from the 491 genes 100 times In contrast to the
nucleated lsquograin filling genersquo cluster the randomly sampled
gene clusters showed a constant expression pattern in
Gene regulation in rice grain filling
copy Blackwell Publishing Ltd
Plant Biotechnology Journal
(2003)
1
59ndash70
61
the 17 grain samples examined (data not shown) The exp-
ression patterns of 100 randomly sampled gene clusters are
significantly different compared to that of the grain filling
genes (
P
lt 00005) While the encoded gene products of
these 269 grain filling genes are active in different pathways
the expression levels of these genes were found to increase
synchronously during grain development (Figure 2A)
Expression pattern and functional classification of the
grain filling genes
The spatial distribution of the transcripts of the nutrient
partitioning genes in developing grains indicated by extrap-
olation of mRNA levels to biological functions that the
endosperm is the main sink for all the nutrients studied espe-
cially carbohydrates and proteins (Figure 2B) However the
expression of genes involved in fatty acid biosynthesis is more
balanced between the embryo and endosperm
The deduced products of the grain filling genes have
diverse functions (Figure 2C) Among the 269 grain filling
genes 42 are involved in starch biosynthesis 28 in lipid
biosynthesis and 33 in seed storage protein synthesis Inter-
estingly 30 genes in this set encode various transporters
such as sugar transporters ABC transporters amino acid
peptide transporters phosphate transporters and nitrate
transporters As expected the largest category consists of
genes with unknown or unclassified functions (Figure 2C)
consistent with the genome annotation in rice (Goff
et al
2002 Yu
et al
2002)
Identification of common
cis
-elements shared by grain
filing genes
To clarify the transcriptional control of the coordinated
processes involved in grain filling and to identify common
regulatory elements the promoter sequences for the 269
genes were extracted according to the following procedure
The probe set sequences were used to B
LASTN
align (Altschul
et al
1997) against the predicted genes (Goff
et al
2002)
Promoter sequences from predicted genes that aligned
(1E-20) with the probe sequences were then extracted using
a custom P
ERL
script Only 103 of the 269 grain filling genes
contain the 15 kb upstream sequences (Supplemental Table 2)
These promoter sequences were analysed by A
LIGN
ACE
(Roth
et al
1998) We could not identify any common novel
cis
-elements that were over-represented in this grain filling
gene cluster This may be due to the higher GC content of the
rice genome (Goff
et al
2002) relative to the genomes of the
organisms that were used to develop the program
We then analysed 16
cis
-elements that appear to play a
role in grain development (Table 2) Comparison of the
percentage of occurrence of each element in the promoters
of genes in the grain gene cluster and in the promoters of all
the genes represented in the microarray revealed that the
AACA element appears to be over-represented in the 103
available promoters of the grain gene cluster
To demonstrate the over-representation of the AACA
element we performed a bootstrap analysis (Efron and
Tibshirani 1994) One thousand control promoter sets each
of which contains 103 promoters from genes that were
randomly selected from the rice genome microarray were
generated In parallel the grain filling gene cluster was
randomly sampled to generate 1000 sets of 103-grain gene
promoters The ratio of the total number of occurrences of
the AACA element in each grain gene promoter set to that
Tab e 1 Rice samp es inc uded in the study
Description Days after germination
Root germinating seedling stage 5
Leaf germinating seedling stage 5
Arial 3ndash4 leaf stage 18
Root tillering stage 49
Leaf tillering stage 49
Arial tillering stage 49
Panicle booting stage 1ndash3 cm 60
Panicle booting stage 4ndash7 cm 62
Panicle booting stage 8ndash14 cm 64
Panicle booting stage 15ndash20 cm 66
Root booting stage 60
Leaf booting stage 60
Arial booting stage 60
Root panicle emergence 78
Stem panicle emergence 78
Panicle panicle emergence 78
Inflorescence no grains 88
Stem maturation 90
Root maturation 90
Leaf maturation 90
Stem senescence 100
Leaf senescence 100
Grain day 0 post-anthesis 79
Grain day 2 post-anthesis 81
Grain day 4 post-anthesis 83
Grain day 7 post-anthesis 86
Grain day 9 post-anthesis 88
Grain soft dough (asymp 14 days post-anthesis) 93
Grain hard dough (asymp 21 days post-anthesis) 100
Embryo 88
Endosperm 88
Seed coat 88
Aleurone 88
Tong Zhu
et al
copy Blackwell Publishing Ltd
Plant Biotechnology Journal
(2003)
1
59ndash70
62
in a corresponding control promoter set was computed A
ratio greater than one indicated that the element occurred
more often in grain promoters than in control promoters A
histogram was generated to visualize the ratio of distribution
for the AACA element in each pair of promoter sets (grain
filling gene set vs control gene set) As shown in Figure 3A
the ratio for the AACA element in each pair of 1000 pro-
moter sets ranged from 0833 to 221 and 977 promoter
sets had a ratio greater than 1 Thus at a 95 confidence
level (
P
-value 0046) the AACA element is over-represented
among the promoters from the grain filling gene cluster For
comparison we applied the same bootstrap analysis to the
ASF1-like element As shown in Figure 3B the ratio for the
ASF1-like element in 1000 promoter sets ranged from 046
to 213 and 568 promoter sets had a ratio which was less than
or equal to 1 It is therefore clear that the ASF1-like element is
not statistically over-represented in the grain gene promoters
The AACA element is conserved among the promoters of
many genes encoding seed storage proteins and is required
for full expression of the rice
GluB-1
gene (Wu
et al
2000)
Among the 103 genes in the grain gene cluster 63 contain
1ndash7 copies of the AACA element per promoter Interestingly
proteins encoded by these predicted genes appear to have
diverse cellular functions including carbohydrate and fatty
acid metabolism nutrient transport transcription and
translation Genes encoding storage proteins were also
found This extends previous findings (Wu
et al
2000)
and suggests that the AACA element could play a key
role in coordinating various major pathways during grain
development
Identification of transcription factors involved in grain
filling
Although transcription factors that bind to the AACA
element have not yet been identified this element is similar
to the type II MYB consensus sequence AMCWAMC which
is required for the expression of several genes such as the
parsley
PAL1
gene (Rushton and Somssich 1998) This sug-
gests that MYB proteins may also be involved in controlling
the expression of grain filling genes
To examine the involvement of transcription factors in
the transcriptional control of grain filling we analysed the
expression patterns for 563 known and putative transcription
Figure 1 Schematic diagram of the data mining process used in this study Grain filling genes were selected based on homology to known function genes and their expression in 33 samples was determined during rice development
Gene regulation in rice grain filling
copy Blackwell Publishing Ltd
Plant Biotechnology Journal
(2003)
1
59ndash70
63
factor genes during grain filling Cluster analysis identified a
group of transcription factor genes with expression patterns
similar to that of the 269 grain filling genes This cluster
includes genes such as
RITA
a bZIP type transcription factor
gene that is highly expressed in aleurone and endosperm
tissues and may be important in regulating gene expression
in developing rice grains (Onodera
et al
2001) Other genes
included in this cluster are
Dof
genes whose gene products
can activate the expression of seed storage protein genes
by binding to the prolamine-box (Vicente-Carbajosa
et al
1997) and nine known and putative
MYB
genes (Figure 4)
The correlation between the gene expression patterns of these
transcription factors and their previously identified functions
suggests their involvement during rice grain filling To confirm
their functions
in vivo
DNA binding assays are being per-
formed for genes encoding selected transcription factors
using a strategy that has been successful in yeast (Ren
et al
2000)
Isoforms as mechanisms for intra-pathway regulation
To examine the potential participation and regulation of genes
encoding different isoforms in the grain-filling process the
mRNA dynamics of 87 genes on the rice genome array involved
Table 2 cis-element table with references
Cis-element Sequence Reference
Cold CCGAC (Baker et al 1994)
G-box CACGTG (Hwang et al 1998)
AACA motif AACAAAA (Wu et al 2000)
GCN4 TGA(GC)TCA (Onodera et al 2001)
C-box TGACGTCA (Cheong et al 1998)
GCC-box TAARAGCCGCC (Leubner-Metzger et al 1998)
Amylase TATCCAY (Hwang et al 1998)
GARE RTAACRRANTCYGG (Hwang et al 1998)
GT1 box GGTTAA (Eyal et al 1995)
In amylase CGACG (Hwang et al 1998)
BS1 AGCGGG (Lacombe et al 2000)
DPBF-1 ACACNNG (Kim et al 1997)
ASF1 like TGACGT (Washida et al 1999)
E-box CANNTG (Ellerstrom et al 1996)
Prolamin-box TGYAAAG (Mena et al 1998)
I-box (core) GATAAG (Rose et al 1999)
Figure 2 Overview of relative mRNA expression during rice grain filling (A) Representation of expression profiles for 269 grain filling genes The x-axis shows the developmental stages and the y-axis shows the relative expression level E indicates the panicle at emergence S is the soft dough stage (asymp 14 days post-anthesis) and H is the hard dough stage (asymp 21 days post-anthesis) The expression levels for genes whose gene products belong to different classes including fatty acid (FA) and carbohydrate (CH) biosynthesis storage proteins and transporters and for the 269 genes were averaged based on the normalized expression level for each gene belonging to that class or in the 269-gene group (plusmn standard
deviation SD) (B) Bar graph representation of the average expression level (
plusmn
SD) for the 269 genes in various grain organs at 9 days post-anthesis Each organ type is indicated on the
x
-axis and the relative expression level is shown on the
y
-axis (C)
Pie chart representation of the functional classification of the predicted gene products of the 269 genes found to be involved in grain development The percentage for each functional category is shown
Tong Zhu
et al
copy Blackwell Publishing Ltd
Plant Biotechnology Journal
(2003)
1
59ndash70
64
in carbohydrate metabolism were studied (Supplemental
Table 3)
We found that 82 of the enzymes in the carbohydrate
metabolic pathway may be represented by isoforms as
determined by sequence analysis of the multiple probe
sets on the microarray (Figure 5) Due to the gene prediction
methods used to generate the probe sets on the GeneChip
we cannot exclude the possibility that two probe sets may
query the same mRNA However the expression profile of
every probe set shown here has unique and distinct features
in terms of spatial and temporal distribution and their
promoter sequences strongly suggesting that mRNAs for
different isoforms are in fact being queried
Two genes encoding the small subunits of ADPG pyrophos-
phorylase are expressed early in grain development in con-
junction with a single gene encoding a large subunit (Figure 5
Supplemental Table 3) Genes encoding three other large
subunits are up-regulated later in development from 4 days
after anthesis in conjunction with the up-regulation of
the starch synthase genes and two genes for branching
enzymes (involved in amylose and amylopectin biosynthesis
respectively) The expression of an additional gene encoding
the small subunit also increases over this time period The
expression of genes encoding different isoforms may be
related to the shift to storage starch production and to a
postulated concomitant shift to cytoplasmic ADP-glucose
production Interestingly two genes encoding other isoforms
of the branching enzyme are expressed early during grain
development and are then expressed less during maturation
These isoforms may be involved in transitory starch synthesis
for energy purposes during early stages (these isoforms are
also expressed in leaves) Two other isoforms are expressed
at higher levels throughout development with the highest
expression occurring around 7ndash9 days post-anthesis Similar
results were obtained for branching enzyme genes in
wheat kernels (Morell
et al
1997)
Figure 4 Expression patterns of nine putative MYB transcription factor genes showing preferential expression during grain filling BSP booting-stage panicle DPA days post-anthesis
Figure 3 Histogram of the ratio of occurrence of the AACA motif and the ASF1-like element in the grain gene cluster vs control gene cluster The histogram was generated as described in the text and is depicted for the AACA motif (A) and the ASF1-like element (B) The x-axis shows the ratio computed by dividing the total number of occurrences of either the AACA motif or the ASF1-like element in a given bootstrapped set of grain cluster genes by that in a corresponding control gene cluster The green line indicates a ratio of 1 The y-axis shows the frequency of a given ratio for each element
Gene regulation in rice grain filling
copy Blackwell Publishing Ltd Plant Biotechnology Journal (2003) 1 59ndash70
65
Figure 5 Pathway of starch biosynthesis in rice with corresponding spatio-temporal gene expression levels Dotted arrows indicate a transport process Dashed arrows indicate that intermediate steps have been omitted Key for panels (A) and (B) 0 2 4 7 9 are days post-anthesis S is soft dough stage H is hard dough stage (approximately 14 and 21 days post-anthesis respectively) ( embryo s endosperm e seed coat and aleurone at 9 days post-anthesis Panel (A) represents absolute expression levels Units are lsquoaverage intensityrsquo (Supplemental Figure 1) Panel (B) represents relative expression levels lsquoEarlyrsquo and lsquolatersquo indicate genes falling into different clusters after cluster analysis Genes that are up-regulated in embryo and endosperm are indicated by the dark grey and light grey markings respectively See text for a description of how the genes were selected
Tong Zhu et al
copy Blackwell Publishing Ltd Plant Biotechnology Journal (2003) 1 59ndash70
66
We also observed distinct spatial expression patterns for
genes encoding different isoforms (Figure 5) For example
we observed that three different sucrose synthase isoforms
are preferentially expressed in developing grain tissues two
of them are expressed more highly at the start of grain
development (0 days post-anthesis) and one is up-regulated
towards the end of grain development Other isoforms with
low expression in grains are expressed strongly in stems or
roots Among the sucrose synthase isoforms that are
preferentially expressed in grains at least three isoforms with
spatially distinct expression patterns have been reported one
in aleurone another in endosperm and a third in grain
tissues other than the endosperm (Wang et al 1999a Yen
et al 1994) Different amylases and glucosidases were also
found to be expressed in different rice grain tissues (Figure 5)
as previously reported (Awazuhara et al 2000)
The expression of the two genes encoding sucrose
synthase isoforms and one gene encoding small subunits
of ADPG pyrophosphorylase isoforms among the 10 grain
samples was examined by quantitative RT-PCR A high
correlation between the results from rice GeneChip microar-
ray and from quantitative RT-PCR was observed with an
average correlation coefficient of 092 (Supplemental
Figure 2) thus validating the specificity of the probe sets and
our observations based on the microarray results
By examining gene expression in the carbohydrate
metabolic pathway we not only confirmed the presence of
different genes encoding isoforms of the same enzyme in this
pathway during grain development (Awazuhara et al 2000
Wang et al 1999b) but also demonstrated both gene
redundancy and coordinated expression of gene families
The differential expression of various isoforms in this pathway
suggests their functional differences and gives an insight
into how structural gene expression patterns determine the
process of grain filling It suggests that transcription
control is a primary mechanism for determining endosperm
development
Mechanistic shifts suggested by transporter
transcript levels
A cluster analysis of the relative expression levels indicates
that genes encoding carbohydrate metabolic enzymes
can be broadly grouped into two phases early and late grain
development (Figure 5) Often a different gene encodes an
enzyme in each phase One isoform of a triose-phosphate
phosphate translocator is expressed at a higher level during
earlier stages of grain development In contrast two isoforms
of a hexose-phosphate translocator and another isoform of a
triose-phosphate translocator are expressed at higher levels
toward the end of grain filling
To characterize the transcription control of the genes
expressed in early and late phases we searched for common
regulatory cis-elements among the available promoters of these
genes No statistically significant elements were identified
among the promoters of the late gene cluster However a
few elements were identified from the 18 promoters of
31 genes belonging to the early gene cluster (data not shown)
Although we cannot confirm the significance of the presence
of these regulatory elements by bootstrap analysis due to
the small number of available promoters multiple classes
of grain-filling promoters may be involved in fine tuning
the process by differentially regulating the expression of
the subgene groups
Our observations also suggest that different mechanisms
for the synthesis and transport of hexose equivalents occur at
different stages during grain development PEP appears to
play a more important role during early stages of grain devel-
opment because genes encoding two isoforms of a PEP-Pi
translocator are relatively highly expressed at this stage We
still do not know if the majority of hexose equivalents are
transported to the amyloplast during the linear phase of
starch accumulation as ADP-glucose as occurs in maize
endosperm development (Shannon et al 1998) However
the expression of a Brittle homologue does indeed increase
almost twofold during seed development (data not shown)
Conclusions
Our results are consistent with the idea that rice grain filling
is a highly coordinated process The synthesis and transport
of carbohydrates storage proteins and fatty acids are co-
regulated starting at the mRNA level These co-regulated
genes contain an over-represented element the AACA motif
in their promoters We hypothesize that this element along
with other unidentified elements may interact with certain key
transcription factors including those identified in this study
to regulate and coordinate the transcription of nutrient par-
titioning genes during grain filling Within each pathway
the expression levels of genes encoding different isoforms
of enzymes are spatially and temporally defined as shown
with the carbohydrate metabolic pathway demonstrating
an additional fine regulation of gene expression at the
intra-pathway level
The rice genome array used in this study along with the
complete genome information provides a powerful tool for
studying and understanding gene function not only in this
important crop but in other cereal species as well since rice
Gene regulation in rice grain filling
copy Blackwell Publishing Ltd Plant Biotechnology Journal (2003) 1 59ndash70
67
shows great synteny and high sequence similarity with other
cereal genomes (Goff et al 2002)
Experimental procedures
Materials and GeneChip microarray experiments
Nipponbare rice (Oryza sativa L ssp Japonica) was grown in
a greenhouse with a 12 h light cycle at 29 degC during the day
and 21 degC during the night Humidity was maintained at
30 Plants were grown in pots containing 50 Sunshine
mix and 50 nitrohumus Tissues were collected from at
least five plants and pooled for each time point The
samples were homogenized in liquid nitrogen prior to
RNA isolation Immature embryo endosperm aleurone and
seed coat samples were dissected from grains of 88-day-old-
plants For the aleurone layers samples were prepared accord-
ing to a previously described procedure (Fath et al 1999) A
complete sample list and description is listed in Table 2
The experiments were performed as previously described
(Zhu et al 2001) Briefly total RNA was isolated using
Qiagen RNeasy columns (Qiagen Chatsworth CA) and
examined by gel electrophoresis for integrity and by spec-
trometry for purity To ensure data quality only samples with
A260A280 ratios of 19ndash21 were included in the study
Total RNA (5 microg) from each sample was reverse transcribed
at 42 degC for 1 h using 100 pmol of the oligo dT(24) primer
containing a 5prime-T7 RNA polymerase promoter sequence
[5prime-GGCCAGTGAATTGTAATACGACTCACTATAGGGAGGCGG-
(dT)24-3] 50 mM Tris-HCl (pH 83) 75 mM KCl 3 mM MgCl2
10 mM dithiotreitol (DTT) 05 mM dNTPs and 200 units of
SuperScript II reverse transcriptase (Life Technologies) The
second strand of cDNA was synthesized using 40 units
of E coli DNA polymerase I 10 units of E coli DNA ligase
and 2 units of RNase H in a reaction containing 25 mM
Tris-HCl (pH 75) 100 mM KCl 5 mM MgCl2 10 mM (NH4)SO4
015 mM b-NAD+ 1 mM dNTPs and 12 mM DTT The reac-
tion proceeded for 2 h at 16 degC and was terminated using
EDTA Double-stranded cDNA products were purified by
phenolchloroform extraction and ethanol precipitation
Biotinylated complementary RNAs (cRNAs) were tran-
scribed in vitro from synthesized cDNA by T7 RNA Polymerase
(ENZO BioArray High Yield RNA Transcript Labelling Kit Enzo)
cRNAs were purified using affinity resin (Qiagen RNeasy
Spin Columns) and randomly fragmented by incubating
at 94 degC for 35 min in a buffer containing 40 mM Tris-
acetate (pH 81) 100 mM potassium acetate and 30 mM
magnesium acetate to produce molecules of approximately
35ndash200 bases
The labelled samples were mixed with 01 mgmL soni-
cated herring sperm DNA in a hybridization buffer containing
100 mM 2-N-morpholino-ethane-sulphonic acid (MES) 1 M
NaCl 20 mM EDTA 001 Tween 20 denatured at 99 degC for
5 min and equilibrated at 45 degC for 5 min before hybridiza-
tion The hybridization mix was then transferred to the rice
GeneChip microarray cartridge and hybridized at 45 degC for
16 h on a rotisserie at 60 rpm
The hybridized arrays were then rinsed and stained in a
fluidics station (Affymetrix) They were first rinsed with wash
buffer A (6times SSPE (09 M NaCl 006 M NaH2PO4 0006 M
EDTA) 001 Tween 20 0005 Antifoam) at 25 degC for
10 min and incubated with wash buffer B (100 mM MES
01 M NaCl 001 Tween 20) at 50 degC for 20 min then
stained with Streptavidin Phycoerythrin (SAPE) 100 mM MES
1 M NaCl 005 Tween 20 0005 Antifoam 10 mgmL
SAPE 2 mgmL BSA at 25 degC for 10 min washed with wash
buffer A at 25 degC for 20 min and stained with biotinylated
antistreptavidin antibody at 25 degC for 10 min After staining
arrays were stained with SAPE at 25 degC for 10 min and
washed with wash buffer A at 30 degC for 30 min The probe
arrays were scanned twice and the intensities were aver-
aged with an Agilent GeneArray Scanner using GeneChip
Suite 40 (Affymetrix)
Data transformation and cluster analysis
The average intensity of all probe sets of each array was
scaled to 100 so that the hybridization intensity of all arrays
was equivalent Genes encoding products potentially involved
in the transport and synthesis of carbohydrates fatty acids
and storage proteins were selected based on their sequence
homology to known genes Expression levels of the selected
genes were processed before being subjected to cluster
analysis according to the following procedure First any
expression values (average fluorescence signals) that were
less than 5 were adjusted to 5 Then the adjusted expression
values were log2-transformed median centred and normalized
among the selected genes so that the sum of squares for
each expression vector was equal to one in order to better
visualize the change in shape of the profile over time and
space regardless of the magnitude of expression level The
processed data were then used for cluster analysis using
CLUSTER (Eisen et al 1998) with self-organizing maps fol-
lowed by complete linkage hierarchical clustering of both genes
and experiments The results were visualized with TREEVIEW
(Eisen et al 1998)
Data for the putative nutrient partitioning genes (identified
from cluster analysis) that are preferentially expressed during
Tong Zhu et al
copy Blackwell Publishing Ltd Plant Biotechnology Journal (2003) 1 59ndash70
68
grain filling were then imported into GENESPRING (Silicon
Genetics Redwood CA) Genes with similar expression patterns
(ie correlation coefficients greater than 085) as the original
bait genes were further selected and are collectively referred
to as grain filling genes
The confidence of finding 98 grain filling genes was
assessed through bootstrapping the 491 genes 100 times
For each cycle 98 genes were randomly selected from the
491 genes Then Pearson correlation coefficients were
calculated between the average of the 98 randomly selected
genes and that of the 98 grain filling genes and the P-value
was deduced from the 100 Pearson correlation coefficients
using the following equations
Promoter analysis
The promoter sequences of the grain filling genes were iden-
tified by BLAST search of the open reading frame sequences
of these genes against the published predicted rice gene
sequences (Goff et al 2002) The predicted gene sequence
that was the best match with scores greater than 1E-20 was
used to represent the open reading frame The 15 kb regions
upstream from the putative ATG start site were extracted
using a custom Perl script
Analysis of starch biosynthesis pathway
Data series for probe sets were considered for analysis if the
average intensity was above 25 in any sample in the series
(Supplemental Figure 1) The transformed data were then
loaded into GENESPRING (Silicon Genetics Redwood CA) A
pathway for starch biosynthesis and degradation was gener-
ated from several sources (Dennis and Emes 1990 Kruger
1990 Myers et al 2000 Stitt 1990) and was converted to
a GIF file and imported into GeneSpring Expression level
display boxes were drawn on this GIF using the mapping
function in GENESPRING Genes were selected for display at the
appropriate location on this image based on their annotation
(Goff et al 2002) For genes that have a cytoplasmic and a
plastidic isoform the isoforms were differentiated based on
the annotation where possible
Validation of microarray data
Quantitative RT-PCR assays were performed on an ABI Prism
7700 (Applied Biosystems Foster City CA) as previously
described using the primers and probe sets specific to genes
encoding isoform described (Supplemental Figure 2) A
standard curve consisting of serial 1 5 dilutions was
prepared with RNA concentrations of 50 ngmicroL 10 ngmicroL
2 ngmicroL 04 ngmicroL and 008 ngmicroL Relative expression levels
were interpolated by comparison with standard curves with
a correlation coefficient of 099 or greater Relative expres-
sion levels were normalized to the expression level of a rice
polyubiquitin gene in each sample which was expressed at a
constant level All reactions were performed in triplicate
Acknowledgements
We thank T Moughamer and C Martin for rice sequence
selection for the rice GeneChip design We also thank S Goff
and J Glazebrook for a critical reading of this manuscript
Supplementary material
To confirm the conclusions of the paper the supplemental
data can be accessed through the journalrsquos website lthttp
wipblackwellpublishingcomproducts journals suppmatPBI
PBI006PBI006smhtmgt and the authorsrsquo website lthttp
tmriorggene_exp_webgt To get sequence information for
the Sequence IDs (Probe Set IDs) referred in the paper go to
lthttptmriorggene_exp_webrice_probesetshtmlgt and enter
the Sequence ID (eg OS0007591_at OS_ORF006203_at) into
the query template provide
References
Altschul SF Madden TL Schaffer AA Zhang J Zhang ZMiller W and Lipman DJ (1997) Gapped BLAST and PSI-BLASTa new generation of protein database search programs NuclAcids Res 25 3389ndash3402
Awazuhara M Nakagawa A Yamaguchi J Fujiwara T Hayashi HHatae K Chino M and Shimada A (2000) Distribution andcharacterization of enzymes causing starch degradation in rice(Oryza sativa cv koshihikari) J Agric Food Chem 48 245ndash252
Baker SS Wilhelm KS and Thomashow MF (1994) The 5prime-region of Arabidopsis thaliana cor15a has cis-acting elements thatconfer cold- drought- and ABA-regulated gene expression PlantMol Biol 24 701ndash713
Cheong YH Yoo CM Park JM Ryu GR Goekjian VHNagao RT Key JL Cho MJ and Hong JC (1998) STF1 is a novelTGACG-binding factor with a zinc-finger motif and a bZIP domainwhich heterodimerizes with GBF proteins Plant J 15 199ndash209
Dennis DT and Emes MJ (1990) Regulation by compartmenta-tion In Plant Physiology Biochemistry and Molecular Biology(Dennis DT and Turpin DH eds) pp 45ndash55 London UKLongman Scientific and Technical
Efron B and Tibshirani RJ (1994) Random samples and probabilityIn An Introduction to the Bootstrap pp 17ndash28 Boca Raton FLMonographs on Statistics and Applied Probability
tX
SS
S
NXX
=
minus=
micro
Gene regulation in rice grain filling
copy Blackwell Publishing Ltd Plant Biotechnology Journal (2003) 1 59ndash70
69
Eisen MB Spellman PT Brown PO and Botstein D (1998)Cluster analysis and display of genome-wide expression patternsProc Natl Acad Sci USA 95 14863ndash14868
Ellerstrom M Stalberg K Ezcurra I and Rask L (1996) Functionaldissection of a napin gene promoter identification of promoterelements required for embryo and endosperm-specific transcrip-tion Plant Mol Biol 32 1019ndash1027
Eyal Y Curie C and McCormick S (1995) Pollen specificityelements reside in 30 bp of the proximal promoters of twopollen-expressed genes Plant Cell 7 373ndash384
Fath A Bethke PC and Jones RL (1999) Barley aleurone celldeath is not apoptotic characterization of nuclease activities andDNA degradation Plant J 20 305ndash315
Girke T Todd J Ruuska S White J Benning C and Ohlrogge J(2000) Microarray analysis of developing Arabidopsis seeds PlantPhysiol 124 1570ndash1581
Goff SA Ricke D Lan TH Presting G Wang R Dunn MGlazebrook J Sessions A Oeller P Varma H et al (2002) Adraft sequence of the rice genome (Oryza sativa L ssp japonica)Science 296 92ndash100
Hwang YS Karrer EE Thomas BR Chen L and Rodriguez RL(1998) Three cis-elements required for rice α-amylase Amy3Dexpression during sugar starvation Plant Mol Biol 36 331ndash341
Kim SY Chung HJ and Thomas TL (1997) Isolation of a novelclass of bZIP transcription factors that interact with ABA-responsive and embryo-specification elements in the Dc3 pro-moter using a modified yeast one-hybrid system Plant J 111237ndash1251
Kruger M (1990) Carborhydrate Synthesis and Degradation InPlant Physiology Biochemistry and Molecular Biology (Dennis DTand Turpin DH eds) pp 59ndash76 London Longman Scientificand Technical
Lacombe E Van Doorsselaere J Boerjan W Boudet AMand Grima-Pettenati J (2000) Characterization of cis-elementsrequired for vascular expression of the cinnamoyl CoA reductasegene and for proteinndashDNA complex formation Plant J 23663ndash676
Leubner-Metzger G Petruzzelli L Waldvogel R Vogeli-Lange Rand Meins F Jr (1998) Ethylene-responsive element bindingprotein (EREBP) expression and the transcriptional regulation ofclass I β-13-glucanase during tobacco seed germination PlantMol Biol 38 785ndash795
Lipshultz RJ Fodor SP Gingeras TR and Lockhart DJ (1999)High density synthetic oligonucleotide arrays Nat Genet 2120ndash24
Lockhart DJ Dong H Byrne MC Follettie MT Gallo MVChee MS Mittmann M Wang C Kobayashi M Horton Hand Brown EL (1996) Expression monitoring by hybridization tohigh-density oligonucleotide arrays Nat Biotechnol 14 1675ndash1680
Mazur B Krebbers E and Tingey S (1999) Gene discovery andproduct development for grain quality traits Science 285372ndash375
Mena M Vicente-Carbajosa J Schmidt RJ and Carbonero P(1998) An endosperm-specific DOF protein from barley highlyconserved in wheat binds to and activates transcription fromthe prolamin-box of a native B-hordein promoter in barleyendosperm Plant J 16 53ndash62
Morell MK Blennow A Kosar-Hashemi B and Samuel MS(1997) Differential expression and properties of starch branching
enzyme isoforms in developing wheat endosperm Plant Physiol113 201ndash208
Myers AM Morell MK James MG and Ball SG (2000) Recentprogress toward understanding biosynthesis of the amylopectincrystal Plant Physiol 122 989ndash997
Onodera Y Suzuki A Wu CY Washida H and Takaiwa F(2001) A rice functional transcriptional activator RISBZ1 respon-sible for endosperm-specific expression of storage protein genesthrough GCN4 motif J Biol Chem 276 14139ndash14152
Ren B Robert F Wyrick JJ Aparicio O Jennings EG Simon IZeitlinger J Schreiber J Hannett N Kanin E et al (2000)Genome-wide location and function of DNA binding proteinsScience 290 2306ndash2309
Rose A Meier I and Wienand U (1999) The tomato I-box bindingfactor LeMYBI is a member of a novel class of myb-like proteinsPlant J 20 641ndash652
Roth FP Hughes JD Estep PW and Church GM (1998) FindingDNA regulatory motifs within unaligned noncoding sequencesclustered by whole-genome mRNA quantitation Nat Biotechnol16 939ndash945
Rushton PJ and Somssich IE (1998) Transcriptional control ofplant genes responsive to pathogens Curr Opin Plant Biol 1311ndash315
Ruuska SA Girke T Benning C and Ohlrogge JB (2002)Contrapuntal networks of gene expression during Arabidopsisseed filling Plant Cell 14 1191ndash1206
Shannon JC Pien FM Cao H and Liu KC (1998) Brittle-1 anadenylate translocator facilitates transfer of extraplastidialsynthesized ADPndashglucose into amyloplasts of maize endospermsPlant Physiol 117 1235ndash1252
Singh V Okadome H Toyoshima H Isobe S and Ohtsubo K(2000) Thermal and physicochemical properties of rice grain flourand starch J Agric Food Chem 48 2639ndash2647
Stitt M (1990) The flux of carbon between the chloroplast andcytoplasm In Plant Physiology Biochemistry and MolecularBiology (Dennis DT and Turpin DH eds) pp 309ndash326 LondonLongman Scientific and Technical
Umemoto T Nakamura Y and Ishikura N (1995) Activity of starchsynthase and the amylose content in rice endosperm Phytochem-istry 40 1613ndash1616
Vicente-Carbajosa J Moose SP Parsons RL and Schmidt RJ(1997) A maize zinc-finger protein binds the prolamin box in zeingene promoters and interacts with the basic leucine zippertranscriptional activator Opaque2 Proc Natl Acad Sci USA 947685ndash7690
Wang AY Kao MH Yang WH Sayion Y Liu LF Lee PD andSu JC (1999a) Differentially and developmentally regulatedexpression of three rice sucrose synthase genes Plant Cell Physiol40 800ndash807
Wang RL Stec A Hey J Lukens L and Doebley J (1999b) Thelimits of selection during maize domestication Nature 398236ndash239
Washida H Wu CY Suzuki A Yamanouchi U Akihama THarada K and Takaiwa F (1999) Identification of cis-regulatoryelements required for endosperm expression of the rice storageprotein glutelin gene GluB-1 Plant Mol Biol 40 1ndash12
Wu C Washida H Onodera Y Harada K and Takaiwa F (2000)Quantitative nature of the Prolamin-box ACGT and AACA motifsin a rice glutelin gene promoter minimal cis-element requirementsfor endosperm-specific gene expression Plant J 23 415ndash421
Tong Zhu et al
copy Blackwell Publishing Ltd Plant Biotechnology Journal (2003) 1 59ndash70
70
Ye X Al-Babili S Kloti A Zhang J Lucca P Beyer P andPotrykus I (2000) Engineering the provitamin A (beta-carotene)biosynthetic pathway into (carotenoid-free) rice endospermScience 287 303ndash305
Yen SF Su JC and Sung HY (1994) Purification and character-ization of rice sucrose synthase isozymes Biochem Mol Biol Int34 613ndash620
Yu J Hu S Wang J Wong GK Li S Liu B Deng Y
Dai L Zhou Y Zhang X et al (2002) A draft sequence ofthe rice genome (Oryza sativa L ssp indica) Science 296 79ndash92
Zhu T Budworth P Han B Brown D Chang HS Zou G andWang X (2001) Toward elucidating the global gene expressionpatterns of developing Arabidopsis Parallel analysis of 8300genes by high-density oligonucleotide probe array Plant PhysiolBiochem 39 221ndash242
Tong Zhu
et al
copy Blackwell Publishing Ltd
Plant Biotechnology Journal
(2003)
1
59ndash70
60
in developing
Arabidopsis
seeds identified many important
genes and demonstrated the complexity of the process
(Girke
et al
2000 Ruuska
et al
2002 Zhu
et al
2001)
However the dramatic differences between
Arabidopsis
and
cereal crops in seed structure developmental process and
storage reserves make the application of these findings to
cereal grains difficult
The recent publication of the rice genome provides us
with not only a genetic blueprint but also an opportunity
for studying functional genomics in rice and other cereal
crops (Goff
et al
2002 Yu
et al
2002) Using rice genome
sequence information (Goff
et al
2002) we developed a
GeneChip genome array to identify genes with the potential
to be involved in rice grain development by examining the
expression of 21 000 genes during rice plant development
Special attention was paid to the regulation of major path-
ways associated with grain filling These pathways determine
nutrient partitioning and as a consequence control the
composition and accumulation of nutrients thus affecting
yield nutritional characteristics and culinary quality of the
grain
Results and discussion
Design of the rice GeneChip genome microarray
The rice GeneChip genome array was designed based on the
sequenced genome of Nipponbare rice (Goff
et al
2002)
Gene sequences were selected based on computational
prediction as previously described (Goff
et al
2002) and with
reference to matching expressed sequence tags (ESTs) and
protein sequences Predicted open reading frames from the
assembly were confirmed by B
LAST
search against the G
EN-
B
ANK
EST database and S
WISS
P
ROT
protein database Thus
genes represented on the array included some with known
functions some whose functions are predicted by DNA
sequence analysis and some predicted with a match to EST
or protein sequences Redundant sequences and introns
were eliminated computationally
The rice GeneChip microarray uses 25-mer oligonucle-
otides with sequences corresponding to the 3
prime
sequence of
open reading frames as probes These oligonucleotide probe
sequences were selected according to the standard array
design procedure (Lipshultz
et al
1999 Lockhart
et al
1996) To increase the capacity of the GeneChip genome
array so that probes for a complex genome such as that of
rice could be accommodated in a single array a novel design
consisting of only perfect matched probes and a 20
micro
m
feature size was used The new design allows 16 probes for
each of the 21 000 rice genes to be represented on a single
array The signal distribution was calculated and outliers
were identified for each probe set The expression level of a
gene was calculated from the median hybridization signal
on the probes in the corresponding probe set excluding
outliers The absolute call (present or P marginal or M and
absent or A) was based on the expression level and the
noise background associated with each probe The sensitivity
of detection was found to be 1 300 000 and the dynamic
range was gt 500-fold based on spike experiments (data
not shown) Reproducibility studies using labelled samples
prepared in parallel from identical rice total RNA indicated
that the data obtained with the rice microarray are highly
reproducible with a false-positive rate of less than 05 at
twofold change level (Supplemental Figure 1)
Selection of grain filling genes
The mRNA expression levels of 21 000 genes in 33 rice
samples including 17 from various stages of grain filling
(Table 1) were investigated following the protocol illustrated
in Figure 1 Briefly from the 21 000 rice genes we first
identified 491 genes whose products are presumably involved
in or associated with three major pathways of nutrient
partitioning the synthesis and transport of carbohydrates
proteins and fatty acids based on their sequence annotation
(Goff
et al
2002) and functional classification We realize
that gene annotation based on sequence homology alone
cannot be relied upon as evidence that a gene is involved in
a particular pathway especially if the annotation is based
on multiple rounds of automated annotation (Goff
et al
2002 Yu
et al
2002) However the functions of many genes
in the list have been verified experimentally according to
previous reports
Cluster analysis of the expression patterns of these 491
genes identified 98 that are preferentially expressed during
grain development Using these genes as bait we searched
21 000 genes for those with similar grain-preferential expres-
sion patterns using pattern matching based on a correlation
among 33 samples An additional 171 genes with a high
correlation to the bait (
r
= 085) were identified Thus we
considered these 269 genes to be lsquograin filling genesrsquo
(Supplemental Table 1)
To exclude the possibility that the 98 grain filling genes
were identified by random chance a bootstrap analysis was
employed where the same number of genes were randomly
selected from the 491 genes 100 times In contrast to the
nucleated lsquograin filling genersquo cluster the randomly sampled
gene clusters showed a constant expression pattern in
Gene regulation in rice grain filling
copy Blackwell Publishing Ltd
Plant Biotechnology Journal
(2003)
1
59ndash70
61
the 17 grain samples examined (data not shown) The exp-
ression patterns of 100 randomly sampled gene clusters are
significantly different compared to that of the grain filling
genes (
P
lt 00005) While the encoded gene products of
these 269 grain filling genes are active in different pathways
the expression levels of these genes were found to increase
synchronously during grain development (Figure 2A)
Expression pattern and functional classification of the
grain filling genes
The spatial distribution of the transcripts of the nutrient
partitioning genes in developing grains indicated by extrap-
olation of mRNA levels to biological functions that the
endosperm is the main sink for all the nutrients studied espe-
cially carbohydrates and proteins (Figure 2B) However the
expression of genes involved in fatty acid biosynthesis is more
balanced between the embryo and endosperm
The deduced products of the grain filling genes have
diverse functions (Figure 2C) Among the 269 grain filling
genes 42 are involved in starch biosynthesis 28 in lipid
biosynthesis and 33 in seed storage protein synthesis Inter-
estingly 30 genes in this set encode various transporters
such as sugar transporters ABC transporters amino acid
peptide transporters phosphate transporters and nitrate
transporters As expected the largest category consists of
genes with unknown or unclassified functions (Figure 2C)
consistent with the genome annotation in rice (Goff
et al
2002 Yu
et al
2002)
Identification of common
cis
-elements shared by grain
filing genes
To clarify the transcriptional control of the coordinated
processes involved in grain filling and to identify common
regulatory elements the promoter sequences for the 269
genes were extracted according to the following procedure
The probe set sequences were used to B
LASTN
align (Altschul
et al
1997) against the predicted genes (Goff
et al
2002)
Promoter sequences from predicted genes that aligned
(1E-20) with the probe sequences were then extracted using
a custom P
ERL
script Only 103 of the 269 grain filling genes
contain the 15 kb upstream sequences (Supplemental Table 2)
These promoter sequences were analysed by A
LIGN
ACE
(Roth
et al
1998) We could not identify any common novel
cis
-elements that were over-represented in this grain filling
gene cluster This may be due to the higher GC content of the
rice genome (Goff
et al
2002) relative to the genomes of the
organisms that were used to develop the program
We then analysed 16
cis
-elements that appear to play a
role in grain development (Table 2) Comparison of the
percentage of occurrence of each element in the promoters
of genes in the grain gene cluster and in the promoters of all
the genes represented in the microarray revealed that the
AACA element appears to be over-represented in the 103
available promoters of the grain gene cluster
To demonstrate the over-representation of the AACA
element we performed a bootstrap analysis (Efron and
Tibshirani 1994) One thousand control promoter sets each
of which contains 103 promoters from genes that were
randomly selected from the rice genome microarray were
generated In parallel the grain filling gene cluster was
randomly sampled to generate 1000 sets of 103-grain gene
promoters The ratio of the total number of occurrences of
the AACA element in each grain gene promoter set to that
Tab e 1 Rice samp es inc uded in the study
Description Days after germination
Root germinating seedling stage 5
Leaf germinating seedling stage 5
Arial 3ndash4 leaf stage 18
Root tillering stage 49
Leaf tillering stage 49
Arial tillering stage 49
Panicle booting stage 1ndash3 cm 60
Panicle booting stage 4ndash7 cm 62
Panicle booting stage 8ndash14 cm 64
Panicle booting stage 15ndash20 cm 66
Root booting stage 60
Leaf booting stage 60
Arial booting stage 60
Root panicle emergence 78
Stem panicle emergence 78
Panicle panicle emergence 78
Inflorescence no grains 88
Stem maturation 90
Root maturation 90
Leaf maturation 90
Stem senescence 100
Leaf senescence 100
Grain day 0 post-anthesis 79
Grain day 2 post-anthesis 81
Grain day 4 post-anthesis 83
Grain day 7 post-anthesis 86
Grain day 9 post-anthesis 88
Grain soft dough (asymp 14 days post-anthesis) 93
Grain hard dough (asymp 21 days post-anthesis) 100
Embryo 88
Endosperm 88
Seed coat 88
Aleurone 88
Tong Zhu
et al
copy Blackwell Publishing Ltd
Plant Biotechnology Journal
(2003)
1
59ndash70
62
in a corresponding control promoter set was computed A
ratio greater than one indicated that the element occurred
more often in grain promoters than in control promoters A
histogram was generated to visualize the ratio of distribution
for the AACA element in each pair of promoter sets (grain
filling gene set vs control gene set) As shown in Figure 3A
the ratio for the AACA element in each pair of 1000 pro-
moter sets ranged from 0833 to 221 and 977 promoter
sets had a ratio greater than 1 Thus at a 95 confidence
level (
P
-value 0046) the AACA element is over-represented
among the promoters from the grain filling gene cluster For
comparison we applied the same bootstrap analysis to the
ASF1-like element As shown in Figure 3B the ratio for the
ASF1-like element in 1000 promoter sets ranged from 046
to 213 and 568 promoter sets had a ratio which was less than
or equal to 1 It is therefore clear that the ASF1-like element is
not statistically over-represented in the grain gene promoters
The AACA element is conserved among the promoters of
many genes encoding seed storage proteins and is required
for full expression of the rice
GluB-1
gene (Wu
et al
2000)
Among the 103 genes in the grain gene cluster 63 contain
1ndash7 copies of the AACA element per promoter Interestingly
proteins encoded by these predicted genes appear to have
diverse cellular functions including carbohydrate and fatty
acid metabolism nutrient transport transcription and
translation Genes encoding storage proteins were also
found This extends previous findings (Wu
et al
2000)
and suggests that the AACA element could play a key
role in coordinating various major pathways during grain
development
Identification of transcription factors involved in grain
filling
Although transcription factors that bind to the AACA
element have not yet been identified this element is similar
to the type II MYB consensus sequence AMCWAMC which
is required for the expression of several genes such as the
parsley
PAL1
gene (Rushton and Somssich 1998) This sug-
gests that MYB proteins may also be involved in controlling
the expression of grain filling genes
To examine the involvement of transcription factors in
the transcriptional control of grain filling we analysed the
expression patterns for 563 known and putative transcription
Figure 1 Schematic diagram of the data mining process used in this study Grain filling genes were selected based on homology to known function genes and their expression in 33 samples was determined during rice development
Gene regulation in rice grain filling
copy Blackwell Publishing Ltd
Plant Biotechnology Journal
(2003)
1
59ndash70
63
factor genes during grain filling Cluster analysis identified a
group of transcription factor genes with expression patterns
similar to that of the 269 grain filling genes This cluster
includes genes such as
RITA
a bZIP type transcription factor
gene that is highly expressed in aleurone and endosperm
tissues and may be important in regulating gene expression
in developing rice grains (Onodera
et al
2001) Other genes
included in this cluster are
Dof
genes whose gene products
can activate the expression of seed storage protein genes
by binding to the prolamine-box (Vicente-Carbajosa
et al
1997) and nine known and putative
MYB
genes (Figure 4)
The correlation between the gene expression patterns of these
transcription factors and their previously identified functions
suggests their involvement during rice grain filling To confirm
their functions
in vivo
DNA binding assays are being per-
formed for genes encoding selected transcription factors
using a strategy that has been successful in yeast (Ren
et al
2000)
Isoforms as mechanisms for intra-pathway regulation
To examine the potential participation and regulation of genes
encoding different isoforms in the grain-filling process the
mRNA dynamics of 87 genes on the rice genome array involved
Table 2 cis-element table with references
Cis-element Sequence Reference
Cold CCGAC (Baker et al 1994)
G-box CACGTG (Hwang et al 1998)
AACA motif AACAAAA (Wu et al 2000)
GCN4 TGA(GC)TCA (Onodera et al 2001)
C-box TGACGTCA (Cheong et al 1998)
GCC-box TAARAGCCGCC (Leubner-Metzger et al 1998)
Amylase TATCCAY (Hwang et al 1998)
GARE RTAACRRANTCYGG (Hwang et al 1998)
GT1 box GGTTAA (Eyal et al 1995)
In amylase CGACG (Hwang et al 1998)
BS1 AGCGGG (Lacombe et al 2000)
DPBF-1 ACACNNG (Kim et al 1997)
ASF1 like TGACGT (Washida et al 1999)
E-box CANNTG (Ellerstrom et al 1996)
Prolamin-box TGYAAAG (Mena et al 1998)
I-box (core) GATAAG (Rose et al 1999)
Figure 2 Overview of relative mRNA expression during rice grain filling (A) Representation of expression profiles for 269 grain filling genes The x-axis shows the developmental stages and the y-axis shows the relative expression level E indicates the panicle at emergence S is the soft dough stage (asymp 14 days post-anthesis) and H is the hard dough stage (asymp 21 days post-anthesis) The expression levels for genes whose gene products belong to different classes including fatty acid (FA) and carbohydrate (CH) biosynthesis storage proteins and transporters and for the 269 genes were averaged based on the normalized expression level for each gene belonging to that class or in the 269-gene group (plusmn standard
deviation SD) (B) Bar graph representation of the average expression level (
plusmn
SD) for the 269 genes in various grain organs at 9 days post-anthesis Each organ type is indicated on the
x
-axis and the relative expression level is shown on the
y
-axis (C)
Pie chart representation of the functional classification of the predicted gene products of the 269 genes found to be involved in grain development The percentage for each functional category is shown
Tong Zhu
et al
copy Blackwell Publishing Ltd
Plant Biotechnology Journal
(2003)
1
59ndash70
64
in carbohydrate metabolism were studied (Supplemental
Table 3)
We found that 82 of the enzymes in the carbohydrate
metabolic pathway may be represented by isoforms as
determined by sequence analysis of the multiple probe
sets on the microarray (Figure 5) Due to the gene prediction
methods used to generate the probe sets on the GeneChip
we cannot exclude the possibility that two probe sets may
query the same mRNA However the expression profile of
every probe set shown here has unique and distinct features
in terms of spatial and temporal distribution and their
promoter sequences strongly suggesting that mRNAs for
different isoforms are in fact being queried
Two genes encoding the small subunits of ADPG pyrophos-
phorylase are expressed early in grain development in con-
junction with a single gene encoding a large subunit (Figure 5
Supplemental Table 3) Genes encoding three other large
subunits are up-regulated later in development from 4 days
after anthesis in conjunction with the up-regulation of
the starch synthase genes and two genes for branching
enzymes (involved in amylose and amylopectin biosynthesis
respectively) The expression of an additional gene encoding
the small subunit also increases over this time period The
expression of genes encoding different isoforms may be
related to the shift to storage starch production and to a
postulated concomitant shift to cytoplasmic ADP-glucose
production Interestingly two genes encoding other isoforms
of the branching enzyme are expressed early during grain
development and are then expressed less during maturation
These isoforms may be involved in transitory starch synthesis
for energy purposes during early stages (these isoforms are
also expressed in leaves) Two other isoforms are expressed
at higher levels throughout development with the highest
expression occurring around 7ndash9 days post-anthesis Similar
results were obtained for branching enzyme genes in
wheat kernels (Morell
et al
1997)
Figure 4 Expression patterns of nine putative MYB transcription factor genes showing preferential expression during grain filling BSP booting-stage panicle DPA days post-anthesis
Figure 3 Histogram of the ratio of occurrence of the AACA motif and the ASF1-like element in the grain gene cluster vs control gene cluster The histogram was generated as described in the text and is depicted for the AACA motif (A) and the ASF1-like element (B) The x-axis shows the ratio computed by dividing the total number of occurrences of either the AACA motif or the ASF1-like element in a given bootstrapped set of grain cluster genes by that in a corresponding control gene cluster The green line indicates a ratio of 1 The y-axis shows the frequency of a given ratio for each element
Gene regulation in rice grain filling
copy Blackwell Publishing Ltd Plant Biotechnology Journal (2003) 1 59ndash70
65
Figure 5 Pathway of starch biosynthesis in rice with corresponding spatio-temporal gene expression levels Dotted arrows indicate a transport process Dashed arrows indicate that intermediate steps have been omitted Key for panels (A) and (B) 0 2 4 7 9 are days post-anthesis S is soft dough stage H is hard dough stage (approximately 14 and 21 days post-anthesis respectively) ( embryo s endosperm e seed coat and aleurone at 9 days post-anthesis Panel (A) represents absolute expression levels Units are lsquoaverage intensityrsquo (Supplemental Figure 1) Panel (B) represents relative expression levels lsquoEarlyrsquo and lsquolatersquo indicate genes falling into different clusters after cluster analysis Genes that are up-regulated in embryo and endosperm are indicated by the dark grey and light grey markings respectively See text for a description of how the genes were selected
Tong Zhu et al
copy Blackwell Publishing Ltd Plant Biotechnology Journal (2003) 1 59ndash70
66
We also observed distinct spatial expression patterns for
genes encoding different isoforms (Figure 5) For example
we observed that three different sucrose synthase isoforms
are preferentially expressed in developing grain tissues two
of them are expressed more highly at the start of grain
development (0 days post-anthesis) and one is up-regulated
towards the end of grain development Other isoforms with
low expression in grains are expressed strongly in stems or
roots Among the sucrose synthase isoforms that are
preferentially expressed in grains at least three isoforms with
spatially distinct expression patterns have been reported one
in aleurone another in endosperm and a third in grain
tissues other than the endosperm (Wang et al 1999a Yen
et al 1994) Different amylases and glucosidases were also
found to be expressed in different rice grain tissues (Figure 5)
as previously reported (Awazuhara et al 2000)
The expression of the two genes encoding sucrose
synthase isoforms and one gene encoding small subunits
of ADPG pyrophosphorylase isoforms among the 10 grain
samples was examined by quantitative RT-PCR A high
correlation between the results from rice GeneChip microar-
ray and from quantitative RT-PCR was observed with an
average correlation coefficient of 092 (Supplemental
Figure 2) thus validating the specificity of the probe sets and
our observations based on the microarray results
By examining gene expression in the carbohydrate
metabolic pathway we not only confirmed the presence of
different genes encoding isoforms of the same enzyme in this
pathway during grain development (Awazuhara et al 2000
Wang et al 1999b) but also demonstrated both gene
redundancy and coordinated expression of gene families
The differential expression of various isoforms in this pathway
suggests their functional differences and gives an insight
into how structural gene expression patterns determine the
process of grain filling It suggests that transcription
control is a primary mechanism for determining endosperm
development
Mechanistic shifts suggested by transporter
transcript levels
A cluster analysis of the relative expression levels indicates
that genes encoding carbohydrate metabolic enzymes
can be broadly grouped into two phases early and late grain
development (Figure 5) Often a different gene encodes an
enzyme in each phase One isoform of a triose-phosphate
phosphate translocator is expressed at a higher level during
earlier stages of grain development In contrast two isoforms
of a hexose-phosphate translocator and another isoform of a
triose-phosphate translocator are expressed at higher levels
toward the end of grain filling
To characterize the transcription control of the genes
expressed in early and late phases we searched for common
regulatory cis-elements among the available promoters of these
genes No statistically significant elements were identified
among the promoters of the late gene cluster However a
few elements were identified from the 18 promoters of
31 genes belonging to the early gene cluster (data not shown)
Although we cannot confirm the significance of the presence
of these regulatory elements by bootstrap analysis due to
the small number of available promoters multiple classes
of grain-filling promoters may be involved in fine tuning
the process by differentially regulating the expression of
the subgene groups
Our observations also suggest that different mechanisms
for the synthesis and transport of hexose equivalents occur at
different stages during grain development PEP appears to
play a more important role during early stages of grain devel-
opment because genes encoding two isoforms of a PEP-Pi
translocator are relatively highly expressed at this stage We
still do not know if the majority of hexose equivalents are
transported to the amyloplast during the linear phase of
starch accumulation as ADP-glucose as occurs in maize
endosperm development (Shannon et al 1998) However
the expression of a Brittle homologue does indeed increase
almost twofold during seed development (data not shown)
Conclusions
Our results are consistent with the idea that rice grain filling
is a highly coordinated process The synthesis and transport
of carbohydrates storage proteins and fatty acids are co-
regulated starting at the mRNA level These co-regulated
genes contain an over-represented element the AACA motif
in their promoters We hypothesize that this element along
with other unidentified elements may interact with certain key
transcription factors including those identified in this study
to regulate and coordinate the transcription of nutrient par-
titioning genes during grain filling Within each pathway
the expression levels of genes encoding different isoforms
of enzymes are spatially and temporally defined as shown
with the carbohydrate metabolic pathway demonstrating
an additional fine regulation of gene expression at the
intra-pathway level
The rice genome array used in this study along with the
complete genome information provides a powerful tool for
studying and understanding gene function not only in this
important crop but in other cereal species as well since rice
Gene regulation in rice grain filling
copy Blackwell Publishing Ltd Plant Biotechnology Journal (2003) 1 59ndash70
67
shows great synteny and high sequence similarity with other
cereal genomes (Goff et al 2002)
Experimental procedures
Materials and GeneChip microarray experiments
Nipponbare rice (Oryza sativa L ssp Japonica) was grown in
a greenhouse with a 12 h light cycle at 29 degC during the day
and 21 degC during the night Humidity was maintained at
30 Plants were grown in pots containing 50 Sunshine
mix and 50 nitrohumus Tissues were collected from at
least five plants and pooled for each time point The
samples were homogenized in liquid nitrogen prior to
RNA isolation Immature embryo endosperm aleurone and
seed coat samples were dissected from grains of 88-day-old-
plants For the aleurone layers samples were prepared accord-
ing to a previously described procedure (Fath et al 1999) A
complete sample list and description is listed in Table 2
The experiments were performed as previously described
(Zhu et al 2001) Briefly total RNA was isolated using
Qiagen RNeasy columns (Qiagen Chatsworth CA) and
examined by gel electrophoresis for integrity and by spec-
trometry for purity To ensure data quality only samples with
A260A280 ratios of 19ndash21 were included in the study
Total RNA (5 microg) from each sample was reverse transcribed
at 42 degC for 1 h using 100 pmol of the oligo dT(24) primer
containing a 5prime-T7 RNA polymerase promoter sequence
[5prime-GGCCAGTGAATTGTAATACGACTCACTATAGGGAGGCGG-
(dT)24-3] 50 mM Tris-HCl (pH 83) 75 mM KCl 3 mM MgCl2
10 mM dithiotreitol (DTT) 05 mM dNTPs and 200 units of
SuperScript II reverse transcriptase (Life Technologies) The
second strand of cDNA was synthesized using 40 units
of E coli DNA polymerase I 10 units of E coli DNA ligase
and 2 units of RNase H in a reaction containing 25 mM
Tris-HCl (pH 75) 100 mM KCl 5 mM MgCl2 10 mM (NH4)SO4
015 mM b-NAD+ 1 mM dNTPs and 12 mM DTT The reac-
tion proceeded for 2 h at 16 degC and was terminated using
EDTA Double-stranded cDNA products were purified by
phenolchloroform extraction and ethanol precipitation
Biotinylated complementary RNAs (cRNAs) were tran-
scribed in vitro from synthesized cDNA by T7 RNA Polymerase
(ENZO BioArray High Yield RNA Transcript Labelling Kit Enzo)
cRNAs were purified using affinity resin (Qiagen RNeasy
Spin Columns) and randomly fragmented by incubating
at 94 degC for 35 min in a buffer containing 40 mM Tris-
acetate (pH 81) 100 mM potassium acetate and 30 mM
magnesium acetate to produce molecules of approximately
35ndash200 bases
The labelled samples were mixed with 01 mgmL soni-
cated herring sperm DNA in a hybridization buffer containing
100 mM 2-N-morpholino-ethane-sulphonic acid (MES) 1 M
NaCl 20 mM EDTA 001 Tween 20 denatured at 99 degC for
5 min and equilibrated at 45 degC for 5 min before hybridiza-
tion The hybridization mix was then transferred to the rice
GeneChip microarray cartridge and hybridized at 45 degC for
16 h on a rotisserie at 60 rpm
The hybridized arrays were then rinsed and stained in a
fluidics station (Affymetrix) They were first rinsed with wash
buffer A (6times SSPE (09 M NaCl 006 M NaH2PO4 0006 M
EDTA) 001 Tween 20 0005 Antifoam) at 25 degC for
10 min and incubated with wash buffer B (100 mM MES
01 M NaCl 001 Tween 20) at 50 degC for 20 min then
stained with Streptavidin Phycoerythrin (SAPE) 100 mM MES
1 M NaCl 005 Tween 20 0005 Antifoam 10 mgmL
SAPE 2 mgmL BSA at 25 degC for 10 min washed with wash
buffer A at 25 degC for 20 min and stained with biotinylated
antistreptavidin antibody at 25 degC for 10 min After staining
arrays were stained with SAPE at 25 degC for 10 min and
washed with wash buffer A at 30 degC for 30 min The probe
arrays were scanned twice and the intensities were aver-
aged with an Agilent GeneArray Scanner using GeneChip
Suite 40 (Affymetrix)
Data transformation and cluster analysis
The average intensity of all probe sets of each array was
scaled to 100 so that the hybridization intensity of all arrays
was equivalent Genes encoding products potentially involved
in the transport and synthesis of carbohydrates fatty acids
and storage proteins were selected based on their sequence
homology to known genes Expression levels of the selected
genes were processed before being subjected to cluster
analysis according to the following procedure First any
expression values (average fluorescence signals) that were
less than 5 were adjusted to 5 Then the adjusted expression
values were log2-transformed median centred and normalized
among the selected genes so that the sum of squares for
each expression vector was equal to one in order to better
visualize the change in shape of the profile over time and
space regardless of the magnitude of expression level The
processed data were then used for cluster analysis using
CLUSTER (Eisen et al 1998) with self-organizing maps fol-
lowed by complete linkage hierarchical clustering of both genes
and experiments The results were visualized with TREEVIEW
(Eisen et al 1998)
Data for the putative nutrient partitioning genes (identified
from cluster analysis) that are preferentially expressed during
Tong Zhu et al
copy Blackwell Publishing Ltd Plant Biotechnology Journal (2003) 1 59ndash70
68
grain filling were then imported into GENESPRING (Silicon
Genetics Redwood CA) Genes with similar expression patterns
(ie correlation coefficients greater than 085) as the original
bait genes were further selected and are collectively referred
to as grain filling genes
The confidence of finding 98 grain filling genes was
assessed through bootstrapping the 491 genes 100 times
For each cycle 98 genes were randomly selected from the
491 genes Then Pearson correlation coefficients were
calculated between the average of the 98 randomly selected
genes and that of the 98 grain filling genes and the P-value
was deduced from the 100 Pearson correlation coefficients
using the following equations
Promoter analysis
The promoter sequences of the grain filling genes were iden-
tified by BLAST search of the open reading frame sequences
of these genes against the published predicted rice gene
sequences (Goff et al 2002) The predicted gene sequence
that was the best match with scores greater than 1E-20 was
used to represent the open reading frame The 15 kb regions
upstream from the putative ATG start site were extracted
using a custom Perl script
Analysis of starch biosynthesis pathway
Data series for probe sets were considered for analysis if the
average intensity was above 25 in any sample in the series
(Supplemental Figure 1) The transformed data were then
loaded into GENESPRING (Silicon Genetics Redwood CA) A
pathway for starch biosynthesis and degradation was gener-
ated from several sources (Dennis and Emes 1990 Kruger
1990 Myers et al 2000 Stitt 1990) and was converted to
a GIF file and imported into GeneSpring Expression level
display boxes were drawn on this GIF using the mapping
function in GENESPRING Genes were selected for display at the
appropriate location on this image based on their annotation
(Goff et al 2002) For genes that have a cytoplasmic and a
plastidic isoform the isoforms were differentiated based on
the annotation where possible
Validation of microarray data
Quantitative RT-PCR assays were performed on an ABI Prism
7700 (Applied Biosystems Foster City CA) as previously
described using the primers and probe sets specific to genes
encoding isoform described (Supplemental Figure 2) A
standard curve consisting of serial 1 5 dilutions was
prepared with RNA concentrations of 50 ngmicroL 10 ngmicroL
2 ngmicroL 04 ngmicroL and 008 ngmicroL Relative expression levels
were interpolated by comparison with standard curves with
a correlation coefficient of 099 or greater Relative expres-
sion levels were normalized to the expression level of a rice
polyubiquitin gene in each sample which was expressed at a
constant level All reactions were performed in triplicate
Acknowledgements
We thank T Moughamer and C Martin for rice sequence
selection for the rice GeneChip design We also thank S Goff
and J Glazebrook for a critical reading of this manuscript
Supplementary material
To confirm the conclusions of the paper the supplemental
data can be accessed through the journalrsquos website lthttp
wipblackwellpublishingcomproducts journals suppmatPBI
PBI006PBI006smhtmgt and the authorsrsquo website lthttp
tmriorggene_exp_webgt To get sequence information for
the Sequence IDs (Probe Set IDs) referred in the paper go to
lthttptmriorggene_exp_webrice_probesetshtmlgt and enter
the Sequence ID (eg OS0007591_at OS_ORF006203_at) into
the query template provide
References
Altschul SF Madden TL Schaffer AA Zhang J Zhang ZMiller W and Lipman DJ (1997) Gapped BLAST and PSI-BLASTa new generation of protein database search programs NuclAcids Res 25 3389ndash3402
Awazuhara M Nakagawa A Yamaguchi J Fujiwara T Hayashi HHatae K Chino M and Shimada A (2000) Distribution andcharacterization of enzymes causing starch degradation in rice(Oryza sativa cv koshihikari) J Agric Food Chem 48 245ndash252
Baker SS Wilhelm KS and Thomashow MF (1994) The 5prime-region of Arabidopsis thaliana cor15a has cis-acting elements thatconfer cold- drought- and ABA-regulated gene expression PlantMol Biol 24 701ndash713
Cheong YH Yoo CM Park JM Ryu GR Goekjian VHNagao RT Key JL Cho MJ and Hong JC (1998) STF1 is a novelTGACG-binding factor with a zinc-finger motif and a bZIP domainwhich heterodimerizes with GBF proteins Plant J 15 199ndash209
Dennis DT and Emes MJ (1990) Regulation by compartmenta-tion In Plant Physiology Biochemistry and Molecular Biology(Dennis DT and Turpin DH eds) pp 45ndash55 London UKLongman Scientific and Technical
Efron B and Tibshirani RJ (1994) Random samples and probabilityIn An Introduction to the Bootstrap pp 17ndash28 Boca Raton FLMonographs on Statistics and Applied Probability
tX
SS
S
NXX
=
minus=
micro
Gene regulation in rice grain filling
copy Blackwell Publishing Ltd Plant Biotechnology Journal (2003) 1 59ndash70
69
Eisen MB Spellman PT Brown PO and Botstein D (1998)Cluster analysis and display of genome-wide expression patternsProc Natl Acad Sci USA 95 14863ndash14868
Ellerstrom M Stalberg K Ezcurra I and Rask L (1996) Functionaldissection of a napin gene promoter identification of promoterelements required for embryo and endosperm-specific transcrip-tion Plant Mol Biol 32 1019ndash1027
Eyal Y Curie C and McCormick S (1995) Pollen specificityelements reside in 30 bp of the proximal promoters of twopollen-expressed genes Plant Cell 7 373ndash384
Fath A Bethke PC and Jones RL (1999) Barley aleurone celldeath is not apoptotic characterization of nuclease activities andDNA degradation Plant J 20 305ndash315
Girke T Todd J Ruuska S White J Benning C and Ohlrogge J(2000) Microarray analysis of developing Arabidopsis seeds PlantPhysiol 124 1570ndash1581
Goff SA Ricke D Lan TH Presting G Wang R Dunn MGlazebrook J Sessions A Oeller P Varma H et al (2002) Adraft sequence of the rice genome (Oryza sativa L ssp japonica)Science 296 92ndash100
Hwang YS Karrer EE Thomas BR Chen L and Rodriguez RL(1998) Three cis-elements required for rice α-amylase Amy3Dexpression during sugar starvation Plant Mol Biol 36 331ndash341
Kim SY Chung HJ and Thomas TL (1997) Isolation of a novelclass of bZIP transcription factors that interact with ABA-responsive and embryo-specification elements in the Dc3 pro-moter using a modified yeast one-hybrid system Plant J 111237ndash1251
Kruger M (1990) Carborhydrate Synthesis and Degradation InPlant Physiology Biochemistry and Molecular Biology (Dennis DTand Turpin DH eds) pp 59ndash76 London Longman Scientificand Technical
Lacombe E Van Doorsselaere J Boerjan W Boudet AMand Grima-Pettenati J (2000) Characterization of cis-elementsrequired for vascular expression of the cinnamoyl CoA reductasegene and for proteinndashDNA complex formation Plant J 23663ndash676
Leubner-Metzger G Petruzzelli L Waldvogel R Vogeli-Lange Rand Meins F Jr (1998) Ethylene-responsive element bindingprotein (EREBP) expression and the transcriptional regulation ofclass I β-13-glucanase during tobacco seed germination PlantMol Biol 38 785ndash795
Lipshultz RJ Fodor SP Gingeras TR and Lockhart DJ (1999)High density synthetic oligonucleotide arrays Nat Genet 2120ndash24
Lockhart DJ Dong H Byrne MC Follettie MT Gallo MVChee MS Mittmann M Wang C Kobayashi M Horton Hand Brown EL (1996) Expression monitoring by hybridization tohigh-density oligonucleotide arrays Nat Biotechnol 14 1675ndash1680
Mazur B Krebbers E and Tingey S (1999) Gene discovery andproduct development for grain quality traits Science 285372ndash375
Mena M Vicente-Carbajosa J Schmidt RJ and Carbonero P(1998) An endosperm-specific DOF protein from barley highlyconserved in wheat binds to and activates transcription fromthe prolamin-box of a native B-hordein promoter in barleyendosperm Plant J 16 53ndash62
Morell MK Blennow A Kosar-Hashemi B and Samuel MS(1997) Differential expression and properties of starch branching
enzyme isoforms in developing wheat endosperm Plant Physiol113 201ndash208
Myers AM Morell MK James MG and Ball SG (2000) Recentprogress toward understanding biosynthesis of the amylopectincrystal Plant Physiol 122 989ndash997
Onodera Y Suzuki A Wu CY Washida H and Takaiwa F(2001) A rice functional transcriptional activator RISBZ1 respon-sible for endosperm-specific expression of storage protein genesthrough GCN4 motif J Biol Chem 276 14139ndash14152
Ren B Robert F Wyrick JJ Aparicio O Jennings EG Simon IZeitlinger J Schreiber J Hannett N Kanin E et al (2000)Genome-wide location and function of DNA binding proteinsScience 290 2306ndash2309
Rose A Meier I and Wienand U (1999) The tomato I-box bindingfactor LeMYBI is a member of a novel class of myb-like proteinsPlant J 20 641ndash652
Roth FP Hughes JD Estep PW and Church GM (1998) FindingDNA regulatory motifs within unaligned noncoding sequencesclustered by whole-genome mRNA quantitation Nat Biotechnol16 939ndash945
Rushton PJ and Somssich IE (1998) Transcriptional control ofplant genes responsive to pathogens Curr Opin Plant Biol 1311ndash315
Ruuska SA Girke T Benning C and Ohlrogge JB (2002)Contrapuntal networks of gene expression during Arabidopsisseed filling Plant Cell 14 1191ndash1206
Shannon JC Pien FM Cao H and Liu KC (1998) Brittle-1 anadenylate translocator facilitates transfer of extraplastidialsynthesized ADPndashglucose into amyloplasts of maize endospermsPlant Physiol 117 1235ndash1252
Singh V Okadome H Toyoshima H Isobe S and Ohtsubo K(2000) Thermal and physicochemical properties of rice grain flourand starch J Agric Food Chem 48 2639ndash2647
Stitt M (1990) The flux of carbon between the chloroplast andcytoplasm In Plant Physiology Biochemistry and MolecularBiology (Dennis DT and Turpin DH eds) pp 309ndash326 LondonLongman Scientific and Technical
Umemoto T Nakamura Y and Ishikura N (1995) Activity of starchsynthase and the amylose content in rice endosperm Phytochem-istry 40 1613ndash1616
Vicente-Carbajosa J Moose SP Parsons RL and Schmidt RJ(1997) A maize zinc-finger protein binds the prolamin box in zeingene promoters and interacts with the basic leucine zippertranscriptional activator Opaque2 Proc Natl Acad Sci USA 947685ndash7690
Wang AY Kao MH Yang WH Sayion Y Liu LF Lee PD andSu JC (1999a) Differentially and developmentally regulatedexpression of three rice sucrose synthase genes Plant Cell Physiol40 800ndash807
Wang RL Stec A Hey J Lukens L and Doebley J (1999b) Thelimits of selection during maize domestication Nature 398236ndash239
Washida H Wu CY Suzuki A Yamanouchi U Akihama THarada K and Takaiwa F (1999) Identification of cis-regulatoryelements required for endosperm expression of the rice storageprotein glutelin gene GluB-1 Plant Mol Biol 40 1ndash12
Wu C Washida H Onodera Y Harada K and Takaiwa F (2000)Quantitative nature of the Prolamin-box ACGT and AACA motifsin a rice glutelin gene promoter minimal cis-element requirementsfor endosperm-specific gene expression Plant J 23 415ndash421
Tong Zhu et al
copy Blackwell Publishing Ltd Plant Biotechnology Journal (2003) 1 59ndash70
70
Ye X Al-Babili S Kloti A Zhang J Lucca P Beyer P andPotrykus I (2000) Engineering the provitamin A (beta-carotene)biosynthetic pathway into (carotenoid-free) rice endospermScience 287 303ndash305
Yen SF Su JC and Sung HY (1994) Purification and character-ization of rice sucrose synthase isozymes Biochem Mol Biol Int34 613ndash620
Yu J Hu S Wang J Wong GK Li S Liu B Deng Y
Dai L Zhou Y Zhang X et al (2002) A draft sequence ofthe rice genome (Oryza sativa L ssp indica) Science 296 79ndash92
Zhu T Budworth P Han B Brown D Chang HS Zou G andWang X (2001) Toward elucidating the global gene expressionpatterns of developing Arabidopsis Parallel analysis of 8300genes by high-density oligonucleotide probe array Plant PhysiolBiochem 39 221ndash242

Gene regulation in rice grain filling
copy Blackwell Publishing Ltd
Plant Biotechnology Journal
(2003)
1
59ndash70
61
the 17 grain samples examined (data not shown) The exp-
ression patterns of 100 randomly sampled gene clusters are
significantly different compared to that of the grain filling
genes (
P
lt 00005) While the encoded gene products of
these 269 grain filling genes are active in different pathways
the expression levels of these genes were found to increase
synchronously during grain development (Figure 2A)
Expression pattern and functional classification of the
grain filling genes
The spatial distribution of the transcripts of the nutrient
partitioning genes in developing grains indicated by extrap-
olation of mRNA levels to biological functions that the
endosperm is the main sink for all the nutrients studied espe-
cially carbohydrates and proteins (Figure 2B) However the
expression of genes involved in fatty acid biosynthesis is more
balanced between the embryo and endosperm
The deduced products of the grain filling genes have
diverse functions (Figure 2C) Among the 269 grain filling
genes 42 are involved in starch biosynthesis 28 in lipid
biosynthesis and 33 in seed storage protein synthesis Inter-
estingly 30 genes in this set encode various transporters
such as sugar transporters ABC transporters amino acid
peptide transporters phosphate transporters and nitrate
transporters As expected the largest category consists of
genes with unknown or unclassified functions (Figure 2C)
consistent with the genome annotation in rice (Goff
et al
2002 Yu
et al
2002)
Identification of common
cis
-elements shared by grain
filing genes
To clarify the transcriptional control of the coordinated
processes involved in grain filling and to identify common
regulatory elements the promoter sequences for the 269
genes were extracted according to the following procedure
The probe set sequences were used to B
LASTN
align (Altschul
et al
1997) against the predicted genes (Goff
et al
2002)
Promoter sequences from predicted genes that aligned
(1E-20) with the probe sequences were then extracted using
a custom P
ERL
script Only 103 of the 269 grain filling genes
contain the 15 kb upstream sequences (Supplemental Table 2)
These promoter sequences were analysed by A
LIGN
ACE
(Roth
et al
1998) We could not identify any common novel
cis
-elements that were over-represented in this grain filling
gene cluster This may be due to the higher GC content of the
rice genome (Goff
et al
2002) relative to the genomes of the
organisms that were used to develop the program
We then analysed 16
cis
-elements that appear to play a
role in grain development (Table 2) Comparison of the
percentage of occurrence of each element in the promoters
of genes in the grain gene cluster and in the promoters of all
the genes represented in the microarray revealed that the
AACA element appears to be over-represented in the 103
available promoters of the grain gene cluster
To demonstrate the over-representation of the AACA
element we performed a bootstrap analysis (Efron and
Tibshirani 1994) One thousand control promoter sets each
of which contains 103 promoters from genes that were
randomly selected from the rice genome microarray were
generated In parallel the grain filling gene cluster was
randomly sampled to generate 1000 sets of 103-grain gene
promoters The ratio of the total number of occurrences of
the AACA element in each grain gene promoter set to that
Tab e 1 Rice samp es inc uded in the study
Description Days after germination
Root germinating seedling stage 5
Leaf germinating seedling stage 5
Arial 3ndash4 leaf stage 18
Root tillering stage 49
Leaf tillering stage 49
Arial tillering stage 49
Panicle booting stage 1ndash3 cm 60
Panicle booting stage 4ndash7 cm 62
Panicle booting stage 8ndash14 cm 64
Panicle booting stage 15ndash20 cm 66
Root booting stage 60
Leaf booting stage 60
Arial booting stage 60
Root panicle emergence 78
Stem panicle emergence 78
Panicle panicle emergence 78
Inflorescence no grains 88
Stem maturation 90
Root maturation 90
Leaf maturation 90
Stem senescence 100
Leaf senescence 100
Grain day 0 post-anthesis 79
Grain day 2 post-anthesis 81
Grain day 4 post-anthesis 83
Grain day 7 post-anthesis 86
Grain day 9 post-anthesis 88
Grain soft dough (asymp 14 days post-anthesis) 93
Grain hard dough (asymp 21 days post-anthesis) 100
Embryo 88
Endosperm 88
Seed coat 88
Aleurone 88
Tong Zhu
et al
copy Blackwell Publishing Ltd
Plant Biotechnology Journal
(2003)
1
59ndash70
62
in a corresponding control promoter set was computed A
ratio greater than one indicated that the element occurred
more often in grain promoters than in control promoters A
histogram was generated to visualize the ratio of distribution
for the AACA element in each pair of promoter sets (grain
filling gene set vs control gene set) As shown in Figure 3A
the ratio for the AACA element in each pair of 1000 pro-
moter sets ranged from 0833 to 221 and 977 promoter
sets had a ratio greater than 1 Thus at a 95 confidence
level (
P
-value 0046) the AACA element is over-represented
among the promoters from the grain filling gene cluster For
comparison we applied the same bootstrap analysis to the
ASF1-like element As shown in Figure 3B the ratio for the
ASF1-like element in 1000 promoter sets ranged from 046
to 213 and 568 promoter sets had a ratio which was less than
or equal to 1 It is therefore clear that the ASF1-like element is
not statistically over-represented in the grain gene promoters
The AACA element is conserved among the promoters of
many genes encoding seed storage proteins and is required
for full expression of the rice
GluB-1
gene (Wu
et al
2000)
Among the 103 genes in the grain gene cluster 63 contain
1ndash7 copies of the AACA element per promoter Interestingly
proteins encoded by these predicted genes appear to have
diverse cellular functions including carbohydrate and fatty
acid metabolism nutrient transport transcription and
translation Genes encoding storage proteins were also
found This extends previous findings (Wu
et al
2000)
and suggests that the AACA element could play a key
role in coordinating various major pathways during grain
development
Identification of transcription factors involved in grain
filling
Although transcription factors that bind to the AACA
element have not yet been identified this element is similar
to the type II MYB consensus sequence AMCWAMC which
is required for the expression of several genes such as the
parsley
PAL1
gene (Rushton and Somssich 1998) This sug-
gests that MYB proteins may also be involved in controlling
the expression of grain filling genes
To examine the involvement of transcription factors in
the transcriptional control of grain filling we analysed the
expression patterns for 563 known and putative transcription
Figure 1 Schematic diagram of the data mining process used in this study Grain filling genes were selected based on homology to known function genes and their expression in 33 samples was determined during rice development
Gene regulation in rice grain filling
copy Blackwell Publishing Ltd
Plant Biotechnology Journal
(2003)
1
59ndash70
63
factor genes during grain filling Cluster analysis identified a
group of transcription factor genes with expression patterns
similar to that of the 269 grain filling genes This cluster
includes genes such as
RITA
a bZIP type transcription factor
gene that is highly expressed in aleurone and endosperm
tissues and may be important in regulating gene expression
in developing rice grains (Onodera
et al
2001) Other genes
included in this cluster are
Dof
genes whose gene products
can activate the expression of seed storage protein genes
by binding to the prolamine-box (Vicente-Carbajosa
et al
1997) and nine known and putative
MYB
genes (Figure 4)
The correlation between the gene expression patterns of these
transcription factors and their previously identified functions
suggests their involvement during rice grain filling To confirm
their functions
in vivo
DNA binding assays are being per-
formed for genes encoding selected transcription factors
using a strategy that has been successful in yeast (Ren
et al
2000)
Isoforms as mechanisms for intra-pathway regulation
To examine the potential participation and regulation of genes
encoding different isoforms in the grain-filling process the
mRNA dynamics of 87 genes on the rice genome array involved
Table 2 cis-element table with references
Cis-element Sequence Reference
Cold CCGAC (Baker et al 1994)
G-box CACGTG (Hwang et al 1998)
AACA motif AACAAAA (Wu et al 2000)
GCN4 TGA(GC)TCA (Onodera et al 2001)
C-box TGACGTCA (Cheong et al 1998)
GCC-box TAARAGCCGCC (Leubner-Metzger et al 1998)
Amylase TATCCAY (Hwang et al 1998)
GARE RTAACRRANTCYGG (Hwang et al 1998)
GT1 box GGTTAA (Eyal et al 1995)
In amylase CGACG (Hwang et al 1998)
BS1 AGCGGG (Lacombe et al 2000)
DPBF-1 ACACNNG (Kim et al 1997)
ASF1 like TGACGT (Washida et al 1999)
E-box CANNTG (Ellerstrom et al 1996)
Prolamin-box TGYAAAG (Mena et al 1998)
I-box (core) GATAAG (Rose et al 1999)
Figure 2 Overview of relative mRNA expression during rice grain filling (A) Representation of expression profiles for 269 grain filling genes The x-axis shows the developmental stages and the y-axis shows the relative expression level E indicates the panicle at emergence S is the soft dough stage (asymp 14 days post-anthesis) and H is the hard dough stage (asymp 21 days post-anthesis) The expression levels for genes whose gene products belong to different classes including fatty acid (FA) and carbohydrate (CH) biosynthesis storage proteins and transporters and for the 269 genes were averaged based on the normalized expression level for each gene belonging to that class or in the 269-gene group (plusmn standard
deviation SD) (B) Bar graph representation of the average expression level (
plusmn
SD) for the 269 genes in various grain organs at 9 days post-anthesis Each organ type is indicated on the
x
-axis and the relative expression level is shown on the
y
-axis (C)
Pie chart representation of the functional classification of the predicted gene products of the 269 genes found to be involved in grain development The percentage for each functional category is shown
Tong Zhu
et al
copy Blackwell Publishing Ltd
Plant Biotechnology Journal
(2003)
1
59ndash70
64
in carbohydrate metabolism were studied (Supplemental
Table 3)
We found that 82 of the enzymes in the carbohydrate
metabolic pathway may be represented by isoforms as
determined by sequence analysis of the multiple probe
sets on the microarray (Figure 5) Due to the gene prediction
methods used to generate the probe sets on the GeneChip
we cannot exclude the possibility that two probe sets may
query the same mRNA However the expression profile of
every probe set shown here has unique and distinct features
in terms of spatial and temporal distribution and their
promoter sequences strongly suggesting that mRNAs for
different isoforms are in fact being queried
Two genes encoding the small subunits of ADPG pyrophos-
phorylase are expressed early in grain development in con-
junction with a single gene encoding a large subunit (Figure 5
Supplemental Table 3) Genes encoding three other large
subunits are up-regulated later in development from 4 days
after anthesis in conjunction with the up-regulation of
the starch synthase genes and two genes for branching
enzymes (involved in amylose and amylopectin biosynthesis
respectively) The expression of an additional gene encoding
the small subunit also increases over this time period The
expression of genes encoding different isoforms may be
related to the shift to storage starch production and to a
postulated concomitant shift to cytoplasmic ADP-glucose
production Interestingly two genes encoding other isoforms
of the branching enzyme are expressed early during grain
development and are then expressed less during maturation
These isoforms may be involved in transitory starch synthesis
for energy purposes during early stages (these isoforms are
also expressed in leaves) Two other isoforms are expressed
at higher levels throughout development with the highest
expression occurring around 7ndash9 days post-anthesis Similar
results were obtained for branching enzyme genes in
wheat kernels (Morell
et al
1997)
Figure 4 Expression patterns of nine putative MYB transcription factor genes showing preferential expression during grain filling BSP booting-stage panicle DPA days post-anthesis
Figure 3 Histogram of the ratio of occurrence of the AACA motif and the ASF1-like element in the grain gene cluster vs control gene cluster The histogram was generated as described in the text and is depicted for the AACA motif (A) and the ASF1-like element (B) The x-axis shows the ratio computed by dividing the total number of occurrences of either the AACA motif or the ASF1-like element in a given bootstrapped set of grain cluster genes by that in a corresponding control gene cluster The green line indicates a ratio of 1 The y-axis shows the frequency of a given ratio for each element
Gene regulation in rice grain filling
copy Blackwell Publishing Ltd Plant Biotechnology Journal (2003) 1 59ndash70
65
Figure 5 Pathway of starch biosynthesis in rice with corresponding spatio-temporal gene expression levels Dotted arrows indicate a transport process Dashed arrows indicate that intermediate steps have been omitted Key for panels (A) and (B) 0 2 4 7 9 are days post-anthesis S is soft dough stage H is hard dough stage (approximately 14 and 21 days post-anthesis respectively) ( embryo s endosperm e seed coat and aleurone at 9 days post-anthesis Panel (A) represents absolute expression levels Units are lsquoaverage intensityrsquo (Supplemental Figure 1) Panel (B) represents relative expression levels lsquoEarlyrsquo and lsquolatersquo indicate genes falling into different clusters after cluster analysis Genes that are up-regulated in embryo and endosperm are indicated by the dark grey and light grey markings respectively See text for a description of how the genes were selected
Tong Zhu et al
copy Blackwell Publishing Ltd Plant Biotechnology Journal (2003) 1 59ndash70
66
We also observed distinct spatial expression patterns for
genes encoding different isoforms (Figure 5) For example
we observed that three different sucrose synthase isoforms
are preferentially expressed in developing grain tissues two
of them are expressed more highly at the start of grain
development (0 days post-anthesis) and one is up-regulated
towards the end of grain development Other isoforms with
low expression in grains are expressed strongly in stems or
roots Among the sucrose synthase isoforms that are
preferentially expressed in grains at least three isoforms with
spatially distinct expression patterns have been reported one
in aleurone another in endosperm and a third in grain
tissues other than the endosperm (Wang et al 1999a Yen
et al 1994) Different amylases and glucosidases were also
found to be expressed in different rice grain tissues (Figure 5)
as previously reported (Awazuhara et al 2000)
The expression of the two genes encoding sucrose
synthase isoforms and one gene encoding small subunits
of ADPG pyrophosphorylase isoforms among the 10 grain
samples was examined by quantitative RT-PCR A high
correlation between the results from rice GeneChip microar-
ray and from quantitative RT-PCR was observed with an
average correlation coefficient of 092 (Supplemental
Figure 2) thus validating the specificity of the probe sets and
our observations based on the microarray results
By examining gene expression in the carbohydrate
metabolic pathway we not only confirmed the presence of
different genes encoding isoforms of the same enzyme in this
pathway during grain development (Awazuhara et al 2000
Wang et al 1999b) but also demonstrated both gene
redundancy and coordinated expression of gene families
The differential expression of various isoforms in this pathway
suggests their functional differences and gives an insight
into how structural gene expression patterns determine the
process of grain filling It suggests that transcription
control is a primary mechanism for determining endosperm
development
Mechanistic shifts suggested by transporter
transcript levels
A cluster analysis of the relative expression levels indicates
that genes encoding carbohydrate metabolic enzymes
can be broadly grouped into two phases early and late grain
development (Figure 5) Often a different gene encodes an
enzyme in each phase One isoform of a triose-phosphate
phosphate translocator is expressed at a higher level during
earlier stages of grain development In contrast two isoforms
of a hexose-phosphate translocator and another isoform of a
triose-phosphate translocator are expressed at higher levels
toward the end of grain filling
To characterize the transcription control of the genes
expressed in early and late phases we searched for common
regulatory cis-elements among the available promoters of these
genes No statistically significant elements were identified
among the promoters of the late gene cluster However a
few elements were identified from the 18 promoters of
31 genes belonging to the early gene cluster (data not shown)
Although we cannot confirm the significance of the presence
of these regulatory elements by bootstrap analysis due to
the small number of available promoters multiple classes
of grain-filling promoters may be involved in fine tuning
the process by differentially regulating the expression of
the subgene groups
Our observations also suggest that different mechanisms
for the synthesis and transport of hexose equivalents occur at
different stages during grain development PEP appears to
play a more important role during early stages of grain devel-
opment because genes encoding two isoforms of a PEP-Pi
translocator are relatively highly expressed at this stage We
still do not know if the majority of hexose equivalents are
transported to the amyloplast during the linear phase of
starch accumulation as ADP-glucose as occurs in maize
endosperm development (Shannon et al 1998) However
the expression of a Brittle homologue does indeed increase
almost twofold during seed development (data not shown)
Conclusions
Our results are consistent with the idea that rice grain filling
is a highly coordinated process The synthesis and transport
of carbohydrates storage proteins and fatty acids are co-
regulated starting at the mRNA level These co-regulated
genes contain an over-represented element the AACA motif
in their promoters We hypothesize that this element along
with other unidentified elements may interact with certain key
transcription factors including those identified in this study
to regulate and coordinate the transcription of nutrient par-
titioning genes during grain filling Within each pathway
the expression levels of genes encoding different isoforms
of enzymes are spatially and temporally defined as shown
with the carbohydrate metabolic pathway demonstrating
an additional fine regulation of gene expression at the
intra-pathway level
The rice genome array used in this study along with the
complete genome information provides a powerful tool for
studying and understanding gene function not only in this
important crop but in other cereal species as well since rice
Gene regulation in rice grain filling
copy Blackwell Publishing Ltd Plant Biotechnology Journal (2003) 1 59ndash70
67
shows great synteny and high sequence similarity with other
cereal genomes (Goff et al 2002)
Experimental procedures
Materials and GeneChip microarray experiments
Nipponbare rice (Oryza sativa L ssp Japonica) was grown in
a greenhouse with a 12 h light cycle at 29 degC during the day
and 21 degC during the night Humidity was maintained at
30 Plants were grown in pots containing 50 Sunshine
mix and 50 nitrohumus Tissues were collected from at
least five plants and pooled for each time point The
samples were homogenized in liquid nitrogen prior to
RNA isolation Immature embryo endosperm aleurone and
seed coat samples were dissected from grains of 88-day-old-
plants For the aleurone layers samples were prepared accord-
ing to a previously described procedure (Fath et al 1999) A
complete sample list and description is listed in Table 2
The experiments were performed as previously described
(Zhu et al 2001) Briefly total RNA was isolated using
Qiagen RNeasy columns (Qiagen Chatsworth CA) and
examined by gel electrophoresis for integrity and by spec-
trometry for purity To ensure data quality only samples with
A260A280 ratios of 19ndash21 were included in the study
Total RNA (5 microg) from each sample was reverse transcribed
at 42 degC for 1 h using 100 pmol of the oligo dT(24) primer
containing a 5prime-T7 RNA polymerase promoter sequence
[5prime-GGCCAGTGAATTGTAATACGACTCACTATAGGGAGGCGG-
(dT)24-3] 50 mM Tris-HCl (pH 83) 75 mM KCl 3 mM MgCl2
10 mM dithiotreitol (DTT) 05 mM dNTPs and 200 units of
SuperScript II reverse transcriptase (Life Technologies) The
second strand of cDNA was synthesized using 40 units
of E coli DNA polymerase I 10 units of E coli DNA ligase
and 2 units of RNase H in a reaction containing 25 mM
Tris-HCl (pH 75) 100 mM KCl 5 mM MgCl2 10 mM (NH4)SO4
015 mM b-NAD+ 1 mM dNTPs and 12 mM DTT The reac-
tion proceeded for 2 h at 16 degC and was terminated using
EDTA Double-stranded cDNA products were purified by
phenolchloroform extraction and ethanol precipitation
Biotinylated complementary RNAs (cRNAs) were tran-
scribed in vitro from synthesized cDNA by T7 RNA Polymerase
(ENZO BioArray High Yield RNA Transcript Labelling Kit Enzo)
cRNAs were purified using affinity resin (Qiagen RNeasy
Spin Columns) and randomly fragmented by incubating
at 94 degC for 35 min in a buffer containing 40 mM Tris-
acetate (pH 81) 100 mM potassium acetate and 30 mM
magnesium acetate to produce molecules of approximately
35ndash200 bases
The labelled samples were mixed with 01 mgmL soni-
cated herring sperm DNA in a hybridization buffer containing
100 mM 2-N-morpholino-ethane-sulphonic acid (MES) 1 M
NaCl 20 mM EDTA 001 Tween 20 denatured at 99 degC for
5 min and equilibrated at 45 degC for 5 min before hybridiza-
tion The hybridization mix was then transferred to the rice
GeneChip microarray cartridge and hybridized at 45 degC for
16 h on a rotisserie at 60 rpm
The hybridized arrays were then rinsed and stained in a
fluidics station (Affymetrix) They were first rinsed with wash
buffer A (6times SSPE (09 M NaCl 006 M NaH2PO4 0006 M
EDTA) 001 Tween 20 0005 Antifoam) at 25 degC for
10 min and incubated with wash buffer B (100 mM MES
01 M NaCl 001 Tween 20) at 50 degC for 20 min then
stained with Streptavidin Phycoerythrin (SAPE) 100 mM MES
1 M NaCl 005 Tween 20 0005 Antifoam 10 mgmL
SAPE 2 mgmL BSA at 25 degC for 10 min washed with wash
buffer A at 25 degC for 20 min and stained with biotinylated
antistreptavidin antibody at 25 degC for 10 min After staining
arrays were stained with SAPE at 25 degC for 10 min and
washed with wash buffer A at 30 degC for 30 min The probe
arrays were scanned twice and the intensities were aver-
aged with an Agilent GeneArray Scanner using GeneChip
Suite 40 (Affymetrix)
Data transformation and cluster analysis
The average intensity of all probe sets of each array was
scaled to 100 so that the hybridization intensity of all arrays
was equivalent Genes encoding products potentially involved
in the transport and synthesis of carbohydrates fatty acids
and storage proteins were selected based on their sequence
homology to known genes Expression levels of the selected
genes were processed before being subjected to cluster
analysis according to the following procedure First any
expression values (average fluorescence signals) that were
less than 5 were adjusted to 5 Then the adjusted expression
values were log2-transformed median centred and normalized
among the selected genes so that the sum of squares for
each expression vector was equal to one in order to better
visualize the change in shape of the profile over time and
space regardless of the magnitude of expression level The
processed data were then used for cluster analysis using
CLUSTER (Eisen et al 1998) with self-organizing maps fol-
lowed by complete linkage hierarchical clustering of both genes
and experiments The results were visualized with TREEVIEW
(Eisen et al 1998)
Data for the putative nutrient partitioning genes (identified
from cluster analysis) that are preferentially expressed during
Tong Zhu et al
copy Blackwell Publishing Ltd Plant Biotechnology Journal (2003) 1 59ndash70
68
grain filling were then imported into GENESPRING (Silicon
Genetics Redwood CA) Genes with similar expression patterns
(ie correlation coefficients greater than 085) as the original
bait genes were further selected and are collectively referred
to as grain filling genes
The confidence of finding 98 grain filling genes was
assessed through bootstrapping the 491 genes 100 times
For each cycle 98 genes were randomly selected from the
491 genes Then Pearson correlation coefficients were
calculated between the average of the 98 randomly selected
genes and that of the 98 grain filling genes and the P-value
was deduced from the 100 Pearson correlation coefficients
using the following equations
Promoter analysis
The promoter sequences of the grain filling genes were iden-
tified by BLAST search of the open reading frame sequences
of these genes against the published predicted rice gene
sequences (Goff et al 2002) The predicted gene sequence
that was the best match with scores greater than 1E-20 was
used to represent the open reading frame The 15 kb regions
upstream from the putative ATG start site were extracted
using a custom Perl script
Analysis of starch biosynthesis pathway
Data series for probe sets were considered for analysis if the
average intensity was above 25 in any sample in the series
(Supplemental Figure 1) The transformed data were then
loaded into GENESPRING (Silicon Genetics Redwood CA) A
pathway for starch biosynthesis and degradation was gener-
ated from several sources (Dennis and Emes 1990 Kruger
1990 Myers et al 2000 Stitt 1990) and was converted to
a GIF file and imported into GeneSpring Expression level
display boxes were drawn on this GIF using the mapping
function in GENESPRING Genes were selected for display at the
appropriate location on this image based on their annotation
(Goff et al 2002) For genes that have a cytoplasmic and a
plastidic isoform the isoforms were differentiated based on
the annotation where possible
Validation of microarray data
Quantitative RT-PCR assays were performed on an ABI Prism
7700 (Applied Biosystems Foster City CA) as previously
described using the primers and probe sets specific to genes
encoding isoform described (Supplemental Figure 2) A
standard curve consisting of serial 1 5 dilutions was
prepared with RNA concentrations of 50 ngmicroL 10 ngmicroL
2 ngmicroL 04 ngmicroL and 008 ngmicroL Relative expression levels
were interpolated by comparison with standard curves with
a correlation coefficient of 099 or greater Relative expres-
sion levels were normalized to the expression level of a rice
polyubiquitin gene in each sample which was expressed at a
constant level All reactions were performed in triplicate
Acknowledgements
We thank T Moughamer and C Martin for rice sequence
selection for the rice GeneChip design We also thank S Goff
and J Glazebrook for a critical reading of this manuscript
Supplementary material
To confirm the conclusions of the paper the supplemental
data can be accessed through the journalrsquos website lthttp
wipblackwellpublishingcomproducts journals suppmatPBI
PBI006PBI006smhtmgt and the authorsrsquo website lthttp
tmriorggene_exp_webgt To get sequence information for
the Sequence IDs (Probe Set IDs) referred in the paper go to
lthttptmriorggene_exp_webrice_probesetshtmlgt and enter
the Sequence ID (eg OS0007591_at OS_ORF006203_at) into
the query template provide
References
Altschul SF Madden TL Schaffer AA Zhang J Zhang ZMiller W and Lipman DJ (1997) Gapped BLAST and PSI-BLASTa new generation of protein database search programs NuclAcids Res 25 3389ndash3402
Awazuhara M Nakagawa A Yamaguchi J Fujiwara T Hayashi HHatae K Chino M and Shimada A (2000) Distribution andcharacterization of enzymes causing starch degradation in rice(Oryza sativa cv koshihikari) J Agric Food Chem 48 245ndash252
Baker SS Wilhelm KS and Thomashow MF (1994) The 5prime-region of Arabidopsis thaliana cor15a has cis-acting elements thatconfer cold- drought- and ABA-regulated gene expression PlantMol Biol 24 701ndash713
Cheong YH Yoo CM Park JM Ryu GR Goekjian VHNagao RT Key JL Cho MJ and Hong JC (1998) STF1 is a novelTGACG-binding factor with a zinc-finger motif and a bZIP domainwhich heterodimerizes with GBF proteins Plant J 15 199ndash209
Dennis DT and Emes MJ (1990) Regulation by compartmenta-tion In Plant Physiology Biochemistry and Molecular Biology(Dennis DT and Turpin DH eds) pp 45ndash55 London UKLongman Scientific and Technical
Efron B and Tibshirani RJ (1994) Random samples and probabilityIn An Introduction to the Bootstrap pp 17ndash28 Boca Raton FLMonographs on Statistics and Applied Probability
tX
SS
S
NXX
=
minus=
micro
Gene regulation in rice grain filling
copy Blackwell Publishing Ltd Plant Biotechnology Journal (2003) 1 59ndash70
69
Eisen MB Spellman PT Brown PO and Botstein D (1998)Cluster analysis and display of genome-wide expression patternsProc Natl Acad Sci USA 95 14863ndash14868
Ellerstrom M Stalberg K Ezcurra I and Rask L (1996) Functionaldissection of a napin gene promoter identification of promoterelements required for embryo and endosperm-specific transcrip-tion Plant Mol Biol 32 1019ndash1027
Eyal Y Curie C and McCormick S (1995) Pollen specificityelements reside in 30 bp of the proximal promoters of twopollen-expressed genes Plant Cell 7 373ndash384
Fath A Bethke PC and Jones RL (1999) Barley aleurone celldeath is not apoptotic characterization of nuclease activities andDNA degradation Plant J 20 305ndash315
Girke T Todd J Ruuska S White J Benning C and Ohlrogge J(2000) Microarray analysis of developing Arabidopsis seeds PlantPhysiol 124 1570ndash1581
Goff SA Ricke D Lan TH Presting G Wang R Dunn MGlazebrook J Sessions A Oeller P Varma H et al (2002) Adraft sequence of the rice genome (Oryza sativa L ssp japonica)Science 296 92ndash100
Hwang YS Karrer EE Thomas BR Chen L and Rodriguez RL(1998) Three cis-elements required for rice α-amylase Amy3Dexpression during sugar starvation Plant Mol Biol 36 331ndash341
Kim SY Chung HJ and Thomas TL (1997) Isolation of a novelclass of bZIP transcription factors that interact with ABA-responsive and embryo-specification elements in the Dc3 pro-moter using a modified yeast one-hybrid system Plant J 111237ndash1251
Kruger M (1990) Carborhydrate Synthesis and Degradation InPlant Physiology Biochemistry and Molecular Biology (Dennis DTand Turpin DH eds) pp 59ndash76 London Longman Scientificand Technical
Lacombe E Van Doorsselaere J Boerjan W Boudet AMand Grima-Pettenati J (2000) Characterization of cis-elementsrequired for vascular expression of the cinnamoyl CoA reductasegene and for proteinndashDNA complex formation Plant J 23663ndash676
Leubner-Metzger G Petruzzelli L Waldvogel R Vogeli-Lange Rand Meins F Jr (1998) Ethylene-responsive element bindingprotein (EREBP) expression and the transcriptional regulation ofclass I β-13-glucanase during tobacco seed germination PlantMol Biol 38 785ndash795
Lipshultz RJ Fodor SP Gingeras TR and Lockhart DJ (1999)High density synthetic oligonucleotide arrays Nat Genet 2120ndash24
Lockhart DJ Dong H Byrne MC Follettie MT Gallo MVChee MS Mittmann M Wang C Kobayashi M Horton Hand Brown EL (1996) Expression monitoring by hybridization tohigh-density oligonucleotide arrays Nat Biotechnol 14 1675ndash1680
Mazur B Krebbers E and Tingey S (1999) Gene discovery andproduct development for grain quality traits Science 285372ndash375
Mena M Vicente-Carbajosa J Schmidt RJ and Carbonero P(1998) An endosperm-specific DOF protein from barley highlyconserved in wheat binds to and activates transcription fromthe prolamin-box of a native B-hordein promoter in barleyendosperm Plant J 16 53ndash62
Morell MK Blennow A Kosar-Hashemi B and Samuel MS(1997) Differential expression and properties of starch branching
enzyme isoforms in developing wheat endosperm Plant Physiol113 201ndash208
Myers AM Morell MK James MG and Ball SG (2000) Recentprogress toward understanding biosynthesis of the amylopectincrystal Plant Physiol 122 989ndash997
Onodera Y Suzuki A Wu CY Washida H and Takaiwa F(2001) A rice functional transcriptional activator RISBZ1 respon-sible for endosperm-specific expression of storage protein genesthrough GCN4 motif J Biol Chem 276 14139ndash14152
Ren B Robert F Wyrick JJ Aparicio O Jennings EG Simon IZeitlinger J Schreiber J Hannett N Kanin E et al (2000)Genome-wide location and function of DNA binding proteinsScience 290 2306ndash2309
Rose A Meier I and Wienand U (1999) The tomato I-box bindingfactor LeMYBI is a member of a novel class of myb-like proteinsPlant J 20 641ndash652
Roth FP Hughes JD Estep PW and Church GM (1998) FindingDNA regulatory motifs within unaligned noncoding sequencesclustered by whole-genome mRNA quantitation Nat Biotechnol16 939ndash945
Rushton PJ and Somssich IE (1998) Transcriptional control ofplant genes responsive to pathogens Curr Opin Plant Biol 1311ndash315
Ruuska SA Girke T Benning C and Ohlrogge JB (2002)Contrapuntal networks of gene expression during Arabidopsisseed filling Plant Cell 14 1191ndash1206
Shannon JC Pien FM Cao H and Liu KC (1998) Brittle-1 anadenylate translocator facilitates transfer of extraplastidialsynthesized ADPndashglucose into amyloplasts of maize endospermsPlant Physiol 117 1235ndash1252
Singh V Okadome H Toyoshima H Isobe S and Ohtsubo K(2000) Thermal and physicochemical properties of rice grain flourand starch J Agric Food Chem 48 2639ndash2647
Stitt M (1990) The flux of carbon between the chloroplast andcytoplasm In Plant Physiology Biochemistry and MolecularBiology (Dennis DT and Turpin DH eds) pp 309ndash326 LondonLongman Scientific and Technical
Umemoto T Nakamura Y and Ishikura N (1995) Activity of starchsynthase and the amylose content in rice endosperm Phytochem-istry 40 1613ndash1616
Vicente-Carbajosa J Moose SP Parsons RL and Schmidt RJ(1997) A maize zinc-finger protein binds the prolamin box in zeingene promoters and interacts with the basic leucine zippertranscriptional activator Opaque2 Proc Natl Acad Sci USA 947685ndash7690
Wang AY Kao MH Yang WH Sayion Y Liu LF Lee PD andSu JC (1999a) Differentially and developmentally regulatedexpression of three rice sucrose synthase genes Plant Cell Physiol40 800ndash807
Wang RL Stec A Hey J Lukens L and Doebley J (1999b) Thelimits of selection during maize domestication Nature 398236ndash239
Washida H Wu CY Suzuki A Yamanouchi U Akihama THarada K and Takaiwa F (1999) Identification of cis-regulatoryelements required for endosperm expression of the rice storageprotein glutelin gene GluB-1 Plant Mol Biol 40 1ndash12
Wu C Washida H Onodera Y Harada K and Takaiwa F (2000)Quantitative nature of the Prolamin-box ACGT and AACA motifsin a rice glutelin gene promoter minimal cis-element requirementsfor endosperm-specific gene expression Plant J 23 415ndash421
Tong Zhu et al
copy Blackwell Publishing Ltd Plant Biotechnology Journal (2003) 1 59ndash70
70
Ye X Al-Babili S Kloti A Zhang J Lucca P Beyer P andPotrykus I (2000) Engineering the provitamin A (beta-carotene)biosynthetic pathway into (carotenoid-free) rice endospermScience 287 303ndash305
Yen SF Su JC and Sung HY (1994) Purification and character-ization of rice sucrose synthase isozymes Biochem Mol Biol Int34 613ndash620
Yu J Hu S Wang J Wong GK Li S Liu B Deng Y
Dai L Zhou Y Zhang X et al (2002) A draft sequence ofthe rice genome (Oryza sativa L ssp indica) Science 296 79ndash92
Zhu T Budworth P Han B Brown D Chang HS Zou G andWang X (2001) Toward elucidating the global gene expressionpatterns of developing Arabidopsis Parallel analysis of 8300genes by high-density oligonucleotide probe array Plant PhysiolBiochem 39 221ndash242
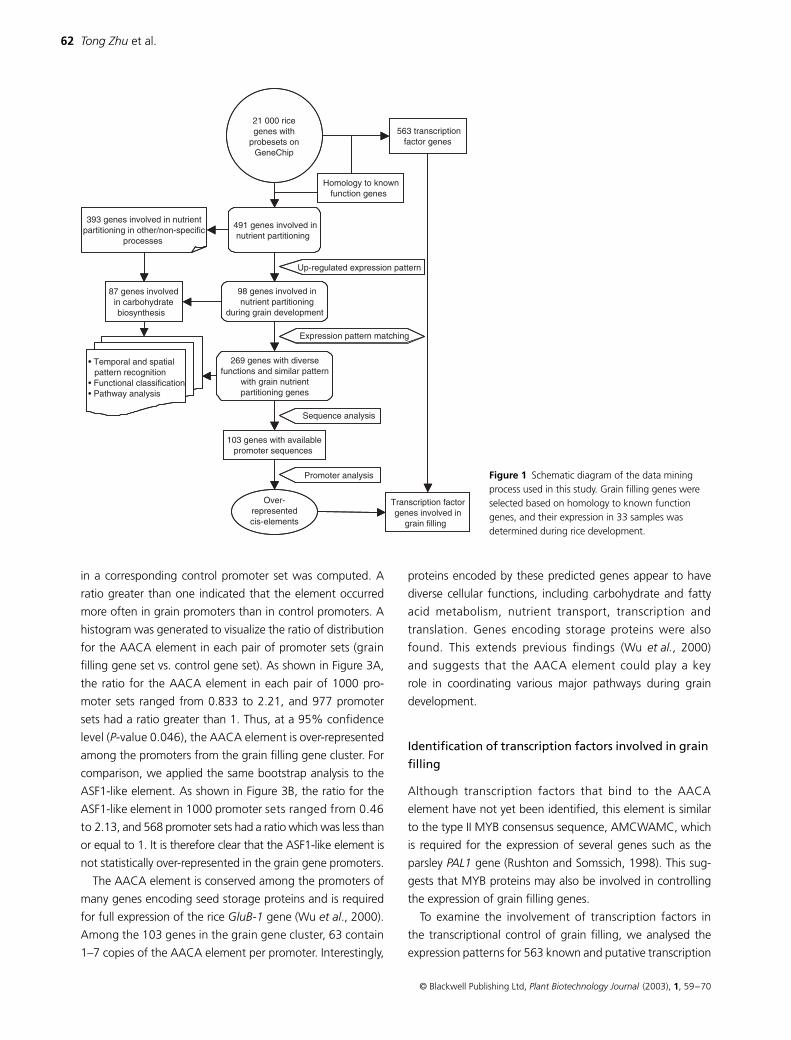
Tong Zhu
et al
copy Blackwell Publishing Ltd
Plant Biotechnology Journal
(2003)
1
59ndash70
62
in a corresponding control promoter set was computed A
ratio greater than one indicated that the element occurred
more often in grain promoters than in control promoters A
histogram was generated to visualize the ratio of distribution
for the AACA element in each pair of promoter sets (grain
filling gene set vs control gene set) As shown in Figure 3A
the ratio for the AACA element in each pair of 1000 pro-
moter sets ranged from 0833 to 221 and 977 promoter
sets had a ratio greater than 1 Thus at a 95 confidence
level (
P
-value 0046) the AACA element is over-represented
among the promoters from the grain filling gene cluster For
comparison we applied the same bootstrap analysis to the
ASF1-like element As shown in Figure 3B the ratio for the
ASF1-like element in 1000 promoter sets ranged from 046
to 213 and 568 promoter sets had a ratio which was less than
or equal to 1 It is therefore clear that the ASF1-like element is
not statistically over-represented in the grain gene promoters
The AACA element is conserved among the promoters of
many genes encoding seed storage proteins and is required
for full expression of the rice
GluB-1
gene (Wu
et al
2000)
Among the 103 genes in the grain gene cluster 63 contain
1ndash7 copies of the AACA element per promoter Interestingly
proteins encoded by these predicted genes appear to have
diverse cellular functions including carbohydrate and fatty
acid metabolism nutrient transport transcription and
translation Genes encoding storage proteins were also
found This extends previous findings (Wu
et al
2000)
and suggests that the AACA element could play a key
role in coordinating various major pathways during grain
development
Identification of transcription factors involved in grain
filling
Although transcription factors that bind to the AACA
element have not yet been identified this element is similar
to the type II MYB consensus sequence AMCWAMC which
is required for the expression of several genes such as the
parsley
PAL1
gene (Rushton and Somssich 1998) This sug-
gests that MYB proteins may also be involved in controlling
the expression of grain filling genes
To examine the involvement of transcription factors in
the transcriptional control of grain filling we analysed the
expression patterns for 563 known and putative transcription
Figure 1 Schematic diagram of the data mining process used in this study Grain filling genes were selected based on homology to known function genes and their expression in 33 samples was determined during rice development
Gene regulation in rice grain filling
copy Blackwell Publishing Ltd
Plant Biotechnology Journal
(2003)
1
59ndash70
63
factor genes during grain filling Cluster analysis identified a
group of transcription factor genes with expression patterns
similar to that of the 269 grain filling genes This cluster
includes genes such as
RITA
a bZIP type transcription factor
gene that is highly expressed in aleurone and endosperm
tissues and may be important in regulating gene expression
in developing rice grains (Onodera
et al
2001) Other genes
included in this cluster are
Dof
genes whose gene products
can activate the expression of seed storage protein genes
by binding to the prolamine-box (Vicente-Carbajosa
et al
1997) and nine known and putative
MYB
genes (Figure 4)
The correlation between the gene expression patterns of these
transcription factors and their previously identified functions
suggests their involvement during rice grain filling To confirm
their functions
in vivo
DNA binding assays are being per-
formed for genes encoding selected transcription factors
using a strategy that has been successful in yeast (Ren
et al
2000)
Isoforms as mechanisms for intra-pathway regulation
To examine the potential participation and regulation of genes
encoding different isoforms in the grain-filling process the
mRNA dynamics of 87 genes on the rice genome array involved
Table 2 cis-element table with references
Cis-element Sequence Reference
Cold CCGAC (Baker et al 1994)
G-box CACGTG (Hwang et al 1998)
AACA motif AACAAAA (Wu et al 2000)
GCN4 TGA(GC)TCA (Onodera et al 2001)
C-box TGACGTCA (Cheong et al 1998)
GCC-box TAARAGCCGCC (Leubner-Metzger et al 1998)
Amylase TATCCAY (Hwang et al 1998)
GARE RTAACRRANTCYGG (Hwang et al 1998)
GT1 box GGTTAA (Eyal et al 1995)
In amylase CGACG (Hwang et al 1998)
BS1 AGCGGG (Lacombe et al 2000)
DPBF-1 ACACNNG (Kim et al 1997)
ASF1 like TGACGT (Washida et al 1999)
E-box CANNTG (Ellerstrom et al 1996)
Prolamin-box TGYAAAG (Mena et al 1998)
I-box (core) GATAAG (Rose et al 1999)
Figure 2 Overview of relative mRNA expression during rice grain filling (A) Representation of expression profiles for 269 grain filling genes The x-axis shows the developmental stages and the y-axis shows the relative expression level E indicates the panicle at emergence S is the soft dough stage (asymp 14 days post-anthesis) and H is the hard dough stage (asymp 21 days post-anthesis) The expression levels for genes whose gene products belong to different classes including fatty acid (FA) and carbohydrate (CH) biosynthesis storage proteins and transporters and for the 269 genes were averaged based on the normalized expression level for each gene belonging to that class or in the 269-gene group (plusmn standard
deviation SD) (B) Bar graph representation of the average expression level (
plusmn
SD) for the 269 genes in various grain organs at 9 days post-anthesis Each organ type is indicated on the
x
-axis and the relative expression level is shown on the
y
-axis (C)
Pie chart representation of the functional classification of the predicted gene products of the 269 genes found to be involved in grain development The percentage for each functional category is shown
Tong Zhu
et al
copy Blackwell Publishing Ltd
Plant Biotechnology Journal
(2003)
1
59ndash70
64
in carbohydrate metabolism were studied (Supplemental
Table 3)
We found that 82 of the enzymes in the carbohydrate
metabolic pathway may be represented by isoforms as
determined by sequence analysis of the multiple probe
sets on the microarray (Figure 5) Due to the gene prediction
methods used to generate the probe sets on the GeneChip
we cannot exclude the possibility that two probe sets may
query the same mRNA However the expression profile of
every probe set shown here has unique and distinct features
in terms of spatial and temporal distribution and their
promoter sequences strongly suggesting that mRNAs for
different isoforms are in fact being queried
Two genes encoding the small subunits of ADPG pyrophos-
phorylase are expressed early in grain development in con-
junction with a single gene encoding a large subunit (Figure 5
Supplemental Table 3) Genes encoding three other large
subunits are up-regulated later in development from 4 days
after anthesis in conjunction with the up-regulation of
the starch synthase genes and two genes for branching
enzymes (involved in amylose and amylopectin biosynthesis
respectively) The expression of an additional gene encoding
the small subunit also increases over this time period The
expression of genes encoding different isoforms may be
related to the shift to storage starch production and to a
postulated concomitant shift to cytoplasmic ADP-glucose
production Interestingly two genes encoding other isoforms
of the branching enzyme are expressed early during grain
development and are then expressed less during maturation
These isoforms may be involved in transitory starch synthesis
for energy purposes during early stages (these isoforms are
also expressed in leaves) Two other isoforms are expressed
at higher levels throughout development with the highest
expression occurring around 7ndash9 days post-anthesis Similar
results were obtained for branching enzyme genes in
wheat kernels (Morell
et al
1997)
Figure 4 Expression patterns of nine putative MYB transcription factor genes showing preferential expression during grain filling BSP booting-stage panicle DPA days post-anthesis
Figure 3 Histogram of the ratio of occurrence of the AACA motif and the ASF1-like element in the grain gene cluster vs control gene cluster The histogram was generated as described in the text and is depicted for the AACA motif (A) and the ASF1-like element (B) The x-axis shows the ratio computed by dividing the total number of occurrences of either the AACA motif or the ASF1-like element in a given bootstrapped set of grain cluster genes by that in a corresponding control gene cluster The green line indicates a ratio of 1 The y-axis shows the frequency of a given ratio for each element
Gene regulation in rice grain filling
copy Blackwell Publishing Ltd Plant Biotechnology Journal (2003) 1 59ndash70
65
Figure 5 Pathway of starch biosynthesis in rice with corresponding spatio-temporal gene expression levels Dotted arrows indicate a transport process Dashed arrows indicate that intermediate steps have been omitted Key for panels (A) and (B) 0 2 4 7 9 are days post-anthesis S is soft dough stage H is hard dough stage (approximately 14 and 21 days post-anthesis respectively) ( embryo s endosperm e seed coat and aleurone at 9 days post-anthesis Panel (A) represents absolute expression levels Units are lsquoaverage intensityrsquo (Supplemental Figure 1) Panel (B) represents relative expression levels lsquoEarlyrsquo and lsquolatersquo indicate genes falling into different clusters after cluster analysis Genes that are up-regulated in embryo and endosperm are indicated by the dark grey and light grey markings respectively See text for a description of how the genes were selected
Tong Zhu et al
copy Blackwell Publishing Ltd Plant Biotechnology Journal (2003) 1 59ndash70
66
We also observed distinct spatial expression patterns for
genes encoding different isoforms (Figure 5) For example
we observed that three different sucrose synthase isoforms
are preferentially expressed in developing grain tissues two
of them are expressed more highly at the start of grain
development (0 days post-anthesis) and one is up-regulated
towards the end of grain development Other isoforms with
low expression in grains are expressed strongly in stems or
roots Among the sucrose synthase isoforms that are
preferentially expressed in grains at least three isoforms with
spatially distinct expression patterns have been reported one
in aleurone another in endosperm and a third in grain
tissues other than the endosperm (Wang et al 1999a Yen
et al 1994) Different amylases and glucosidases were also
found to be expressed in different rice grain tissues (Figure 5)
as previously reported (Awazuhara et al 2000)
The expression of the two genes encoding sucrose
synthase isoforms and one gene encoding small subunits
of ADPG pyrophosphorylase isoforms among the 10 grain
samples was examined by quantitative RT-PCR A high
correlation between the results from rice GeneChip microar-
ray and from quantitative RT-PCR was observed with an
average correlation coefficient of 092 (Supplemental
Figure 2) thus validating the specificity of the probe sets and
our observations based on the microarray results
By examining gene expression in the carbohydrate
metabolic pathway we not only confirmed the presence of
different genes encoding isoforms of the same enzyme in this
pathway during grain development (Awazuhara et al 2000
Wang et al 1999b) but also demonstrated both gene
redundancy and coordinated expression of gene families
The differential expression of various isoforms in this pathway
suggests their functional differences and gives an insight
into how structural gene expression patterns determine the
process of grain filling It suggests that transcription
control is a primary mechanism for determining endosperm
development
Mechanistic shifts suggested by transporter
transcript levels
A cluster analysis of the relative expression levels indicates
that genes encoding carbohydrate metabolic enzymes
can be broadly grouped into two phases early and late grain
development (Figure 5) Often a different gene encodes an
enzyme in each phase One isoform of a triose-phosphate
phosphate translocator is expressed at a higher level during
earlier stages of grain development In contrast two isoforms
of a hexose-phosphate translocator and another isoform of a
triose-phosphate translocator are expressed at higher levels
toward the end of grain filling
To characterize the transcription control of the genes
expressed in early and late phases we searched for common
regulatory cis-elements among the available promoters of these
genes No statistically significant elements were identified
among the promoters of the late gene cluster However a
few elements were identified from the 18 promoters of
31 genes belonging to the early gene cluster (data not shown)
Although we cannot confirm the significance of the presence
of these regulatory elements by bootstrap analysis due to
the small number of available promoters multiple classes
of grain-filling promoters may be involved in fine tuning
the process by differentially regulating the expression of
the subgene groups
Our observations also suggest that different mechanisms
for the synthesis and transport of hexose equivalents occur at
different stages during grain development PEP appears to
play a more important role during early stages of grain devel-
opment because genes encoding two isoforms of a PEP-Pi
translocator are relatively highly expressed at this stage We
still do not know if the majority of hexose equivalents are
transported to the amyloplast during the linear phase of
starch accumulation as ADP-glucose as occurs in maize
endosperm development (Shannon et al 1998) However
the expression of a Brittle homologue does indeed increase
almost twofold during seed development (data not shown)
Conclusions
Our results are consistent with the idea that rice grain filling
is a highly coordinated process The synthesis and transport
of carbohydrates storage proteins and fatty acids are co-
regulated starting at the mRNA level These co-regulated
genes contain an over-represented element the AACA motif
in their promoters We hypothesize that this element along
with other unidentified elements may interact with certain key
transcription factors including those identified in this study
to regulate and coordinate the transcription of nutrient par-
titioning genes during grain filling Within each pathway
the expression levels of genes encoding different isoforms
of enzymes are spatially and temporally defined as shown
with the carbohydrate metabolic pathway demonstrating
an additional fine regulation of gene expression at the
intra-pathway level
The rice genome array used in this study along with the
complete genome information provides a powerful tool for
studying and understanding gene function not only in this
important crop but in other cereal species as well since rice
Gene regulation in rice grain filling
copy Blackwell Publishing Ltd Plant Biotechnology Journal (2003) 1 59ndash70
67
shows great synteny and high sequence similarity with other
cereal genomes (Goff et al 2002)
Experimental procedures
Materials and GeneChip microarray experiments
Nipponbare rice (Oryza sativa L ssp Japonica) was grown in
a greenhouse with a 12 h light cycle at 29 degC during the day
and 21 degC during the night Humidity was maintained at
30 Plants were grown in pots containing 50 Sunshine
mix and 50 nitrohumus Tissues were collected from at
least five plants and pooled for each time point The
samples were homogenized in liquid nitrogen prior to
RNA isolation Immature embryo endosperm aleurone and
seed coat samples were dissected from grains of 88-day-old-
plants For the aleurone layers samples were prepared accord-
ing to a previously described procedure (Fath et al 1999) A
complete sample list and description is listed in Table 2
The experiments were performed as previously described
(Zhu et al 2001) Briefly total RNA was isolated using
Qiagen RNeasy columns (Qiagen Chatsworth CA) and
examined by gel electrophoresis for integrity and by spec-
trometry for purity To ensure data quality only samples with
A260A280 ratios of 19ndash21 were included in the study
Total RNA (5 microg) from each sample was reverse transcribed
at 42 degC for 1 h using 100 pmol of the oligo dT(24) primer
containing a 5prime-T7 RNA polymerase promoter sequence
[5prime-GGCCAGTGAATTGTAATACGACTCACTATAGGGAGGCGG-
(dT)24-3] 50 mM Tris-HCl (pH 83) 75 mM KCl 3 mM MgCl2
10 mM dithiotreitol (DTT) 05 mM dNTPs and 200 units of
SuperScript II reverse transcriptase (Life Technologies) The
second strand of cDNA was synthesized using 40 units
of E coli DNA polymerase I 10 units of E coli DNA ligase
and 2 units of RNase H in a reaction containing 25 mM
Tris-HCl (pH 75) 100 mM KCl 5 mM MgCl2 10 mM (NH4)SO4
015 mM b-NAD+ 1 mM dNTPs and 12 mM DTT The reac-
tion proceeded for 2 h at 16 degC and was terminated using
EDTA Double-stranded cDNA products were purified by
phenolchloroform extraction and ethanol precipitation
Biotinylated complementary RNAs (cRNAs) were tran-
scribed in vitro from synthesized cDNA by T7 RNA Polymerase
(ENZO BioArray High Yield RNA Transcript Labelling Kit Enzo)
cRNAs were purified using affinity resin (Qiagen RNeasy
Spin Columns) and randomly fragmented by incubating
at 94 degC for 35 min in a buffer containing 40 mM Tris-
acetate (pH 81) 100 mM potassium acetate and 30 mM
magnesium acetate to produce molecules of approximately
35ndash200 bases
The labelled samples were mixed with 01 mgmL soni-
cated herring sperm DNA in a hybridization buffer containing
100 mM 2-N-morpholino-ethane-sulphonic acid (MES) 1 M
NaCl 20 mM EDTA 001 Tween 20 denatured at 99 degC for
5 min and equilibrated at 45 degC for 5 min before hybridiza-
tion The hybridization mix was then transferred to the rice
GeneChip microarray cartridge and hybridized at 45 degC for
16 h on a rotisserie at 60 rpm
The hybridized arrays were then rinsed and stained in a
fluidics station (Affymetrix) They were first rinsed with wash
buffer A (6times SSPE (09 M NaCl 006 M NaH2PO4 0006 M
EDTA) 001 Tween 20 0005 Antifoam) at 25 degC for
10 min and incubated with wash buffer B (100 mM MES
01 M NaCl 001 Tween 20) at 50 degC for 20 min then
stained with Streptavidin Phycoerythrin (SAPE) 100 mM MES
1 M NaCl 005 Tween 20 0005 Antifoam 10 mgmL
SAPE 2 mgmL BSA at 25 degC for 10 min washed with wash
buffer A at 25 degC for 20 min and stained with biotinylated
antistreptavidin antibody at 25 degC for 10 min After staining
arrays were stained with SAPE at 25 degC for 10 min and
washed with wash buffer A at 30 degC for 30 min The probe
arrays were scanned twice and the intensities were aver-
aged with an Agilent GeneArray Scanner using GeneChip
Suite 40 (Affymetrix)
Data transformation and cluster analysis
The average intensity of all probe sets of each array was
scaled to 100 so that the hybridization intensity of all arrays
was equivalent Genes encoding products potentially involved
in the transport and synthesis of carbohydrates fatty acids
and storage proteins were selected based on their sequence
homology to known genes Expression levels of the selected
genes were processed before being subjected to cluster
analysis according to the following procedure First any
expression values (average fluorescence signals) that were
less than 5 were adjusted to 5 Then the adjusted expression
values were log2-transformed median centred and normalized
among the selected genes so that the sum of squares for
each expression vector was equal to one in order to better
visualize the change in shape of the profile over time and
space regardless of the magnitude of expression level The
processed data were then used for cluster analysis using
CLUSTER (Eisen et al 1998) with self-organizing maps fol-
lowed by complete linkage hierarchical clustering of both genes
and experiments The results were visualized with TREEVIEW
(Eisen et al 1998)
Data for the putative nutrient partitioning genes (identified
from cluster analysis) that are preferentially expressed during
Tong Zhu et al
copy Blackwell Publishing Ltd Plant Biotechnology Journal (2003) 1 59ndash70
68
grain filling were then imported into GENESPRING (Silicon
Genetics Redwood CA) Genes with similar expression patterns
(ie correlation coefficients greater than 085) as the original
bait genes were further selected and are collectively referred
to as grain filling genes
The confidence of finding 98 grain filling genes was
assessed through bootstrapping the 491 genes 100 times
For each cycle 98 genes were randomly selected from the
491 genes Then Pearson correlation coefficients were
calculated between the average of the 98 randomly selected
genes and that of the 98 grain filling genes and the P-value
was deduced from the 100 Pearson correlation coefficients
using the following equations
Promoter analysis
The promoter sequences of the grain filling genes were iden-
tified by BLAST search of the open reading frame sequences
of these genes against the published predicted rice gene
sequences (Goff et al 2002) The predicted gene sequence
that was the best match with scores greater than 1E-20 was
used to represent the open reading frame The 15 kb regions
upstream from the putative ATG start site were extracted
using a custom Perl script
Analysis of starch biosynthesis pathway
Data series for probe sets were considered for analysis if the
average intensity was above 25 in any sample in the series
(Supplemental Figure 1) The transformed data were then
loaded into GENESPRING (Silicon Genetics Redwood CA) A
pathway for starch biosynthesis and degradation was gener-
ated from several sources (Dennis and Emes 1990 Kruger
1990 Myers et al 2000 Stitt 1990) and was converted to
a GIF file and imported into GeneSpring Expression level
display boxes were drawn on this GIF using the mapping
function in GENESPRING Genes were selected for display at the
appropriate location on this image based on their annotation
(Goff et al 2002) For genes that have a cytoplasmic and a
plastidic isoform the isoforms were differentiated based on
the annotation where possible
Validation of microarray data
Quantitative RT-PCR assays were performed on an ABI Prism
7700 (Applied Biosystems Foster City CA) as previously
described using the primers and probe sets specific to genes
encoding isoform described (Supplemental Figure 2) A
standard curve consisting of serial 1 5 dilutions was
prepared with RNA concentrations of 50 ngmicroL 10 ngmicroL
2 ngmicroL 04 ngmicroL and 008 ngmicroL Relative expression levels
were interpolated by comparison with standard curves with
a correlation coefficient of 099 or greater Relative expres-
sion levels were normalized to the expression level of a rice
polyubiquitin gene in each sample which was expressed at a
constant level All reactions were performed in triplicate
Acknowledgements
We thank T Moughamer and C Martin for rice sequence
selection for the rice GeneChip design We also thank S Goff
and J Glazebrook for a critical reading of this manuscript
Supplementary material
To confirm the conclusions of the paper the supplemental
data can be accessed through the journalrsquos website lthttp
wipblackwellpublishingcomproducts journals suppmatPBI
PBI006PBI006smhtmgt and the authorsrsquo website lthttp
tmriorggene_exp_webgt To get sequence information for
the Sequence IDs (Probe Set IDs) referred in the paper go to
lthttptmriorggene_exp_webrice_probesetshtmlgt and enter
the Sequence ID (eg OS0007591_at OS_ORF006203_at) into
the query template provide
References
Altschul SF Madden TL Schaffer AA Zhang J Zhang ZMiller W and Lipman DJ (1997) Gapped BLAST and PSI-BLASTa new generation of protein database search programs NuclAcids Res 25 3389ndash3402
Awazuhara M Nakagawa A Yamaguchi J Fujiwara T Hayashi HHatae K Chino M and Shimada A (2000) Distribution andcharacterization of enzymes causing starch degradation in rice(Oryza sativa cv koshihikari) J Agric Food Chem 48 245ndash252
Baker SS Wilhelm KS and Thomashow MF (1994) The 5prime-region of Arabidopsis thaliana cor15a has cis-acting elements thatconfer cold- drought- and ABA-regulated gene expression PlantMol Biol 24 701ndash713
Cheong YH Yoo CM Park JM Ryu GR Goekjian VHNagao RT Key JL Cho MJ and Hong JC (1998) STF1 is a novelTGACG-binding factor with a zinc-finger motif and a bZIP domainwhich heterodimerizes with GBF proteins Plant J 15 199ndash209
Dennis DT and Emes MJ (1990) Regulation by compartmenta-tion In Plant Physiology Biochemistry and Molecular Biology(Dennis DT and Turpin DH eds) pp 45ndash55 London UKLongman Scientific and Technical
Efron B and Tibshirani RJ (1994) Random samples and probabilityIn An Introduction to the Bootstrap pp 17ndash28 Boca Raton FLMonographs on Statistics and Applied Probability
tX
SS
S
NXX
=
minus=
micro
Gene regulation in rice grain filling
copy Blackwell Publishing Ltd Plant Biotechnology Journal (2003) 1 59ndash70
69
Eisen MB Spellman PT Brown PO and Botstein D (1998)Cluster analysis and display of genome-wide expression patternsProc Natl Acad Sci USA 95 14863ndash14868
Ellerstrom M Stalberg K Ezcurra I and Rask L (1996) Functionaldissection of a napin gene promoter identification of promoterelements required for embryo and endosperm-specific transcrip-tion Plant Mol Biol 32 1019ndash1027
Eyal Y Curie C and McCormick S (1995) Pollen specificityelements reside in 30 bp of the proximal promoters of twopollen-expressed genes Plant Cell 7 373ndash384
Fath A Bethke PC and Jones RL (1999) Barley aleurone celldeath is not apoptotic characterization of nuclease activities andDNA degradation Plant J 20 305ndash315
Girke T Todd J Ruuska S White J Benning C and Ohlrogge J(2000) Microarray analysis of developing Arabidopsis seeds PlantPhysiol 124 1570ndash1581
Goff SA Ricke D Lan TH Presting G Wang R Dunn MGlazebrook J Sessions A Oeller P Varma H et al (2002) Adraft sequence of the rice genome (Oryza sativa L ssp japonica)Science 296 92ndash100
Hwang YS Karrer EE Thomas BR Chen L and Rodriguez RL(1998) Three cis-elements required for rice α-amylase Amy3Dexpression during sugar starvation Plant Mol Biol 36 331ndash341
Kim SY Chung HJ and Thomas TL (1997) Isolation of a novelclass of bZIP transcription factors that interact with ABA-responsive and embryo-specification elements in the Dc3 pro-moter using a modified yeast one-hybrid system Plant J 111237ndash1251
Kruger M (1990) Carborhydrate Synthesis and Degradation InPlant Physiology Biochemistry and Molecular Biology (Dennis DTand Turpin DH eds) pp 59ndash76 London Longman Scientificand Technical
Lacombe E Van Doorsselaere J Boerjan W Boudet AMand Grima-Pettenati J (2000) Characterization of cis-elementsrequired for vascular expression of the cinnamoyl CoA reductasegene and for proteinndashDNA complex formation Plant J 23663ndash676
Leubner-Metzger G Petruzzelli L Waldvogel R Vogeli-Lange Rand Meins F Jr (1998) Ethylene-responsive element bindingprotein (EREBP) expression and the transcriptional regulation ofclass I β-13-glucanase during tobacco seed germination PlantMol Biol 38 785ndash795
Lipshultz RJ Fodor SP Gingeras TR and Lockhart DJ (1999)High density synthetic oligonucleotide arrays Nat Genet 2120ndash24
Lockhart DJ Dong H Byrne MC Follettie MT Gallo MVChee MS Mittmann M Wang C Kobayashi M Horton Hand Brown EL (1996) Expression monitoring by hybridization tohigh-density oligonucleotide arrays Nat Biotechnol 14 1675ndash1680
Mazur B Krebbers E and Tingey S (1999) Gene discovery andproduct development for grain quality traits Science 285372ndash375
Mena M Vicente-Carbajosa J Schmidt RJ and Carbonero P(1998) An endosperm-specific DOF protein from barley highlyconserved in wheat binds to and activates transcription fromthe prolamin-box of a native B-hordein promoter in barleyendosperm Plant J 16 53ndash62
Morell MK Blennow A Kosar-Hashemi B and Samuel MS(1997) Differential expression and properties of starch branching
enzyme isoforms in developing wheat endosperm Plant Physiol113 201ndash208
Myers AM Morell MK James MG and Ball SG (2000) Recentprogress toward understanding biosynthesis of the amylopectincrystal Plant Physiol 122 989ndash997
Onodera Y Suzuki A Wu CY Washida H and Takaiwa F(2001) A rice functional transcriptional activator RISBZ1 respon-sible for endosperm-specific expression of storage protein genesthrough GCN4 motif J Biol Chem 276 14139ndash14152
Ren B Robert F Wyrick JJ Aparicio O Jennings EG Simon IZeitlinger J Schreiber J Hannett N Kanin E et al (2000)Genome-wide location and function of DNA binding proteinsScience 290 2306ndash2309
Rose A Meier I and Wienand U (1999) The tomato I-box bindingfactor LeMYBI is a member of a novel class of myb-like proteinsPlant J 20 641ndash652
Roth FP Hughes JD Estep PW and Church GM (1998) FindingDNA regulatory motifs within unaligned noncoding sequencesclustered by whole-genome mRNA quantitation Nat Biotechnol16 939ndash945
Rushton PJ and Somssich IE (1998) Transcriptional control ofplant genes responsive to pathogens Curr Opin Plant Biol 1311ndash315
Ruuska SA Girke T Benning C and Ohlrogge JB (2002)Contrapuntal networks of gene expression during Arabidopsisseed filling Plant Cell 14 1191ndash1206
Shannon JC Pien FM Cao H and Liu KC (1998) Brittle-1 anadenylate translocator facilitates transfer of extraplastidialsynthesized ADPndashglucose into amyloplasts of maize endospermsPlant Physiol 117 1235ndash1252
Singh V Okadome H Toyoshima H Isobe S and Ohtsubo K(2000) Thermal and physicochemical properties of rice grain flourand starch J Agric Food Chem 48 2639ndash2647
Stitt M (1990) The flux of carbon between the chloroplast andcytoplasm In Plant Physiology Biochemistry and MolecularBiology (Dennis DT and Turpin DH eds) pp 309ndash326 LondonLongman Scientific and Technical
Umemoto T Nakamura Y and Ishikura N (1995) Activity of starchsynthase and the amylose content in rice endosperm Phytochem-istry 40 1613ndash1616
Vicente-Carbajosa J Moose SP Parsons RL and Schmidt RJ(1997) A maize zinc-finger protein binds the prolamin box in zeingene promoters and interacts with the basic leucine zippertranscriptional activator Opaque2 Proc Natl Acad Sci USA 947685ndash7690
Wang AY Kao MH Yang WH Sayion Y Liu LF Lee PD andSu JC (1999a) Differentially and developmentally regulatedexpression of three rice sucrose synthase genes Plant Cell Physiol40 800ndash807
Wang RL Stec A Hey J Lukens L and Doebley J (1999b) Thelimits of selection during maize domestication Nature 398236ndash239
Washida H Wu CY Suzuki A Yamanouchi U Akihama THarada K and Takaiwa F (1999) Identification of cis-regulatoryelements required for endosperm expression of the rice storageprotein glutelin gene GluB-1 Plant Mol Biol 40 1ndash12
Wu C Washida H Onodera Y Harada K and Takaiwa F (2000)Quantitative nature of the Prolamin-box ACGT and AACA motifsin a rice glutelin gene promoter minimal cis-element requirementsfor endosperm-specific gene expression Plant J 23 415ndash421
Tong Zhu et al
copy Blackwell Publishing Ltd Plant Biotechnology Journal (2003) 1 59ndash70
70
Ye X Al-Babili S Kloti A Zhang J Lucca P Beyer P andPotrykus I (2000) Engineering the provitamin A (beta-carotene)biosynthetic pathway into (carotenoid-free) rice endospermScience 287 303ndash305
Yen SF Su JC and Sung HY (1994) Purification and character-ization of rice sucrose synthase isozymes Biochem Mol Biol Int34 613ndash620
Yu J Hu S Wang J Wong GK Li S Liu B Deng Y
Dai L Zhou Y Zhang X et al (2002) A draft sequence ofthe rice genome (Oryza sativa L ssp indica) Science 296 79ndash92
Zhu T Budworth P Han B Brown D Chang HS Zou G andWang X (2001) Toward elucidating the global gene expressionpatterns of developing Arabidopsis Parallel analysis of 8300genes by high-density oligonucleotide probe array Plant PhysiolBiochem 39 221ndash242
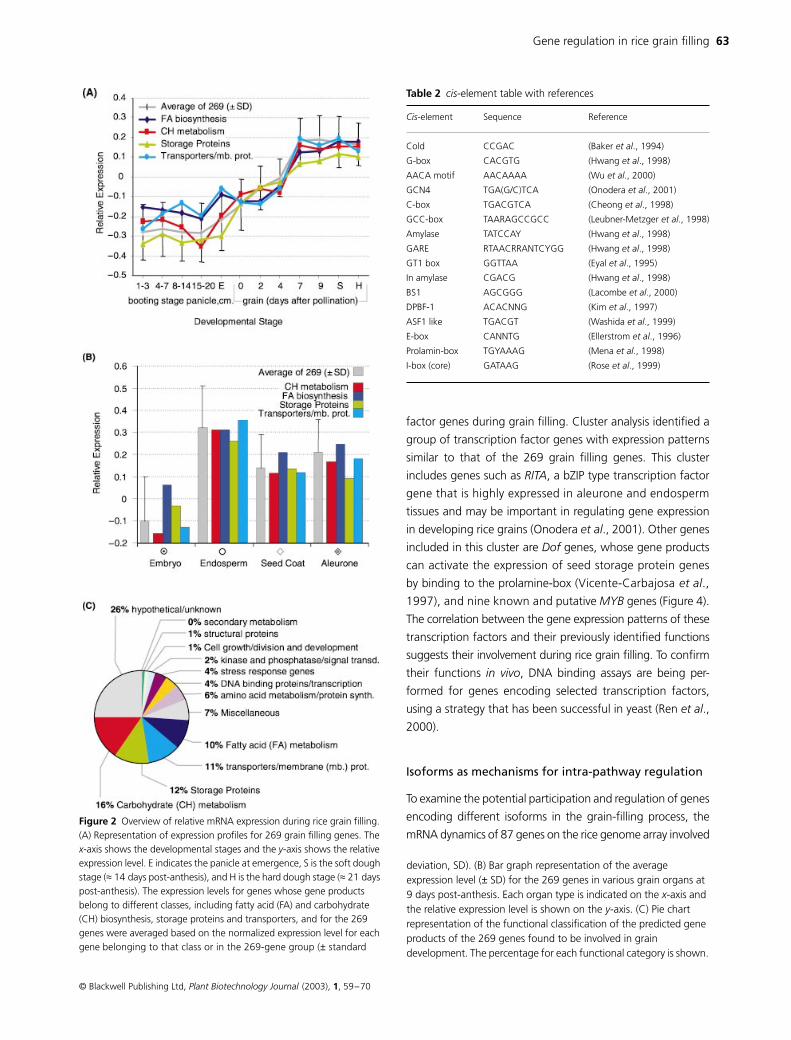
Gene regulation in rice grain filling
copy Blackwell Publishing Ltd
Plant Biotechnology Journal
(2003)
1
59ndash70
63
factor genes during grain filling Cluster analysis identified a
group of transcription factor genes with expression patterns
similar to that of the 269 grain filling genes This cluster
includes genes such as
RITA
a bZIP type transcription factor
gene that is highly expressed in aleurone and endosperm
tissues and may be important in regulating gene expression
in developing rice grains (Onodera
et al
2001) Other genes
included in this cluster are
Dof
genes whose gene products
can activate the expression of seed storage protein genes
by binding to the prolamine-box (Vicente-Carbajosa
et al
1997) and nine known and putative
MYB
genes (Figure 4)
The correlation between the gene expression patterns of these
transcription factors and their previously identified functions
suggests their involvement during rice grain filling To confirm
their functions
in vivo
DNA binding assays are being per-
formed for genes encoding selected transcription factors
using a strategy that has been successful in yeast (Ren
et al
2000)
Isoforms as mechanisms for intra-pathway regulation
To examine the potential participation and regulation of genes
encoding different isoforms in the grain-filling process the
mRNA dynamics of 87 genes on the rice genome array involved
Table 2 cis-element table with references
Cis-element Sequence Reference
Cold CCGAC (Baker et al 1994)
G-box CACGTG (Hwang et al 1998)
AACA motif AACAAAA (Wu et al 2000)
GCN4 TGA(GC)TCA (Onodera et al 2001)
C-box TGACGTCA (Cheong et al 1998)
GCC-box TAARAGCCGCC (Leubner-Metzger et al 1998)
Amylase TATCCAY (Hwang et al 1998)
GARE RTAACRRANTCYGG (Hwang et al 1998)
GT1 box GGTTAA (Eyal et al 1995)
In amylase CGACG (Hwang et al 1998)
BS1 AGCGGG (Lacombe et al 2000)
DPBF-1 ACACNNG (Kim et al 1997)
ASF1 like TGACGT (Washida et al 1999)
E-box CANNTG (Ellerstrom et al 1996)
Prolamin-box TGYAAAG (Mena et al 1998)
I-box (core) GATAAG (Rose et al 1999)
Figure 2 Overview of relative mRNA expression during rice grain filling (A) Representation of expression profiles for 269 grain filling genes The x-axis shows the developmental stages and the y-axis shows the relative expression level E indicates the panicle at emergence S is the soft dough stage (asymp 14 days post-anthesis) and H is the hard dough stage (asymp 21 days post-anthesis) The expression levels for genes whose gene products belong to different classes including fatty acid (FA) and carbohydrate (CH) biosynthesis storage proteins and transporters and for the 269 genes were averaged based on the normalized expression level for each gene belonging to that class or in the 269-gene group (plusmn standard
deviation SD) (B) Bar graph representation of the average expression level (
plusmn
SD) for the 269 genes in various grain organs at 9 days post-anthesis Each organ type is indicated on the
x
-axis and the relative expression level is shown on the
y
-axis (C)
Pie chart representation of the functional classification of the predicted gene products of the 269 genes found to be involved in grain development The percentage for each functional category is shown
Tong Zhu
et al
copy Blackwell Publishing Ltd
Plant Biotechnology Journal
(2003)
1
59ndash70
64
in carbohydrate metabolism were studied (Supplemental
Table 3)
We found that 82 of the enzymes in the carbohydrate
metabolic pathway may be represented by isoforms as
determined by sequence analysis of the multiple probe
sets on the microarray (Figure 5) Due to the gene prediction
methods used to generate the probe sets on the GeneChip
we cannot exclude the possibility that two probe sets may
query the same mRNA However the expression profile of
every probe set shown here has unique and distinct features
in terms of spatial and temporal distribution and their
promoter sequences strongly suggesting that mRNAs for
different isoforms are in fact being queried
Two genes encoding the small subunits of ADPG pyrophos-
phorylase are expressed early in grain development in con-
junction with a single gene encoding a large subunit (Figure 5
Supplemental Table 3) Genes encoding three other large
subunits are up-regulated later in development from 4 days
after anthesis in conjunction with the up-regulation of
the starch synthase genes and two genes for branching
enzymes (involved in amylose and amylopectin biosynthesis
respectively) The expression of an additional gene encoding
the small subunit also increases over this time period The
expression of genes encoding different isoforms may be
related to the shift to storage starch production and to a
postulated concomitant shift to cytoplasmic ADP-glucose
production Interestingly two genes encoding other isoforms
of the branching enzyme are expressed early during grain
development and are then expressed less during maturation
These isoforms may be involved in transitory starch synthesis
for energy purposes during early stages (these isoforms are
also expressed in leaves) Two other isoforms are expressed
at higher levels throughout development with the highest
expression occurring around 7ndash9 days post-anthesis Similar
results were obtained for branching enzyme genes in
wheat kernels (Morell
et al
1997)
Figure 4 Expression patterns of nine putative MYB transcription factor genes showing preferential expression during grain filling BSP booting-stage panicle DPA days post-anthesis
Figure 3 Histogram of the ratio of occurrence of the AACA motif and the ASF1-like element in the grain gene cluster vs control gene cluster The histogram was generated as described in the text and is depicted for the AACA motif (A) and the ASF1-like element (B) The x-axis shows the ratio computed by dividing the total number of occurrences of either the AACA motif or the ASF1-like element in a given bootstrapped set of grain cluster genes by that in a corresponding control gene cluster The green line indicates a ratio of 1 The y-axis shows the frequency of a given ratio for each element
Gene regulation in rice grain filling
copy Blackwell Publishing Ltd Plant Biotechnology Journal (2003) 1 59ndash70
65
Figure 5 Pathway of starch biosynthesis in rice with corresponding spatio-temporal gene expression levels Dotted arrows indicate a transport process Dashed arrows indicate that intermediate steps have been omitted Key for panels (A) and (B) 0 2 4 7 9 are days post-anthesis S is soft dough stage H is hard dough stage (approximately 14 and 21 days post-anthesis respectively) ( embryo s endosperm e seed coat and aleurone at 9 days post-anthesis Panel (A) represents absolute expression levels Units are lsquoaverage intensityrsquo (Supplemental Figure 1) Panel (B) represents relative expression levels lsquoEarlyrsquo and lsquolatersquo indicate genes falling into different clusters after cluster analysis Genes that are up-regulated in embryo and endosperm are indicated by the dark grey and light grey markings respectively See text for a description of how the genes were selected
Tong Zhu et al
copy Blackwell Publishing Ltd Plant Biotechnology Journal (2003) 1 59ndash70
66
We also observed distinct spatial expression patterns for
genes encoding different isoforms (Figure 5) For example
we observed that three different sucrose synthase isoforms
are preferentially expressed in developing grain tissues two
of them are expressed more highly at the start of grain
development (0 days post-anthesis) and one is up-regulated
towards the end of grain development Other isoforms with
low expression in grains are expressed strongly in stems or
roots Among the sucrose synthase isoforms that are
preferentially expressed in grains at least three isoforms with
spatially distinct expression patterns have been reported one
in aleurone another in endosperm and a third in grain
tissues other than the endosperm (Wang et al 1999a Yen
et al 1994) Different amylases and glucosidases were also
found to be expressed in different rice grain tissues (Figure 5)
as previously reported (Awazuhara et al 2000)
The expression of the two genes encoding sucrose
synthase isoforms and one gene encoding small subunits
of ADPG pyrophosphorylase isoforms among the 10 grain
samples was examined by quantitative RT-PCR A high
correlation between the results from rice GeneChip microar-
ray and from quantitative RT-PCR was observed with an
average correlation coefficient of 092 (Supplemental
Figure 2) thus validating the specificity of the probe sets and
our observations based on the microarray results
By examining gene expression in the carbohydrate
metabolic pathway we not only confirmed the presence of
different genes encoding isoforms of the same enzyme in this
pathway during grain development (Awazuhara et al 2000
Wang et al 1999b) but also demonstrated both gene
redundancy and coordinated expression of gene families
The differential expression of various isoforms in this pathway
suggests their functional differences and gives an insight
into how structural gene expression patterns determine the
process of grain filling It suggests that transcription
control is a primary mechanism for determining endosperm
development
Mechanistic shifts suggested by transporter
transcript levels
A cluster analysis of the relative expression levels indicates
that genes encoding carbohydrate metabolic enzymes
can be broadly grouped into two phases early and late grain
development (Figure 5) Often a different gene encodes an
enzyme in each phase One isoform of a triose-phosphate
phosphate translocator is expressed at a higher level during
earlier stages of grain development In contrast two isoforms
of a hexose-phosphate translocator and another isoform of a
triose-phosphate translocator are expressed at higher levels
toward the end of grain filling
To characterize the transcription control of the genes
expressed in early and late phases we searched for common
regulatory cis-elements among the available promoters of these
genes No statistically significant elements were identified
among the promoters of the late gene cluster However a
few elements were identified from the 18 promoters of
31 genes belonging to the early gene cluster (data not shown)
Although we cannot confirm the significance of the presence
of these regulatory elements by bootstrap analysis due to
the small number of available promoters multiple classes
of grain-filling promoters may be involved in fine tuning
the process by differentially regulating the expression of
the subgene groups
Our observations also suggest that different mechanisms
for the synthesis and transport of hexose equivalents occur at
different stages during grain development PEP appears to
play a more important role during early stages of grain devel-
opment because genes encoding two isoforms of a PEP-Pi
translocator are relatively highly expressed at this stage We
still do not know if the majority of hexose equivalents are
transported to the amyloplast during the linear phase of
starch accumulation as ADP-glucose as occurs in maize
endosperm development (Shannon et al 1998) However
the expression of a Brittle homologue does indeed increase
almost twofold during seed development (data not shown)
Conclusions
Our results are consistent with the idea that rice grain filling
is a highly coordinated process The synthesis and transport
of carbohydrates storage proteins and fatty acids are co-
regulated starting at the mRNA level These co-regulated
genes contain an over-represented element the AACA motif
in their promoters We hypothesize that this element along
with other unidentified elements may interact with certain key
transcription factors including those identified in this study
to regulate and coordinate the transcription of nutrient par-
titioning genes during grain filling Within each pathway
the expression levels of genes encoding different isoforms
of enzymes are spatially and temporally defined as shown
with the carbohydrate metabolic pathway demonstrating
an additional fine regulation of gene expression at the
intra-pathway level
The rice genome array used in this study along with the
complete genome information provides a powerful tool for
studying and understanding gene function not only in this
important crop but in other cereal species as well since rice
Gene regulation in rice grain filling
copy Blackwell Publishing Ltd Plant Biotechnology Journal (2003) 1 59ndash70
67
shows great synteny and high sequence similarity with other
cereal genomes (Goff et al 2002)
Experimental procedures
Materials and GeneChip microarray experiments
Nipponbare rice (Oryza sativa L ssp Japonica) was grown in
a greenhouse with a 12 h light cycle at 29 degC during the day
and 21 degC during the night Humidity was maintained at
30 Plants were grown in pots containing 50 Sunshine
mix and 50 nitrohumus Tissues were collected from at
least five plants and pooled for each time point The
samples were homogenized in liquid nitrogen prior to
RNA isolation Immature embryo endosperm aleurone and
seed coat samples were dissected from grains of 88-day-old-
plants For the aleurone layers samples were prepared accord-
ing to a previously described procedure (Fath et al 1999) A
complete sample list and description is listed in Table 2
The experiments were performed as previously described
(Zhu et al 2001) Briefly total RNA was isolated using
Qiagen RNeasy columns (Qiagen Chatsworth CA) and
examined by gel electrophoresis for integrity and by spec-
trometry for purity To ensure data quality only samples with
A260A280 ratios of 19ndash21 were included in the study
Total RNA (5 microg) from each sample was reverse transcribed
at 42 degC for 1 h using 100 pmol of the oligo dT(24) primer
containing a 5prime-T7 RNA polymerase promoter sequence
[5prime-GGCCAGTGAATTGTAATACGACTCACTATAGGGAGGCGG-
(dT)24-3] 50 mM Tris-HCl (pH 83) 75 mM KCl 3 mM MgCl2
10 mM dithiotreitol (DTT) 05 mM dNTPs and 200 units of
SuperScript II reverse transcriptase (Life Technologies) The
second strand of cDNA was synthesized using 40 units
of E coli DNA polymerase I 10 units of E coli DNA ligase
and 2 units of RNase H in a reaction containing 25 mM
Tris-HCl (pH 75) 100 mM KCl 5 mM MgCl2 10 mM (NH4)SO4
015 mM b-NAD+ 1 mM dNTPs and 12 mM DTT The reac-
tion proceeded for 2 h at 16 degC and was terminated using
EDTA Double-stranded cDNA products were purified by
phenolchloroform extraction and ethanol precipitation
Biotinylated complementary RNAs (cRNAs) were tran-
scribed in vitro from synthesized cDNA by T7 RNA Polymerase
(ENZO BioArray High Yield RNA Transcript Labelling Kit Enzo)
cRNAs were purified using affinity resin (Qiagen RNeasy
Spin Columns) and randomly fragmented by incubating
at 94 degC for 35 min in a buffer containing 40 mM Tris-
acetate (pH 81) 100 mM potassium acetate and 30 mM
magnesium acetate to produce molecules of approximately
35ndash200 bases
The labelled samples were mixed with 01 mgmL soni-
cated herring sperm DNA in a hybridization buffer containing
100 mM 2-N-morpholino-ethane-sulphonic acid (MES) 1 M
NaCl 20 mM EDTA 001 Tween 20 denatured at 99 degC for
5 min and equilibrated at 45 degC for 5 min before hybridiza-
tion The hybridization mix was then transferred to the rice
GeneChip microarray cartridge and hybridized at 45 degC for
16 h on a rotisserie at 60 rpm
The hybridized arrays were then rinsed and stained in a
fluidics station (Affymetrix) They were first rinsed with wash
buffer A (6times SSPE (09 M NaCl 006 M NaH2PO4 0006 M
EDTA) 001 Tween 20 0005 Antifoam) at 25 degC for
10 min and incubated with wash buffer B (100 mM MES
01 M NaCl 001 Tween 20) at 50 degC for 20 min then
stained with Streptavidin Phycoerythrin (SAPE) 100 mM MES
1 M NaCl 005 Tween 20 0005 Antifoam 10 mgmL
SAPE 2 mgmL BSA at 25 degC for 10 min washed with wash
buffer A at 25 degC for 20 min and stained with biotinylated
antistreptavidin antibody at 25 degC for 10 min After staining
arrays were stained with SAPE at 25 degC for 10 min and
washed with wash buffer A at 30 degC for 30 min The probe
arrays were scanned twice and the intensities were aver-
aged with an Agilent GeneArray Scanner using GeneChip
Suite 40 (Affymetrix)
Data transformation and cluster analysis
The average intensity of all probe sets of each array was
scaled to 100 so that the hybridization intensity of all arrays
was equivalent Genes encoding products potentially involved
in the transport and synthesis of carbohydrates fatty acids
and storage proteins were selected based on their sequence
homology to known genes Expression levels of the selected
genes were processed before being subjected to cluster
analysis according to the following procedure First any
expression values (average fluorescence signals) that were
less than 5 were adjusted to 5 Then the adjusted expression
values were log2-transformed median centred and normalized
among the selected genes so that the sum of squares for
each expression vector was equal to one in order to better
visualize the change in shape of the profile over time and
space regardless of the magnitude of expression level The
processed data were then used for cluster analysis using
CLUSTER (Eisen et al 1998) with self-organizing maps fol-
lowed by complete linkage hierarchical clustering of both genes
and experiments The results were visualized with TREEVIEW
(Eisen et al 1998)
Data for the putative nutrient partitioning genes (identified
from cluster analysis) that are preferentially expressed during
Tong Zhu et al
copy Blackwell Publishing Ltd Plant Biotechnology Journal (2003) 1 59ndash70
68
grain filling were then imported into GENESPRING (Silicon
Genetics Redwood CA) Genes with similar expression patterns
(ie correlation coefficients greater than 085) as the original
bait genes were further selected and are collectively referred
to as grain filling genes
The confidence of finding 98 grain filling genes was
assessed through bootstrapping the 491 genes 100 times
For each cycle 98 genes were randomly selected from the
491 genes Then Pearson correlation coefficients were
calculated between the average of the 98 randomly selected
genes and that of the 98 grain filling genes and the P-value
was deduced from the 100 Pearson correlation coefficients
using the following equations
Promoter analysis
The promoter sequences of the grain filling genes were iden-
tified by BLAST search of the open reading frame sequences
of these genes against the published predicted rice gene
sequences (Goff et al 2002) The predicted gene sequence
that was the best match with scores greater than 1E-20 was
used to represent the open reading frame The 15 kb regions
upstream from the putative ATG start site were extracted
using a custom Perl script
Analysis of starch biosynthesis pathway
Data series for probe sets were considered for analysis if the
average intensity was above 25 in any sample in the series
(Supplemental Figure 1) The transformed data were then
loaded into GENESPRING (Silicon Genetics Redwood CA) A
pathway for starch biosynthesis and degradation was gener-
ated from several sources (Dennis and Emes 1990 Kruger
1990 Myers et al 2000 Stitt 1990) and was converted to
a GIF file and imported into GeneSpring Expression level
display boxes were drawn on this GIF using the mapping
function in GENESPRING Genes were selected for display at the
appropriate location on this image based on their annotation
(Goff et al 2002) For genes that have a cytoplasmic and a
plastidic isoform the isoforms were differentiated based on
the annotation where possible
Validation of microarray data
Quantitative RT-PCR assays were performed on an ABI Prism
7700 (Applied Biosystems Foster City CA) as previously
described using the primers and probe sets specific to genes
encoding isoform described (Supplemental Figure 2) A
standard curve consisting of serial 1 5 dilutions was
prepared with RNA concentrations of 50 ngmicroL 10 ngmicroL
2 ngmicroL 04 ngmicroL and 008 ngmicroL Relative expression levels
were interpolated by comparison with standard curves with
a correlation coefficient of 099 or greater Relative expres-
sion levels were normalized to the expression level of a rice
polyubiquitin gene in each sample which was expressed at a
constant level All reactions were performed in triplicate
Acknowledgements
We thank T Moughamer and C Martin for rice sequence
selection for the rice GeneChip design We also thank S Goff
and J Glazebrook for a critical reading of this manuscript
Supplementary material
To confirm the conclusions of the paper the supplemental
data can be accessed through the journalrsquos website lthttp
wipblackwellpublishingcomproducts journals suppmatPBI
PBI006PBI006smhtmgt and the authorsrsquo website lthttp
tmriorggene_exp_webgt To get sequence information for
the Sequence IDs (Probe Set IDs) referred in the paper go to
lthttptmriorggene_exp_webrice_probesetshtmlgt and enter
the Sequence ID (eg OS0007591_at OS_ORF006203_at) into
the query template provide
References
Altschul SF Madden TL Schaffer AA Zhang J Zhang ZMiller W and Lipman DJ (1997) Gapped BLAST and PSI-BLASTa new generation of protein database search programs NuclAcids Res 25 3389ndash3402
Awazuhara M Nakagawa A Yamaguchi J Fujiwara T Hayashi HHatae K Chino M and Shimada A (2000) Distribution andcharacterization of enzymes causing starch degradation in rice(Oryza sativa cv koshihikari) J Agric Food Chem 48 245ndash252
Baker SS Wilhelm KS and Thomashow MF (1994) The 5prime-region of Arabidopsis thaliana cor15a has cis-acting elements thatconfer cold- drought- and ABA-regulated gene expression PlantMol Biol 24 701ndash713
Cheong YH Yoo CM Park JM Ryu GR Goekjian VHNagao RT Key JL Cho MJ and Hong JC (1998) STF1 is a novelTGACG-binding factor with a zinc-finger motif and a bZIP domainwhich heterodimerizes with GBF proteins Plant J 15 199ndash209
Dennis DT and Emes MJ (1990) Regulation by compartmenta-tion In Plant Physiology Biochemistry and Molecular Biology(Dennis DT and Turpin DH eds) pp 45ndash55 London UKLongman Scientific and Technical
Efron B and Tibshirani RJ (1994) Random samples and probabilityIn An Introduction to the Bootstrap pp 17ndash28 Boca Raton FLMonographs on Statistics and Applied Probability
tX
SS
S
NXX
=
minus=
micro
Gene regulation in rice grain filling
copy Blackwell Publishing Ltd Plant Biotechnology Journal (2003) 1 59ndash70
69
Eisen MB Spellman PT Brown PO and Botstein D (1998)Cluster analysis and display of genome-wide expression patternsProc Natl Acad Sci USA 95 14863ndash14868
Ellerstrom M Stalberg K Ezcurra I and Rask L (1996) Functionaldissection of a napin gene promoter identification of promoterelements required for embryo and endosperm-specific transcrip-tion Plant Mol Biol 32 1019ndash1027
Eyal Y Curie C and McCormick S (1995) Pollen specificityelements reside in 30 bp of the proximal promoters of twopollen-expressed genes Plant Cell 7 373ndash384
Fath A Bethke PC and Jones RL (1999) Barley aleurone celldeath is not apoptotic characterization of nuclease activities andDNA degradation Plant J 20 305ndash315
Girke T Todd J Ruuska S White J Benning C and Ohlrogge J(2000) Microarray analysis of developing Arabidopsis seeds PlantPhysiol 124 1570ndash1581
Goff SA Ricke D Lan TH Presting G Wang R Dunn MGlazebrook J Sessions A Oeller P Varma H et al (2002) Adraft sequence of the rice genome (Oryza sativa L ssp japonica)Science 296 92ndash100
Hwang YS Karrer EE Thomas BR Chen L and Rodriguez RL(1998) Three cis-elements required for rice α-amylase Amy3Dexpression during sugar starvation Plant Mol Biol 36 331ndash341
Kim SY Chung HJ and Thomas TL (1997) Isolation of a novelclass of bZIP transcription factors that interact with ABA-responsive and embryo-specification elements in the Dc3 pro-moter using a modified yeast one-hybrid system Plant J 111237ndash1251
Kruger M (1990) Carborhydrate Synthesis and Degradation InPlant Physiology Biochemistry and Molecular Biology (Dennis DTand Turpin DH eds) pp 59ndash76 London Longman Scientificand Technical
Lacombe E Van Doorsselaere J Boerjan W Boudet AMand Grima-Pettenati J (2000) Characterization of cis-elementsrequired for vascular expression of the cinnamoyl CoA reductasegene and for proteinndashDNA complex formation Plant J 23663ndash676
Leubner-Metzger G Petruzzelli L Waldvogel R Vogeli-Lange Rand Meins F Jr (1998) Ethylene-responsive element bindingprotein (EREBP) expression and the transcriptional regulation ofclass I β-13-glucanase during tobacco seed germination PlantMol Biol 38 785ndash795
Lipshultz RJ Fodor SP Gingeras TR and Lockhart DJ (1999)High density synthetic oligonucleotide arrays Nat Genet 2120ndash24
Lockhart DJ Dong H Byrne MC Follettie MT Gallo MVChee MS Mittmann M Wang C Kobayashi M Horton Hand Brown EL (1996) Expression monitoring by hybridization tohigh-density oligonucleotide arrays Nat Biotechnol 14 1675ndash1680
Mazur B Krebbers E and Tingey S (1999) Gene discovery andproduct development for grain quality traits Science 285372ndash375
Mena M Vicente-Carbajosa J Schmidt RJ and Carbonero P(1998) An endosperm-specific DOF protein from barley highlyconserved in wheat binds to and activates transcription fromthe prolamin-box of a native B-hordein promoter in barleyendosperm Plant J 16 53ndash62
Morell MK Blennow A Kosar-Hashemi B and Samuel MS(1997) Differential expression and properties of starch branching
enzyme isoforms in developing wheat endosperm Plant Physiol113 201ndash208
Myers AM Morell MK James MG and Ball SG (2000) Recentprogress toward understanding biosynthesis of the amylopectincrystal Plant Physiol 122 989ndash997
Onodera Y Suzuki A Wu CY Washida H and Takaiwa F(2001) A rice functional transcriptional activator RISBZ1 respon-sible for endosperm-specific expression of storage protein genesthrough GCN4 motif J Biol Chem 276 14139ndash14152
Ren B Robert F Wyrick JJ Aparicio O Jennings EG Simon IZeitlinger J Schreiber J Hannett N Kanin E et al (2000)Genome-wide location and function of DNA binding proteinsScience 290 2306ndash2309
Rose A Meier I and Wienand U (1999) The tomato I-box bindingfactor LeMYBI is a member of a novel class of myb-like proteinsPlant J 20 641ndash652
Roth FP Hughes JD Estep PW and Church GM (1998) FindingDNA regulatory motifs within unaligned noncoding sequencesclustered by whole-genome mRNA quantitation Nat Biotechnol16 939ndash945
Rushton PJ and Somssich IE (1998) Transcriptional control ofplant genes responsive to pathogens Curr Opin Plant Biol 1311ndash315
Ruuska SA Girke T Benning C and Ohlrogge JB (2002)Contrapuntal networks of gene expression during Arabidopsisseed filling Plant Cell 14 1191ndash1206
Shannon JC Pien FM Cao H and Liu KC (1998) Brittle-1 anadenylate translocator facilitates transfer of extraplastidialsynthesized ADPndashglucose into amyloplasts of maize endospermsPlant Physiol 117 1235ndash1252
Singh V Okadome H Toyoshima H Isobe S and Ohtsubo K(2000) Thermal and physicochemical properties of rice grain flourand starch J Agric Food Chem 48 2639ndash2647
Stitt M (1990) The flux of carbon between the chloroplast andcytoplasm In Plant Physiology Biochemistry and MolecularBiology (Dennis DT and Turpin DH eds) pp 309ndash326 LondonLongman Scientific and Technical
Umemoto T Nakamura Y and Ishikura N (1995) Activity of starchsynthase and the amylose content in rice endosperm Phytochem-istry 40 1613ndash1616
Vicente-Carbajosa J Moose SP Parsons RL and Schmidt RJ(1997) A maize zinc-finger protein binds the prolamin box in zeingene promoters and interacts with the basic leucine zippertranscriptional activator Opaque2 Proc Natl Acad Sci USA 947685ndash7690
Wang AY Kao MH Yang WH Sayion Y Liu LF Lee PD andSu JC (1999a) Differentially and developmentally regulatedexpression of three rice sucrose synthase genes Plant Cell Physiol40 800ndash807
Wang RL Stec A Hey J Lukens L and Doebley J (1999b) Thelimits of selection during maize domestication Nature 398236ndash239
Washida H Wu CY Suzuki A Yamanouchi U Akihama THarada K and Takaiwa F (1999) Identification of cis-regulatoryelements required for endosperm expression of the rice storageprotein glutelin gene GluB-1 Plant Mol Biol 40 1ndash12
Wu C Washida H Onodera Y Harada K and Takaiwa F (2000)Quantitative nature of the Prolamin-box ACGT and AACA motifsin a rice glutelin gene promoter minimal cis-element requirementsfor endosperm-specific gene expression Plant J 23 415ndash421
Tong Zhu et al
copy Blackwell Publishing Ltd Plant Biotechnology Journal (2003) 1 59ndash70
70
Ye X Al-Babili S Kloti A Zhang J Lucca P Beyer P andPotrykus I (2000) Engineering the provitamin A (beta-carotene)biosynthetic pathway into (carotenoid-free) rice endospermScience 287 303ndash305
Yen SF Su JC and Sung HY (1994) Purification and character-ization of rice sucrose synthase isozymes Biochem Mol Biol Int34 613ndash620
Yu J Hu S Wang J Wong GK Li S Liu B Deng Y
Dai L Zhou Y Zhang X et al (2002) A draft sequence ofthe rice genome (Oryza sativa L ssp indica) Science 296 79ndash92
Zhu T Budworth P Han B Brown D Chang HS Zou G andWang X (2001) Toward elucidating the global gene expressionpatterns of developing Arabidopsis Parallel analysis of 8300genes by high-density oligonucleotide probe array Plant PhysiolBiochem 39 221ndash242
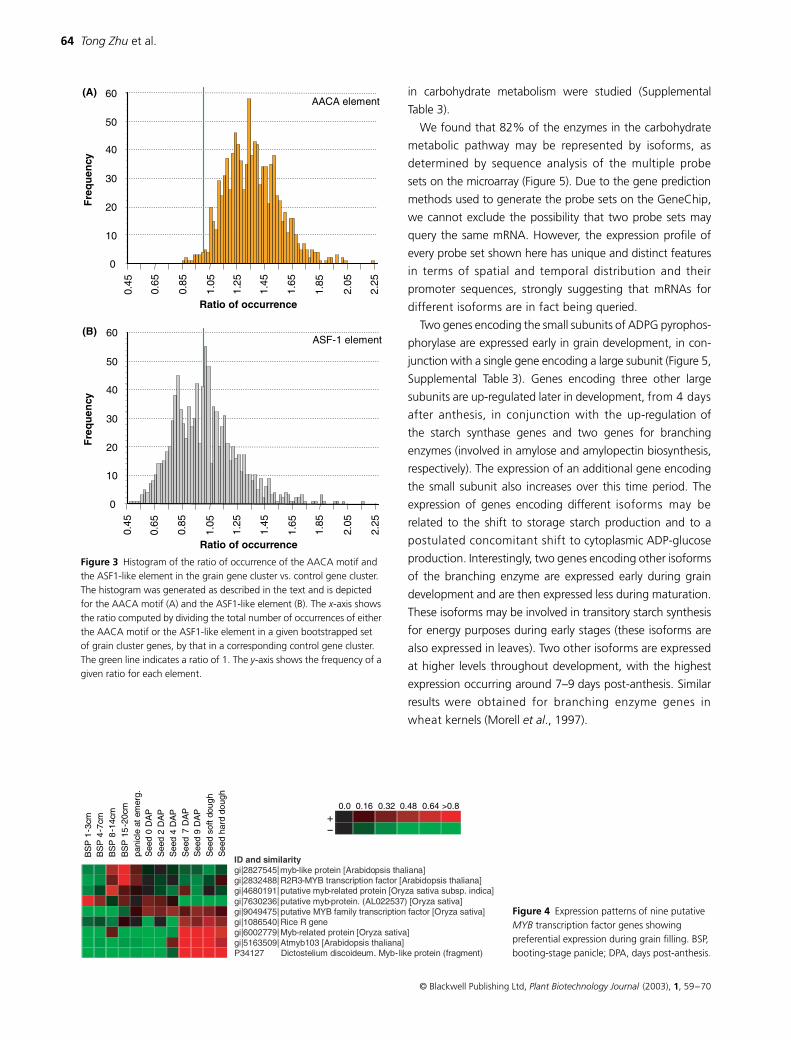
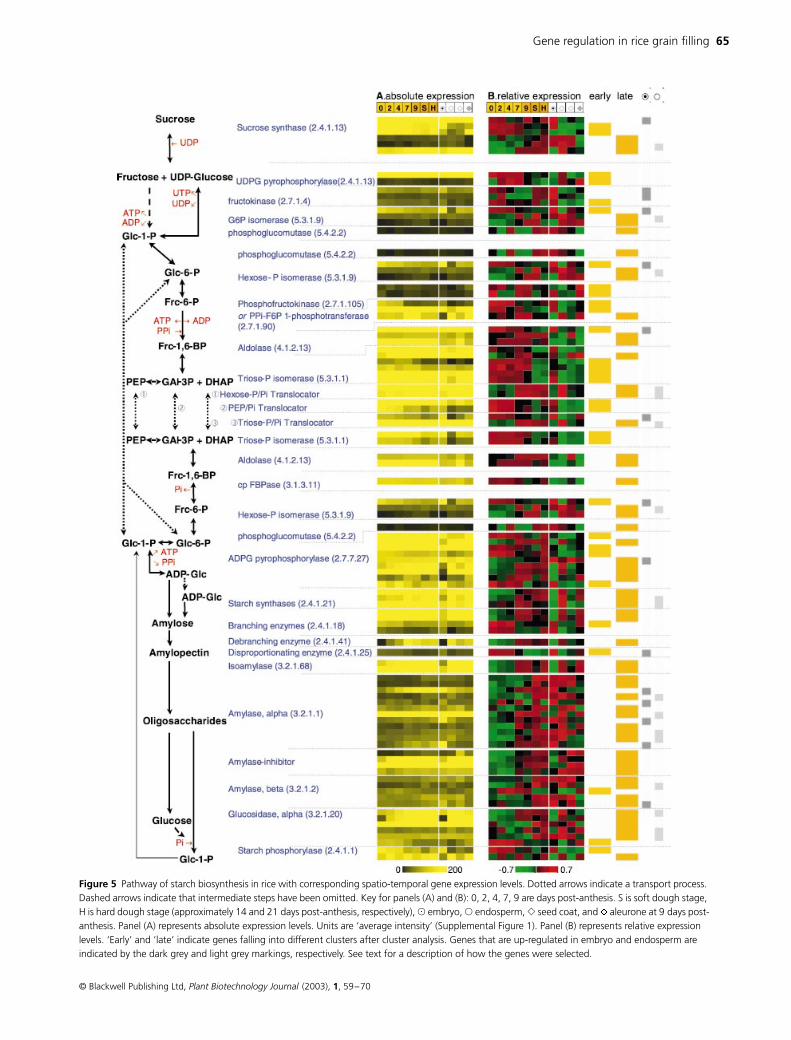
Gene regulation in rice grain filling
copy Blackwell Publishing Ltd Plant Biotechnology Journal (2003) 1 59ndash70
65
Figure 5 Pathway of starch biosynthesis in rice with corresponding spatio-temporal gene expression levels Dotted arrows indicate a transport process Dashed arrows indicate that intermediate steps have been omitted Key for panels (A) and (B) 0 2 4 7 9 are days post-anthesis S is soft dough stage H is hard dough stage (approximately 14 and 21 days post-anthesis respectively) ( embryo s endosperm e seed coat and aleurone at 9 days post-anthesis Panel (A) represents absolute expression levels Units are lsquoaverage intensityrsquo (Supplemental Figure 1) Panel (B) represents relative expression levels lsquoEarlyrsquo and lsquolatersquo indicate genes falling into different clusters after cluster analysis Genes that are up-regulated in embryo and endosperm are indicated by the dark grey and light grey markings respectively See text for a description of how the genes were selected
Tong Zhu et al
copy Blackwell Publishing Ltd Plant Biotechnology Journal (2003) 1 59ndash70
66
We also observed distinct spatial expression patterns for
genes encoding different isoforms (Figure 5) For example
we observed that three different sucrose synthase isoforms
are preferentially expressed in developing grain tissues two
of them are expressed more highly at the start of grain
development (0 days post-anthesis) and one is up-regulated
towards the end of grain development Other isoforms with
low expression in grains are expressed strongly in stems or
roots Among the sucrose synthase isoforms that are
preferentially expressed in grains at least three isoforms with
spatially distinct expression patterns have been reported one
in aleurone another in endosperm and a third in grain
tissues other than the endosperm (Wang et al 1999a Yen
et al 1994) Different amylases and glucosidases were also
found to be expressed in different rice grain tissues (Figure 5)
as previously reported (Awazuhara et al 2000)
The expression of the two genes encoding sucrose
synthase isoforms and one gene encoding small subunits
of ADPG pyrophosphorylase isoforms among the 10 grain
samples was examined by quantitative RT-PCR A high
correlation between the results from rice GeneChip microar-
ray and from quantitative RT-PCR was observed with an
average correlation coefficient of 092 (Supplemental
Figure 2) thus validating the specificity of the probe sets and
our observations based on the microarray results
By examining gene expression in the carbohydrate
metabolic pathway we not only confirmed the presence of
different genes encoding isoforms of the same enzyme in this
pathway during grain development (Awazuhara et al 2000
Wang et al 1999b) but also demonstrated both gene
redundancy and coordinated expression of gene families
The differential expression of various isoforms in this pathway
suggests their functional differences and gives an insight
into how structural gene expression patterns determine the
process of grain filling It suggests that transcription
control is a primary mechanism for determining endosperm
development
Mechanistic shifts suggested by transporter
transcript levels
A cluster analysis of the relative expression levels indicates
that genes encoding carbohydrate metabolic enzymes
can be broadly grouped into two phases early and late grain
development (Figure 5) Often a different gene encodes an
enzyme in each phase One isoform of a triose-phosphate
phosphate translocator is expressed at a higher level during
earlier stages of grain development In contrast two isoforms
of a hexose-phosphate translocator and another isoform of a
triose-phosphate translocator are expressed at higher levels
toward the end of grain filling
To characterize the transcription control of the genes
expressed in early and late phases we searched for common
regulatory cis-elements among the available promoters of these
genes No statistically significant elements were identified
among the promoters of the late gene cluster However a
few elements were identified from the 18 promoters of
31 genes belonging to the early gene cluster (data not shown)
Although we cannot confirm the significance of the presence
of these regulatory elements by bootstrap analysis due to
the small number of available promoters multiple classes
of grain-filling promoters may be involved in fine tuning
the process by differentially regulating the expression of
the subgene groups
Our observations also suggest that different mechanisms
for the synthesis and transport of hexose equivalents occur at
different stages during grain development PEP appears to
play a more important role during early stages of grain devel-
opment because genes encoding two isoforms of a PEP-Pi
translocator are relatively highly expressed at this stage We
still do not know if the majority of hexose equivalents are
transported to the amyloplast during the linear phase of
starch accumulation as ADP-glucose as occurs in maize
endosperm development (Shannon et al 1998) However
the expression of a Brittle homologue does indeed increase
almost twofold during seed development (data not shown)
Conclusions
Our results are consistent with the idea that rice grain filling
is a highly coordinated process The synthesis and transport
of carbohydrates storage proteins and fatty acids are co-
regulated starting at the mRNA level These co-regulated
genes contain an over-represented element the AACA motif
in their promoters We hypothesize that this element along
with other unidentified elements may interact with certain key
transcription factors including those identified in this study
to regulate and coordinate the transcription of nutrient par-
titioning genes during grain filling Within each pathway
the expression levels of genes encoding different isoforms
of enzymes are spatially and temporally defined as shown
with the carbohydrate metabolic pathway demonstrating
an additional fine regulation of gene expression at the
intra-pathway level
The rice genome array used in this study along with the
complete genome information provides a powerful tool for
studying and understanding gene function not only in this
important crop but in other cereal species as well since rice
Gene regulation in rice grain filling
copy Blackwell Publishing Ltd Plant Biotechnology Journal (2003) 1 59ndash70
67
shows great synteny and high sequence similarity with other
cereal genomes (Goff et al 2002)
Experimental procedures
Materials and GeneChip microarray experiments
Nipponbare rice (Oryza sativa L ssp Japonica) was grown in
a greenhouse with a 12 h light cycle at 29 degC during the day
and 21 degC during the night Humidity was maintained at
30 Plants were grown in pots containing 50 Sunshine
mix and 50 nitrohumus Tissues were collected from at
least five plants and pooled for each time point The
samples were homogenized in liquid nitrogen prior to
RNA isolation Immature embryo endosperm aleurone and
seed coat samples were dissected from grains of 88-day-old-
plants For the aleurone layers samples were prepared accord-
ing to a previously described procedure (Fath et al 1999) A
complete sample list and description is listed in Table 2
The experiments were performed as previously described
(Zhu et al 2001) Briefly total RNA was isolated using
Qiagen RNeasy columns (Qiagen Chatsworth CA) and
examined by gel electrophoresis for integrity and by spec-
trometry for purity To ensure data quality only samples with
A260A280 ratios of 19ndash21 were included in the study
Total RNA (5 microg) from each sample was reverse transcribed
at 42 degC for 1 h using 100 pmol of the oligo dT(24) primer
containing a 5prime-T7 RNA polymerase promoter sequence
[5prime-GGCCAGTGAATTGTAATACGACTCACTATAGGGAGGCGG-
(dT)24-3] 50 mM Tris-HCl (pH 83) 75 mM KCl 3 mM MgCl2
10 mM dithiotreitol (DTT) 05 mM dNTPs and 200 units of
SuperScript II reverse transcriptase (Life Technologies) The
second strand of cDNA was synthesized using 40 units
of E coli DNA polymerase I 10 units of E coli DNA ligase
and 2 units of RNase H in a reaction containing 25 mM
Tris-HCl (pH 75) 100 mM KCl 5 mM MgCl2 10 mM (NH4)SO4
015 mM b-NAD+ 1 mM dNTPs and 12 mM DTT The reac-
tion proceeded for 2 h at 16 degC and was terminated using
EDTA Double-stranded cDNA products were purified by
phenolchloroform extraction and ethanol precipitation
Biotinylated complementary RNAs (cRNAs) were tran-
scribed in vitro from synthesized cDNA by T7 RNA Polymerase
(ENZO BioArray High Yield RNA Transcript Labelling Kit Enzo)
cRNAs were purified using affinity resin (Qiagen RNeasy
Spin Columns) and randomly fragmented by incubating
at 94 degC for 35 min in a buffer containing 40 mM Tris-
acetate (pH 81) 100 mM potassium acetate and 30 mM
magnesium acetate to produce molecules of approximately
35ndash200 bases
The labelled samples were mixed with 01 mgmL soni-
cated herring sperm DNA in a hybridization buffer containing
100 mM 2-N-morpholino-ethane-sulphonic acid (MES) 1 M
NaCl 20 mM EDTA 001 Tween 20 denatured at 99 degC for
5 min and equilibrated at 45 degC for 5 min before hybridiza-
tion The hybridization mix was then transferred to the rice
GeneChip microarray cartridge and hybridized at 45 degC for
16 h on a rotisserie at 60 rpm
The hybridized arrays were then rinsed and stained in a
fluidics station (Affymetrix) They were first rinsed with wash
buffer A (6times SSPE (09 M NaCl 006 M NaH2PO4 0006 M
EDTA) 001 Tween 20 0005 Antifoam) at 25 degC for
10 min and incubated with wash buffer B (100 mM MES
01 M NaCl 001 Tween 20) at 50 degC for 20 min then
stained with Streptavidin Phycoerythrin (SAPE) 100 mM MES
1 M NaCl 005 Tween 20 0005 Antifoam 10 mgmL
SAPE 2 mgmL BSA at 25 degC for 10 min washed with wash
buffer A at 25 degC for 20 min and stained with biotinylated
antistreptavidin antibody at 25 degC for 10 min After staining
arrays were stained with SAPE at 25 degC for 10 min and
washed with wash buffer A at 30 degC for 30 min The probe
arrays were scanned twice and the intensities were aver-
aged with an Agilent GeneArray Scanner using GeneChip
Suite 40 (Affymetrix)
Data transformation and cluster analysis
The average intensity of all probe sets of each array was
scaled to 100 so that the hybridization intensity of all arrays
was equivalent Genes encoding products potentially involved
in the transport and synthesis of carbohydrates fatty acids
and storage proteins were selected based on their sequence
homology to known genes Expression levels of the selected
genes were processed before being subjected to cluster
analysis according to the following procedure First any
expression values (average fluorescence signals) that were
less than 5 were adjusted to 5 Then the adjusted expression
values were log2-transformed median centred and normalized
among the selected genes so that the sum of squares for
each expression vector was equal to one in order to better
visualize the change in shape of the profile over time and
space regardless of the magnitude of expression level The
processed data were then used for cluster analysis using
CLUSTER (Eisen et al 1998) with self-organizing maps fol-
lowed by complete linkage hierarchical clustering of both genes
and experiments The results were visualized with TREEVIEW
(Eisen et al 1998)
Data for the putative nutrient partitioning genes (identified
from cluster analysis) that are preferentially expressed during
Tong Zhu et al
copy Blackwell Publishing Ltd Plant Biotechnology Journal (2003) 1 59ndash70
68
grain filling were then imported into GENESPRING (Silicon
Genetics Redwood CA) Genes with similar expression patterns
(ie correlation coefficients greater than 085) as the original
bait genes were further selected and are collectively referred
to as grain filling genes
The confidence of finding 98 grain filling genes was
assessed through bootstrapping the 491 genes 100 times
For each cycle 98 genes were randomly selected from the
491 genes Then Pearson correlation coefficients were
calculated between the average of the 98 randomly selected
genes and that of the 98 grain filling genes and the P-value
was deduced from the 100 Pearson correlation coefficients
using the following equations
Promoter analysis
The promoter sequences of the grain filling genes were iden-
tified by BLAST search of the open reading frame sequences
of these genes against the published predicted rice gene
sequences (Goff et al 2002) The predicted gene sequence
that was the best match with scores greater than 1E-20 was
used to represent the open reading frame The 15 kb regions
upstream from the putative ATG start site were extracted
using a custom Perl script
Analysis of starch biosynthesis pathway
Data series for probe sets were considered for analysis if the
average intensity was above 25 in any sample in the series
(Supplemental Figure 1) The transformed data were then
loaded into GENESPRING (Silicon Genetics Redwood CA) A
pathway for starch biosynthesis and degradation was gener-
ated from several sources (Dennis and Emes 1990 Kruger
1990 Myers et al 2000 Stitt 1990) and was converted to
a GIF file and imported into GeneSpring Expression level
display boxes were drawn on this GIF using the mapping
function in GENESPRING Genes were selected for display at the
appropriate location on this image based on their annotation
(Goff et al 2002) For genes that have a cytoplasmic and a
plastidic isoform the isoforms were differentiated based on
the annotation where possible
Validation of microarray data
Quantitative RT-PCR assays were performed on an ABI Prism
7700 (Applied Biosystems Foster City CA) as previously
described using the primers and probe sets specific to genes
encoding isoform described (Supplemental Figure 2) A
standard curve consisting of serial 1 5 dilutions was
prepared with RNA concentrations of 50 ngmicroL 10 ngmicroL
2 ngmicroL 04 ngmicroL and 008 ngmicroL Relative expression levels
were interpolated by comparison with standard curves with
a correlation coefficient of 099 or greater Relative expres-
sion levels were normalized to the expression level of a rice
polyubiquitin gene in each sample which was expressed at a
constant level All reactions were performed in triplicate
Acknowledgements
We thank T Moughamer and C Martin for rice sequence
selection for the rice GeneChip design We also thank S Goff
and J Glazebrook for a critical reading of this manuscript
Supplementary material
To confirm the conclusions of the paper the supplemental
data can be accessed through the journalrsquos website lthttp
wipblackwellpublishingcomproducts journals suppmatPBI
PBI006PBI006smhtmgt and the authorsrsquo website lthttp
tmriorggene_exp_webgt To get sequence information for
the Sequence IDs (Probe Set IDs) referred in the paper go to
lthttptmriorggene_exp_webrice_probesetshtmlgt and enter
the Sequence ID (eg OS0007591_at OS_ORF006203_at) into
the query template provide
References
Altschul SF Madden TL Schaffer AA Zhang J Zhang ZMiller W and Lipman DJ (1997) Gapped BLAST and PSI-BLASTa new generation of protein database search programs NuclAcids Res 25 3389ndash3402
Awazuhara M Nakagawa A Yamaguchi J Fujiwara T Hayashi HHatae K Chino M and Shimada A (2000) Distribution andcharacterization of enzymes causing starch degradation in rice(Oryza sativa cv koshihikari) J Agric Food Chem 48 245ndash252
Baker SS Wilhelm KS and Thomashow MF (1994) The 5prime-region of Arabidopsis thaliana cor15a has cis-acting elements thatconfer cold- drought- and ABA-regulated gene expression PlantMol Biol 24 701ndash713
Cheong YH Yoo CM Park JM Ryu GR Goekjian VHNagao RT Key JL Cho MJ and Hong JC (1998) STF1 is a novelTGACG-binding factor with a zinc-finger motif and a bZIP domainwhich heterodimerizes with GBF proteins Plant J 15 199ndash209
Dennis DT and Emes MJ (1990) Regulation by compartmenta-tion In Plant Physiology Biochemistry and Molecular Biology(Dennis DT and Turpin DH eds) pp 45ndash55 London UKLongman Scientific and Technical
Efron B and Tibshirani RJ (1994) Random samples and probabilityIn An Introduction to the Bootstrap pp 17ndash28 Boca Raton FLMonographs on Statistics and Applied Probability
tX
SS
S
NXX
=
minus=
micro
Gene regulation in rice grain filling
copy Blackwell Publishing Ltd Plant Biotechnology Journal (2003) 1 59ndash70
69
Eisen MB Spellman PT Brown PO and Botstein D (1998)Cluster analysis and display of genome-wide expression patternsProc Natl Acad Sci USA 95 14863ndash14868
Ellerstrom M Stalberg K Ezcurra I and Rask L (1996) Functionaldissection of a napin gene promoter identification of promoterelements required for embryo and endosperm-specific transcrip-tion Plant Mol Biol 32 1019ndash1027
Eyal Y Curie C and McCormick S (1995) Pollen specificityelements reside in 30 bp of the proximal promoters of twopollen-expressed genes Plant Cell 7 373ndash384
Fath A Bethke PC and Jones RL (1999) Barley aleurone celldeath is not apoptotic characterization of nuclease activities andDNA degradation Plant J 20 305ndash315
Girke T Todd J Ruuska S White J Benning C and Ohlrogge J(2000) Microarray analysis of developing Arabidopsis seeds PlantPhysiol 124 1570ndash1581
Goff SA Ricke D Lan TH Presting G Wang R Dunn MGlazebrook J Sessions A Oeller P Varma H et al (2002) Adraft sequence of the rice genome (Oryza sativa L ssp japonica)Science 296 92ndash100
Hwang YS Karrer EE Thomas BR Chen L and Rodriguez RL(1998) Three cis-elements required for rice α-amylase Amy3Dexpression during sugar starvation Plant Mol Biol 36 331ndash341
Kim SY Chung HJ and Thomas TL (1997) Isolation of a novelclass of bZIP transcription factors that interact with ABA-responsive and embryo-specification elements in the Dc3 pro-moter using a modified yeast one-hybrid system Plant J 111237ndash1251
Kruger M (1990) Carborhydrate Synthesis and Degradation InPlant Physiology Biochemistry and Molecular Biology (Dennis DTand Turpin DH eds) pp 59ndash76 London Longman Scientificand Technical
Lacombe E Van Doorsselaere J Boerjan W Boudet AMand Grima-Pettenati J (2000) Characterization of cis-elementsrequired for vascular expression of the cinnamoyl CoA reductasegene and for proteinndashDNA complex formation Plant J 23663ndash676
Leubner-Metzger G Petruzzelli L Waldvogel R Vogeli-Lange Rand Meins F Jr (1998) Ethylene-responsive element bindingprotein (EREBP) expression and the transcriptional regulation ofclass I β-13-glucanase during tobacco seed germination PlantMol Biol 38 785ndash795
Lipshultz RJ Fodor SP Gingeras TR and Lockhart DJ (1999)High density synthetic oligonucleotide arrays Nat Genet 2120ndash24
Lockhart DJ Dong H Byrne MC Follettie MT Gallo MVChee MS Mittmann M Wang C Kobayashi M Horton Hand Brown EL (1996) Expression monitoring by hybridization tohigh-density oligonucleotide arrays Nat Biotechnol 14 1675ndash1680
Mazur B Krebbers E and Tingey S (1999) Gene discovery andproduct development for grain quality traits Science 285372ndash375
Mena M Vicente-Carbajosa J Schmidt RJ and Carbonero P(1998) An endosperm-specific DOF protein from barley highlyconserved in wheat binds to and activates transcription fromthe prolamin-box of a native B-hordein promoter in barleyendosperm Plant J 16 53ndash62
Morell MK Blennow A Kosar-Hashemi B and Samuel MS(1997) Differential expression and properties of starch branching
enzyme isoforms in developing wheat endosperm Plant Physiol113 201ndash208
Myers AM Morell MK James MG and Ball SG (2000) Recentprogress toward understanding biosynthesis of the amylopectincrystal Plant Physiol 122 989ndash997
Onodera Y Suzuki A Wu CY Washida H and Takaiwa F(2001) A rice functional transcriptional activator RISBZ1 respon-sible for endosperm-specific expression of storage protein genesthrough GCN4 motif J Biol Chem 276 14139ndash14152
Ren B Robert F Wyrick JJ Aparicio O Jennings EG Simon IZeitlinger J Schreiber J Hannett N Kanin E et al (2000)Genome-wide location and function of DNA binding proteinsScience 290 2306ndash2309
Rose A Meier I and Wienand U (1999) The tomato I-box bindingfactor LeMYBI is a member of a novel class of myb-like proteinsPlant J 20 641ndash652
Roth FP Hughes JD Estep PW and Church GM (1998) FindingDNA regulatory motifs within unaligned noncoding sequencesclustered by whole-genome mRNA quantitation Nat Biotechnol16 939ndash945
Rushton PJ and Somssich IE (1998) Transcriptional control ofplant genes responsive to pathogens Curr Opin Plant Biol 1311ndash315
Ruuska SA Girke T Benning C and Ohlrogge JB (2002)Contrapuntal networks of gene expression during Arabidopsisseed filling Plant Cell 14 1191ndash1206
Shannon JC Pien FM Cao H and Liu KC (1998) Brittle-1 anadenylate translocator facilitates transfer of extraplastidialsynthesized ADPndashglucose into amyloplasts of maize endospermsPlant Physiol 117 1235ndash1252
Singh V Okadome H Toyoshima H Isobe S and Ohtsubo K(2000) Thermal and physicochemical properties of rice grain flourand starch J Agric Food Chem 48 2639ndash2647
Stitt M (1990) The flux of carbon between the chloroplast andcytoplasm In Plant Physiology Biochemistry and MolecularBiology (Dennis DT and Turpin DH eds) pp 309ndash326 LondonLongman Scientific and Technical
Umemoto T Nakamura Y and Ishikura N (1995) Activity of starchsynthase and the amylose content in rice endosperm Phytochem-istry 40 1613ndash1616
Vicente-Carbajosa J Moose SP Parsons RL and Schmidt RJ(1997) A maize zinc-finger protein binds the prolamin box in zeingene promoters and interacts with the basic leucine zippertranscriptional activator Opaque2 Proc Natl Acad Sci USA 947685ndash7690
Wang AY Kao MH Yang WH Sayion Y Liu LF Lee PD andSu JC (1999a) Differentially and developmentally regulatedexpression of three rice sucrose synthase genes Plant Cell Physiol40 800ndash807
Wang RL Stec A Hey J Lukens L and Doebley J (1999b) Thelimits of selection during maize domestication Nature 398236ndash239
Washida H Wu CY Suzuki A Yamanouchi U Akihama THarada K and Takaiwa F (1999) Identification of cis-regulatoryelements required for endosperm expression of the rice storageprotein glutelin gene GluB-1 Plant Mol Biol 40 1ndash12
Wu C Washida H Onodera Y Harada K and Takaiwa F (2000)Quantitative nature of the Prolamin-box ACGT and AACA motifsin a rice glutelin gene promoter minimal cis-element requirementsfor endosperm-specific gene expression Plant J 23 415ndash421
Tong Zhu et al
copy Blackwell Publishing Ltd Plant Biotechnology Journal (2003) 1 59ndash70
70
Ye X Al-Babili S Kloti A Zhang J Lucca P Beyer P andPotrykus I (2000) Engineering the provitamin A (beta-carotene)biosynthetic pathway into (carotenoid-free) rice endospermScience 287 303ndash305
Yen SF Su JC and Sung HY (1994) Purification and character-ization of rice sucrose synthase isozymes Biochem Mol Biol Int34 613ndash620
Yu J Hu S Wang J Wong GK Li S Liu B Deng Y
Dai L Zhou Y Zhang X et al (2002) A draft sequence ofthe rice genome (Oryza sativa L ssp indica) Science 296 79ndash92
Zhu T Budworth P Han B Brown D Chang HS Zou G andWang X (2001) Toward elucidating the global gene expressionpatterns of developing Arabidopsis Parallel analysis of 8300genes by high-density oligonucleotide probe array Plant PhysiolBiochem 39 221ndash242
Tong Zhu et al
copy Blackwell Publishing Ltd Plant Biotechnology Journal (2003) 1 59ndash70
66
We also observed distinct spatial expression patterns for
genes encoding different isoforms (Figure 5) For example
we observed that three different sucrose synthase isoforms
are preferentially expressed in developing grain tissues two
of them are expressed more highly at the start of grain
development (0 days post-anthesis) and one is up-regulated
towards the end of grain development Other isoforms with
low expression in grains are expressed strongly in stems or
roots Among the sucrose synthase isoforms that are
preferentially expressed in grains at least three isoforms with
spatially distinct expression patterns have been reported one
in aleurone another in endosperm and a third in grain
tissues other than the endosperm (Wang et al 1999a Yen
et al 1994) Different amylases and glucosidases were also
found to be expressed in different rice grain tissues (Figure 5)
as previously reported (Awazuhara et al 2000)
The expression of the two genes encoding sucrose
synthase isoforms and one gene encoding small subunits
of ADPG pyrophosphorylase isoforms among the 10 grain
samples was examined by quantitative RT-PCR A high
correlation between the results from rice GeneChip microar-
ray and from quantitative RT-PCR was observed with an
average correlation coefficient of 092 (Supplemental
Figure 2) thus validating the specificity of the probe sets and
our observations based on the microarray results
By examining gene expression in the carbohydrate
metabolic pathway we not only confirmed the presence of
different genes encoding isoforms of the same enzyme in this
pathway during grain development (Awazuhara et al 2000
Wang et al 1999b) but also demonstrated both gene
redundancy and coordinated expression of gene families
The differential expression of various isoforms in this pathway
suggests their functional differences and gives an insight
into how structural gene expression patterns determine the
process of grain filling It suggests that transcription
control is a primary mechanism for determining endosperm
development
Mechanistic shifts suggested by transporter
transcript levels
A cluster analysis of the relative expression levels indicates
that genes encoding carbohydrate metabolic enzymes
can be broadly grouped into two phases early and late grain
development (Figure 5) Often a different gene encodes an
enzyme in each phase One isoform of a triose-phosphate
phosphate translocator is expressed at a higher level during
earlier stages of grain development In contrast two isoforms
of a hexose-phosphate translocator and another isoform of a
triose-phosphate translocator are expressed at higher levels
toward the end of grain filling
To characterize the transcription control of the genes
expressed in early and late phases we searched for common
regulatory cis-elements among the available promoters of these
genes No statistically significant elements were identified
among the promoters of the late gene cluster However a
few elements were identified from the 18 promoters of
31 genes belonging to the early gene cluster (data not shown)
Although we cannot confirm the significance of the presence
of these regulatory elements by bootstrap analysis due to
the small number of available promoters multiple classes
of grain-filling promoters may be involved in fine tuning
the process by differentially regulating the expression of
the subgene groups
Our observations also suggest that different mechanisms
for the synthesis and transport of hexose equivalents occur at
different stages during grain development PEP appears to
play a more important role during early stages of grain devel-
opment because genes encoding two isoforms of a PEP-Pi
translocator are relatively highly expressed at this stage We
still do not know if the majority of hexose equivalents are
transported to the amyloplast during the linear phase of
starch accumulation as ADP-glucose as occurs in maize
endosperm development (Shannon et al 1998) However
the expression of a Brittle homologue does indeed increase
almost twofold during seed development (data not shown)
Conclusions
Our results are consistent with the idea that rice grain filling
is a highly coordinated process The synthesis and transport
of carbohydrates storage proteins and fatty acids are co-
regulated starting at the mRNA level These co-regulated
genes contain an over-represented element the AACA motif
in their promoters We hypothesize that this element along
with other unidentified elements may interact with certain key
transcription factors including those identified in this study
to regulate and coordinate the transcription of nutrient par-
titioning genes during grain filling Within each pathway
the expression levels of genes encoding different isoforms
of enzymes are spatially and temporally defined as shown
with the carbohydrate metabolic pathway demonstrating
an additional fine regulation of gene expression at the
intra-pathway level
The rice genome array used in this study along with the
complete genome information provides a powerful tool for
studying and understanding gene function not only in this
important crop but in other cereal species as well since rice
Gene regulation in rice grain filling
copy Blackwell Publishing Ltd Plant Biotechnology Journal (2003) 1 59ndash70
67
shows great synteny and high sequence similarity with other
cereal genomes (Goff et al 2002)
Experimental procedures
Materials and GeneChip microarray experiments
Nipponbare rice (Oryza sativa L ssp Japonica) was grown in
a greenhouse with a 12 h light cycle at 29 degC during the day
and 21 degC during the night Humidity was maintained at
30 Plants were grown in pots containing 50 Sunshine
mix and 50 nitrohumus Tissues were collected from at
least five plants and pooled for each time point The
samples were homogenized in liquid nitrogen prior to
RNA isolation Immature embryo endosperm aleurone and
seed coat samples were dissected from grains of 88-day-old-
plants For the aleurone layers samples were prepared accord-
ing to a previously described procedure (Fath et al 1999) A
complete sample list and description is listed in Table 2
The experiments were performed as previously described
(Zhu et al 2001) Briefly total RNA was isolated using
Qiagen RNeasy columns (Qiagen Chatsworth CA) and
examined by gel electrophoresis for integrity and by spec-
trometry for purity To ensure data quality only samples with
A260A280 ratios of 19ndash21 were included in the study
Total RNA (5 microg) from each sample was reverse transcribed
at 42 degC for 1 h using 100 pmol of the oligo dT(24) primer
containing a 5prime-T7 RNA polymerase promoter sequence
[5prime-GGCCAGTGAATTGTAATACGACTCACTATAGGGAGGCGG-
(dT)24-3] 50 mM Tris-HCl (pH 83) 75 mM KCl 3 mM MgCl2
10 mM dithiotreitol (DTT) 05 mM dNTPs and 200 units of
SuperScript II reverse transcriptase (Life Technologies) The
second strand of cDNA was synthesized using 40 units
of E coli DNA polymerase I 10 units of E coli DNA ligase
and 2 units of RNase H in a reaction containing 25 mM
Tris-HCl (pH 75) 100 mM KCl 5 mM MgCl2 10 mM (NH4)SO4
015 mM b-NAD+ 1 mM dNTPs and 12 mM DTT The reac-
tion proceeded for 2 h at 16 degC and was terminated using
EDTA Double-stranded cDNA products were purified by
phenolchloroform extraction and ethanol precipitation
Biotinylated complementary RNAs (cRNAs) were tran-
scribed in vitro from synthesized cDNA by T7 RNA Polymerase
(ENZO BioArray High Yield RNA Transcript Labelling Kit Enzo)
cRNAs were purified using affinity resin (Qiagen RNeasy
Spin Columns) and randomly fragmented by incubating
at 94 degC for 35 min in a buffer containing 40 mM Tris-
acetate (pH 81) 100 mM potassium acetate and 30 mM
magnesium acetate to produce molecules of approximately
35ndash200 bases
The labelled samples were mixed with 01 mgmL soni-
cated herring sperm DNA in a hybridization buffer containing
100 mM 2-N-morpholino-ethane-sulphonic acid (MES) 1 M
NaCl 20 mM EDTA 001 Tween 20 denatured at 99 degC for
5 min and equilibrated at 45 degC for 5 min before hybridiza-
tion The hybridization mix was then transferred to the rice
GeneChip microarray cartridge and hybridized at 45 degC for
16 h on a rotisserie at 60 rpm
The hybridized arrays were then rinsed and stained in a
fluidics station (Affymetrix) They were first rinsed with wash
buffer A (6times SSPE (09 M NaCl 006 M NaH2PO4 0006 M
EDTA) 001 Tween 20 0005 Antifoam) at 25 degC for
10 min and incubated with wash buffer B (100 mM MES
01 M NaCl 001 Tween 20) at 50 degC for 20 min then
stained with Streptavidin Phycoerythrin (SAPE) 100 mM MES
1 M NaCl 005 Tween 20 0005 Antifoam 10 mgmL
SAPE 2 mgmL BSA at 25 degC for 10 min washed with wash
buffer A at 25 degC for 20 min and stained with biotinylated
antistreptavidin antibody at 25 degC for 10 min After staining
arrays were stained with SAPE at 25 degC for 10 min and
washed with wash buffer A at 30 degC for 30 min The probe
arrays were scanned twice and the intensities were aver-
aged with an Agilent GeneArray Scanner using GeneChip
Suite 40 (Affymetrix)
Data transformation and cluster analysis
The average intensity of all probe sets of each array was
scaled to 100 so that the hybridization intensity of all arrays
was equivalent Genes encoding products potentially involved
in the transport and synthesis of carbohydrates fatty acids
and storage proteins were selected based on their sequence
homology to known genes Expression levels of the selected
genes were processed before being subjected to cluster
analysis according to the following procedure First any
expression values (average fluorescence signals) that were
less than 5 were adjusted to 5 Then the adjusted expression
values were log2-transformed median centred and normalized
among the selected genes so that the sum of squares for
each expression vector was equal to one in order to better
visualize the change in shape of the profile over time and
space regardless of the magnitude of expression level The
processed data were then used for cluster analysis using
CLUSTER (Eisen et al 1998) with self-organizing maps fol-
lowed by complete linkage hierarchical clustering of both genes
and experiments The results were visualized with TREEVIEW
(Eisen et al 1998)
Data for the putative nutrient partitioning genes (identified
from cluster analysis) that are preferentially expressed during
Tong Zhu et al
copy Blackwell Publishing Ltd Plant Biotechnology Journal (2003) 1 59ndash70
68
grain filling were then imported into GENESPRING (Silicon
Genetics Redwood CA) Genes with similar expression patterns
(ie correlation coefficients greater than 085) as the original
bait genes were further selected and are collectively referred
to as grain filling genes
The confidence of finding 98 grain filling genes was
assessed through bootstrapping the 491 genes 100 times
For each cycle 98 genes were randomly selected from the
491 genes Then Pearson correlation coefficients were
calculated between the average of the 98 randomly selected
genes and that of the 98 grain filling genes and the P-value
was deduced from the 100 Pearson correlation coefficients
using the following equations
Promoter analysis
The promoter sequences of the grain filling genes were iden-
tified by BLAST search of the open reading frame sequences
of these genes against the published predicted rice gene
sequences (Goff et al 2002) The predicted gene sequence
that was the best match with scores greater than 1E-20 was
used to represent the open reading frame The 15 kb regions
upstream from the putative ATG start site were extracted
using a custom Perl script
Analysis of starch biosynthesis pathway
Data series for probe sets were considered for analysis if the
average intensity was above 25 in any sample in the series
(Supplemental Figure 1) The transformed data were then
loaded into GENESPRING (Silicon Genetics Redwood CA) A
pathway for starch biosynthesis and degradation was gener-
ated from several sources (Dennis and Emes 1990 Kruger
1990 Myers et al 2000 Stitt 1990) and was converted to
a GIF file and imported into GeneSpring Expression level
display boxes were drawn on this GIF using the mapping
function in GENESPRING Genes were selected for display at the
appropriate location on this image based on their annotation
(Goff et al 2002) For genes that have a cytoplasmic and a
plastidic isoform the isoforms were differentiated based on
the annotation where possible
Validation of microarray data
Quantitative RT-PCR assays were performed on an ABI Prism
7700 (Applied Biosystems Foster City CA) as previously
described using the primers and probe sets specific to genes
encoding isoform described (Supplemental Figure 2) A
standard curve consisting of serial 1 5 dilutions was
prepared with RNA concentrations of 50 ngmicroL 10 ngmicroL
2 ngmicroL 04 ngmicroL and 008 ngmicroL Relative expression levels
were interpolated by comparison with standard curves with
a correlation coefficient of 099 or greater Relative expres-
sion levels were normalized to the expression level of a rice
polyubiquitin gene in each sample which was expressed at a
constant level All reactions were performed in triplicate
Acknowledgements
We thank T Moughamer and C Martin for rice sequence
selection for the rice GeneChip design We also thank S Goff
and J Glazebrook for a critical reading of this manuscript
Supplementary material
To confirm the conclusions of the paper the supplemental
data can be accessed through the journalrsquos website lthttp
wipblackwellpublishingcomproducts journals suppmatPBI
PBI006PBI006smhtmgt and the authorsrsquo website lthttp
tmriorggene_exp_webgt To get sequence information for
the Sequence IDs (Probe Set IDs) referred in the paper go to
lthttptmriorggene_exp_webrice_probesetshtmlgt and enter
the Sequence ID (eg OS0007591_at OS_ORF006203_at) into
the query template provide
References
Altschul SF Madden TL Schaffer AA Zhang J Zhang ZMiller W and Lipman DJ (1997) Gapped BLAST and PSI-BLASTa new generation of protein database search programs NuclAcids Res 25 3389ndash3402
Awazuhara M Nakagawa A Yamaguchi J Fujiwara T Hayashi HHatae K Chino M and Shimada A (2000) Distribution andcharacterization of enzymes causing starch degradation in rice(Oryza sativa cv koshihikari) J Agric Food Chem 48 245ndash252
Baker SS Wilhelm KS and Thomashow MF (1994) The 5prime-region of Arabidopsis thaliana cor15a has cis-acting elements thatconfer cold- drought- and ABA-regulated gene expression PlantMol Biol 24 701ndash713
Cheong YH Yoo CM Park JM Ryu GR Goekjian VHNagao RT Key JL Cho MJ and Hong JC (1998) STF1 is a novelTGACG-binding factor with a zinc-finger motif and a bZIP domainwhich heterodimerizes with GBF proteins Plant J 15 199ndash209
Dennis DT and Emes MJ (1990) Regulation by compartmenta-tion In Plant Physiology Biochemistry and Molecular Biology(Dennis DT and Turpin DH eds) pp 45ndash55 London UKLongman Scientific and Technical
Efron B and Tibshirani RJ (1994) Random samples and probabilityIn An Introduction to the Bootstrap pp 17ndash28 Boca Raton FLMonographs on Statistics and Applied Probability
tX
SS
S
NXX
=
minus=
micro
Gene regulation in rice grain filling
copy Blackwell Publishing Ltd Plant Biotechnology Journal (2003) 1 59ndash70
69
Eisen MB Spellman PT Brown PO and Botstein D (1998)Cluster analysis and display of genome-wide expression patternsProc Natl Acad Sci USA 95 14863ndash14868
Ellerstrom M Stalberg K Ezcurra I and Rask L (1996) Functionaldissection of a napin gene promoter identification of promoterelements required for embryo and endosperm-specific transcrip-tion Plant Mol Biol 32 1019ndash1027
Eyal Y Curie C and McCormick S (1995) Pollen specificityelements reside in 30 bp of the proximal promoters of twopollen-expressed genes Plant Cell 7 373ndash384
Fath A Bethke PC and Jones RL (1999) Barley aleurone celldeath is not apoptotic characterization of nuclease activities andDNA degradation Plant J 20 305ndash315
Girke T Todd J Ruuska S White J Benning C and Ohlrogge J(2000) Microarray analysis of developing Arabidopsis seeds PlantPhysiol 124 1570ndash1581
Goff SA Ricke D Lan TH Presting G Wang R Dunn MGlazebrook J Sessions A Oeller P Varma H et al (2002) Adraft sequence of the rice genome (Oryza sativa L ssp japonica)Science 296 92ndash100
Hwang YS Karrer EE Thomas BR Chen L and Rodriguez RL(1998) Three cis-elements required for rice α-amylase Amy3Dexpression during sugar starvation Plant Mol Biol 36 331ndash341
Kim SY Chung HJ and Thomas TL (1997) Isolation of a novelclass of bZIP transcription factors that interact with ABA-responsive and embryo-specification elements in the Dc3 pro-moter using a modified yeast one-hybrid system Plant J 111237ndash1251
Kruger M (1990) Carborhydrate Synthesis and Degradation InPlant Physiology Biochemistry and Molecular Biology (Dennis DTand Turpin DH eds) pp 59ndash76 London Longman Scientificand Technical
Lacombe E Van Doorsselaere J Boerjan W Boudet AMand Grima-Pettenati J (2000) Characterization of cis-elementsrequired for vascular expression of the cinnamoyl CoA reductasegene and for proteinndashDNA complex formation Plant J 23663ndash676
Leubner-Metzger G Petruzzelli L Waldvogel R Vogeli-Lange Rand Meins F Jr (1998) Ethylene-responsive element bindingprotein (EREBP) expression and the transcriptional regulation ofclass I β-13-glucanase during tobacco seed germination PlantMol Biol 38 785ndash795
Lipshultz RJ Fodor SP Gingeras TR and Lockhart DJ (1999)High density synthetic oligonucleotide arrays Nat Genet 2120ndash24
Lockhart DJ Dong H Byrne MC Follettie MT Gallo MVChee MS Mittmann M Wang C Kobayashi M Horton Hand Brown EL (1996) Expression monitoring by hybridization tohigh-density oligonucleotide arrays Nat Biotechnol 14 1675ndash1680
Mazur B Krebbers E and Tingey S (1999) Gene discovery andproduct development for grain quality traits Science 285372ndash375
Mena M Vicente-Carbajosa J Schmidt RJ and Carbonero P(1998) An endosperm-specific DOF protein from barley highlyconserved in wheat binds to and activates transcription fromthe prolamin-box of a native B-hordein promoter in barleyendosperm Plant J 16 53ndash62
Morell MK Blennow A Kosar-Hashemi B and Samuel MS(1997) Differential expression and properties of starch branching
enzyme isoforms in developing wheat endosperm Plant Physiol113 201ndash208
Myers AM Morell MK James MG and Ball SG (2000) Recentprogress toward understanding biosynthesis of the amylopectincrystal Plant Physiol 122 989ndash997
Onodera Y Suzuki A Wu CY Washida H and Takaiwa F(2001) A rice functional transcriptional activator RISBZ1 respon-sible for endosperm-specific expression of storage protein genesthrough GCN4 motif J Biol Chem 276 14139ndash14152
Ren B Robert F Wyrick JJ Aparicio O Jennings EG Simon IZeitlinger J Schreiber J Hannett N Kanin E et al (2000)Genome-wide location and function of DNA binding proteinsScience 290 2306ndash2309
Rose A Meier I and Wienand U (1999) The tomato I-box bindingfactor LeMYBI is a member of a novel class of myb-like proteinsPlant J 20 641ndash652
Roth FP Hughes JD Estep PW and Church GM (1998) FindingDNA regulatory motifs within unaligned noncoding sequencesclustered by whole-genome mRNA quantitation Nat Biotechnol16 939ndash945
Rushton PJ and Somssich IE (1998) Transcriptional control ofplant genes responsive to pathogens Curr Opin Plant Biol 1311ndash315
Ruuska SA Girke T Benning C and Ohlrogge JB (2002)Contrapuntal networks of gene expression during Arabidopsisseed filling Plant Cell 14 1191ndash1206
Shannon JC Pien FM Cao H and Liu KC (1998) Brittle-1 anadenylate translocator facilitates transfer of extraplastidialsynthesized ADPndashglucose into amyloplasts of maize endospermsPlant Physiol 117 1235ndash1252
Singh V Okadome H Toyoshima H Isobe S and Ohtsubo K(2000) Thermal and physicochemical properties of rice grain flourand starch J Agric Food Chem 48 2639ndash2647
Stitt M (1990) The flux of carbon between the chloroplast andcytoplasm In Plant Physiology Biochemistry and MolecularBiology (Dennis DT and Turpin DH eds) pp 309ndash326 LondonLongman Scientific and Technical
Umemoto T Nakamura Y and Ishikura N (1995) Activity of starchsynthase and the amylose content in rice endosperm Phytochem-istry 40 1613ndash1616
Vicente-Carbajosa J Moose SP Parsons RL and Schmidt RJ(1997) A maize zinc-finger protein binds the prolamin box in zeingene promoters and interacts with the basic leucine zippertranscriptional activator Opaque2 Proc Natl Acad Sci USA 947685ndash7690
Wang AY Kao MH Yang WH Sayion Y Liu LF Lee PD andSu JC (1999a) Differentially and developmentally regulatedexpression of three rice sucrose synthase genes Plant Cell Physiol40 800ndash807
Wang RL Stec A Hey J Lukens L and Doebley J (1999b) Thelimits of selection during maize domestication Nature 398236ndash239
Washida H Wu CY Suzuki A Yamanouchi U Akihama THarada K and Takaiwa F (1999) Identification of cis-regulatoryelements required for endosperm expression of the rice storageprotein glutelin gene GluB-1 Plant Mol Biol 40 1ndash12
Wu C Washida H Onodera Y Harada K and Takaiwa F (2000)Quantitative nature of the Prolamin-box ACGT and AACA motifsin a rice glutelin gene promoter minimal cis-element requirementsfor endosperm-specific gene expression Plant J 23 415ndash421
Tong Zhu et al
copy Blackwell Publishing Ltd Plant Biotechnology Journal (2003) 1 59ndash70
70
Ye X Al-Babili S Kloti A Zhang J Lucca P Beyer P andPotrykus I (2000) Engineering the provitamin A (beta-carotene)biosynthetic pathway into (carotenoid-free) rice endospermScience 287 303ndash305
Yen SF Su JC and Sung HY (1994) Purification and character-ization of rice sucrose synthase isozymes Biochem Mol Biol Int34 613ndash620
Yu J Hu S Wang J Wong GK Li S Liu B Deng Y
Dai L Zhou Y Zhang X et al (2002) A draft sequence ofthe rice genome (Oryza sativa L ssp indica) Science 296 79ndash92
Zhu T Budworth P Han B Brown D Chang HS Zou G andWang X (2001) Toward elucidating the global gene expressionpatterns of developing Arabidopsis Parallel analysis of 8300genes by high-density oligonucleotide probe array Plant PhysiolBiochem 39 221ndash242
Gene regulation in rice grain filling
copy Blackwell Publishing Ltd Plant Biotechnology Journal (2003) 1 59ndash70
67
shows great synteny and high sequence similarity with other
cereal genomes (Goff et al 2002)
Experimental procedures
Materials and GeneChip microarray experiments
Nipponbare rice (Oryza sativa L ssp Japonica) was grown in
a greenhouse with a 12 h light cycle at 29 degC during the day
and 21 degC during the night Humidity was maintained at
30 Plants were grown in pots containing 50 Sunshine
mix and 50 nitrohumus Tissues were collected from at
least five plants and pooled for each time point The
samples were homogenized in liquid nitrogen prior to
RNA isolation Immature embryo endosperm aleurone and
seed coat samples were dissected from grains of 88-day-old-
plants For the aleurone layers samples were prepared accord-
ing to a previously described procedure (Fath et al 1999) A
complete sample list and description is listed in Table 2
The experiments were performed as previously described
(Zhu et al 2001) Briefly total RNA was isolated using
Qiagen RNeasy columns (Qiagen Chatsworth CA) and
examined by gel electrophoresis for integrity and by spec-
trometry for purity To ensure data quality only samples with
A260A280 ratios of 19ndash21 were included in the study
Total RNA (5 microg) from each sample was reverse transcribed
at 42 degC for 1 h using 100 pmol of the oligo dT(24) primer
containing a 5prime-T7 RNA polymerase promoter sequence
[5prime-GGCCAGTGAATTGTAATACGACTCACTATAGGGAGGCGG-
(dT)24-3] 50 mM Tris-HCl (pH 83) 75 mM KCl 3 mM MgCl2
10 mM dithiotreitol (DTT) 05 mM dNTPs and 200 units of
SuperScript II reverse transcriptase (Life Technologies) The
second strand of cDNA was synthesized using 40 units
of E coli DNA polymerase I 10 units of E coli DNA ligase
and 2 units of RNase H in a reaction containing 25 mM
Tris-HCl (pH 75) 100 mM KCl 5 mM MgCl2 10 mM (NH4)SO4
015 mM b-NAD+ 1 mM dNTPs and 12 mM DTT The reac-
tion proceeded for 2 h at 16 degC and was terminated using
EDTA Double-stranded cDNA products were purified by
phenolchloroform extraction and ethanol precipitation
Biotinylated complementary RNAs (cRNAs) were tran-
scribed in vitro from synthesized cDNA by T7 RNA Polymerase
(ENZO BioArray High Yield RNA Transcript Labelling Kit Enzo)
cRNAs were purified using affinity resin (Qiagen RNeasy
Spin Columns) and randomly fragmented by incubating
at 94 degC for 35 min in a buffer containing 40 mM Tris-
acetate (pH 81) 100 mM potassium acetate and 30 mM
magnesium acetate to produce molecules of approximately
35ndash200 bases
The labelled samples were mixed with 01 mgmL soni-
cated herring sperm DNA in a hybridization buffer containing
100 mM 2-N-morpholino-ethane-sulphonic acid (MES) 1 M
NaCl 20 mM EDTA 001 Tween 20 denatured at 99 degC for
5 min and equilibrated at 45 degC for 5 min before hybridiza-
tion The hybridization mix was then transferred to the rice
GeneChip microarray cartridge and hybridized at 45 degC for
16 h on a rotisserie at 60 rpm
The hybridized arrays were then rinsed and stained in a
fluidics station (Affymetrix) They were first rinsed with wash
buffer A (6times SSPE (09 M NaCl 006 M NaH2PO4 0006 M
EDTA) 001 Tween 20 0005 Antifoam) at 25 degC for
10 min and incubated with wash buffer B (100 mM MES
01 M NaCl 001 Tween 20) at 50 degC for 20 min then
stained with Streptavidin Phycoerythrin (SAPE) 100 mM MES
1 M NaCl 005 Tween 20 0005 Antifoam 10 mgmL
SAPE 2 mgmL BSA at 25 degC for 10 min washed with wash
buffer A at 25 degC for 20 min and stained with biotinylated
antistreptavidin antibody at 25 degC for 10 min After staining
arrays were stained with SAPE at 25 degC for 10 min and
washed with wash buffer A at 30 degC for 30 min The probe
arrays were scanned twice and the intensities were aver-
aged with an Agilent GeneArray Scanner using GeneChip
Suite 40 (Affymetrix)
Data transformation and cluster analysis
The average intensity of all probe sets of each array was
scaled to 100 so that the hybridization intensity of all arrays
was equivalent Genes encoding products potentially involved
in the transport and synthesis of carbohydrates fatty acids
and storage proteins were selected based on their sequence
homology to known genes Expression levels of the selected
genes were processed before being subjected to cluster
analysis according to the following procedure First any
expression values (average fluorescence signals) that were
less than 5 were adjusted to 5 Then the adjusted expression
values were log2-transformed median centred and normalized
among the selected genes so that the sum of squares for
each expression vector was equal to one in order to better
visualize the change in shape of the profile over time and
space regardless of the magnitude of expression level The
processed data were then used for cluster analysis using
CLUSTER (Eisen et al 1998) with self-organizing maps fol-
lowed by complete linkage hierarchical clustering of both genes
and experiments The results were visualized with TREEVIEW
(Eisen et al 1998)
Data for the putative nutrient partitioning genes (identified
from cluster analysis) that are preferentially expressed during
Tong Zhu et al
copy Blackwell Publishing Ltd Plant Biotechnology Journal (2003) 1 59ndash70
68
grain filling were then imported into GENESPRING (Silicon
Genetics Redwood CA) Genes with similar expression patterns
(ie correlation coefficients greater than 085) as the original
bait genes were further selected and are collectively referred
to as grain filling genes
The confidence of finding 98 grain filling genes was
assessed through bootstrapping the 491 genes 100 times
For each cycle 98 genes were randomly selected from the
491 genes Then Pearson correlation coefficients were
calculated between the average of the 98 randomly selected
genes and that of the 98 grain filling genes and the P-value
was deduced from the 100 Pearson correlation coefficients
using the following equations
Promoter analysis
The promoter sequences of the grain filling genes were iden-
tified by BLAST search of the open reading frame sequences
of these genes against the published predicted rice gene
sequences (Goff et al 2002) The predicted gene sequence
that was the best match with scores greater than 1E-20 was
used to represent the open reading frame The 15 kb regions
upstream from the putative ATG start site were extracted
using a custom Perl script
Analysis of starch biosynthesis pathway
Data series for probe sets were considered for analysis if the
average intensity was above 25 in any sample in the series
(Supplemental Figure 1) The transformed data were then
loaded into GENESPRING (Silicon Genetics Redwood CA) A
pathway for starch biosynthesis and degradation was gener-
ated from several sources (Dennis and Emes 1990 Kruger
1990 Myers et al 2000 Stitt 1990) and was converted to
a GIF file and imported into GeneSpring Expression level
display boxes were drawn on this GIF using the mapping
function in GENESPRING Genes were selected for display at the
appropriate location on this image based on their annotation
(Goff et al 2002) For genes that have a cytoplasmic and a
plastidic isoform the isoforms were differentiated based on
the annotation where possible
Validation of microarray data
Quantitative RT-PCR assays were performed on an ABI Prism
7700 (Applied Biosystems Foster City CA) as previously
described using the primers and probe sets specific to genes
encoding isoform described (Supplemental Figure 2) A
standard curve consisting of serial 1 5 dilutions was
prepared with RNA concentrations of 50 ngmicroL 10 ngmicroL
2 ngmicroL 04 ngmicroL and 008 ngmicroL Relative expression levels
were interpolated by comparison with standard curves with
a correlation coefficient of 099 or greater Relative expres-
sion levels were normalized to the expression level of a rice
polyubiquitin gene in each sample which was expressed at a
constant level All reactions were performed in triplicate
Acknowledgements
We thank T Moughamer and C Martin for rice sequence
selection for the rice GeneChip design We also thank S Goff
and J Glazebrook for a critical reading of this manuscript
Supplementary material
To confirm the conclusions of the paper the supplemental
data can be accessed through the journalrsquos website lthttp
wipblackwellpublishingcomproducts journals suppmatPBI
PBI006PBI006smhtmgt and the authorsrsquo website lthttp
tmriorggene_exp_webgt To get sequence information for
the Sequence IDs (Probe Set IDs) referred in the paper go to
lthttptmriorggene_exp_webrice_probesetshtmlgt and enter
the Sequence ID (eg OS0007591_at OS_ORF006203_at) into
the query template provide
References
Altschul SF Madden TL Schaffer AA Zhang J Zhang ZMiller W and Lipman DJ (1997) Gapped BLAST and PSI-BLASTa new generation of protein database search programs NuclAcids Res 25 3389ndash3402
Awazuhara M Nakagawa A Yamaguchi J Fujiwara T Hayashi HHatae K Chino M and Shimada A (2000) Distribution andcharacterization of enzymes causing starch degradation in rice(Oryza sativa cv koshihikari) J Agric Food Chem 48 245ndash252
Baker SS Wilhelm KS and Thomashow MF (1994) The 5prime-region of Arabidopsis thaliana cor15a has cis-acting elements thatconfer cold- drought- and ABA-regulated gene expression PlantMol Biol 24 701ndash713
Cheong YH Yoo CM Park JM Ryu GR Goekjian VHNagao RT Key JL Cho MJ and Hong JC (1998) STF1 is a novelTGACG-binding factor with a zinc-finger motif and a bZIP domainwhich heterodimerizes with GBF proteins Plant J 15 199ndash209
Dennis DT and Emes MJ (1990) Regulation by compartmenta-tion In Plant Physiology Biochemistry and Molecular Biology(Dennis DT and Turpin DH eds) pp 45ndash55 London UKLongman Scientific and Technical
Efron B and Tibshirani RJ (1994) Random samples and probabilityIn An Introduction to the Bootstrap pp 17ndash28 Boca Raton FLMonographs on Statistics and Applied Probability
tX
SS
S
NXX
=
minus=
micro
Gene regulation in rice grain filling
copy Blackwell Publishing Ltd Plant Biotechnology Journal (2003) 1 59ndash70
69
Eisen MB Spellman PT Brown PO and Botstein D (1998)Cluster analysis and display of genome-wide expression patternsProc Natl Acad Sci USA 95 14863ndash14868
Ellerstrom M Stalberg K Ezcurra I and Rask L (1996) Functionaldissection of a napin gene promoter identification of promoterelements required for embryo and endosperm-specific transcrip-tion Plant Mol Biol 32 1019ndash1027
Eyal Y Curie C and McCormick S (1995) Pollen specificityelements reside in 30 bp of the proximal promoters of twopollen-expressed genes Plant Cell 7 373ndash384
Fath A Bethke PC and Jones RL (1999) Barley aleurone celldeath is not apoptotic characterization of nuclease activities andDNA degradation Plant J 20 305ndash315
Girke T Todd J Ruuska S White J Benning C and Ohlrogge J(2000) Microarray analysis of developing Arabidopsis seeds PlantPhysiol 124 1570ndash1581
Goff SA Ricke D Lan TH Presting G Wang R Dunn MGlazebrook J Sessions A Oeller P Varma H et al (2002) Adraft sequence of the rice genome (Oryza sativa L ssp japonica)Science 296 92ndash100
Hwang YS Karrer EE Thomas BR Chen L and Rodriguez RL(1998) Three cis-elements required for rice α-amylase Amy3Dexpression during sugar starvation Plant Mol Biol 36 331ndash341
Kim SY Chung HJ and Thomas TL (1997) Isolation of a novelclass of bZIP transcription factors that interact with ABA-responsive and embryo-specification elements in the Dc3 pro-moter using a modified yeast one-hybrid system Plant J 111237ndash1251
Kruger M (1990) Carborhydrate Synthesis and Degradation InPlant Physiology Biochemistry and Molecular Biology (Dennis DTand Turpin DH eds) pp 59ndash76 London Longman Scientificand Technical
Lacombe E Van Doorsselaere J Boerjan W Boudet AMand Grima-Pettenati J (2000) Characterization of cis-elementsrequired for vascular expression of the cinnamoyl CoA reductasegene and for proteinndashDNA complex formation Plant J 23663ndash676
Leubner-Metzger G Petruzzelli L Waldvogel R Vogeli-Lange Rand Meins F Jr (1998) Ethylene-responsive element bindingprotein (EREBP) expression and the transcriptional regulation ofclass I β-13-glucanase during tobacco seed germination PlantMol Biol 38 785ndash795
Lipshultz RJ Fodor SP Gingeras TR and Lockhart DJ (1999)High density synthetic oligonucleotide arrays Nat Genet 2120ndash24
Lockhart DJ Dong H Byrne MC Follettie MT Gallo MVChee MS Mittmann M Wang C Kobayashi M Horton Hand Brown EL (1996) Expression monitoring by hybridization tohigh-density oligonucleotide arrays Nat Biotechnol 14 1675ndash1680
Mazur B Krebbers E and Tingey S (1999) Gene discovery andproduct development for grain quality traits Science 285372ndash375
Mena M Vicente-Carbajosa J Schmidt RJ and Carbonero P(1998) An endosperm-specific DOF protein from barley highlyconserved in wheat binds to and activates transcription fromthe prolamin-box of a native B-hordein promoter in barleyendosperm Plant J 16 53ndash62
Morell MK Blennow A Kosar-Hashemi B and Samuel MS(1997) Differential expression and properties of starch branching
enzyme isoforms in developing wheat endosperm Plant Physiol113 201ndash208
Myers AM Morell MK James MG and Ball SG (2000) Recentprogress toward understanding biosynthesis of the amylopectincrystal Plant Physiol 122 989ndash997
Onodera Y Suzuki A Wu CY Washida H and Takaiwa F(2001) A rice functional transcriptional activator RISBZ1 respon-sible for endosperm-specific expression of storage protein genesthrough GCN4 motif J Biol Chem 276 14139ndash14152
Ren B Robert F Wyrick JJ Aparicio O Jennings EG Simon IZeitlinger J Schreiber J Hannett N Kanin E et al (2000)Genome-wide location and function of DNA binding proteinsScience 290 2306ndash2309
Rose A Meier I and Wienand U (1999) The tomato I-box bindingfactor LeMYBI is a member of a novel class of myb-like proteinsPlant J 20 641ndash652
Roth FP Hughes JD Estep PW and Church GM (1998) FindingDNA regulatory motifs within unaligned noncoding sequencesclustered by whole-genome mRNA quantitation Nat Biotechnol16 939ndash945
Rushton PJ and Somssich IE (1998) Transcriptional control ofplant genes responsive to pathogens Curr Opin Plant Biol 1311ndash315
Ruuska SA Girke T Benning C and Ohlrogge JB (2002)Contrapuntal networks of gene expression during Arabidopsisseed filling Plant Cell 14 1191ndash1206
Shannon JC Pien FM Cao H and Liu KC (1998) Brittle-1 anadenylate translocator facilitates transfer of extraplastidialsynthesized ADPndashglucose into amyloplasts of maize endospermsPlant Physiol 117 1235ndash1252
Singh V Okadome H Toyoshima H Isobe S and Ohtsubo K(2000) Thermal and physicochemical properties of rice grain flourand starch J Agric Food Chem 48 2639ndash2647
Stitt M (1990) The flux of carbon between the chloroplast andcytoplasm In Plant Physiology Biochemistry and MolecularBiology (Dennis DT and Turpin DH eds) pp 309ndash326 LondonLongman Scientific and Technical
Umemoto T Nakamura Y and Ishikura N (1995) Activity of starchsynthase and the amylose content in rice endosperm Phytochem-istry 40 1613ndash1616
Vicente-Carbajosa J Moose SP Parsons RL and Schmidt RJ(1997) A maize zinc-finger protein binds the prolamin box in zeingene promoters and interacts with the basic leucine zippertranscriptional activator Opaque2 Proc Natl Acad Sci USA 947685ndash7690
Wang AY Kao MH Yang WH Sayion Y Liu LF Lee PD andSu JC (1999a) Differentially and developmentally regulatedexpression of three rice sucrose synthase genes Plant Cell Physiol40 800ndash807
Wang RL Stec A Hey J Lukens L and Doebley J (1999b) Thelimits of selection during maize domestication Nature 398236ndash239
Washida H Wu CY Suzuki A Yamanouchi U Akihama THarada K and Takaiwa F (1999) Identification of cis-regulatoryelements required for endosperm expression of the rice storageprotein glutelin gene GluB-1 Plant Mol Biol 40 1ndash12
Wu C Washida H Onodera Y Harada K and Takaiwa F (2000)Quantitative nature of the Prolamin-box ACGT and AACA motifsin a rice glutelin gene promoter minimal cis-element requirementsfor endosperm-specific gene expression Plant J 23 415ndash421
Tong Zhu et al
copy Blackwell Publishing Ltd Plant Biotechnology Journal (2003) 1 59ndash70
70
Ye X Al-Babili S Kloti A Zhang J Lucca P Beyer P andPotrykus I (2000) Engineering the provitamin A (beta-carotene)biosynthetic pathway into (carotenoid-free) rice endospermScience 287 303ndash305
Yen SF Su JC and Sung HY (1994) Purification and character-ization of rice sucrose synthase isozymes Biochem Mol Biol Int34 613ndash620
Yu J Hu S Wang J Wong GK Li S Liu B Deng Y
Dai L Zhou Y Zhang X et al (2002) A draft sequence ofthe rice genome (Oryza sativa L ssp indica) Science 296 79ndash92
Zhu T Budworth P Han B Brown D Chang HS Zou G andWang X (2001) Toward elucidating the global gene expressionpatterns of developing Arabidopsis Parallel analysis of 8300genes by high-density oligonucleotide probe array Plant PhysiolBiochem 39 221ndash242
Tong Zhu et al
copy Blackwell Publishing Ltd Plant Biotechnology Journal (2003) 1 59ndash70
68
grain filling were then imported into GENESPRING (Silicon
Genetics Redwood CA) Genes with similar expression patterns
(ie correlation coefficients greater than 085) as the original
bait genes were further selected and are collectively referred
to as grain filling genes
The confidence of finding 98 grain filling genes was
assessed through bootstrapping the 491 genes 100 times
For each cycle 98 genes were randomly selected from the
491 genes Then Pearson correlation coefficients were
calculated between the average of the 98 randomly selected
genes and that of the 98 grain filling genes and the P-value
was deduced from the 100 Pearson correlation coefficients
using the following equations
Promoter analysis
The promoter sequences of the grain filling genes were iden-
tified by BLAST search of the open reading frame sequences
of these genes against the published predicted rice gene
sequences (Goff et al 2002) The predicted gene sequence
that was the best match with scores greater than 1E-20 was
used to represent the open reading frame The 15 kb regions
upstream from the putative ATG start site were extracted
using a custom Perl script
Analysis of starch biosynthesis pathway
Data series for probe sets were considered for analysis if the
average intensity was above 25 in any sample in the series
(Supplemental Figure 1) The transformed data were then
loaded into GENESPRING (Silicon Genetics Redwood CA) A
pathway for starch biosynthesis and degradation was gener-
ated from several sources (Dennis and Emes 1990 Kruger
1990 Myers et al 2000 Stitt 1990) and was converted to
a GIF file and imported into GeneSpring Expression level
display boxes were drawn on this GIF using the mapping
function in GENESPRING Genes were selected for display at the
appropriate location on this image based on their annotation
(Goff et al 2002) For genes that have a cytoplasmic and a
plastidic isoform the isoforms were differentiated based on
the annotation where possible
Validation of microarray data
Quantitative RT-PCR assays were performed on an ABI Prism
7700 (Applied Biosystems Foster City CA) as previously
described using the primers and probe sets specific to genes
encoding isoform described (Supplemental Figure 2) A
standard curve consisting of serial 1 5 dilutions was
prepared with RNA concentrations of 50 ngmicroL 10 ngmicroL
2 ngmicroL 04 ngmicroL and 008 ngmicroL Relative expression levels
were interpolated by comparison with standard curves with
a correlation coefficient of 099 or greater Relative expres-
sion levels were normalized to the expression level of a rice
polyubiquitin gene in each sample which was expressed at a
constant level All reactions were performed in triplicate
Acknowledgements
We thank T Moughamer and C Martin for rice sequence
selection for the rice GeneChip design We also thank S Goff
and J Glazebrook for a critical reading of this manuscript
Supplementary material
To confirm the conclusions of the paper the supplemental
data can be accessed through the journalrsquos website lthttp
wipblackwellpublishingcomproducts journals suppmatPBI
PBI006PBI006smhtmgt and the authorsrsquo website lthttp
tmriorggene_exp_webgt To get sequence information for
the Sequence IDs (Probe Set IDs) referred in the paper go to
lthttptmriorggene_exp_webrice_probesetshtmlgt and enter
the Sequence ID (eg OS0007591_at OS_ORF006203_at) into
the query template provide
References
Altschul SF Madden TL Schaffer AA Zhang J Zhang ZMiller W and Lipman DJ (1997) Gapped BLAST and PSI-BLASTa new generation of protein database search programs NuclAcids Res 25 3389ndash3402
Awazuhara M Nakagawa A Yamaguchi J Fujiwara T Hayashi HHatae K Chino M and Shimada A (2000) Distribution andcharacterization of enzymes causing starch degradation in rice(Oryza sativa cv koshihikari) J Agric Food Chem 48 245ndash252
Baker SS Wilhelm KS and Thomashow MF (1994) The 5prime-region of Arabidopsis thaliana cor15a has cis-acting elements thatconfer cold- drought- and ABA-regulated gene expression PlantMol Biol 24 701ndash713
Cheong YH Yoo CM Park JM Ryu GR Goekjian VHNagao RT Key JL Cho MJ and Hong JC (1998) STF1 is a novelTGACG-binding factor with a zinc-finger motif and a bZIP domainwhich heterodimerizes with GBF proteins Plant J 15 199ndash209
Dennis DT and Emes MJ (1990) Regulation by compartmenta-tion In Plant Physiology Biochemistry and Molecular Biology(Dennis DT and Turpin DH eds) pp 45ndash55 London UKLongman Scientific and Technical
Efron B and Tibshirani RJ (1994) Random samples and probabilityIn An Introduction to the Bootstrap pp 17ndash28 Boca Raton FLMonographs on Statistics and Applied Probability
tX
SS
S
NXX
=
minus=
micro
Gene regulation in rice grain filling
copy Blackwell Publishing Ltd Plant Biotechnology Journal (2003) 1 59ndash70
69
Eisen MB Spellman PT Brown PO and Botstein D (1998)Cluster analysis and display of genome-wide expression patternsProc Natl Acad Sci USA 95 14863ndash14868
Ellerstrom M Stalberg K Ezcurra I and Rask L (1996) Functionaldissection of a napin gene promoter identification of promoterelements required for embryo and endosperm-specific transcrip-tion Plant Mol Biol 32 1019ndash1027
Eyal Y Curie C and McCormick S (1995) Pollen specificityelements reside in 30 bp of the proximal promoters of twopollen-expressed genes Plant Cell 7 373ndash384
Fath A Bethke PC and Jones RL (1999) Barley aleurone celldeath is not apoptotic characterization of nuclease activities andDNA degradation Plant J 20 305ndash315
Girke T Todd J Ruuska S White J Benning C and Ohlrogge J(2000) Microarray analysis of developing Arabidopsis seeds PlantPhysiol 124 1570ndash1581
Goff SA Ricke D Lan TH Presting G Wang R Dunn MGlazebrook J Sessions A Oeller P Varma H et al (2002) Adraft sequence of the rice genome (Oryza sativa L ssp japonica)Science 296 92ndash100
Hwang YS Karrer EE Thomas BR Chen L and Rodriguez RL(1998) Three cis-elements required for rice α-amylase Amy3Dexpression during sugar starvation Plant Mol Biol 36 331ndash341
Kim SY Chung HJ and Thomas TL (1997) Isolation of a novelclass of bZIP transcription factors that interact with ABA-responsive and embryo-specification elements in the Dc3 pro-moter using a modified yeast one-hybrid system Plant J 111237ndash1251
Kruger M (1990) Carborhydrate Synthesis and Degradation InPlant Physiology Biochemistry and Molecular Biology (Dennis DTand Turpin DH eds) pp 59ndash76 London Longman Scientificand Technical
Lacombe E Van Doorsselaere J Boerjan W Boudet AMand Grima-Pettenati J (2000) Characterization of cis-elementsrequired for vascular expression of the cinnamoyl CoA reductasegene and for proteinndashDNA complex formation Plant J 23663ndash676
Leubner-Metzger G Petruzzelli L Waldvogel R Vogeli-Lange Rand Meins F Jr (1998) Ethylene-responsive element bindingprotein (EREBP) expression and the transcriptional regulation ofclass I β-13-glucanase during tobacco seed germination PlantMol Biol 38 785ndash795
Lipshultz RJ Fodor SP Gingeras TR and Lockhart DJ (1999)High density synthetic oligonucleotide arrays Nat Genet 2120ndash24
Lockhart DJ Dong H Byrne MC Follettie MT Gallo MVChee MS Mittmann M Wang C Kobayashi M Horton Hand Brown EL (1996) Expression monitoring by hybridization tohigh-density oligonucleotide arrays Nat Biotechnol 14 1675ndash1680
Mazur B Krebbers E and Tingey S (1999) Gene discovery andproduct development for grain quality traits Science 285372ndash375
Mena M Vicente-Carbajosa J Schmidt RJ and Carbonero P(1998) An endosperm-specific DOF protein from barley highlyconserved in wheat binds to and activates transcription fromthe prolamin-box of a native B-hordein promoter in barleyendosperm Plant J 16 53ndash62
Morell MK Blennow A Kosar-Hashemi B and Samuel MS(1997) Differential expression and properties of starch branching
enzyme isoforms in developing wheat endosperm Plant Physiol113 201ndash208
Myers AM Morell MK James MG and Ball SG (2000) Recentprogress toward understanding biosynthesis of the amylopectincrystal Plant Physiol 122 989ndash997
Onodera Y Suzuki A Wu CY Washida H and Takaiwa F(2001) A rice functional transcriptional activator RISBZ1 respon-sible for endosperm-specific expression of storage protein genesthrough GCN4 motif J Biol Chem 276 14139ndash14152
Ren B Robert F Wyrick JJ Aparicio O Jennings EG Simon IZeitlinger J Schreiber J Hannett N Kanin E et al (2000)Genome-wide location and function of DNA binding proteinsScience 290 2306ndash2309
Rose A Meier I and Wienand U (1999) The tomato I-box bindingfactor LeMYBI is a member of a novel class of myb-like proteinsPlant J 20 641ndash652
Roth FP Hughes JD Estep PW and Church GM (1998) FindingDNA regulatory motifs within unaligned noncoding sequencesclustered by whole-genome mRNA quantitation Nat Biotechnol16 939ndash945
Rushton PJ and Somssich IE (1998) Transcriptional control ofplant genes responsive to pathogens Curr Opin Plant Biol 1311ndash315
Ruuska SA Girke T Benning C and Ohlrogge JB (2002)Contrapuntal networks of gene expression during Arabidopsisseed filling Plant Cell 14 1191ndash1206
Shannon JC Pien FM Cao H and Liu KC (1998) Brittle-1 anadenylate translocator facilitates transfer of extraplastidialsynthesized ADPndashglucose into amyloplasts of maize endospermsPlant Physiol 117 1235ndash1252
Singh V Okadome H Toyoshima H Isobe S and Ohtsubo K(2000) Thermal and physicochemical properties of rice grain flourand starch J Agric Food Chem 48 2639ndash2647
Stitt M (1990) The flux of carbon between the chloroplast andcytoplasm In Plant Physiology Biochemistry and MolecularBiology (Dennis DT and Turpin DH eds) pp 309ndash326 LondonLongman Scientific and Technical
Umemoto T Nakamura Y and Ishikura N (1995) Activity of starchsynthase and the amylose content in rice endosperm Phytochem-istry 40 1613ndash1616
Vicente-Carbajosa J Moose SP Parsons RL and Schmidt RJ(1997) A maize zinc-finger protein binds the prolamin box in zeingene promoters and interacts with the basic leucine zippertranscriptional activator Opaque2 Proc Natl Acad Sci USA 947685ndash7690
Wang AY Kao MH Yang WH Sayion Y Liu LF Lee PD andSu JC (1999a) Differentially and developmentally regulatedexpression of three rice sucrose synthase genes Plant Cell Physiol40 800ndash807
Wang RL Stec A Hey J Lukens L and Doebley J (1999b) Thelimits of selection during maize domestication Nature 398236ndash239
Washida H Wu CY Suzuki A Yamanouchi U Akihama THarada K and Takaiwa F (1999) Identification of cis-regulatoryelements required for endosperm expression of the rice storageprotein glutelin gene GluB-1 Plant Mol Biol 40 1ndash12
Wu C Washida H Onodera Y Harada K and Takaiwa F (2000)Quantitative nature of the Prolamin-box ACGT and AACA motifsin a rice glutelin gene promoter minimal cis-element requirementsfor endosperm-specific gene expression Plant J 23 415ndash421
Tong Zhu et al
copy Blackwell Publishing Ltd Plant Biotechnology Journal (2003) 1 59ndash70
70
Ye X Al-Babili S Kloti A Zhang J Lucca P Beyer P andPotrykus I (2000) Engineering the provitamin A (beta-carotene)biosynthetic pathway into (carotenoid-free) rice endospermScience 287 303ndash305
Yen SF Su JC and Sung HY (1994) Purification and character-ization of rice sucrose synthase isozymes Biochem Mol Biol Int34 613ndash620
Yu J Hu S Wang J Wong GK Li S Liu B Deng Y
Dai L Zhou Y Zhang X et al (2002) A draft sequence ofthe rice genome (Oryza sativa L ssp indica) Science 296 79ndash92
Zhu T Budworth P Han B Brown D Chang HS Zou G andWang X (2001) Toward elucidating the global gene expressionpatterns of developing Arabidopsis Parallel analysis of 8300genes by high-density oligonucleotide probe array Plant PhysiolBiochem 39 221ndash242