Evaluating The Response Of Maize (Zea Mays L.), Varieties ...
Upload
sorbonne-frCategory
view
2download
0
Physiology of maize II: Identification of physiologicalmarkers representative of the nitrogen status of maize(Zea mays) leaves during grain fillingBertrand Hirela,*, Bruno Andrieub, Marie-Helene Valadiera, Sylvain Renarda, Isabelle Quillerea,Michael Chelleb, Bernard Pommelb, Christian Fournierb and Jean-Louis Drouetb
aUnite de Nutrition Azotee des Plantes, INRA, Centre de Versailles, Route de Saint-Cyr, F-78026 Versailles Cedex, FrancebUMR INRA-INAPG Environnement et Grandes Cultures, F-78850 Thiverval-Grignon, France
Correspondence
*Corresponding author,
e-mail: [email protected]
Received 23 December 2004; revised 18
February 2005
doi: 10.1111/j.1399-3054.2005.00511.x
To illustrate the development of the source-to-sink transition in maize leavesduring the grain-filling period, an integrated physiological-agronomicapproach is presented in this study. The evolution of physiological markerssuch as total leaf nitrogen (N), chlorophyll, soluble protein, amino acid andammonium contents was monitored from silking to a period close to maturityin different leaf stages of three maize genotypes grown at high and low levelsof N fertilization. In addition, the activities of glutamine synthetase (GS) andglutamate dehydrogenase (GDH), two enzymes known to play a direct or anindirect role during leaf N remobilization, were measured. In the threegenotypes examined, we found that a general decrease of most metabolicand enzyme markers occurred during leaf ageing and that this decrease wasenhanced when plants were N starved. In contrast, such variations were notobserved between different sections of a single leaf even at an advancedstage of leaf senescence. We found that there is a strong correlation betweentotal N, chlorophyll, soluble protein and GS activity, which is not dependentupon the N fertilization level, which indicates the N status of the plant, eitherin a single leaf or during ageing. In contrast, ammonium, amino acids andGDH activity were not subject to such variations, thus suggesting that they areindicators of the metabolic activity of the whole plant in response to the levelof N fertilization. The use of these markers to predict the N status of maize as afunction of both plant development and N availability is discussed.
Introduction
Crops such as cereals, grown for protein content andyield, require large quantities of nitrogenous fertilizersto attain their maximal yields. In the past few years, anumber of physiological and agronomic studies havebeen undertaken to identify which are the limiting stepsin the control of nitrogen (N) uptake, assimilation andrecycling during plant growth and development (Gallaisand Hirel 2004, Jeuffroy et al. 2002, Lawlor 2002).
In addition, agronomic studies have been very informa-tive in defining key elements of the N economy of aplant. However, our knowledge on the regulation ofN acquisition and management is still fragmentary, asmost biochemical and molecular studies were devel-oped to identify the key physiological and morpho-logical traits involved but were rarely placed in awhole plant or an agronomic context.
Abbreviations – DAS, days after silking; DW, dry weight; GDH, glutamate dehydrogenase; GS, glutamine synthetase;
N, nitrogen; NUE, nitrogen use efficiency.
178 Physiol. Plant. 124, 2005
Physiologia Plantarum 124: 178–188. 2005 Copyright � Physiologia Plantarum 2005, ISSN 0031-9317

Only recently, by developing whole plant physiologyand quantitative genetic studies, it has become possible tounderstand in a more integrated manner the regulation ofN uptake, N assimilation and N recycling and theirprogression during plant growth and development.These studies have allowed the identification of a numberof biochemical and molecular markers characteristic ofthe biological events occurring during the transitionbetween primary N assimilation and N remobilization asa function of both leaf ageing and mineral N nutrition.In particular, it has been shown that in a dicotyledonousplant such as tobacco, the changes in chlorophyll,protein, ammonium and amino acids contents could beused to depict the transition of source leaves to sinkleaves. Moreover, in this species, the concomitant induc-tion of the two enzymes cytosolic glutamine synthetase(GS1; EC 6.3.1.2) and glutamate dehydrogenase (GDH;EC 1.4.1.2) appeared to be one of the most characteristicbiochemical events occurring during the transition fromNassimilation to N remobilization (Terce-Laforgue et al.2004a). The enzyme GS catalyses the assimilation ofammonium, whatever its cellular origin, to synthesizeglutamine, which is then further used as an amino donorfor the rest of cellular metabolism (Hirel and Lea 2002,Andrews et al. 2004). Although the exact physiologicalrole of GDH is still not clearly defined, several hypotheseshave been proposed to explain its putative function in thecontrol of carbon and N reallocation under variousphysiological conditions (Dubois et al. 2003, Terce-Laforgue et al. 2004b). The two enzymes’ activities ofGS and GDH have therefore often been used as represen-tative biochemical markers to evaluate the N status of aplant at a given stage of leaf development. In monocotssuch as rice (Yamaya et al. 2002) and maize (Gallais andHirel 2004, Hirel et al. 2005), the importance of the twoenzymes in the control of N assimilation and recyclinghas been established using either physiological or quanti-tative genetic approaches because they represent putativekey reactions that may influence grain yield and itscomponents (Hirel et al. 2001, Dubois et al. 2003).
To help fill the gap that still exists between physiolo-gical and agronomic studies, it is now necessary toobtain a more integrated view of the regulation of Nmanagement within the plant or within a particularorgan. This would allow the identification of simplephysiological markers that could be further used asindicators to depict the changes in source/sink relation-ships during plant growth and development. Usingmaize as a model crop (Hirel et al. 2005), we havemonitored under-field growth conditions, the changesin metabolite concentrations and enzyme activitiesinvolved in N metabolism within a single leaf, at differ-ent stages of leaf growth and at different periods of plant
development during the grain-filling period. To increasethe potential value of these biochemical markers asphysio-agronomic indicators, we have monitored theirdevelopment in three different genotypes and at twocontrasting levels of N fertilization. Correlations betweenthese markers were then evaluated to determine whetheror not they are linked to each other regardless of thegenetic background, environmental conditions, develop-mental stage and leaf spatial distribution. Whether someof these markers can be used as diagnostic tools forpredicting the N status of a plant and its change duringplant growth and development, is discussed.
Materials and methods
Plant material for field and physiological studies
Two lines (F2 and MBS258) and one hybrid (Dea) ofmaize were grown during the season of 2001 in anexperimental field of the Institut National de laRecherche Agronomique, at Thiverval-Grignon, France.The lines F2 and MBS258 were chosen because theyhad been used to produce the population of recombi-nant inbred lines for quantitative genetic studiesdesigned to identify the genetic basis of maize N useefficiency (NUE) (Hirel et al. 2001). The hybrid Dea hasalready been used to model plant development underdifferent environmental conditions (Drouet andBonhomme 1999, Fournier and Andrieu 1999). Plantswere grown on two levels of ammonium-nitrate N ferti-lization (Nþ 5 170 kg N ha�1 and N–5 30 kg N ha�1),and the residual N provided by the soil was estimated tobe approximately 60 kg ha�1. Both phosphorus (P205)and potassium (K20) were also applied at 100 kg ha�1.Plant density was 120 000 ha�1 with a space of 80 cmbetween rows (eight rows for F2, 12 rows for Dea andseven rows for MBS258 for each of the Nþ and N–
treatments) and of approximately 10 cm betweenplants. Plants were sown on the 7th of May. The levelof N fertilization significantly affected neither the rate ofdevelopment nor the total number of leaves. The totalnumber of leaves formed in F2, Dea and MBS258 was14, 16 and 18, respectively. The silking date was the19th of July for F2, the 25th of July for Dea and the 7thof August for MBS258.
For measuring the physiological markers (N metabo-lite contents and enzyme activities) representative of thedifferent leaf stages, three plants were selected for eachgenotype and N treatment at silking and 15, 35 and 55days after silking (DAS). Leaves were numbered acrope-tally, as �3, �1, þ1 and þ1, where number 0 corres-ponds to the leaf located below the ear. From each leaf,the main midrib was removed, and 3-cm2 sections of
Physiol. Plant. 124, 2005 179

leaf tissue were randomly collected and pooled in twogroups of five leaf disks. One groupwasweighed and thenlyophilized to determine freshweight (FW) and dryweight(DW) per area. The other was weighed, frozen and used todetermine protein quantity and chlorophyll quantity perFW and leaf area. The remaining leaf tissue was frozen inliquid N and immediately reduced to a homogenouspowder that was stored at �80� C and used for all furthermeasurements. All the harvesting of fresh material wasdone concomitantly between 10:00 and 12:00 h.The harvesting protocol was slightly different for mea-
suring the variation in N metabolite contents and enzymeactivities along a single leaf. In this experiment, only leafþ1 of genotype Dea was harvested using three individualplant samples. Two harvesting dates representative ofboth N treatments were selected. The first harvestingdate was 35 DAS for Nþ and N– plants. Under both Nfertilization regimes, no visible symptom of leaf senes-cence could be seen at this date of sampling. The secondharvesting date was 55 DAS for N– plants and wasdelayed until 71 DAS for Nþ plants to obtain a similarvisible gradient of senescence from the tip to the base ofthe leaf under both low and high N fertilization condi-tions (Fig. 2). Each leaf was divided into 6–8 sections ofequal size depending on its length. The protocol forphysiological analysis was similar to that used for thedifferent leaf stages of the three genotypes.
Metabolite extractions and analyses and enzymaticassays (place query)
An aliquot of approximately 1 g of frozen leaf tissue wasground to a fine powder and lyophilized. Around 20 mg ofthis powder was then extracted in 1 ml of 80% ethanol for1 h at 4� C. During extraction, the samples were continu-ously agitated and then they were centrifuged for 5 min at10 000 g. The supernatant was removed and the pelletsubjected to further extractions in 60% ethanol and finallyin water. All supernatants were combined to form thehydroalcoholic extract. The total N content was deter-mined using the combustion method of Dumas.Ammonium was determined by the phenol hypochloriteassay (Berthelot reaction), which provides reliable data forcomparative studies when its concentration is low,although a more precise quantification can be obtainedby other methods (Husted et al. 2000). Total free aminoacids were determined by the Rosen colorimetric method,using leucine as a standard (Rosen 1957). Chlorophyll wasestimated in crude leaf extracts using the method of Arnon(1949). Soluble protein was determined using a commer-cially available kit (Coomassie Protein assay reagent,Biorad, Munchen, Germany) using bovine serumalbumin as a standard (Bradford 1976).
Enzymes were extracted from frozen leaf materialstored at �80� C. All extractions were performedat 4� C. GS was measured according to the method ofO’Neal and Joy (1973). GDH {nicotinamideadenine dinucleotide [NAD(H)]-GDH and nicotinamideadenine dinucleotide phosphate-GDH} were measuredas described by Turano et al. (1996) except that theextraction buffer was the same as for GS.
Statistical analysis
For metabolite analyses, measurement of enzymesactivities and protein amounts, results are presented asmean values for three plants with standard errors(SE 5 SD/Hn, where SD is the standard deviation and nthe number of samples).
Correlations’ studies and R-square calculationswere performed using the Microsoft Excel software(Microsoft 98).
Results
Distribution of N metabolites and changes inenzyme activities
In several model and crop species, total leaf N and leafsoluble protein content have been used as markers of theoverall N metabolic status of the plant with respect toN assimilation and remobilization (Jeuffroy et al. 2002).Both free amino acid content and free ammonium contentrepresent good indicators of plant metabolic activity duringthe transition from N assimilation to N remobilization(Feller and Fisher 1994, Masclaux et al. 2000). Changesin the amount of chlorophyll were also measured, becausethe molecule represents one of the main biomarkersemployed to monitor the development of leaf yellowingduring senescence in both C3 (Terce-Laforgue et al. 2004a)and C4 plants (Smart et al. 1995).
The results obtained for the hybrid Dea are presented inFig. 1. Leaf dry matter per unit of leaf area was similar inNþ and N– grown plants and slightly increased 35 DASand onwards in the two youngest leaves. In the bottomleaves, dry matter remained almost constant whatever thedevelopmental stage of the plant. The distribution patternof total N, soluble protein and chlorophyll contents fol-lowed a similar trend when either the different leaf stagesor the developmental age of the plant was considered.A more or less pronounced decrease of the three traits wasobserved from leafþ3 to leaf�3. This pattern was similarunder both N fertilization regimes. However, the relativeconcentrations of total N, soluble protein and chloro-phyll were always lower in plants grown under low Ninput compared with plants grown under high N input.
180 Physiol. Plant. 124, 2005

A decrease in the amount of these three metabolicmarkers was also observed during plant ageing. Thisdecrease was delayed in the Nþ treatment comparedwith the N– treatment.
Compared with total N, soluble protein and chloro-phyll, the distribution patterns of amino acid andammonium contents between leaves were different,because they did not exhibit major changes betweenleaf stages; although, their relative concentrations weresignificantly higher under high N input. Only a slightdecrease in both amino acid and ammonium contentwas observed particularly in the oldest leaves at the twolatest sampling dates, regardless of the level of Nfertilization.
The development of leaf GS and leaf NADH-GDHactivities was monitored in parallel to the N metabolitecontent. For GS activity, we did not observe any majorchanges in the different leaf stages until 35 DAS. At35 DAS the enzyme activity started to decrease, parti-cularly in the oldest leaves. This decrease was evengreater in plants grown under low N input.
In the Nþ treatment, the observed changes in NADH-GDH activity were different from that of GS activity,because they remained almost constant throughout thewhole plant developmental cycle. However, in a similarmanner to GS, GDH activity was always lower from theflowering period to 55 DAS in plants grown under lowN-fertilization conditions.
The developmental changes in the seven physiologi-cal markers were overall very similar in the two othergenotypes F2 and MBS, although in particular for leafchlorophyll content, there were some genotype-specificchanges (data not shown).
Distribution of N metabolites and changes in theactivities of key enzymes along the leaf
The changes in the physiological markers on individualsections covering the entire leaf blade were monitored.This study was performed on the leaf above the ear (þ1)of genotype Dea at two different sampling dates. Thefirst date was 35 DAS, where no symptoms of
0
40
80
120
Pro
tein
[mg
(g D
W)–1
]
0
5
10
15
0
10
20
30
40
Nitr
ogen
[mg
(g D
W)–1
]
0
2
4
6
Dry
mat
ter
(mg
cm–2
)
0
20
40
60
80
Am
ino
acid
[µm
ol g
(DW
)–1]
0
5
10
15
Am
mon
ium
[µm
ol g
(DW
)–1]
0
1
2
3
4
GS
[µm
ol m
in–1
(g D
W)–1
]
0
1
2
3
4
GD
H[µ
mol
min
–1 (g
DW
)–1]
0 DAS 15 DAS 35 DAS 55 DAS 0 DAS 15 DAS 35 DAS 55 DASC
hror
ophy
ll [m
g (g
DW
)–1]
Fig. 1. Distribution of markers for N metabolism in relation to leaf ageing and N nutrition level. Changes in dry matter, metabolite content and
enzyme activities in the different leaf stages, at silking (0 DAS), 15, 35 and 55 DAS in leaves of maize plants grown in the field under high Nþ (.), lowN–, (n) of N fertilization. For each curve, the four leaf stages are shown acropetally (�3, �1, þ1 and þ3: leaf 0 being the leaf located below the ear)
from left to right. Vertical bars correspond to the mean � SE of three individual plants.
Physiol. Plant. 124, 2005 181
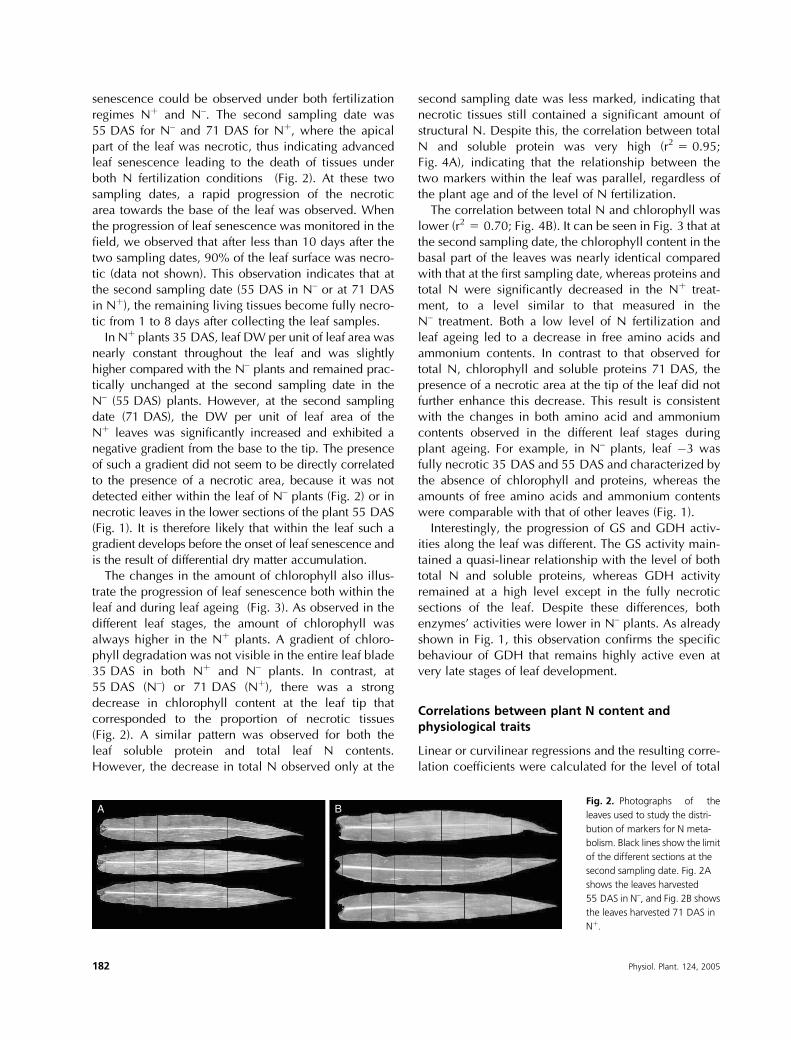
senescence could be observed under both fertilizationregimes Nþ and N–. The second sampling date was55 DAS for N– and 71 DAS for Nþ, where the apicalpart of the leaf was necrotic, thus indicating advancedleaf senescence leading to the death of tissues underboth N fertilization conditions (Fig. 2). At these twosampling dates, a rapid progression of the necroticarea towards the base of the leaf was observed. Whenthe progression of leaf senescence was monitored in thefield, we observed that after less than 10 days after thetwo sampling dates, 90% of the leaf surface was necro-tic (data not shown). This observation indicates that atthe second sampling date (55 DAS in N– or at 71 DASin Nþ), the remaining living tissues become fully necro-tic from 1 to 8 days after collecting the leaf samples.In Nþ plants 35 DAS, leaf DW per unit of leaf area was
nearly constant throughout the leaf and was slightlyhigher compared with the N– plants and remained prac-tically unchanged at the second sampling date in theN– (55 DAS) plants. However, at the second samplingdate (71 DAS), the DW per unit of leaf area of theNþ leaves was significantly increased and exhibited anegative gradient from the base to the tip. The presenceof such a gradient did not seem to be directly correlatedto the presence of a necrotic area, because it was notdetected either within the leaf of N– plants (Fig. 2) or innecrotic leaves in the lower sections of the plant 55 DAS(Fig. 1). It is therefore likely that within the leaf such agradient develops before the onset of leaf senescence andis the result of differential dry matter accumulation.The changes in the amount of chlorophyll also illus-
trate the progression of leaf senescence both within theleaf and during leaf ageing (Fig. 3). As observed in thedifferent leaf stages, the amount of chlorophyll wasalways higher in the Nþ plants. A gradient of chloro-phyll degradation was not visible in the entire leaf blade35 DAS in both Nþ and N– plants. In contrast, at55 DAS (N–) or 71 DAS (Nþ), there was a strongdecrease in chlorophyll content at the leaf tip thatcorresponded to the proportion of necrotic tissues(Fig. 2). A similar pattern was observed for both theleaf soluble protein and total leaf N contents.However, the decrease in total N observed only at the
second sampling date was less marked, indicating thatnecrotic tissues still contained a significant amount ofstructural N. Despite this, the correlation between totalN and soluble protein was very high (r2 5 0.95;Fig. 4A), indicating that the relationship between thetwo markers within the leaf was parallel, regardless ofthe plant age and of the level of N fertilization.
The correlation between total N and chlorophyll waslower (r2 5 0.70; Fig. 4B). It can be seen in Fig. 3 that atthe second sampling date, the chlorophyll content in thebasal part of the leaves was nearly identical comparedwith that at the first sampling date, whereas proteins andtotal N were significantly decreased in the Nþ treat-ment, to a level similar to that measured in theN– treatment. Both a low level of N fertilization andleaf ageing led to a decrease in free amino acids andammonium contents. In contrast to that observed fortotal N, chlorophyll and soluble proteins 71 DAS, thepresence of a necrotic area at the tip of the leaf did notfurther enhance this decrease. This result is consistentwith the changes in both amino acid and ammoniumcontents observed in the different leaf stages duringplant ageing. For example, in N– plants, leaf �3 wasfully necrotic 35 DAS and 55 DAS and characterized bythe absence of chlorophyll and proteins, whereas theamounts of free amino acids and ammonium contentswere comparable with that of other leaves (Fig. 1).
Interestingly, the progression of GS and GDH activ-ities along the leaf was different. The GS activity main-tained a quasi-linear relationship with the level of bothtotal N and soluble proteins, whereas GDH activityremained at a high level except in the fully necroticsections of the leaf. Despite these differences, bothenzymes’ activities were lower in N– plants. As alreadyshown in Fig. 1, this observation confirms the specificbehaviour of GDH that remains highly active even atvery late stages of leaf development.
Correlations between plant N content andphysiological traits
Linear or curvilinear regressions and the resulting corre-lation coefficients were calculated for the level of total
A BFig. 2. Photographs of the
leaves used to study the distri-
bution of markers for N meta-
bolism. Black lines show the limit
of the different sections at the
second sampling date. Fig. 2A
shows the leaves harvested
55 DAS in N–, and Fig. 2B shows
the leaves harvested 71 DAS in
Nþ.
182 Physiol. Plant. 124, 2005

N versus the concentration of chlorophyll, N metabolitecontent and the activities of GS and GDH. Values werecalculated by compiling the data obtained in the leafstages and in the leaf segments using the three geno-types grown under low and high N-fertilization input.Total leaf N content was used as the main basic para-meter in the correlation studies because it reflects theoverall physiological status of the plant in relation tolevel of N fertilization. Moreover, N content is one ofthe main parameters currently used when building upmathematical models to predict crop requirement underfluctuating N supply (Jeuffroy et al. 2002).
Figure 5A–D shows that in leaves there are strongrelationships between total N, chlorophyll, soluble pro-teins and free amino acid contents (r2 higher than 0.7).However, the correlation found between total N andfree amino acids content was mostly due to the varia-tions occurring between the different sampling datesand to the level of N fertilization and not to the varia-tions occurring between the different leaf stages orwithin a single leaf. This interpretation is illustrated inFigs 1 and 3, where in contrast to what occurred for
total N, no consistent pattern could be seen for freeamino acids, either in the different leaf stages or in thedifferent section of a single leaf, respectively.
Interestingly, we found a genotype-specific curvi-linear relation between leaf N and chlorophyll, revealedby a specific response curve for each genotyperegardless of either the age of the leaf or the level of Nfertilization (Fig. 5A). The variations in soluble proteinswere linearly correlated to that of leaf N concentration(Fig. 5B), in a similar manner to that observed within asingle leaf. However, we did not observe a cleargenotype dependence between the two parameters, aswas shown for chlorophyll. No obvious correlationbetween leaf N and free NH4
þ contents was found(Fig. 5D).
A linear relationship was obtained when leaf GSactivity was plotted versus leaf N or protein content(r2 5 0.73; Fig. 5E). In contrast to GDH activity, noclear relationship with total N was observed, exceptfor the lower values corresponding to the enzymeactivity measured in the necrotic zone of the leaf(Fig. 5F).
0
10
20
30
0 0.2 0.4 0.6 0.8 1.0
Nitr
ogen
[mg
(g D
W)–1
]
0
2
4
6
0 0.2 0.4 0.6 0.8 1.0
Dry
mat
ter
(mg
cm–2
)
N-N+
0
2
4
6
0 0.2 0.4 0.6 0.8 1
0
10
20
30
0 0.2 0.4 0.6 0.8 1
0
15
30
45
60
0 0.2 0.4 0.6 0.8 1
Pro
tein
[mg
(g D
W)–1
]
0
5
10
15
0 0.2 0.4 0.6 0.8 1
Chl
orop
hyll
[mg
(g D
W)–1
]
0
15
30
45
60
0 0.2 0.4 0.6 0.8 1
0
5
10
15
0 0.2 0.4 0.6 0.8 1
0
15
30
45
60
0 0.2 0.4 0.6 0.8 1
Am
ino
acid
[µm
ol (
g D
W)–
1 ]
0
5
10
15
0 0.2 0.4 0.6 0.8 1
NH
4+ [µ
mol
(g
DW
)–1 ]
0
15
30
45
60
0 0.2 0.4 0.6 0.8 1
0
5
10
15
0 0.2 0.4 0.6 0.8 1
0
1
2
3
0 0.2 0.4 0.6 0.8 1
GD
H [µ
mol
min
–1(g
DW
)–1]
0
1
2
3
0 0.2 0.4 0.6 0.8 1
GS
[µm
ol m
in–1
(g D
W)–1
]
0
1
2
3
0 0.2 0.4 0.6 0.8 1
0
1
2
3
0 0.2 0.4 0.6 0.8 1
Sampling date 1 Sampling date 1Sampling date 2 Sampling date 2
Fig. 3. Distribution of markers for N metabolism in different leaf sections. Changes in dry matter, metabolite content and enzyme activities in the
different sections of leaves harvested 35 DAS in Nþ and N– and 55 DAS for N– (sampling date 1) and 71 DAS in Nþ (sampling date 2). Leaf sections
are shown acropetally from left to right (. is for Nþ and n is for N–). The scale on the horizontal axis represents the position of the centre of the
section, normalized by leaf length (position of ligule is 0, position of leaf tip is 1). Vertical bars correspond to the mean � SE of three individual plants.
Physiol. Plant. 124, 2005 183

Discussion
We have examined the progressive changes in the meta-bolites’ pools and in the activity of two marker enzymesrepresentative of the transition from N assimilation to Nrecycling in the different leaf stages of three maizegenotypes. The progressive change in these pools wasmonitored during the development of plants grown inthe field at low and high levels of N fertilization and indifferent sections of a single leaf. This study has allowedthe construction of a dynamic picture, both in a spatialand in a temporal manner, of the changes in metabolicand biochemical markers for N assimilation and recy-cling occurring during the grain-filling period. The valueof this dynamic picture is discussed, with a view toemploying some of these markers to depict the N statusof the plant, either at the leaf or the whole organismlevel.In several previous investigations, it has been pro-
posed that the amount of chlorophyll represents agood senescence biomarker in a number of plant spe-cies (Makino et al. 1983, Masclaux et al. 2000) includ-ing maize (Gentinetta et al. 1986, Osaki et al. 1995).Several authors have showed that in maize, chlorophyllmeters provide a convenient and reliable way to esti-mate leaf N content during vegetative growth (Chapmanand Baretto 1997) and over a large time scale afteranthesis (Dwyer et al. 1995). We confirmed that a strongcorrelation exists between chlorophyll and total N con-tents in different leaf stages of high and low N-fertilizedplants. Because, in the present study, a large number ofsamples from three different genotypes were analysed,our results stress that two additional aspects have to betaken into account for the use of chlorophyll as a senes-cence biomarker. (1) The relationship between total Nand chlorophyll is curvilinear, exhibiting only a smallincrease in chlorophyll content at a high value of N,when the amount of soluble protein is also high. Thisobservation is consistent with the previous finding thatin the leaf above the ear the decrease in chlorophyll
content before leaf tissue necrosis is delayed comparedwith that of total N or proteins (Crafts-Brandner etPoneleit 1987). (2) The relationship between chloro-phyll and total N content is genotype-specific becausethe timing between the decrease in chlorophyll and thedecrease in total N may be variable in different hybrids(Crafts-Brandner et Poneleit 1987). Here, we showedthat this was also due in certain genotypes to thepresence of higher amounts of chlorophyll when Ncontent was maximum. This observation means thatthe amount of N used to build the photosynthetic appa-ratus differs between genotypes. Now, it remains to bedetermined whether these differences have an impacton the efficiency of the use of photosynthetic radiation,and later on, the amount of N that is remobilized duringleaf ageing.
Determining the soluble protein or the N content of aleaf would appear to be an interesting alternative tomonitor the N status of a plant during the grain-fillingperiod. In the Nþ plants, at late stages of leaf develop-ment just before the death of tissues, the amount of totalN and protein in green tissues had significantlydecreased compared with that present during the earlierstages of leaf development. However, this decrease wasnot observed in N– plants, indicating that the death oftissue is not necessarily preceded by a decrease in totalN or protein. Moreover, since death occurred, irrespec-tive of whether the soluble protein or total N contentwas high or low, it can be concluded that there is nodirect relationship between the N status of the leaf andthe onset of tissue death. The progressive loss of totalleaf N observed during the grain-filling period corre-sponds with the well-known phenomenon of chloro-plastic protein degradation (chlorophyll proteincomplexes and photosynthetic enzymes) that occurs inboth C4 (Hortensteiner and Feller 2002, Terce-Laforgueet al. 2004a) and C4 plants (Smart et al. 1995, Esquivelet al. 2000). In addition, we found that in a C4 plantsuch as maize this process does not occur at a faster rate
0
5
10
15
0 10 20 30
Nitrogen [mg (g DW)–1]
Chl
orop
hyll
[mg
(g D
W)–1
]
0
20
40
60
0 10 20 30
Nitrogen [mg (g DW)–1]
Pro
tein
s [m
g (g
DW
)–1] A B
Fig. 4. Scatter plot of soluble
proteins versus total nitrogen
(A) or chlorophyll (B) in the leaf
sections of genotype Dea.
Dates 1 and 2 are plotted
together. (.) is for Nþ and (*)
is for N–.
184 Physiol. Plant. 124, 2005

in leaves of N– plants, so that tissue necrosis was theultimate way to ensure translocation of leaf N to thegrain. This explains why tissue necrosis occurs at afaster rate in N– plants.
The free amino acid content of the leaves, in a similarmanner to chlorophyll and soluble protein, exhibited astrong relationship with the plant total N content. Thiscorrelation was due to the variation in amino acid con-tent as a function of both plant age and N fertilizationbut was not the result of changes occurring in leaves ofincreasing age along the plant. This observation suggeststhat the decrease in amino acids is due rather to a loweranabolic activity when the plant is N-depleted and/orwhen the plant becomes older, than the result of anenhanced translocation of the amino acids released dur-ing protein hydrolysis in the oldest senescing leaves(Feller and Fisher 1994). The decrease in free aminoacids in the leaves was not accompanied by a conco-mitant increase in free ammonium released during pro-tein degradation that has sometimes been observed
during dark-induced senescence (Chen and Kao 1996)or natural senescence in C3 plants (Masclaux et al.,2000). It is therefore likely that in C4 plants such asmaize grown under agronomic conditions, both theleaf amino acid and ammonium contents probablyreflect the anabolic activity of the whole plant that isknown to coexist along with protein degradation(Moutot et al., 1986).
Because a strong relationship was obtained betweenleaf GS activity and total N content, we suggest that thisenzyme is the main checkpoint controlling the N statusof the plant and therefore the flux of reduced N that isfurther transported to all plant parts. In agreement withthis hypothesis, we found that GS activity is high whenthere is a greater concentration of N available during theassimilatory phases of plant development. Followingthis, GS activity is lowered when N remobilization pro-gressively replaces N assimilation following a reductionin the availability of N. Recently, the developmentalcontrol of N demand by GS has been assessed in
0
25
50
75
100
0 10 20 30 40
Pro
tein
[mg
(g D
W)–1
]
0
20
40
60
80
0 10 20 30 40
Am
ino
acid
[µm
ol (g
DW
)–1]
0
5
10
15
0 10 20 30 40
NH
4 [µ
mol
(g D
W)–1
]
0
5
10
15
0 10 20 30 40
Nitrogen [mg (g DW)–1]
Nitrogen [mg (g DW)–1]
Nitrogen [mg (g DW)–1]
Nitrogen [mg (g DW)–1]
Nitrogen [mg (g DW)–1]
Nitrogen [mg (g DW)–1]
Chl
orop
hyll
[mg
(g D
W)–1
]
A B
C D
0
1
2
3
4
0 10 20 30 40
GS
[µ m
ol m
in–1
(g D
W)–1
]
Ec
0
1
2
3
4
0 10 20 30 40
F
GD
H [µ
mol
min
–1 (g
DW
)–1]
Fig. 5. Scatter plots
between total N content and the
amount of different markers for
N metabolism. Chlorophyll (A),
protein (B), free amino acids
(C), ammonium (D), glutamine
synthetase activity (E) and gluta-
mate dehydrogenase activity (F).
Each symbol corresponds to a leaf
sample harvested in one of the
four leaf stages, at a given date
and on a plant grown under low
or high N-fertilization regime.
One point represents either a
whole leaf for genotype Dea, F2
andMBS or a leaf section for Dea
only. Symbols are (*) for Dea,
(~) for F2 and (&) for MBS.
Physiol. Plant. 124, 2005 185

mathematical models (Nkoa et al. 2003), suggesting thatthe enzyme plays a major function during plant growthand development. Moreover, the finding that the reac-tion catalysed by GS is an important step in the controlof plant N demand is not surprising, because by exploit-ing maize genetic variability it was shown that GS1plays a key role in the assimilation and/or reassimilationof ammonium in a wide range of physiological situa-tions (Dubois et al. 2003, Hirel et al. 2001, Limami et al.2002). The finding that GS1 is the major GS isoenzymeexpressed in maize leaves whatever the leaf develop-mental stage, or the N-fertilization conditions (Hirelet al. 2005), also supports this hypothesis.Interestingly, the development of GDH activity in
maize expressed as a function of leaf age and ofN-fertilization conditions was very different comparedwith that of GS, because no significant correlation wasobtained with either total N content or with the othermetabolic markers. As already observed in tobacco,high GDH activity was always associated with a highconcentration of ammonium, which is an inducer of theenzyme activity (Terce-Laforgue et al. 2004a). In maizeleaves, the level of both GDH and ammonium did notdecrease below a certain threshold whatever the leafage or the plant developmental stage examined.Although the physiological significance of the responseof GDH to ammonia or other metabolites is still specu-lative, it is attractive to think that the enzyme may beone of the key elements sensing the N status of the plantvia the phloem (Terce-Laforgue et al. 2004b) and for thisreason the enzyme is still active until late stages of bothleaf and whole plant development.Unexpectedly, we did not observe any major varia-
tions in N metabolite content and enzyme activitywithin a single leaf blade, under either low or high Ninput. When a decrease in total N, chlorophyll andsoluble protein was observed at the tip of the oldestsenescing leaves, it was the result of tissue necrosis(Feller et al. 1977). These observations, therefore, indi-cate that until a very late stage of leaf ageing either theentire leaf blade or small leaf fragments can be ran-domly used for measuring physiological traits relatedto N metabolism. Moreover, extractable GS and GDHactivities were substantially reduced but not null innecrotic leaf sections, indicating that these are potentiallymetabolically active, as also indicated by the presence ofhigh concentrations of free amino acids and ammonium.In conclusion, we propose that there are three distinct
categories of markers, which together illustrate differentaspects of the N status of maize either at the leaf or atthe whole plant level: (1) Total N, chlorophyll, solubleprotein content and GS activity are strongly interrelatedand are indicators that mainly reflect the N status of
individual leaves, whatever the level of N fertilization.Interestingly, we found that the leaf N status specified bythese markers is not an accurate forecaster of the timingof future tissue death, which represents the ultimate stepof leaf senescence. (2) Amino acid content was influ-enced both by the level of N fertilization and by thedevelopmental stage of the plant but did not show anyclear-cut variations in the different leaf stages examined.This suggests that this marker reflects the general meta-bolic activity of the plant that is largely dependent uponN availability, whatever its metabolic origin. (3)Ammonium content and GDH activity vary between indi-vidual leaves or as a function of plant development.However, no clear relationship could be found with theage or the N status, neither at the leaf nor at the plant level.
It is clear that the physiological significance of someof these markers in the dynamics of the N status of theplant requires further research. They should, however,allow investigations into the spatial and temporal regu-lation of plant N metabolism, both at the biochemicaland molecular level, as already considered by Hirelet al. (2005). It should be possible to link these markersto the corresponding gene(s) and protein(s) and novelmodelling approaches studying their expression in thewhole plant context, can be envisaged (Hammer et al.2004). These modelling approaches will be one of thenext steps for integrating physiology and moleculargenetics in a crop such as maize, with the aim tooptimize yield as a function of N nutrition in differentgenotypes and under different environmentalconditions.
Acknowledgements – This work was founded by INRA
through the Action Incitative Programmee (AIP) ECOGENE.
The authors express their thanks to Alain Fortineau for his
technical contribution. We are particularly grateful to
Professor Peter Lea for critically reviewing the manuscript.
References
Andrews M, Lea PJ, Raven JA, Lindsey K (2004) Can genetic
manipulation of plant nitrogen assimilation enzymes result
in increased crop yield and greater N-use efficiency? An
assessment. Ann Appl Biol 145: 25–40.
Arnon DI (1949) Copper enzymes in isolated chloroplasts.
Polyphenol oxidase in Beta vulgaris L. Plant Physiol 24: 1–15.
Bradford MM (1976) A rapid and sensitive method for the
quantification of microgram quantities of protein utilizing
the principle of protein-dye binding. Anal Biochem 72:
248–254.
Chapman S, Baretto H (1997) Using a chlorophyll meter to
estimate specific leaf nitrogen of tropical maize during
vegetative growth. Agron J 89: 557–562.
186 Physiol. Plant. 124, 2005

Chen SJ, Kao CH (1996) Ammonium accumulation in rela-
tion to senescence of detached maize leaves. Bot Bull
Acad Sin 37: 255–259.
Crafts-Brandner SJ, Poneleit CG (1987) Carbon dioxide
exchange rates, ribulose bisphosphate carboxylase/oxyge-
nease and phosphoenolpyruvate carboxylase activities,
and kernel growth characteristics in maize. Plant Physiol
84: 255–260.
Drouet JL, Bonhomme R (1999) Do variations in local leaf
irradiance explains changes to leaf nitrogen within row
maize canopies? Ann Bot 84: 61–69.
Dubois F, Terce-Laforgue T, Gonzalez-Moro MB, Estavillo JM,
Sangwan R, Gallais A, Hirel B (2003) Glutamate
dehydrogenase in plants: is there a new story for an old
enzyme? Plant Physiol Biochem 41: 565–576.
Dwyer LM, Anderson AM, Ma BL, Stewart DW, Tollenaar M,
Gregorich E (1995) Quantifying the nonlinearity in chlor-
ophyll meter response to corn leaf nitrogen concentration.
Can J Plant Sci 75: 179–182.
Esquivel MG, Ferreira RB, Teixeira AR (2000) Protein degra-
dation in C3 and C4 plants subjected to nutrient starvation;
particular reference to ribulose bisphosphate carboxylase/
oxygenase and glycolate oxidase. Plant Sci 153: 15–23.
Feller U, Fischer A (1994) Nitrogen metabolism in senescing
leaves. CRC Crit Rev Plant Sci 13: 241–273.
Feller UK, Tai-Sen TS, Hageman R (1977) Leaf proteolytic
activities and senescence of field grown corn (Zea mays L.).
Plant Physiol 59: 290–294.
Fournier F, Andrieu B (1999) ADEL maize: an 1-system based
model for the integration of growth processes from the
organ to the canopy. Application to regulation of mor-
phogenesis by light availibility. Agronomie 19: 313–327.
Gallais A, Hirel B (2004) An approach of the genetics of
nitrogen use efficiency in maize. J Exp Bot 396: 295–306.
Gentinetta E, Ceppi D, Perico G, Motto M, Salamini F (1986) A
major gene for delayed senescence in maize. Pattern photo-
synthesis accumulation inheritance. Plant Breed 97: 193–203.
Hammer GL, Sinclair TR, Chapman SC, Oosterom E (2004)
On systems thinking, systems biology, and the in silico
plant. Plant Physiol 134: 909–911.
Hirel B, Bertin P, Quillere I, Bourdoncle W, Attagnant C,
Dellay C, Gouy A, Cadiou S, Retailliau C, Falque M,
Gallais A (2001) Towards a better understanding of the
genetic and physiological basis for nitrogen use efficiency
in maize. Plant Physiol 125: 1258–1270.
Hirel B, Lea PJ (2002) The biochemistry, Molecular Biology,
and genetic manipulation of primary ammonia assimila-
tion. In: Foyer, CH, Noctor, G, eds. Photosynthetic
Nitrogen Assimilation and Associated Carbon and
Respiratory Metabolism. Advances in Photosynthesis and
Respiration. Kluwer. Academic Publishers, Dordrecht,
Boston, London, pp 71–92.
Hirel B, Martin A, Terce-Laforgue T, Gonzalez-Moro MB,
Estavillo JM (2005) Physiology of maize I: a
comprehensive and integrated view of nitrogen metabo-
lism in a C4 plant. Physiol Plant (in press).
Hortensteiner S, Feller U (2002) Nitrogen metabolism and
remobilization during senescence. J Exp Bot 53: 927–937.
Husted S, Hebbern CA, Mattson M, Schjoerring JK (2000) A
critical experimental evaluation of methods for determi-
nation of NH4þ in plant tissue, xylem sap and apoplastic
fluid. Physiol Plant 109: 167–179.
Jeuffroy MH, Ney B, Ourry A (2002) Integrated physiological
and agronomic modelling of N capture and use within the
plant. J Exp Bot 53: 809–823.
Lawlor DW (2002) Carbon and nitrogen assimilation in
relation to yield: mechanisms are the key to understanding
production systems. J Exp Bot 53: 773–787.
Limami AM, Rouillon C, Glevarec G, Gallais A, Hirel B
(2002) Genetic and physiological analysis of germination
efficiency in maize in relation to nitrogen metabolism
reveals the importance of cytosolic glutamine synthetase.
Plant Physiol 130: 1860–1870.
Makino A, Mae T, Ohira K (1983) Photosynthesis and
Ribulose 1,5-bisphosphate carboxylase in rice leaves.
Change in photosynthesis and enzymes involved in carbon
assimilation from leaf development through senescence.
Plant Physiol 73: 1002–1007.
Masclaux C, Valadier MH, Brugiere N, Morot-Gaudry JF,
Hirel B (2000) Characterization of the sink/source transi-
tion in tobacco (Nicotiana tabacum L.) shoots in relation to
nitrogen management and leaf senescence. Planta 211:
510–518.
Moutot F, Huet JC, Morot-Gaudry JF, Pernollet JC (1986)
Relationship between photosynthesis and protein synthesis
in maize. I. Kinetics of translocation of the photoassimi-
lated carbon from the ear leaf to the seed. Plant Physiol 80:
211–215.
Nkoa R, Desjardins Y, Tremblay N, Querec L, Baana M,
Nkoa B (2003) A mathematical model for nitrogen
demand quantification and a link to broccoli (Brassica
oleracea var. italica) glutamine synthetase activity. Plant
Sci 165: 483–496.
O’Neal D, Joy KD (1973) Glutamine synthetase of pea
leaves. I. Purification, stabilisation and pH optima. Arch
Biochem Biophys 159: 113–122.
Osaki M, Iyoda M, Tdano T (1995) Effect of nitrogen
application and sink manipulation on the content of
ribulose-1,5-bisphophate carboxylase/ oxygenase,
phosphoenolpyruvate carboxylase, and chlorophyll in
leaves of maize during the maturation stage. Soil Sci Plant
Nutr 41: 295–303.
Rosen H (1957) A modified ninhydrin colorimetric analysis
for amino acids. Arch Biochem Biophys 67: 10–15.
Smart CM, Hosken SE, Thomas H, Greaves JA, Blair BG,
Schuch W (1995) The timing of leaf senescence and
characterisation of senescence-related cDNAs. Physiol
Plant 93: 673–682.
Physiol. Plant. 124, 2005 187

Terce-Laforgue T, Mack G, Hirel B (2004a) New insights
towards the function of glutamate dehydrogenase revealed
during source-sink transition of tobacco (Nicotiana taba-
cum L.) plants grown under different nitrogen regimes.
Physiol Plant 120: 220–228.
Terce-Laforgue T, Dubois F, Ferrario-Mery S, Pou de
Crecenzo MA, Sangwan R, Hirel B (2004b) Glutamate
dehydrogenase of tobacco (Nicotiana tabacum L.) is
mainly induced in the cytosol of phloem companion
cells when ammonia is provided either externally or
released during photorespiration. Plant Physiol 136:
4308–4317.
Turano FJ, Thakkar SS, Fang T, Weisemann JM (1996)
Characterisation and expression of NAD(H) dependent
glutamate dehydrogenase genes in Arabidopsis. Plant
Physiol 113: 1329–1341.
Yamaya T, Obara M, Nakajima H, Sasaki S, Hayakawa T,
Sato T (2002) Gentic manipulation and quantitative-trait
loci mapping for nitrogen recycling in rice. J Exp Bot 370:
917–925.
Edited by J.K. Schjørring
188 Physiol. Plant. 124, 2005
Copyright © 2022 FDOKUMEN