Assessment of growth and yield losses in two Zea mays L. cultivars (quality protein maize and...
14
RESEARCH ARTICLE Assessment of growth and yield losses in two Zea mays L. cultivars (quality protein maize and nonquality protein maize) under projected levels of ozone Aditya Abha Singh & S. B. Agrawal & J. P. Shahi & Madhoolika Agrawal Received: 17 May 2013 /Accepted: 23 September 2013 /Published online: 11 October 2013 # Springer-Verlag Berlin Heidelberg 2013 Abstract Rapid industrialization and economic developments have increased the tropospheric ozone (O 3 ) budget since preindustrial times, and presently, it is supposed to be a major threat to crop productivity. Maize (Zea mays L.), a C4 plant is the third most important staple crop at global level with a great deal of economic importance. The present study was conducted to evaluate the performance of two maize cultivars [HQPM1: quality protein maize (QPM)] and [DHM117: nonquality protein maize (NQPM)] to variable O 3 doses. Experimental setup included filtered chambers, nonfiltered chambers (NFC), and two elevated doses of O 3 viz. NFC+ 15 ppb O 3 (NFC+15) and NFC+30 ppb O 3 (NFC+30). During initial growth period, both QPM and NQPM plants showed hormetic effect that is beneficial due to exposure of low doses of a toxicant (NFC and NFC+15 ppb O 3 ), but at later stages, growth attributes were negatively affected by O 3 . Growth indices showed the variable pattern of photosynthate translo- cation under O 3 stress. Foliar injury in the form of interveinal chlorosis and reddening of leaves due to increased production of anthocyanin pigments was observed at higher concentra- tions of O 3 . One-dimensional gel electrophoresis of leaves taken from NFC+30 showed reductions of major photosyn- thetic proteins, and differential response was observed between the two test cultivars. Decline in the number of male flowers at elevated O 3 doses suggested damaging effect of O 3 on repro- ductive structures which might be a cause of productivity losses. Variable carbon allocation pattern particularly to husk leaves, foliar injury, and damage of photosynthetic proteins led to significant reductions in economic yield at higher O 3 doses. PCA showed that both the cultivars responded more or less similarly to O 3 stress in their respective groupings of growth and yield parameters, but magnitude of their response was variable. It is further supported by difference in the significance of correlations between variables of yield and AOT40. Cultivar response reflects that QPM performed better than NQPM against elevated O 3 . Keywords Tropospheric ozone . Zea mays L. . QPM . Growth . Foliar injury . Photosynthetic proteins . Yield Introduction Rapid industrialization and expanding economy have guided us towards an increased emission of O 3 precursors leading to an increase in its concentration (Wang and Mauzerall 2004; Van Dingenen et al. 2009). Background O 3 concentrations have doubled since preindustrial times to the level ranging from 20 to 45 nL/L (Vingarzan 2004). According to Meehl et al. (2007), if there is unremitting emission of O 3 precursors as suggested by various models (increase of 20–25 % in O 3 Responsible editor: Philippe Garrigues A. A. Singh : S. B. Agrawal (*) : M. Agrawal Laboratory of Air Pollution and Global Climate Change, Department of Botany, Banaras Hindu University, Varanasi 221005, India e-mail: [email protected] A. A. Singh e-mail: [email protected] M. Agrawal e-mail: [email protected] J. P. Shahi Department of Genetics and Plant Breeding, Institute of Agricultural Sciences, Banaras Hindu University, Varanasi 221005, India e-mail: [email protected] Environ Sci Pollut Res (2014) 21:2628–2641 DOI 10.1007/s11356-013-2188-6
-
Upload
independent -
Category
Documents
-
view
0 -
download
0
Transcript of Assessment of growth and yield losses in two Zea mays L. cultivars (quality protein maize and...

RESEARCH ARTICLE
Assessment of growth and yield losses in two Zea mays L.cultivars (quality protein maize and nonquality protein maize)under projected levels of ozone
Aditya Abha Singh & S. B. Agrawal & J. P. Shahi &Madhoolika Agrawal
Received: 17 May 2013 /Accepted: 23 September 2013 /Published online: 11 October 2013# Springer-Verlag Berlin Heidelberg 2013
Abstract Rapid industrialization and economic developmentshave increased the tropospheric ozone (O3) budget sincepreindustrial times, and presently, it is supposed to be a majorthreat to crop productivity. Maize (Zea mays L.), a C4 plant isthe third most important staple crop at global level with a greatdeal of economic importance. The present study wasconducted to evaluate the performance of two maize cultivars[HQPM1: quality protein maize (QPM)] and [DHM117:nonquality protein maize (NQPM)] to variable O3 doses.Experimental setup included filtered chambers, nonfilteredchambers (NFC), and two elevated doses of O3 viz. NFC+15 ppb O3 (NFC+15) and NFC+30 ppb O3 (NFC+30). Duringinitial growth period, both QPM and NQPM plants showedhormetic effect that is beneficial due to exposure of low dosesof a toxicant (NFC and NFC+15 ppb O3), but at later stages,growth attributes were negatively affected by O3. Growthindices showed the variable pattern of photosynthate translo-cation under O3 stress. Foliar injury in the form of interveinal
chlorosis and reddening of leaves due to increased productionof anthocyanin pigments was observed at higher concentra-tions of O3. One-dimensional gel electrophoresis of leavestaken from NFC+30 showed reductions of major photosyn-thetic proteins, and differential responsewas observed betweenthe two test cultivars. Decline in the number of male flowers atelevated O3 doses suggested damaging effect of O3 on repro-ductive structures which might be a cause of productivitylosses. Variable carbon allocation pattern particularly to huskleaves, foliar injury, and damage of photosynthetic proteins ledto significant reductions in economic yield at higher O3 doses.PCA showed that both the cultivars responded more or lesssimilarly to O3 stress in their respective groupings of growthand yield parameters, but magnitude of their response wasvariable. It is further supported by difference in the significanceof correlations between variables of yield and AOT40. Cultivarresponse reflects that QPM performed better than NQPMagainst elevated O3.
Keywords Tropospheric ozone . Zeamays L. . QPM .
Growth . Foliar injury . Photosynthetic proteins . Yield
Introduction
Rapid industrialization and expanding economy have guidedus towards an increased emission of O3 precursors leading toan increase in its concentration (Wang and Mauzerall 2004;Van Dingenen et al. 2009). Background O3 concentrationshave doubled since preindustrial times to the level rangingfrom 20 to 45 nL/L (Vingarzan 2004). According to Meehlet al. (2007), if there is unremitting emission of O3 precursorsas suggested by various models (increase of 20–25 % in O3
Responsible editor: Philippe Garrigues
A. A. Singh : S. B. Agrawal (*) :M. AgrawalLaboratory of Air Pollution and Global Climate Change, Departmentof Botany, Banaras Hindu University, Varanasi 221005, Indiae-mail: [email protected]
A. A. Singhe-mail: [email protected]
M. Agrawale-mail: [email protected]
J. P. ShahiDepartment of Genetics and Plant Breeding, Institute of AgriculturalSciences, Banaras Hindu University, Varanasi 221005, Indiae-mail: [email protected]
Environ Sci Pollut Res (2014) 21:2628–2641DOI 10.1007/s11356-013-2188-6

concentration by 2050 and 40–60 % by 2100), ensuing croplosses will lead to a serious threat to food security. Variousstudies documented in literature confirm the negative impactof O3 on agricultural productivity. Therefore, a normal ap-proach for any nation in the future will be to strengthen itsagricultural production for meeting future demands for theever increasing population. It will be a challenge for a devel-oping country like India since its rising NOx emission rates (aprecursor of O3) and its location in the tropical region of theglobe favors the formation of tropospheric O3. It has alreadybeen reported that East Asia and Pakistan are likely to expe-rience reductions in crop forage production due to ambient O3
(Emberson et al. 2009; Wang and Mauzerall 2004; Ashmore2005). So, the present study was designed to study the impactof current and future levels of O3 on two cultivars of maize, aC4 crop plant differing in their nutritional quality. Maize isgrown largely throughout the world as third important staplecrop, and India ranks fifth for its contribution in the world formaize economy. Although some studies on maize have beenreported from developed countries (Rudorff et al. 1996;Mulchi et al. 1995; Heagle et al. 1972; Leitao et al. 2007a,b), to the best of our knowledge, no such report is availablefrom Asia [specifically quality protein maize (QPM) andnonquality protein maize (NQPM)]. QPM is an improvedvariety of maize, which contains more than twice the nourish-ment of two essential amino acids tryptophan and lysine withlower amount of leucine and isoleucine than those of thenormal maize or nonquality protein maize (Jat et al. 2009).Several studies indicated that the QPM protein contains ingeneral 55 % more tryptophan, 30 % more lysine, and 38 %less leucine than non-QPM (Prasanna et al. 2001). Such abalanced combination of amino acids in the endosperm ofmaize results in its improved biological value ensuring moreavailability of qualitative protein to human and animal thannonquality protein maize and even other cereals.
Ozone being a potent oxidant generates reactive oxygenspecies and thus alters the antioxidative defense system, re-duces plant growth, and manipulates carbon allocation patternleading to yield reductions (Anisworth 2008; Biswas et al.2008; Singh et al. 2009; Sarkar and Agrawal 2010b, 2011).Some of the changes in plant metabolism due to O3 manifestthemselves in the form of visible foliar injury (Krupa et al.2001). Various workers (Sarkar and Agrawal 2010a, Torreset al. 2007, Leitao et al. 2007a) have reported visible foliarinjury in different crop plants supporting the view that senes-cence process is accelerated by O3. Miller et al. (1999) report-ed that there was an induction of 12 senescence-related genesin Arabidopsis thaliana leading to its premature senescenceunder O3 stress. Different studies indicate that O3 damages thephotosynthetic machinery leading to a progressive loss in theamount as well as the activity of ribulose-1, 5-bisphosphatecarboxylase/oxygenase (RuBisCO) (Cho et al. 2008, Fenget al. 2008, Sarkar and Agrawal 2010a). It also imparts its
detrimental effect on reproductive parts and different phasesof reproductive cycle (Black et al. 2000). Hence, the presentstudy was aimed to throw light on the future impacts ofincreasing levels of O3 on the two maize cultivars (QPMand NQPM) using open top chambers (OTCs) having nearnatural field conditions on (a) growth, biomass production,and its allocation pattern under different levels of O3, (b) O3
induced visible injury and its developmental pattern, (c) O3
induced damage at molecular level with the help of proteinprofile, and (d) yield reductions at current and elevated O3
concentrations with respect to filtered chambers for two testcultivars. The study was done principally to assess the betterperformer between two varieties at futuristic levels of O3.Overall response of the selected maize cultivars differing intheir nutritional quality under projected levels of O3 would bean important insight for agronomists and plant breeders forselecting and developing the suitable cultivars for the areashaving high O3 atmosphere.
Material and methods
Experimental site and study material
The experimental site was located at the Agriculture ResearchFarm of Banaras Hindu University (25°14′ N latitude and82°03′ E longitude) belonging to subrural area of Varanasi at76 m above the mean sea level. The experiment was carriedout between December 2011and April 2012. The plants werecultivated in the field, i.e., directly on land. Soil of the trial sitewas sandy loam in texture with soil pH 7.4 and organic carboncontent 0.98 %. Total nitrogen content was 0.05 % and avail-able phosphorus content 0.288 mg g−1. Two high-yieldingcultivars of maize (Zea mays L.) were chosen for the study(HQPM1 and DHM117). HQPM1 is QPM with an averageyield of 62 q ha−1, and DHM117 is a non-QPM (NQPM)whose average yield is 75 q ha−1.
Experimental setup
Five treatments were kept for each of the hybrid cultivarswhich included filtered chambers (FC) in which approximate-ly 92 % of the O3 is scrubbed off using charcoal filters (Sarkarand Agrawal 2010a). Nonfiltered chambers (NFC) with am-bient O3 concentration, two elevated doses of O3 viz NFC+15 ppb O3(NFC+15) and NFC+30 ppb O3(NFC+30) abovethe ambient level of O3 given for 5 h daily (1030 to1530 hours) through O3 generators (Systrocom Instruments,Varanasi) from 10 days after emergence (DAE) until thematurity of the plants. The two doses of O3, one lower andanother higher were selected as per the predictions of Meehlet al. (2007) for 2050 and 2100. In addition to these, an openplot treatment (OP) was also kept to monitor chamber effect if
Environ Sci Pollut Res (2014) 21:2628–2641 2629

any. Open top chambers (OTCs) with 2.5 m diameter and2.5 m height and open plots of 2×2 m were kept in triplicate.So, a total number of 24 OTCs were installed (three OTCs asreplicates of each treatment for both the cultivars). Distancebetween the rows was 60 cm, and plant to plant distance wasmaintained at 20 cm. Hence, a total of 34 plants were plantedin four rows in a single OTC. Recommended dose of fertil-izers were supplemented as 120, 60, 40 kg/ha NPK, respec-tively. A full dose of P and K was given at the time of sowingwhile nitrogen was given in three split doses.
Variables of meteorological condition
Different meteorological variables like minimum and maxi-mum temperature, relative humidity, sunshine hours, and rain-fall of the experimental site were recorded daily from theIndian Meteorological Division, Banaras Hindu University.
Ozone monitoring and AOT40
Inside the OTCs, O3 concentrations were standardized beforestarting the experiment by continuous monitoring and O3
generators were optimized to produce the required concentra-tions of O3. During the experimental period, the concentrationwas checked by O3 analyzer (Horiba, APOA-370; Japan) ineach of the OTCs at regular intervals. This was achieved byusing a teflon tube (0.35 cm diameter) placed randomly abovethe canopy of plants. Ten hourly (0800 to 1800 hours) ambientO3 concentrations were monitored using another O3 analyzer(Horiba, APOA-370, Japan) for the entire experimental periodat the experimental site. For each dose of O3, data was com-puted as elevation above the ambient level as hourly meanvalues for the exposure duration (1030 to 1530 hours) follow-ed by the calculation of meanmonthly O3 concentration. AOT40 (accumulated exposure over a threshold of 40 ppb) forambient and two O3 doses was calculated as the hours ex-ceeding 40 ppb during the exposure period for each day, andits cumulative value for the entire exposure period was calcu-lated using the formula given by Mauzerall and Wang (2001).
Growth parameters
A destructive harvest of the plants with intact roots was carriedout at 35, 70, and 105 days after the emergence of kernels(DAE) in OTCs and open plots. Five plants per OTCs for eachtreatment were sampled randomly. Plant samples were ana-lyzed for shoot length, root length, number of leaves, and leafarea. For biomass determination, individual plant parts wereseparated and oven-dried at 80 °C and were weighed sepa-rately. Portable Leaf area meter (LI-3000, LICOR, Inc. USA)was used for leaf area measurement. Green leaf area ratio(GLAR) was computed by the formula given by Mulhollandet al. (1997). Growth indices were calculated using the
standard formulae of Hunt (1982). At the third sampling stage(105 DAE), five plants that were selected for analysis ofgrowth variables from each chamber and OP were also usedfor counting the number of male flowers.
Foliar injury analysis and protein isolation for SDS-PAGE
Ozone-induced leaf injuries were observed daily on maizecultivars in all the tested atmospheres of O3. Injuries wereobserved mainly on the mature leaves. Lowermost leaveswere not taken into consideration for foliar injury profilingsince in O3-enriched environment, most of them were with-ered off with complete senescence but remain attached to theplants; these leaves were considered as standing dead. Forfoliar injury profiling five plants from each treatment set werecollected at 70 and 105 DAE after the manifestation of injuriesin different treatments. All the leaves of the plants (with orwithout injury symptoms) were collected (excluding standingdead), and their total area was measured through portable leafarea meter (LI 3000, LICOR Inc, USA) after that injuryshowing area was cut and measured again with the sameinstrument. Foliar injury percentage (FIP) was calculatedaccording to the formula given by Rao et al. (1995).
Protein isolation-leaves showing injury symptom fromNFC+30 (FIP between10–20 %) were taken, and their injuredarea was cut and used for protein isolation and normal asymp-tomatic leaves were taken from plants growing in FC fromboth the cultivars to obtain one dimension protein profile at 80DAE. Protein extraction was done according to the methoddescribed by Sarkar and Agrawal (2010a). Quantification ofprotein was done by the method of Bradford (1976). Sodiumdodecyl sulfate-polyacrylamide gel electrophoresis (SDS-PAGE) equal protein concentration (80 μg of protein) in gelloading buffer (125 mM Tris–HCl pH 6.8,10 % w /v SDS,10 % v /v glycerol, and 0.01 % w /v bromophenol blue) wasloaded per well. It was then resolved on 12 % polyacrylamidegel (5 % stacking and 12 % resolving gel) with a constantcurrent supply of 15 mA. Protein gels were scanned andanalyzed using PhotoCapMw version 99.4 software; molecu-lar weight of all the bands were calculated and proteins show-ing changes in the protein profile were searched in the avail-able bioinformatics public database (Uniprot) for theiridentification.
Yield parameters
After the physiological maturity of the plants, final harvestingwas done on 140 DAE for both the cultivars. Ten plants wereharvested from each OTC and weight of cobs plant−1 wastaken. Number of rows of kernel in each cob and number ofkernels cob−1 was counted. Weight of kernels plant−1 (grams)and 1,000 kernel weight were also taken. Harvest Index (HI)was calculated as the ratio of economic yield (weight of
2630 Environ Sci Pollut Res (2014) 21:2628–2641
kernels plant−1) to biological yield (total above ground bio-mass). Yield was calculated in terms of weight of kernels m−2
(grams). Relative yield was calculated by the formula:
Relativeyield ¼ YieldatelevatedO3 dose
Yieldof FC
Where FC is the yield of filtered chamber.
Statistical analysis
The data obtained were subjected to two- and three-way analysisof variance (ANOVA) for assessing the significance of quanti-tative changes in the variables as a result of O3 and theirrespective interactionwith age and cultivar. To overviewwhetherthe two selected cultivars differed in their response to O3 stress,selected growth parameters and yield attributes were subjected toprincipal component analysis. This approach was also taken totest the response of each parameter towards the stress in relationto each other. In a dataset, the first principal component explainsmost of the variance in data; hence, in our analysis, the first twocomponents were selected which showed maximum varianceand a scatter plot was obtained for the parameters that were takeninto consideration. Our principal component analysis (PCA)
results are based on the correlation matrix with the rotationmethod of varimax with Kaiser normalization. Loading valuesof more than 0.5 in both the components were considered to besignificantly influenced by O3. Correlation was done betweensome of the yield parameters and AOT 40 to test if any signif-icant correlation exists between the yield attributes of QPM andNQPM with AOT 40. Regression equation was calculated forthe correlation test between yield (kernels m−2) and AOT40. Allthe statistical analyses were performed using SPSS software(SPSS Inc. version 16.0).
Results
Meteorological parameters
The weather of Varanasi is characterized by dry tropicalmonsoon climate. Maximum temperature varied from 21.7to 38.5 °C, and minimum temperature varied from 9.7 to22.2 during the experimental period. Total rainfall wasmaximum in January, i.e., 191.2 mm. Mean sunshine hourswas least in December while it was maximum in April.Meteorological parameters during the experimental periodare provided in Table 1.
Ozone monitoring and AOT40
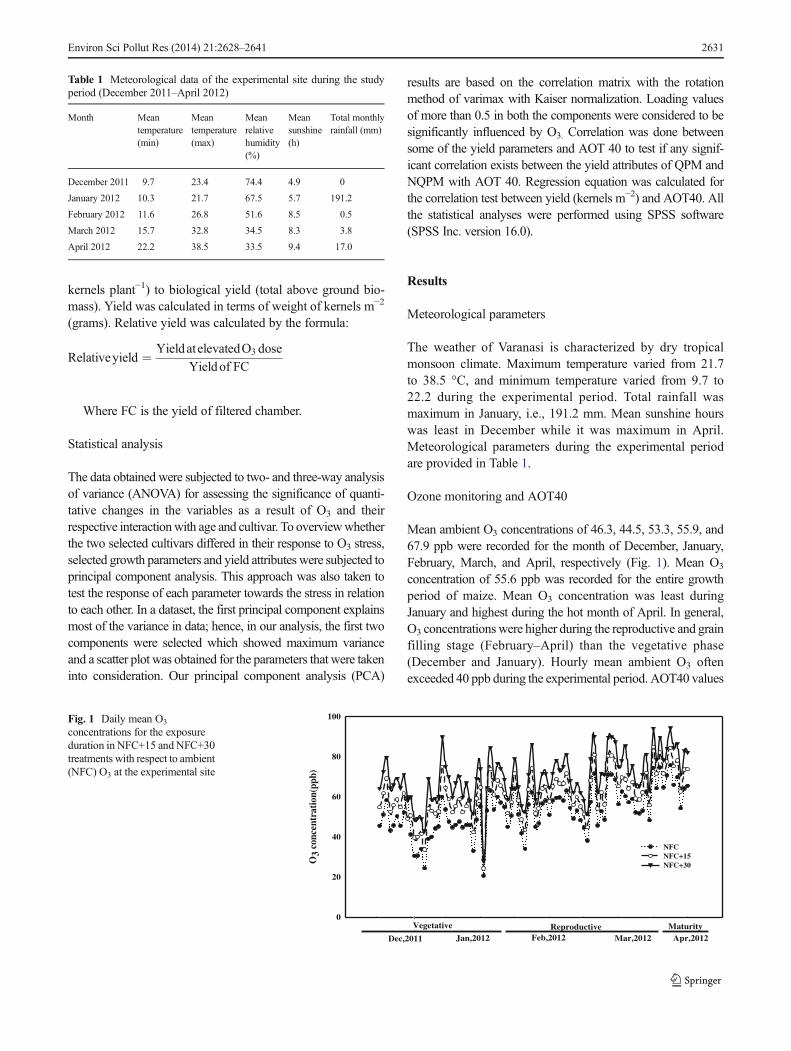
Mean ambient O3 concentrations of 46.3, 44.5, 53.3, 55.9, and67.9 ppb were recorded for the month of December, January,February, March, and April, respectively (Fig. 1). Mean O3
concentration of 55.6 ppb was recorded for the entire growthperiod of maize. Mean O3 concentration was least duringJanuary and highest during the hot month of April. In general,O3 concentrationswere higher during the reproductive and grainfilling stage (February–April) than the vegetative phase(December and January). Hourly mean ambient O3 oftenexceeded 40 ppb during the experimental period. AOT40 values
Table 1 Meteorological data of the experimental site during the studyperiod (December 2011–April 2012)
Month Meantemperature(min)
Meantemperature(max)
Meanrelativehumidity(%)
Meansunshine(h)
Total monthlyrainfall (mm)
December 2011 9.7 23.4 74.4 4.9 0
January 2012 10.3 21.7 67.5 5.7 191.2
February 2012 11.6 26.8 51.6 8.5 0.5
March 2012 15.7 32.8 34.5 8.3 3.8
April 2012 22.2 38.5 33.5 9.4 17.0
O3
conc
entr
atio
n(pp
b)
0
20
40
60
80
100
Dec,2011 Jan,2012 Feb,2012 Mar,2012 Apr,2012
Vegetative Reproductive Maturity
NFCNFC+15NFC+30
Fig. 1 Daily mean O3
concentrations for the exposureduration in NFC+15 and NFC+30treatments with respect to ambient(NFC) O3 at the experimental site
Environ Sci Pollut Res (2014) 21:2628–2641 2631
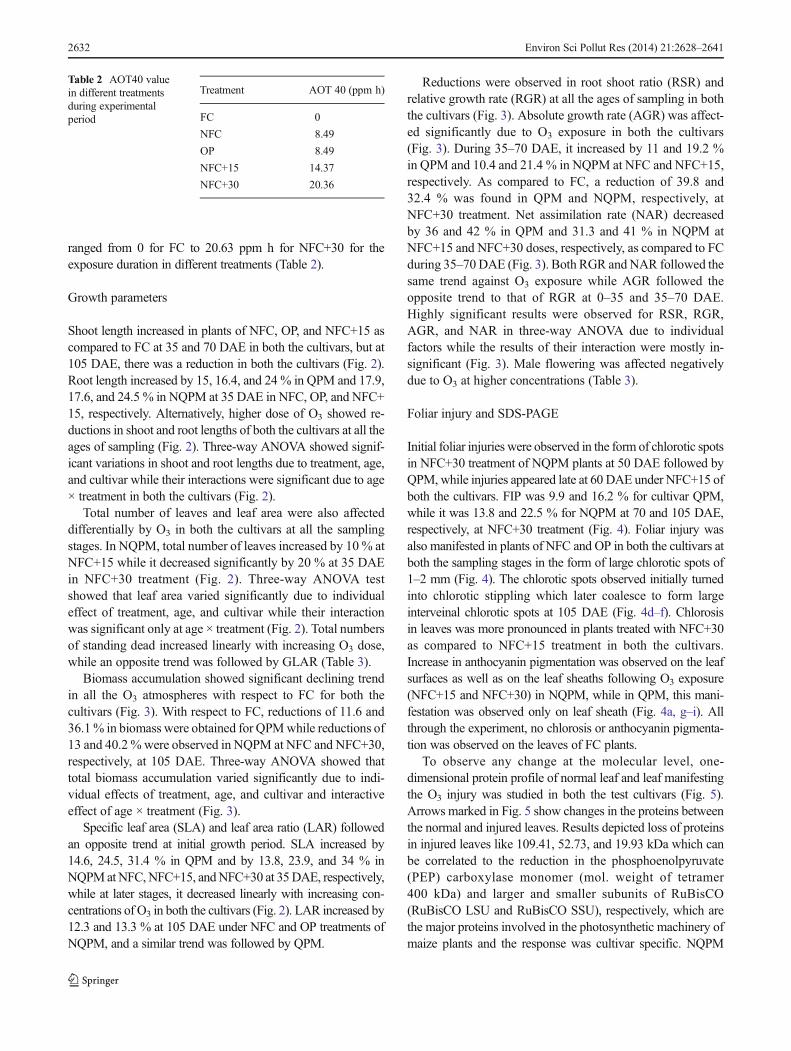
ranged from 0 for FC to 20.63 ppm h for NFC+30 for theexposure duration in different treatments (Table 2).
Growth parameters
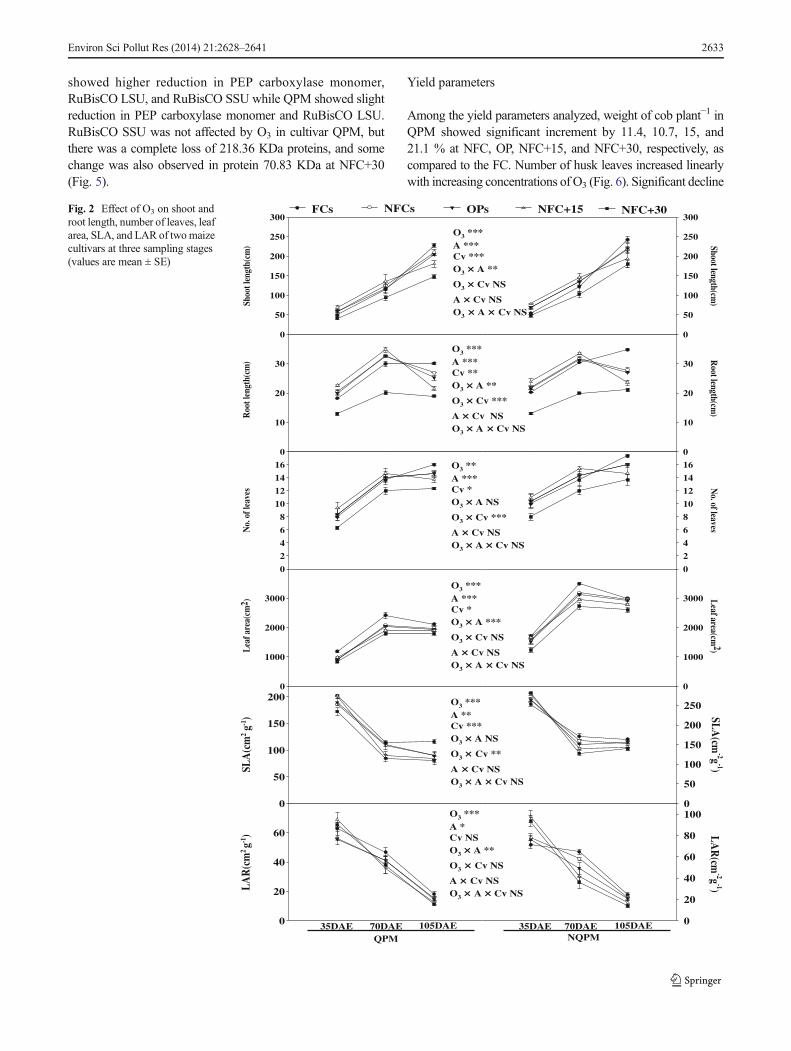
Shoot length increased in plants of NFC, OP, and NFC+15 ascompared to FC at 35 and 70 DAE in both the cultivars, but at105 DAE, there was a reduction in both the cultivars (Fig. 2).Root length increased by 15, 16.4, and 24 % in QPM and 17.9,17.6, and 24.5 % in NQPM at 35 DAE in NFC, OP, and NFC+15, respectively. Alternatively, higher dose of O3 showed re-ductions in shoot and root lengths of both the cultivars at all theages of sampling (Fig. 2). Three-way ANOVA showed signif-icant variations in shoot and root lengths due to treatment, age,and cultivar while their interactions were significant due to age× treatment in both the cultivars (Fig. 2).
Total number of leaves and leaf area were also affecteddifferentially by O3 in both the cultivars at all the samplingstages. In NQPM, total number of leaves increased by 10 % atNFC+15 while it decreased significantly by 20 % at 35 DAEin NFC+30 treatment (Fig. 2). Three-way ANOVA testshowed that leaf area varied significantly due to individualeffect of treatment, age, and cultivar while their interactionwas significant only at age × treatment (Fig. 2). Total numbersof standing dead increased linearly with increasing O3 dose,while an opposite trend was followed by GLAR (Table 3).
Biomass accumulation showed significant declining trendin all the O3 atmospheres with respect to FC for both thecultivars (Fig. 3). With respect to FC, reductions of 11.6 and36.1% in biomass were obtained for QPMwhile reductions of13 and 40.2 % were observed in NQPM at NFC and NFC+30,respectively, at 105 DAE. Three-way ANOVA showed thattotal biomass accumulation varied significantly due to indi-vidual effects of treatment, age, and cultivar and interactiveeffect of age × treatment (Fig. 3).
Specific leaf area (SLA) and leaf area ratio (LAR) followedan opposite trend at initial growth period. SLA increased by14.6, 24.5, 31.4 % in QPM and by 13.8, 23.9, and 34 % inNQPMatNFC,NFC+15, andNFC+30 at 35DAE, respectively,while at later stages, it decreased linearly with increasing con-centrations of O3 in both the cultivars (Fig. 2). LAR increased by12.3 and 13.3 % at 105 DAE under NFC and OP treatments ofNQPM, and a similar trend was followed by QPM.
Reductions were observed in root shoot ratio (RSR) andrelative growth rate (RGR) at all the ages of sampling in boththe cultivars (Fig. 3). Absolute growth rate (AGR) was affect-ed significantly due to O3 exposure in both the cultivars(Fig. 3). During 35–70 DAE, it increased by 11 and 19.2 %in QPM and 10.4 and 21.4 % in NQPM at NFC and NFC+15,respectively. As compared to FC, a reduction of 39.8 and32.4 % was found in QPM and NQPM, respectively, atNFC+30 treatment. Net assimilation rate (NAR) decreasedby 36 and 42 % in QPM and 31.3 and 41 % in NQPM atNFC+15 and NFC+30 doses, respectively, as compared to FCduring 35–70DAE (Fig. 3). Both RGR andNAR followed thesame trend against O3 exposure while AGR followed theopposite trend to that of RGR at 0–35 and 35–70 DAE.Highly significant results were observed for RSR, RGR,AGR, and NAR in three-way ANOVA due to individualfactors while the results of their interaction were mostly in-significant (Fig. 3). Male flowering was affected negativelydue to O3 at higher concentrations (Table 3).
Foliar injury and SDS-PAGE
Initial foliar injuries were observed in the form of chlorotic spotsin NFC+30 treatment of NQPM plants at 50 DAE followed byQPM, while injuries appeared late at 60 DAE under NFC+15 ofboth the cultivars. FIP was 9.9 and 16.2 % for cultivar QPM,while it was 13.8 and 22.5 % for NQPM at 70 and 105 DAE,respectively, at NFC+30 treatment (Fig. 4). Foliar injury wasalso manifested in plants of NFC and OP in both the cultivars atboth the sampling stages in the form of large chlorotic spots of1–2 mm (Fig. 4). The chlorotic spots observed initially turnedinto chlorotic stippling which later coalesce to form largeinterveinal chlorotic spots at 105 DAE (Fig. 4d–f). Chlorosisin leaves was more pronounced in plants treated with NFC+30as compared to NFC+15 treatment in both the cultivars.Increase in anthocyanin pigmentation was observed on the leafsurfaces as well as on the leaf sheaths following O3 exposure(NFC+15 and NFC+30) in NQPM, while in QPM, this mani-festation was observed only on leaf sheath (Fig. 4a, g–i). Allthrough the experiment, no chlorosis or anthocyanin pigmenta-tion was observed on the leaves of FC plants.
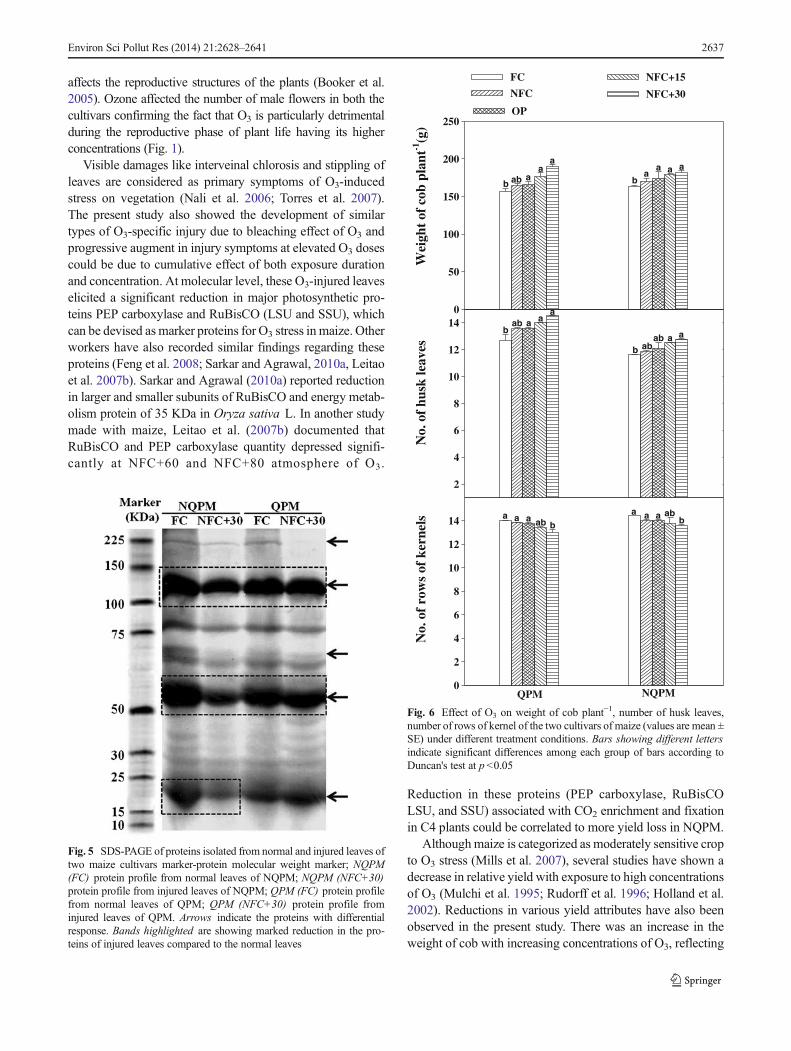
To observe any change at the molecular level, one-dimensional protein profile of normal leaf and leaf manifestingthe O3 injury was studied in both the test cultivars (Fig. 5).Arrows marked in Fig. 5 show changes in the proteins betweenthe normal and injured leaves. Results depicted loss of proteinsin injured leaves like 109.41, 52.73, and 19.93 kDa which canbe correlated to the reduction in the phosphoenolpyruvate(PEP) carboxylase monomer (mol. weight of tetramer400 kDa) and larger and smaller subunits of RuBisCO(RuBisCO LSU and RuBisCO SSU), respectively, which arethe major proteins involved in the photosynthetic machinery ofmaize plants and the response was cultivar specific. NQPM
Table 2 AOT40 valuein different treatmentsduring experimentalperiod
Treatment AOT 40 (ppm h)
FC 0
NFC 8.49
OP 8.49
NFC+15 14.37
NFC+30 20.36
2632 Environ Sci Pollut Res (2014) 21:2628–2641
showed higher reduction in PEP carboxylase monomer,RuBisCO LSU, and RuBisCO SSU while QPM showed slightreduction in PEP carboxylase monomer and RuBisCO LSU.RuBisCO SSU was not affected by O3 in cultivar QPM, butthere was a complete loss of 218.36 KDa proteins, and somechange was also observed in protein 70.83 KDa at NFC+30(Fig. 5).
Yield parameters
Among the yield parameters analyzed, weight of cob plant−1 inQPM showed significant increment by 11.4, 10.7, 15, and21.1 % at NFC, OP, NFC+15, and NFC+30, respectively, ascompared to the FC. Number of husk leaves increased linearlywith increasing concentrations of O3 (Fig. 6). Significant decline
Shoo
t len
gth(
cm)
0
50
100
150
200
250
300
Shoot length(cm)
0
50
100
150
200
250
300
Roo
t len
gth(
cm)
0
10
20
30
Root length(cm
)
0
10
20
30
No.
of l
eave
s
0
2
4
6
8
10
12
14
16
No. of leaves
0
2
4
6
8
10
12
14
16
Lea
f are
a(cm
2 )
0
1000
2000
3000 Leaf area(cm
2)
0
1000
2000
3000
FCs NFCs OPs NFC+15 NFC+30
O3 ***A ***Cv **O3 × A **
O3 × Cv ***
A × Cv NSO3 × A × Cv NS
O3 **A ***Cv *O3 × A NS
O3 × Cv ***
A × Cv NSO3 × A × Cv NS
O3 ***A ***Cv *O3 × A ***
O3 × Cv NS
A × Cv NSO3 × A × Cv NS
SLA
(cm
2 g-1
)
0
50
100
150
200
SLA
(cm-2g
-1)
0
50
100
150
200
250
LA
R(c
m2 g-1
)
0
20
40
60 LA
R(cm
-2g-1)
0
20
40
60
80
100
O3 ***A **Cv ***O3 × A NS
O3 × Cv **
A × Cv NSO3 × A × Cv NS
O3 ***A *Cv NSO3 × A **
O3 × Cv NS
A × Cv NSO3 × A × Cv NS
O3 ***A ***Cv ***O3 × A **
O3 × Cv NS
A × Cv NSO3 × A × Cv NS
35DAE 70DAE 105DAE NQPM
35DAE 70DAE 105DAEQPM
Fig. 2 Effect of O3 on shoot androot length, number of leaves, leafarea, SLA, and LAR of twomaizecultivars at three sampling stages(values are mean ± SE)
Environ Sci Pollut Res (2014) 21:2628–2641 2633
of 12.8 % was detected in number of rows of kernel cob−1 atNFC+30 in NQPM (Fig. 6). Reductions in weight of kernelsplant−1 by 4.0, 4.8, 7.2, and 10.1 % in QPM and 5.5, 5.4, 9.5,and 13.8% in NQPMwere observed at NFC, OP, NFC+15, andNFC+30, respectively (Fig. 7). Two-way ANOVA resultsshowed significant reductions in weight of kernels plant−1 dueto treatment and cultivar but not because of their interactions.Thousand kernel weight decreased significantly in both cultivarsat NFC, OP, NFC+15, and NFC+30, respectively (Fig. 7). HItoo followed the similar trend of reductions in both the cultivarsand showed significant variation due to cultivar only in two-wayANOVA test (Fig. 7).
Principal component analysis
PCA results showed that in QPM shoot length, root length,number of leaves, leaf area, GLAR, weight of kernels plant−1,and thousand kernel weight had their respective loading valuesmore than 0.5 for the first component, while number of maleflowers, number of rows of kernels, and number of kernelsplant−1 had values more than 0.5 for the second component. Itimplies that the variables having higher loading values in com-ponent one have maximum correlation among them and wereinfluenced more or less in a similar fashion by O3,while thevariables which showed higher loading values for component 2had significant correlations amongst them (Fig. 8). Similarly, forNQPM, shoot length, root length, number of leaves, leaf area,GLAR, and thousand kernel weight had their respective loadingvalues more than 0.5 for component one. Number of male
flowers, number of kernels plant−1, and weight of kernels−1werecorrelated and had loading values more than 0.5 for secondcomponent, while number of rows of kernel had the highestvalue for second component, hence, did not show any correla-tionwith other parameters. Results clearly reflect that bothQPMand NQPM responded almost in a similar manner for thestatistical analysis performed due to almost similar groupingof variables though differed in their magnitude of affect (Fig. 8).
Dose response analysis
AOT 40 and yield response relationship indicates a linear declinein crop yield resulting from cumulative exposure of O3 above40 ppb. Significant correlation was observed between yield(weight of kernels m−2), relative yield, and cumulative AOT40.Correlation analysis showed that O3 had more negative effects athigher concentrations where hourly mean often exceeded40 ppb. The equation obtained from the regression analysis(y =1,539.96–7.78x) and (y =2,058.46–9.94x) for QPM andNQPM, respectively, can predict the yield in gm−2 for variableAOT 40 values (Fig. 9). Significant correlation was also ob-served between number of kernels plant−1, weight of kernelsplant−1, thousand kernel weight, and cumulative AOT40 forboth QPM and NQPM, but significance levels of the variablesdiffered for the cultivars (Table 4). Significant correlation wasobtained between harvest index of NQPM and AOT 40, while itwas insignificant for QPM. Values of correlation coefficient (r2)showed that yield attributes of QPM were affected lesser thanthat of NQPM with respect to AOT40 (Table 4).
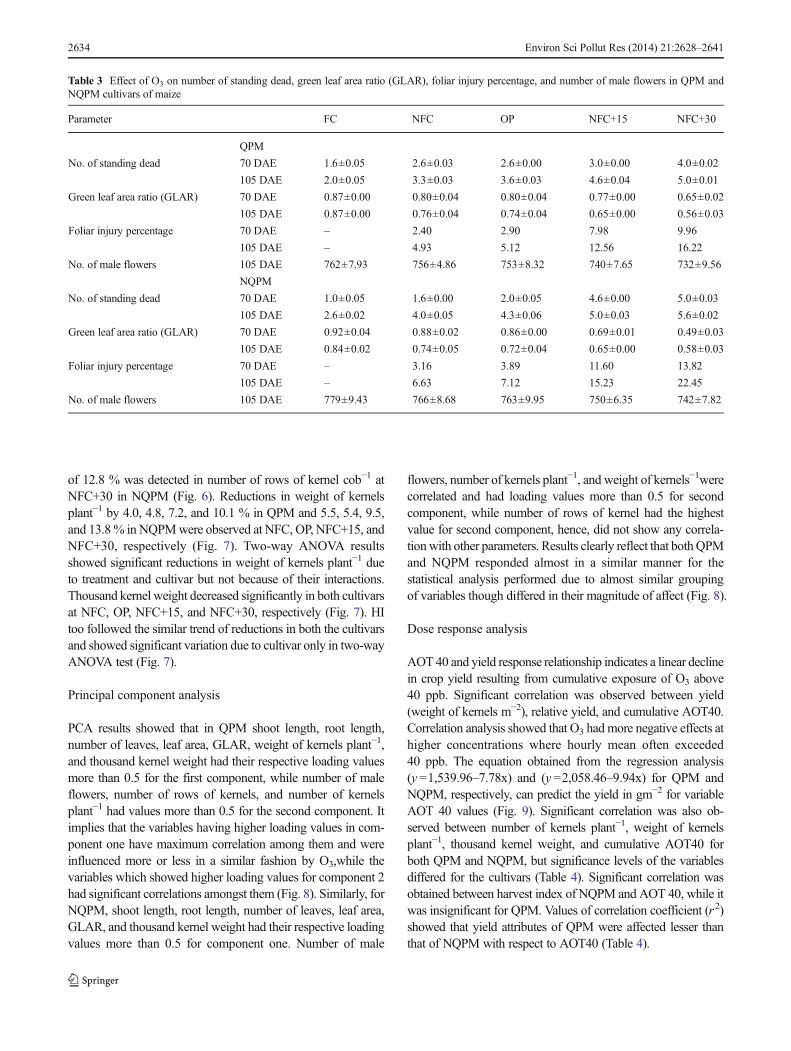
Table 3 Effect of O3 on number of standing dead, green leaf area ratio (GLAR), foliar injury percentage, and number of male flowers in QPM andNQPM cultivars of maize
Parameter FC NFC OP NFC+15 NFC+30
QPM
No. of standing dead 70 DAE 1.6±0.05 2.6±0.03 2.6±0.00 3.0±0.00 4.0±0.02
105 DAE 2.0±0.05 3.3±0.03 3.6±0.03 4.6±0.04 5.0±0.01
Green leaf area ratio (GLAR) 70 DAE 0.87±0.00 0.80±0.04 0.80±0.04 0.77±0.00 0.65±0.02
105 DAE 0.87±0.00 0.76±0.04 0.74±0.04 0.65±0.00 0.56±0.03
Foliar injury percentage 70 DAE – 2.40 2.90 7.98 9.96
105 DAE – 4.93 5.12 12.56 16.22
No. of male flowers 105 DAE 762±7.93 756±4.86 753±8.32 740±7.65 732±9.56
NQPM
No. of standing dead 70 DAE 1.0±0.05 1.6±0.00 2.0±0.05 4.6±0.00 5.0±0.03
105 DAE 2.6±0.02 4.0±0.05 4.3±0.06 5.0±0.03 5.6±0.02
Green leaf area ratio (GLAR) 70 DAE 0.92±0.04 0.88±0.02 0.86±0.00 0.69±0.01 0.49±0.03
105 DAE 0.84±0.02 0.74±0.05 0.72±0.04 0.65±0.00 0.58±0.03
Foliar injury percentage 70 DAE – 3.16 3.89 11.60 13.82
105 DAE – 6.63 7.12 15.23 22.45
No. of male flowers 105 DAE 779±9.43 766±8.68 763±9.95 750±6.35 742±7.82
2634 Environ Sci Pollut Res (2014) 21:2628–2641

Discussion
The recorded meteorological data at the present experimentalsite during the growth period of test crop demonstrated favor-able meteorological conditions for the photochemical forma-tion of secondary pollutant O3 as minimum and maximumtemperatures were highest during April, which led to higherO3 concentrations. Average high temperature and no rainfallfacilitated more O3 formation in December, while in January,more rainfall led to washing out of O3 precursors resulting inless mean monthly O3 concentration (Fig. 1). The environmen-tal conditions also favored higher O3 concentrations duringMarch and April when maize plants were in reproductive andgrain setting phase of their life cycle leading to significant yield
reductions. Soja et al. (2000) have also reported that yield ofbean as well as wheat were found to be up to 50 % moresensitive to O3 exposure during the grain/pod filling period.Earlier studies have already shown that the mean ambientlevels of O3 in Varanasi, India, varied from 36.4 to 48 ppbduring December 2004 to March 2005 (Rai et al. 2007) and35.3 to 54.2 ppb during December 2006 to March 2007 (Singhet al. 2009). Tripathi et al. (2011) reported that mean ambientO3 concentrations of the same site varied from 36.3 to 64.3 ppbduring December 2007 to March 2008. The monitoring data ofthe above studies also demonstrate that O3 was the major airpollutant at the experimental site, and there was a continuousincreasing trend in tropospheric O3 concentrations over theyears. Findings of Mittal et al. (2007) that Indo-Gangetic plain
Tot
al p
lant
bio
mas
s(g)
0
20
40
60
80
100 Total plant biom
ass(g)0
20
40
60
80
100
RSR
0.00
0.02
0.04
0.06
0.08
RSR
0.00
0.02
0.04
0.06
0.08
RG
R(g
g-1da
y-1)
0.00
0.05
0.10
0.15
0.20
0.25
RG
R(gg
-1day-1)
0.00
0.05
0.10
0.15
0.20
0.25
AG
R(c
m d
ay-1
)
0.0
0.5
1.0
1.5
2.0
2.5
AG
R(cm
day-1)
0.0
0.5
1.0
1.5
2.0
2.5
NA
R(g
cm
-2da
y-1)
0.00
0.02
0.04
0.06
0.08 NA
R(g cm
-2 day-1)
0.00
0.02
0.04
0.06
0.08
FCs NFCs OPs NFC+15 NFC+30
O 3 ***A ***Cv ***O 3 × A ***
O 3 × Cv NS
A × Cv NSO 3 × A × Cv NS
O 3 **A **Cv ***O 3 × A NS
O 3 × Cv **
A × Cv NSO 3 × A × Cv NS
O 3 ***A **Cv ***O 3 × A NS
O 3 × Cv NS
A × Cv NSO 3 × A × Cv NS
O 3 ***A ***Cv ***O 3 × A ***
O 3 × Cv NS
A × Cv NSO 3 × A × Cv NS
O 3 ***A ***Cv ***O 3 × A **
O 3 × Cv **
A × Cv ***O 3 × A × Cv NS
35 DAE 70 DAE 105 DAEQPM
35 DAE 70 DAE 105 DAE NQPM
Fig. 3 Effect of variableconcentrations of O3 on total plantbiomass and different growthindices of QPM and NQPMcultivars of maize (values aremean ± SE)
Environ Sci Pollut Res (2014) 21:2628–2641 2635

situated in the north east of India had very high AOT40 alsosupported our O3 monitoring results.
Our results depict the phenomenon of hormesis and are inagreement with the earlier works (Kumari et al. 2009; Sarkarand Agrawal 2011; Jia et al. 2012), showing a beneficial effectfrom exposure to low doses of a toxicant that is otherwisedetrimental when given at higher dose. Calabrese and Blain(2005) have also reported that a toxicant can act as a stimulatingagent at lower doses. Increase in growth was concurrently notaccompanied by an increase in biomass accumulation in NFCand NFC+15, perhaps due to the nonavailability of enoughphotosynthates as there is additional requirement of carbonskeleton for the production of antioxidants, secondary metabo-lites, etc. for various repair mechanisms to overcome the O3
stress (Rai et al. 2007). Studies by previous researchers onmaizehave also reported a significant inhibitory effect of O3 onbiomass accumulation (Rudorff et al. 1996; Leitao et al.2007a). Other studies (Singh et al. 2005; Rai et al. 2007;Sarkar and Agrawal 2010b, 2011) have also shown reductionsin biomass due to ambient air pollutants and specifically withelevated levels of O3 in their respective experiments made onpalak, rice, and wheat. Number of leaves and leaf area are twoimportant parameters for plant survival and growth. Lesserreduction in both the parameters due to elevated O3 in NQPMthan QPM led to its better growth and more biomass
accumulation at two initial stages of sampling. These findingsalso justified more reduction in RGR and NAR at 35 and 70DAE inQPM thanNQPM. Increase in number of standing deadand FIP in NQPM at third sampling stage led to significantreduction in GLAR (this ratio determines the green leaf areaavailable for photosynthesis) suggesting less assimilate produc-tion compared to QPM, which had fewer numbers of standingdead, less FIP, and more GLAR under elevated O3. This mightbe a possible reason of more yield loss in NQPM. Severalworkers have reported a decline in RGR and NARwith increas-ing O3 concentrations (Rai et al. 2010; Sarkar and Agrawal2010b). In our findings, RGR and NAR showed positive cor-relation and decrease in RGR andNAR suggested a reduction inthe drymatter production efficiency, which led to lesser biomassin O3 exposed plants. Plants exposed to elevated doses of O3
compensated for a lower NAR by increasing LAR at initialstages of development. Increased LAR accompanied with in-crease in SLA indicates more increase in leaf area as comparedto leaf biomass. This shows more expansion of cells rather thanthe division and such situation leads to increase in green areaavailable for photosynthesis, which can be an adaptive mecha-nism against O3 stress in both the cultivars. The general trendtowards increased SLA during initial stages of growth underelevated O3 has also been reported in earlier studies (Rai andAgrawal 2008; Mishra et al. 2013). It is well known that O3
Fig. 4 O3-induced chlorosis andincrease of anthocyaninpigmentation. a Anthocyaninpigmentation on leaf sheath; bleaf of FC showing no chlorosisand anthocyanin pigmentation; cinjury symptom on leaf of NFC;d , e , f progressive developmentof interveinal chlorosis at NFC+15 and NFC+30; g , h , iprogressive increase in themanifestation of anthocyaninpigment on leaf at NFC+15 andNFC+30
2636 Environ Sci Pollut Res (2014) 21:2628–2641
affects the reproductive structures of the plants (Booker et al.2005). Ozone affected the number of male flowers in both thecultivars confirming the fact that O3 is particularly detrimentalduring the reproductive phase of plant life having its higherconcentrations (Fig. 1).
Visible damages like interveinal chlorosis and stippling ofleaves are considered as primary symptoms of O3-inducedstress on vegetation (Nali et al. 2006; Torres et al. 2007).The present study also showed the development of similartypes of O3-specific injury due to bleaching effect of O3 andprogressive augment in injury symptoms at elevated O3 dosescould be due to cumulative effect of both exposure durationand concentration. At molecular level, these O3-injured leaveselicited a significant reduction in major photosynthetic pro-teins PEP carboxylase and RuBisCO (LSU and SSU), whichcan be devised as marker proteins for O3 stress in maize. Otherworkers have also recorded similar findings regarding theseproteins (Feng et al. 2008; Sarkar and Agrawal, 2010a, Leitaoet al. 2007b). Sarkar and Agrawal (2010a) reported reductionin larger and smaller subunits of RuBisCO and energy metab-olism protein of 35 KDa in Oryza sativa L. In another studymade with maize, Leitao et al. (2007b) documented thatRuBisCO and PEP carboxylase quantity depressed signifi-cantly at NFC+60 and NFC+80 atmosphere of O3.
Reduction in these proteins (PEP carboxylase, RuBisCOLSU, and SSU) associated with CO2 enrichment and fixationin C4 plants could be correlated to more yield loss in NQPM.
Althoughmaize is categorized as moderately sensitive cropto O3 stress (Mills et al. 2007), several studies have shown adecrease in relative yield with exposure to high concentrationsof O3 (Mulchi et al. 1995; Rudorff et al. 1996; Holland et al.2002). Reductions in various yield attributes have also beenobserved in the present study. There was an increase in theweight of cob with increasing concentrations of O3, reflecting
Wei
ght
of c
ob p
lant
-1(g
)
0
50
100
150
200
250
No.
of
husk
leav
es
2
4
6
8
10
12
14
ab
a
b
a
ba a
b
No.
of
row
s of
ker
nels
0
2
4
6
8
10
12
14a a aa a a
FC
NFC
OP
NFC+15
NFC+30
a aa
a aab
aaab
abab bb
abab
QPM NQPM
Fig. 6 Effect of O3 on weight of cob plant−1, number of husk leaves,number of rows of kernel of the two cultivars of maize (values are mean ±SE) under different treatment conditions. Bars showing different lettersindicate significant differences among each group of bars according toDuncan's test at p <0.05
Fig. 5 SDS-PAGE of proteins isolated from normal and injured leaves oftwo maize cultivars marker-protein molecular weight marker; NQPM(FC) protein profile from normal leaves of NQPM; NQPM (NFC+30)protein profile from injured leaves of NQPM; QPM (FC) protein profilefrom normal leaves of QPM; QPM (NFC+30) protein profile frominjured leaves of QPM. Arrows indicate the proteins with differentialresponse. Bands highlighted are showing marked reduction in the pro-teins of injured leaves compared to the normal leaves
Environ Sci Pollut Res (2014) 21:2628–2641 2637

more translocation of photosynthates towards the husk leavesduring O3 stress just to provide protection and safeguard tofemale reproductive organs. This protective mechanismadopted by maize in the form of thick husk leaves whichprevented direct exposure of female reproductive structuresto O3 could be one reason that maize is a moderately sensitivecrop against O3 in terms of yield. This point is evidenced bylesser reduction in yield in QPM than NQPM because moreprotection was provided by husk leaves in the former than thelater. Reduction in maize yield due to elevated O3 has alsobeen documented by earlier workers (Mulchi et al. 1995;
Rudorff et al. 1996; Heagle et al. 1972). Our results are inaccordance with the predictions of Wang and Mauzerall(2004) that crop losses from elevated O3 would increase by2–16 % for wheat, rice, and corn.
It is also evident from our findings that number of kernelsplant−1 was affected less than the weight of kernels plant−1,which is in agreement with earlier observations made with wheatas amodel crop (Jablonski et al. 2002; Piikki et al. 2008). Declinein thousand kernel weight at elevated O3 doses in both thecultivars indicates a reduction in the size of individual kerneldue to less availability of photosynthates. On the other hand, the
No.
of
kern
els
plan
t-1
0
100
200
300
400
500O3cv
O3 x cv
Tho
usan
d ke
rnel
wei
ght(
g)
0
100
200
300
Weight of kernels (g plant -1)
0
20
40
60
80
100
120
140
Harvest index
0.0
0.1
0.2
0.3
0.4
QPM NQPM QPM NQPM
a ababb
a abab b
a
b bbc
ca abab b b
a
abab
bb
a
abab
b b
aa a a a
aa
a aa
O3cv
O3 x cv
O3cv
O3 x cv NSNS
******
NS
**
bb ****
NS
O3 ****cv
O3 x cv NS
FC OP NFC+30NFC NFC+15Fig. 7 Effect of O3 on number ofkernels plant−1, weight of kernelsplant−1, thousand kernel weight,and Harvest Index of the QPMand NQPM cultivars of maize(values are mean ± SE). Barsshowing different letters indicatesignificant differences amongeach group of bars according toDuncan's test at p <0.05
Fig. 8 PCA of both the cultivars (growth parameters extracted from thirdsampling and yield variables). The scatter plot of both principal compo-nents is given. Each symbol represents the parameters taken into accountviz. SL shoot length,RL root length,NOL number of leaves, LA leaf area,
GLAR green leaf area ratio, NOMF number of male flowers, NORKnumber of rows of kernels, NOKP number of kernels per plant, WOKPweight of kernels per plant, TKW thousand kernel weight
2638 Environ Sci Pollut Res (2014) 21:2628–2641

present study contradicts the results of Mulchi et al. (1995)showing a slight increase in thousand seed weight at ele-vated dose of O3. HI did not change significantly in both the
test cultivars, possibly due to proportional distribution ofassimilates between the kernels and other vegetative parts,while others have shown a significant change in HI ofwheat, rice, and maize (Agrawal et al. 2004; Sarkar andAgrawal 2010b; Rudorff 1993).
For any crop, yield has always been the primary point ofinterest. Depending on the dose response analysis, Mills et al.(2007) have decisively synthesized the critical levels of AOT40 and yield reductions for European countries. Hence, one ofthe basic aims of the present study was to understand thefeasibility of that critical level of AOT 40 for tropical maizecultivars and their individual sensitivity towards increasingAOT 40. Mills et al. (2007) have reported that yield of moder-ately sensitive crop such as maize was suppressed by 5 % atseasonal AOT 40 value of 8.6–20 ppm h, while present studyshowed a decrease in the relative yield of QPM by 10.1 and13.8 % in NQPM at 20.36 ppm h. Higher reductions in grainyield in tropical climatic conditions indicate that tropical maizecultivars are more sensitive towards tropospheric O3, and in thefuture, it will be a major environmental problem for Asiancountries. Less correlation between AOT 40 value and relativeyield in QPM than NQPM showed that cumulative O3 expo-sure over 40 ppb resulted in lesser reduction in QPM. So, it issuggested that nutrient rich QPM cultivar, which also showedbetter performance against elevated O3 should be preferredover NQPM for cultivation in high O3 environment.
As per result of principal component analysis, it is clear thatat third sampling stage reductions in number of leaves, leafarea and GLAR (with highest loading value among the three)led to lesser production of photosynthates. It might be due toless availability of green leaf area for light capturing mecha-nism of photosynthesis which impaired shoot and root devel-opment at higher O3 concentrations. The cultivars showedsimilar response in this context. Lesser correlation betweenthe yield parameters taken for the test with the growth vari-ables indicates that reductions in number of rows of kernels,number of kernels plant−1, and weight of kernels are not onlydue to reduction in growth factors at third sampling age. Itmight be due to reductions in GLAR, number of male flowers,photosynthetic proteins, increase in foliar injury, and numberof standing dead, etc. leading to altered translocation
AOT40(ppm h)0 5 10 15 20 25
Yie
ld (
g m
-2)
500
1000
1500
2000
2500 AOT40 vs Yield of NQPM
AOT40(ppm h)0 5 10 15 20 25
Rel
ativ
e yi
eld
0.86
0.88
0.90
0.92
0.94
0.96
0.98
1.00
1.02
AOT40 vs Yield of QPM
AOT 40 vs Relative yield of NQPMAOT40 vs Relative yield of QPM
(r2= 0.492;y=2058.46-9.94x)
(r2= 0.392;y=1539.96-7.78x)
Fig. 9 Correlation coefficients and regression equations between a indi-vidual yield responses and cumulative AOT 40; b correlation betweenrelative yield and cumulative AOT40 for two maize cultivars
Table 4 Correlation coefficientsand level of significance betweenselected yield attributes andAOT40 of both the test cultivarsof maize
NS not significant
Significance level *p <0.05; p <0.01; p <0.001
Yield attributes QPM NQPM
Correlation coefficient Significance Correlation coefficient Significance
No. of kernels plant−1 0.452 ** 0.473 **
Weight of kernels plant−1 0.390 * 0.468 **
Thousand kernel weight 0.431 ** 0.575 ***
Harvest Index 0.161 NS 0.398 *
Relative yield 0.321 * 0.459 **
Environ Sci Pollut Res (2014) 21:2628–2641 2639
mechanism during the course of life cycle of maize that mighthave played an important role in deciding the yield. All thesefactors have their cumulative effects. Hence, higher reductionin these variables in case of NQPM than QPM led to moreyield loss in the former. Higher correlation between number ofmale flowers and number of rows of kernels and kernelsplant−1 show that any adverse effect on male reproductive struc-ture can play a detrimental effect on the plant's productivity.
Conclusion
The present study clearly depicts that current as well aselevated levels of O3 affected the growth, photosynthate allo-cation pattern, development of male flowers, and yield of boththe test cultivars of maize. Results further showed that at lowerO3 dose, there was a stimulative effect on the growth of thecultivars, while at higher dose, it was detrimental. Elevated O3
causes visible injury in the form of interveinal chlorosis,increased manifestation of anthocyanin pigments, and reduc-tion in the major photosynthetic proteins. PCA results showedthat both the cultivars responded in a similar manner to thestress, but there were variations in the magnitude of the effectson different parameters resulting in difference in yield reduc-tions as reflected by the correlation analysis. Increase inanthocyanin pigmentation, more foliar injury, reductions ingreen leaf area ratio, number of male flowers, and decrease inphotosynthetic proteins led to more yield loss in NQPM thanQPM. Hence, the present investigation concludes that QPMwill perform better thanNQPM in future world with inevitableproblem of higher O3 concentrations. The study further sug-gests the need of future research to screen some more QPMcultivars, which can withstand and show better adaptability inthe tropical environment having higher concentration of O3.
Acknowledgments The authors are thankful to the Head, Departmentof Botany, Banaras Hindu University (BHU), Varanasi for providing thenecessary laboratory facilities, Dr. Bhagat Singh, Farm Superintendent,Agriculture Research Farm, BHU for providing the field facilities. Finan-cial support from the Council of Scientific and Industrial Research (CSIR),Government of India, New Delhi, in form of major research project(38(1287)/11/EMR-II) and UGC-UPE is highly acknowledged. The au-thors are highly thankful to all the three anonymous reviewers for theircritical suggestions which helped in improving the quality of the paper.
References
Agrawal SB, Singh A, Rathore D (2004) Assessing the effects of ambientair pollution on growth, biochemical and yield characteristics ofthree cultivars of wheat (Triticum aestivum L.) with ethylene diureaand ascorbic acid. J Plant Biol 31:165–172
Anisworth EA (2008) Rice production in a changing climate: a meta-analysis of responses to elevated carbon dioxide and elevated ozoneconcentration. Glob change Biol 14:1642–1650
Ashmore MR (2005) Assessing the future global impacts of ozone onvegetation. Plant cell Environ 28:949–964
Biswas DK, Xu H, Li YG, Sun JZ, Wang XZ, Han XG, Jiang GM (2008)Genotypic differences in leaf biochemical, physiological and growthresponse to ozone in 20 winter wheat cultivars released over the past60 years. Glob Change Biol 14:46–59
Black VJ, Black CR, Roberts JA, Stewart CA (2000) Impact of ozone onthe reproductive development of plants. New Phytol 147:421–447
Booker FL, Miller JE, Fiscus EL, Parsley WA, Stafanski LA (2005)Comparative response of container-verses ground- grown soybeanto elevated carbon dioxide and ozone. Crop Sci 45:883–895
Bradford MM (1976) A rapid and sensitive method for the quantificationof microgram quantities of protein utilizing the principle of protein-dye binding. Anal Biochem 72:248–254
Cho K, Shibato J, Agrawal GK, Jung YH, Kubo A, Jwa NS, Tamogami S,Satoh K, Kikuchi S, Higashi T, Kimura S, Saji H, Tanaka Y, IswahashiH,MasuoyY, Rakwal R (2008) Integrated transcriptomics, proteomicsand metabolomics analyses to survey ozone responses in leaves of riceseedlings. J Proteome Res 7:2980–2998
Calabrese EJ, Blain R (2005) The occurrence of hormetic dose responsesin the toxicological literature, the hormesis database: an overview.Toxicol Appl Pharm 202:289–301
Emberson LD, Buker P, Ashmore MR, Mills G, Jackson LS, Agrawal M,AtikuzzaMD, Cinderby S, EngardtM, Jamir C, Kobayashi K, OanhNTK, Quadir QF,Wahid A (2009) A comparison of NorthAmericanand Asian exposure response data for ozone effects on crop yields.Atmos Environ 43:1945–1953
Feng YW, Komatsu S, Furukawa T, Koshiba T, Kohnu Y (2008) Prote-ome analysis of proteins responsive to ambient and elevated ozonein rice seedlings. Agric Ecosyst Environ 125:255–265
Heagle AS, Body DE, Pounds FK (1972) Effects of ozone on yield ofsweet corn. Phytopathology 62:673–678
Holland M, Mills G, Hayes F, Bused A, Emberson L, Cambridge H,Cinderby S, Terry A, Ashmore M (2002) Economic assessment ofcrop yield losses from ozone exposure. The UNECE InternationalCooperative Programme on Vegetation. Contract EPG1/3/170.Cen-ter for Ecology and Hydrology and UK Department for Environ-ment, Food and Rural Affairs.
Hunt R (1982) Growth curves. Edward Arnold, LondonJablonski LM, Wang X, Curtis PS (2002) Plant reproduction under
elevated CO2 conditions: a meta- analysis of reports on 79 cropand wild species. New Phytol 156:9–26
Jat ML, Dass S, Yadav VK, Sekhar JC, Singh DK (2009) Quality ProteinMaize for Food and Nutritional Security in India DMR TechnicalBulletin 2009/4. Directorate of Maize Research, Pusa, p 23
Jia L, Liu Z, Chen W, He X (2012) Stimulative effect induced by low-concentration cadmium in Lonicera japonica Thunb. Afr JMicrobiol Res 6:826–833
Krupa S, Mc GMT, Anderson CP, Booker FL, Burkey KO, ChappelkaAH, Chenove BI, Pell EJ, Zilinskas BA (2001) Ambient ozone andplant health. Plant Dis 85:4–12
Kumari R, Singh S, Agrawal SB (2009) Effects of supplemental ultravi-olet B radiation on growth and physiology of Acorus calamus L.(sweet flag). Acta Biologica Cracoviensia series Botanica 51(2):19–27
Leitao L, Bethenod O, Biolley JP (2007a) The impact of ozone onjuvenile maize (Zea mays L.) plant photosynthesis: effects on veg-etative biomass, pigmentation and carboxylases (PEPc andRuBisCo). Plant Biol 9:478–488
Leitao L, Maoret JJ, Biolley JP (2007b) Changes in PEP carboxylase,Rubisco and Rubisco activase mRNA levels frommaize (Zea mays)exposed to a chronic ozone stress. Biol Res 40:137–153
Mauzerall DL, Wang X (2001) Protecting agricultural crops from theeffects of tropospheric ozone exposure: reconciling science andstandard setting in United States, Europe and Asia. Ann Rev EnergyEnviron 26:237–287
2640 Environ Sci Pollut Res (2014) 21:2628–2641
Meehl GA, Stocker TF, Collins WD (2007) Global climate projections. In:Solomon S, Qin D, Manning M, Chen Z, Marquis M, Avery KB,Tignor M, Miller HL (eds) Climate Change, the physical basis. con-tribution ofworking group I to the fourth assessment report of IPCC onclimate change. Cambridge University, New York, pp 747–846
Miller JD, Arteca RN, Pell EJ (1999) Senescence associated gene expres-sion during ozone induced leaf senescence in Arabidopsis. PlantPhysiol 120:1015–1024
Mills G, Buse A, Gimeno B, Bermejo V, Holland M, Emberson L, PleijelH (2007) A synthesis of AOT40-based response functions andcritical levels of ozone for agricultural and horticultural crops.Atmos Environ 41:2630–2643
Mishra AK, Rai R, Agrawal SB (2013) Differential response of dwarf andtall tropical wheat cultivars to elevated ozone with and withoutcarbon dioxide enrichment: growth, yield and grain quality. FieldCrop Res 145:21–32
Mittal ML, Hess PG, Jain SL, Arya BC, Sharma C (2007) Surface ozonein the Indian region. Atmos Environ 41:6572–6584
Mulchi C, Rudorff BFT, Lee E, Rowland R, Pausch R (1995) Morpho-logical responses among crop species to full season exposures toenhanced concentrations of atmospheric CO2 and O3.Water Air SoilPoll 85:1379–1386
Mulholland BJ, Craigon J, Black CR, Colls JJ, Atherton J, Landon G(1997) Impact of elevated atmospheric CO2 and O3 on gas exchangeand chlorophyll content in spring wheat (Triticum aestivum L.). JExp Botany 48:1853–1863
Nali C, Francini A, Lorenzini G (2006) Biological monitoring of ozone:the twenty years of Italian experience. J Environ Monit 8:25–32
Piikki K, De Temmerman L, Ojanpera K, Danielsson H, Pleijel H (2008)The grain quality of spring wheat (Triticum aestivum L.) in relationto elevated ozone uptake and carbon dioxide exposure. Eur J Agron28:245–254
Prasanna BM, Vasal SK, Kassahun B, Singh NN (2001) Quality ProteinMaize Curr Sci 10:1308–1319
Rai R,AgrawalM,Agrawal SB (2007)Assessment of yield losses in tropicalwheat using open top chambers. Atmos Environ 41:9543–9554
Rai R, Agrawal M (2008) Evaluation of physiological and biochemicalresponses of two rice (Oryza sativa L.) cultivars to ambient airpollution using open top chambers at a rural site in India. Sci TotalEnviron 407:679–691
Rai R, Agrawal M, Agrawal SB (2010) Threat to food security undercurrent levels of ground level ozone: a case study for Indian cultivarsof rice. Atmos Environ 44:4272–4282
Rao MV, Hale BA, Ormrod DP (1995) Amelioration of ozone inducedoxidative damage in wheat plants grown under high carbon dioxide.Plant Physiol 109:421–432
Rudorff BFT (1993) Interactive effects of enhanced tropospheric ozoneand carbon dioxide on wheat and corn, Ph. D Thesis, University ofMaryland, College park, pp 192
Rudorff BFT, Mulchi CL, Lee EH, Rowland R, Pausch R (1996) Effectsof enhanced O3 and CO2 enrichment on plant characteristics inwheat and corn. Environ Pollut 94:53–60
Sarkar A, Agrawal SB (2010a) Identification of ozone stress in Indian ricethrough foliar injury and differential protein profile. Environ MonitAssess 161:205–215
Sarkar A, Agrawal SB (2010b) Elevated ozone and two modern wheatcultivars: an assessment of dose dependent sensitivity with respectto growth, reproductive and yield parameters. Environ Exp Bot 69:328–337
Sarkar A, Agrawal SB (2011) Evaluating the response of two highyielding Indian rice cultivars against ambient and elevatedlevels of ozone by using open top chambers. J Environ Manag30:1–6
Singh A, Agrawal SB, Rathore D (2005) Amelioration of Indian urban airpollution phytotoxicity in Beta vulgaris L. by modifying NPKnutrients. Environ Pollut 134:385–395
Singh S, Agrawal SB, Agrawal M (2009) Differential protection ofethylene diurea (EDU) against ambient ozone for five cultivars oftropical wheat. Environ Pollut 157:2359–2367
Soja G, Barnes JD, Posch M, Vandermeiren K, Pleijel H, Mills G (2000)Phenological weighting of ozone exposures in the calculation ofcritical levels for wheat, bean and plantain. Environ Pollut 109:517–525
Torres NL, Cho K, Shibato J, Hirano M, Kubo A, Masuo Y, Iwahashi H,Jwa N-S, Agrawal GK, Rakwal R (2007) Gel based proteomicsreveals potential novel protein markers of ozone stress in leaves ofcultivated bean and maize species of Panama. Electrophoresis 28:4369–4381
Tripathi R, Sarkar A, Rai SP, Agrawal SB (2011) Supplementalultraviolet-B and ozone: impact on antioxidants, proteome andgenome of linseed (Linum usitatissimum L.cv.Padmini). Plant Biol13:93–104
Van Dingenen R, Dentener FJ, Raes F, Korl MC, Emberson L, Cofala J(2009) The global impact of ozone on agricultural crop yields undercurrent and future air quality legislation. Atmos Environ 43:604–618
Vingarzan R (2004) A review of surface ozone background levels andtrends. Atmos Environ 38:3431–3442
Wang X, Mauzerall DL (2004) Characterizing distribution of tropospher-ic ozone and its impacts on grain production in China, Japan andSouth Korea: 1990 and 2000. Atmos Environ Int –Asia 38:4383–4402
Environ Sci Pollut Res (2014) 21:2628–2641 2641