Canadian Chemical Transactions Homology Modeling and Microarray Analysis of Silicon Transporter...
12
Borderless Science Publishing 326 Canadian Chemical Transactions Year 2013 | Volume 1 | Issue 4 | Page 326-337 ISSN 2291-6458 (Print), ISSN 2291-6466 (Online) Research Article Homology Modeling and Microarray Analysis of Silicon Transporter Protein in Rice, Barley and Maize Mohammed M. Morshed 1 , Mohammad A. Ashraf 1 , Mohammad K. Manik 2 and Mohammad N. Morshed 3, 4* 1 Department of Biochemistry & Molecular Biology, University of Dhaka, Dhaka, Bangladesh 2 Department of Pharmacy, East West University, Dhaka, Bangladesh 3 Center for Advanced Research in Sciences (CARS), University of Dhaka, Dhaka, Bangladesh 4 Center for Neuromedicine, Korea Institute of Science & Technology (KIST), Seoul, Korea *Corresponding Author, Email: [email protected] Tel.: +8802966192073/4634; Fax: +88028615583 Received: October 6, 2013 Revised: November 11, 2013 Accepted: November 12, 2013 Published: November 12, 2013 Abstract: Higher plants like rice, barley and maize have unique silicon accumulation characteristic. Silicon is uptaken in the form of silicic acid by silicon transporter protein in root. The uniqueness of silicon accumulation in different plants is caused by both the physiologic and molecular diversity in the species even in different parts of a single plant. To understand the mechanism of silicon or silicic acid uptake, it is essential to analyze and study the 3D structure of transporter protein and expression profile through microarray experiments. We used I-TASSER and RAMPAGE prediction and validation of 3D structure of silicon transporters respectively followed by microarray analysis. The 3D models showed over 90% residues in favorable regions were considered in this study. Microarray analysis indicated root and shoot with highest silicon accumulation in the analyzed plants. For the development of better abiotic stress tolerant plant, expression of this transporter protein in shoot and root is given priority. This particular work might be helpful for designing a better plant with target efficient and maximum silicon uptake ability. Keywords: Silicon Transporter; Biotic Stress; Abiotic Stress; 3D Structure; Microarray 1. INTRODUCTION Silicon (Si) is an advantageous element for the growth of plant [1]. It aids plants to overcome various biotic and abiotic stress [2, 3]. Si helps to fight against both fungi and bacterial diseases caused by increasing resistance of various plant species [4]. Si enhances resistance against diseases like rice blast, powdery mildew, and sheath blight[5]. It also reduces insect pests[6]. It helps in suppressing stem borer and brown plant hopper [7]. Interestingly, silicon improves nutrient imbalance in a wide variety of plant
Transcript of Canadian Chemical Transactions Homology Modeling and Microarray Analysis of Silicon Transporter...

Ca
Borderless Science Publishing 326
Canadian Chemical Transactions Year 2013 | Volume 1 | Issue 4 | Page 326-337
ISSN 2291-6458 (Print), ISSN 2291-6466 (Online)
Research Article
Homology Modeling and Microarray Analysis of Silicon
Transporter Protein in Rice, Barley and Maize
Mohammed M. Morshed
1, Mohammad A. Ashraf
1, Mohammad K. Manik
2 and
Mohammad N. Morshed3, 4*
1Department of Biochemistry & Molecular Biology, University of Dhaka, Dhaka, Bangladesh
2Department of Pharmacy, East West University, Dhaka, Bangladesh
3Center for Advanced Research in Sciences (CARS), University of Dhaka, Dhaka, Bangladesh
4Center for Neuromedicine, Korea Institute of Science & Technology (KIST), Seoul, Korea
*Corresponding Author, Email: [email protected] Tel.: +8802966192073/4634; Fax: +88028615583
Received: October 6, 2013 Revised: November 11, 2013 Accepted: November 12, 2013 Published: November 12, 2013
Abstract: Higher plants like rice, barley and maize have unique silicon accumulation characteristic.
Silicon is uptaken in the form of silicic acid by silicon transporter protein in root. The uniqueness of
silicon accumulation in different plants is caused by both the physiologic and molecular diversity in the
species even in different parts of a single plant. To understand the mechanism of silicon or silicic acid
uptake, it is essential to analyze and study the 3D structure of transporter protein and expression profile
through microarray experiments. We used I-TASSER and RAMPAGE prediction and validation of 3D
structure of silicon transporters respectively followed by microarray analysis. The 3D models showed
over 90% residues in favorable regions were considered in this study. Microarray analysis indicated root
and shoot with highest silicon accumulation in the analyzed plants. For the development of better abiotic
stress tolerant plant, expression of this transporter protein in shoot and root is given priority. This
particular work might be helpful for designing a better plant with target efficient and maximum silicon
uptake ability.
Keywords: Silicon Transporter; Biotic Stress; Abiotic Stress; 3D Structure; Microarray
1. INTRODUCTION
Silicon (Si) is an advantageous element for the growth of plant [1]. It aids plants to overcome various
biotic and abiotic stress [2, 3]. Si helps to fight against both fungi and bacterial diseases caused by
increasing resistance of various plant species [4]. Si enhances resistance against diseases like rice blast,
powdery mildew, and sheath blight[5]. It also reduces insect pests[6]. It helps in suppressing stem borer
and brown plant hopper [7]. Interestingly, silicon improves nutrient imbalance in a wide variety of plant

Ca
Borderless Science Publishing 327
Canadian Chemical Transactions Year 2013 | Volume 1 | Issue 4 | Page 326-337
ISSN 2291-6458 (Print), ISSN 2291-6466 (Online)
Table 1: Silicon Transporter Protein for Rice, Barley and Maize
Accession number Source Amino acid residue
90855460 Oryza sativa Japonica group 298
224548822 Hordeum vulgare 295
99866966 Zea mays 301
Table 2: InterProScan-Simplified presentation
Accession
number
Source Aquaporin or aquaporin like domain
90855460 Oryza sativa Japonica group YES
224548822 Hordeum vulgare YES
99866966 Zea mays YES
Table 3: Dataset for multiple sequence alignment
Accession number Source Amino acid residue
75294117 Oryza Sativa Japonica group 298
90855460 Oryza Sativa Japonica group 298
193811876 Oryza Sativa Japonica group 298
99866966 Zea mays 301
145228075 Sorghum bicolor 297
148467568 Sorghum bicolor 295
304651330 Triticum aestivum 295
Table 4: List of gene ID retrieved from PLEXdb
Accession number Source Length Gene location ID
75294117 Oryza sativa Japonica group 298 LOC_Os06g12310.1
90855460 Oryza sativa Japonica group 298 LOC_Os06g12310.1
152717100 Oryza sativa Japonica group 472 LOC_Os03g01700.1
193811876 Oryza sativa Japonica group 298 LOC_Os06g12310.1
296936086 Oryza sativa Japonica group 472 LOC_Os03g01700.1
253960506 Hordeum vulgare 474 LOC_Os02g57620.1
224548822 Hordeum vulgare 295 LOC_Os06g12310.1
253960504 Hordeum vulgare 300 LOC_Os06g12310.1
308044363 Zea mays 477 LOC_Os03g05390.9
256997236 Zea mays 477 LOC_Os03g05390.9
99866966 Zea mays 301 LOC_Os02g51110.1
species [8]. In addition, Silicon enhances the resistance to lodging, alleviates metal toxicity, salt
and drought stresses [4].
Every plant contains silicon in their tissue[9] but differs in accumulation ranging from 0.1% to
10.0% of shoot dry weight[10]. Silicon is taken up by the root in the form of silicic acid, an uncharged
molecule[11, 12]. Three Si transporters have been acknowledged to be involved in both the uptake and
distribution of silicon denoted as Lsi1, Lsi2, and Lsi6. These are identified from rice which is considered

Ca
Borderless Science Publishing 328
Canadian Chemical Transactions Year 2013 | Volume 1 | Issue 4 | Page 326-337
ISSN 2291-6458 (Print), ISSN 2291-6466 (Online)
to be a characteristic Si-accumulating species [10, 13, 14].Water-selective channel proteins which are too
recognized as aquaporins (AQPs) involved with transmembrane water flow. During growth and
development processes like germination, cell elongation, stomatal movement, phloem loading and
unloading, AQPs play role to mediate and regulate rapid transmembrane water flow[15, 16]. In addition,
reproductive growth and stress responses are also mediated and controlled by AQPs[16, 17].
Based on amino acid sequence homology and protein subcellular localization, plant AQPs family
is classified into four families[18, 19]. Namely, plasma membrane intrinsic proteins (PIPs)[20]; tonoplast
membrane intrinsic proteins (TIPs)[21]; nodulin 26-like intrinsic proteins (NIPs)[22]; and small basic
intrinsic protein (SIPs)[23]. Lsi1 and Lsi6 belong to the nodulin-26 like major intrinsic protein III (NIP
III) subgroup[10, 24]. Identifying salt tolerance genes and understanding their functions have become the
most urgent tasks in agricultural research today. Scientists around the globe are trying to make new
varieties which are tolerant to biotic and abiotic stress. Rice has silicon transporter and higher the uptake
of silicon, better the tolerance against biotic and abiotic stress.
Here our aim was to construct 3D model of silicon transporter protein in higher plants. For this
we have selected the transporter proteins available in parts (root, shoot) of rice, barley and maize. In the
next step we identified the presence of aquaporin or aquaporin-like domain in rice, barley and maize
related to stress tolerance. After identification of necessary domain and motif, we proceeded for
construction of 3D models. In this step, sequentially we used number of tools like SOSUI for
transmembrane domain prediction, I-TASSER for 3D structure prediction. C-score, TM-score guided
models were validated by RAMPAGE.
2. METHODS AND MATERIALS
2.1 Data Set Collection
The sequence of silicon transporter in Rice (75294117) was retrieved from National Center for
Biotechnology Information (NCBI). Basic Local Alignment Search Tool (BLAST) of the retrieved
sequences was done through NCBI in order to find the sequence homology with the sequence of silicon
transporter in Rice (75294117). The retrieved sequences through BLAST for the same transporter from
Rice and other higher plant species are enlisted as follows in Table1.
2.2 Domain Prediction
Domain prediction was done by InterProScan (V4.8;http://www.ebi.ac.uk/Tools/pfa/iprscan/).The
collected sequences (Oryza sativa Japonica group; accession number: 90855460, Hordeum vulgare;
accession number: 224548822 and Zea mays; accession number: 99866966) were run through InterProScan
to filter the dataset. A simplified presentation of InterProScan output is enlisted in Table 2.
2.3 Multiple Sequence Alignment
Clustal Omega (http://www.ebi.ac.uk/Tools/msa/clustalo/) was used for Multiple Sequence
Alignment (MSA) of the protein sequences. Both homology and the evolutionary relationships between
the sequences studied can be deduced from the output. Multiple sequence alignment done for proteins is
enlisted in Table 3.
2.4 Transmembrane Domain Prediction
Transmembrane domain prediction was done for the silicon transporter proteins through SOSUI
(http://bp.nuap.nagoya-u.ac.jp/sosui/sosuiG/sosuigsubmit.html). Here sequences (Oryza sativa Japonica
group; accession number: 90855460, Hordeum vulgare; accession number: 224548822 and Zea mays;
accession number: 99866966) were used for prediction.

Ca
Borderless Science Publishing 329
Canadian Chemical Transactions Year 2013 | Volume 1 | Issue 4 | Page 326-337
ISSN 2291-6458 (Print), ISSN 2291-6466 (Online)
2.5 3D Structure
3D structure of the transporter proteins were generated through I-TASSER
(http://zhanglab.ccmb.med.umich.edu/I-TASSER/) server. For 3D structure generation, sequences of Rice
(Oryza sativa Japonica group; accession number: 9085546), Barley (Hordeum vulgare; accession number:
224548822) and Maize (Zea mays; accession number: 99866966) were used as input. Starting from an
amino acid sequence, we generated three-dimensional (3D) atomic models from multiple threading
alignments and iterative structural assembly simulations using I-TASSER. The function of the protein was
then inferred by structurally matching the 3D models with other known proteins. The output from a
typical server run contain full-length secondary and tertiary structure predictions, and functional
annotations on ligand-binding sites, Enzyme Commission numbers and Gene Ontology terms.
Accuracy of the predicted models by I-TASSER was provided based on the confidence score (C-
score) of the modeling. It was calculated based on the significance of threading template alignments and
the convergence parameters of the structure assembly simulations. C-score is typically in the range of -5
to 2, where a C-score of higher value signifies a model with a high confidence and vice-versa.
TM-score and RMSD are known standards for measuring structural similarity between two
structures which are usually used to measure the accuracy of structure modeling when the native structure
is known. In case where the native structure is not known, it becomes necessary to predict the quality of
the modeling prediction, i.e. what is the distance between the predicted model and the native structures.
For that we tried the TM-score and RMSD of the predicted models relative the native structures based on
the C-score.
TM-score is a recently proposed scale for measuring the structural similarity between two
structures. The purpose of proposing TM-score is to solve the problem of RMSD which is sensitive to the
local error. Because RMSD is an average distance of all residue pairs in two structures, a local error will
raise a big RMSD value although the global topology is correct. In TM-score, however, the small distance
is weighted stronger than the big distance which makes the score insensitive to the local modeling error. A
TM-score >0.5 indicates a model of correct topology and a TM-score<0.17 means a random similarity.
These cutoffs do not depend on the protein length.
I-TASSER generates full length model of proteins by excising continuous fragments from
threading alignments and then reassembling them using replica-exchanged Monte Carlo simulations. Low
temperature replicas (decoys) generated during the simulation are clustered by SPICKER and top five
cluster centroids are selected for generating full atomic models. The cluster density is defined as the
number of structure decoys at a unit of space in the SPICKER cluster. A higher cluster density means the
structure occurs more often in the simulation trajectory and therefore signifies a better quality model.
2.6 3D Structure Validation
RAMPAGE (http://mordred.bioc.cam.ac.uk/~rapper/rampage.php) was applied for structural
validation by the Ramachandran plot assessment. Based on a manually selected set of high-quality protein
structures (from the Richardson's Group at Duke University) and a number of filters (such as B-factor
cutoff and van der Waals clashes), reference phi/psi plots were derived for Gly, Pro, pre-Pro and general
(other) residue types, and subdivided into "favored", "allowed" and "outlier" regions.
2.7 PLEXdb (Plant Expression Database)
The gene location ID for the desired protein was retrieved from PLEXdb
(http://www.plexdb.org). BLAST tool was chosen from PLEXdb and protein-protein BLAST was

Ca
Borderless Science Publishing 330
Canadian Chemical Transactions Year 2013 | Volume 1 | Issue 4 | Page 326-337
ISSN 2291-6458 (Print), ISSN 2291-6466 (Online)
Figure1: A) Inter Pro Scan output for Oryza sativa Japonica group (Accession number: 90855460)
B) Inter Pro Scan output for Hordeum vulgare(Accession number: 224548822) C) Inter Pro Scan output
for Zea mays (Accession number: 99866966)
A
B
C

Ca
Borderless Science Publishing 331
Canadian Chemical Transactions Year 2013 | Volume 1 | Issue 4 | Page 326-337
ISSN 2291-6458 (Print), ISSN 2291-6466 (Online)
Figure 2. Multiple sequence alignment of silicon transporter proteins in Oryza sativa and other higher
plants like Hordeum vulgare, Zea mays, Sorghum bicolor, Triticum aestivum

Ca
Borderless Science Publishing 332
Canadian Chemical Transactions Year 2013 | Volume 1 | Issue 4 | Page 326-337
ISSN 2291-6458 (Print), ISSN 2291-6466 (Online)
performed. FASTA sequence data was placed as input which is the supported format to BLAST against
the consensus sequence for all probe sets on the selected target array of Arabidopsis ATH1 22k. The input
consists of probe set ID’s are blasted against the consensus sequence for the selected target array. From
the BLAST result, we picked the best identical match to find the gene location ID. The NCBI accession
numbers, plant sources, length and gene location ID retrieved from PLEXdb are enlisted in Table 4.
PLEXdb BLAST was performed to search the PLEXdb database for matching exemplars from microarray
platforms which BLAST sequence against the consensus sequence for each microarray.
2.8 Rice Oligonucleotide Array Database (ROAD)
Gene list was imported directly for microarray experiments of ROAD
(http://www.ricearray.org/index.shtml). Genome wide expression profiling of rice (GSE7951) was
selected to identify the expression level in root and shoot [25].
3. RESULTS
3.1 Domain Prediction
InterProScan provides functional analysis of proteins by classifying them into families and
predicting domains and important sites. The result for Oryza sativa Japonica Group (Accession number
90855460), Hordeum vulgare (Accession number: 224548822) and Zea mays (Accession number:
99866966) was shown in Figure 1 (A, B and C) where aquaporin and aquaporin-like domain is present in
all silicon transporters of the plants.
3.2 Multiple Sequence Alignment
Multiple sequence alignment was done to identify Asn-Pro-Ala (NPA) motif in the same silicon
transporter protein sequences. The alignment result and confirmation of the presence of NPA motif are
shown in Figure 2.
3.3 Transmembrane Domain Prediction
Transmembrane domain prediction was done here to prove them as transporter proteins.
Transmembrane domain needs at least 18 residues to span the membrane. The entire predicted domain has
length approximately 23. And the regions of transmembrane domain in all sequences are almost same.
The prediction result for Oryza sativa, Hordeum vulgare and Zea mays is summarized in Table S1-S3
respectively.
3.4 3D Structure
The three dimensional modeling of these transporter sequences is the crucial task as there is no
PDB files were found for these sequences, except one. Here we used I-TASSER for homology modeling.
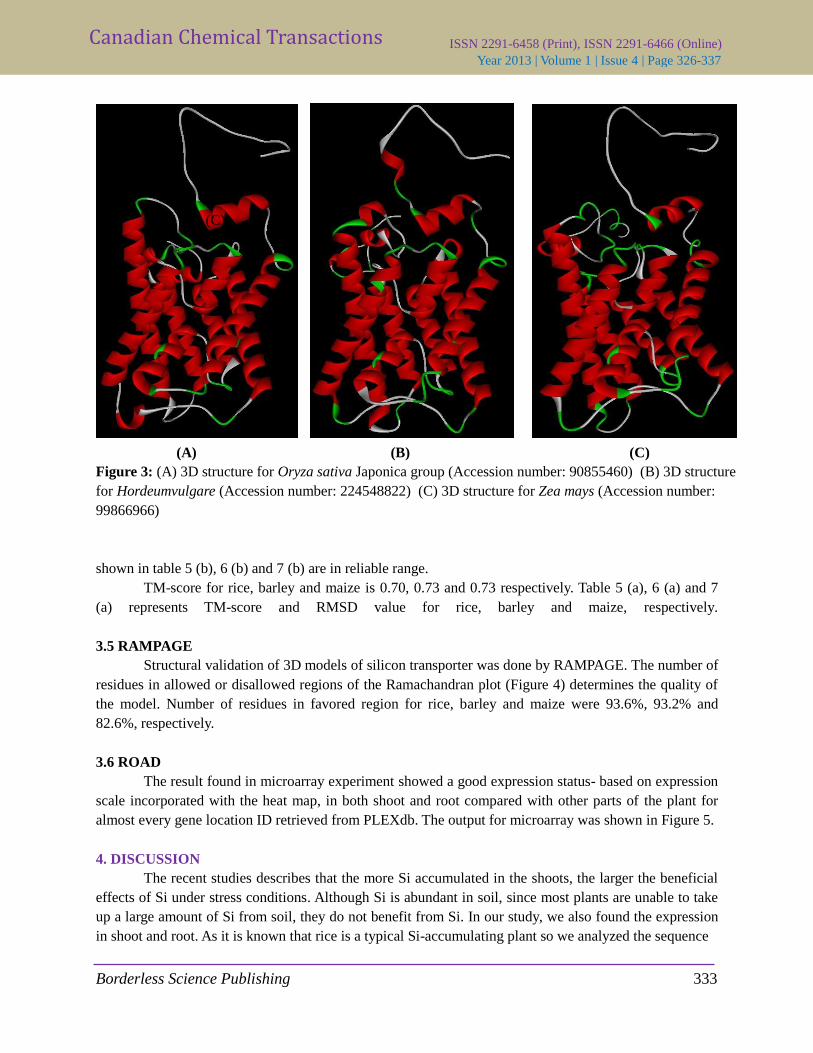
All the results and the image of best predicted model were enlisted. Figure 3(A, B & C) showed the
model for Oryza sativa, Hordeum vulgare and Zea mays respectively.
C-score is used to estimate the accuracy of predicted model by I-TASSER. The typical C-score
value ranges between -5 to 2, where a higher C-score value signifies a model with a high confidence and
vice-versa. In table 8 (b), 9 (b) and 10 (b) we observe that C-score for Oryza sativa, Hordeum vulgare and
Zea mays is -0.10, 0.11 and 0.14, respectively. These values are the indicator of good model. The value of
other parameters (No. of decoys & cluster density) generated by I-TASSER for the significance of model
Ca
Borderless Science Publishing 333
Canadian Chemical Transactions Year 2013 | Volume 1 | Issue 4 | Page 326-337
ISSN 2291-6458 (Print), ISSN 2291-6466 (Online)
(C)
(A) (B) (C)
Figure 3: (A) 3D structure for Oryza sativa Japonica group (Accession number: 90855460) (B) 3D structure
for Hordeumvulgare (Accession number: 224548822) (C) 3D structure for Zea mays (Accession number:
99866966)
shown in table 5 (b), 6 (b) and 7 (b) are in reliable range.
TM-score for rice, barley and maize is 0.70, 0.73 and 0.73 respectively. Table 5 (a), 6 (a) and 7
(a) represents TM-score and RMSD value for rice, barley and maize, respectively.
3.5 RAMPAGE
Structural validation of 3D models of silicon transporter was done by RAMPAGE. The number of
residues in allowed or disallowed regions of the Ramachandran plot (Figure 4) determines the quality of
the model. Number of residues in favored region for rice, barley and maize were 93.6%, 93.2% and
82.6%, respectively.
3.6 ROAD
The result found in microarray experiment showed a good expression status- based on expression
scale incorporated with the heat map, in both shoot and root compared with other parts of the plant for
almost every gene location ID retrieved from PLEXdb. The output for microarray was shown in Figure 5.
4. DISCUSSION
The recent studies describes that the more Si accumulated in the shoots, the larger the beneficial
effects of Si under stress conditions. Although Si is abundant in soil, since most plants are unable to take
up a large amount of Si from soil, they do not benefit from Si. In our study, we also found the expression
in shoot and root. As it is known that rice is a typical Si-accumulating plant so we analyzed the sequence

Ca
Borderless Science Publishing 334
Canadian Chemical Transactions Year 2013 | Volume 1 | Issue 4 | Page 326-337
ISSN 2291-6458 (Print), ISSN 2291-6466 (Online)
Table 5 (a): I-TASSER output for Oryza sativa Japonica Group (Accession number: 90855460)
Accession number Type TM-score RMSD
90855460 Oryza sativa Japonica Group 0.70±0.12 6.4±3.9Å
Table 5 (b): Score, No. of decoys, Cluster density value for different models (Accession number:
90855460)
Model 1 Model 2 Model 3 Model 4 Model 5
Score -0.10 -1.33 -0.47 -3.19 -1.76
No. of decoys 6881 2007 4756 312 1303
Cluster density 0.2108 0.0615 0.1457 0.0096 0.0399
Table 6 (a): I-TASSER output for Hordeum vulgare (Accession number: 224548822)
Accession number Type TM-score RMSD
224548822 Hordeum vulgare 0.73±0.11 5.9±3.7Å
Table 6 (b): Score, No. of decoys, Cluster density value for different models (Accession number:
224548822)
Model 1 Model 2 Model 3 Model 4 Model 5
Score 0.11 -0.99 -2.44 -1.27 -0.64
No. of decoys 6937 2316 541 1748 3633
Cluster density 0.2576 0.086 0.0210 0.0649 0.1349
Table 7 (a): I-TASSER output for Zea mays (Accession number: 99866966)
Accession number Type TM-score RMSD
99866966 Zea mays 0.73±0.11 5.9±3.7Å
Table 7 (b): Score, No. of decoys, Cluster density value for different models (Accession number:
99866966)
Model 1 Model 2 Model 3 Model 4 Model 5
Score 0.14 -0.6 -0.29 -0.95 -1.13
No. of decoys 6732 3200 4387 2264 1888
Cluster density 0.2665 0.1267 0.1737 0.0896 0.0747

Ca
Borderless Science Publishing 335
Canadian Chemical Transactions Year 2013 | Volume 1 | Issue 4 | Page 326-337
ISSN 2291-6458 (Print), ISSN 2291-6466 (Online)
(A) (B) (C)
Figure 4: (A) Ramachandran plot for Oryza sativa Japonica group (Accession number: 90855460)
(B) Ramachandran plot for Hordeum vulgare (Accession number: 224548822) (C) Ramachandran plot for
Zea mays (Accession number: 99866966)
Figure 5: Microarray expression profile analyzed by Rice Oligo Array Database
and found the similar characteristic protein in barley and maize. The well known approach to enhance the
resistance of plants to multiple stresses is genetic modification for Si uptake ability. To understand the
different uptake ability of rice compared to other plants we generated 3D structure of protein. Protein

Ca
Borderless Science Publishing 336
Canadian Chemical Transactions Year 2013 | Volume 1 | Issue 4 | Page 326-337
ISSN 2291-6458 (Print), ISSN 2291-6466 (Online)
sequences for the study were collected from NCBI as the starting step. These sequences were then run
through InterProScan to identify aquaporin or aquaporin-like domain. For rice, barley and maize plants,
there were the expected domains. Lsi1gene controls silicon accumulation in rice and is specific for silicon
transport. This Lsi1 gene belongs to aquaporin family and it has already been known that the aquaporin is
related to stress tolerance. The identification of a silicon transporter provides an insight into the silicon
uptake system in plants. After successful identification of essential domain, presence of NPA motif was
checked next step by Clustal Omega (multiple sequence alignment tools). The result from multiple
alignments confirmed the presence of NPA motif, responsible for better stress tolerance. In the subsequent
step SOSUI was used for the transmembrane domain prediction. SOSUI results have revealed that all the
sequences of this study have six transmembrane helix and all the helixes are started and ended almost at
the same position. After primary analysis of sequences we proceeded to predict 3D structure by I-
TASSER. Estimated C-score by I-TASSER was reliable for rice (-0.10), barley (0.11) and maize (0.14).
Another important parameter TM-score for rice (0.70), barley (0.73) and maize (0.73) has also verified
the structural accuracy. The generated models were validated by RAMPAGE also. All the above results
imply that the sequence analysis and generated models are acceptable and keep scope for further study.
Finally, the result found in microarray experiment shows a good expression status in both shoot and root
compared to other parts of the plant for almost every gene location ID. Further study with structural
information will provide valuable information for understanding difference and designing plants with
better uptake ability.
5. CONCLUSION
In this study our goal was to predict the 3D structure for silicon transporter protein in rice, barley
and maize. For that purpose presence of NPA motif was confirmed first. The result indicates the presence
of NPA motif twice for the studied sequences almost at the same regions resembling aquaporin in
conservancy. Thereafter, studied sequences confirm six transmembrane helixes and to be almost at the
same position indicating structural similarity. After confirmation of relevant motif and structural
similarity, I-TASSER was used for 3D structure prediction and the result was satisfactory to get reliable
model. All the predicted models were validated by RAMPAGE and study shows the reliability as well as
acceptance for the predicted models of rice, barley and maize. Eventually, expression profile through
microarray result in shoot and root shows the prospect of silicon transporter. The findings of this study
will be useful for making new varieties which are tolerant to biotic and abiotic stress.
REFERENCE AND NOTES
[1] Ma, J.; Miyake Y.; Takahashi, E. Silicon as a beneficial element for crop plants. Stud Plant Sci. 2001, 8, 17-
39.
[2] Epstein, E. Silicon. Annu Rev Plant Biol. 1999, 50, 641-664.
[3] Ma, J. F.; Tamai K.; Yamaji, N.; Mitani, N.; Konishi, S.; Katsuhara, M.; Ishiquro, M.; Murata, Y.; Yano, M.
A silicon transporter in rice. Nature 2006, 440, 688-691.
[4] Ma, J. F. Silicon transporters in higher plants. Adv Exp Med Biol. 2010, 679, 99-109.
[5] Ma, J. F; Yamaji, N.; Mitani, N. Transport of silicon from roots to panicles in plants. Proc. Jpn. Acad., Ser.
B 2011, 87, 377-385.
[6] Gurr, G.; Kvedaras, O. Synergizing biological control: scope for sterile insect technique, induced plant
defences and cultural techniques to enhance natural enemy impact. Biological Control 2012, 52, 198-207.
[7] Yamaji, N.; Chiba, Y.; Mitani, N.; Ma, J. F. Functional characterization of a silicon transporter gene

Ca
Borderless Science Publishing 337
Canadian Chemical Transactions Year 2013 | Volume 1 | Issue 4 | Page 326-337
ISSN 2291-6458 (Print), ISSN 2291-6466 (Online)
implicated in Si distribution in barley. Plant Physiol. 2009. 126, 1358-1369.
[8] Feng, J.; Shi, Q.; Wang, X.; Wei, M.; Yang, F.; Xu, H. Silicon supplementation ameliorated the inhibition of
photosynthesis and nitrate metabolism by cadmium (Cd) Toxicity in Cucumis sativus L. Sci. Hortic. 2010,
123, 521-530.
[9] Lee, S. K.; Sohn, E. Y.; Hamayun, M.; Yoon, J. Y.; Lee, I. J. Effect of silicon on growth and salinity stress
of soybean plant grown under hydroponic system. Agroforest Syst. 2010, 80, 333-340.
[10] Ma, J. F. Role of silicon in enhancing the resistance of plants to biotic and abiotic stresses. Soil Sci. Plant
Nutr. 2004, 50, 11-18.
[11] Mitani, N.; Yamaji, N; Ma, J. F. Identification of maize silicon influx transporters. Plant Cell Physiol. 2009,
50, 5-12.
[12] Takahashi, E.; Hino, K. Silica uptake by rice plant with special reference to the forms of dissolved silica.
Jpn. J. Soil Sci. Manure 1978, 49, 357-360.
[13] Mitani, N.; Ma, J. F. Uptake system of silicon in different plant species. J. Exp. Bot. 2005, 56, 1255-1261.
[14] Isa, M.; Bai, S.; Yokoyama, T.; Ma, J. F.; Ishibashi, Y.; Yuasa, T.; Iwaya, M. Silicon enhances growth
independent of silica deposition in a low-silica rice mutant, lsi1. Plant Soil 2010, 331, 361-375.
[15] Mitani, N.; Chiba, Y.; Yamaji, N.; Ma, J. F. Identification and characterization of maize and barley Lsi2-like
silicon efflux transporters reveals a distinct silicon uptake system from that in rice. Plant Cell 2009, 21,
2133-2142.
[16] Santoni, V.; Gerbeau, P.; Javot, H.; Maurel, C. The high diversity of aquaporins reveals novel facets of plant
membrane functions. Curr Opin Plant Biol. 2000, 3, 476-481.
[17] Eisenbarth, D.A.; Weig, A.R. Dynamics of aquaporins and water relations during hypocotyl elongation in
Ricinuscommunis L. seedlings. J. Exp. Bot. 2005, 56, 1831-1842.
[18] Lian, H.L.; Yu, X.; Ye, Q.; Ding, X. S.; Kitagawa, Y.; Kwak, S. S.; Su, W. A.; Tang, Z. C. The role of
aquaporin RWC3 in drought avoidance in rice. Plant Cell Physiol. 2004, 45, 481-489.
[19] Johanson, U.; Karlsson, M.; Johansson, I.; Gustavsson, S.; Sjövall, S.; Fraysse, L.; Weig, A. R.; Kjellbom,
P. The complete set of genes encoding major intrinsic proteins in Arabidopsis provides a framework for a
new nomenclature for major intrinsic proteins in plants. Plant Physiol. 2001, 126, 1358-1369.
[20] Kaldenhoff, R.; Bertl, A.; Otto, B.; Moshelion, M.; Uehlein, N. Characterization of plant aquaporins.
Methods Enzymol. 2007, 428, 505-531.
[21] Kammerloher, W.; Fischer, U.; Piechottka, G. P.; Schäffner, A. R. Water channels in the plant plasma
membrane cloned by immunoselection from a mammalian expression system. Plant J. 1994, 6, 187-199.
[22] Maeshima, M. Tonoplast transporters: organization and function. Annu Rev Plant Physiol Plant Mol Biol.
2001, 52, 469-497.
[23] Wallace, I.S.; Choi, W.G.; Roberts, D.M. The structure, function and regulation of the nodulin 26-like
intrinsic protein family of plant aquaglyceroporins. Biochim. Biophy. Acta Biomembranes 2006, 1758,
1165-1175.
[24]. Johanson, U.; Gustavsson, S. A new subfamily of major intrinsic proteins in plants. Mol Biol Evol 2002, 19,
456-461.
[25]. Dash S.; Van H. J.; Hong L.; Wise, R. P.; Dickerson, J. A. PLEXdb: gene expression resources for plants
and plant pathogens. Nucleic Acids Res. 2012, 40, D1194-D1201.
The authors declare no conflict of interest
© 2013 By the Authors; Licensee Borderless Science Publishing, Canada. This is an open access article
distributed under the terms and conditions of the Creative Commons Attribution license
http://creativecommons.org/licenses/by/3.0/