EFFECTS OF MAIZE (Zea mays L.) – SOYBEAN (Glycine max (L.) Merrill) INTERCROPPING PATTERNS ON...
123
EFFECTS OF MAIZE (Zea mays L.) – SOYBEAN (Glycine max (L.) Merrill) INTERCROPPING PATTERNS ON YIELDS AND SOIL PROPERTIES IN TWO CONTRASTING SITES OF EMBU AND MERU COUNTIES, KENYA Jossias Mateus Materusse Matusso, BSc. (Hon.) A148F/23965/2011 “A Thesis Submitted in Partial Fulfillment of the Requirements for the Award of the degree of Master of Science (Integrated Soil Fertility Management) in the School of Agriculture and Enterprise Development of Kenyatta University” March, 2014
-
Upload
afap-partnership -
Category
Documents
-
view
1 -
download
0
Transcript of EFFECTS OF MAIZE (Zea mays L.) – SOYBEAN (Glycine max (L.) Merrill) INTERCROPPING PATTERNS ON...

EFFECTS OF MAIZE (Zea mays L.) – SOYBEAN (Glycine max (L.) Merrill)
INTERCROPPING PATTERNS ON YIELDS AND SOIL PROPERTIES IN TWO
CONTRASTING SITES OF EMBU AND MERU COUNTIES, KENYA
Jossias Mateus Materusse Matusso, BSc. (Hon.)
A148F/23965/2011
“A Thesis Submitted in Partial Fulfillment of the Requirements for the Award of the degree
of Master of Science (Integrated Soil Fertility Management) in the School of Agriculture and
Enterprise Development of Kenyatta University”
March, 2014

ii
DECLARATION
This thesis is my original work and has not been presented for a degree in any other
university.
Jossias Mateus Materusse Matusso Date
_____________________________________ ___/___/___
We confirm that the work reported in this thesis was carried out by the candidate under our
supervision and submitted with our approval as university supervisors
Dr. Jayne Njeri Mugwe
Department of Agricultural Resource Management
School of Agriculture and Enterprise Development
Kenyatta University Date
_____________________________________ ___/___/___
Dr. Monicah Wanjiku Mucheru-Muna
Department of Environmental Science
School of Environmental Studies
Kenyatta University Date
_____________________________________ ___/___/___

iii
DEDICATION
In memory of my late father Mateus Materusse Matusso.

iv
ACKNOWLEDGEMENT
I would like to express my deepest appreciation to my supervisors; Dr. Jayne Njeri Mugwe
and Dr. Monicah Wanjiku Mucheru-Muna, for their advice, guidance, attention and support
during the course of this study. I am also very grateful to Dr. Benjamim Danga for facilitating
my coming to Kenya and for his technical and moral support. The support, encouragement,
and unconditional friendship provided by my brother of the trench, Benvindo Serafim
Manuel Mario Verde, is highly acknowledged. Dr. Isaac Osuga, a biometrician in the
Department of Agricultural Resource Management for provided useful input in data analysis.
I am grateful to Alliance for Green Revolution in Africa for awarding me full scholarship that
enabled me to pursue my MSc. studies at Kenyatta University. I also appreciate the team of
the Soya & Climbing Beans (SoCo) Project for the support provided in hosting me and all my
research work, including most of the inputs for my experiment both at Embu and Tigania-
Kamujine. I wish to sincerely thank the Principal Researcher of the project, Prof. Daniel
Mugendi for his technical and moral support throughout the research work. The support
provided by Dr. Felix Ngetich in setting my experiment is also acknowledged. I also wish to
thank the SoCo Project Field Coordinator, Mrs. Sarah Muchai for her patience and support.
The support provided by Steve Njeru and Wilfred Mirithi, technicians at Kamujine site and
Embu sites, respectively, is highly acknowledged. I am also grateful to Mirithi, Eric, Ndawa,
Mary, and Joshua at Kamujine site for their assistance in data collection and support.
I am also very grateful to Esperança Michaque for the encouragement and assistance in data
collection. Enock Rotich, the laboratory technician at Kenyatta University, School of
Agriculture and Enterprise Development, also provided useful support in laboratory analysis.

v
TABLE OF CONTENT
DECLARATION ........................................................................................................................... II
DEDICATION .............................................................................................................................. III
LIST OF TABLES ....................................................................................................................... VII
LIST OF FIGURES ................................................................................................................... VIII
LIST OF APPENDICES ............................................................................................................... IX
LIST OF ABBREVIATIONS AND ACRONYMS ....................................................................... X
ABSTRACT .................................................................................................................................. XI
CHAPTER ONE: INTRODUCTION ............................................................................................. 1
1.1. BACKGROUND ...................................................................................................................... 1
1.2. STATEMENT OF THE PROBLEM ............................................................................................. 3
1.3. JUSTIFICATION OF THE STUDY .............................................................................................. 4
1.4. RESEARCH QUESTIONS ......................................................................................................... 5
1.5. OBJECTIVES ......................................................................................................................... 5
1.5.1. General objective ................................................................................................................ 5
1.5.2. Specific objectives .............................................................................................................. 5
1.6. HYPOTHESES ........................................................................................................................ 6
1.7. SIGNIFICANCE OF THE STUDY ............................................................................................... 6
1.8. CONCEPTUAL FRAMEWORK .................................................................................................. 7
1.9. DEFINITION OF TERMS .......................................................................................................... 8
CHAPTER TWO: LITERATURE REVIEW ............................................................................... 10
2.1. GENERAL OVERVIEW .......................................................................................................... 10
2.2. ROLE OF LEGUME IN INTEGRATED SOIL FERTILITY MANAGEMENT ...................................... 11
2.3. CEREAL-LEGUMES INTERCROPPING SYSTEMS ..................................................................... 13
2.4. BENEFITS OF INTERCROPPING ............................................................................................. 13
2.4.1. Radiation use efficiency (RUE) ........................................................................................ 15
2.4.2. Nitrogen dynamics and uptake by maize-soybean in intercrop ........................................ 16
2.5. LIMITATIONS OF INTERCROPPING ....................................................................................... 17
2.6. BIOLOGICAL NITROGEN FIXATION (BNF) IN CEREAL – LEGUME CROPPING SYSTEMS ........ 18
2.7. NITROGEN TRANSFER IN CEREAL-LEGUME INTERCROPPING SYSTEMS ................................ 19
2.8. RESIDUAL EFFECTS OF CEREAL-LEGUME CROPPING SYSTEM .............................................. 19
2.9. EFFECTS OF SHADING ON SOYBEAN YIELD .......................................................................... 20
2.10. INTERCROPPING PRODUCTIVITY ......................................................................................... 22
CHAPTER THREE: MATERIALS AND METHODS ................................................................ 25
3.1. DESCRIPTION OF THE STUDY AREA ..................................................................................... 25
3.1.1. Embu West Sub County .................................................................................................... 25
3.1.2. Tigania East Sub County ................................................................................................... 28
3.2. EXPERIMENTAL DESIGN...................................................................................................... 29
3.3. MANAGEMENT OF THE EXPERIMENT .................................................................................. 31
3.2.1. Maize and soybean harvest and yields .............................................................................. 32
3.2.2. Soil sampling and determination of soil mineral nitrogen ................................................ 33

vi
3.2.3. Determination of maize and soybean N uptake and plant height...................................... 34
3.3. DETERMINATION OF LIGHT INTERCEPTION AND LEAF AREA INDEX ..................................... 35
3.4. PERFORMANCE OF THE INTERCROPPING MAIZE – SOYBEAN SYSTEMS ................................ 36
3.5. DATA ANALYSIS ................................................................................................................. 36
CHAPTER FOUR: RESULTS AND DISCUSSION ................................................................... 37
4.1. EFFECTS OF DIFFERENT MAIZE–SOYBEAN INTERCROPPING PATTERNS ON YIELDS AND N
UPTAKE, AND SOIL PROPERTIES ...................................................................................................... 37
4.1.1. Effect of intercropping pattern on maize yields ................................................................ 37
4.1.1.2.Maize yield component ..................................................................................................... 38
4.1.2. Effect of intercropping pattern on soybean yields and growth parameters ....................... 42
4.1.2.1. Plant height ...................................................................................................................... 42
4.1.2.2. Number of days to flowering and podding ...................................................................... 44
4.1.2.3. Soybean yields and components ...................................................................................... 45
4.1.2.4. Effects of maize–soybean intercropping patterns on N uptake by maize ........................ 54
4.1.2.4.1. Soil mineral N ............................................................................................................... 54
4.1.2.4.2. Nitrogen uptake by maize and soybean ........................................................................ 60
4.1.2.5. Effects of maize – soybean intercropping patterns on chemical soil properties .............. 64
4.2. EFFECTS OF MAIZE-SOYBEAN INTERCROPPING PATTERNS ON LIGHT INTERCEPTION AND
LEAF AREA INDEX ......................................................................................................................... 72
4.3. EFFECTS OF MAIZE–SOYBEAN INTERCROPPING PATTERNS ON LAND EQUIVALENT RATIO
(LER) OF MAIZE AND SOYBEAN ..................................................................................................... 81
CHAPTER FIVE: SUMMARY OF FINDINGS, CONCLUSIONS AND .................................. 85
RECOMMENDATIONS .............................................................................................................. 85
5.1. SUMMARY OF FINDINGS ..................................................................................................... 85
5.2. CONCLUSIONS .................................................................................................................... 89
5.3. RECOMMENDATIONS AND AREAS FOR FURTHER RESEARCH ................................................ 90
REFERENCES .............................................................................................................................. 91
APPENDICES ............................................................................................................................ 109
vii
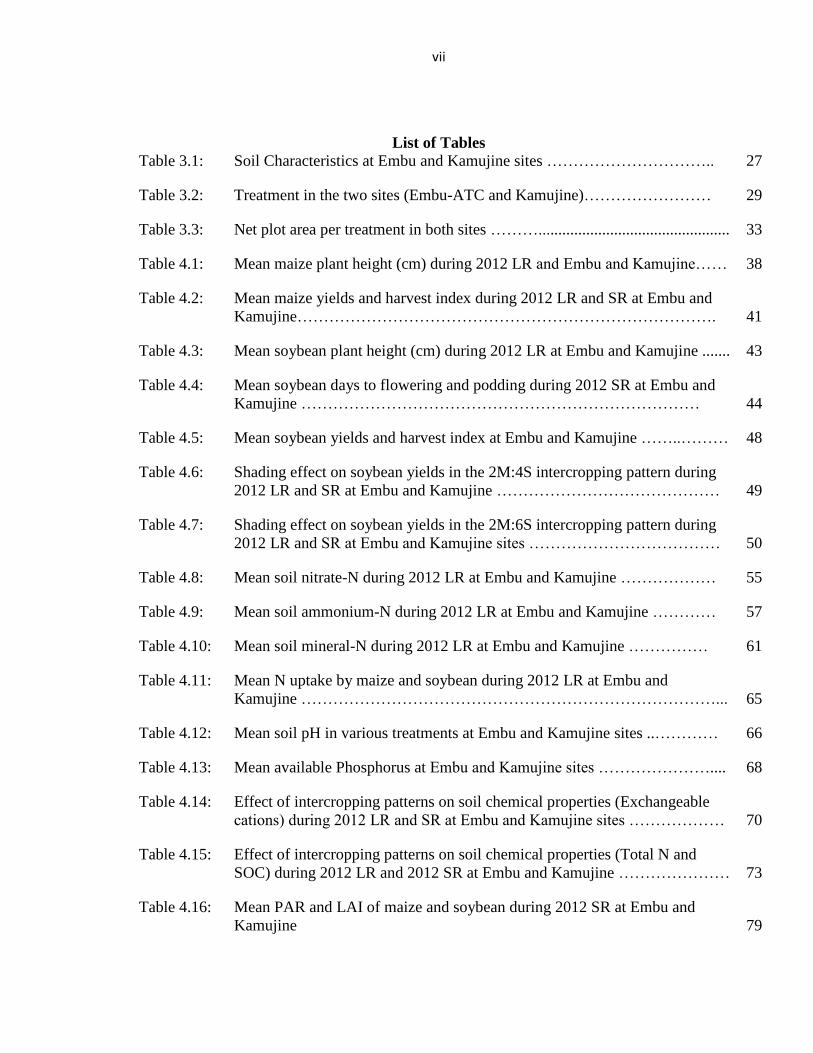
List of Tables
Table 3.1: Soil Characteristics at Embu and Kamujine sites ………………………….. 27
Table 3.2: Treatment in the two sites (Embu-ATC and Kamujine)…………………… 29
Table 3.3: Net plot area per treatment in both sites ………................................................ 33
Table 4.1: Mean maize plant height (cm) during 2012 LR and Embu and Kamujine…… 38
Table 4.2: Mean maize yields and harvest index during 2012 LR and SR at Embu and
Kamujine……………………………………………………………………. 41
Table 4.3: Mean soybean plant height (cm) during 2012 LR at Embu and Kamujine ....... 43
Table 4.4: Mean soybean days to flowering and podding during 2012 SR at Embu and
Kamujine ………………………………………………………………… 44
Table 4.5: Mean soybean yields and harvest index at Embu and Kamujine ……..……… 48
Table 4.6: Shading effect on soybean yields in the 2M:4S intercropping pattern during
2012 LR and SR at Embu and Kamujine …………………………………… 49
Table 4.7: Shading effect on soybean yields in the 2M:6S intercropping pattern during
2012 LR and SR at Embu and Kamujine sites ……………………………… 50
Table 4.8: Mean soil nitrate-N during 2012 LR at Embu and Kamujine ……………… 55
Table 4.9: Mean soil ammonium-N during 2012 LR at Embu and Kamujine ………… 57
Table 4.10: Mean soil mineral-N during 2012 LR at Embu and Kamujine …………… 61
Table 4.11: Mean N uptake by maize and soybean during 2012 LR at Embu and
Kamujine ……………………………………………………………………... 65
Table 4.12: Mean soil pH in various treatments at Embu and Kamujine sites ..………… 66
Table 4.13: Mean available Phosphorus at Embu and Kamujine sites ………………….... 68
Table 4.14: Effect of intercropping patterns on soil chemical properties (Exchangeable
cations) during 2012 LR and SR at Embu and Kamujine sites ……………… 70
Table 4.15: Effect of intercropping patterns on soil chemical properties (Total N and
SOC) during 2012 LR and 2012 SR at Embu and Kamujine ………………… 73
Table 4.16: Mean PAR and LAI of maize and soybean during 2012 SR at Embu and
Kamujine 79

viii
Table 4.17: Effects of maize shade on PAR intercepted by soybean during 2012 SR at
Embu and Kamujine sites …………………………………………………… 81
Table 4.18: Mean land equivalent ration during 2012 LR and SR at Embu and Kamujine
sites …………………………………………………………………………… 83
List of Figures
Figure 1.1: Conceptual diagram of the study …………………………………………… 7
Figure 3.1: Map of Kenya (a) and the study area (b) .…………………………………… 25
Figure 3.2: Rainfall amount during 2012 LR and 2012 SR at Embu-ATC and Kamujine
sites, Kenya .……………………………………………………………......... 26
Figure 3.3: Schematic representation of maize-soybean intercrop planted in alternate
rows at an inter-row of 37.5 cm in the conventional system, 1M:1S ……… 30
Figure 3.4: Schematic representation of MBILI-MBILI treatment showing intercrop
with two rows of soybean in between two rows of maize spaced at 1.0m.
Soybean-soybean spaced at 33.3 cm and maize-maize at 50 cm ………… 30
Figure 3.5: Schematic representation of 2M:4S treatment showing intercrop with four
rows of soybean in between two rows of maize spaced at 166.5 cm.
Soybean-soybean spaced at 33.3 cm and maize-maize spaced at 50 cm ……
30
Figure 3.6: Schematic representation of 2M:6S treatment showing intercrop with six
rows of soybean in between two rows of maize. Soybean-soybean spaced at
33.3 cm and maize-maize spaced at 50 cm ……………………………… 31
Figure 4.1: Relation between soybean grain yield with PAR intercepted and LAI in
middle rows during 2012 SR at Embu site ………………………………… 51
Figure 4.2: Relation between soybean stover yield with PAR intercepted and LAI in
middle rows during 2012 SR at Kamujine site ……………........................... 52
Figure 4.3: Relation between soybean s grain yield with PAR intercepted and LAI in
middle rows during 2012 SR at Kamujine site ………………........................ 52
Figure 4.4: Soil mineral-N trend at 0-15 cm soil depth sampled at different periods
during 2012 LR at Embu site ……………………………………………….. 58
Figure 4.5: Soil mineral-N trend at 0-15 cm soil depth sampled at different periods
during 2012 LR at Kamujine site ……………………………… 59

ix
Figure 4.6: Relation between soybean grain yield under MBILI treatment with PAR and
LAI during 2012 SR at Embu site ………………………………………… 74
Figure 4.7: PAR intercepted (%) during 2012 SR at Embu (a) and Kamujine (b) sites … 77
List of Appendices
Appendix 1. Analysis of Variance for maize stover yield (2012 LR), Embu-ATC site 109
Appendix 2. Analysis of Variance for maize stover yield (2012 SR), Embu-ATC site 109
Appendix 3. Analysis of Variance for maize grain yield (2012 LR), Embu-ATC site 109
Appendix 4. Analysis of Variance for maize grain yield (2012 SR), Embu-ATC site 109
Appendix 5. Analysis of Variance for maize stover yield (2012 LR), Kamujine site 110
Appendix 6. Analysis of Variance for maize stover yield (2012 SR), Kamujine site 110
Appendix 7. Analysis of Variance for maize grain yield (2012 SR), Kamujine site 110
Appendix 8. Analysis of Variance for maize grain yield (2012 SR), Kamujine site 110
Appendix 9. Analysis of Variance for soybean stover yield (2012 SR) Embu-ATC
site
111
Appendix 10. Analysis of Variance for soybean stover yield (2012 SR), Embu-ATC
site
111
Appendix 11. Analysis of Variance for soybean grain yield (2012 SR), Embu-ATC site 111
Appendix 12. Analysis of Variance for soybean grain yield (2012 SR), Embu-ATC site 111
Appendix 13. Analysis of Variance for soybean stover yield (2012 SR), Kamujine site 112
Appendix 14. Analysis of Variance for soybean stover yield (2012 SR), Kamujine site 112
Appendix 15. Analysis of Variance for soybean grain yield (2012 SR), Kamujine site 112
Appendix 16. Analysis of Variance for soybean grain yield (2012 SR), Kamujine site 112

x
List of Abbreviations and Acronyms
ANOVA Analysis Of Variance
ASL Above Sea Level
CAN Calcium Ammonium Nitrate
LAI Leaf Area Index
LER Land Equivalent Ratio
LM 3 Lower Midland
UM 3 Upper Midland
PAR Photosynthetically Active Radiation
TSP Triple Super Phosphate
US$ United State dollar
WAP Weeks After Planting
MBILI-MBILI Two by two
MAI Monetary Advantage Index
BCR Benefit Cost Ratio
SOM Soil Organic Matter
SSA Sub-Saharan Africa
ISFM Integrated Soil Fertility Management
RUE Radiation Use Efficiency
AEZ Agro-Ecological Zone
RCBD Randomized Complete Bock Design
KCL Potassium Chloride
SOC Soil Organic Carbon
LR Long Rain
SR Short Rain
PAR Photosynthetic Active Radiation
HIV/AIDS Human Immunodeficiency Virus/Acquired
Immunodeficiency Syndrome
FURP Fertilizer Use Recommendation Project
BNF Biological Nitrogen Fixation
HI Harvest Index
LER Leaf Equivalent Ratio
WAP Weeks After Planting
ATC Agricultural Training Centre

xi
ABSTRACT
In the central highlands of Kenya, the adoption of integrated soil fertility management
technologies such as maize-soybean intercropping system is being promoted as one of the
options to address low crop productivity and soil fertility depletion among the farmers of this
region. This study aimed to: (i) determine the effects of maize-soybean intercropping patterns
on yields, N uptake, and soil properties; (ii) determine the effects of different maize-soybean
intercropping patterns on light interception and leaf area index; (iii) quantify the land
equivalent ratio of various maize soybean intercropping patterns. The study areas were Embu
– Agriculture Training Centre in Embu district (Embu County) and Kamujine in Tigania East
district (Meru County). The main treatments were four maize – soybean intercropping
patterns (conventional-1maize:1soya; MBILI-2maize:2soya; 2maize:4soya; 2maize:6soya)
and two sole crops of maize and soybean, respectively. The experimental design was a
randomized complete block design with four replications, and plot size of 7.0 m by 4.5 m.
The study was carried out in two seasons (long rain 2012 and short rain 2012). The soil was
sampled at 15 cm depth. All biophysical data were subjected to Analysis of Variance and
means separated using Least Significant Difference of mean at 95% (p ≤ 0.05). The results
showed that, the maize-soybean intercropping patterns had significant effect on maize stover
and grain yields during both seasons at Embu site. During the long rain 2012, the soybean
yields were reduced by 60 and 81% due to the intercropping with maize, at Embu and
Kamujine, respectively; whereas during the 2012 SR, the yields were reduced by 52 and 78%
as effect of intercropping with maize at Embu and Kamujine sites, respectively. In general,
the soil nitrate-N was reduced due to intercropping patterns. The soil organic matter was
significantly (p≤0.05) affected by the treatments at Kamujine site. The intercropping patterns
affected significantly (p≤0.0001) the photosynthetically active radiation intercepted and the
leaf area index at both sites. During both seasons at both localities, the total land equivalent
ratio values greater than unit. From the results of this study, the use of MBILI maize-soybean
intercropping pattern can be recommended to the farmers of central highlands of Kenya
because of more efficient resources use and higher yields.

1
CHAPTER ONE: INTRODUCTION
1.1. Background
Smallholder farmers are the most important food security stakeholders in Sub-Saharan Africa
(FAO, 2011), who mainly practice subsistence agriculture characterized by low crop
productivity due to the soil nutrient depletion (Mugwe et al., 2007). The majority of these
farmers lack financial resources to purchase sufficient amount of mineral fertilizers to replace
soil nutrients removed through harvested crop products (Jama et al., 2000), crop residues, and
through loss by runoff, leaching and as gases (Bekunda et al., 1997). Consequently, poor soil
fertility has emerged as one of the greatest biophysical constraint to increasing agricultural
productivity hence threatening food security in this region (Mugwe et al., 2009; Mugendi,
1997). Therefore, it is necessary to adopt improved and sustainable technologies in order to
guarantee improvements in food productivity and thereby food security (Landers, 2007;
Gruhn et al., 2000). Such technologies include the use of integrated soil fertility management
practices (ISFM) such as improved intercropping systems of cereals with grain legumes as
one of its main components (Mucheru-Muna et al., 2010; Sanginga and Woomer, 2009).
Cereal – grain legume intercropping has potential to address the soil nutrient depletion on
smallholder farms (Sanginga and Woomer, 2009). The legumes play an important role in
nitrogen fixation (Peoples and Craswell, 1992), and are important source of nutrition for both
humans and livestock (Nandwa et al., 2011). In the central highlands of Kenya, cereal –
legume intercropping is already being widely practiced by the smallholder famers where the
most predominant are maize-common bean, maize-cowpea as well as maize-pigeonpea

2
(Jaetzold et al., 2006). According to Sanginga and Woomer (2009) intercropping cereal and
grain legume crops helps maintain and improve soil fertility, because crops such as cowpea,
mung bean, soybean and groundnuts accumulate from 80 to 350kg nitrogen (N) ha-1 (Peoples
and Craswell, 1992). For instance, soybean can positively contribute to soil health, human
nutrition and health, livestock nutrition, household income, poverty reduction and overall
improvements in livelihoods and ecosystem services, than many others leguminous grain
crops (Rakasi, 2011; Raji, 2007). Moreover, intercropping maize with soybean was reported
to be profitable in terms of land utilization, in western Kenya (Kipkemoi et al., 2002).
Although soybean is relatively new crop for smallholder farmers in the central highlands of
Kenya, its cultivation is expected to gain popularity in the near future due to the increasing
demand on food to their families and fodder for their livestock (Mugendi et al., 2010). It is
mostly being intercropped with maize using the conventional 1:1 intercropping system,
recommended by the Kenyan Ministry of Agriculture. However, field trials conducted in
western Kenya showed improved intercropping system of two rows of cereal followed by two
rows of leguminous crop, known as Mbili in Kiswahili, to be more profitable than the
conventional intercropping system, due to its efficiency in use of resources, particularly land,
nutrients, light and water (Woomer et al., 2004).
Nevertheless, intercropping of cereal-legume may lead to reduction in yield of the legume
component because of the adverse competitive effects (Willey et al., 1983). Often, the cereal
component with relatively higher growth rate, height advantage and a more extensive rooting
system is favored in the competition with the associated legume crop. Thus, the greater yield
loss of the minor crop is mainly due to reduced photosynthetically active radiation (PAR)

3
reaching the lower parts of the intercrop canopy, occupied by the minor legume (Liu et al.,
2010). The intensity and the quality of solar radiation intercepted by the canopy are important
determinants of yield components and therefore yield of soybean since it is sensitive to
shading (Liu et al., 2010; Purcell, 2000). Light levels during the late flowering to mid pod
formation stages of growth have been found to be more critical than during vegetative and
late reproductive periods (Liu et al., 2010; Schou et al., 1978).
Therefore, any interventions that lead to increased amount of PAR interception by the minor
crop have potential to increase the yield of the minor crop and increase productivity of the
intercropping system (Mashingaidze, 2004). For instance, Woomer and Tungani (2003)
reported that MBILI system had resulted in 20 per cent more light penetration to the minor
legume component when compared to the conventional intercropping pattern. Improved
intercropping systems are part of ISFM technologies (Mucheru-Muna et al., 2010; Sanginga
and Woomer, 2009) and in central highlands of Kenya the information is scarce in regard to
optimum cropping pattern of maize-soybean.
1.2. Statement of the Problem
In the central highlands of Kenya, low soil fertility is one of the major constraints causing
decreased maize production and other staple food and income generating crops, leading to
hunger and poverty, where over 90 per cent of farmers are resource poor smallholders. The
situation is worsened by continued mining of nutrients, poor nutrient conservation practices,
increasing population growth and land scarcity. The adoption of maize-soybean intercropping
system is being promoted as one of the options for increasing crop production by the farmers.
Available evidence indicate that improved intercropping systems with integration of legume

4
as part of ISFM technologies have large scope for increasing crop yields and householder
income. However, small scale farmers of this region lack information on optimum cropping
pattern. The purpose of this study was therefore to evaluate the effect of maize-soybean
intercropping pattern on maize and soybean yields and soil properties.
1.3. Justification of the Study
The intercrop of maize and soybean is an alternative system for small-scale farmers to
improve income and food production per unit of area (Mukhala et al., 1999), and lessen the
risk of total crop failure due to environmental limitations (Prasad and Brook, 2005). Woomer
and Tungani (2003), after several years of on-farm trials found that MBILI system resulted in
an increase of 422 kg maize, 443 kg pulses and KSh 23300 net returns (about US $300) per
hectare over conventional intercropping, in Western Kenya. Also, in recognition of the
economic and nutritional importance of soybean as grain legume and maize as important
cereal crop, smallholder farmers of many countries prefer the cultivation of soybean and
maize in mixture as against sole cropping system (Muoneke et al., 2007). Soybean possesses
a very high nutritional value; it contains 20 percent oil, 40 per cent high quality protein, as
against 7 percent rice, 12 per cent wheat, 10 per cent maize, 20 to 25 percent other pulses
(Raji, 2007). Its protein is rich in the valuable amino acid lysine (5 percent) in which most
cereals are deficient. It also contains a good amount of minerals, salts, and vitamins (Singh,
1983).

5
1.4. Research questions
The following research questions guided this study;
i. Which is the maize – soybean intercropping pattern that gives maximum economic
yields, efficient N uptake and improved soil properties?
ii. Which is the maize – soybean intercropping pattern that uses light more efficiently
and gives the highest leaf area index in each of the constrasting sites?
iii. Which maize-soybean intercropping pattern gives the highest Land Equivalent Ratio
(LER) in each of the constrasting sites?
1.5. Objectives
1.5.1. General objective
To evaluate the effect of maize-soybean intercropping patterns on yields, soil properties, and
performance in terms of land equivalent ratio.
1.5.2. Specific objectives
The specific objectives of the study are to:
1. Determine the effects of different maize–soybean intercropping patterns on yields, N
uptake and soil properties.
2. Determine the effects of different maize–soybean intercropping patterns on light
interception and leaf area index in two contrasting sites.
3. Quantify the land equivalent ratio of different maize–soybean intercropping patterns
in two contrasting sites.

6
1.6. Hypotheses
The study was guided by the following research hypotheses:
1. The MBILI intercropping pattern gives significantly higher yields than conventional
intercropping pattern.
2. The 2:6 intercropping pattern of maize-soybean is more efficient in light use and
gives higher leaf area index than conventional (1M:1S) intercropping pattern.
3. The 2M:6S intercropping pattern of maize-soybean significantly improves soil
properties more than the conventional intercropping pattern.
4. Nitrogen uptake and land equivalent ratio is significantly higher in 2M:4S
intercropping pattern than the MBILI (2M:2S) intercropping pattern.
1.7. Significance of the study
This study will contribute to providing useful information on optimum maize-soybean
intercropping pattern which should guide smallholder farmers on the management of this new
crop in the region. Further, the study will add value on the ISFM technologies that are being
promoted in Africa. Lastly, the study will bring useful information which can guide extension
services on better management practices of maize-soybean cropping system to be
recommended to the smallholder farmers of the central highlands of Kenya.

7
1.8. Conceptual framework
The maize-soybean intercropping system is being promoted for smallholder farmers in the
central highlands of Kenya, using the conventional practice (scenario A in Figure 1.1) that
has been proven not efficient by several researchers (Mucheru-Muna et al., 2010), leading to
an decrease in household welfare, food insecurity and increase soil nutrient depletion
(Sanginga and Woomer, 2009). The use of optimum cropping pattern plus other ISFM
practices (scenario B in Figure 1.1) has potential for improving light and nutrient use
resulting in increased yields hence contributing to household welfare and food security
(Mucheru-Muna et al., 2010; Woomer and Tungani, 2003). The dependent variables in this
study are the different cropping patterns while the dependent variable comprises yield and
soil components.
Figure 1.1: Conceptual diagram showing linkages among variables in the study.
Different Maize-soybean
cropping patterns:
Sole crop
Conventional
Mbili-Mbili
2 maize rows: 4 soybean
rows
2 maize rows : 6 soybean
rows
Decrease crop yields
Decrease land productivity
Decrease soil fertility status
Inefficient light and nutrient use
Decrease monetary return
Increase crop yields
Increase land productivity
Increase soil fertility status
Efficient light and nutrient use
Increase monetary return
Decrease household
welfare
Food insecurity
Increase soil nutrient
depletion
i. Increase household welfare
Decrease household
welfare
ii. Food insecurity
iii. Increase soil nutrient
depletion
iv. Food security
v. Improved soil fertility
status
Independent
variables
Dependent
variables
A
B

8
1.9. Definition of terms
Soil is a three-dimensional, dynamic, natural body occurring on the surface of the earth that is
a medium for plant growth and whose characteristics have resulted from the integrated effect
of climate and living matter acting upon parental material, as modified by relief, over periods
of time (Gupta, 2011).
Soil fertility is the inherent capacity of the soil to provide essential chemical elements for
plant growth. A fertile soil is not necessarily a productive soil because productivity
emphasizes the capacity of soil to produce crops and be expressed in terms of yields (Gupta,
2011).
Biological Nitrogen Fixation (BNF) is the assimilation of free nitrogen from the air by soil
organisms, eventually making the nitrogen available to plants (Foth, 1990).
Soil nutrient depletion is the process by which the soil loses its nutrients and is not
replenished it the same amounts. There are three basic processes through which nutrients are
depleted in soil, they are: (i) crop removal, (ii) leaching losses and (iii) loss in gaseous form
(Gupta, 2011).
Farming system is an agricultural enterprise, activity or business consisting of a combination
of inputs (e.g. crop varieties, land, farm practice, etc.) whether in numbers, amounts,
sequences and timing used to satisfy specific objectives of the farmer under a specified
environmental setting (Silwana, 2000).
Intercropping is the cultivation of two or more crops simultaneously on the same piece of
land in competition among them (Willey et al., 1983).

9
Leaf Area Index (LAI) was defined by Watson (1947) as the total one‐sided area of leaf tissue
per unit ground surface area.
Photosynthetically Active Radiation (PAR) is the amount of light available for
photosynthesis, which is light in the 400 to 700 nanometer wavelength range. PAR changes
seasonally and varies depending on the latitude and time of day.
Land equivalent ratio (LER), defined as the total land area required under monocropping to
give the yields that are obtained under intercropping mixture, is normally used for analysis of
possible advantages of intercropping (Willey et al., 1980).

10
CHAPTER TWO: LITERATURE REVIEW
2.1. General overview
Soil fertility depletion in smallholder farms is the fundamental biophysical root cause for
declining per capita food production in Sub-Saharan Africa (Sanchez et al., 1997). An
average of 660 kg N ha-1, 75 kg P ha-1, and 450 kg K ha-1 has been lost during the last 30
years from about 200 million ha of cultivated land in 37 African countries (Braun et al.,
1997). The major reasons for the nutrient depletion process are: the breakdown of traditional
practices and the low priority given to the rural sector (Sanchez et al., 1997). Increasing
pressures on agricultural land have resulted in much higher nutrient outflows and the
subsequent breakdown of many traditional soil fertility maintenance strategies, such as
fallowing land, intercropping cereals with legume crops, mixed crop-livestock farming, and
opening new lands (Sanchez et al., 1997). Thus, continued population pressure has reduced
farm sizes to the point where farms can only provide adequate living for their families if the
land is farmed very intensively and if there is off-farm income (Sanchez et al., 1997). Lack of
an effective fertilizer supply and distribution system has resulted in reduced crop productivity
and food insecurity as the main consequences of the soil fertility depletion in Africa (Palm et
al., 1997).
Because of that, soils have come under intensive cultivation only recently as human
populations have increased, often leading to greater net losses of Soil Organic Matter due to
reduced organic inputs, the faster rate of Soil Organic Matter turnover under cultivation, and
increased losses from soil erosion. As a result Soil Organic Matter and the supply of N have

11
declined as natural fallows shortened or vanished, and the short- to medium-term capital store
of N has effectively been used up. For the replenishment of N there are three principal
sources, biological N2 fixation, organic resources recycled within the cropping field or
concentrated from a larger area, and mineral N fertilizers. Any proposed interventions must
generate cropping systems that are productive, sustainable, and economically attractive for
smallholder subsistence farmers (Buresh et al., 1997). In the most densely populated areas,
such as central highlands of Kenya, land scarcity prohibits the devotion of land to restoration
of soil fertility. In this region, the use of mineral fertilizers is less than 20 kg N ha-1 and 10 kg
P ha-1 (Muriithi et al., 1994), due to their unavailability and high d prices (Jama et al., 2000).
Furthermore, the use of manure is also limited due to its low availability in required amounts
to sustain crop production when used exclusively (Kihanda, 2004). Thereby, integrated
nutrient management options need to be sought and the efficient use of these inputs also need
to be properly addressed for sustainable soil fertility management on smallholder farms
(Mucheru-Muna et al., 2008).
2.2. Role of legume in integrated soil fertility management
Poor soil fertility and nutrient depletion continue to represent huge obstacles to securing
needed harvest in SSA (Sanginga and Woomer, 2009). Integrated soil fertility management
(ISFM) technologies, which combine various existing soil fertility management techniques,
and where improved leguminous crops play multiple roles in soil fertility improvements, food
and fodder provision, are considered of particular importance to overcome this situation in
most smallholder farming systems of the region (Nandwa et al., 2011; Mugendi et al., 2011).

12
Several studies have been carried out in recent years and proven the beneficial effects of
legumes on soil fertility improvements (Sanginga and Woomer, 2009). For instance, in
Kenya Mugwe et al. (2009) found that herbaceous legumes improved soil fertility properties,
especially cations (Ca, K and Mg). In Tanzania Tuaeli and Friesen (2003) reported that the
soil fertility was improved after incorporation of Dolichos and Mucuna to the soil. In
Uganda, Fishler and Wortmann (1999) reported that maize grown following crotalaria
produced significantly higher yield than the one without leguminous cover crop, and they
attributed the positive effect to high nitrogen and phosphorus benefits and nutrient pumping
ability of legumes from deeper horizons.
In addition to the reports about the ability of herbaceous legumes to increase soil fertility
properties, there are also studies showing the huge contribution of nitrogen-fixing trees to soil
fertility improvement. For example, in Kenya Rutunga et al. (1999) showed that maize yield
was increased by up to 100 percent after six-months of fallow period with Tephrosia vogelii,
which accumulated 154 kg N ha-1. However, grain legumes are more acceptable to
smallholder farmers than herbaceous legumes or nitrogen-fixing trees, which occupy land
meant for food production (Peoples and Craswell, 1992), indicating some tradeoffs that need
to be accommodated (Odendo et al., 2011). For instance, Oyewole et al. (2000) found that
smallholder farmers preferred cowpea-maize to mucuna-maize double cropping to keep grain
producing cowpea in the system although the benefits of cowpea was less than that of
mucuna.

13
2.3. Cereal-legumes intercropping systems
In intercropping system there is one main crop cultivated with one or more added crops
where the main crop is of primary importance due to economic or food production reasons
(Brintha and Seran, 2009). In the SSA region, cereal and grain legumes intercrop is the most
practiced by smallholder farmers (Odendo et al., 2011; Sanginga and Woomer, 2009). The
major reason why these farmers intercrop cereals and grain legumes is because they are
particularly important human food as they are rich in protein and are sometimes sold for cash
income (Odendo et al., 2011). In addition, intercrops give them the stability of the yields over
several seasons (Ofori and Stern, 1987; Steiner, 1982), when one crop fails, the other might
still give a reasonable yield (Prasad and Brook, 2005; Beets, 1982; Steiner, 1982).
Furthermore, grain legumes help maintain and improve soil fertility due to their ability to
biologically fix atmospheric nitrogen (Sanginga and Woomer, 2009; Jarenyama et al., 2000;
Ofori and Stern, 1987; Horwith, 1985; Willey et al., 1983).
2.4. Benefits of intercropping
The intercropping of maize and legumes is widespread among smallholder farmers due to the
ability of the legume to cope with soil erosion and with declining levels of soil fertility. The
principal reasons for smallholder farmers to intercrop are flexibility, profit maximization, risk
minimization against total crop failure, soil conservation and improvement of soil fertility,
weed control and balanced nutrition (Shetty et al., 1995). Other advantages of intercropping
include potential for increased profitability and low fixed costs for land as a result of a
second crop in the same field (Thobatsi, 2009). Furthermore, intercrop can give higher yield
than sole crop yields, greater yield stability, more efficient use of nutrients, better weed

14
control, provision of insurance against total crop failure, improved quality by variety, also
maize as a sole crop requires a larger area to produce the same yield as maize in an
intercropping system (Viljoen and Allemann, 1996). For example, regularly intercropped
pigeonpea or cowpea can help to maintain maize yield to some extent when maize is grown
without mineral fertilizer on sandy soil in Sub-humid zones of Zimbabwe (Waddington et al.,
2007). Intercropping maize with cowpea has been reported to increase light penetration in the
intercrops, reduce water evaporation, and improve conservation of the soil moisture
compared with maize alone (Ghanbari et al., 2010).
On the other hand, it is often believed that traditional intercropping systems are better in
weeds, pests and diseases control compared to the monocrops, but it must be known that
intercropping is an almost infinitely variable, and often complex, system in which adverse
effects can also occur. Weed growth basically depends on the competitive ability of the
whole crop community, which in intercropping largely depends on the competitive abilities
of the component crops and their respective plant populations (Willey et al., 1983). For
instance, intercropping of cereals and cowpea has been observed to reduce striga infestation
significantly (Khan et al., 2002). This was attributed to the soil cover of cowpea that created
unfavorable conditions for striga germination (Mbwaga et al. 2001). Mashingaidze (2004)
found that maize-bean intercropping reduced weed biomass by 50-66 percent when
established at a density of 222,000 plants ha-1 for beans equivalent to 33 percent of the maize
density (37,000 plants ha-1). Weed suppression in maize-groundnut intercropping was
reported by Steiner (1984). Other studies where intercropping systems were used as an
integrated weed management tool reported the same results (Caporali et al., 1998; Rana and
Pal, 1999).

15
For pests and diseases, the most commonly quoted effect is that one crop can provide a
barrier to the spread of a pest or disease of the other crop (Willey et al., 1983). Brown (1935)
noted that bud worm infestation in sole maize was greater than in maize intercropped with
soybean. Sekamatte et al. (2003) reported that soybean and groundnut are more effective in
suppressing termite attack than common beans. The average percentage of maize stalk borer
infestation was significantly greater in monocropped (70 percent) than in intercropped maize-
soybean (Martin, 1990).
Moreover, intercropping systems control soil erosion by preventing rain drops from hitting
the bare soil where they tend to seal surface pores, prevent water from entering the soil and
increase surface runoff (Seran and Brintha, 2010). Kariaga (2004) found that in maize-
cowpea intercropping system, cowpea act as best cover crop and reduced soil erosion than
maize-bean system. Reddy and Reddi (2007) found that taller crops act as wind barrier for
short crops, in intercrops of taller cereals with short legume crops. Similarly, sorghum-
cowpea intercropping reduced runoff by 20-30 percent compared with sorghum sole crop and
by 45-55 percent compared with cowpea monoculture. Also, soil loss was reduced with
intercropping by more than 50 percent compared with sorghum and cowpea monocultures
(Zougmore et al., 2000).
2.4.1. Radiation use efficiency (RUE)
Intercropping of high and low canopy crops helps to improve light interception and hence
yields of the shorter crops requires that they be planted between sufficiently wider rows of
the taller once (Seran and Brintha, 2010). For instance, Ennin et al. (2002) found that per cent
PAR intercepted by intercrops was 4 per cent greater in closer row arrangements of soybean

16
and maize than in equally spaced 2 rows soybean: 2 rows maize. Reddy et al. (1980) reported
that millet-groundnut intercrop system was 28 percent more efficient in light use than their
monocrops, which was attributed to approximately 30 percent greater LAI of the intercrop
than the sole crops. Leaf area index of a canopy is important for predicting crop growth and
yields (Xinyou et al., 2003). A reasonable LAI is critical to maintain high photosynthetic
rates and the yield (Xiaolei and Zhifeng, 2002). If the index is too low, not enough light will
be absorbed and if too high, lower leaves will not receive enough light and will thus be a
liability (Brintha and Seran, 2009).
2.4.2. Nitrogen dynamics and uptake by maize-soybean in intercrop
Of all nutrients, N is required in the greatest quantity for plant growth, and the capacity of
soils to supply N to plants is inextricably linked to the amount and nature of the soil organic
matter (SOM). According to Giller et al. (1991), there are three main forms of N capital, i)
mineral N (NH4+ - N and NO3
- - N) susceptible to losses (also known as soil mineral N); ii)
organic N which is in the SOM, which is mineralizable in the relatively short term (months)
and medium term (1 to 5 years); and, iii) long-term N capital is essentially the more
recalcitrant part of SOM that contributes relatively little to N supply within 5 to 10 years.
This mineral N has been reported to be dynamic in the soil because both nitrate-N (NO3- - N)
and ammonium-N (NH4+ - N) may be recycled within the soil biota, taken up by the crop,
retained within the soil matrix or lost through leaching, volatilization, nitrification and
denitrification processes (Barrios et al., 1998).
Although nitrogen is one of the major plant nutrients, in the central highlands of Kenya many
soils are severely N deficient (Mugwe et al., 2011), and studies from SSA and elsewhere

17
confirm the importance of N nutrition in crop yields, and the potential for use of soil
inorganic N as predictors of yields. For example, in Zambia Barrios et al. (1998) obtained
strong correlations between maize grain yields and pre-season inorganic N in surface soil. In
Uganda, Stephen (1967) cited by Ikerra et al. (1999) reported that soil NO3--N 4 WAP was
highly correlated with maize yields. In Nigeria, Webert at al. (1995) obtained a highly
significant relationship between maize grain yields and soil nitrate-N at 2 to 8 WAP. On the
other hand, Van Kessel and Roskoski (1988) found that maize grown at the closer row
spacing with cowpea registered higher N-uptake during the first 7 WAP, whereas maize
grown at the widest row spacing had higher N-uptake during the last 4 WAP before the final
harvest. Li et al. (2002) found that when the roots of two species intermingled N uptake was
384 kg N ha−1 while, when the roots of the two species were separated completely, it was
reduced by 21 percent.
2.5. Limitations of intercropping
Intercropping can lead to reduction in yield of one or more of component crops due to
adverse competitive effects (Willey and Rao, 1980). Competition between component crops
for growth limiting factor is regulated by basic morpho – physiological differences and
agronomic factors such as proportion of crops in the mixture, fertilizer applications and
relative sowing time (Willey and Rao, 1980). Where component crops area arranged in
definite rows the degree of competition is determined by the relative growth rates, growth
duration and proximity of roots of the different crops (Willey and Rao, 1980). In cereal-
legume intercrops, cereal component with relatively higher growth rate, highest advantage
and a more extensive rooting system is favored in the competition with associated legume

18
(Ofori and Stern, 1987). A review by Ofori and Stern (1987), of 40 published papers showed
that the yield of the legume component declined on average by about 52 percent of the sole
crop yield whereas the cereal yield was reduced by only 11 percent. The general observations
from this are that yields of the legume components are significantly depressed by cereal
components in intercropping, which is attributed to reduced photosynthetically active
radiation (PAR) that reaches the lower parts of the maize canopy occupied by the soybean
crop. Another limitation of intercropping is often thought to be difficulties concerned with
practical management of intercropping especially where there is a high degree of
mechanization or where the component crops have different requirements for fertilizer and
pesticides (Willey et al., 1980).
2.6. Biological Nitrogen Fixation (BNF) in cereal – legume cropping systems
One promising alternative that can substantially reduce investment in fertilizers is the
inclusion of legumes in the various cereals farming systems (Osunde et al., 2004), due to the
fact that legumes have the ability to biologically fix nitrogen from the atmosphere, which is
the major source of N in legume-cereal mixed cropping systems (Fujita at al., 1992). For
instance, Osunde et al. (2004) found that without the addition of fertilizer the proportion of N
derived from N2-fixation was about 40 percent in the intercropped soybean and 30 percent in
the sole crop, and with application of 40 kg N ha-1 N2-fixed by the sole cropped soybean was
significantly greater than that fixed by intercropped system. Yusuf et al. (2007) found that
maize grain yield was 46 percent significantly higher when grown after soybean than after
maize and natural fallow.

19
2.7. Nitrogen transfer in cereal-legume intercropping systems
Evidence suggests that associated non-legumes may benefit through N-transfer from legumes
(Fujita et al., 1992). This N-transfer is considered to occur through root excretion, N leached
from leaves, leaf fall, and animal excreta if present in the system (Fujita et al., 1992). The
limited studies carried out within SSA suggested that N2-fixed by a leguminous component
may be available to the associated cereal in the current growing season (Eaglesham et al.,
1981), known as direct N transfer (Stern, 1993). Eaglesham et al. (1981) showed that 24.9
percent of N fixed by cowpea was transferred to maize. However, Ofori and Stern (1987) and
Danso et al. (1993) reported that there is little or no current N transfer in cereal-legume
intercropping system. In addition, Fujita et al. (1992) reported that benefits to associated non-
leguminous crop in intercropping systems is influenced by component crop densities, which
determine the closeness of legume and non-legume crops, and legume growth stages.
Despite claims for substantial N-transfer from grain legumes to the associated cereal crops,
the evidence indicate that benefits are limited (Giller et al., 1991). Benefits are more likely to
occur to subsequent crops as the main transfer path-way is due to root and nodule senescence
and fallen leaves (Ledgard and Giller, 1995).
2.8. Residual effects of cereal-legume cropping system
The intercrop legume may accrue N to the soil and this may not become available until after
the growing season, improving soil fertility to benefit a subsequent crop (Ofori and Stern
1987; Ledgard and Giller, 1995). For instance, Yusuf et al. (2009) found that maize grain
yield was 46 percent significantly higher when grown after soybean than after maize and

20
natural fallow. Kumwenda et al. (1998) reported that sunnhemp (Crotalaria juncea),
Tephrosia (Tephrosia vogelii) and velvet bean (Mucuna pruriens) green manure often
resulted in maize yields of 3-6 t ha-1 even with no addition of mineral N fertilizer. Moreover,
Chibudu (1998) found that maize yields were increased about 25 percent and 88 percent after
maize-mucuna and maize-cowpea intercropping systems, respectively. Phiri et al., (1999)
found that maize yields were increased about 244 percent after maize-Sesbania sesban
intercropping system. Kureh and Kamara (2005) found that maize grain yield was 28 percent
higher after one year of soybean and 21 percent higher after one year of cowpea than in the
continuously cropped maize. Maize grain yield was 85 percent higher after two years of
soybean, and 66 percent higher after two years of cowpea than in the continuously cropped
maize.
Furthermore, Akinnifesi et al. (2007) found that over 4 consecutive cropping seasons, grain
yields of maize increased by 340 percent in gliricidia-maize intercropping, when compared to
unfertilized sole maize. Bationo et al. (1995) reported that intercropping of cowpea with
millet may enhance millet grain yields by 30 percent above the control. According to Peoples
and Herridge (1990) to maximize the contribution of legume N to a following crop, it is
necessary to maximize total amount of N in legume crop, the proportion of N derived from
N2 fixation, the proportion legume N mineralized and the efficiency of utilization of this
mineral N. Unfortunately, it is not always possible to optimize these factors.
2.9. Effects of shading on soybean yield
Intensity and quality of solar radiation intercepted by a soybean canopy during the
reproductive period is an important environmental factor determining soybean yield and yield

21
components (Liu et al., 2010; Mathew et al., 2000). Hardman and Brun (1971) stated that the
yield of soybean is controlled by the availability of photosynthates during post-flowering
stage of development. Schou et al. (1978) reported that light levels during late flowering to
mid pod formation stages of growth are more critical than during vegetative and late
reproductive periods in determining the yield of soybean. Taylor et al. (1982) concluded that
pod abortion caused by lack of photosynthate supply late in the growing period is a major
factor limiting yield of soybean. Duncan (1986) suggested that light intercepted during and
after seed initiation is a major determinant of yield. In an experiment by Jiang and Egli
(1993), shade imposed from first flower to early pod-fill reduced flower production and
increased flower and pod abscission, resulting in reduced pod number and yield. They also
found canopy photosynthesis during flowering and pod set to be an important determinant of
seeds m-2, and that the impact of shading on seeds m-2 depends on duration of shading.
Furthermore, Herbert and Litchfield (1982) observed that pod number per plant was the most
important component responsible for differences in soybean yield between different row
widths and densities within a particular year, while a change in seed size resulted in the yield
difference between 2 consecutive years. Thus, there is a differential response of yield
components to changes in environmental conditions. Shading (49-20 per cent of ambient
light) resulted in lengthening of internodes and increased lodging in soybean plants (Ephrath
et al., 1993). Light enrichment initiated at late vegetative or early flowering stages increased
seed yield 144 to 252 percent, mainly by increasing pod number. While light enrichment
beginning at early pod formation increased seed size 8 to 23 percent, resulting in a 32 to 115
percent increase in seed yield (Mathew et al., 2000).

22
2.10. Intercropping productivity
One of the most important reasons for intercropping is to ensure that an increased and diverse
productivity per unit area is obtained compared to sole cropping (Sullivan, 2003). For
instance, using LER in a maize-soybean intercropping system, Kipkemoi et al. (2002)
reported that it was greater than one under intercrop. Muoneke et al. (2007) found that the
productivity of the intercropping system indicated yield advantage of 2-63 percent as
depicted by the LER of 1.02-1.63 showing efficient utilization of land resource by growing
the crops together. Raji (2007) had also reported higher production efficiency in
maize/soybean intercropping systems. Addo-Quaye et al. (2011) found that LER was greater
than unity, implying that it will be more productive to intercrop maize and soybean than grow
them in monoculture. Allen and Obura (1983) observed LER of 1.22 and 1.10 for maize-
soybean intercrop in two consecutive years. Prasad and Brook (2005) reported that Land
equivalent ratios of all maize-soybean intercrops were greater than unity (1.30 to 1.45),
indicating higher efficiency of intercropping compared to sole crops.

23
2.11. Constraints of cereal-legume intercropping system contribution to soil
fertility management in smallholder farms
Despite the benefits of cereal-legumes intercropping systems in ISFM, there are some
constraints that need to be curbed so as to attain progress (Mugendi et al., 2011; Odendo et
al., 2011). For instance, in some of countries within the region the soils are acidic with
limited phosphorus availability (Sanchez et al., 1997), which is harmful for BNF process and
therefore lessen the N contribution of the legume component to system (Giller, 2001; Fujita
and Ofosu-Budu, 1996). This is worsened by the current use of mineral fertilizers that is still
low among smallholder farmers (Palm et al., 1997), which is associated to accessibility and
affordability of appropriate fertilizer due to financial and infrastructure problems (Jama et al.,
2000). Lack of access to improved seed on time to these farmers, which is associated to poor
market and policy are also contributing negatively to the successful contribution of these
systems (Mugendi et al., 2011).
Moreover, legume trees and legume cover crops have been repeatedly demonstrated to
improve and maintain soil fertility under different environmental conditions, compared to
grain legumes intercropping systems (Mugendi, 1997; Mugendi et al., 1999; Kumwenda et
al., 1998; Mugwe et al., 2011; Bationo et al., 2011). However, they have increasingly
emerged as the least prioritized by smallholder farmers under their prevailing circumstances,
which can be largely attributed to their lack of short-term benefits of both food and income
(Mugendi et al., 2011; Bationo et al., 2011).
Furthermore, there is lack of information and knowledge about fertility management
technologies because most of the research that has been done related to cereal-legumes

24
intercropping system in the past decades had less involvement of farmers, particularly the
resource-constrained farmers (Mugendi et al., 2011; Maphumo, 2011), which is worsened by
low know how of extension services on legume-based ISFM technologies (Maphumo, 2011).
Consequently, there are misconceptions among smallholder farmers about the role of
legumes in the soil fertility management (Mtambanegwe and Maphumo, 2009). As
consequence of these, the optimum productivity of cereal-legume systems is still a big
challenge to the stakeholders involved in this sector. This study will therefore contribute to
useful information to smallholder farmers, extension services and other stakeholders on the
optimum intercropping patterns, contribution of the system to the soil and the economic
aspect of the maize-soybean cropping system.

25
CHAPTER THREE: MATERIALS AND METHODS
3.1. Description of the study area
The experiment was carried out in two counties of central highlands of Kenya, namely Embu
West and Tigania East sub counties. Figure 3.1 shows the map of the study area.
Figure 3.1: Map of Kenya (a) and the study area (b)
3.1.1. Embu West Sub County
Embu West District is located in Embu County, in the central highlands of Kenya, and
occupies an area of 708 Km2 and is bordered by Mbeere district to the East and South East,
Kirinyaga to the West and Meru South to the North. The experimental site lies within N 0°
31´ 4.2´´ E 370 27´ 20´´ and at 1468 m above the sea level (ASL), at Embu Agricultural Staff
Training College (Jaetzold et al., 2006).
(a) (b)

26
Diagnosis study carried out in the central highlands of Kenya have reported soil fertility
constraints, particularly N and P deficiencies, low carbon content and low soil pH (Gachimbi
et al., 2002). The major agro-ecological zone (AEZ) is Upper Midland 2 (UM 2). The soils
are mainly humic Nitisols and the total arable land area is 478 Km2 with total available
agricultural land area covering 371 Km2. The major enterprises include maize/sorghum –
bean, potatoes, sweet potatoes, cabbages, kales, tomatoes, onions, Arabica coffee, bananas,
citrus, avocadoes and passion fruit (Jaetzold et al., 2006). The average annual rainfall varies
from 909 to 1230 mm with long rainy season between March and June and short rainy season
between October and December, respectively. Rainfall for the two seasons in which the
experiment was conducted is presented in Figure 3.2.
Figure 3.2: Rainfall amount in 2012 at Embu-ATC and Kamujine sites, Kenya

27
Table 3.1: The soil characteristics at Embu site and Kamujine Sites, Kenya
Soil parameter Embu – ATC Site Kamujine Site
pH in water (1:2.5) 5.30 5.50
Total N (%) 0.03 0.01
Total organic carbon (%) 2.64 1.88
Extractable P (ppm) 13.40 9.54
Exchangeable Ca (C mol kg-1) 0.22 0.21
Exchangeable Mg (C mol kg-1) 0.53 0.53
Exchangeable K (C mol kg-1) 0.12 0.08
Clay (%) 65 45
Sand (%) 17 20
Silt (%) 18 35
Embu Sub County is one of the thirteen sub counties, which make up Eastern Province. The
population densities in Embu Sub County are relatively high, with Central Division having
743 persons km-2 in 1999 and expected to grow to 869 by the year 2008. The district inter-
censal growth rate dropped sharply from a high rate of 3.08 percent per annum between
1979-1989 to moderate 1.7 percent per annum between 1989 and 1999. This sharp drop may
be explained by various reasons, among them being a general decline in fertility rate due to
the increasing awareness of the importance of family planning. The available agricultural
land per household was 0.82 ha per household of 4.44 persons in 1979 compared to the 1999
figure of 0.6 ha for an equivalent number of persons per household, i.e. 4.40 persons
(Jaetzold et al., 2006). In other words the available agricultural land per person is
continuously decreasing, from 0.18 ha in 1979 to 0.14 ha per person in 1999 (Jaetzold et al.,
2006). This decreasing trend has serious implications on per capita land productivity,
particularly under the soil fertility depleted soils as found in Embu District. According to the
Report on Poverty in Kenya (2000), 56 percent of the population in Embu District is
absolutely poor while 43.5 percent of this was categorized as chronically poor. The

28
HIV/AIDS pandemic has played a major role in raising the mortality rates among the
population, with the prevalence rate of 30 percent (Jaetzold et al., 2006).
3.1.2. Tigania East Sub County
Tigania East Sub County is located in Meru County, in the central highlands of Kenya and it
occupies 108.6 km2. The experimental site lies within N 0° 6´ 19.5´´ E 037° 64´ 39.6´´ and at
935 m above the sea level (ASL), at Kamujine Dispensary in Mikinduri Division. The major
agro-ecological zones are Lower Midlands 3 and Upper Midland 3 (LM 3 and UM 3), the
soils are mainly eutric Nitisols and humic Cambisols. The annual average temperature varies
from 19.2 °C to 22.9 °C (Jaetzold et al., 2006). Table 3.1 shows the soil characteristics of the
soils in Kamujine.
The district has relatively high population density of 285 persons per km2 due to its suitability
for farming activities. The spatial distribution of the available land per household and per
person ranges from 0.05 to 0.55 ha. There are cases of high absolute levels of poverty in the
district. The major enterprises include crop systems, namely horticultural crops, maize,
banana and Irish potato, and livestock system namely goat and cattle. The average annual
rainfall varies from 1000 to 2200 mm with long rainy season between March and June and
short rainy season between October and December, respectively (Jaetzold et al., 2006).
Rainfall for the two seasons in which the experiment was conducted is presented in Figure
3.2.
In general (Table 3.1), the soils in the two contrasting sites were different. For instance, at
Embu site they were relatively acidic compared to Kamujine site. The total N (%) was

29
slightly higher at Embu site compared to Kamujine. The soil organic carbon was 40 percent
higher at Embu site than at Kamujine, and at this site the soil texture was relatively lighter
(45 percent clay) than at Embu site (65 percent clay).
3.2. Experimental design
The experiment in this study was established in Embu-ATC (Embu West district) and in
Kamujine (Tigania East district) in March 2012 and it was laid out as a randomized complete
block design (RCBD). There were four replicate blocks and plot sizes measuring 7 m x 4.5 m
The cropping system was of sole maize (Zea mays L.), sole soybean (Glycine max (L.)
Merrill) and maize (M) – soybean (S) intercropping with cropping patterns (Table 3.2 and
Figure 3.3, 3.4, 3.5 and 3.6).
Table 3.2: Treatments in the two sites (ATC-Embu and Kamujine)
Cropping system Cropping system
Sole maize Maize-Soybean (2:2)
Sole soybean Maize-Soybean (2:4)
Maize-Soybean (1:1) Maize-Soybean (2:6)
The maize – soybean was intercropped in four types of intercrops will be done as shown
below.

30
Figure 3.3: Schematic representation of maize – soybean intercrop planted in alternate rows
at an inter-row spacing of 37.5 cm in the conventional system, 1M:1S. Key:
…........ Maize row; --------- Soybean row
Figure 3.4: Schematic representation of MBILI intercrop showing intercrop with two rows of
soybean in between two rows of maize spaced at 1.0m. Soybean-soybean spaced
at 33.3 cm and maize-maize spaced at 50 cm. Key: …........ Maize row; ---------
Soybean row
Figure 3.5: Schematic representation of 2M:4S showing intercrop with four rows of soybean
in between two rows of maize spaced at 166.5 cm. Soybean-soybean spaced at 33.3
cm and maize-maize spaced at 50 cm.
37.5 cm
4.5m
12.5 cm
12.5 cm
75 cm 37.5 cm
7.0
m
25.0 cm
33.3 cm
25.0 cm
50 cm
33.3 cm
1.0 m 7.0
m
50 cm
33.3 cm
4.5 m
50 cm
33.3 cm
33.3 cm
4.5 m
7.0
m 33.3 cm
33.3 cm
33.3 cm
50 cm

31
Figure 3.6: Schematic representation of 2M:6S showing intercrop with four rows of soybean
in between two rows of maize. Soybean-soybean spaced at 33.3 cm and maize-
maize spaced at 50 cm.
3.3. Management of the experiment
The fields were ploughed using hand hoe and left as such for two weeks. Plots measuring 7.0
x 4.5 m were marked just before planting. Pathways measuring 3.0 m and 2.0 m were left
between the blocks and plots, respectively. At Embu-ATC, planting was done on the 23rd of
March and 12th of October 2012 for the 1st and 2nd seasons, respectively. At Kamujine,
planting was done on the 26th of March and 15th of October 2012 for the 1st and 2nd seasons,
respectively. The sole maize (Zea mays L.) var. DK 8031 was planted at a spacing of 0.75 m
0.50 m inter and intra-row, respectively. The number of hills per row was 10 with three seeds
50 cm
33.3 cm
33.3 cm
33.3 cm
7.0
m
33.3 cm
33.3 cm
50 cm
33.3 cm
33.3 cm
42 cm
4.5 m
42 cm

32
per hill in order to ensure maximum plant population and to account for germination failure;
and two weeks after germination the excess plants were thinned out to remain with two plants
per hill. The sole soybean (Glycine max (L.) Merrill) var. Gazelle was hand drilled at a
spacing of 0.45 m × 0.10 m in inter and intra – row spacing resulting to 62 plants per row to
ensure maximum germination/population and the excess plants were thinned out to remain
with the recommended population of 31 plants per row after 2 weeks of emergence. The
following external nutrient replenishment inputs were applied per plot: 6 kg of manure
equivalent to 30 kg N ha-1, applied two weeks before planting; 94.5 grams of CAN as source
of N, equivalent to 30 kg N ha-1, for soybean the Nitrogen (starter N) was applied at sowing
while for maize it was applied when the crop had six leaves, as top dressing; 189 grams of
TSP as source of P, equivalent to 60 kg P ha-1, which was applied at sowing. The fertilizers
were applied accordingly to the recommendation from FURP (1987). Management practices
were the same for both the monocrop and the maize – soybean intercrop.
3.2.1. Maize and soybean harvest and yields
Maize and soybean grain and stover was harvested at maturity from a net area of each
treatment demarcated after leaving out two rows on each side of the plot and the first two and
the last two maize/soybean plants on each row to minimize the edge effect (Table 3.3). The
entire plants on the plots was harvested by cutting at the ground level and weighted to
represent the total fresh weight. Maize/Soybean cobs/pods were manually separated from the
stover, sun-dried, and packed in sacks before threshing. After threshing, moisture content of
the grains was determined using a moisture meter and grain yield adjusted to 12 percent

33
moisture content using the following formula. Similarly, the yields and harvest index were
calculated using the following formulas.
)tan100(
)100(*
contentmoisturedards
contentmoisturesampleyieldmeasuredyieldAdjusted
(1)
)(
)/(*10)/(
2
2
mareaNet
mkgweightDryhatYield (2)
100*)/(
)/((%))(
hatyieldbiomassTotal
hatyieldGrainHIIndexHarvest (3)
Table 3.3: Net plot area per treatment at Embu and Kamujine sites
3.2.2. Soil sampling and determination of soil mineral nitrogen
Soil samples for determination of mineral N were taken from 0-15 cm depth at 0, 2, 4, 6, 8,
12, 16 and 20 weeks after planting (WAP) , in all plots, during the LR season (March-
August/2012). The soil samples was taken at 10 different spots per plot then bulked to give
one composite sample, this aimed to eliminate the variability of inorganic N. After sampling
the soil samples were packed in cooler boxes and delivered to the laboratory within 24 hours.
Intercropping pattern Total plot size (m2) Net plot
(m2)
Sole maize 7.0m×4.5m=31.5 6.0m×3.5m=21.0
Sole soybean 7.0m×4.5m=31.5 4.95m×3.9m=19.3
Maize-Soybean (1M:1S) 7.0m×4.5m=31.5 5.25m×3.5m=18.4
Maize-Soybean (2M:2S) 7.0m×4.5m=31.5 4.8m×3.5m=16.9
Maize-Soybean (2M:4S) 7.0m×4.5m=31.5 5.3m×3.5m=18.7
Maize-Soybean (2M:6S) 7.0m×4.5m=31.5 4.5m×3.5m=15.8

34
To avoid any further mineralization before extraction, the samples were stored in the fridge at
5 °C. The soil extraction was done using 2M KCl, then the analysis of extractable nitrate
(NO3-) through a flow injection system, using cadmium reduction column method, followed
by determination of extractable ammonium using colorimetric method through a flow
injection system (Okalebo et al., 2002).
3.2.3. Determination of maize and soybean N uptake and plant height
Destructive random sampling of maize and soybean plants was carried out at 4, 6, 8, 12, 16
and 20 WAP (harvest) for determination of N concentration in the plant tissue. The plants
were taken from an area outside the net plot. The samples were taken to the laboratory and
oven-dried at 60 °C for 48 hours, milled and sieved through a 1.0 mm sieve and then
analyzed separately for nitrogen concentration using Kjeldahl acid digestion method,
followed by colorimetry method (Okalebo et al., 2002). Nitrogen uptake by maize and
soybean crops was determined by multiplying the dry matter yields (kg ha-1) with nitrogen
concentration (%). Also, height of maize and soybean plants was taken at the time of plant
sampling for N determination (i.e., at 4, 6, 8, 12, 16 and 20 WAP).
3.2.4. Determination of changes in soil chemical properties
First, soil samples from the experimental sites were collected at 0 – 15 cm depth of analysis
for organic carbon, total nitrogen using standard methods (Okalebo et al., 2002), extractable
P, Ca, Mg, K, Na using Mehlich-1 (M1) extraction method. The P and Mg2+ were determined
colourimetrically in a spectrophotometer while Ca2+, and K+ were determined using flame
photometer.

35
To determine changes in soil chemical properties, soil sampling was done at the beginning of
the experiment in March long rain (LR) and at the end in October short rain (SR) of 2012.
Soil samples were taken at 0 – 15 cm depth during the two sampling periods. The samples
were analyzed for Extractable phosphorous (P) and the exchangeable cations (Na+, K +, Ca2+
and Mg2+) were determined through Mehlich-1 (M1) extraction method, where P and Mg2+
were determined colourimetrically in a spectrophotometer while Ca2+, K + and Na+ were
determined using a flame photometer. Total N was determined using Kjeldahl acid digestion
method, using an automatic CN elemental analyzer 2000 (Okalebo et al., 2002), while
organic carbon was determined by combustion using an elemental analyzer CNS-2000
analyzer using an automatic CN 2000.
3.3. Determination of light interception and leaf area index
Radiation interception of photosynthetically active radiation was measured in both the sole
crop and the different intercropping patterns using a Sunfleck Ceptometer. The measurements
were taken between 11.30 am and 01:30 pm (local time) at an interval of fourteen days. The
PAR intercepted was then calculated according to Goudriaan (1988) as follows;
(4)
Where, PARa = PAR above the canopy and PARb = PAR below the canopy.
The determination of LAI was done using the inversion of transmitted PAR, as indicated in
the equation according to Goudriaan (1988)
(5)

36
Where, L is leaf area index; K is the extinction coefficient for the canopy, given as
with Ɵ the zenith angle of the sun; fb is the fraction of incident PAR; τ is the ration of PAR
measured below the canopy to PAR above the canopy; A is given as
, with a the leaf absorptivity in the PAR band (typically
around 0.9).
3.4. Performance of the intercropping Maize – Soybean systems
To evaluate the intercrop’s performance, land equivalent ratio was calculated using formula
provided by Willey (1980) thus;
(6)
Where, Xy and Yy refer to X (maize) and Y (soybean) yields, respectively. The subscript “i”,
refers to the intercrop and the subscript “s” the sole crop.
3.5. Data analysis
Data of maize and soybean yields, soil mineral N and N uptake by maize and other growth
parameters were subjected to analysis of variance using SAS version 8. To test for significant
differences between different cropping pattern and conventional intercropping systems, the
yields were subjected to t-student test at 95 per cent of significance level (p < 0.05).

37
CHAPTER FOUR: RESULTS AND DISCUSSION
4.1. Effects of different maize–soybean intercropping patterns on yields and N uptake,
and soil properties
4.1.1. Effect of intercropping pattern on maize yields
4.1.1.1. Plant height
The intercropping of maize and soybean did not affect maize plant height in both sites (Embu
and Kamujine), during all the sampling periods. However, at Embu the conventional (1M:1S)
had the tallest maize height during the early stage of the crop growth (4, 6 and 8 WAP, with
47.45 cm, 76.08 cm and 147.85 cm, respectively) than all the other intercropping patterns,
including the sole crop, but at the end of the season (12 and 16 WAP) the sole crop had the
tallest plants with 266.00 cm and 266.08 cm, respectively. Whereas in Kamujine, the MBILI
(2M:2S) had the tallest plants during the early stages (4, 6 and 8 WAP, with 69.70 cm,
134.20 cm and 214.30, respectively) compared to the other intercropping patterns, at the end
of the season, the conventional treatment recorded the tallest plants.

38
Table 4.1: Mean maize plant height (cm) during 2012 LR at Embu and Kamujine sites
Location Treatment 4 WAP 6 WAP 8 WAP 12 WAP 16 WAP
Embu
Sole maize 46.58 71.88 144.98 266.00 266.08
Maize-Soybean (1M:1S) 47.45 76.08 147.85 260.88 260.88
Maize-Soybean (2M:2S) 45.23 73.43 140.13 260.13 260.13
Maize-Soybean (2M:4S) 41.70 69.15 131.45 247.38 247.38
Maize-Soybean (2M:6S) 45.03 70.13 139.48 254.95 255.15
p-value 0.5082 0.6313 0.3599 0.6619 0.6603
LSD(0.05) 10.58 15.24 25.74 40.63 40.55
Kamujine
Sole maize 66.20 119.83 212.73 219.18 219.20
Maize-Soybean (1M:1S) 69.50 118.23 210.18 230.55 230.55
Maize-Soybean (2M:2S) 69.70 134.20 214.30 226.45 226.53
Maize-Soybean (2M:4S) 68.75 127.45 212.78 217.18 217.18
Maize-Soybean (2M:6S) 58.63 125.18 207.00 223.60 223.68
p-value 0.0805 0.1672 0.7916 0.5112 0.5085
LSD(0.05) 12.71 20.65 19.97 26.16 26.14
ns – not significant;
The findings on this study are similar to those of Undie et al. (2012), Muoneke et al. (2007),
Alvarenga et al. (1998) and Yunusa (1989) who did not find significant differences in terms
of plant height, between sole maize and intercropping with soybean. Similarly, Thobatsi
(2009) and Watiki et al. (1993) found that maize intercropped with cowpea did not have any
effect on maize plant height.
4.1.1.2. Maize yield component
At Embu during both seasons, maize stover and grain yields were significantly affected by
the intercropping pattern (Table 4.2). For instance, during 2012 LR the MBILI treatment
recorded significantly higher stover and grain yields (13.12 t ha-1, p=0.0001 and 6.11 t ha-1, p
≤ 0.0001, respectively) than all the other treatments, excluding the conventional (for the grain
yield and stover yield) and also sole maize treatment (for the stover yield). During the 2012
SR, similar trend emerged with the MBILI treatment recording significantly the highest

39
stover and grain yield 7.62 t ha-1, p ≤ 0.0001 and 5.62 t ha-1 p=0.0467, respectively. It is only
during 2012 LR when the harvest index (HI) was significantly affected by the intercropping
patterns, where the 2M:6S treatment observed the highest HI of 37.30 percent than all the
other treatments. Slightly different situation was observed during 2012 SR, where although
not significantly different (p=0.5398) from other treatments, the MBILI treatment recorded
numerically the highest HI of 42.22% (Table 4.2). These differences between the two seasons
in terms of HI may be related to variations in rainfall and/or differences in weed pressure.
During both seasons at Kamujine site, maize stover yield was significantly (p ≤ 0.05) affected
by the intercropping pattern (Table 4.2). For instance, during 2012 LR the conventional
treatment produced significantly the highest stover yield (3.87 t ha-1, p=0.0461). During this
season, the grain yield was not significantly affected by the intercropping patterns
(p=0.0704); however, the sole maize treatment recorded numerically the highest value of 3.36
t ha-1 while and 2M:6S treatment recorded the lowest yield. The lower maize yields under
2M:6S treatment could be related to the lower plant density compared to other treatments.
During the 2012 LR, the maize stover yield was strongly significantly (p ≤ 0.05) positively
correlated with the N uptake at all the sampling periods, excluding 16 WAP and 20WAP.
During the 2012 SR, the MBILI treatment recorded significantly the highest stover and grain
yield (6.55 t ha-1, p=0.0005 and 3.55 t ha-1 p=0.0006, respectively) than all the other
treatments, except sole maize and conventional treatments. At Embu site, the harvest index
was not significantly affected by the intercropping patterns during both seasons (p=0.4243
and p=0.4908, respectively). However, the MBILI (during the 2012 LR) and 2M:4S (during
the 2012 SR) treatments observed numerically the highest HI of 51.40 and 37.29 percent,
respectively (Table 4.2).

40
Table 4.2: Mean maize yields and harvest index at Embu and Kamujine
Location Treatment Stover yield (t/ha) Grain yield (t/ha) Harvest Index (%)
2012 LR 2012 SR 2012 LR 2012 SR 2012 LR 2012 SR
Embu
Sole maize 11.73 8.14 4.95 4.58 29.95 36.02
Maize-Soybean (1M:1S) 12.64 7.74 5.49 5.16 30.45 39.27
Maize-Soybean (2M:2S) 13.12 7.62 6.11 5.62 31.80 42.22
Maize-Soybean (2M:4S) 8.89 4.91 4.05 3.48 31.30 41.43
Maize-Soybean (2M:6S) 5.26 4.45 2.74 3.16 37.30 41.52
p-value 0.0001*** <0.0001*** <0.0001*** 0.0467* 0.0168* 0.5398
LSD(0.05) 2.59 1.31 0.87 1.79 4.23 8.63
Kamujine
Sole maize 3.81 6.00 3.36 2.98 47.05 32.90
Maize-Soybean (1M:1S) 3.87 6.34 3.09 3.44 44.59 35.03
Maize-Soybean (2M:2S) 2.95 6.55 3.07 3.55 51.40 35.14
Maize-Soybean (2M:4S) 2.59 4.83 2.47 2.86 49.23 37.29
Maize-Soybean (2M:6S) 1.90 3.97 1.9 1.82 50.39 32.19
p-value 0.0461* 0.0005*** 0.0704ns 0.0006*** 0.4243 0.4908
LSD(0.05) 1.43 1.00 1.07 0.64 8.24 6.55
ns – not significant; *significant at p≤0.05; **significant at p≤0.01; ***significant at p≤0.001.
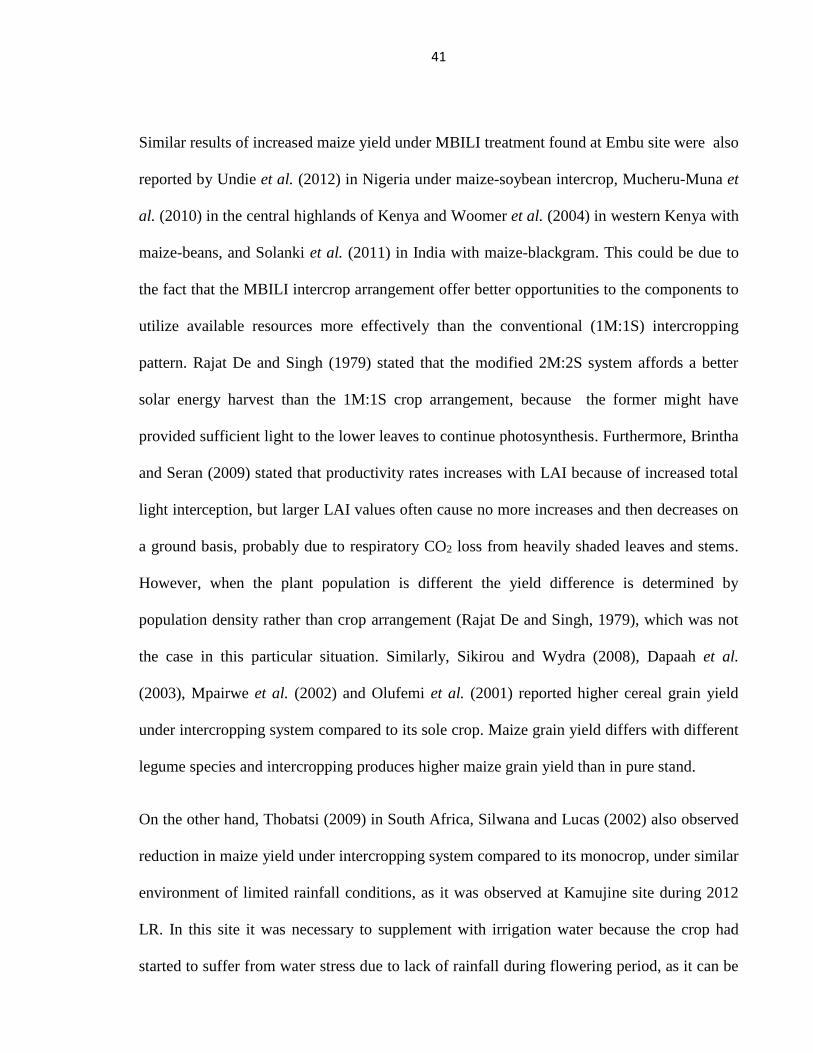
41
Similar results of increased maize yield under MBILI treatment found at Embu site were also
reported by Undie et al. (2012) in Nigeria under maize-soybean intercrop, Mucheru-Muna et
al. (2010) in the central highlands of Kenya and Woomer et al. (2004) in western Kenya with
maize-beans, and Solanki et al. (2011) in India with maize-blackgram. This could be due to
the fact that the MBILI intercrop arrangement offer better opportunities to the components to
utilize available resources more effectively than the conventional (1M:1S) intercropping
pattern. Rajat De and Singh (1979) stated that the modified 2M:2S system affords a better
solar energy harvest than the 1M:1S crop arrangement, because the former might have
provided sufficient light to the lower leaves to continue photosynthesis. Furthermore, Brintha
and Seran (2009) stated that productivity rates increases with LAI because of increased total
light interception, but larger LAI values often cause no more increases and then decreases on
a ground basis, probably due to respiratory CO2 loss from heavily shaded leaves and stems.
However, when the plant population is different the yield difference is determined by
population density rather than crop arrangement (Rajat De and Singh, 1979), which was not
the case in this particular situation. Similarly, Sikirou and Wydra (2008), Dapaah et al.
(2003), Mpairwe et al. (2002) and Olufemi et al. (2001) reported higher cereal grain yield
under intercropping system compared to its sole crop. Maize grain yield differs with different
legume species and intercropping produces higher maize grain yield than in pure stand.
On the other hand, Thobatsi (2009) in South Africa, Silwana and Lucas (2002) also observed
reduction in maize yield under intercropping system compared to its monocrop, under similar
environment of limited rainfall conditions, as it was observed at Kamujine site during 2012
LR. In this site it was necessary to supplement with irrigation water because the crop had
started to suffer from water stress due to lack of rainfall during flowering period, as it can be

42
seen in the Figure 3.3. Amede (1995) stated that one of the factors that reduces maize grain
yield is dry conditions that occur specially during the flowering period. Higher populations
under intercrops compared to monocrop under stress conditions might result in intercrop
yields being lower than sole crop yields due to increased competition for moisture (Natarajan
and Willey, 1986). Yield reductions involving one or all intercropping components in
intercropping could be associated to inter-specific competition for nutrients, moisture and/or
space (Adaniyan et al., 2007). Moreover, Kamujine has a light texture soil, which has low
moisture holding capacity (Jaetzold et al., 2006), resulting therefore in reduced yields under
intercropping (Natarajan and Willey, 1986).
The efficiency of a crop variety to convert the dry matter into economic yield is determined
by its harvest index. The higher the value, the higher will be dry matter conversion
efficiency. The absence of significant differences in HI of maize observed during 2012 SR at
Embu and Kamujine sites agrees with results by Haseeb-ur-Rehman et al. (2010) and Egbe et
al. (2010) in maize-cowpea intercropping; Saleem et al. (2011) in maize-legume
intercropping systems; and, Carruthers et al. (2000) in maize-soybean intercropping who
reported that the intercropping systems did not affect the harvest index of maize component.
4.1.2. Effect of intercropping pattern on soybean yields and growth parameters
4.1.2.1. Plant height
The intercropping of soybean with maize did not affect soybean plant height either at Embu
or Kamujine. However, at Embu the intercrop of soybean with maize resulted in an increase
of soybean plant height of about 9.34, 7.36, 10.91, and 7.19 percent in 4, 6, 8 and 12 WAP,
respectively compared to its pure stand. Similar scenario was observed at Kamujine, where

43
the intercrop resulted in an increase of soybean plant height of about 16.24, 12.64, and 3.84
percent in 4, 6 and 8 WAP, respectively compared to the sole soybean; while during the late
sampling periods (12 and 16 WAP) the intercrop of soybean with maize resulted in reduction
of soybean plant height of about 15 percent compared to its monocrop (Table 4.3).
Table 4.3: Mean soybean plant height (cm) during 2012 LR at Embu and Kamujine sites
Location Treatment 4 WAP 6 WAP 8 WAP 12 WAP 16 WAP
Embu
Sole soybean 13.10 15.73 28.33 44.50 44.50
Maize-Soybean (1M:1S) 13.88 16.98 30.88 42.38 42.38
Maize-Soybean (2M:2S) 13.63 15.70 31.80 47.95 47.95
Maize-Soybean (2M:4S) 13.70 14.98 28.73 47.18 47.35
Maize-Soybean (2M:6S) 14.45 16.63 30.70 46.20 46.08
p-value 0.6984ns 0.4751ns 0.7654ns 0.9129ns 0.9049ns
LSD(0.05) 1.97 2.51 6.64 13.83 13.61
Kamujine
Sole soybean 10.83 17.63 31.83 28.83 29.18
Maize-Soybean (1M:1S) 12.63 18.48 30.48 25.13 25.25
Maize-Soybean (2M:2S) 11.53 18.63 27.78 24.55 24.65
Maize-Soybean (2M:4S) 12.93 20.18 33.10 27.28 27.28
Maize-Soybean (2M:6S) 11.70 18.33 29.45 27.88 27.95
p-value 0.3239ns 0.7800ns 0.3711ns 0.4736ns 0.4448ns
LSD(0.05) 2.28 4.27 5.82 5.71 5.72
ns – not significant;
Increased soybean plant height under intercrop with maize was also been reported by
Muoneke et al. (2007), though they observed it only at 8 WAP and Ennin et al. (2002) in all
sampling periods. Competition for light under intercropping could have induced taller plants
at the different cropping pattern compared to sole cropping of soybean (Ijoyah and Fanen,
2012). According to Keating and Carberry (1993) increased plant height of the lower
component is typical responses in the intercrop due to increased far: red ratio what is this
intercepted at the lower levels of the intercrop canopy. Similar Carr et al. (1995) who found
that intercropping wheat and lentil increased lentil plant height in intercrop compared to its
monocrop. On the other hand, the observed reduction of soybean plant height under intercrop

44
with maize compared to its sole crop during the late sampling periods (12 WAP and 16
WAP) in Kamujine is similar to observations by Undie et al. (2012) only at 4 WAP.
4.1.2.2. Number of days to flowering and podding
During 2012 SR, soybean’s growth duration to 50 percent flowering was not significantly
affected by intercropping patterns in both sites (Embu and Kamujine, with p=0.8598 and
p=01937, respectively). However, there was a slight delay of 1 day in terms of days to 50
percent flowering in intercropped treatments compared to sole soybean in both sites. This
could probably be due to shading effect of maize which reduces effective heat unit
accumulation, resulting in longer required growth period. Still during 2012 SR, intercropping
patterns affected significantly (p=0.0017 and p=0.0069) the number of days to 50 percent
podding in Embu and Kamujine, respectively. For instance, in both sites podding was
delayed by to 2 days due to intercropping with maize (Table 4.4).
Table 4.4: Mean soybean days to flowering and podding (2012 SR) at Embu and Kamujine
Location Treatment Days to 50% flowering Days to 50% podding
Embu
Sole soybean 40.50 57.50
Maize-Soybean (1M:1S) 41.00 59.50
Maize-Soybean (2M:2S) 40.75 59.75
Maize-Soybean (2M:4S) 40.75 59.25
Maize-Soybean (2M:6S) 40.75 59.50
p-value 0.8598ns 0.0017**
LSD(0.05) 0.9642 0.9642
Kamujine
Sole soybean 36.75 54.75
Maize-Soybean (1M:1S) 37.50 55.75
Maize-Soybean (2M:2S) 37.50 55.75
Maize-Soybean (2M:4S) 37.50 56.75
Maize-Soybean (2M:6S) 37.50 56.75
p-value 0.1937ns 0.0069**
LSD(0.05) 0.77 1.05
ns – not significant; *significant at p≤0.05; **significant at p<0.01; ***significant at
p<0.001.

45
Similarly, Muoneke et al. (2007) did not find any significant differences in terms of days to
50 per cent flowering of soybean intercropped with maize. In maize-cowpea intercropping,
Mpangane et al. (2004) did not also find significant differences on 50 percent flowering due
to cropping system. Hardley et al. (1983) stated that flowering is dependent on both genotype
and environment.
4.1.2.3. Soybean yields and components
During both seasons in both sites, the soybean yield was significantly affected by the
intercropping pattern. During the 2012 LR, the yields were reduced by 60 and 81 percent due
to the intercropping with maize, at Embu and Kamujine, respectively; whereas, during the
2012 SR, the yields were reduced by 52 and 78 percent as a result of intercropping with
maize, at Embu and Kamujine, respectively (Table 4.5). At Embu, during 2012 LR, the sole
soybean observed significantly the highest stover yield (1.41 t ha-1, p = 0.0015), followed by
the 2M:6S intercrop pattern with 1.03 t ha-1 which was statistically different from MBILI
(0.53 t ha-1, p = 0.0015) and conventional (0.40 t ha-1, p = 0.0015) intercropping patterns, but
not significantly different from the 2M:4S intercropping pattern. Also, the sole soybean
treatment gave statistically the highest grain yield (1.44 t ha-1, p=0.0002) than all the
intercropping patterns, followed again by the 2M:6S treatment (0.88 t ha-1, p=0.0002), which
was significantly different from other intercropping patterns (conventional, MBILI and
2M:4S). Similar results were obtained during 2012 SR, where sole soybean treatment
recorded statistically the highest stover yield (1.45 t ha-1, p ≤ 0.0001), followed by the 2M:6S
treatment (1.17 t ha-1, p ≤ 0.0001), which was statistically different from the rest of the

46
intercropping patterns. Although the conventional treatment observed 28 percent higher
stover yield than the MBILI treatment, they were not statistically different among them. The
monocropped soybean observed also the highest grain yield (1.65 t ha-1, p ≤ 0.0001) than all
other treatments, followed by the 2M:6S treatment with 1.01 t ha-1 (p ≤ 0.0001), which
significantly differed from the rest of the treatments. During this season, there was positive
correlation between the soybean grain yield and soil nitrates, and soil mineral N, with r=0.56
(p=0.0109) and r=0.45 (p=0.047), respectively.
During both seasons, the harvest index of soybean was significantly (p=0.0004 and p=0.0003,
respectively) reduced by the intercropping patterns. For instance, during 2012 LR the sole
soybean treatment observed the highest HI of 50.28 percent which was significantly
(p=0.0004) different from all other treatments. Similar results were obtained during 2012 SR,
where sole soybean recorded significantly (p=0.0003) the highest HI (53.52 per cent) than all
the other treatments, excluding the 2M:4S treatment. During the 2012 LR, the soybean stover
yields was significantly (p≤0.05) positively correlated with the N uptake at all the sampling
periods, except at 16 WAP and 20WAP.
At Kamujine during 2012 LR, the sole soybean treatment gave statistically the highest stover
and grain yields (1.09 t ha-1, p ≤ 0.0001 and 0.56 t ha-1, p=0.0007, respectively) than all the
other treatments, followed by the 2M:6S treatment with 0.78 t ha-1 for the stover yield, which
was significantly different (p ≤ 0.0001) from the other intercropping patterns. However the
soybean yields from MBILI intercropping pattern was not statistically different from the
conventional intercropping pattern. During the 2012 LR season, there was significant positive
correlation between the soybean grain yield and, soil mineral N, with r=0.73 (p=0.0002) and

47
r=0.76 (p ≤ 0.0001), respectively. During 2012 SR, monocropped soybean treatment
observed also significantly the highest stover yield (1.27 t ha-1, p=0.0004) than all the other
treatments. Similarly, sole soybean treatment recorded the highest grain yield of 0.72 t ha-1 (p
≤ 0.0001) than all the other treatments. During this season, there was also positive correlation
between the soybean grain yield and, soil mineral N, with r=0.61 (p=0.0043) and r=0.60 (p ≤
0.0053), respectively. During both season, the harvest index of soybean was not significantly
(p=0.0864; p=0.0988) affected by the intercropping patterns; however, it was numerically
reduced by the intercropping patterns. In general, the yields increased with about 23 and 26
percent in the second season compared to the first season, at Embu and Kamujine,
respectively. Probably due to the cumulative effects of the goat manure that was applied in
the first and second seasons, and also due to root and nodule senescence.

48
Table 4.5: Mean soybean yields and harvest index at Embu and Kamujine
Location Treatment Stover yield (t ha-1) Grain yield (t ha-1) Harvest Index (%)
2012 LR 2012 SR 2012 LR 2012 SR 2012 LR 2012 SR
Embu
Sole soybean 1.41 1.45 1.44 1.65 50.28 53.52
Maize-Soybean (1M:1S) 0.40 0.76 0.26 0.41 39.26 35.38
Maize-Soybean (2M:2S) 0.53 0.55 0.35 0.42 39.98 43.17
Maize-Soybean (2M:4S) 0.60 0.83 0.46 0.76 42.95 47.98
Maize-Soybean (2M:6S) 1.03 1.17 0.88 1.01 45.99 46.60
p-value 0.0015** 0.0001*** 0.0002*** < 0.0001*** 0.0004*** 0.0003***
LSD(0.05) 0.43 0.28 0.39 0.18 4.02 5.73
Kamujine
Sole soybean 1.09 1.27 0.56 0.72 32.39 36.41
Maize-Soybean (1M:1S) 0.18 0.21 0.05 0.07 19.44 23.74
Maize-Soybean (2M:2S) 0.19 0.24 0.04 0.08 19.29 24.31
Maize-Soybean (2M:4S) 0.52 0.58 0.17 0.30 22.42 36.56
Maize-Soybean (2M:6S) 0.78 0.83 0.24 0.37 22.55 33.65
p-value < 0.0001*** 0.0004*** 0.0007*** <0.0001*** 0.0864 0.0988
LSD(0.05) 0.13 0.39 0.20 0.08 10.17 12.52
ns – not significant; *significant at p ≤ 0.05; **significant at p ≤ 0.01; ***significant at p ≤ 0.001.

49
At Embu during the 2012 LR, there were significant differences in soybean stover yield
(p=0.0278) among the rows in 2M:4S treatment, where the row next to the maize plant
observed 16.7 percent lower yield than the row far away from the maize plant. For the grain
yield, the row far away from the maize plant gave 20 percent significantly higher (p=0.0009)
yield than the row next to maize plant. During the 2012 SR, the soybean stover and grain
yields were 9.5 and 14.8 percent significantly (p = 0.0113 and p = 0.0108, respectively)
higher in the middle row than in the row next to the maize plant, respectively. At Kamujine
during the 2012 LR, there were no significant differences (p = 0.7292) on soybean stover
yield between the middle row and the row next to the maize plant; whereas the grain yield in
the middle row was 21 percent significantly (p=0.0251) higher than in the row next to the
maize plant. During the 2012 SR, the soybean stover and grain yields were 22.2 and 25.9
percent significantly (p=0.0088 and p=0.0085, respectively) lower in the closer row than in
the middle row, respectively (Table 4.6).
Table 4.6: Shading effect on soybean yield in the 2M:4S during 2012 LR and 2012 SR at
Embu and Kamujine sites
Location Row
position
Maize-Soybean (2M:4S)
Stover yield (t/ha) Grain yield (t/ha)
2012 LR 2012 SR 2012 LR 2012 SR
Embu Middle 0.07 0.095a 0.05 0.061a
Closer 0.06 0.086b 0.04 0.052b
p-value 0.0278* 0.0113** 0.0009*** 0.0108**
LSD(0.05) 0.01 0.007 0.01 0.007
Kamujine Middle 0.05 0.066 0.019 0.034
Closer 0.05 0.054 0.015 0.027
p-value 0.7292 0.0088** 0.0251* 0.0085**
LSD (0.05) 0.01 0.009 0.004 0.005
ns – not significant; *significant at p ≤ 0.05; **significant at p ≤ 0.01; ***significant at
p≤0.001.

50
At Embu during the 2012 LR, there were significant differences in soybean stover yield
(p=0.0179) among rows in 2M:6S intercropping pattern. The middle row recorded about 27.3
percent higher yield than the row next to the maize row. For the grain yield, the middle row
observed 30 percent significantly higher (p=0.0236) than the row closer to maize plant.
During the 2012 SR, the soybean stover yield did not show significant differences (p=0.1008)
between the row next to the maize plant and one in the middle row; however, it was
numerically 7.7 percent higher in the middle row than in the row next to the maize plant. The
grain yield was 25 percent significantly (p=0.0297) higher in middle row than in the closer
row. At Kamujine during the 2012 LR, there were no significant differences (p=0.1049) on
soybean stover yield between the row middle row and the row closer to the maize plant;
whereas the grain yield in the middle row was 33.3 percent significantly (p=0.0305) higher
than in the closer row. During the 2012 SR, the soybean stover and grain yields were 40.0
and 44.6 percent significantly (p=0.0051 and p=0.0017, respectively) higher in the middle
row than in the closer row, respectively (Table 4.7).
Table 4.7: Shading effect on soybean yield in the 2M:6S treatment during 2012 LR and 2012
SR at Embu and Kamujine sites
Location Row
position
Maize-Soybean (2M:6S)
Stover yield (t/ha) Grain yield (t/ha)
2012 LR 2012 SR 2012 LR 2012 SR
Embu Middle 0.11 0.13a 0.10 0.12a
Closer 0.08 0.12a 0.07 0.09b
p-value 0.0179* 0.1008 0.0236* 0.0297*
LSD(0.05) 0.03 0.02 0.03 0.02
Kamujine Middle 0.086 0.10a 0.024 0.065a
Closer 0.066 0.060b 0.016 0.036b
p-value 0.1049 0.0051** 0.0305* 0.0017**
LSD (0.05) 0.025 0.03 0.007 0.02
ns – not significant; *significant at p≤0.05; **significant at p≤0.01; ***significant at
p≤0.001.

51
At Embu site, during the 2012 SR there was statistically significant strong positive
correlation between soybean grain yields of the middle row and PAR intercepted (r=0.998;
p=0.0019) and LAI (r=0.992; p=0.0078), at 49 DAP (Figure 4.1).
Figure 4.1: Relationship between soybean grain yield with PAR intercepted (a) and LAI (b)
in middle rows during 2012 SR at Embu site.
At Kamujine site, during 2012 SR also middle rows showed existence of significant
correlation between soybean yields and light intercepted and leaf area index, at 63 DAP. For
instance, soybean stover yield was strongly positive correlated with the PAR intercepted
(r=0.95; p=0.0463) and LAI (r=0.99; p=0.0088), as indicated by Figure 4.2. Similarly, there
was strong positive correlation between soybean grain yield with the amount of light
intercepted (r=0.997; p=0.0027) and LAI (r=0.99; p=0.0085) (Figure 4.3)
a) b)

52
Figure 4.2: Relationship between soybean stover yield with PAR intercepted (a) and LAI (b)
in middle rows during 2012 SR at Kamujine site.
Figure 4.3: Relationship between soybean grain yield with PAR intercepted (a) and LAI (b)
in middle rows during 2012 SR at Kamujine site
The reduction of soybean yields under intercropping with maize or sorghum has also been
reported by several researchers (Ijoyah and Fanen, 2012; Egbe, 2010; Muoneke et al., 2007;
Muneer et al., 2004; Heibsch et al., 1995; Olufajo, 1992; Pal et al., 1992; Neupane, 1983).
This reduction in soybean yields under intercropping could be due to interspecific
competition between the intercrop components for water, light, air and nutrients, and also the
aggressive effects maize (C4 species) on soybean, a C3 species (Egbe, 2010; Muoneke et al.,
a) b)
a) b)

53
2007). According to Heibsch et al. (1995), crops with C4 photosynthetic pathways have been
known to be dominant when intercropped with C3 species like soybean. The shading of
soybean by the maize plants (taller) may also have contributed to the reduction of the yields
of intercropped soybean. Olufajo (1992) reported that shading by the taller plants in mixture
could reduce the photosynthetic rate of the lower growing plants and thereby reduce their
yields. This observation was confirmed in this study where lower soybean yields were
recorded in the rows next to the maize plant compared to the middle row, and the yields
positively correlated with the PAR intercepted. In addition, Lesoing and Francis (1999) stated
that water stress and shading were probably the two major factors, which contribute to
reduced legume component yield under intercropping. Moreover, Natarajan and Willey
(1980) and Sivakumar and Virmani (1980) reported that stover yield often shows a positive
correlation with the amount of radiation intercepted by crops in intercropping systems.
However in the current study there was a positive correlation between grain yield with the
amount of radiation intercepted by crops in intercropping treatments.
The reduction of harvest index of the legume component observed in this study was also
reported by other researchers (Alhassan et al., 2012; Zaefarian et al., 2007). The reduction
was mainly due to maize shading effects on soybean, which caused the legume component to
allocate its photosynthates to vegetative growth and height increasing for competing with
taller maize. On the other hand, the findings at Kamujine site are in agreement with
Carruthers et al. (2000) who reported that the HI for intercrop soybean was not significantly
different from monocrop soybean.

54
4.1.2.4. Effects of maize–soybean intercropping patterns on N uptake by maize
4.1.2.4.1. Soil mineral N
At Embu during 2012 LR, no significant differences were observed in soil nitrate – N content
(NO3- - N) among the intercropping patterns during all the sampling periods at 15 cm depth,
except at 12 WAP where the 2M:4S treatment observed significantly (p=0.0285) higher NO3-
- N content (9.01 mg kg-1) than all other treatments, excluding sole maize treatment. At
harvest (20 WAP) the MBILI and 2M:4S treatments observed significantly (p=0.0525) the
lowest NO3- - N content (8.24 mg kg-1 and 9.15 mg kg-1, respectively) than the sole soybean
and conventional treatments, with 14.95 mg kg-1 and 14.62 mg kg-1, respectively. This is an
indication that intercropping may have reduced the soil nitrate that moved to region where it
could not be easily absorbed by plant roots. Similarly, at Kamujine during the same season
(2012 LR), no significant differences were observed in soil nitrate – N content (NO3- - N)
among the intercropping patterns during all the sampling periods, except at 20 WAP where
sole soybean treatment recorded statistically (p = 0.0301) higher NO3- - N content (8.24 mg
kg-1) than all other treatments, except the 2M:4S treatment (Table 4.8).

55
Table 4.8: Mean soil nitrate-N at different periods during 2012 LR at Embu and Kamujine sites
Location
Treatment
Weeks After Planting (WAP)
0 4 6 8 12 16 20
Nitrate – N (NO3⁻ - N) mg kg-1
Embu
Sole maize 5.19 9.18 6.55 6.65 6.72 4.59 8.24
Sole soybean 7.42 9.81 8.62 7.83 5.78 5.76 14.95
Maize-Soybean (1:1) 6.95 11.36 6.06 8.17 4.71 5.01 14.62
Maize-Soybean (2:2) 10.22 6.08 7.80 8.77 5.66 5.10 12.20
Maize-Soybean (2:4) 8.77 10.07 6.50 8.07 9.01 5.56 9.15
Maize-Soybean (2:6) 8.76 8.50 7.49 5.53 4.69 7.16 10.38
p-value 0.4638 0.1780 0.9224 0.7915 0.0285* 0.7444 0.0525*
LSD(0.05) 5.36 4.04 5.52 5.23 2.62 3.69 5.01
Kamujine
Sole maize 13.31 5.75 7.38 5.47 5.12 5.17 3.73
Sole soybean 12.87 9.37 9.00 8.79 8.06 6.67 8.24
Maize-Soybean (1:1) 10.71 8.51 6.25 4.12 4.38 4.08 3.78
Maize-Soybean (2:2) 11.94 6.31 4.14 5.57 3.40 4.30 3.14
Maize-Soybean (2:4) 14.72 6.40 6.38 6.06 5.76 5.32 6.14
Maize-Soybean (2:6) 9.53 8.04 6.62 6.51 4.01 4.93 1.66
p-value 0.6283 0.7124 0.2385 0.0567 0.0728 0.4762 0.0301*
LSD(0.05) 6.70 5.71 3.86 2.80 3.13 2.84 3.90
ns – not significant; *significant at p ≤0.05; **significant at p ≤0.01; ***significant at p ≤ 0.001.

56
The low soil nitrate content observed at harvest (20 WAP) in maize – soybean intercrop
agrees with results of Ye et al. (2008) who reported that the soil nitrate N was lower under
faba bean – pea intercrop than under their monocrops. Li et al. (2005) and, Zhang and Li
(2003) also reported that intercropping maize with faba beans decreased the soil nitrate – N
content at harvest. Intercropping faba beans with wheat reduced the nitrate concentration in
soil profile (Stuelpnagel, 1993). This might be due to the complimentary root distribution of
cereal/legume intercrop or the increased time of plant uptake of N by maize in intercropping
systems (Li et al., 2005). For instance, Li et al. (2005) found that in the maize – faba beans
system, maize roots were distributed in both the profiles of maize and faba beans. Thus,
maize could utilize the nitrate in the strip of intercropping faba beans (Li, 1999).
At Embu during 2012 LR, no significant differences were observed in soil ammonium – N
content (NH4+ - N) among the intercropping patterns during all the sampling periods. Similar
results were also observed at Kamujine, where the treatments had no significant effect of soil
ammonium – N (Table 4.9). The findings indicate that intercropping patterns had little effect
on soil ammonium nitrogen. Similar results were also observed by Huang et al. (2011) on soil
ammonium N under maize-legume intercropping systems. However, there was a general
increase in general increase in ammonium – N at the end of the season. This increase could
be due to dry soil conditions that helped the microorganisms to mineralize organic – N from
residues into ammonium – N, making it available in the soil solution at that particular period.
Similar findings were also reported by Anggria at al. (2012) who found that under dry
conditions with aerobic conditions the ammonification of organic residues was faster than the
oxidation of ammonium to nitrate, and resulted in a higher ammonium accumulation.

57
Table 4.9: Mean soil ammonium-N at 0–15 cm soil depth sampled at different periods during 2012 LR at Embu and Kamujine sites
Location Treatment Weeks After Planting
0 4 6 8 12 16 20
Ammonium – N (NH4⁺ - N) mg kg-1
Embu
Sole maize 5.24 5.07 5.82 4.96 5.87 2.99 3.54
Sole soybean 7.45 5.89 4.14 2.28 3.03 3.90 2.32
Maize-Soybean (1:1) 7.64 3.86 3.96 2.99 7.63 6.06 2.52
Maize-Soybean (2:2) 7.31 4.78 4.61 3.41 3.77 4.14 3.75
Maize-Soybean (2:4) 8.67 4.69 6.26 2.56 5.64 5.16 6.32
Maize-Soybean (2:6) 9.31 5.23 8.67 6.36 4.91 3.80 2.59
p-value 0.8610 0.7855 0.2338 0.0930 0.4800 0.7602 0.4771
LSD(0.05) 6.92 2.91 4.29 3.12 5.06 4.57 4.63
Kamujine
Sole maize 6.42 5.11 4.84 3.25 3.53 1.72 3.78
Sole soybean 6.86 5.29 2.39 5.59 6.28 5.62 4.60
Maize-Soybean (1:1) 5.84 4.33 6.95 5.42 3.49 5.17 3.45
Maize-Soybean (2:2) 3.96 3.71 3.79 4.62 6.99 4.77 2.89
Maize-Soybean (2:4) 7.51 6.53 6.85 1.27 5.16 5.49 3.12
Maize-Soybean (2:6) 6.11 5.66 4.73 4.47 6.48 3.98 4.10
p-value 0.6406 0.7239 0.5532 0.1578 0.5169 0.3174 0.6718
LSD(0.05) 4.41 3.97 5.87 3.56 4.91 3.88 2.38
ns – not significant; *significant at p≤0.05; **significant at p≤0.01; ***significant at p≤0.001.

58
At Embu during 2012 LR, no significant differences were observed in soil mineral – N
content among the intercropping patterns during all the sampling periods. However, there
was general increase of soil mineral N for the MBILI, sole soybean and conventional
treatments, where the MBILI treatment observed the highest value (51.06 percent) followed
by the sole soybean with 16.21 percent (Figure 4.4). On the other hand, there was general
decrease of soil mineral N for the sole maize, 2M:4S, and 2M:6S treatments, where the sole
maize recorded the highest decrease of 31.60 percent (Figure 4.4).
Figure 4.4. Soil mineral – N trend at 0–15 cm soil depth sampled at different periods during
2012 LR at Embu.
Similarly, Hauggaard-Nielsen et al. (2001a) did not find significant differences on soil
mineral N at harvest in the 0-25 cm soil layer under pea sole crop compared to the other
treatments. The increase on soil mineral N for sole soybean and some of the intercropping
treatments was also reported by Rusinamhodzi (2006) who found that soil mineral N had
increased in sole cowpea and cowpea-cotton treatments but not sole cotton cropping system.

59
At Kamujine during 2012 LR, no significant differences were observed in soil mineral – N
content as result of the treatments during all the sampling periods. Despite that, there was
general decrease of soil mineral N in all the treatment, where the sole maize and sole soybean
treatments recorded the highest (63.76 percent) and the lowest (34.92 percent) values,
respectively (Figure 4.5).
Figure 4.5. Soil mineral – N trend at 0–15 cm soil depth sampled at different periods during
2012 LR at Kamujine
Similarly, Hauggaard-Nielsen et al. (2001b) observed higher soil mineral N at harvest in the
0-25cm soil layer under pea sole crop compared to the other treatments independent of
cropping strategy. Hauggaard-Nielsen et al. (2001c) observed that the lowest soil inorganic N
deficit was observed in pea sole crop and the greatest in barley sole crop. This suggests that
legume and non-legume intercrops are not likely to increase soil N in the long term, but
rather deplete it (Hauggaard-Nielsen et al., 2001c). Jensen (1996) equivalently concluded that
the N balance was positive for sole cropped pea, whereas it was negative for barley and pea-
barley in all years.

60
4.1.2.4.2. Nitrogen uptake by maize and soybean
At Embu during 2012 LR, the N uptake of maize and soybean was significantly affected by
the intercropping patterns (Table 4.10). For instance, at 4 WAP the sole soybean yielded
significantly the highest N amount (2.75 percent N, p=0.0026) than all the other treatments,
excluding intercropped soybean. This was strongly correlated (r=0.81; p=0.0988) with soil
mineral at the same sampling period (4 WAP); however the correlation was not significant at
p=0.05. At 16 WAP the sole soybean had significantly accumulated the lowest N (0.35
percent N, p ≤ 0.0001) than all the other treatments, except soybean under 2M:2S, 2M:4S and
2M:6S treatments. Also, the N uptake by soybean during this period was positively correlated
(r=0.48; p=0.4125) with soil mineral N at the same sampling period. The maize under MBILI
treatment observed significantly (p ≤ 0.0001) the highest N uptake of 14.88 kg ha-1 than all
other treatments, followed by maize under 2M:6S, which was not significantly different to
soybean component under all the treatments; and sole soybean observed significantly the
lowest N uptake (0.13kg ha-1), though not statistically different from other soybean
treatments. Also, maize under MBILI treatment observed significantly the highest N uptake
to the grain (9.41 kg ha-1) than sole soybean, soybean under MBILI, soybean under 2M:4S
and soybean under 2M:6S treatments. The N accumulated in maize grain was positively
correlated with soil mineral N at 4 and 16 WAP, with r=0.87 (p=0.0543) and r=0.81
(p=0.0995), respectively. In general, the N accumulation by maize under intercropping
treatments was generally lower than for sole cropping, particularly up to 12 WAP (Table
4.10).
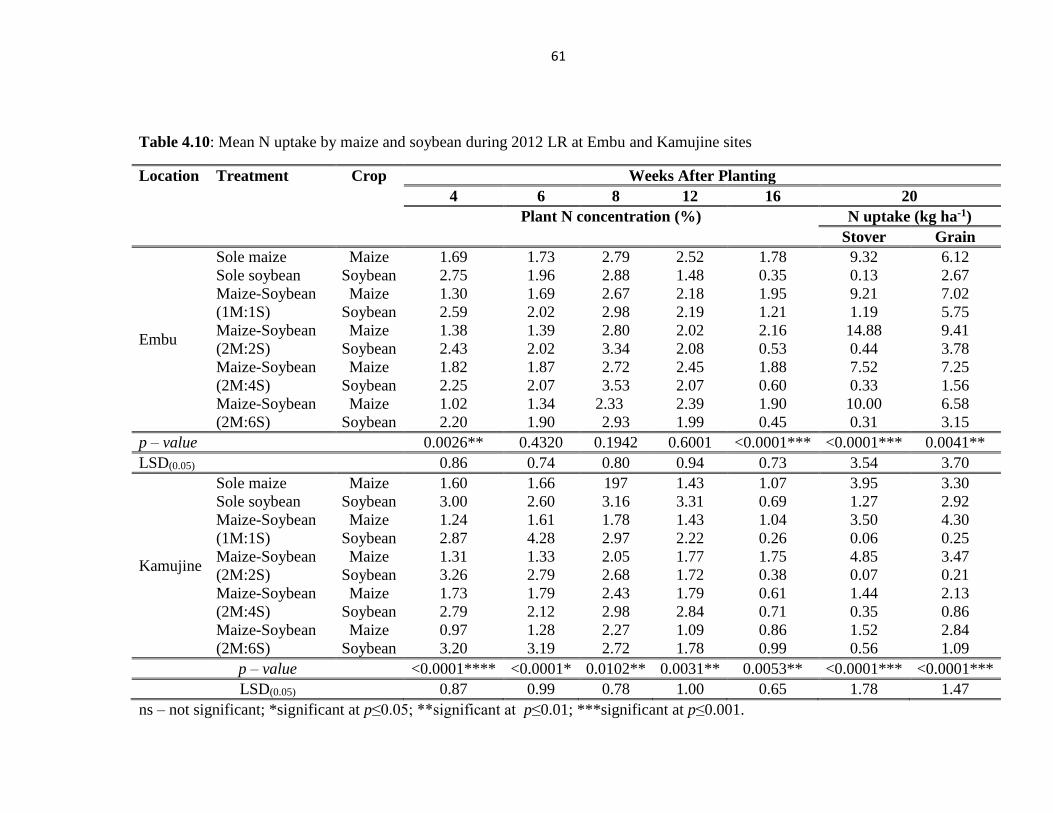
61
Table 4.10: Mean N uptake by maize and soybean during 2012 LR at Embu and Kamujine sites
Location Treatment Crop Weeks After Planting
4 6 8 12 16 20
Plant N concentration (%) N uptake (kg ha-1)
Stover Grain
Embu
Sole maize Maize 1.69 1.73 2.79 2.52 1.78 9.32 6.12
Sole soybean Soybean 2.75 1.96 2.88 1.48 0.35 0.13 2.67
Maize-Soybean
(1M:1S)
Maize 1.30 1.69 2.67 2.18 1.95 9.21 7.02
Soybean 2.59 2.02 2.98 2.19 1.21 1.19 5.75
Maize-Soybean
(2M:2S)
Maize 1.38 1.39 2.80 2.02 2.16 14.88 9.41
Soybean 2.43 2.02 3.34 2.08 0.53 0.44 3.78
Maize-Soybean
(2M:4S)
Maize 1.82 1.87 2.72 2.45 1.88 7.52 7.25
Soybean 2.25 2.07 3.53 2.07 0.60 0.33 1.56
Maize-Soybean
(2M:6S)
Maize 1.02 1.34 2.33 2.39 1.90 10.00 6.58
Soybean 2.20 1.90 2.93 1.99 0.45 0.31 3.15
p – value 0.0026** 0.4320 0.1942 0.6001 <0.0001*** <0.0001*** 0.0041**
LSD(0.05) 0.86 0.74 0.80 0.94 0.73 3.54 3.70
Kamujine
Sole maize Maize 1.60 1.66 197 1.43 1.07 3.95 3.30
Sole soybean Soybean 3.00 2.60 3.16 3.31 0.69 1.27 2.92
Maize-Soybean
(1M:1S)
Maize 1.24 1.61 1.78 1.43 1.04 3.50 4.30
Soybean 2.87 4.28 2.97 2.22 0.26 0.06 0.25
Maize-Soybean
(2M:2S)
Maize 1.31 1.33 2.05 1.77 1.75 4.85 3.47
Soybean 3.26 2.79 2.68 1.72 0.38 0.07 0.21
Maize-Soybean
(2M:4S)
Maize 1.73 1.79 2.43 1.79 0.61 1.44 2.13
Soybean 2.79 2.12 2.98 2.84 0.71 0.35 0.86
Maize-Soybean
(2M:6S)
Maize 0.97 1.28 2.27 1.09 0.86 1.52 2.84
Soybean 3.20 3.19 2.72 1.78 0.99 0.56 1.09
p – value <0.0001**** <0.0001* 0.0102** 0.0031** 0.0053** <0.0001*** <0.0001***
LSD(0.05) 0.87 0.99 0.78 1.00 0.65 1.78 1.47
ns – not significant; *significant at p≤0.05; **significant at p≤0.01; ***significant at p≤0.001.

62
During 2012 LR at Kamujine site, intercropping systems affected significantly the N uptake
by maize and soybean (Table 4.10). For instance, at 4 WAP the soybean under MBILI
treatment had accumulated significantly higher N (3.26 percent N, p≤0.0001) than maize
under different treatments. The N uptake was highly positively correlated (r=0.79; p=0.1089)
with soil mineral N of the same sampling period. At 6 WAP the soybean under conventional
treatment yielded significantly the highest N (4.28 percent N, p≤0.0001) than all the other
treatments. At 8 WAP the soybean sole acquired significantly the highest N (3.16 per cent N,
p=0.0102) than sole maize and maize under conventional, MBILI, and 2M:6S treatments.
The N uptake by maize was significantly positively correlated (r=0.88; p=0.051) with soil
mineral N during the same period. At 12 WAP the sole soybean also recorded significantly
the highest N (3.31 percent N, p=0.0031) than all the other treatments, excluding soybean
under 2M:4S treatment. During this sampling period, the amount of N accumulated by
soybean was highly significantly positively correlated (r=0.91; p=0.0301) with soil mineral
N of the same period and soil mineral N at 16 WAP (r=0.89; p=0.0437), respectively.
Whereas towards the end of season (at 16 WAP) the maize under MBILI treatment acquired
statistically the highest N (1.75 percent N, p=0.0053) than all the other intercropping
patterns. At harvest, still the maize under MBILI treatment accumulated significantly the
highest N (4.85 kg N ha-1, p<0.0001) than all other treatments, except sole maize and maize
under conventional treatments. At this moment the amount of N yielded by soybean was
strongly correlated (r=0.78; p=0.1201) with the soil mineral N for the period. For the grain,
the maize under conventional treatment observed significantly the highest N uptake (4.30 kg
ha-1, p≤0.0001) than all other treatments, excluding sole maize, maize under MBILI, sole
soybean and maize under 2M:6S treatments (Table 4.10).

63
The greater N acquisition by a non-legume crop intercropped with a legume is frequently
reported in literature (Francis, 1986; Stern, 1993; Li et al., 2001; Shata et al., 2007). In
cereal-legume intercropping, an increase in N acquisition may be derived in two ways. First,
the difference in competitive abilities of component species may increase N uptake by cereal,
which in most cases has higher competitive ability relative to legume. This may conversely
stimulate nodulation in legume, as noted by Rerkasem et al. (1988) for beans intercropped
with maize. Second, an increase in N acquisition may also be attributed to N transfer to cereal
from legume (Brophy et al., 1987). The higher N facilitation may enable cereal to absorb
more N in intercropping systems than in sole cropping systems, or it may increase the N
fixation ability of legumes and may transfer from legume to cereal (Ning et al., 2012).
However, in the experimental sites the soils are moderately acidic (pH=5.33 and pH=5.46, at
Embu and Kamujine sites, respectively), limiting phosphorus availability, which is harmful
for BNF process and therefore lessen the N contribution of the legume component to system.
Furthermore, according to Jones and Giddens (1985) there are a number of factors that affect
N2 fixation by legume in acid soil. The number of compactible rhizobia in the rhizosphere
and the degree of infection of the root by the bacteria are important factors, which are
controlled by environmental conditions such as soil pH. Thus, in cereal-legume
intercropping, without N-fixing and transfer, the N demand of each intercrop may also
increase N competition, particularly when relatively low amount of fertilizer-N and soil-N are
used (Li et al., 2003a; Li et al., 2003b). Simpson (1965) stated that in some of the
intercropping systems, competition by the legume for N is high and results in reduced N
uptake by the cereal, and in this study it resulted in higher uptake by soybean as compared to
the maize component. On the other hand, the higher N uptake by maize observed under

64
MBILI treatment at Kamujine site could be due to the fact that during that time the legume
component had accomplished its N requirements and about to be harvested. Therefore, the
competition for N could be reduced to its minimum.
4.1.2.5. Effects of maize – soybean intercropping patterns on chemical soil properties
At Embu site, before planting the pH values were not significantly different (p=0.6585)
among the treatments, and ranged from 5.30 (for conventional and MBILI treatments) to 5.37
(for sole soybean treatment). Results of soil pH at harvest showed that the treatments did not
significantly (p=0.5581 and p=0.7956, respectively) affect the soil pH. However, there was a
general decrease across the seasons the highest and lowest reduction was observed in the sole
maize (2.49 percent) and the conventional (0.57 percent) treatments, respectively. This
situation was not expected because manure that was applied as blank was supposed to have
increased the soil pH in all the treatments due to its buffer capacity; but, probably the
exchangeable cations were leached from the topsoil (0-15 cm) because of the heavy rains that
were registered during the seasons. It also could be due to the quality of the manure applied,
that probably had not enough cations on it that could raise the pH of the soil. At Kamujine,
although there were also no significant differences in the three sampling periods (p=0.3046,
p=0.1946 and p=0.0835, respectively), the situation was slightly different at Embu because
the pH values increased from the preseason to post second season, where the sole maize
recorded the highest increase (8.31 percent) and 2M:6S treatment with the lowest value of
4.03 percent (Table 4.11).

65
Table 4.11: Mean soil pH in various treatments at Embu and Kamujine
Location Treatment pH (water, 1:2.5)
At planting 2012LR 2012SR
Embu
Sole maize 5.36 5.20 5.23
Sole soybean 5.37 5.20 5.26
Maize-Soybean (1M:1S) 5.30 5.32 5.27
Maize-Soybean (2M:2S) 5.30 5.34 5.26
Maize-Soybean (2M:4S) 5.36 5.32 5.30
Maize-Soybean (2M:6S) 5.31 5.25 5.22
p-value 0.6585 0.5581 0.7956
LSD(0.05) 0.12 0.21 0.13
Kamujine
Sole maize 5.41 5.62 5.90
Sole soybean 5.43 5.51 5.71
Maize-Soybean (1M:1S) 5.55 5.63 5.91
Maize-Soybean (2M:2S) 5.41 5.55 5.73
Maize-Soybean (2M:4S) 5.49 5.62 5.87
Maize-Soybean (2M:6S) 5.48 5.49 5.71
p-value 0.3046 0.1946 0.0835
LSD(0.05) 0.15 0.15 0.19
ns – not significant; *significant at p≤0.05; **significant at p≤0.01; ***significant at
p≤0.001.
At Embu site, the available phosphorus values did not show any significant differences
(p=0.2373, p=0.6963, p=0.3224, respectively) among the treatments, during all the sampling
periods. However, the P values generally decreased from the preseason to the post second
season. Similar situation was observed at Kamujine site, where P values were also not
significantly different during the three sampling periods (p=0.7243, p=0.6508 and p=0.6775,
respectively). However, P also decreased from the preseason to post second season (Table
4.12).

66
Table 4.12: Mean available Phosphorus at Embu and Kamujine
Location Treatment Phosphorus (ppm)
At
planting
2012LR 2012SR
Embu
Sole maize 12.85 12.81 8.43
Sole soybean 13.21 13.74 7.94
Maize-Soybean (1M:1S) 12.21 15.03 8.99
Maize-Soybean (2M:2S) 12.65 13.39 8.93
Maize-Soybean (2M:4S) 15.78 13.62 9.31
Maize-Soybean (2M:6S) 13.68 13.46 8.20
p-value 0.2373 0.6963 0.3224
LSD(0.05) 3.09 2.86 1.40
Kamujine
Sole maize 9.50 10.84 6.21
Sole soybean 9.50 12.15 6.64
Maize-Soybean (1M:1S) 10.21 12.20 6.48
Maize-Soybean (2M:2S) 8.76 13.01 6.36
Maize-Soybean (2M:4S) 9.18 10.27 6.37
Maize-Soybean (2M:6S) 10.02 12.56 7.20
p-value 0.7243 0.6508 0.6775
LSD(0.05) 2.13 3.88 1.33
ns – not significant; *significant at p≤0.05; **significant at p≤0.01; ***significant at
p≤0.001.
This generalized decline of available P under different cropping systems was also reported by
Ahmad and Rao (1982) who found that sole maize, sole cowpea, maize-pigeonpea,
pigeonpea-cowpea treatments had resulted in reduction of extractable P. This suggests that
the P inputs applied as black were not enough to satisfy the needs of the crops and remain in
the soil (Ahmad and Rao, 1982).
At Embu site, before planting the Ca2+ values were not significantly different (p=0.2670)
among the treatments and ranged between 0.26 and 0.18 Cmol kg-1 for 2M:4S and MBILI
treatment, respectively. After harvesting the first (2012 LR) and second (2012 SR) seasons
Calcium was not significantly affected (p=0.4209 and p=0.7795, respectively) by the

67
treatments. However, Calcium recorded a general decrease from the preseason to post second
season. At Kamujine site, there were also no significant differences in the three sampling
periods (p=0.6791, p=0.4224 and p=0.1715, respectively); and, similarly the Ca2+ values
observed reduction at the end of 2012 SR (Table 4.13).
At Embu site, the Mg2+ values were comparable among the treatments, during the sampling
periods. However, the values slightly decreased from the preseason to the post second season.
Slightly different situation was observed at Kamujine site, where Mg2+ values were only
significantly (p ≤ 0.0001) affected by the treatment during 2012 SR, having sole maize
treatment observed statistically the highest Mg2+ value of 0.37 Cmol kg-1 than all other
treatments (Table 4.13).
At Embu site, the K+ values were comparable among the treatments, during the sampling
periods. However, the K+ values generally decreased from the preseason to the post second
season. Similar situation was observed at Kamujine site, where K+ values were also not
significantly different in the three sampling periods. But differently from Embu site, at
Kamujine site they showed three different trends, where in the sole maize and 2M:6S
treatments the values remained constant; in the sole soybean and conventional treatments the
values were slightly increased; and in the MBILI and 2M:4S treatments, the values decreased
from the preseason to post second season (Table 4.13).

68
Table 4.13: Effect of intercropping patterns on soil chemical properties (exchangeable cations) during 2012 LR and 2012 SR at
Embu and Kamujine sites
Location Treatment Ca2+ (cmol kg-1) Mg2+ (cmol kg-1) K+ (cmol kg-1)
(Baseline) 2012LR 2012 SR (Baseline) 2012LR 2012 SR (Baseline) 2012LR 2012
SR
Embu
Sole maize 0.25 0.24 0.08 0.55 0.49 0.47 0.13 0.10 0.04
Sole soybean 0.20 0.19 0.07 0.54 0.54 0.53 0.12 0.12 0.08
Maize-Soybean
(1M:1S)
0.25 0.24 0.09 0.53 0.49 0.48 0.11 0.11 0.05
Maize-Soybean
(2M:2S)
0.18 0.16 0.09 0.50 0.46 0.46 0.10 0.08 0.06
Maize-Soybean
(2M:4S)
0.26 0.20 0.10 0.55 0.53 0.52 0.12 0.11 0.07
Maize-Soybean
(2M:6S)
0.20 0.18 0.10 0.51 0.44 0.44 0.11 0.10 0.05
p-value 0.2670 0.4209 0.7795 0.5922 0.5326 0.4484 0.6801 0.5579 0.3850
LSD(0.05) 0.07 0.10 0.04 0.09 0.13 0.10 0.05 0.04 0.04
Kamujine
Sole maize 0.21 0.20 0.15 0.50 0.46 0.37 0.08 0.08 0.08
Sole soybean 0.27 0.22 0.15 0.50 0.50 0.28 0.06 0.08 0.07
Maize-Soybean
(1M:1S)
0.22 0.26 0.16 0.54 0.49 0.29 0.07 0.08 0.08
Maize-Soybean
(2M:2S)
0.22 0.22 0.07 0.53 0.52 0.26 0.09 0.08 0.07
Maize-Soybean
(2M:4S)
0.22 0.17 0.09 0.57 0.54 0.34 0.08 0.06 0.06
Maize-Soybean
(2M:6S)
0.18 0.22 0.10 0.49 0.58 0.33 0.07 0.08 0.07
p-value 0.6791 0.4224 0.1715 0.4743 0.5672 <0.0001*** 0.4306 0.3612 0.4704
LSD(0.05) 0.11 0.09 0.08 0.09 0.14 0.03 0.02 0.02 0.02
ns – not significant; ***significant at p≤0.001.

69
During 2012 SR at Embu site, there were significant differences in soil total N as affected by
intercropping patterns. For instance, the MBILI treatment observed the highest N value of
0.05 percent (p=0.0530) than all other intercropping patterns, excluding the 2M:4S treatment.
Whereas, the soil organic carbon was not affected by the intercropping patterns (p=0.2460);
however, the 2M:6S treatment observed numerically the highest SOC value of 2.56 percent
than all other treatments. In general, the SOC was higher under intercropping treatments than
under sole cropping systems, probably due to higher crop residues produced under
intercropping compared to sole cropping systems (Table 4.14).
Different situation was observed at Kamujine site, where the soil total N was not affected by
the intercropping patterns (p=0.0800). This could be due to relatively slow turnover times for
SOM, making the incorporation of residue into total N small. Whereas, the SOC was
significantly affected by the intercropping and the conventional treatment recorded the
highest value of 2.46 percent, p=0.0020 (Table 4.14). In general, the SOC at this site was not
expected to be relatively low under intercropping treatments than under sole crop treatments.
The higher SOC values observed at Embu site compared to Kamujine site could be due to
relatively higher precipitation recorded at first location which resulted in lower
mineralization rate and therefore higher SOC.

70
Table 4.14: Effect of intercropping patterns on soil chemical properties (soil total N and
SOC) during 2012 SR at Embu and Kamujine sites
Location Treatment Soil total N (%N) Soil Organic C (%C)
Embu
Sole maize 0.01 2.48
Sole soybean 0.02 2.48
Maize-Soybean (1M:1S) 0.02 2.50
Maize-Soybean (2M:2S) 0.05 2.53
Maize-Soybean (2M:4S) 0.03 2.48
Maize-Soybean (2M:6S) 0.02 2.56
p-value 0.0530* 0.2460
LSD(0.05) 0.02 0.09
Kamujine
Sole maize 0.03 2.31
Sole soybean 0.00 2.14
Maize-Soybean (1M:1S) 0.02 2.46
Maize-Soybean (2M:2S) 0.02 2.03
Maize-Soybean (2M:4S) 0.02 2.30
Maize-Soybean (2M:6S) 0.005 1.96
p-value 0.0800 0.0020**
LSD(0.05) 0.02 0.22
ns – not significant; *significant at p≤0.05; **significant at p≤0.01; ***significant at
p≤0.001.
The increase in the soil pH values in intercropped systems compared with sole cropping
systems as encountered at Kamujine site, demonstrates that intercropping lead to reduction in
soil acidity compared to monocropping systems, probably due to higher organic material
generation. Similarly, Esekhade et al. (2003) observed higher soil pH in intercropping
treatments compared with soil under monocropping. Yasin et al. (2010) argued that,
decomposition product of organic matter (maize) in the soil can play a role as soil pH
regulator. Contrarily to the findings in this study, Dahmardeh et al. (2010) found that
intercropping of maize-cowpea had significantly increased the phosphorus and potassium in
soil, and that the lowest P level was observed in the sole maize treatment. Although not
significantly different from other treatments, the lowest P level was also observed in sole

71
maize at Kamujine site. Similarly, Suwanarit et al. (1998) did not find significant effect of
corn-groundnut intercropping system on available phosphorus. The soil mineral – N observed
under sole legume treatment at Kamujine site was also reported by Dahmardeh et al. (2010),
who found that soil mineral – N was significantly higher under sole cowpea treatment than in
the other treatments.
The higher SOC observed in this study under intercropping treatments compared to their sole
crops was also reported by several other authors (Bichel, 2013; Sainju et al., 2009). Bambrick
(2009) reported that tree based intercropping systems had greater potential for carbon storage
than conventional cropping systems due to the fact that carbon is stored in the biomass of
growing trees and trees provide additional carbon inputs (leaves, roots) that contribute to the
SOC pool. As reported at Embu site, Zhang et al. (2007) also did not find significant
differences on SOC under intercropping treatments compared to their pure stands. On the
other hand, the absence of differences in soil total N observed at Kamujine site was also
reported by Bichel (2013) in Argentina under maize-soybean intercropping systems.
Mazzoncini et al. (2011) reported that soil total N stocks significantly changed after 15 years,
and recommended long-term studies, especially when focusing on the SOM pool. The SOM
have been used as indicators of the effects related to biomass source and amounts on soil
organic matter dynamics in cropping systems (Bayer et al., 2009). Soil chemical properties in
terms of macro-, meso- and micro-nutrients after a cropping period depends on the type of
crops planted and cropping systems used (Ibeawuchi, 2007).

72
4.2. Effects of maize-soybean intercropping patterns on light interception and Leaf Area
Index
At Embu during the 2012 SR, significant differences (p≤0.001 and p≤0.05) were observed in
light interception (PAR) and leaf area index (LAI), respectively for maize and soybean
during the sampling period as affected by the intercropping patterns, except during 49 days
after planting (DAP). For instance, during the 35 DAP sole soybean intercepted significantly
(p=0.0002) more light (58.23 percent) and LAI of 1.03 (p=0.0003) than all other treatments
and/or crop, excluding sole maize, soybean in 2M:2S, 2M:4S and in 2M:6S treatments. In
this period only soybean under MBILI treatment showed existence of significant strong
correlation between grain yield and PAR intercepted (r=0.98; p =0.0254) and LAI (r=0.97;
p=0.0324), as shown by the figure 4.6. While at 63 DAP the soybean in MBILI treatment
observed statistically (p = 0.0310) the highest light interception (84.15 percent) than sole
soybean, maize and soybean under 2M:4S, and maize under 2M:6S treatments (Table 4.15).
At Kamujine site during the same sampling period, where both PAR and LAI were
significantly (35 DAP with p≤0.0001 and p≤0.0001; and, 49 DAP with p=0.0476 and
p=0.0342, respectively) affected by the intercropping patterns. At 35 DAP the sole soybean
recorded statistically the highest PAR of 62.08 percent (p≤0.0001) and LAI of 1.18
(p≤0.0001) compared to all other treatments. Whereas, during the time of 49 DAP maize
under MBILI treatment intercepted significantly more light (80.69 percent, p=0.0476) than
all other treatments, excluding sole soybean, sole maize, soybean under MBILI and maize
under 2M:6S treatments. In the same period (49 DAP), still maize under MBILI treatment
showed the highest LAI of 2.06 than all other treatments, except soybean under monocrop
(Table 4.15).

73
Table 4.15: Mean PAR and LAI of maize and soybean during 2012 SR at Embu and Kamujine sites
Location Treatment Crop 35 DAP 49 DAP 63 DAP
PAR% LAI PAR% LAI PAR% LAI
Embu
Sole maize Maize 57.23 1.03 66.50 1.28 83.40 3.61
Sole soybean Soybean 58.23 1.09 54.97 1.00 73.12 2.87
Maize-Soybean
(1M:1S)
Maize 32.41 0.47 56.55 0.99 74.19 2.74
Soybean 41.65 0.66 56.67 0.99 78.05 3.06
Maize-Soybean
(2M:2S)
Maize 45.88 0.74 61.00 1.24 74.10 3.21
Soybean 53.70 0.95 66.92 1.45 84.15 4.26
Maize-Soybean
(2M:4S)
Maize 42.67 0.70 55.58 0.95 69.05 2.34
Soybean 55.89 1.00 48.74 0.87 68.24 2.40
Maize-Soybean
(2M:6S)
Maize 46.34 0.75 51.38 0.87 66.95 2.23
Soybean 53.82 0.95 59.13 1.10 77.73 3.35
p – value 0.0002*** 0.0003*** 0.2850 0.3564 0.0310* 0.0962
LSD(0.05) 10.10 0.25 14.97 0.52 10.95 1.33
Kamujine
Sole maize Maize 49.86 0.85 69.39 1.52 76.47 2.28
Sole soybean Soybean 62.08 1.18 75.72 1.67 80.93 2.65
Maize-Soybean
(1M:1S)
Maize 36.24 0.55 67.17 1.37 78.90 2.54
Soybean 32.51 0.48 54.79 0.95 67.68 1.89
Maize-Soybean
(2M:2S)
Maize 43.71 0.71 80.69 2.06 84.23 3.24
Soybean 41.66 0.66 70.60 1.46 79.48 2.60
Maize-Soybean
(2M:4S)
Maize 37.44 0.57 64.10 1.21 71.74 2.08
Soybean 41.38 0.66 65.62 1.38 73.57 2.00
Maize-Soybean
(2M:6S)
Maize 48.87 0.82 67.97 1.37 76.84 2.34
Soybean 23.26 0.33 65.17 1.37 80.98 2.48
p – value <0.0001*** <0.0001*** 0.0476* 0.0342* 0.1417 0.2026
LSD(0.05) 8.83 0.20 13.35 0.54 11.05 0.93
ns – not significant; *significant at p ≤ 0.05; **significant at p≤0.01; ***significant at p≤0.001.

74
Figure 4.6: Relation between sobean grain yield under MBILI treatment with PAR (a) and
LAI (b) during 2012 SR at Embu site
The higher light interception showed by sole soybean treatment at Embu and Kamujine sites
was also reported by Ghanbari et al. (2010), who observed that the cowpea-maize
intercropping and maize sole crop had showed a lower light interception compared to cowpea
sole crop. Studying wheat-faba bean intercropping, Eskandari (2011) found that the mean of
PAR interception averaged over sampling dates by sole cropped bean was significantly
higher than that for sole cropped wheat. Studying maize-peas intercropping, Kanton and
Dennett (2008) found that at 36 DAP the sole peas were intercepting 30 percent more light
than sole maize. Studying maize-bean intercropping, Tsubo et al. (2001) found that sole
beans showed higher PAR intercepted than sole maize. Studying southern pea-sweet corn
intercropping system, Francis and Decoteau (1993) found that monocropped southern pea
had intercepted more light than monocropped sweet corn at 52 and 66 DAP. Solanki et al.
(2011) reported that sole soybean intercepted more light as compared to maize+soybean and
sole maize at 75 DAP.
a) b)
75
Varies studies, particularly in tropical, have shown that intercrops intercept more PAR than
sole crops, for example, Sivakumar and Virmani (1980) with maize-pigeon pea, Bandy-
opadhyay (1988) with sorghum-mung bean, and Tsubo et al. (2001) with maize-bean
intercrops. The present study confirmed that MBILI treatment capture more radiant energy
than sole crops, but the differences between this treatment and the sole maize crop (at Embu
site) or soybean crop (at Kamujine site) were relatively small and not significant. This might
be probably due to the differences in agro-ecological zonation and rainfall patterns between
the two sites, where at Embu site (upper midland) had received more rainfall which made the
maize crop to respond positively as it allowed faster leaf area growth and plant height, and
therefore more light was intercepted; whereas, at Kamujine site (lower midland) had received
less rainfall which made the maize crop to retard its initial growth rate compared to soybean
and not being able to cover the soil surface very early resulting in lower interception of PAR
compared to soybean. Also, Soybean plants, being deep rooted, can to some extent withstand
dry periods (Prasad and Brook, 2005).
Environmental factors such as limited moisture, influences the leaf area development
(Afuakwa and Crookston, 1984). Tsubo et al. (2001) stated that faster leaf area growth can
cause higher PAR intercepted during the vegetative stage. Radiation interception varies from
seedling emergence to crop harvest (Natarajan and Willey, 1980; Sivakumar and Virmani,
1980) and depends largely on the canopy leaf area (Tsubo et al., 2001). The higher PAR
conversion efficiencies of intercrop systems relative to the sole crops may be due to spread of
light over greater leaf area, and more efficient distribution of light in their canopies during
early stages of growth (Addo-Quaye et al., 2011). Keating and Carberry (1993) concluded
that cereal and legume can differ in PAR interception because of differences in their vertical

76
arrangement of foliage and canopy architecture and can therefore intercept more PAR
compared to sole crops. Moreover, it has been found by several investigators (Reddy and
Willey, 1981; Sivakumar and Virmani, 1984; Watiki et al., 1993) that LAI patterns follow
the patterns of radiation interception.
The higher LAI observed during 49 DAP with intercropped maize at Kamujine agrees with
the results of Baldé et al. (2011) who found that maize intercropped with pigeonpea or
brachiria had higher LAI than sole maize crop; and, Thobatsi (2009) who found maize
intercropped with cowpea long duration cultivar had significantly higher LAI of 2.23
compared to medium season cultivars. Higher maize LAI when intercropped with soybean
during 2012 SR could be attributed to sufficient rainfall at the beginning of the season that
stimulated maize leaf growth.
Similarly, the reductions of maize LAI under intercropping systems have been also reported
by other researchers (Thobatsi, 2009; Zegada-Lizarazu, et al., 2006; Bilalis et al., 2005). The
absence of differences in maize LAI between all treatments in both sites (Embu and
Kamujine) at 63 DAP and at 49 DAP in Embu site correspond with results of Filho (2000)
who did not find any significant differences between sole maize and maize intercropped with
cowpea. Twala and Ossom (2004) also did not find any significant differences in LAI
between maize monocrop and maize intercropped with sugar beans or groundnuts. These
results support the fact that different climatic conditions will result in different leaf
development patterns of maize, with or without intercropping.
In general, at Embu site monocropped maize and the MBILI treatments intercepted
numerically more light than all other treatments, at 69.04 and 64.29 percent during the

77
sampling period, respectively. The MBILI treatment intercepted 10.43 per cent more light
than the conventional treatment (Figure 4.7). While, at Kamujine site monocropped soybean
and the MBILI treatment intercepted numerically more light than all other treatments, with
averages of 72.91 and 66.73 percent, respectively. The PAR intercepted by the MBILI
treatment was 15.66 percent above the one that the conventional treatment had intercepted
(Figure 4.7).
Figure 4.7: PAR Intercepted (%) during 2012 SR at Embu (a) and Kamujine (b) sites
Similar results were also reported by Woomer and Tungani (2003) who found that beans had
intercepted 20 percent more light under MBILI treatment than under conventional crop
arrangement. These findings demonstrate the advantages of light penetration to the MBILI
intercropping pattern which offer realizable potential for smallholder farmers to improve the
performance of their maize-legume enterprise (Woomer and Tungani, 2003).
The Table 4.16 shows that in both sites (Embu and Kamujine) the amount of light intercepted
by the legume component and LAI were significantly (p ≤ 0.05) affected by maize shade. For
instance at Embu site, 35 DAP the middle row intercepted significantly (p=0.001 and

78
p≤0.0001) 19.97 and 19.0 percent more light than the closer row, in the 2M:4S and 2M:6S
treatments, respectively. During the time of 49 DAP, the closer row had significantly
(p≤0.0001 and p=0.0029) intercepted 19.12 and 19.45 percent less light than the middle row,
in the 2M:4S and 2M:6S treatments, respectively. Similarly, at Kamujine the closer row had
significantly (p<0.0001 and p=0.012) intercepted 17.21 and 6.79 percent less light than the
middle row, in the 2M:4S and 2M:6S treatments, respectively, at the time of 35 DAP. During
the time of 49 DAP, the middle row had significantly (p=0.0051 and p=0.0021) intercepted
14.58 and 19.90 percent more light than the closer row, in the 2M:4S and 2M:6S treatments,
respectively. At 63 DAP, the PAR intercerped by the closer row was 12.40 and 21.10 percent
statistically (p=0.0027 and p<0.0001) lower than the one that was intercepted by the middle
row, in the 2M:4S and 2M:6S treatments, respectively (Table 4.16).

79
Table 4.16: Effects of maize shade on PAR intercepted of soybean during 2012 SR at Embu and Kamujine sites
Location Row
position
35 DAP 49 DAP 63 DAP
2M:4S 2M:6S 2M:4S 2M:6S 2M:4S 2M:6S
PAR PAR PAR PAR PAR PAR
Embu Middle 63.94 61.71 66.87 68.68 78.03 87.05
Closer 43.97 42.71 47.75 49.23 66.05 71.25
p – value 0.001*** <0.0001*** <0.0001*** 0.0029** 0.0001*** 0.0092**
LSD(0.05) 9.13 6.16 7.12 11.58 5.59 11.24
Kamujine Middle 48.82 53.23 61.69 69.08 75.55 84.51
Closer 31.61 46.44 47.11 49.18 63.15 63.41
p – value <0.0001*** 0.012* 0.0051** 0.0021** 0.0027** <0.0001***
LSD(0.05) 5.31 5.05 9.85 11.36 7.74 6.53
ns – not significant; *significant at p ≤ 0.05; **significant at p<0.01; ***significant at p<0.001.

80
At Embu site during 2012 SR, at 35 DAP the middle row observed significantly (p=0.001
and p<0.001) 1.24 and 1.17 higher LAI than the closer row with 0.71 and 0.67, in the 2M:4S
and 2M:6S treatments, respectively. During the time of 49 DAP, the closer row had
significantly (p<0.0001 and p=0.0029) recorded 0.52 and 0.55 lower LAI than the middle
row, in the 2M:4S and 2M:6S treatments, respectively. At 63 DAP, the LAI observed by the
middle row was 1.04 and 1.47 statistically (p=0.001 and p=0.0078) higher than the one that
was recorded by the closer row, in the 2M:4S and 2M:6S treatments, respectively (Table
4.17).
At Kamujine site, during 35 DAP the closer row had significantly (p<0.0001 and p=0.0124)
observed lower LAI with values of 0.46 and 0.76 than the middle row (0.82 and 0.93), in the
2M:4S and 2M:6S treatments, respectively. During the time of 49 DAP, the middle row had
significantly (p=0.008 and p=0.0017) recorded higher LAI with values of 1.17 and 1.40 than
the closer row that observed 0.80 and 0.83, in the 2M:4S and 2M:6S treatments, respectively.
At 63 DAP, the LAI recorded by the closer row was 0.81 and 1.42 statistically (p=0.001 and
p<0.0001) lower than the one that was showed by the middle row, in the 2M:4S and 2M:6S
treatments, respectively (Table 4.13). Similar effects of shading on legume component have
been reported by several authors (Hang et al., 1984; Stirling at al., 1990; Ali, Jeffers and
Henderlong (2003). For instance, Ali et al. (2003) found that alternate row of soybean had
intercepted 31 percent more PAR than alternate narrow rows at 74 DAP.

81
Table 4.17: Effects of maize shade on LAI of soybean during 2012 SR at Embu and
Kamujine sites
Location
Row
positio
n
35 DAP 49 DAP 63 DAP
2M:4S 2M:6S 2M:4S 2M:6S 2M:4S 2M:6S
LAI LAI LAI LAI LAI LAI
Embu Middle 1.24 1.17 1.33 1.38 3.23 4.20
Closer 0.71 0.67 0.81 0.83 2.19 2.73
p – value 0.001** 0.001*
*
<0.00
1
0.002
8
0.00
1 0.0078
LSD(0.05) 0.25 0.20 0.17 0.33 0.58 1.02
Kamujin
e
Middle 0.82 0.93 1.17 1.40 2.43 3.04
Closer 0.46 0.76 0.80 0.83 1.62 1.62
p – value <0.0001**
* 0.0124 0.008
0.001
7
0.00
1
<0.000
1
LSD(0.05) 0.11 0.13 0.27 0.32 0.45 0.43
ns – not significant; *significant at p ≤ 0.05; **significant at p≤0.01; ***significant at
p≤0.001.
4.3. Effects of maize–soybean intercropping patterns on land equivalent ratio (LER) of
maize and soybean
During both seasons at both locations, the partial LERs values were significantly affected by
the intercropping patterns (p<0.0001). For instance, during 2012 LR at Embu site, the total
LER values showed greater yield advantage of intercropping maize and soybean over
component sole crops, though yield advantage varied from 81 percent to 22 percent. During
this season, the MBILI treatment observed significantly the highest LER value (1.81,
p=0.0019) than all the other treatments. However, the partial LERs for both maize and
soybean were all less than 1.00, except for maize where the MBILI was 48 percent
significantly (p≤0.0001) more productive than the conventional treatment, which was 11
percent more productive than pure maize. Whereas, during 2012 SR the total LERs values
observed yield advantage varied from 43 to 20 percent; and, the partial LERs for both maize
and soybean were also less than 1.00, excluding for maize in MBILI and conventional

82
treatments that was numerically 6 and 5 percent, respectively, more productive than pure
maize. In this second season, conventional treatment was significantly (1.43, p=0.0005) more
productive than all other treatments, excluding the MBILI treatment (Table 4.18).
During 2012 LR at Kamujine site, the total LER values showed greater yield advantage of
intercropping maize and soybean over component sole crops, though yield advantage varied
from 55 to 11 per cent. During this period, the 2M:6S treatment observed statistically the
highest LER value (1.55, p≤0.0001) than all the other treatments. The partial LERs for both
maize and soybean were all less than 1.00. Whereas, during 2012 SR the total LERs values
observed yield advantage varying from 28 to 22 percent; and, the 2M:4S treatment showed
significantly the highest LER value (1.29, p=0.0024) than the maize and soybean monocrops,
followed by the MBILI treatment with LER of 1.28 (p=0.0024), but they were not
statistically different from the other intercropping patterns. The partial LERs for both maize
and soybean were also less than 1.00, excluding the one for maize in the MBILI treatment,
which significantly (1.12, p≤0.0001) more productive than pure maize treatment (Table
4.18). Probably the greater LER of intercrops was mainly due to a greater resource use and
resource complementarily than when the species were grown separated.

83
Table 4.18: Mean land equivalent ratio (LER) during 2012 LR and SR at Embu and Kamujine sites
Location Treatment
Partial LER Total LER
Maize Soybean
2012 LR 2012 SR 2012 LR 2012 SR 2012 LR 2012 SR
Embu
Sole maize 1.00 1.00 --- --- 1.00 1.00
Sole soybean --- --- 1.00 1.00 1.00 1.00
Maize-Soybean (1M:1S) 1.11 1.05 0.24 0.38 1.35 1.43
Maize-Soybean (2M:2S) 1.48 1.06 0.33 0.32 1.81 1.38
Maize-Soybean (2M:4S) 0.90 0.68 0.41 0.52 1.31 1.20
Maize-Soybean (2M:6S) 0.49 0.61 0.73 0.71 1.22 1.32
p-value <0.0001*** <0.0001*** <0.0001*** <0.0001*** 0.0019** 0.0005**
LSD (0.05) 0.27 0.18 0.25 0.09 0.35 0.19
Kamujine
Sole maize 1.00 1.00 --- --- 1.00 1.00
Sole soybean --- --- 1.00 1.00 1.00 1.00
Maize-Soybean (1M:1S) 0.97 1.08 0.14 0.14 1.11 1.22
Maize-Soybean (2M:2S) 0.99 1.12 0.14 0.16 1.13 1.28
Maize-Soybean (2M:4S) 0.95 0.86 0.41 0.43 1.36 1.29
Maize-Soybean (2M:6S) 0.93 0.65 0.63 0.60 1.55 1.25
p-value
<0.0001*** <0.0001*** <0.0001*** <0.0001*** <0.0001*** 0.0024**
LSD (0.05)
0.07 0.12 0.09 0.17 0.12 0.16
ns – not significant; *significant at p≤0.05; **significant at p≤0.01; ***significant at p≤0.001.

84
Intercropping maize with soybean showed advantages in land use efficiency expressed as
LER, when compared with their sole crops. A LER greater than 1.00 has also been reported
with maize-soybean (Yusuf et al., 2012; Addo-Quaye et al., 2011; Pawar et al., 2011;
Solanki et al., 2011; Ullah et al., 2007; Thole, 2007; Kipkemoi et al., 2001 ), maize-cowpea
(Dahmardeh et al. 2010; Hugar and Palled, 2008), and maize-beans (Yilmaz et al., 2008;
Odhiambo and Ariga, 2001). The lower LERs for soybean observed in both sites can be
explained by the findings of Ofori and Stern (1986) who reported that light is the most
important factor determining LER of maize and soybean intercropping and LER declines
when legume becomes severely shaded as shown by Light measurements. Furthermore, the
higher productivity of the intercrop system compared to the sole crop may have resulted from
complementary and efficient use of growth resources by the component crops (Li et al.,
2006; Li et al., 2003). For instance, Sivakumar and Virmani (1980) observed that in maize-
pigeon pea intercrop, dry matter production per unit of PAR intercepted was higher in the
mixture than in sole crops, which was confirmed in this study through higher light
interception in intercropping treatments compared to monocrops.

85
CHAPTER FIVE: SUMMARY OF FINDINGS, CONCLUSIONS AND
RECOMMENDATIONS
5.1. Summary of findings
The maize-soybean intercropping patterns had significant effect on maize stover and grain
yields during both seasons at Embu site. In this site, the MBILI treatment recorded the
highest stover and grain yields. During 2012 LR at Kamujine site only the maize stover yield
was significantly affected by maize-soybean intercropping patterns. The conventional
treatment observed the highest stover yield than 2M:6S treatment; but it was statistically at
par with the one recorded by the MBILI treatment. And during the 2012 SR, the maize stover
and grain yields maize-soybean intercropping patterns affected significantly the MBILI
treatment recorded the highest stover and grain yields.
During both seasons in both sites, the soybean yield was significantly affected by the
intercropping pattern. During the 2012 LR, the yields were reduced by 60 and 81 percent due
to the intercropping with maize, at Embu and Kamujine, respectively; whereas, during the
2012 SR, the yields were reduced by 52 and 78 percent as a result of intercropping with
maize, at Embu and Kamujine, respectively. At Embu, during 2012 LR, the sole soybean
observed significantly the highest stover yield than all the intercropping patterns. Also, the
sole soybean treatment gave statistically the highest grain yield than all the intercropping
patterns. Similar results were obtained during 2012 SR, where sole soybean treatment
recorded statistically the highest stover yield than all the other treatments. The monocropped
soybean observed also the highest grain yield than all other treatments.

86
The maize-soybean intercropping patterns affected significantly soil nitrate-N only at harvest
(20 WAP) at both locations, and at 12 WAP at Embu site. But in general, the soil nitrate-N
was reduced by the intercropping patterns. The soil mineral-N was not significantly affected
by the maize-soybean intercropping patterns at Embu site; and at Kamujine site it was only
affected at harvest (20WAP). Generally the mineral N decreased across the season explained
mainly by depletion of N as a result of plant uptake and the dry conditions experienced
towards the end of the season.
The N uptake of maize and soybean was significantly affected by the intercropping patterns,
at both locations. For instance, at 4 WAP the sole soybean observed significantly the higher
N amount than all the other treatments, which was strongly correlated with soil mineral at the
same sampling period. At 16 WAP the sole soybean had accumulated significantly the lowest
N compared to all the other treatments. Also, the N uptake by soybean during this period was
positively correlated with soil mineral N at the same sampling period. The maize under
MBILI treatment observed significantly the highest N uptake while sole soybean observed
significantly the lowest N uptake, which was statistically at par other soybean treatment. Still
the maize under MBILI treatment observed significantly the highest N uptake to the grain
than other treatments. In general, the N accumulation by maize under intercropping
treatments was generally lower than that for sole cropping.
During 2012 LR at Kamujine site, the soybean under MBILI treatment had accumulated
significantly the highest N than maize under different treatments, at 4 WAP. During this time
the N uptake was highly positively correlated with soil mineral N of the same sampling
period. At 8 WAP the soybean sole acquired significantly the highest N than sole maize and

87
maize under conventional, MBILI, and 2M:6S treatments. At this time the N uptake by maize
was significantly positively correlated with soil mineral N during the same period. At 12
WAP the sole soybean also recorded significantly the highest N than all the other treatments,
excluding soybean under 2M:4S treatment. During this sampling period, the amount of N
accumulated by soybean was highly significantly positively correlated with soil mineral N of
the same period and soil mineral N at 16 WAP, respectively. At harvest, still the maize under
MBILI treatment accumulated significantly the highest N than all other treatments. At this
moment the amount of N yielded by soybean was strongly correlated with the soil mineral N
for the period. For the grain, the maize under conventional treatment observed significantly
the highest N uptake than all other treatments, excluding sole maize, maize under MBILI,
sole soybean and maize under 2M:6S treatments.
The maize-soybean intercropping patterns had no significant effect on soil pH, extractable
phosphorus, exchangeable calcium and potassium, and extractable ammonium at both
locations. Although, the available Phosphorus was not affected by the treatment, it recorded a
general decrease from the pre-season to 2012SR at all locations of the study. The
exchangeable magnesium was significantly higher under maize sole crop at Kamujine site
during 2012 SR. The soil organic carbon was significantly affected by the intercropping
patterns at Kamujine site where the conventional treatment observed the highest SOC, but it
was not affected at Embu site.
The intercropping patterns affected significantly the PAR intercepted and the leaf area index
at both sites. During 35 DAP at Embu site, the soybean sole crop intercepted significantly
more light and leaf area index (LAI) than all other treatments and/or crop. In this period only

88
soybean under MBILI treatment showed existence of significant strong correlation between
grain yield and PAR intercepted and LAI. Whereas, at 63 DAP the soybean in MBILI
treatment observed statistically the highest light interception (84.15 percent) than sole
soybean, maize and soybean under 2M:4S, and maize under 2M:6S treatments. At Kamujine
site during the same sampling period, where both PAR and LAI was significantly affected by
the intercropping patterns. At 35 DAP the sole soybean recorded statistically the highest PAR
and LAI than all other treatments. Whereas, during the time of 49 DAP maize under MBILI
treatment intercepted significantly more light than all other treatments.
During both seasons at both locations, the partial LERs values were significantly affected by
the intercropping patterns. For instance, during 2012 LR at Embu site, the total LER values
showed greater yield advantage of intercropping maize and soybean over component sole
crops, though yield advantage varied from 81 percent to 22 percent. During this season, the
MBILI treatment observed significantly the highest LER value than all the other treatments.
Whereas, during 2012 SR the total LERs values observed yield advantage varied from 43 to
20 percent. In this second season, conventional treatment was significantly more productive
than all other treatments, excluding the MBILI treatment.
During 2012 LR at Kamujine site, the total LER values showed greater yield advantage of
intercropping maize and soybean over component sole crops, though yield advantage varied
from 55 to 11 percent. During this period, the 2M:6S treatment observed statistically the
highest LER value than all the other treatments. Whereas, during 2012 SR the total LERs
values observed yield advantage varying from 28 to 22 percent; and, the 2M:4S treatment
showed significantly the highest LER value than the maize and soybean monocrops, followed

89
by the MBILI treatment with LER, but they were not statistically different from the other
intercropping patterns.
5.2. Conclusions
The maize-soybean intercropping patterns had significant effect on maize stover and grain
yields during both seasons and sites. The MBILI treatment recorded significantly the highest
maize stover and grain yields.
During both seasons in both sites, the soybean yield was significantly affected by the
intercropping pattern. During the 2012 LR, the yields were reduced by 60 and 81 percent and
during the 2012 SR, the yields were reduced by 52 and 78 percent as a result of intercropping
with maize.
The N uptake of maize and soybean was significantly affected by the intercropping patterns,
at both locations. The maize under MBILI treatment observed significantly the highest N
uptake to the stover and to the grain than all other treatments.
The maize-soybean intercropping patterns had no significant effect on the soil chemical
properties at both locations, excluding exchangeable Magnesium and soil organic carbon, at
Kamujine site.
The intercropping patterns affected significantly the PAR intercepted and the leaf area index
at both sites. The soybean sole crop intercepted significantly more light and leaf area index
(LAI) than all other treatments and/or crop. Towards the end of the season, the soybean in
MBILI treatment observed statistically the highest light interception than other treatments.

90
The total LER values showed greater yield advantage of intercropping maize and soybean
over component sole crops, though yield advantage varied from 81 percent to 20 percent,
during both seasons and locations.
5.3. Recommendations and areas for further research
The major recommendation emanating from this study for farmers is to use the MBILI
maize-soybean intercropping pattern because it showed efficient resources use.
Three issues are suggested for future research:
1. There is need to quantify the BNF activity of different intercropping patterns that
could assist to explain some findings of this study.
2. To assess the water use efficiency and soil moisture content of the maize-soybean
intercropping during different sampling periods of the season.
3. There is a need to conduct future studies on N balances under varying amounts of
inputs in particular manure and phosphorus.

91
REFERENCES
Addo-Quaye, A. A., Darkwa, A. A., and Ocloo, G. K. (2011). Yield and Productivity of
Component Crops In a Maize-Soybean Intercropping System as Affected By Time of
Planting and Spatial Arrangement. Journal of Agricultural and Biological Science. Vol. 6,
No. 9: 50-57.
Adeniyan, O. N., Akande, S. R., Balogun, M. O., and Saka, J. O. (2007). Evaluation of Crop
Yield of African Yam Bean, Maize and Kenaf under Intercropping Systems. American –
Eurasian J. Agric. & Environ. Sci. 2(1): 99 – 102.
Afuakwa, J. J., and Crookston, N. R. (1984). Using the Kernel Milk Line to Visually Monitor
Grain Maturity in Maize. Crop Sci. 24(4), 687-691.
Ahmad, S. and Rao, M. R. (1982). Performance of Maize-Soybean intercrop Combination in
the Tropics: Results of a Multilocation Study. Field Crops Res., 5: 147-161.
Akinnifesi, F. K., Makumba, W., Sileshi, G., Ajayi, O. C., Mweta, D. (2007). Synergistic
Effect of Inorganic N and P fertilizers and Organic Inputs from Gliricidia sepium on
Productivity of Intercropped Maize in Southern Malawi. Plant Soil 294: 203-217.
Alhassan, G. A., Kalu, B. A., and Egbe, O. M. (2012). Influence of Planting Densities on the
Performance of Intercropped Bamabra Groundnut with Cowpea in Makurdi, Benue State,
Nigeria. International Journal of Development and Sustainability. Vol. 1(3):1-20.
Ali, M., Jeffers, D. L., and Henderlong, P. R. (2003). Interrelationship Between Leaf Area,
Light Interception and Growth Rate in a Soybean – Wheat System. Asian Journal of Plant
Science 2(8): 605-612.
Allen J. R. and Obura R. K. (1983). Yield of corn and soybean in intercropping soybeans.
Agron. J. 75: 1005-1009.
Alvarenga, A. D., Rezende, P. M., Andrade, M. J. de B. and Andrade, L. A. de B. (1998).
Corn-Soybean Intercropping. V. Intercropping System Effects and Corn Planting. Ciência
Rural, Santa Maria, v. 28, n. 2: 199-204.
Amede, T. (1995). Yield Gain and Risk Minimization in Maize Through Cultivar Mixtures in
Semi-Arid Zones of the Rift Valley in Ethiopia. Exp. Agric. 31: 161 – 168.
Anderson, J. M. and Ingram, J. S. I. (1993). Tropical Soil Biology and Fertility- A Handbook
of Methods. 2nd ed. CAB International, Wallingford, UK.
Anggria, L., Kasno, A., and Rochayati, S. (2012). Effect of Organic Matter on Nitrogen
Mineralization in Flooded and Dry Soil. Journal of Agricultural and Biological Science.
VOL. 7, No. 8: 586-590.

92
Baldé, A. B., Scopel, E., Affholder, F., Corbeels, M., Da Silva, F. A. M., Xavier, J. H. V.,
Wery, J. (2011). Agronomic Performance of No-Tillage Relay Intercropping with Maize
under Smallholder Conditions in Central Brasil. Field Crops Research. 124, 240-251.
Bambrick, A. (2009). Soil Organic Carbon in Tree-Based Intercropping Systems of Quebec
and Ontario, Canada. MSc. Thesis. McGill University, Montréal, Canada. 93pp.
Bandyopadhyay, S. K. (1988). Solar Radiation Interception, Soil Water and Nitrogen Use in
Sorghum Based Intercropping System with Legumes. Indian J. Agron. 33: 31-36.
Barrios, E., Kwesiga, F., Buresh, R. J., Sprent, J. I., Coe, R. (1998). Relating Preseason Soil
Nitrogen to Maize Yield in Tree Legume-Maize Rotation. Soil Sci. Soc. Am. J. 62:164–169.
Bationo, A., Buerkert, A., Sedogo, M. P., Christianson, B. C. and Mokwunye, A. U. (1995).
A Critical Review of Crop Residue use as Soil Amendment in the West African Semi-arid
Tropics. In: Powell, J.M., Fernández-Rivera, S., Williams, T.O. and Renard, C. (eds),
Livestock and Sustainable Nutrient Cycles in Mixed Farming Systems of sub-Saharan Africa,
vol. 2: Technical Papers. Proceedings of an International Conference, 22-26 November 1993,
International Livestock Centre for Africa (ILCA), Addis Ababa, Ethiopia, pp. 305 – 322.
Baumann, D. T., Bastiaans, L., and Krooff, M. (2003). Intercropping System Optimization
for Yield, Quality, and Weed Suppression Combining Mechanistic and Descriptive Models.
Doi: 10.2134/ Agron J. 2002.7340. Vol. 94 No. 4, p. 734-742.
Bayer, C., Dieckow, J., Amado, T. J. C., Eltz, F. L. F., Vieira, F. C. B. (2009). Cover Crop
Effects Increasing Carbon Storage in a Subtropical no‑till Sandy Acrisol. Communications in
Soil Science and Plant Analysis, Vol.40: 1499‑1511.
Beets, W. C. (1982). Multiple Cropping and Tropical Farming Systems. Westview Press,
Boulder, 156pp.
Bekunda, M. A., A. Bationo, and H. Ssali. (1997). Soil Fertility Management in Africa: A
Review of Selected Research Trials, p. 63-79. In R.J. Buresh et al. (ed.) Replenishing soil
fertility in Africa. SSSA Spec. Publ. 51. SSSA, Madison, WI.
Bichel, A. (2013). Applied Soybean and Maize Residue Contributions to Soil Organic Matter
in a Temperate Soybean/Maize Intercropping System. MSc. Thesis. University of Waterloo,
Canada. 149pp.
Bilalis, D. J., Sidiras, N., Kakampouki, I., Efthimiadou, A., Papatheohari, Y., and
Thomopoulos, P. (2005). Effects of Organic Fertilizer on Maize/Legume Intercrop in a Clay
Loam Soil and Mediterranean Climate – Can the Land Equivalent Ratio Index (LER) be
Used for Root Development? J. Food, Agric. & Environ. 3 (3&4): 117-123.
Braun, A. R., Smaling, E. MA., Muchungu, E. I., Shepherd, K. D., and Cobertt, J. D. (1997).
Maintenance and Improvement of Soil Productivity in the Highlands of Ethiopia, Kenya,

93
Madagascar and Uganda. AHI Technical Report Series no. 6.African Highlands Initiative.
AHI Coordinating Office, ICRAF. Box 30677, Nairobi, Kenya. 166pp.
Brintha, I. and Seran, T. H. (2009). Effect of Paired Row Planting of Radish
(Raphanussativus L.) Intercropped with Vegetable Amaranthus (Amaranthus tricolor L.) on
Yield Components of Radish in Sandy Regosol. J. Agric. Sci., 4: 19-28.
Brophy, L. S., Heichel, G. H., and Russelle, M. P. (1987). Nitrogen Transfer from Forage
Legumes to Grass in a Systematic Planting Design. Crop Sci. 27:753-758.
Brown, H. B. (1935). Effect of soybean on corn-yields. Louisiana. Exp. Agric., 265: 31-31.
Buresh, R.J., PC. Smithson, and D.T. Heliums. 1997. Building soil phosphorus capital in
Africa, p. 111-149. In R.J. Buresh et al. (ed.) Replenishing soil fertility in Africa. SSSA Spec.
Publ. 51.
Caporali, F., Campiglia, E., Paolini, R. e Mancinelli, R.,1998. The effect of crop species,
nitrogen fertilization and weeds on winter cereal/pea intercropping. Ital. J. of Agron., 2, 1, 1-
9."
Carr, P. M., Gardner, J. C., Schatz, B. J., Zullnger, S. W., Guldan, J. (1995). Grain Yield and
Biomass of a Wheat – Lentil Intercrop. Agron. J. 87: 547 – 579.
Carruthers, K., Prithiviraj, B., Fe, Q., Cloutier, D., Martin, R. C., and Smith, D. L. (2000).
Intercropping Corn with Soybean, Lupin and Forages: Yield Component Responses.
European Journal of Agronomy. 12:103-115.
Chianu, J. N., Vanlauwe, B., Mahasi, J. M., Katungi, E., Akech, C., Mairura F. S., Chianu,
Justina N., and Sanginga, N. (2008). Soybean Situation and Outlook Analysis: The Case of
Kenya. April 2008.
Dahmardeh, M., Ghanbari, A., Syahsar, B. A., and Ramrodi, M. (2010). The Role of
Intercropping maize (Zea mays L.) and Cowpea (Vigna unguiculata L.) on yield and Soil
Chemical Properties. Afr. J. Agric. Res. Vol. 5(8), pp 631-636.
Danso S.K.A., Hardarson, G., Zapata, F. (1993). Misconceptions and Practical Problems in
the use of the 15N Soil EnrichmentTechniques for Estimating N fixation. Plant Soil 152: 25–
52.
Dapaah, H. K.m Asafu-agyei, J. N., Ennin, S. A., and Yamoah, C. (2008). Yield Stability of
Cassava, Maize, Soybean and Cowpea Intercrops. J. Agric. Sci. 140: 73 – 82.
Duncan, W. G. (1986). Planting Patterns and Soybean Yields. Crop Sci. 26: 584 – 588.
Eaglesham, A. R. J., Ayanaba, A., Rango, R., V & Eskew, D. L. (1981). Improving Nitrogen
Nutrition of Maize Intercropping with Cowpea. Soil Biology Biochemistry, 13, 169 – 171.

94
Egbe, O. M., Alibo, S. E., and Nwueze, I. (2010). Evaluation of Some Extra-Early-and Early-
Maturing Cowpea Varieties for Intercropping with Maize in Southern Guinea Savanna of
Nigeria. Agric. Biol. J. N. Am. 1(5): 845-858.
Ennin, S. A., Clegg, M. D., and Francis, C. A. (2002). Resource Utilization in
Soybean/Maize Intercrops. African Crop Science Journal, Vol. 10. No. 3, 2002, pp. 251-261.
Ephrath, J. E., Wang, R. F., Terashima, K., Hesketh, J. D., Huck, M. G., and Hummel, J. W.
(1993). Shading Effects on Soybean and Corn. Biotronics. 22: 15 – 24.
Esekhade, T.U., Orimoloye, J.R., Ugwa, I.K. and Idoko, S. O. (2003). Potentials of multiple
cropping systems in young rubber plantations. Journal of Sustainable Agriculture. 22: 79 –
94.
Eskandari, H. (2011). Intercropping of Wheat (Triticum aestivum) and Bean (Vicia faba):
Effects of Complementarity and Competition of Intercrop Components in Resource
Consumption on Dry Matter Production and Weed Growth. African Journal of Biotechnology
Vol. 10(77), pp. 17755-17762.
FAO, (2011). The State of The World’s Land and Water Resources for Food and Agriculture.
Managing systems at risk. Food and Agriculture Organization of the United Nations. Rome,
2011.
Filho, J. M. L. (2000). Physiological Responses of Maize and Cowpea to Intercropping. Pesq.
Brasilia. 35(5), 915-921.
Fishler, M. and Wortmann, C. (1999). Crotaelaria (C. ochroleuca) as a green manure crop in
maize-bean cropping systems in Uganda. Field Crops Research 61: 97-107.
Foth, H. D. (1990). Fundamentals of Soil Science. John Wiley & Sons, Inc. 8th Edition.
Francis, C. A. (1986). Multiple Cropping Systems. Macmillan, New York.
Francis, R. and Decoteau, D. R. (1993). Developing Effective Southern pea and Sweet Corn
Intercrop System. Hort Technology, Vol. 3(2): 178-184.
Fujita K., Ofosu-Budu K. G. and Ogata, S. (1992). Biological Nitrogen Fixation in Mixed
Legume-Cereal Cropping Systems. Plant and Soil 141, 155-176.
Fujita, K. and Ofosu-Budu, K. G. (1996). Significance of Intercropping in Cropping Systems.
pp 19-40. In: O. Ito, C. Johansen, J. J. Adu-Gyamfi, K. Katayama, J. V. D. K. Kumar Rao
and T. J. Rego(Eds.)/ Dynamics of Roots and Nitrogen in Cropping Systems of the Semi-
Arid Tropics. Japan International Research Center for Agricultural Sciences. International
Agricultural Series No. 3 Ohwashi, Tsukuba, Ibavaki 305, Japan.
Gachimbi, L. N., de Jager, A., van Kuelen, H., Thuranira, E. G., Nandawa, S. M. (2002).
Participatory Diagnosis of Soil Nutrient Depletion in Semi-Arid Areas of Kenya. Managing
Africa’s Soils No. 26, IIED.

95
Ghanbari, A., Dahmardeh, M., Siahsar, B. A., and Ramroudi, M. (2010). Effect of Maize
(Zea mays L.) – Cowpea (Vigna unguiculata L.) Intercropping on Light Distribution, Soil
Temperature and Soil Moisture in Arid Environment. Journal of Food, Agriculture &
Environment Vol. 8(1):102-108.
Giller, K. E., Ormesher, J., Awah, F. M. (1991). Nitrogen Transfer from Phaseolus Bean to
Intercropped Maize Measured Using 15N-enrichment and 15N-isotope Dilution Methods.
Soil Biology Biochemistry. 23, 339-346.
Goudriaan, J. (1988). The bare bones of leaf-angle distribution in radiation models for
canopy photosynthesis and energy exchange. Agricultural and Forest Meteorology, v.43,
p.155 – 169.
Gruhn, P., Goletti, F., and Yudelman, M. (2000). Integrated Nutrient Management, Soil
Fertility, and Sustainable Agriculture: Current Issues and Future Challenges. International
Food Policy Research Institute, 2033 K Street, N.W. Washington, D.C. 20006 U.S.A.
September, 2000.
Gunasena, H. P. M., Sangakkara, R., and Wickramasinghe, P. (1977). Studies on
Intercropping. Results of Sri Lanka Experiments Incorporated in Review Paper. Proc. Second
Rev. Meeting. INPUTS Project, EAST-WEST CENTER, Hawaii, May 8-17.
Gupta, P. K. (2011). A Handbook of Soil, Fertilizer and Manure. Agrobios. India. 564pgs.
Hadley, P., Roberts, E. H., Summerfield, R. J., and Minchin, F. R. (1983). A quantitative
Model of Reproductive Development in Cowpea (Vigna unguiculata (L) Walp) in Relation to
Photoperiod and Temperature, and Implications for Screening Germoplasm. Annals of
Botany 51, 531-543.
Hang, A. N., McCloud, D. E., Boote, K. J., Duncan, W. G., (1984). Shade Effects on Growth,
Partitioning, and Yield Components of Peanuts. Crop Sci. 24, 109-115.
Hardman, L. L., and Brun, W. A. (1971). Effect of Atmospheric Carbon Dioxide Enrichment
at Different Development Stages on Growth and Yield Components of Soybeans. Crop Sci.
11: 886–888.
Haseeb-ur, R., Ali, A., Muhammad, W., Tanveer, A., Tahir, M., Nadeem, M. A., and Zamir,
M. S. (2010). Impact of Nitrogen Application on Growth and Yield of Maize (Zea mays L.)
Grown Alone and in Combination with Cowpea (Vigna unguiculata L.). American-Eurasian
J. Agric. & Environ. Sci. 7(1):43-47.
Hauggaard-Nielsen, H., Ambus, P., and Jensen, E. S. (2001a). Interspecific Competition, N
use and Interference with Weeds in Pea-Barley Intercropping. Field Crops Research. 70,
101-109.
Hauggaard-Nielsen, H., Ambus, P., and Jensen, E. S. (2001b). Temporal and Spatial
Distribution of Roots and Competition for Nitrogen in Pea-Barley Intercrops – a Field Study
Employing 32P Methodology. In: Competitive Interactions, Resource Use and Nitrogen

96
Dynamics in Annual Intercrops in Low-Input Cropping Systems. Ph.D.-thesis by Hauggaard-
Nielsen, H. Plant Biology and Biogeochemistry Department. Risø National Laboratory.
www.risoe.dk/pbk.
Hauggaard-Nielsen, H., Ambus, P., and Jensen, E. S. (2001c). Nitrate Leaching and N
Balance in Cropping Systems with Sole or Intercropped Pea and Barley. In: Competitive
Interactions, Resource Use and Nitrogen Dynamics in Annual Intercrops in Low-Input
Cropping Systems. Ph.D.-thesis by Hauggaard-Nielsen, H. Plant Biology and
Biogeochemistry Department. Risø National Laboratory. www.risoe.dk/pbk.
Herbert, S. J., and Litchfield, G. V. (1982). Partitioning Soybean Yield Components. Crop
Sci. 22: 1074 – 1079.
Hiebsch, C., Tetio-Kegho, F., Chirembo, F. P., (1995). Plant Density and Soybean Maturity
in a Soybean-Maize Intercrop. Agron. J. 87, 965 – 970.
Horwith, B. (1985). A Role for Intercropping in Modern Agriculture. Biological Sciences
35(5): 286-291.
Huang, J. X., Sui, P., Nie, S. W., Wang, B. B., Nie, Z. J., Gao, W. S., and Yuan-quan Chen,
Y. Q. (2011). Effect of Maize-Legume Intercropping on Soil Nitrate and Ammonium
Accumulation. Journal of Food, Agriculture & Environment Vol.9 (3&4): 416 - 419.
Hugar, H. Y. and Palled, Y. B. (2008) Effect of Intercropped Vegetables on Maize and
Associated Weeds in Maize-Vegetable Intercropping systems. Karnataka Journal of
Agricultural Sciences, 21 (2):159-161.
Ibeawuchi, I. I. (2007). Soil-Chemical Properties as Affected by Yam/Cassava/Landrace
Legumes Intercropping Systems in Owerri Ultisols Southeastern Nigeria. International
Journal of Soil Science, 2: 62 – 68.
Ijoyaha, M. O. and Fanen, F. T. (2012). Effects of Different Cropping Pattern on
Performance of Maize-Soybean Mixture in Makurdi, Nigeria. Scientific Journal of Crop
Science (2012) 1(2) 39-47. ISSN 2322-1690.
Ikerra, S. T., Maghembe, J. A., Smithson, P. C., and Buresh, R. J. (1999). Soil Nitrogen
Dynamics and Relationships with Maize Yields in a Gliricidia–Maize Intercrop in Malawi.
Plant and Soil 211:155–164. Kluwer Academic Publishers. Printed in the Netherlands.
Jaetzold, R., Schmidt, H., Hornetz, B., Shisanya, C. A. (2006). Farm Management Handbook
of Kenya. Natural Conditions and Farm Information, 2nd edition, vol. 11/C. Ministry of
Agriculture/GTZ, Nairobi, Kenya (Eastern Province).
Jama, B., Palm, C. A. Buresh, R. J., Niang, A., Gachengo, C., Nziguheba, G., Amadalo, B.
(2000). Tithonia Diversifolia as a Green Manure for Soil Fertility Improvement in Western
Kenya: a Review. Agrofor Syst 49: 201–221. doi:10.1023/A:1006339025728.

97
Jarenyama, P., Hesterman, O. B., Waddington, S. R., Harwood, R. R. (2000). Relay-
Intercropping of Sunnhemp and Cowpea into a Smallholder Maize System in Zimbabwe.
Agron. J., 92: 239–244.
Jensen, E. S., (1996). Grain Yield, Symbiotic N2 Fixation and Interspecific Competition for
Inorganic N in Pea-Barley Intercrops. Plant Soil 182, 25-38.
Jiang, H., and Egli, D. B. (1995). Soybean Seed Number and Crop Growth Rate During
Flowering. Agron. J. 87: 264 – 267.
Jones, R. A., and Giddens, J. E. (1985). Tolerance of Soybean Rhizobia to Soil Acidity.
Petanika. Vol. 8(3): 311-315.
Kanton, R. A. L. and Dennett, M. D. (2008). Radiation Capture and Use as Affected by
Morphologically Contrasting Maize/Pea in Sole and Intercropping. West African Journal of
Applied Ecology – Volume 13.
Kariaga, B. M. (2004). Intercropping Maize with Cowpeas and Beans for Soil and Water
Management in Western Kenya. Proceedings of the 13th International Soil Conservation
Organization Conference, July 2004, Conserving Soil and Water for Society, Brisbane, pp: 1
– 5.
Keating, B. A. and Carberry, P. S. (1993). Resource Capture and Use in Intercropping: Solar
Radiation. Field Crops Res. 34: 273-301.
Khan Z. R., Hassanali, A., Overholt, W., Khamis, T. M., Hooper, A. M., Pickett, J. A.,
Wadhams, L. J., Woodcock, C. M. (2002). Control of witch weed Striga hermonthica by
intercropping with Desmodium spp. and the mechanism defined as allelopathic. J Chem.
Ecol. 28 (9).
Kihanda, F.M., Warren, G.P., Atwal, S.S. 2004. The influence of goat manure application on
crop yield and soil nitrate variations in semi-arid eastern Kenya. In Bationo, A. (ed)
Managing Nutrient Cycles to Sustain Soil Fertility in Sub-Saharan Africa, Academy Science
Publishers (ASP), Nairobi, Kenya.
Kipkemoi, P. L, Wasike, V. W., Ooro, P. A., Riungu, T. C., Bor, P. K., and Rogocho, L. M.
(2002). Effects of Intercropping Pattern on Soybean and Maize Yield in Central Rift Valley
of Kenya. KARI-Njoro.
Kumwenda, J. D. T., Saka, A. R., Snapp, S. S., Ganunga, R. P., Benson, T. (1998). Effects of
Organic Legume Residues and Inorganic Fertilizer Nitrogen on Maize Yield in Malawi. In:
Waddington SR, Murwira H. K., Kumwenda JDT, Hikwa D, Tagwira F (eds.) The Soil
Fertility Network for Maize-Based Cropping Systems in Malawi and Zimbabwe. Proceeding
of the Soil Fertility Network Results and Planning Workshop Held from 7 to 11 July 1997 at
Africa University, Mutare, Zimbabwe. Soil Fertility Network and CIMMYT-Zimbabwe, pp
165 – 171.

98
Landers, J. N., (2007). Tropical Crop–livestock Systems in Conservation Agriculture: The
Brazilian Experience. Integrated Crop Management. Vol. 5–2007.FAO.Rome, 2007.
Ledgard, S.J.m Giller, K.E. (1995). Atmospheric N2-fixation as Alternative Nitrogen Source.
In: Bacon, P. (ed.) Nitrogen Fertilization and the Environment. Marcel Dekker,New York,
pp. 443–486.
Lesoing, G. W., and Francis, C. A. (1999). Strip Intercropping of Grain Sorghum/Soybean in
Irrigated and Rainfed Environments. Journal of Production Agriculture. Vol. 12, no. 4: 601 –
606.
Li L., Zhang F. S., Li X. L., Christie P., Sun J. H., Yang S. C. and Tang C. (2002).
Interspecific Facilitation of Nutrient Uptakes by Intercropped Maize and Faba bean. Nutrient
Cycling in Agroecosystems 65: 61–71.
Li, L., (1999). Interspecific Facilitative and Competitive Interactions Between Intercropped
Species in Intercropping Systems. Ph.D. Dissertation. China Agricultural University, Beijing.
Li, L., Sun, J. H., Zhang, F. S., Li, X. L., Yang, S. C., and Rengel, Z. (2006). Wheat/Maize or
Wheat/Soybean Intercropping I. Yield Advantage and Interspecific Interactions on Nutrients.
Field Crop Res. 71:123-137.
Li, L., Sun, J., Zhang, F., Li, X., Yang, S., and Rengel, Z. (2001). Wheat/Maize or
Wheat/Soybean Strip Intercropping I. Yield Advantage and Interspecific Interactions on
Nutrients. Field Crop Res. 71:123-137.
Li, W. X., Li, L., Sun, J. H., Zhang, F. S., Christic, P. (2003a). Effects of Nitrogen and
Phosphorus Fertilizers and Intercropping on Uptake of Nitrogen and Phosphorus by Wheat,
Maize and Faba bean. J. Plant Nutr. Vol. 26(3): 629-642.
Li, W., Li, L., Sun, J., Guo, T., Zhang, F., Bao, X., An, P., and Tang, C. (2005). Effects of
Intercropping and Nitrogen Application on Nitrate Present in the Profile of an Orthic
Anthrosol in Northwest China.
Li, X. J., Wang, J. C, Lu, S. H., Zhang, F. S., Zeng, X. Z., Ai, Y. W. (2003b). Effects of Non-
Flooded Mulching Cultivation and Nutrition Management on Crop Growth, Nutrient Uptake
and Balances in Rice/Wheat cropping systems. Field Crop Res. Vol. 83(3):297-311.
Liu, B., Liu X. B., Wang, C., Jin, J., Harbert, S. J., and Hashemi, M. (2010). Response of
soybean yield and yield components to light enrichment and planting density. International
Journal of Plant Production, 4 (1): 1-10.
Martin, R. C. (1990). Intercropping Corn and Soybean for High-protein Silage in a Cool
Temperate Region. PhD thesis, McGill University, Montreal, Quebec, 185p.
Mashingaidze, N. (2004). The effect of Detassilling and Leaf Stripping on productivity and
Weed Pressure in a Maize-Bean intercrop in Chinyika Resettlement Area. MSc. Thesis, Crop
Science Department, University of Zimbabwe. 88pgs.

99
Mathew, J. P., Herbert, S. J., Zhang, S., Rautenkranz, A. A. F., and Litchfield, G. V. (2000).
Differential Response of Soybean Yield Components to the Timing of Light Enrichment.
Agron. J. 92: 1156 – 1161.
Mazzoncini, M., Sapkota, T.B., Bárberi, P., Antichi, D., and Risaliti, R. (2011). Long-term
Effect of Tillage, Nitrogen Fertilization and Cover Crops on Soil Organic Carbon and Total
Nitrogen Content. Soil & Tillage Research. 114:165-174.
Mbwaga, A. M., Massawe, C. R., Kaswende, A. M., Hella, J. P. (2001). On-farm verification
of maize/cowpea intercropping on the control of striga under subsistence farming. Seventh
Eastern Africa regional maize conference, pp. 165-167.
Mead, R., and Willey, R. W. (1980).The Concept of a Land Equivalent Ratio and Advantages
in Yields From Intercropping. Exp. Agric. 16:217-228.
Mohammed, I. B., Olufajo, O. O., Singh, B. B., Oluwasemire, K. O., Chiezey, U. F. (2009).
Cowpea Genotype and Row Arrangement Effects on the Productivity and Economic Returns
of Sorghum/Cowpea Intercrop in the Nigeria Savanna. Agricultura Tropica Et Subtropica.
Vol. 42(3): 146-151.
Mpairwe, D. R., Sabiiti, E. N., Ummana, N. N. Tegegne, A. and Osuju, P. (2002). Effects of
Intercropping Cereal Crops with Forage Legumes and Source of Nutrients on Cereal Grain
Yield and Fodder Dry Matter Yields. Afri. Crop Sci. J. 10: 81 – 97.
Mpangane, P. N. Z., Ayisi, K. K., Mishiyi, M. G., and Whitebread, A. M. (2004). Grain Yield
of Maize Grown in Sole and Binary Cultures with Cowpea and Lablab in the Limpopo
Province of South Africa. Tropical Legumes for Sustainable Farming Systems in Southern
Africa and Australia. Eds: Whitebread, A. M. and Pengelly, B. C. ACIAR Proceeding No.
115.
Mucheru-Muna, M. W., Mugendi D., Mugwe, J., Kung’u, J. (2008). Maize yields and
mineral-N movement as affected by organic and inorganic inputs in a humic nitisol in Meru
South District, Kenya. African Journal of Environmental Studies and Development 1: 99-
108.
Mucheru-Muna, M., Pypers, P., Mugendi, D., Kung’u J., Mugwe, J., Merckx R., Vanlauwe,
B. (2010). Staggered Maize–Legume Intercrop Arrangement Robustly Increases Crop Yields
and Economic Returns in the Highlands of Central Kenya. Field Crops Research 115 (2010)
132–139. 2009 Elsevier B.V. All rights reserved. Journal homepage:
www.elsevier.com/locate/fcr.
Mudita, I. I., Chiduza, C., Richardson-Kageler, S. J., and Murungu, F. S. (2008).
Performance of Maize (Zea mays L.) and Soybean (Glycine max (L.) Merril) Cultivars of
Different Growth Habits in Intercrop in Sub-humid Environment of Zimbabwe. Journal of
Agronomy 7:229-236.

100
Mugendi, D. N. (1997). Tree Biomass decomposition, Nitrogen Dynamics and Maize growth
Under Agroforestry conditions in the sub-humid highlands of Kenya. PhD Thesis, University
of Florida, Gainesville, Florida, U.S.A.
Mugendi, D. N., Waswa, B. S., Mucheru-Muna, M. W., Kimetu, J. M. 2011. Strategies to
Adapt, Disseminate and Scale Out Legume Based Technologies. In: A. Bationo et al. (eds.),
Fighting Poverty in Sub-Saharan Africa: The Multiple Roles of Legumes in Integrated Soil
Fertility Management. DOI 10.1007/978-94-007-1536-3_3, Springer Science+Business
Media B.V. 2011, pp 85-116.
Mugendi, D., Mucheru-Muna, M., Pypers, P., Mugwe, J., Kung'u, J., Vanlauwe, B., and Roel
M. (2010). Maize Productivity as Influenced by Organic Inputs and Mineral Fertilizer in a
Nitisol Soil in Meru South District.19th World Congress of Soil Science, Soil Solutions for a
Changing World.1 – 6 August 2010, Brisbane, Australia.
Mugwe, J., Mugendi, D. N., Mucheru-Muna, M., and Kung’u, J. (2011). Soil Inorganic N and
N Uptake by Maize Following Application of Legume Biomass, Tithonia, Manure and
Mineral Fertilizer in Central Kenya. In: A. Bationo et al. (eds.), Innovations as Key to the
Green Revolution in Africa, pp 605-612. DOI 10.1007/978-90-481-2543-2_62, © Springer
Science+Business Media B.V. 2011.
Mugwe, J., Mugendi, D., Kung’u, J. and Mucheru-Muna, M. (2007). Effect of Plant Biomass,
Manure and Inorganic Fertilizer on Maize Yield in the Central Highlands of Kenya. African
Crop Science Journal, Vol. 15, No. 3, pp. 111 - 126 ISSN 1021-9730/2007.Printed in
Uganda. All rights reserved 2007, African Crop Science Society.
Mugwe, J., Mugendi, D., Mucheru-Muna, M., Merckx, R., Chianu, J., and Vanlauwe, B.
(2009). Determinants of the Decision to Adopt Integrated Soil Fertility Management
Practices by Smallholder Farmers in the Central Highlands of Kenya. Expl Agric. (2009),
volume 45, pp. 61–75. Cambridge University Press doi:10.1017/S0014479708007072 Printed
in the United Kingdom.
Mukhala, E., De Jager, J. M., Van Rensburg, L. D. and Walker, S. (1999). Dietary Nutrient
Deficiency in Small-scale Farming Communities in South Africa: Benefits of Intercropping
Maize (Zea mays) and Beans (Phaseolus vulgaris). Nutrition Research 19:629–641.
Muneer, A.P., Fida, H.M., Mumtaz, A.K., Muhammad, I.S., 2004. Performance of Maize in
Intercropping System with Soybean under Different Patterns and Nitrogen Levels. J. App.
Sci. 4(2), 201-205.
Muoneke, C. O., Ogwuche, M. A. O., and Kalu, B. A. (2007). Effect of Maize Planting
Density on the Performance of Maize/Soybean Intercropping System in a Guinea Savannah
Agro-ecosystem. African Journal of Agricultural Research Vol. 2 (12), pp. 667-677,
December 2007.
Murithi, F.M., Thijssen, H.J.C., Mugendi, D.N., Mwangi, J.N., O’Neil, M.K and Nyaata,
O.Z. 1994. Report of a survey on agroforestry technologies used for fodder production and

101
soil fertility improvement in Meru District, Kenya. National Agroforestry Regional Project,
Regional Research Centre, Embu, Kenya.
Nadwa, S. M., Bationo, A., Obanyi, S. N., Rao, I. M., Sanginga, N, and Vanlauwe, B. (2011).
Inter and Intra-Specific Variation of Legumes and Mechanisms to Access and Adapt to Less
Available Soil Phosphorus and Rock Phosphate. In: A. Bationo et al. (eds.), Fighting Poverty
in Sub-Saharan Africa: The Multiple Roles of Legumes in Integrated Soil Fertility
Management. DOI 10.1007/978-94-007-1536-3_3, Springer Science+Business Media B.V.
2011, pp 47-83.
Natarajan, M., and Willey, R. W. (1980). Sorghum-Pigeonpea Intercropping and the Effects
of Plant Population Density. 2. Resource Use. J. Agric. Sci. Camb. 95, 59-65.
Natarajan, M., and Willey, R. W. (1986). The Effects of Water Stress on Yield Advantages of
Intercropping Systems. Field Crops Res. 13: 117 – 131.
Neupane, R. K. (1983). Effects of Planting Arrangement on Maize and Soybean
Intercropping. J. Inst. Agric. Anim. Sci. 4: 1 – 5.
Ning, T., Zheng, Y., Han, H., Jiang, G., and Li, Z. (2012). Nitrogen Uptake, Biomass Yield
and Quality of Intercropped Spring- and Summer-Sown Maize at Different Nitrogen Levels
in the North China Plain. Biomass and Bioenergy. Vol. 47:91-98.
Odendo, M., Bationo, A. and Kimani, S. (2011), Socio-Economic Contribution of Legumes
to Livelihoods in Sub-Saharan Africa. In: A. Bationo et al. (eds.), Fighting Poverty in Sub-
Saharan Africa: The Multiple Roles of Legumes in Integrated Soil Fertility Management.
DOI 10.1007/978-94-007-1536-3_3, Springer Science+Business Media B.V. 2011, pp 27-46.
Odhiambo, G. D. and Ariga E. S. (2001). Effect of Intercropping Maize and Beans on Striga
Incidence and Grain Yield. Seventh Eastern and Southern Africa Regional Maize Conference
11th–15th February, 2001. Pp. 183-186.
Ofori, F., and Stern, W. R. (1987). Cereal-legume intercropping systems. Advances in
Agronomy 40:41-90.
Okalebo, J. R., Gathua, K. W. and Woomer, P. L. (2002). Laboratory Methods of Soil and
Plant Analysis: A Working Manual. 2nd Ed. TSBF-CIAT and SACRED Africa, Nairobi,
Kenya.
Olufajo, O.O., 1992. Response of soybean to intercropping with maize in a subhumid tropical
environment. Trop. oil seeds J. 1, 27-33.
Olufemi, O., Pitan, R., and Odebiyi, J. A. (2001). The Effects of Intercropping with Maize on
the Level of Infestation and Damage of Pod – Sucking Bugs in the Cowpeas. Crop
Protection. 20: 367 – 372.
Osman, A. N., Ræbild, A., Christiansen, J. L., and Bayala, J. (2011). Performance of Cowpea
(Vigna unguiculata) and Pearl Millet (Pennisetum glaucum) Intercropped under

102
Parkiabiglobosain an Agroforestry System in Burkina Faso. African Journal of Agricultural
Research Vol. 6(4), pp. 882-891, 18 February, 2011.
http://www.academicjournals.org/AJAR.
Osunde, A. O., Tsado, P. A., Bala, A., and Sanginga, N. (2004). Productivity of a Maize-
Promiscuous Soybean Intercrops as Affected by Fertilizer in the Southern Guinea Savanna
Zone of Nigeria. West African Journal of Applied Ecology, vol. 5, 2004.
Oyewole, B., Carsky, R. J., and Schulz, S. (2000). On-farm Testing of Mucuna and Cowpea
Double Cropping with Maize in the Guinea Savanna of Nigeria. In: Carsky, R. J., Keatige, J.
D. H., Manyong, V. M., and Eteka, A. C. (eds.) Cover crops for integrated natural resource
management in West Africa, IITA, Ibadan, Nigeria, pp 137-147.
Pal, U. R., Oseni, T. O., and Norman, J. C. (1992). Effect of Component Densities on
Productivity of Soybean/Maize Soybean/Sorghum Intercrop. J. Agron. Crop Sci., 170: 66 –
70.
Palm C. A., Myers R. J. K., and Nandwa, S. M., 1997. Combined Use of Organic and
Inorganic Nutrient Sources for Soil Fertility Maintenance and Replenishment. In:
Replenishing soil fertility in Africa.1997; RJ Buresh, PA Sanchez and F Calhoun (Ed.).
Special Publication. No. 51. 193- 217pp. Madison. WI. Soil Science Society of America.
Pawar, S. U., Solunke, S. S., Gokhale, D. N., and Alse, U. N. (2011). Studies on Soybean
Based Intercropping Systems with Different Ro Ratios. Inter. Res. J. Appl. Basic. Sci. Vol.
2(4):142-144.
Peoples, M. B. and Craswell, E. T. (1992). Biological nitrogen fixation: Investments,
Expectations and Actual Contributions to Agriculture. Plant and Soil 141: 13-39. Kluwer
Academic Publishers. Printed in the Netherlands. PLSO SA02. In: Biological Nitrogen
Fixation for Sustainable Agriculture. Developments in Plant and Soil Sciences. Vol. 49.
Peoples, M. B., Faizah, A. W., Rerkasem, B., and Herridge, D. F. (1990). Methods for
Evaluating Nitrogen Fixation by Nodulated Legumes in the Field. ACIAR Monograph No.
11, vii + 76 p.
Phiri, A. D. K., Kanyana-Phiri, G. Y., Snapp, S. (1999). Maize and Sesbania Production in
Relay Cropping at three Landscape Positions in Malawi. Agrofor. Syst. 47: 153 – 162.
Prasad, R. B. and Brook, R. M. (2005). Effect of Varying Maize Densities on Intercropped
Maize and Soybean in Nepal. Experimental Agriculture 41:365–382.
Purcell, L. C. (2000). Soybean Canopy Coverage and Light Interception Measurements Using
Digital Imagery. Crop Sci. 40: 834-837.
Rajat De and Singh, S. P. (1979). Management Practices for Intercropping Systems. Pgs: 17 –
21. In: Proceedings of the International Workshop on Intercropping, 10 -13 Jan 1979,
Hyderadab, India. Edited by Willey, R. W. and Garver, C.

103
Raji, J. A. (2007). Intercropping Soybean and Maize in a Derived Savanna Ecology. African
Journal of Biotechnology Vol. 6 (16), pp. 1885-1887. http://www.academicjournals.org/AJB.
ISSN 1684–5315 © 2007 Academic Journals.
Rakasi, K. (2011). Nutritional and Health Benefits of Soybeans and Micro – Enterprise
Opportunities. Quinto congresso de la Soja de Marcosur: 14 al 16 de Setembre/Rosario,
Argentina.
Rana, R. S., Singh, B. and Negi, S. C. (2001). Management of Maize/Legume Intercropping
Under Mid-Hill Sub-Humid Conditions. Indian J. Agric. Res., 35 (2): 100 – 103.
Reddy, M. S., and Willey, R. W. (1981). Growth and Resource Use Studies in an Intercrop of
Pearl Millet/Groundnut. Field Crops Res. 4, 13-24.
Reddy, M. S., Floyd, C. N., and Willey, R. W. (1980) Groundnut in Intercropping Systems.
In: Proceedings of the International Workshop on Groundnuts, 13-17 October 1980,
ICRISAT Center Patancheru, India.
Reddy, T. Y., Reddi, G. H. S. (2007). Principles of Agronomy, Kalyani Publishers, India, pp:
468-489.
Rerkasem, B., Rerkasem, K., Peoples, M. B., Herridge, D. F., Bergersen, F. J. (1988).
Measurement of N2 Fixation in Maize (Zea mays L.)- Rice-bean (Vigna umbellate [Thumb.]
Ohwi and Ohashi) Intercrops. Plant and Soil. 108:125-135.
Rezvani, M., Zaefarian, F., Aghaalikhani, M., Mashhadi, H. R., and Zand, E. (2011).
Investigation Corn and Soybean Intercropping Advantages in Competition with Redroot
Pigweed and Jimsonweed. World Academy of Science, Engineering and Technology 81 2011.
Rusinamhodzi, L. (2006). Effects of Cotton – Cowpea Intercropping on Crop Yields and Soil
Nutrient Status under Zimbabwean Rain – Fed Conditions. M.Ph. Thesis. University of
Zimbabwe.
Rutunga, V., Karanja, N. K., Gachene, C. K. K., and Palm, C. (1999). Biomass Production
and Nutrient Accumulation by Tephrosia vogelii (Hemsley) A. Gray and Tithonia diversifolia
Hook F. fallows during the six-month growth period at Maseno, Western Kenya.
Biotechnology, Agronomy, Society and Environment 3 (4): 237-246.
Sainju, U. M., Senwo, Z. N., Nyakatawa, E. Z., Tazisong, I. A., Reddy, K. C. (2009). Tillage,
Cropping Systems, and Nitrogen Fertilizer Source Effects on Soil Carbon Sequestration and
Fractions. Journal of Environmental Quality, Vol.37: 880‑888.
Saleem, R., Ahmed, Z. I., Ashraf, M., Arif, M., Malik, M. A., Munir, M., Khan, M. A.
(2011). Response of Maize-Legume Intercropping System to Different Fertility Sources
under Rainfed Conditions. Sarhad J. Agric. Vol. 27 No. 4: 503-511.
104
Sanchez, P.A. 1997 Soil fertility replenishment in Africa: An investment in natural resource
capital. In R.J. Buresh et al. (ed), Replenishing Soil Fertility in Africa. SSSA Special
Publication no. 51. SSSA. Madison, USA. pp 1-46.
Sanginga, N. and Woomer P. L. (2009). Integrated Soil Fertility Management in Africa:
Principles, Practices and Development Process. (eds.). Tropical Soil Biology and Fertility
Institute of the International Centre for Tropical Agriculture. Nairobi. 263 pp.
Schou, J. B., Jeffers, D. L., and Streeter, J. G. (1978). Effects of Reflectors, Black Boards, or
Shades Applied at Different Stages of Plant Development on Yield of Soybeans. Crop Sci.
18: 29 – 34.
Sekamatte, B. M., Ogenga-Latigo, M., Russell-Smith, A. (2003). Effects of maize–legume
intercrops on termite damage to maize, activity of predatory ants and maize yields in Uganda.
Crop Protection 22 (2003) 87–93
Seran, T. H. and Brintha, I. (2010). Review on Maize Based Intercropping. Journal of
Agronomy 9 (3): 135–145.
Shah, N. H., Koul, P. K., Khanday, B. A., and Kachrov D. (1991). Production Potential and
Monetary Advantage Index of Maize Intercropped with Different Grain Legumes. Indian J.
Agron. 36(1): 23-28.
Shata, S. M., Safaa, A., Mahmound, A., Hanan, S., Siam. (2007). Improving Calcareous
Productivity by Integrated Effect of Intercropping and Fertilizer. Res. J. Agric. & Biol. Sci.
3(6):733-739.
Shetty, S. V .R., B.R. Ntare, A. Bationo, and C. Renard. (1995). Millet and Cowpea in Mixed
farming of the Sahel. A Review of Strategies for Increased Productivity and Sustainability.
Pgs 293–304 in Livestock and sustainable nutrient cycling in mixed farming systems of sub-
Saharan Africa, edited by J.M. Powell, S. Fernandez Rivera, T.O. Williams, and C. Renard.
Proceedings International Conference, ILCA, Addis Ababa, Ethiopia.
Sikirou, S. and Wydra, K. (2008). Effect of Intercropping Cowpea with Maize or Cassava on
Cowpea Bacterial Blight and Yield. Journal of Plant Diseases and Protection.114 (4): 145 –
151.
Silwana, T. T. 2000. The performance of Maize / Bean and Maize / Pumpkin Intercrops
under Different Planting Combinations and Weeding in Transkei, South Africa. M.Sc.
Dissertation. University of Fort Hare, Alice, South Africa.
Silwana, T. T. and Lucas, E. O. (2002). The Effect of Planting Combinations and Weeding
and Yield of Component Crops of Maize/Bean and Maize/Pumpkin Intercrops. J. Agric. Sci.
138: 193 – 200.
Simpson, J. R. (1965). The Transfer of N from Pasture Legumes to an Associated Grass
under Several Systems of Management in Pot Culture. Aust. J. Agric. Res. 16:915-926.

105
Singh, C. (1983). Modern Techniques of Raising Field Crops. Oxford and IBH Publishing
Co. New Delhi, India.
Sivakumar, M. V. K., and Virmani, S. M. (1980). Growth and Resource Use of Maize,
Pigeonpea and Maize/Pigeonpea Intercrop in an Operational Research Watershed. Exp.
Agric. 16, 377-386.
Sivakumar, M. V. K., and Virmani, S. M. (1984). Crop Productivity in Relation to
Interception of Photosynthetically Active Radiation. Agric. For. Meteorol. 31, 131-141.
Solanki, N. S., Singh, D., and Sumeriya, H. K. (2011). Resources Utilization in Maize (Zea
mays)-based Intercropping System under Rainfed Condition. Indian Journal of Agricultural
Science. 81(6):511-515.
Steiner, K. G. (1982). Intercropping in Tropical Smallholder Agriculture with Special
Reference to West Africa. Schriftenreihe der GT2, N. 137, Eischbon, Germany.
Steiner, K. G. (1984). Intercropping in Tropical Smallholder Agriculture with Special
Reference to West Africa. 1st Edn. Geselleschaft Fur Technische Zusammenarbeit (GTZ),
Eschborn, Germany.
Stern, W. R. (1993). Nitrogen Fixation and Transfer in an Intercropping Systems. Field Crop
Res. 34: 335-356.
Stirling, C. M., Williams, J. H., Black, C. R., Ong, C.K. (1990). The Effect of Timing of
Shade on Development, Dry Matter Production and Light Use Efficiency in Groundnut
(Arachis hypogaea L.) under Field Conditions. Aust. J. Agric. Res. 41, 633-644.
Stuelpnagel, R. (1993). Intercropping of Faba Beans (Vicia faba L.) with Oats or Spring
Wheat. In Proceedings of the International Crop Science Congress, 14–44, July, 1992. Iowa
State University, Ames, Iowa.
Sullivan, P. (2003). Intercropping Principles and Production Practices. Appropriate
Technology Transfer for Rural Areas Publication. http://www.attra.ncat.org.
Suwanarit, A., Lekhasoonthrakorn, N., Rungchuang, J., and Kritapirom, S. (1998). Effects of
Intercropping Groundnut and Green-Manure Legumes to Corn on the Yields of Corn and
Productivity and Chemical Properties of Soil. Kasetsart J. (Nat. Sci.) 32:374-384.
Szeicz, G. (1974). Solar Radiation for Plant Growth. J. Appl. Ecol. 11, 617-636.
Taylor, H. M., Mason, W. K., Bennie, A. T. P., Rowse, H. R. (1992). Response of Soybeans
to Two Row Spacing and Two Soil Water Levels: I. an Analysis of Biomass Accumulation,
Canopy Development, Solar Radiation Interception and Components of Seed Yield. Field
Crop Res. 5: 1 – 14.
Temesgen, A., Dadefo, T., Birhanu, Shumi, G., Degefa, K., Tadesse, S., Biru, G., and
Waltaji, I. (2011). On Farm and on Station ‘Best Bet’ Maize-Legume Cropping Systems

106
Evaluation under CA and Conventional Practice in mid Altitude Sub humid of Western
Ethiopia. SIMLESA (Sustainable intensification of maize legume cropping systems for food
security in Eastern and Southern Africa), 2011. Annual Review 08-11 March 2011, Nairobi
Kenya.
Thobatsi, T. (2009). Growth and Yield Responses of Maize (Zea mays L.) and Cowpea
(Vigna Unguiculata L.) in an Intercropping System. Msc. Thesis. University of Pretoria.
159p.
Thole, A. (2007). Adaptability of Soybean (Glycine max (L.) Merr.) Varieties to
Intercropping Under Leaf Stripped and Detasselled Maize (Zea mays L.). MSc. Thesis.
University of Zimbabwe. 59 pp.
Tsubo, M., Walker, S. and Mukhala, E. (2001). Comparison of Radiation Use Efficiency of
Mono-/Inter-Cropping Systems with Different Row orientations. Field Crop Research. 71: 17
– 29.
Tuaeli, E. M. and Friesen, D. (2003). Adaptable maize/legume Systems for Improved Maize
Production in Northern Tanzania. Africa Crop Science Conference Proceedings, Vol. 6. 649
– 654.
Twala, M. G., and Ossom, E. M. (2004). Legume-Maize Association Influences Crops
Characteristics and Yields. 4th International Crop Science Congress. 26-Set – 01-Oct, 2004.
Brisbane, Australia.
Ullah, A., Bhatti, N. A., Gurmani, Z. A., and Imran, H. (2007). Studies on Planting Patterns
of Maize (Zea mays L.) Facilitating Legumes Intercropping. J. Agric. Res., 45, 113-118.
Undie, U. L., Uwah, D. F., and Attoe, E. E. (2012). Growth and Development of Late Season
Maize/Soybean Intercropping in Response to Nitrogen and Crop Arrangement in the Forest
Agro-ecology of South Southern Nigeria. Inter. J. Agric. Res.,7 (1): 1 – 16.
Van kessel, C. and Roskoski, J. P. (1988). Row Spacing Effects on N2-fixation, N-yield and
Soil N Uptake of Intercropped Cowpea and Maize. Plant and Soil 111, 17-23. Kluwer
Academic Publishers. PLSO 7439.
Vanlauwe, B.; Bationo, A.; Chianu J.; Giller, K. E.; Merckx, R.; Mokwunye, U.; Ohiokpehai,
O.; Pypers, P.; Tabo, R.; Shepherd, K.; Smaling, E.; Woomer, P. L.; Sanginga, N. (2011).
Integrated soil fertility management: operational definition and consequences for
implementation and dissemination. Outlook on Agriculture 39:17–24.
Verdelli, D., Acciaresi, H. A., and Leguizamón, E. S. (2012). Corn and Soybean in a Strip
Intercropping System: Crop Growth Rates, Radiation Interception, and Grain Yield
Components. International Journal of Agronomy. Vol. 2012: 1 – 17.

107
Viljoen, J. and Allemann, J. (1996). Cowpea and Maize Intercropping. pp 16-24, in: Training
Course. Cowpea.Vegetable and ornamental Plant Institute, Agricultural Research Council,
Roodeplaat.
Waddington, S.R., Mekuria, M., Siziba, S., Karigwindi, J. (2007). Long-term Yield
Sustainability and Financial Returns from Grain Legume-Maize Intercrops on a Sandy Soil in
Sub-humid North Central Zimbabwe. Exp. Agric. 43:489-503.
Watiki, J. M., Furai, S., Banda, J. A., and Keating, B. A. (1993). Radiation Interception and
Growth of Maize/Cowpea intercrop as affected by Plant Density and Cowpea Cultivar. Field
Crops Research. 35, 123-133.
Watson, D. J. 1947. Comparative Physiological Studies in the Growth of Field Crops. I.
Variation in net assimilation rate and leaf area between species and varieties, and within and
between years. Annals of Botany11,41–76.
Webert, G., Chude, V., Pleysier, J., and Oiketh, S. (1995). On farm Evaluation of Nitrate
Nitrogen Dynamics under Maize in the Northern Guinea Savanna of Nigeria. Expl. Agric. 31,
333–344.
White, A. and Parker, R.P. (1999). Cost-Benefit Analysis Concepts for Insensitive. Munitions
Policy Implementation. DSTO Aeronautical and Maritime Research Laboratory. P O Box
4331. Melbourne Victoria 3001 Australia.
Willey, R. W., Natarajan, M., Reddy, M. S., Rao, M. R., Nambiar, P. T. C. M., Kannaiyan, J.
and Bhatnagar, V. S. (1983). Intercropping Studies with Annual Crops. In: Better Crop for
Food, Nugent, J. and O’Connor M. (eds). Pitman Co., London.
Willey, R. W., Rao, M. R., and Natarajan, M. (1980). Traditional Cropping Systems with
Pigeon pea and Their Improvement. In: Nene, Y. L. and Kumble, V. ICRISAT. 1981.
Proceedings of the International Workshop on Pigeon peas, Volume 1, 15-19 December
1980, Patancheru, A.P., India.
Woomer P. L. and Tungani, J. O. (2003). Light Availability within an Innovative Maize-
Legume Intercropping System in Western Kenya. African Crop Science Conference
Proceedings, Vol. 6.42-46.
Woomer, P. L., Langat, M., Tungani, J. O. (2004). Innovative maize–legume intercropping
results in above- and below-ground competitive advantages for understory legumes. West
African Journal of Applied Ecology 6, 85–94.
Xiaolei, S., and Zhifeng, W. (2002). The optimal Leaf Area Index for Cucumber
Photosynthesis and Production in Plastic Green House. ISHS Acta Horticulturae, 633. XXVI
International Horticultural Congress.
Xinyou, Y, E., Schapendonk, A. D. H. C. M. and Xuhua, Z. (2003). Some Quantitative
Relationships Between Leaf Area Index and Canopy Nitrogen Content and Distribution.
Annals of Botany, 9:893-903.

108
Yasin, S., Junaidi, A., Wahyudi, E., Herlena, S., Darmawan, K. K. (2010). Changes of Soil
Properties on Various Ages of Rubber Trees in Dhamasraya, West Sumatra, Indonesia. J.
Trop. Soils. 15(3): 221 – 227.
Ye, Y. L., LI, L., and SUN, J. H. (2008). Effect of Intercropping three Legume Crops with
Maize on Soil Nitrate-N Accumulation and Distribution in the Soil Profile. Chinese Journal
of Eco-Agriculture. 16:4 pp.818-823.
Yilmaz, F., Atak, M., Erayman, M. (2008). Identification of Advantages of Maize-Legume
Intercropping over Solitary Cropping through Competition Indices in the East Mediterranean
Region. Turk J Agric 32: 111-119.
Yunusa, I. A. M. (1989). Effects of Planting Density and Plant Arrangement Pattern on
Growth and Yields of Maize (Zea mays L.) and Soybean (Glycine max (L.) Merrill) Grown in
Mixture. Journal of Agriculture Science. Cambridge. v. 112: 1-18.
Yusuf, A. A., Iwuafor, E. N. O., Olufajo, O. O., Abaidoo, R. C., and Sanginga, N. (2009).
Effect of Crop Rotation and Nitrogen Fertilization on Yield and Nitrogen Efficiency in Maize
in the Northern Guinea Savanna of Nigeria. African Journal of Agricultural Research Vol. 4
(10), pp. 913-921. http://www.academicjournals.org/AJAR. ISSN 1991-637X © 2009
Academic Journals.
Yusuf, I. A. Bissallah, G., Aiyelari, E. A., and Audu, P. (2012). Evaluation of The Planting
Schedule of Soyabean (Glycine max L. Merril) /Maize (Zea mays) Intercrop Systems for
Optimum Yields in the Guinea Savanna of Nigeria. Continental J. Agricultural Science 6 (3):
50–55.
Zegada-Lizarazu, W., Izumi, Y., and Iijima, M. (2006). Water Competition of Intercropped
Pearl Millet with Cowpea under Drought and Soil Compaction Stress. Plant Prod. Sci. 9(2),
123-132.
Zhang, F. and Long, L. (2003). Using Competitive and Facilitative Interactions in
Intercropping Systems Enhances Crop Productivity and Nutrient-Use Efficiency. Plant and
Soil 248: 305–312.
Zhang, M., Ful, X. H., Feng, W. T., and Zou, X. (2007). Soil Organic Carbon In Pure
Rubber And Tea-Rubber Plantations in South-western China. Tropical Ecology 48(2): 201-
207.
Zougmore, R., Kambou F. N., Ouattara, K., Guillobez, S. (2000). Sorghum-Cowpea
Intercropping: An Effective Technique Against Runoff and Soil erosion in the Sahel (Saria,
Burkina Faso). Arid Land Res. Manag. 14: 329 - 34.

109
APPENDICES
Appendix 1: Analysis of Variance for maize stover yield, during 2012 LR at Embu-ATC
site.
Source DF Anova SS Mean Square F Value Pr > F
Block 3 10.3206724 3.4402241 1.22 0.3462
Treatment 4 171.2968594 42.8242149 15.14 0.0001
Appendix 2: Analysis of Variance for maize stover yield, during 2012 SR at Embu-ATC
site.
Source DF Anova SS Mean Square F Value Pr > F
Block 3 4.21125131 1.40375044 1.95 0.1757
Treatment 4 48.92206458 12.23051615 16.97 <.0001
Appendix 3: Analysis of Variance for maize grain yield, during 2012 LR at Embu-ATC site.
Source DF Anova SS Mean Square F Value Pr > F
Block 3 1.26758643 0.42252881 1.32 0.3144
Treatment 4 27.76532152 6.94133038 21.64 <.0001
Appendix 4: Analysis of Variance for maize grain yield, during 2012 SR at Embu-ATC site.
Source DF Anova SS Mean Square F Value Pr > F
Block 3 1.43503939 0.47834646 0.36 0.7857
Treatment 4 17.95050090 4.48762522 3.34 0.0467

110
Appendix 5: Analysis of Variance for maize stover yield, during 2012 LR at Kamujine site.
Source DF Anova SS Mean Square F Value Pr > F
Block 3 0.74071915 0.24690638 0.30 0.8276
Treatment 4 11.19860055 2.79965014 3.36 0.0461
Appendix 6: Analysis of Variance for maize stover yield, during 2012 SR at Kamujine site.
Source DF Anova SS Mean Square F Value Pr > F
Block 3 9.63133652 3.21044551 7.61 0.0041
Treatment 4 19.31909196 4.82977299 11.45 0.0005
Appendix 7: Analysis of Variance for maize grain yield, during 2012 LR at Kamujine site.
Source DF Anova SS Mean Square F Value Pr > F
Block 3 2.18093898 0.72697966 1.50 0.2653
Treatment 4 5.56512343 1.39128086 2.87 0.0704
Appendix 8: Analysis of Variance for maize grain yield, during 2012 SR at Kamujine site.
Source DF Anova SS Mean Square F Value Pr > F
Block 3 3.12169727 1.04056576 5.98 0.0098
Treatment 4 7.52864085 1.88216021 10.82 0.0006

111
Appendix 9: Analysis of Variance for soybean stover yield, during 2012 LR at Embu-ATC
site.
Source DF Anova SS Mean Square F Value Pr > F
Block 3 0.04698110 0.01566037 0.20 0.8954
Treatment 4 2.77661959 0.69415490 8.80 0.0015
Appendix 10: Analysis of Variance for soybean stover yield, during 2012 SR at Embu-ATC
site.
Source DF Anova SS Mean Square F Value Pr > F
Block 3 0.38427796 0.12809265 3.83 0.0391
Treatment 4 2.02965718 0.50741429 15.17 0.0001
Appendix 11: Analysis of Variance for soybean grain yield, during 2012 LR at Embu-ATC
site.
Source DF Anova SS Mean Square F Value Pr > F
Block 3 0.03327029 0.01109010 0.17 0.9145
Treatment 4 3.77912858 0.94478215 14.49 0.0002
Appendix 12: Analysis of Variance for soybean grain yield, during 2012 SR at Embu-ATC
site.
Source DF Anova SS Mean Square F Value Pr > F
Block 3 0.06260868 0.02086956 1.54 0.2546
Treatment 4 4.19036864 1.04759216 77.37 <.0001

112
Appendix 13: Analysis of Variance for soybean stover yield, during 2012 LR at Kamujine
site.
Source DF Anova SS Mean Square F Value Pr > F
Block 3 0.16158423 0.05386141 8.09 0.0032
Treatment 4 2.46022977 0.61505744 92.42 <.0001
Appendix 14: Analysis of Variance for soybean stover yield, during 2012 SR at Kamujine
site.
Source DF Anova SS Mean Square F Value Pr > F
Block 3 0.34642013 0.11547338 1.78 0.2045
Treatment 4 3.12448087 0.78112022 12.04 0.0004
Appendix 15: Analysis of Variance for soybean grain yield, during 2012 LR at Kamujine
site.
Source DF Anova SS Mean Square F Value Pr > F
Block 3 0.19604052 0.06534684 3.81 0.0397
Treatment 4 0.71215958 0.17803989 10.37 0.0007
Appendix 16: Analysis of Variance for soybean grain yield, during 2012 SR at Kamujine
site.
Source DF Anova SS Mean Square F Value Pr > F
Block 3 0.04570205 0.01523402 6.36 0.0080
Treatment 4 1.13850676 0.28462669 118.78 <.0001