PROBING MAS-SURFACE INTERACTIONS W l l A ...
99
INIS-mf--11380 PROBING MAS-SURFACE INTERACTIONS W l l A MOLECULAR BEAM MARCEL SPRUIT
-
Upload
khangminh22 -
Category
Documents
-
view
1 -
download
0
Transcript of PROBING MAS-SURFACE INTERACTIONS W l l A ...
INIS-mf--11380
PROBING MAS-SURFACE INTERACTIONS
W l l A MOLECULAR BEAM
MARCEL SPRUIT
PROBING GAS-SURFACE INTERACTIONS
WITH A MOLECULAR BEAM
Het aftasten van gas-oppervlak wisselwerkingen
met behulp van een moleculaire bundel
PROBING GAS-SURFACE INTERACTIONS
WITH A MOLECULAR BEAM
ACADEMISCH PROEFSCHRIFT
ter verkrijging van de graad van doctor aan deUniversiteit van Amsterdam, op gezag van de RectorMagnificus, Prof. dr. S.K. Thoden van Velzen, in hetopenbaar te verdedigen in de Aula der Universiteit(Oude Lutherse Kerk, ingang Singel 411, hoek Spui),op woensdag 22 juni 1988 te 15.00 uur
door
Marcellinus Eduardus Maria Spruit
geborcn te Amsterdam

Promotor: Prof. dr. J. Los
Co-promotor: Dr. A.W. Kleyn

Aan Marian
Aan mijn ouders
This thesis is based upon the following articles:
Chapter 2 - Molecular beam scattering of O2 and Ar from Ag(l 11).
M.E.M Spruit, E.W. Kuipers, M.G. Tenner, J. Kimman and A.W. Kleyn,J. Vac. Sci. Techn. A 5,496 (1987).
Chapter 3 - Direct inelastic scattering ofsuperthermalAr, CO, NO and O2from Ag(lll)M.E.M Spruit, P.J. van den Hoek, E.W. Kuipers, F.H. Geuzebroek andA.W. Kleyn,submitted to Surf. Science.
Chapter 4 - Trapping-desorption 0}'Ozfrom Ag(lll).
M.E.M Spruit, P.J. van den Hoek, E.W. Kuipers, F.H. Geuzebroek andA.W. Kleyn,submitted to Surf. Science.
Chapter 5 - Dissociative adsorption ofOt on Ag(lll).
M.E.M. Spruit and A.W. Kleyn,to be submitted to J. Chem. Physics.
Chapter 6 - An empirical potential energy surface for the interaction ofO2 and Ag(IlI).M.E.M. Spruit and A.W. Kleyn,to be submitted to Chem. Phys. Letters.
The work described in this thesis is performed at the FOM-Institute for Atomic and MolecularPhysics, Kruislaan 407,1098 SJ Amsterdam, The Netherlands. It is part of the research programof the Stichting voor Fundatnenteel Onderzoek der Materie (Foundation for the FundamentalResearch on Matter) and was made possible by financial support from the Nederlandse Organisatievoor Wetenschappelijk Onderzoek (Netherlands Organization for the Advancement of Research).
Table of contents
TABLE OF CONTENTS 8
CHAPTER 1General introduction 11
General introduction 11References 15
CHAPTER 2The experimental arrangement and data processing 171. Introduction 172. Experimental arrangement 183. Data analysis 22
References 25
CHAPTER 3Direct inelastic scattering of superthermal Ar, CO,NO and O2 from Ag(l l l ) 271. Introduction 272. Experimental 303. Results 31
3.1 Experimental 313.2 Classical trajectory calculations 41
4. Discussion 454.1 Surface corrugation 454.2 Energy transfer 474.3 Sticking and electronic effects 51
5. Conclusions 51References 52
CHAPTER 4Trapping-desorption of O2 from Ag(l l l ) 551. Introduction 552. Experimental 583. Results and discussion 59
3.1 Desorption of Ar and O2 593.2 Trapping probability 653.3 O2-Ag(lll) interaction 67
4. Conclusions 67References 68
CHAPTER 5Dissociative adsorption of O2 on Ag(l l l ) 691. Introduction 692. Experimental 713. Results and discussion 72
3.1 Determination of the initial sticking probability . 723.2 The asymptotic behaviour of III0 773.3 The initial sticking probability 80
5. Conclusions 81References 81
CHAPTER 6An empirical potential energy surface for theinteraction of O2 and Ag(ll l) 831. Introduction 832. The construction of the PES 863. Discussion 904. Conclusions 93
References 93
SUMMARY 95
SAMENVATTING 99
NAWOORD 103
11
CHAPTER 1
General introduction
Probing gas-surface interactions with a molecular beam.
General introduction
The interaction of gasses and solid surfaces is very interesting because itdetermines in many cases properties of materials, and it is crucial in chemicalreactions on surfaces. Essential to the latter is the ability of a surface to adsorb gasparticles, and to break chemical bonds in the case that the adsorbed particles aremolecules. To study the interactions in detail, the investigation of energy transfer inmolecule-surface collisions is necessary. Essentially there exist only two possibleoutcomes for such collisions. First, a molecule can scatter directly, and nearlyinelastically, from the surface. In this case the molecule spends a very short time inthe vicinity of the surface (== 1O13 s), and can exchange energy with the surface.Second, the molecule can collide with the surface, loose its initial energy, andsubsequently get trapped at the surface. In this case, a variety of reactions on thesurface are possible, such as dissociation of the molecule, or chemical reaction ofthe particle with the surface, or with other trapped particles. As a result of thesereactions new products may form on the surface, and these may escape from thesurface into the gas phase. On a catalytic surface, that is a surface that improves orselects a certain reaction without being consumed in the process, various types ofthese reactions take place. In many studies on catalytical systems, one tries tounderstand and influence the rate of a given reaction by changing those parametersof the whole system which one believes to be important. More fundamental studiesconcentrate on the investigation of individual steps out of the total reaction path.Most fundamental studies deal with the structure of the surface and adsorbates,steady state reaction rates and other (static) situations. However, in this thesis theprincipal interest is not the (static) location of given intermediates on the surface,
Chapter 1
t how these intermediates are formed and what happens as a function of time onatomic timescale. In other words, we are looking at the dynamics of the reaction,i more simply the interaction between a gas particle and a surface in real time,r this kind of experiments molecular beam methods are necessary.
.2
S38-SO
I
Lattice coordinate
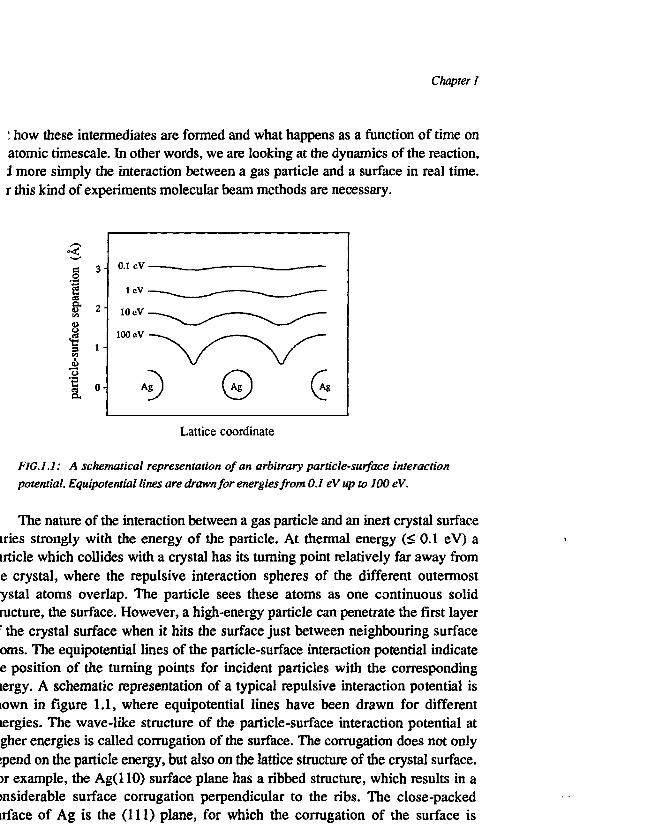
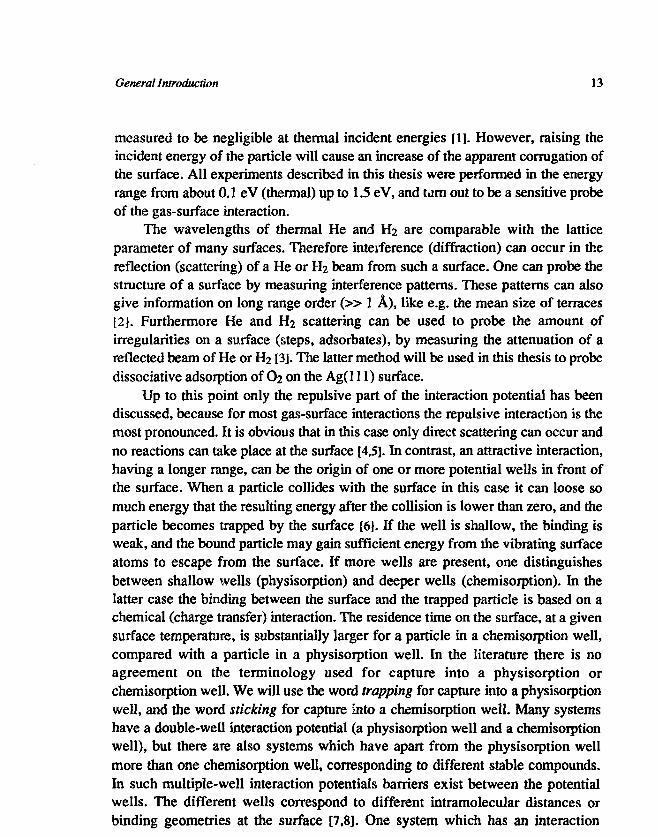
FIG.1.1: A schematical representation of an arbitrary particle-surface interactionpotential. Equipotential lines are drawn for energies from 0.1 eV up to 100 eV.
The nature of the interaction between a gas particle and an inert crystal surfaceiries strongly with the energy of the particle. At thermal energy (< 0.1 eV) airticle which collides with a crystal has its turning point relatively far away frome crystal, where the repulsive interaction spheres of the different outermostystal atoms overlap. The particle sees these atoms as one continuous solidructure, the surface. However, a high-energy particle can penetrate the first layerr the crystal surface when it hits the surface just between neighbouring surfaceoms. The equipotential lines of the particle-surface interaction potential indicatee position of the turning points for incident particles with the correspondinglergy. A schematic representation of a typical repulsive interaction potential isiown in figure 1.1, where equipotential lines have been drawn for differenttergies. The wave-like structure of the particle-surface interaction potential atgher energies is called corrugation of the surface. The corrugation does not onlyspend on the particle energy, but also on the lattice structure of the crystal surface.>r example, the Ag(110) surface plane has a ribbed structure, which results in awisiderable surface corrugation perpendicular to the ribs. The close-packedirface of Ag is the (111) plane, for which the corrugation of the surface is
General Introduction 13
measured to be negligible at thermal incident energies [1]. However, raising theincident energy of the particle will cause an increase of the apparent corrugation ofthe surface. All experiments described in this thesis were performed in the energyrange from about 0.1 eV (thermal) up to 1.5 eV, and tarn out to be a sensitive probeof the gas-surface interaction.
The wavelengths of thermal He and H2 are comparable with the latticeparameter of many surfaces. Therefore interference (diffraction) can occur in thereflection (scattering) of a He or H2 beam from such a surface. One can probe thestructure of a surface by measuring interference patterns. These patterns can alsogive information on long range order ( » 1 A), like e.g. the mean size of terraces[2]. Furthermore He and H2 scattering can be used to probe the amount ofirregularities on a surface (steps, adsorbates), by measuring the attenuation of areflected beam of He or H2 [3]. The latter method will be used in this thesis to probedissociative adsorption of O2 on the Ag(l 11) surface.
Up to this point only the repulsive part of the interaction potential has beendiscussed, because for most gas-surface interactions the repulsive interaction is themost pronounced. It is obvious that in this case only direct scattering can occur andno reactions can take place at the surface [4,5]. In contrast, an attractive interaction,having a longer range, can be the origin of one or more potential wells in front ofthe surface. When a particle collides with the surface in this case it can loose somuch energy that the resulting energy after the collision is lower than zero, and theparticle becomes trapped by the surface [6]. If the well is shallow, the binding isweak, and the bound particle may gain sufficient energy from the vibrating surfaceatoms to escape from the surface. If more wells are present, one distinguishesbetween shallow wells (physisorption) and deeper wells (chemisorption). In thelatter case the binding between the surface and the trapped particle is based on achemical (charge transfer) interaction. The residence time on the surface, at a givensurface temperature, is substantially larger for a particle in a chemisorption well,compared with a particle in a physisorption well. In the literature there is noagreement on the terminology used for capture into a physisorption orchemisorption well. We will use the word trapping for capture into a physisorptionwell, and the word sticking for capture into a chemisorption well. Many systemshave a double-well interaction potential (a physisorption well and a chemisorptionwell), but there are also systems which have apart from the physisorption wellmore than one chemisorption well, corresponding to different stable compounds.In such multiple-well interaction potentials barriers exist between the potentialwells. The different wells correspond to different intramolecular distances orbinding geometries at the surface [7,8]. One system which has an interaction
14 Chapter!
potential with mote than two wells is Oj on Ag, which we have chosen to investigatein more detail, and which will be described in this thesis.
The 02/Ag system has industrial importance, since epoxidation (oxilationwith only a single oxygen atom) of ethylene (C2H4 -» C2H4O) requires Ag as acatalyst [9]. The Ag surface acts in this case as a selector between two reaction paths.Without Ag the ethylene reacts in a common combustion reaction as follows:C2H4 + 3 O2 -> 2 CO2 + 2 H2O. If a Ag surface is available as a catalyst, the desiredepoxidation reaction can take place: C2H4 + V2 O2 -* C2H4O. In the latter reaction,the role of the Ag surface is the dissociative adsorption of O2 from the gas phase.Consequently the epoxidation reaction can be split into two steps, namely thecreation of an atomic oxygen layer on the Ag surface and afterwards the actualepoxidation reaction of an ethylene molecule with an oxygen atom. The importantparameters of the epoxidation reaction are under industrial circumstances (highpressure and high temperature) rather well known, although very little is known ofthe fundamental principles of the reaction. This especially holds for the first step,the generation of atomic oxygen on the Ag surface, of which one knows that itoccurs, but it is almost completely unknown which mechanism is responsible for it.
When one wants to study the dynamics of the interaction of O2 with a Agsurface, the first thing to investigate is the energy transfer in collisions of O2 withthe surface. The energy transfer is different for various angles of incidence, anglesof reflection, and translational energies. It can be probed efficiently by measuringangular and velocity distributions of the particles that are scattered from thesurface. To study direct inelastic scattering, molecular-beam scattering is theobvious technique. The apparatus we developed for these experiments is describedin chapter 2, and results of direct scattering are described in chapter 3. Informationon trapping-desorption dynamics can be derived from measurements oftranslational and internal energies of desorbing molecules. With time-of-flightmeasurements one can check the validity of known potential models, and theexistence of barriers before or between potential wells. Sticking cannot be studiedwith molecular-beam techniques directly, but it can be investigated by measuringthe attenuation of a reflected molecular-beam of He. Furthermore molecular-beamscattering can give additional information on the parameters which determinetrapping or sticking. Molecular-beam results for trapping of O2 are described inchapter 4, and results for sticking of O2 in chapter 5. In chapter 6 a three-dimensional potential energy surface of the O2/Ag(lll) interaction is presented.With this potential energy surface we are able to describe the scattering results ofoxygen from Ag(l 11) (Chapters 3-5) satisfactorily.
General Introduction IS
References
1 J.M. Home and D.R. Miller, Surf. Sci. 66, 365 (1977).2 M.G. Tenner, M.E.M. Spruit, E.W. Kuipers and A.W. Kleyn, Surf. Sci. 189/190,
656 (1987).3 B. Poelsema and G. Comst, Comm. At. Mol. Phys. 17, 37 (1985).4 J.A. Barker and D.J. Auerbach, Surf. Sci. Rep. 4, 1 (1985).5 R.B. Gerber, Chem. Rev. 87, 29 (1987).6 G. Comsa and R. David, Surf. Sci. Rep. 5, 145 (1985).7 J.W. Gadzuk, Comm. At. Mol. Phys. 16, 219 (1985).8 S. Holloway, J. Vac. Sci. Techn. A 5,476 (1987).9 R. A. van Santen and H.P.C.E. Kuipers, Adv. Catal. 35, 265 (1987).
16
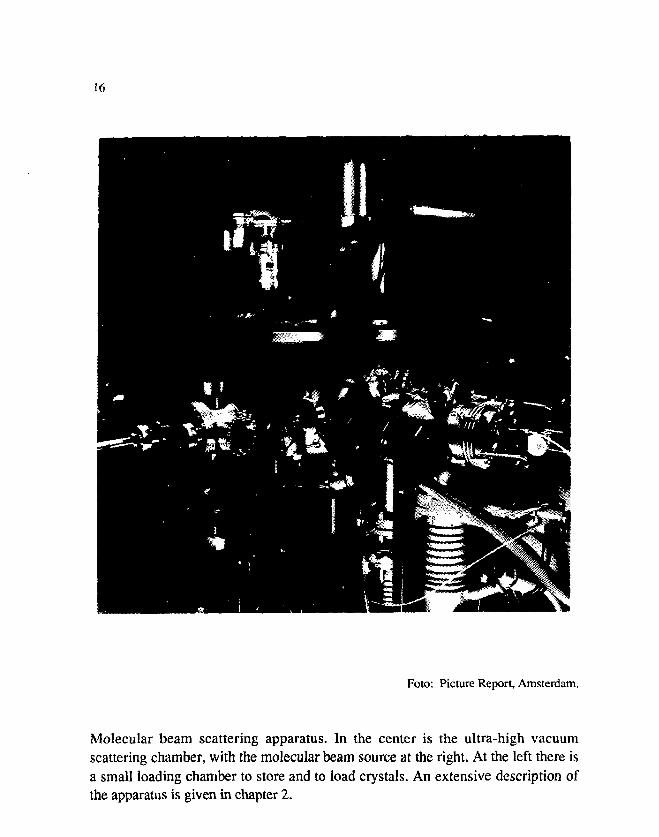
Foto: Picture Report, Amsterdam.
Molecular beam scattering apparatus. In the center is the ultra-high vacuumscattering chamber, with the molecular beam source at the right. At the left there isa small loading chamber to store and to load crystals. An extensive description ofthe apparatus is given in chapter 2.
17
CHAPTER 2
The experimental arrangementand data processing
A well-collimated supersonic beam of particles (Ar, CO, NO or O2), optionallyseeded in He to increase the translational energy, collides with a Ag(Ul) surface inUHV. The resulting angular and momentum distributions of the scattered particlesare measured using a rotatable quadrupole mass spectrometer and time-of-flight(TOF) techniques. A deconvolution procedure has been developed in order todetermine the velocity distribution of scattered particles.
1. Introduction
When one wants information on the reaction dynamics on surfaces, forexample in research on catalysis, the first thing to consider is the energy transfer incollisions of the molecules with the surface. Since energy transfer is different forvarious angles of incidence and angles of reflection, we also have to consider theangular distributions of scattered particles. Detailed study of such collisionsrequires well-defined conditions. To define the conditions as well as possible, weused a high-purity molecular beam, which is scattered from a Ag single crystal inan ultra-high-vacuurn (UHV) chamber. We have chosen the (111) surface planebecause it is the close-packed surface of Ag, and therefore gives smallestcorrugation effects at thermal conditions. The use of a supersonic molecular beamand a chopper with a short opening time, makes it possible to measure time-of-flight (TOF) distributions. An extensive description of the experimental setup isgiven in the next section.
A supersonic molecular beam has been used for the first time in 1927, but onlyafter 1951 it was developed into a commonly used beam technique [1]. Incomparison with the effusive molecular beam (molecular flow through an
18 Chapter 2
aperture), the supersonic (nozzle) beam has a much narrower velocity distribution.This often is, somewhat exaggerated, characterized as monoenergetic.Furthermore the supersonic beam has a higher intensity, and the beam particleshave a higher translational energy [2,3]. The latter holds especially for tr^iecules(di- and poly-atomic) which can increase their translational energy further, at thecost of energy from internal degrees of freedom (especially rotation and bending).In this case an additional advantage is the low rotational energy of diatomicmolecules in the beam. Collimation of a molecular beam is possible with conicalapertures (skimmers) [3].
Although the velocity distribution of our molecular beam is considerablynarrower than that of an effusive beam, there is still a substantial spread in time ofarrival of the molecules at the surface, compared to the total time-of-flight. As aresult of that the measured time-of-flight (and velocity) distribution does notrepresent the distribution of the scattered particles, but a convolution of incidentand exit distributions. Therefore we have to deconvolute the velocity distributionof the scattered particles out of the measured velocity distribution. For that purposewe developed a deconvolution procedure, which is described in section 3 of thischapter.
2. Experimental arrangement
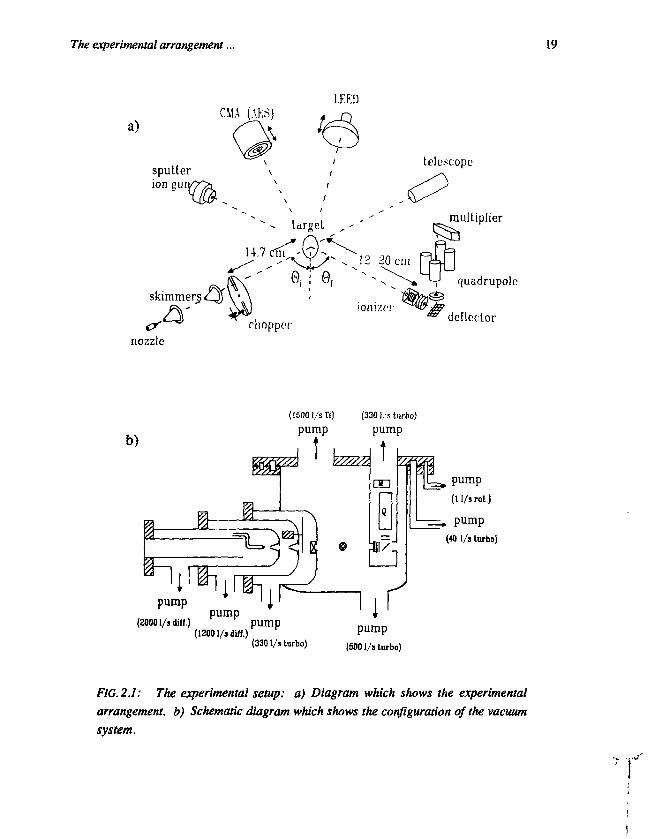
The experimental setup is shown in figure 2.1. Figure 2.1a shows theexperimental arrangement, while figure 2.1b shows the configuration of thevacuum system. The apparatus consists of a supersonic molecular-beam source, anUHV scattering chamber with the target, and a differentially pumped detectorchamber. The last two are bakable up to 200° C to reach a base pressure of about101 0 mbar.
The beam line starts with a heatable dc nozzle with a diameter of 100 u.m, usedwith input pressures up to 1 bar and temperatures up to 1000 K. The supersonicexpansion from the nozzle is collimated by two conical skimmers (top angle 30° and50°, respectively) with an aperture of 1 mm diameter each. The distance from thenozzle to the first skimmer is 10 mm, which is in our case the optimum formaximum beam intensity without influence of background gas. The secondskimmer, which is the real collimator, determines the opening angle of the beam. Inthis case the opening angle is 0.7°. Behind the second skimmer a chopper ismounted in a separate chamber to buffer the gasflow when the chopper is closed.The chopper is a rotating disk of 15 cm diameter with two slits of 1 mm. The
The experimental arrangement... 19
LEED
a)CMA (AKS
sputterion gui
skimmers
nozzle
target
U.7ctu
e, e,
chopper
telescope
'12 20 cm
ionizer
multiplier
•f quadrupole
deflector
(1500 1/sTi) (330 l/s turbo)
pump pump
pump
(2ooo i/s din.)
(11/s rot.)
. pump(40 1/3 turbo)
pump(5001/s turbo)
FIG. 2.1: The experimental setup; a) Diagram which shows the experimentalarrangement, b) Schematic diagram which shows the configuration of the vacuumsystem.
20 Chapter 2
chopper is driven by a water-cooled AC motor (Globe) which results in amaximum frequency of 400 Hz, giving beam pulses of 10 jus. A photodetector givesthe chopping reference signal. The total pressures with the beam on in the threebeam chambers are, respectively, 1-10-3 mbar in the nozzle chamber using a 20001/s unbaffled diffusion pump, 5 1 0 6 mbar in the chamber between the skimmersusing a 1200 1/s baffled diffusion pump, and 4-107 mbar in the chopper chamberwith running chopper using a 330 1/s turbopump which drains to the boosterdiffusion pump of the UHV chamber. Between the chopper chamber and the UHVchamber, a compressed air controlled valve is present which can be used todisconnect the beam line from the UHV system. The molecular beam can becharacterized by the speed ratio E (the velocity of the reference frame of the beam,divided by the most probable velocity of the particles within the beam ). In our caseH = 7 for He, and E = 20 for Ar at a nozzle pressure of 500 mbar. In that case theflux is 1-1015 particles/s behind the second skimmer. By seeding a relatively heavygas as Ar or O2 in He and optionally heating the nozzle, it is possible to raise theenergy of the heavier particles significantly.
The UHV scattering chamber is a 60 cm diameter and 50 cm-high stainless-steel cylindrical chamber pumped by a 500 1/s turbopump with a booster diffusionpump, and a 1500 1/s Ti sublimation pump with a liquid-nitrogen trap. The basepressure is in the order of 10-10 mbar with the beam off, increasing to about10-9 mbar with the beam on. In order to minimize the distance between the beamsource and the crystal, about 25 cm of the beam line is inside the scatteringchamber, as can be seen in figure 2.1b. The crystal is clamped on a manipulatormounted from the side of the chamber with which we first can rotate the angle ofincidence, and second the surface normal out of scattering plane (both with 0.5°accuracy). The exact three-dimensional translational positioning of the crystal isdone from outside the scattering chamber. Crystal preparation and analysistechniques available are ion sputtering, low-energy electron diffraction (LEED)(transparent type by Omicron), Auger electron spectroscopy (AES) (using acylindrical mirror analyzer by Riber), and obviously specular He scattering. LEEDand AES are mounted on draw-out manipulators (30 cm range) to get close to thecrystal without interfering with the detector. The detector is mounted in adifferentially pumped (3301/s turbopump) box which is connected to the cover ofthe scattering chamber. In order to rotate the detector around the crystal, the wholecover of the scattering chamber is rotatable. The cover is mounted on the chamberusing a bearing and the sealing is performed by three differentially pumped springloaded Teflon seals [4].
The experimental arrangement... 21
The detector is an Extranuclear quadripole mass filter with a 50 V electronimpact ionizer, an Einzel lens in front, and a Galileo channeltron behind. Theionizer works on the beam axis. To save space and to improve the removal ofnonionized particles, the quadrupole is mounted vertically, so before the Einzellens and behind the ionizer a parallel plate 90° deflector is used. The detector has anaperture of 3 mm diameter at a distance of the crystal which is adjustable from 12to 20 cm. Inside the detector chamber the partial pressure of the beam gas is twoorders of magnitude lower than in the crystal chamber. In the case of a perfectlyreflecting crystal surface the image of the beam shows up as a distribution with awidth of 2°, since the detector rotates around the crystal at a 17 cm distance, whilethe nozzle-detector distance is 45 cm. When the angle of incidence of the beam onthe surface becomes larger than 70°, the beam spot starts to hit the crystal mountingwhich causes an increase of the diffuse scattering component.
The output of the multiplier is charge amplified (Canberra type 2004) andsubsequently further amplified with noise reduction by amplifiers from Canberra(type 2110 and 1428A). The resulting pulses are counted with a high-speed digitalmultichannel analyzer (4 /xs resolution) which is connected via a CAMAC interfaceto a ^iPDP minicomputer. This fiPDP also controls the scanning of the angle ofreflection, making use of a high-resolution magnetic ruler (Sony). Deconvolutionand plotting are done on a VAX 11/785.
The crystal was cut with an orientation precision better than G.5° from acommercial silver single-crystal rod (Materials Research; purity > 99.99%). Thediameter of the crystal is 10 mm. Subsequently the crystal was mechanicallypolished by SiC paper with 100 pm grain and A12O3 with grain sizes down to 3 fjm,followed by a short dip into a 65% HNO3 solution. Then an electrochemical etchingwas performed using a solution of KCN and AgCN in water [5,6]. Between allpolishing and etching stadia the crystal was rinsed carefully with pure water andacetone. After the etching the crystal was mounted in the UHV chamber where itwas cleaned further by alternate sputtering (1 h at 600 eV and 600 K), andannealing (60 s at 700 K during the first cycle, to 5 s at 800 K during the last one).The temperature of the crystal was monitored with a Chromel/Alumelthermocouple clambed to the back of the crystal. The quality of the crystal waschecked with LEED and AES, and finally with specular He scattering. The lastmethod is most sensitive in detecting surface imperfections which show up asinterferences in the angular dependence [7,8] and flight time [9] of the specularlyreflected beam. Before and after every measurement, the surface was checked withspecular He scattering. When the width of the scattered peak was the same as that ofthe direct beam, within our accuracy, the surface was supposed to be clean.
22 Chapter 2
3. Data analysis
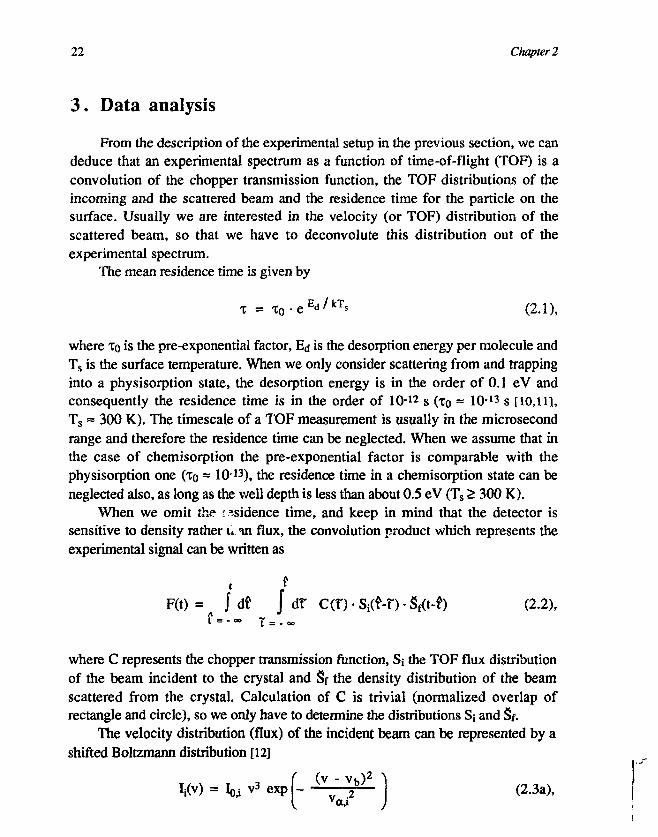
From the description of the experimental setup in the previous section, we candeduce that an experimental spectrum as a function of time-of-flight (TOF) is aconvolution of the chopper transmission function, the TOF distributions of theincoming and the scattered beam and the residence time for the particle on thesurface. Usually we are interested in the velocity (or TOF) distribution of thescattered beam, so that we have to deconvolute this distribution out of theexperimental spectrum.
The mean residence time is given by
T = T 0 - e E d / k T s (2.1),
where To is the pre-exponential factor, Ej is the desorption energy per molecule andTs is the surface temperature. When we only consider scattering from and trappinginto a physisorption state, the desorption energy is in the order of 0.1 eV andconsequently the residence time is in the order of 10-12 s (To = 10-13 s [10,11],Ts = 300 K). The timescale of a TOF measurement is usually in the microsecondrange and therefore the residence time can be neglected. When we assume that inthe case of chemisorption the pre-exponential factor is comparable with thephysisorption one (To ~ 10-13), the residence time in a chemisorption state can beneglected also, as long as the well depth is less than about 0.5 eV (Ts > 300 K).
When we omit the residence time, and keep in mind that the detector issensitive to density rather u.in flux, the convolution product which represents theexperimental signal can be written as
;F(t) = Jdt j df C<X)-SX{$-T) •&&-$) (2.2),
I = - oo t = -
where C represents the chopper transmission function, Si the TOF flux distributionof the beam incident to the crystal and Sf the density distribution of the beamscattered from the crystal. Calculation of C is trivial (normalized overlap ofrectangle and circle), so we only have to determine the distributions Sj and Sf.
The velocity distribution (flux) of the incident beam can be represented by ashifted Boltzmann distribution [12]
( (V - V K ) 2 \Ii(v) = hi v3 exp - 2
b ; (2.3a),
I v«.' )
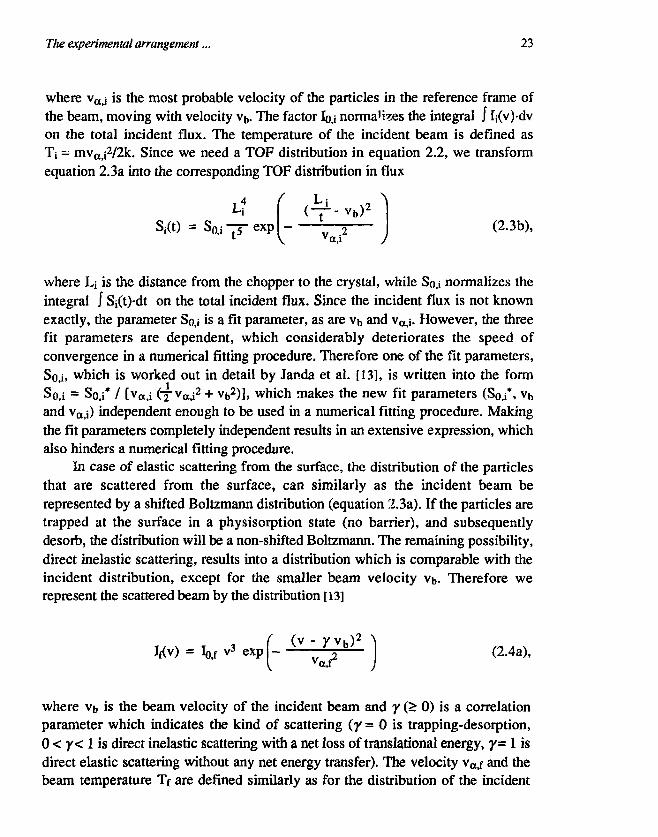
The experimental arrangement... 23
where va>j is the most probable velocity of the particles in the reference frame ofthe beam, moving with velocity V(,. The factor Io,i normalises the integral / I;(v)-dvon the total incident flux. The temperature of the incident beam is defined asTj - mvttii
2/2k. Since we need a TOF distribution in equation 2.2, we transformequation 2.3a into the corresponding TOF distribution in flux
{ ^Sift) = S0,i-T exp —2 (2.3b),
1 V va,i /a,i
where Lj is the distance from the chopper to the crystal, while So,i normalizes theintegral I Si(t)-dt on the total incident flux. Since the incident flux is not knownexactly, the parameter So,i is a fit parameter, as are Vb and vaij. However, the threefit parameters are dependent, which considerably deteriorates the speed ofconvergence in a numerical fitting procedure. Therefore one of the fit parameters,So,i, which is worked out in detail by Janda et al. [13], is written into the formSo,i = So,i* / [vttji (~v a i 2 + Vb2)], which makes the new fit parameters (So/, vb
and vaij) independent enough to be used in a numerical fitting procedure. Makingthe fit parameters completely independent results in an extensive expression, whichalso hinders a numerical fitting procedure.
In case of elastic scattering from the surface, the distribution of the particlesthat are scattered from the surface, can similarly as the incident beam berepresented by a shifted Boltzmann distribution (equation 2.3a). If the particles aretrapped at the surface in a physisorption state (no barrier), and subsequentlydesorb, the distribution will be a non-shifted Boltzmann. The remaining possibility,direct inelastic scattering, results into a distribution which is comparable with theincident distribution, except for the smaller beam velocity vt>. Therefore werepresent the scattered beam by the distribution [13]
= Io,f v3 expf- (V y*p) ) (2.4a),
where Vb is the beam velocity of the incident beam and y (> 0) is a correlationparameter which indicates the kind of scattering (y = 0 is trapping-desorption,0 < y< 1 is direct inelastic scattering with a net loss of translational energy, y= 1 isdirect elastic scattering without any net energy transfer). The velocity vaif and thebeam temperature Tf are defined similarly as for the distribution of the incident
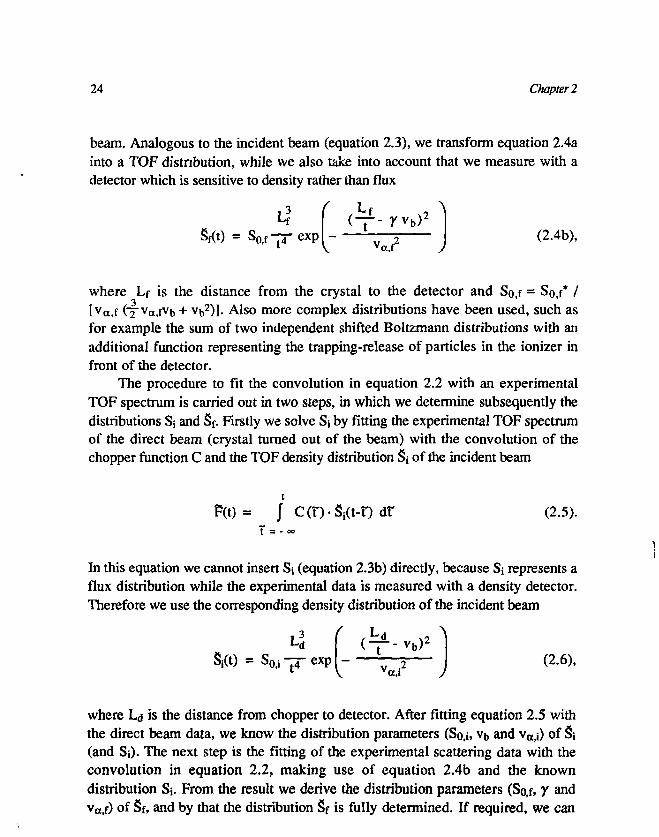
24 Chapter 2
beam. Analogous to the incident beam (equation 2.3), we transform equation 2.4ainto a TOF distribution, while we also take into account that we measure with adetector which is sensitive to density rather than flux
= SOif — exp(- ^ J (2.4b),
where Lf is the distance from the crystal to the detector and So,f = So,f* /lvH,f (~va>fVb + Vb2)]. Also more complex distributions have been used, such asfor example the sum of two independent shifted Boltzmann distributions with anadditional function representing the trapping-release of particles in the ionizer infront of the detector.
The procedure to fit the convolution in equation 2.2 with an experimentalTOF spectrum is carried out in two steps, in which we determine subsequently thedistributions Si and Sf. Firstly we solve Sj by fitting the experimental TOF spectrumof the direct beam (crystal turned out of the beam) with the convolution of thechopper function C and the TOF density distribution Sj of the incident beam
F(t) = J C(T)-Si(t-r)dr (2.5).
In this equation we cannot insert Si (equation 2.3b) directly, because S, represents aflux distribution while the experimental data is measured with a density detector.Therefore we use the corresponding density distribution of the incident beam
Si(t) = Sa i-4" exp — j (2.6),2
where L<j is the distance from chopper to detector. After fitting equation 2.5 withthe direct beam data, we know the distribution parameters (So,i, Vb and vai;) of Si(and Si). The next step is the fitting of the experimental scattering data with theconvolution in equation 2.2, making use of equation 2.4b and the knowndistribution Si. From the result we derive the distribution parameters (So,f, y andva,f) of Sf, and by that the distribution Sf is fully determined. If required, we can
The experimental arrangement... 25
simply rewrite the TOF distribution into a velocity or an energy distribution, andwe can also rewrite those density distributions into flux distributions.
The fit procedure itself is a modified Marquardt nonlinear least squaresminimization routine [14], which has been implemented into a program whichcontains the experimental geometry. The Marquardt algorithm is a very fastconverging minimization routine which combines the advantages of both thesteepest-descent method [15], which works well far away from a minimum, and theNewton minimization method, which works well in the vicinity of a minimum [16].As long as there are only a few independent fit parameters, as is the case with asingly shifted Boltzmann distribution, the value of the final least squares sum y} andchecking the fit by eye give sufficient indication on the exactness of the calculatedminimum. The errorbars are small and their size can easily be estimated. In the caseof either many or dependent fit parameters, the probability of ending in a wronglocal minimum is not imaginary. In this case variation of the starting criteria ismostly enough to evade local minima, but the errorbars of the calculated valuesmight be considerable when there are dependences between different fitparameters.
References
1 A. Kantrowitz and J. Gray, Rev. Sci. Insirum. 22, 328 (1951).2 J.B. Anderson and R.P. Andres, in: Advances in Atomic and Molecular Physics, i
(Edited by Bates and Estermann) 1, 345 (1965). '3 J.B. Anderson, in: Gasdynamics 4, Molecular Beams and low density Gasdynamics,
Edited by P.P. Wegener (1974).4 D.J.Auerbach, C.A.Becker, J.P.Cowin and L.Wharton, Rev. Sci. Instrum. 49, 1518
(1978).5 L.Venema, Private communication.6 WJ.McG.Tegart, The Electrolytic and Chemical Polishing of Metals, (Pergamon,
New York, 1959).7 U.Linke and B.Poelsema, J. Phys. E: Sci. Instrum. 18, 26 (1985).8 J.Lapujoulade, Surf. Sci. 108, 526 (1981).9 M.G.Tenner, M.E.M.Spmit, E.W.Kuipers and A.W.Kleyn, Surf. Sci. 189/190, 656
(1987).10 J.H. de Boer, in: Advances in Catalysis, Edited by W.G. Frankenburg et al. (Academic
Press, New York, 1956); H. Ibach, W. Erley and H. Wagner, Surf. Sci. 92, 29 (1980).11 G.A. Somorjai, Chemistry in two dimensions: Surfaces (Cornell University Press, Ithaca,
1981).12 J.B. Anderson, Gas Dynamics 4, Molecular beam and low density gas dynamics, Edited
by P.P. Wegener (1974).13 K.C. Janda, J.E. Hurst, C.A. Becker, J.P. Cowin, D.J. Auerbach and L. Wharton, J.
26 Chapter 2
Chem. Phys. 72, 2403 (1980).14 IMSL Math/Library, routine UNLSF (IMSL, Houston, 1987).15 D. Marquardt, SIAM J. Appl. Math. 11,431 (1963).16 P.R. Bevington, Data Reduction and Error Analysis for the Physical Sciences (McGraw-
Hill, New York, 1969).

27
CHAPTER 3
Direct inelastic scattering ofsuper thermal Ar, CO, NO and O2
from Ag(lll)
A molecular beam with translational energies ranging from 0.07 up to 1.6 eV, isscattered from a Ag(lll) surface. From the measured angular-TOF spectra wehave determined the corresponding angular distributions and mean translationalenergies of the scattered particles. At an incident energy of about 1.6 eV and anangle of incidence of 38°, we find that the angular distribution o/C>2 is much morebroadened than it is for Ar, CO and NO, and that the translational energy loss of02is substantially more than found recently for NO {12J. Both the enhanced width andthe energy loss scale with normal energy. The enhanced width can be explained byscattering from a corrugated surface. The surface corrugation for O2 is larger thanfor e.g. Ar or NO, and sets in at normal energies of a few tenth of an eV. Althoughwe show that modified cube-models are useful, we also have compared ourexperimental results with classical trajectory calculations. The differences inenergy loss between Ar, CO, NO and O2, indicate that except for collision inducedinternal excitation also electronic effects may be important.
1. Introduction
Molecular-beam scattering from surfaces is well suited to study dynamics ofgas surface interactions [3,4]. When a molecular beam collides with a surface, partof the incident molecules may be trapped, while the remainder is (in)elasticallyscattered. The residence time of trapped molecules on the surface, is determined bythe well depth of the molecule-surface interaction potential and the temperature of
28 Chapter 3
the surface. If this time is long enough, the molecules accomodate to the surface anddesorb, after some time, in a cosine to the power n (n > 0) shaped angulardistribution around the surface normal [5]. Because desorbing molecules, incontrast to directly scattered molecules, do not keep memory of their incident speedand direction, and because they have a velocity distribution which is a function ofsurface temperature, we can distinguish between desorbing molecules and directlyscattered molecules by measuring the angular and velocity distributions. In thiswork we will restrict ourselves to direct scattering. Trapping-desorption will bedescribed elsewhere [6]. The build up of a stable chemisorbed layer (sticking), doeshardly occur for the present systems, but cannot be excluded in general [7,8].
In the thermal and superthermal energy range, with incident energies Ej lowerthan about 2 eV, most phenomena in molecular scattering scale with the normalenergy En = Ej-cos2©;, where ©j is the angle of incidence with respect to the surfacenormal. Examples are the width of the angular distribution [9-12], rotationalexcitation [13-15], vibrational excitation [16] and sticking [17]. An exception is thesticking of N2 on W(l 10) that scales with Ej, which however is most likely due to aprecursor state in the reaction path [18]. The scaling with En suggests that thesurface can be assumed to be flat and that the observed angular broadening is due tothermal motion of surface atoms. The flatness of close-packed metal surfaces isconfirmed by He and H2 scattering [19], where one observed that the higher (> 1)order diffraction peaks are some orders of magnitude smaller than the specularlyreflected peak. We will present experimental and theoretical results which clearlyshow broadening of angular distributions for e.g. O2 scattering from Ag(l 11) thatis due to strong surface corrugation, much stronger than we observe for Ar. Thisindicates that corrugation of the close-packed Ag( l l l ) surface can be importanteven at energies just above thermal. At substantial higher energies and on non-close-packed surfaces, corrugation can be seen for other systems as well [20-22].
At thermal energies relatively heavy molecules, as for example Ar, producebroad lobular angular scattering distributions, compared to He. One has found thatthe angular width of these distributions, and the angular shift of the top away fromthe specular position, change as a function of incident energy [23]. In the case of Ar,the angular distribution of the scattered signal first becomes narrower atsuperthermal incident energies and then becomes broader again when incidentenergies increase further up to about 20 eV [11]. Further investigations were, untilnow, restricted to either low incident energies (lower than 1 eV) in severalscattering systems [3,24-26], or noble gas scattering at various incident energies[3,27]. Early state resolved experiments on NO scattering from Ag(l l l ) , makinguse of laser-induced fluorescence (LIF) [13,28,29], showed that scattered NO was
Direct inelastic scattering ... 29
internally excited. Further state resolved experiments on NO/Ag(ll 1), making useof multi-photon-ionization (MPI), showed the precise energy balance [1,30]. Stateresolved experiments on especially O2 are not feasible and that may be the reasonthat O2 scattering from Ag(l l l ) was not subject of extensive investigation (exceptfor thermal O2 [24]), although we can derive quite some information on internalexcitation of O2 from angular-TOF measurements and comparison with othermolecules.
As the surface appears to be flat the most frequently used model, to explainbeam scattering, is the rather simple hard-cube model [23,31], which appears towork well at thermal energies, in spite of its simplicity. In the cube model thesurface is represented by a 2-dimensional matrix of vibrating flat cubes. Thesurface cubes, which can vibrate only perpendicular to the surface, have a gas-surface interaction potential which is either a hard-wall potential, in which case onespeaks about the hard-cube model [23,32], or a more realistic interaction potential,in which case one speaks about the soft-cube model [23,33]. In the hard-cube modelthe collision is impulsive and therefore the collision time is infinitesimally small.As a result of that, the energy transfer from molecule to surface is usuallyoverestimated. However, a finite collision time, which is the most importantconsequence of the soft-cube model, can in the hard-cube model be simulated byincreasing the cube mass, because the latter simulates the larger number of surfaceatoms that participate in the collision, and therefore is able to simulate bothenhanced elasticity and surface recoil. Since the most important advantages of thesoft-cube model can be simulated in the hard-cube model, the latter is preferredbecause of its simplicity. The hard-cube model has been extended with a corrugatedsurface [34]. Furthermore the hard-cube model has been modified to include a rigidrotor (hard ellipsoid) instead of a spherical particle [35-37], although this is nevercombined with the corrugated surface extension. The hard-cube model, and the 2-dimensional models based on it, can only explain in-plane scattering. Moresophisticated models are based on 3-dimensional classical trajectory calculations[3,4,38]. Both methods will be used to analyze the data presented in this paper.
The next section briefly describes the experimental setup. Section 3 reports theexperimental results and describes the comparison of experiments with the hard-cube model. Furthermore some results of extensive classical trajectory calculationsare shown. Section 4 discusses surface corrugation and energy transfer, making useof modified hard-cube models and classical trajectory calculations. Finally section5 presents the conclusions.
30 Chapter 3
2. Experimental
The experimental setup is described in detail elsewhere [39]. A shortdescription will be given here. A supersonic molecular beam is produced by a100 /un heatable dc quartz nozzle. Behind two skimmers the beam is chopped intopulses of about 15 /zs by a rotating disc chopper situated 15 cm in front of thetarget. The use of a chopper gives the possibility to perform time-of-flightmeasurements with a resolution of 2 jus. By seeding the beam gas in He, andoptionally heating the nozzle, it is possible to raise the translational energy of thebeam molecules. The beam is directed with a variable angle of incidence 0j to thetarget, which is a Ag(ll l) single crystal, mounted on a two axis goniometer in thecentre of a UHV chamber. The Ag(l 11) crystal is sputtered with 500 eV Ar+ ionsand annealed at 780 K before the experiments. The quality of the crystal surface canbe checked with specular He-scattering, Auger electron spectroscopy (AES) andlow energy electron diffraction (LEED). The crystal was clean as seen by AES, andexhibited a clear lx l LEED pattern. Comparing He scattering with light scattering(He-Ne laser), showed that the misalignment of our crystal surface was less than 1 °.The surface was checked with He diffraction techniques and was shown to be notcompletely free of defects, although the quality of the crystal was increasing withtime. The incident as well as the scattered particles, are detected by a differentiallypumped quadrupole mass spectrometer (QMS), which has an opening angle of 2°, ata distance of 18 cm from the target crystal. The angle of reflection ©f, measuredwith respect to the surface normal, can be changed by rotating the detector aroundthe crystal. The construction of the apparatus is such, that the lowest available angleof reflection is (60° - angle of incidence).
The velocity and energy of the detected particles are determined from theTOF measurements. By assuming that the TOF profiles of both the incident beamand the scattered beam are represented by a shifted Boltzmann distribution [39,40],we are able to fit the TOF profile, making use of a Marquardt nonlinear least-squares fitting algorithm [6]. Because our detector is sensitive to density rather thanflux, we transform the calculated (density) fit into a flux profile and then we areable to determine the mean translational energy and momentum of the beam.
Direct inelastic scattering... 31
3. Results
3.1 Experimental
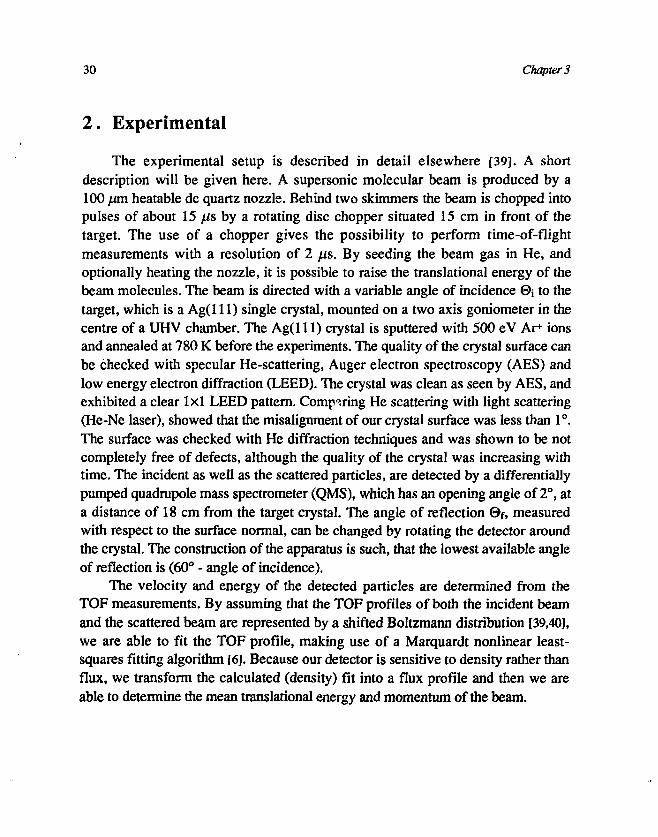
Figure 3.1(a) shows a typical 3-dimensional angular-TOF spectrum, in thiscase the scattering spectrum of a room-temperature beam of O2 seeded in He, withan angle of incidence of 61°. The angle of incidence, @i, and the angle of reflection,©f, are measured with respect to the surface normal. The 3-dimensional spectrum isbuilt up by a stepwise scanning through the angle of reflection, while measuring a2-dimensional TOF spectrum at each of these reflection angles. The spectra whichare shown in this work are built up by taking angular steps of 5° and measuringTOF with channels of 10 fis. To be able to obtain more quantitative informationfrom such a 3-dimensional spectrum, it is also plotted in a topographical way, asshown in figure 3.1(b). In this topographical plot contour lines are drawn whichrepresent 30%, 50% (corresponding to the full-width-half-maximum), 70% and90% of the peak maximum, respectively.
a) 500
300 o
CO
FIG. 3.1: A typical (angular-TOF) spectrum of a seeded room-temperature O2 beam(&i = 61 °, Ts = 600 K) as a function of the total flight time in the apparatus and thefinal scattering angle, a) Plotted as a common 3-dimensional plot, b) The same dataplotted topographically, with contour lines at 30%, 50%, 70% and 90% of themaximum value in the peak.
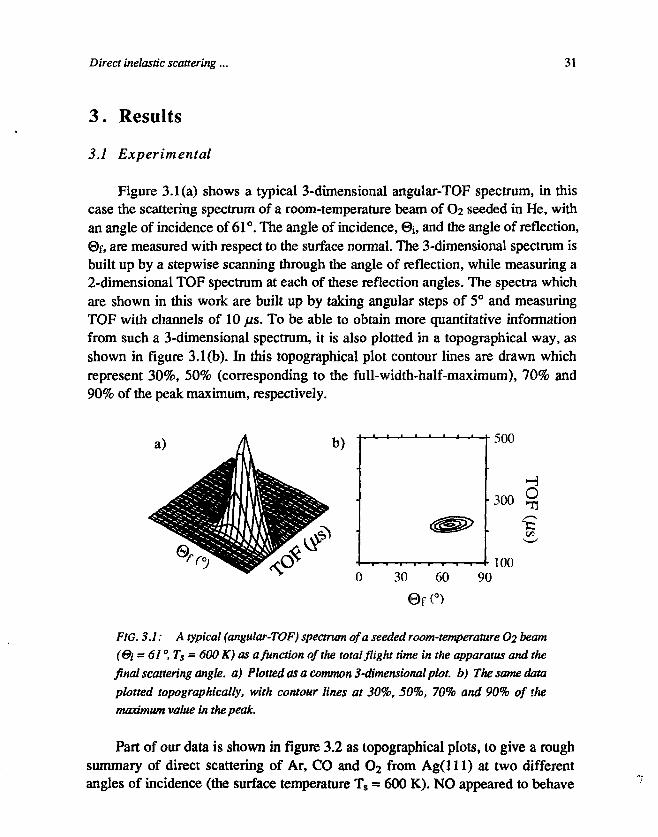
Part of our data is shown in figure 3.2 as topographical plots, to give a roughsummary of direct scattering of Ar, CO and O2 from Ag( l l l ) at two differentangles of incidence (the surface temperature Ts = 600 K). NO appeared to behave
32 Chapter 3
600
400
200
600
400
200 •
CO
40 60 80 20 40 60 80
i = 0.52eVi = 1.68 eV
Ei = 0.10eV
Ei = 0.42eVEi=1.43eV
Ei = 0.10eV
Ei = 0.47 eVEi=1.56eV
FIG. 3.2; Topographically plotted experimental angular-TOF spectra ofAr, CO and
O2, scattered from a 600 K Ag(lll) surface. Contour lines are drawn at 50%
(FWHM) and 90% of the peak maximum. The vertical dashed lines show the specular
positions. The horizontal dotted lines show the peak position in the incident TOF
profiles. The mean incident translational energy is given at the right of the
corresponding dotted line.

Direct inelastic scattering ... 33
almost the same as CO and is therefore not shown in this figure. For the sake ofclarity contour lines are drawn at 50% (FWHM) and 90% of peak maximum only,so that individual contour lines are locally fairly straight and contour lines ofneighbouring peaks do not overlap. The vertical dashed lines indicate the specularangle of reflection (0f = 0,). For each spectrum, the position of the top of the TOFprofile of the corresponding incident beam, is indicated by a dotted horizontal line,while the mean translational energy of the given incident beam is shown at the rightof the dotted line.
When we assume that the surface is flat, we can use the hard-cube model todescribe the scattering data. For particles which approach the surface cubes with alow translational energy, the velocity of the particles is comparable with thevelocity of the thermally vibrating cube, and there will be a large spread in energytransfer between molecule and cube, which show up as a broad angulardistribution. Since the incident particles have a larger probability to collide with anupwards moving cube, compared to a downwards moving cube, gain of normalenergy has largest probability, and the peak of the angular distribution is shiftedinto the direction of the surface normal. The shift in scattering angle by gain ofnormal energy is accompanied by a decrease in TOF, which causes slanting ofcontour lines in angular-TOF spectra as shown in figure 3.2. The higher thetranslational energy of the incident particles, the more we enter into the situationthat the particles are moving fast compared to the velocity of the vibrating cube,and therefore have the tendency to lose normal energy with a small spread inenergy transfer. This results in a narrow angular distribution which is peaked at anangle of reflection that is larger than the specular angle of reflection (0f = ©0. Infigure 3.2 we can see that the Ar results, especially those at ©i = 61°, are in goodqualitative agreement with the behaviour which is predicted by the hard-cubemodel. This suggests that the flat-surface approximation is valid for Ar onAg(l l l ) . Furthermore, the results of our Ar experiment' can be compared withearlier work [11,23,24,41] and they appear to be in good agreement.
We have seen that the hard-cube model can rather well describe the behaviourof our Ar experiments, as well as other Ar scattering experiments using varioussurfaces and energies up to about 1 eV [23,27,31,39,40]. From the assumptions of thehard-cube model, one can derive, that the mean translational energy (Ef) of thescattered particles is a linear function of the mean translational energy (Ej) of theincident particles [31]: (Ef) = a, (Ej) + as <ES), where <ES) = 2kTs, with Ts thetemperature of the surface and (X\ and Og constants depending only on 0j , the gasparticle mass and the cube mass. The mean (in-plane) translational energy (Ef) ofour spectra is determined by first integrate the angular-TOF spectra, shown in
34 Chapter 3
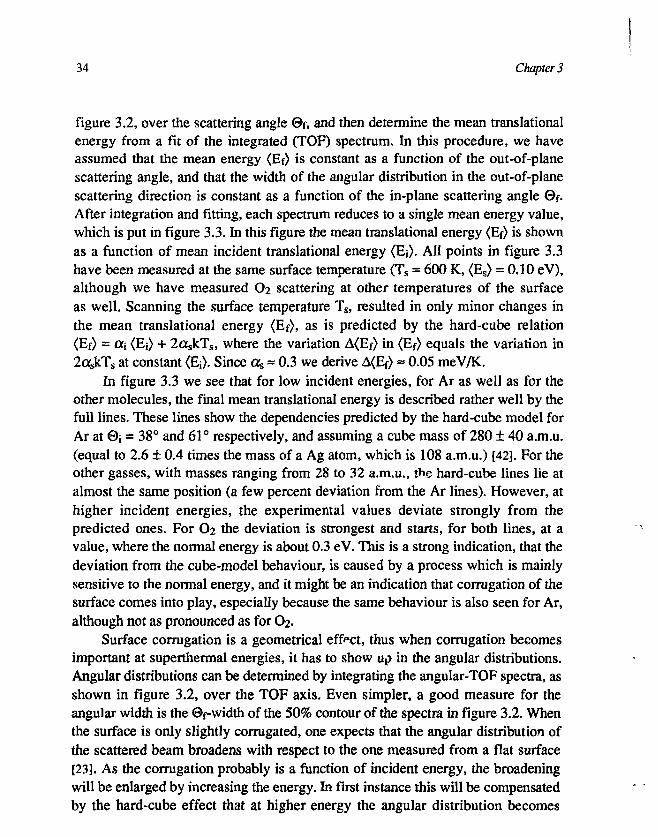
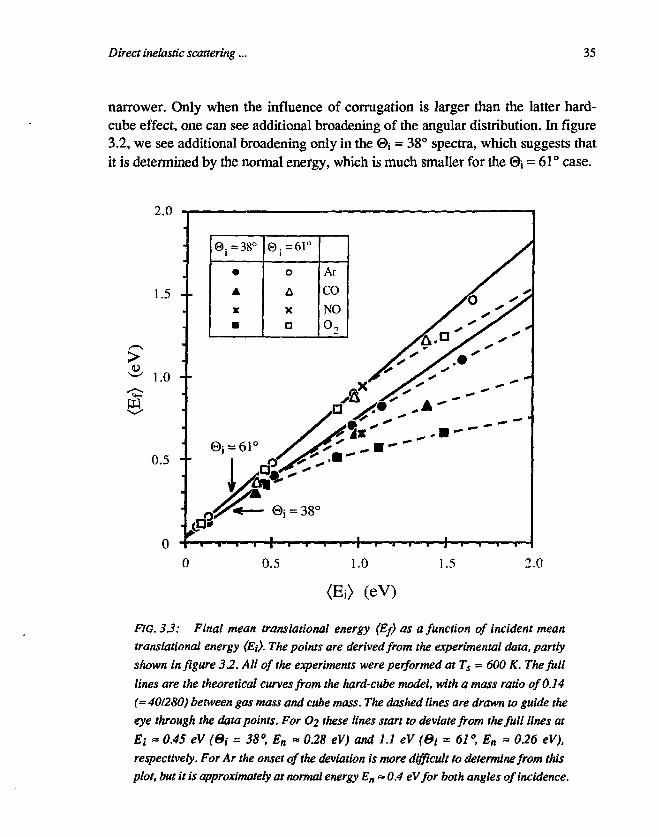
figure 3.2, over the scattering angle ©f, and then determine the mean translationalenergy from a fit of the integrated (TOF) spectrum. In this procedure, we haveassumed that the mean energy (Ef) is constant as a function of the out-of-planescattering angle, and that the width of the angular distribution in the out-of-planescattering direction is constant as a function of the in-plane scattering angle Of.After integration and fitting, each spectrum reduces to a single mean energy value,which is put in figure 3.3. In this figure the mean translational energy (Ef) is shownas a function of mean incident translational energy (Ei). All points in figure 3.3have been measured at the same surface temperature (Ts = 600 K, (Es) = 0.10 eV),although we have measured O2 scattering at other temperatures of the surfaceas well. Scanning the surface temperature Ts, resulted in only minor changes inthe mean translational energy (Ef), as is predicted by the hard-cube relation(Ef) = (Xi (Ej) + 2askTs, where the variation A(Ef) in (E{) equals the variation in2OskTs at constant <E;). Since (%, = 0.3 we derive A(Ef> « 0.05 meV/K.
In figure 3.3 we see that for low incident energies, for Ar as well as for theother molecules, the final mean translational energy is described rather well by thefull lines. These lines show the dependencies predicted by the hard-cube model forAr at @i = 38° and 61° respectively, and assuming a cube mass of 280 ± 40 a.m.u.(equal to 2.6 ± 0.4 times the mass of a Ag atom, which is 108 a.m.u.) [42]. For theother gasses, with masses ranging from 28 to 32 a.m.u., the hard-cube lines lie atalmost the same position (a few percent deviation from the Ar lines). However, athigher incident energies, the experimental values deviate strongly from thepredicted ones. For O2 the deviation is strongest and starts, for both lines, at avalue, where the normal energy is about 0.3 eV. This is a strong indication, that thedeviation from the cube-model behaviour, is caused by a process which is mainlysensitive to the normal energy, and it might be an indication that corrugation of thesurface comes into play, especially because the same behaviour is also seen for Ar,although not as pronounced as for O2.
Surface corrugation is a geometrical effect, thus when corrugation becomesimportant at superthermal energies, it has to show up in the angular distributions.Angular distributions can be determined by integrating the angular-TOF spectra, asshown in figure 3.2, over the TOF axis. Even simpler, a good measure for theangular width is the ©f width of the 50% contour of the spectra in figure 3.2. Whenthe surface is only slightly corrugated, one expects that the angular distribution ofthe scattered beam broadens with respect to the one measured from a flat surface[23]. As the corrugation probably is a function of incident energy, the broadeningwill be enlarged by increasing the energy. In first instance this will be compensatedby the hard-cube effect that at higher energy the angular distribution becomes
Direct inelastic scattering... 35
narrower. Only when the influence of corrugation is larger than the latter hard-cube effect, one can see additional broadening of the angular distribution. In figure3.2, we see additional broadening only in the ©i = 38° spectra, which suggests thatit is determined by the normal energy, which is much smaller for the 0j = 61° case.
2.0
1 . 5 • •
1.0 - -
0.5 - •
0;=38°
•
X
•
0.=6P
o
X
a
Ar
CO
NO
°2
0.5 1.0 1.5 2.0
(eV)
FIG. 3.3: Final mean transiational energy (Ef) as a function of incident meantransiational energy {Ei}. The points are derived from the experimental data, partlyshown in figure 32. All of the experiments were performed at Ts = 600 K. The fulllines are the theoretical curves from the hard-cube model, with a mass ratio of 0.14(~ 401280) between gas mass and cube mass. The dashed lines are drawn to guide theeye through the data points. For Oi these lines start to deviate from the full lines atEi - 0.45 eV (Si = 38°, En « 0.28 eV) and 1.1 eV (Bi = 61°, En - 0.26 eV),respectively. For Ar the onset of the deviation is more difficult to determine from thisplot, but it is approximately at normal energy En = 0.4 eVfor both angles of incidence.
36 Chapter 3
200
100
200
tuO loo
200
100 •
40 60 80 20 40 60 80 20 40 60 80
En = 0.72 cV
f-:,, = d.5
= (I.X.I L-V
= 0.()2 cV
F.,, = O.rW eV E,, = 0.37 eV
Ei =1.56 eV
• = 61°
Ei= 1.16 cV
Experimemal
e, = 43
l-i --.(I.1)I cV
0i = 3S-
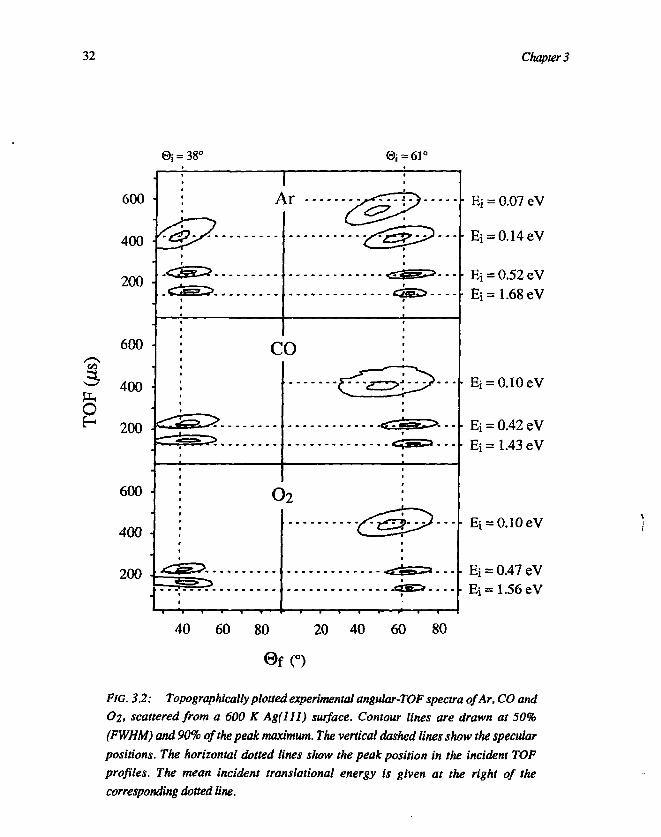
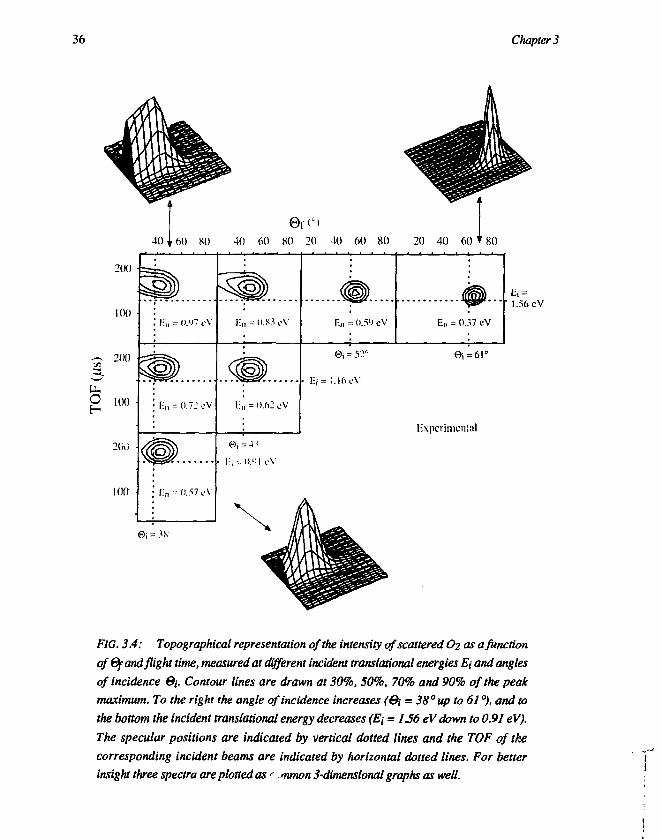
FIG. 3.4: Topographical representation of the intensity of scattered O2 as a function
of 6f and flight time, measured at different incident translational energies Et and angles
of incidence &i. Contour lines are drawn at 30%, 50%, 70% and 90% of the peak
maximum. To the right the angle of incidence increases (&i = 38" up to 61"), and to
the bottom the incident translational energy decreases (Ej = U6eV down to 0.91 eV).
The specular positions are indicated by vertical dotted lines and the TOF of the
corresponding incident beams are indicated by horizontal dotted lines. For better
insight three spectra are plotted as <• nunon 3-dimensional graphs as well.
Direct inelastic scattering ... 37
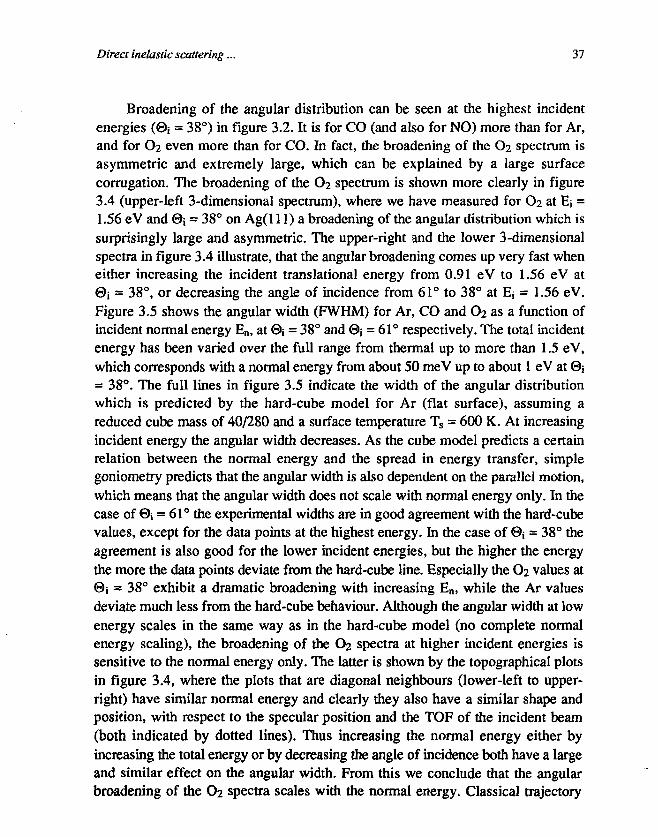
Broadening of the angular distribution can be seen at the highest incidentenergies (0i = 38°) in figure 3.2. It is for CO (and also for NO) more than for Ar,and for O2 even more than for CO. In fact, the broadening of the O2 spectrum isasymmetric and extremely large, which can be explained by a large surfacecorrugation. The broadening of the O2 spectrum is shown more clearly in figure3.4 (upper-left 3-dimensional spectrum), where we have measured for O2 at E; =1.56 eV and 0i = 38° on Ag(l 11) a broadening of the angular distribution which issurprisingly large and asymmetric. The upper-right and the lower 3-dimensionalspectra in figure 3.4 illustrate, that the angular broadening comes up very fast wheneither increasing the incident translational energy from 0.91 eV to 1.56 eV at@i = 38°, or decreasing the angle of incidence from 61° to 38° at E; = 1.56 eV.Figure 3.5 shows the angular width (FWHM) for Ar, CO and O2 as a function ofincident normal energy En, at 0j = 38° and 0j = 61° respectively. The total incidentenergy has been varied over the full range from thermal up to more than 1.5 eV,which corresponds with a normal energy from about 50 meV up to about 1 eV at 0j= 38°. The full lines in figure 3.5 indicate the width of the angular distributionwhich is predicted by the hard-cube model for Ar (flat surface), assuming areduced cube mass of 40/280 and a surface temperature Ts = 600 K. At increasingincident energy the angular width decreases. As the cube model predicts a certainrelation between the normal energy and the spread in energy transfer, simplegoniometry predicts that the angular width is also dependent on the parallel motion,which means that the angular width does not scale with normal energy only. In thecase of ©i = 61° the experimental widths are in good agreement with the hard-cubevalues, except for the data points at the highest energy. In the case of 0 , = 38° theagreement is also good for the lower incident energies, but the higher the energythe more the data points deviate from the hard-cube line. Especially the O2 values at©i = 38° exhibit a dramatic broadening with increasing En, while the Ar valuesdeviate much less from the hard-cube behaviour. Although the angular width at lowenergy scales in the same way as in the hard-cube model (no complete normalenergy scaling), the broadening of the O2 spectra at higher incident energies issensitive to the normal energy only. The latter is shown by the topographical plotsin figure 3.4, where the plots that are diagonal neighbours (lower-left to upper-right) have similar normal energy and clearly they also have a similar shape andposition, with respect to the specular position and the TOF of the incident beam(both indicated by dotted lines). Thus increasing the normal energy either byincreasing the total energy or by decreasing the angle of incidence both have a largeand similar effect on the angular width. From this we conclude that the angularbroadening of the O2 spectra scales with the normal energy. Classical trajectory
38 Chapter 3
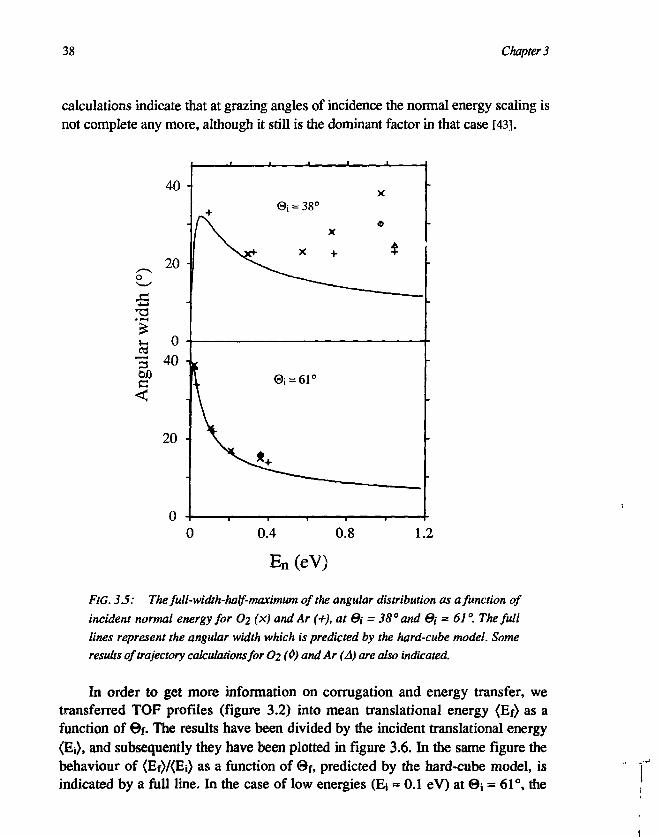
calculations indicate that at grazing angles of incidence the normal energy scaling isnot complete any more, although it still is the dominant factor in that case [43].
0
FIG. 35: The full-width-half-maximum of the angular distribution as a function ofincident normal energy for O2 (x) and Ar (+), at 0i = 38° and ©, = 61 °. The fulllines represent the angular width which is predicted by the hard-cube model. Someresults of trajectory calculations for O2 (0) and Ar (A) are also indicated.
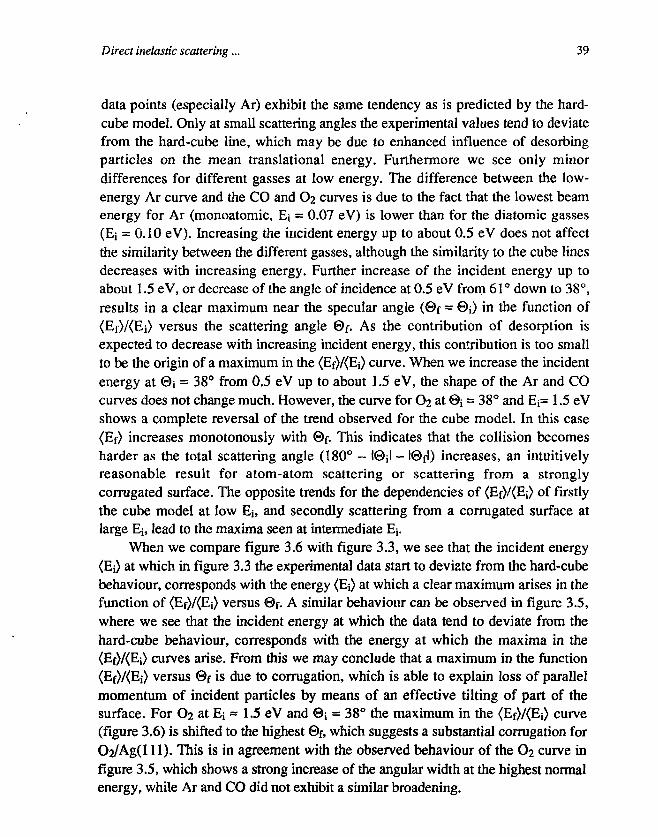
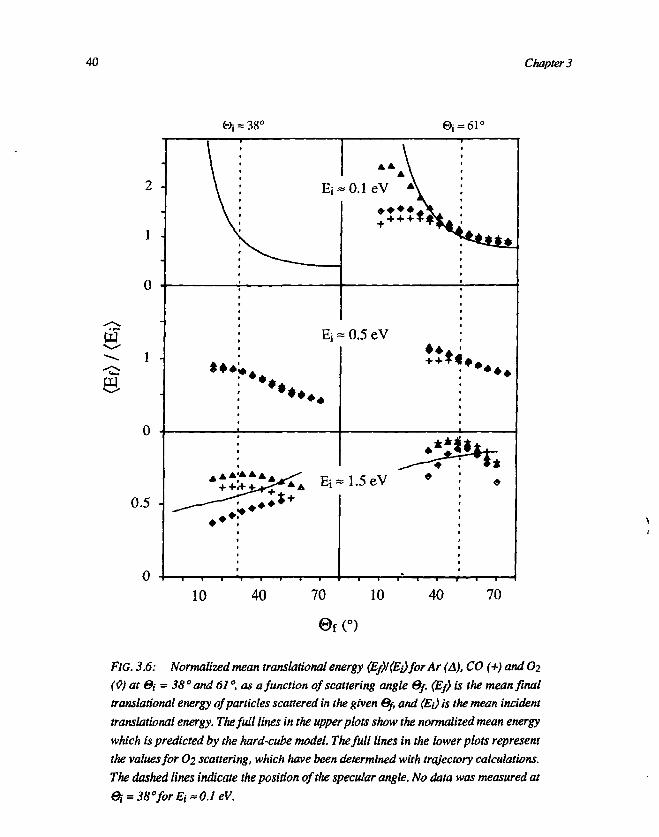
In order to get more information on corrugation and energy transfer, wetransferred TOF profiles (figure 3.2) into mean translational energy (Ef) as afunction of ©f. The results have been divided by the incident translational energy(Ej), and subsequently they have been plotted in figure 3.6. In the same figure thebehaviour of <Ef)/<Ej) as a function of 0f, predicted by the hard-cube model, isindicated by a full line. In the case of low energies (Ej = 0.1 eV) at ©i = 61°, the
Direct inelastic scattering ... 39
data points (especially Ar) exhibit the same tendency as is predicted by the hard-cube model. Only at small scattering angles the experimental values tend to deviatefrom the hard-cube line, which may be due to enhanced influence of desorbingparticles on the mean translational energy. Furthermore we see only minordifferences for different gasses at low energy. The difference between the low-energy Ar curve and the CO and O2 curves is due to the fact that the lowest beamenergy for Ar (monoatomic, E, = 0.07 eV) is lower than for the diatomic gasses(Ei = 0.10 eV). Increasing the incident energy up to about 0.5 eV does not affectthe similarity between the different gasses, although the similarity to the cube linesdecreases with increasing energy. Further increase of the incident energy up toabout 1.5 eV, or decrease of the angle of incidence at 0.5 eV from 61° down to 38°,results in a clear maximum near the specular angle (@f = ©i) in the function of(Ef)/(Ei) versus the scattering angle ©f. As the contribution of desorption isexpected to decrease with increasing incident energy, this contribution is too smallto be the origin of a maximum in the (Ef)/(Ei) curve. When we increase the incidentenergy at ©i = 38° from 0.5 eV up to about 1.5 eV, the shape of the Ar and COcurves does not change much. However, the curve for O2 at 0* = 38° and E;= 1.5 eVshows a complete reversal of the trend observed for the cube model. In this case<Ef) increases monotonously with ©f. This indicates that the collision becomesharder as the total scattering angle (180° - l@il - l®fl) increases, an intuitivelyreasonable result for atom-atom scattering or scattering from a stronglycorrugated surface. The opposite trends for the dependencies of (Ef)/(Ej) of firstlythe cube model at low Ei, and secondly scattering from a corrugated surface atlarge E,, lead to the maxima seen at intermediate Ej.
When we compare figure 3.6 with figure 3.3, we see that the incident energy(Ej) at which in figure 3.3 the experimental data start to deviate from the hard-cubebehaviour, corresponds with the energy (Ei) at which a clear maximum arises in thefunction of (Ef)/(Ej) versus ©f. A similar behaviour can be observed in figure 3.5,where we see that the incident energy at which the data tend to deviate from thehard-cube behaviour, corresponds with the energy at which the maxima in the(Ef)/(Ej) curves arise. From this we may conclude that a maximum in the function(Ef)/(Ej) versus ©f is due to corrugation, which is able to explain loss of parallelmomentum of incident particles by means of an effective tilting of part of thesurface. For O2 at E, » 1.5 eV and ©i = 38° the maximum in the (Ef)/(Ej) curve(figure 3.6) is shifted to the highest ©f, which suggests a substantial corrugation forO2/Ag(lll). This is in agreement with the observed behaviour of the O2 curve infigure 3.5, which shows a strong increase of the angular width at the highest normalenergy, while Ar and CO did not exhibit a similar broadening.
40 Chapter 3
2 -
1 •
0
1 -
0
0.5 -
0
# • •
Ei« 0.5 eV
• * • • • • • • •
10
iiu' • • •
F/G. 5.6; Normalized mean translational energy {Ef)/(Ej)for Ar (A), CO (+) and 02(0) at &i = 38° and 61 °, as a function of scattering angle 0/. (Ef) is the mean finaltranslational energy of particles scattered in the given Gf, and (E{) is the mean incidenttranslational energy. The full lines in the upper plots show the normalized mean energywhich is predicted by the hard-cube model. The full lines in the lower plots representthe values for O2 scattering, which have been determined with trajectory calculations.The dashed lines indicate the position of the specular angle. No data was measured at0i = 38°forEi'=O.leV.
Direct inelastic scattering ... 41
3.2 Classical trajectory calculations
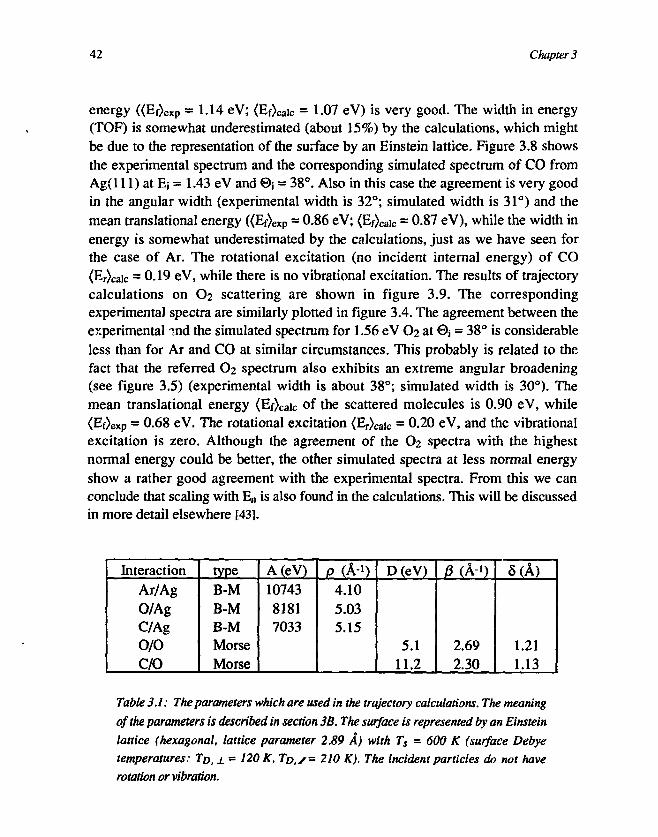
Although cube models are useful, they have to be checked against moresophisticated trajectory calculations. We have simulated our experimental resultsby 3-dimensional classical trajectory calculations as described previously [20,38,44],using summed pairwise repulsive interaction potentials. In the case of a scatteringmolecule we have summed pairwise per atom of the molecule. The pairpotentialsare Born-Mayer potentials (V(r) = A-e-P1", where r is the distance from the particleto a surface atom) fitted to the repulsive part of Hartree-Fock-SIater (HFS)potentials computed for these systems [38,44,45]. In the Ar/Ag(lll) case wecomputed the potential parameters A = 10743 eV and p = 4.10 A-1, for (tyAgO 11)the parameters A = 8181 eV and p = 5.03 A-i, and for C/Ag(ll l) in theCO/Ag(lll) case the parameters A = 7033 eV and p = 5.15 A 1 (summarizedin table 3.1). The intramolecular potential is represented by a Morse potential(V(d) = D-(e-0(d-§)-l)2, where d is the separation distance and 8 the equilibriumseparation). The parameters used for these potentials were found in the literature[46], and have been summarized in table 3.1. The molecular trajectories have beencalculated at a cluster of 30 Ag atoms, which are incorporated in a thermal Einsteinlattice at a temperature of 600 K. We have allowed enhanced amplitude of surfacevibration by using surface Debye temperatures of 120 K and 210 K (bulk value is225 K) [47,48], corresponding with motion perpendicular and parallel to the surfacerespectively. Both rotational and vibrational excitation of the initially non-rotatingand non-vibrating molecules are included in the calculations. To make comparisonwith experimental spectra more convenient, we have performed the calculationssuch as to mimic the experimental conditions as much as possible, including a finitevelocity distribution of the incident beam. Furthermore the calculated spectra havebeen plotted with the same TOF and % axes as the experimental spectra.
As we represent the crystal by an Einstein lattice, this might also explain thefact that at thermal incident energies (E, = 0.1 eV) the mean translational energy ofthe scattered particles is somewhat underestimated by the calculations (for Ar atEj = 0.07 eV and &i = 61°, <Ef)exp = 0.10 eV; {EfXafc = 0.07 eV), which may be dueto the neglect of correlation in the motion of surface atoms. However, we expect theEinstein lattice to work well outside the range where the cube theory works well,which means incident energies of about 1 eV and higher.
The result of trajectory calculations for Ar on Ag(l 11) at Ei = 1.68 eV and©i = 38° is shown in figure 3.7, together with the corresponding experimentalspectrum. As can be clearly seen, the agreement in angular distribution(experimental width is 24°; simulated width is 26°) and in mean translational
42 Chapter 3
energy «Ef)eXp = 1.14 eV; <Ef)caic = 1-07 eV) is very good. The width in energy(TOF) is somewhat underestimated (about 15%) by the calculations, which mightbe due to the representation of the surface by an Einstein lattice. Figure 3.8 showsthe experimental spectrum and the corresponding simulated spectrum of CO fromAg(l 11) at Ej = 1.43 eV and 0j = 38°. Also in this case the agreement is very goodin the angular width (experimental width is 32°; simulated width is 31°) and themean translational energy ((Ef)exp = 0.86 eV; (Ef)caic = 0.87 eV), while the width inenergy is somewhat underestimated by the calculations, just as we have seen forthe case of Ar. The rotational excitation (no incident internal energy) of CO(Er)caic = 0.19 eV, while there is no vibrational excitation. The results of trajectorycalculations on O2 scattering are shown in figure 3.9. The correspondingexperimental spectra are similarly plotted in figure 3.4. The agreement between theexperimental ind the simulated spectrum for 1.56 eV O2 at @j = 38° is considerableless than for Ar and CO at similar circumstances. This probably is related to thefact that the referred O2 spectrum also exhibits an extreme angular broadening(see figure 3.5) (experimental width is about 38°; simulated width is 30°). Themean translational energy (Ef)caic of the scattered molecules is 0.90 eV, while<Ef>eXp = 0.68 eV. The rotational excitation <Er)caic = 0.20 eV, and the vibrationalexcitation is zero. Although the agreement of the O2 spectra with the highestnormal energy could be better, the other simulated spectra at less normal energyshow a rather good agreement with the experimental spectra. From this we canconclude that scaling with En is also found in the calculations. This will be discussedin more detail elsewhere [43].
InteractionAr/AgO/AgC/AgO/OC/O
typeB-MB-MB-MMorseMorse
A(eV)1074381817033
P (A-i)4.105.035.15
D(eV)
5.111.2
0 (A-1)
2.692.30
5 (A)
1.211.13
Table 3.1: The parameters which are used in the trajectory calculations. The meaningof the parameters is described in section 3B. The surface is represented by an Einsteinlattice (hexagonal, lattice parameter 2.89 A) with Ts = 600 K (surface Debyetemperatures: To, 1 = 120 K, To,y= 210 K). The incident particles do not haverotation or vibration.
Direct inelastic scattering... 43
1
TO
F (
a)
300 •
•
200 •
100 •
<=>; =
30
= 38°
Experimental
60 90 30
= 38°
Simulation
60
b)
•300
•
•200
• 100
90
HOrcl
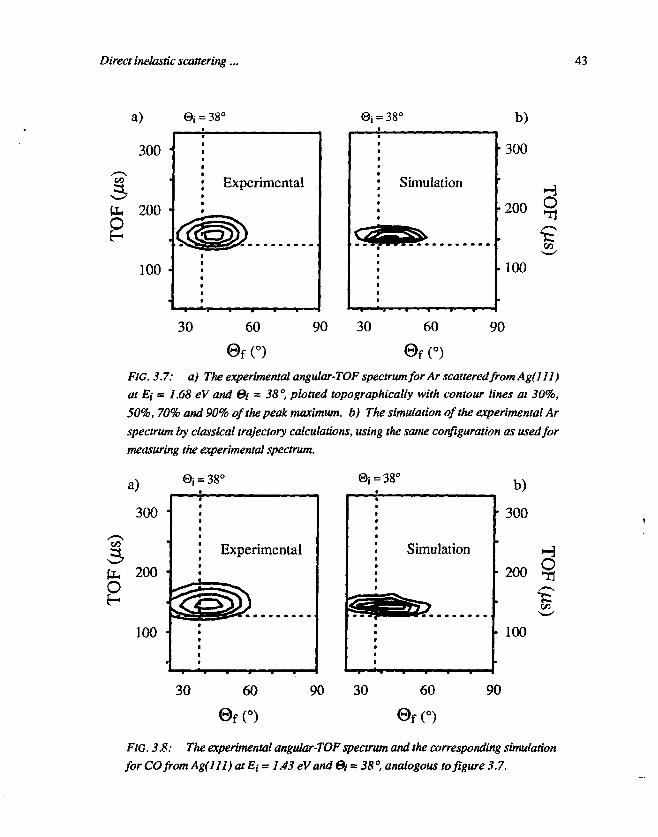
FIG. 3.7: a) The experimental angular-TOF' spectrum for Arscatteredfrom Ag(lll)at Ei = 1.68 eV and &i - 38°, plotted topographically with contour lines at 30%,50%, 70% and 90% of the peak maximum, b) The simulation of the experimental Arspectrum by classical trajectory calculations, using the same configuration as used formeasuring the experimental spectrum.
a) • = 38°
TO
F
300 •
•
200 •
100 •a
Experimental
ft)Simulation
^ 5 ? .
• 300
•
• 200
100
H
CO
b)
30 60
n90 30 60 90
FIG. 3.8: The experimental angular-TOF spectrum and the corresponding simulationfor COfromAg(lll) atEi = 1.43 eV and &i = 38°, analogous to figure 3.7.
44 Chapter 3
200
200
O 100
2(K) •
100 •
0f<°>40 60 80 40 60 80 20 40 60 80 20 40 60 80
, = 0.<)7eV
E,, = (1.72 cV
En = 0.57 eV
= D.X.? cV
= 0.62 L-V
E,, = 0.5') cV E,, = 0..37 eV
Ei =I.S6cV
Oi = ?2
Ei = 1.16 cV
Simulations0, = 43°
6i = ?
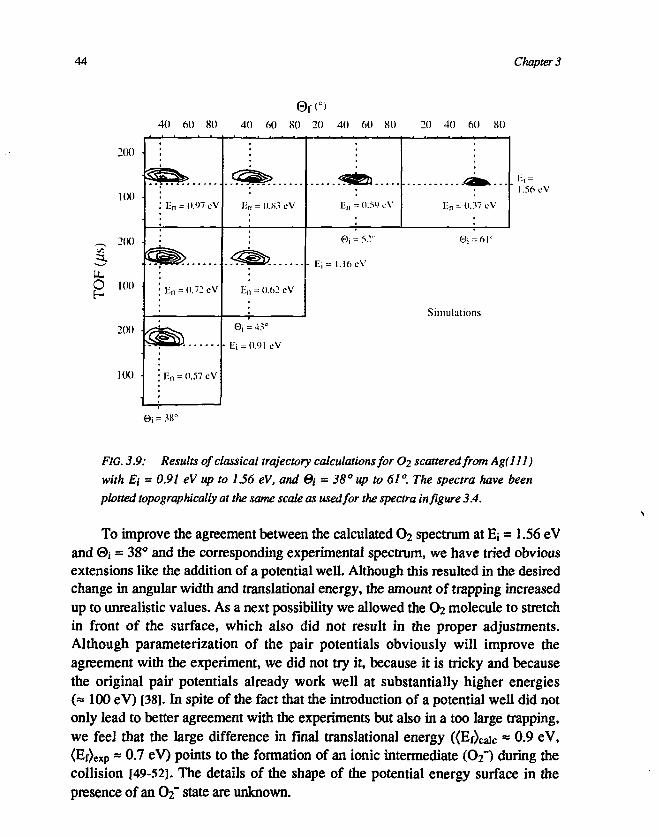
FIG. 3.9: Results of classical trajectory calculations for O2 scattered from Ag(lll)
with Ei - 0.91 eV up to 1.56 eV, and ©/ = 38° up to 61°. The spectra have been
plotted topographically at the same scale as used for the spectra in figure 3.4.
To improve the agreement between the calculated O2 spectrum at Ei = 1.56 eVand ©i = 38° and the corresponding experimental spectrum, we have tried obviousextensions like the addition of a potential well. Although this resulted in the desiredchange in angular width and translational energy, the amount of trapping increasedup to unrealistic values. As a next possibility we allowed the O2 molecule to stretchin front of the surface, which also did not result in the proper adjustments.Although parameterization of the pair potentials obviously will improve theagreement with the experiment, we did not try it, because it is tricky and becausethe original pair potentials already work well at substantially higher energies(« 100 eV) [38]. In spite of the fact that the introduction of a potential well did notonly lead to better agreement with the experiments but also in a too large trapping,we feel that the large difference in final translational energy «Ef)caic ~ 0.9 eV,(Ef)exp ~ 0.7 eV) points to the formation of an ionic intermediate (O2") during thecollision [49-52]. The details of the shape of the potential energy surface in thepresence of an O2" state are unknown.
Direct inelastic scattering... 45
4. Discussion
4.1 Surface corrugation
The width of angular distributions can be up to 40° at thermal energies, whenthe molecular velocity is comparable with the thermal motion of the surface atoms[24]. As is expected for scattering from hard-cubes [23,31], the angular widthdecreases drastically when the translational energy becomes superthermal (above0.1 eV) [39]. At further increase of energy, the angular width is expected toincrease again, due to the onset of structure scattering or corrugation. This has notbeen observed before for molecular scattering, and as can be seen in figure 3.5, wealso did not observe it for Ar. However, for O2 scattering we have observed a largebroadening, which comes up very fast when increasing the incident translationalenergy from 0.91 eV to 1.56 eV at 0j = 38° (figure 3.5), and which appeared toscale with normal energy (figure 3.4).
The strong broadening of the O2 spectrum at 1.56 e V will be shown to be mostlikely due to surface corrugation, since a variance of the cube mass with the impactparameter within the unit cell can only explain a broadening of the angular width ofabout 1°. Internal excitation would not result in a strong broadening either.Collision induced vibrational excitation is unlikely, because the vibrationalfrequency of O2 differs substantially from the Ag(l l l ) surface lattice frequency[46-48], and calculations have shown that collision induced rotational excitationhardly influences the angular distribution [35]. Therefore we can use a modifiedhard-cube model, which incorporates surface corrugation, to explain theexperimental broadening. Such a model which has been proposed earlier [34],is based on the common hard-cube model [23,31]. Using this modified hard-cube model and representing the corrugation by a cosine with an adjustableamplitude, we were able to reproduce the experimental angular distribution for O2at Ei = 1.56 eV and ©i = 38° (Ts = 600 K, reduced cube mass = 32/108) when weused a corrugation depth of about 0.1 A at a modulation distance of 2.89 A, thelattice parameter of Ag. The agreement very sensitively depends on the amount ofcorrugation, while a variation in the reduced cube mass has only minor effect.We have to emphasize that the in this way determined corrugation is an average,since we represented the actual 3-dimensional corrugation by a 2-dimensionalcorrugation in the model. Consequently the maximum corrugation amplitude isconsiderably larger than 0.1 A. In the trajectory calculations we can also determinethe corrugation amplitude by marking the turning points. The maximumcorrugation amplitude appears along a line over the centra of the surface atoms,
46 Chapter 3
and for O2 at 1.56 eV it was found to be 0.45 A, at a nominal distance of about 1.6 A(which appeared to be slightly dependent on the orientation of the O2 molecule).
Although we have derived a considerable corrugation in the previousparagraph, we did not observe a double peak structure in the calculations with thecube model, which would indicate that rainbow scattering takes place [20,22,53,54].The most probable origin for smearing out the double peak structure is thevibration of the surface atoms. When the surface temperature Ts is higher than thesurface Debye temperature Td, the vibration frequency of the surface atoms is equalto the Debye frequency fi>d = kTd/h". The expectation value for the amplitudesquared (u2) = 3kTs/Ma>d2, where M = MAg, the mass of a surface atom. As thesurface Debye temperature (perpendicular to the surface) is about 120 K [47,48],the mean vibrational amplitude of surface atoms is about 0.2 A at Ts = 600 K.Although this value is indeed larger than the mean corrugation that the 1.56 eV O2is probing (0.1 A), it is considerably smaller than the maximum value found by thetrajectory calculations (0.45 A). The trajectory calculations show that the surfacevibration is not the prime cause of the damping of the rainbow structure. In fact thetrajectory calculations show that the double peak structure is even smeared outwhen the surface temperature is equal to 0 K without zero-point motion. The actualorigin for the disappearance of the double peak structure appeared to be the impactpoint of the incident particle in the unit cell. The fact that the corrugation is largestalong a line over the centra of the surface atoms, and is much smaller along theparallel line through the valleys between the surface atoms, is enough to smear outthe double peak structure. Other parameters such as, for example, internalexcitation of the incident molecules, appeared to be hardly of influence on theexistence of the double peak structure.
When we measure scattering of other particles (Ar, CO, NO) at approximatelyEj = 1.5 eV and ©i = 38°, the width of the angular distribution varies from about20° for Ar to about 30° for CO and NO, but O2 exhibits by far the largestbroadening (> 35°). This indicates that there is a substantial difference in surfacecorrugation for those particles. Trajectory calculations show that differences insurface corrugation are due to differences in slope of the interaction potentialbetween particle and surface, when it is represented by a sum over Born-Mayerpotentials (V(r) = A-e-f). If the interaction potential has a long repulsive range(p < 4 A'1), the turning point of the approaching molecule will be relatively faraway from the surface (> 2 A), where the corrugation of the surface potential issomewhat damped out. In the case of steep potentials (ft > 4 A-') the corrugationbecomes more perceptible at the turning point, so corrugation induced effects canbecome larger. The computed value for p = 5.03 A 1 (O) and p = 5.15 A 1 (C),
Direct inelastic scattering ... 47
which are rather large, lead to large corrugation. For Ar the computed p = 4.10 A"1
is considerably smaller, leading to less corrugation. At very low energies(En < 0.3 eV) the differences in angular distributions disappear, because thenfor any particle the turning point will be far away from the surface.
Careful comparison of the experimental Ar (Ej = 1.68 eV, 0 ; = 38°), CO (E; =1.43 eV, 0j = 38°) and O2 (Ej = 1.56 eV, 0j = 38°) spectra with the correspondingcalculated spectra, show that the width of the calculated angular distribution in thecase of O2 is somewhat underestimated, while the agreement in the case of Ar andCO is very good (see also figure 3.5). Since rotational and vibrational excitation ofCO and O2 are taken into account, the slight disagreement in the O2 case points toshortcomings of the model, which are discussed in section 3B. The fact that theangular width of the calculated O2 spectrum (Ej = 1.56 eV, 0j = 38°) is somewhatunderestimated, suggests that the maximum corrugation amplitude is larger thanthe calculated value of 0.45 A.
4.2 Energy transfer
In figure 3.3 we see, that in case of high incident energies, the mean scatteredtranslational energy is much lower than what is predicted by the hard-cube model,especially for O2. Because we have seen that corrugation is important at theseenergies, we can use a modified hard-cube model in which corrugation isincorporated. When we use this model to calculate the mean translational energy ofthe scattered molecules, we find that there is hardly any difference with the valuethat is predicted by the hard-cube model without corrugation. This is in agreementwith earlier analytical calculations [34], where it was found that additional energytransfer, due to corrugation, is very small, at corrugation amplitudes in the rangewe are considering. From this we conclude that the corrugation modification of thehard-cube model is not able to explain the substantial translational energy loss, aslong as we assume that the cube mass remains unchanged.
In the hard-cube model the cube mass McUbe was assumed to be equal to about2.6 times the mass MA 8 of a Ag atom, to fit the experimental mean energy of thescattered particles in case of low incident energies (figure 3.3). This relativelylarge cube mass has to simulate the enhanced elasticity (because an incident particleinteracts with more than one surface atom), and the enhanced surface recoil(because within the collision time surface atoms can reflect from the bulk andinteract again with the scattered particle), which are both present in a less impulsivecollision with a realistic molecule-surface interaction potential. When the incident
48 Chapter 3
translational energy is increased, the collision elasticity decreases (furtherpenetration into the surface results in less interacting surface atoms), the surfacerecoil decreases (smaller collision time), and the enhanced corrugation causes theaverage angle of incidence to become somewhat smaller (corrugation tilts localsurface normal). Therefore the energy transfer increases and consequently theeffective cube mass, required by the (modified) hard-cube model, becomes smallerthan 2.6-MAg. The magnitude of this effect can be estimated from the Ar data infigure 3.3. The 1.68 eV Ar point is situated on the hard-cube line whichcorresponds with a cube mass of 2.0-MAg. Since we have seen that surfacecorrugation for O2 is more pronounced than it is for Ar, we assume that in the caseof O2 the effect of decreased cube mass is larger or equal than in the case of Ar(Mcube ^ 2.0-MAg), but that the effective cube mass cannot become smaller than1.0-MAg (MCUbe ̂ 1.0-MAg), which corresponds to a head-on collision with one freeAg atom. Thus in the case of O2 at an incident translational energy of 1.56 eV andan angle of incidence of 38° (Ts = 600 K) the effective cube mass has to be between1.0-MAg and 2.0-MAg. With those values the hard-cube model predicts a final meantranslational energy between 0.90 eV (MCUbe = 1-0-MAg) and 1.15 eV (Mcube =2.0-MAg). The experimental result of the corresponding O2 measurement is 0.68eV,which is clearly not in the mentioned range. Consequently, we conclude thateven the smallest effective cube mass (1.0-MAg) is not able to explain the wholetranslational energy loss in the case of O2, although it can in the case of Ar. For O2the additional energy loss, which cannot be explained by a decreased effective cubemass, is between about 0.2 eV (Mcube = l-0'MAg) and 0.5 eV (Mcube = 2.0-MAg). Thebehaviour for CO and NO is in between that for Ar and O2.
Because the experimental energy transfer is much more for molecules (CO,NO, O2) than it is for Ar, we have to consider internal excitation. In case of O2more energy transfer occurs than from CO and NO, which suggests that O2 is moreinternally excited. In the NO/Ag(lll) system rotational excitation is known to bedominant, and collision induced vibrational excitation is negligible [1,16]. Since thevibrational frequencies of O2 and NO differ substantially from the Ag(l 11) surfacelattice frequency, and the vibrational frequencies of O2 and NO are comparable[46-48], it is likely that collision induced vibrational excitation of O2 will also benegligible. As in the case of NO, rotational excitation might be dominant for O2scattering. Therefore we assume that additional energy transfer is due to rotationalexcitation and thus we represent the molecule by a rigid rotor. A rigid rotor can beincorporated in the hard-cube model, although this extension has never beencombined with the corrugation modification. Theoretical calculations have shownthat the angular distributions of rigid rotor scattering from hard-cubes are hardly
Direct inelastic scattering... 49
different from those of common hard-cube scattering [35]. As we already havementioned that surface corrugation hardly influences the energy transfer, we canconsider rigid rotor scattering from a non-corrugated surface, although thecorrugation and the enhanced impulsiveness of the collision slightly influence theeffective cube mass (and thus the energy transfer). In addition, corrugation canenhance rotational excitation.
Numerical calculations (summarized in table 1 in Ref. 36) show that the meantotal energy (translational energy (Ef) + rotational energy (Er)) of the scatteredrigid rotor is almost independent of the ellipticity e of the rotor, but the ratio<Er)/(Ef) certainly is not. Therefore the rigid rotor is able to explain additionalenergy transfer by assuming rotational excitation at the cost of translational energy.The mean total energy of the scattered rotor is the same as in the common hard-cube model, which actually corresponds to a rigid rotor having an ellipticitye = 1.0. Furthermore the calculations show that at e = 1.6, both <Er> and (Ef> of thescattered molecules are equal to half of the total scattered energy (which is equal tothe scattered translational energy predicted by the common hard-cube theory).According to this estimate, the rigid rotor extension is able to explain additionalenergy loss of the order of magnitude of our experimental value. For O2 theadditional energy loss is between 0.2 eV and 0.5 eV at a residual translationalenergy of about 0.7 eV (0.3 < <Er)/<Ef) < 0.7), so that the ellipticity of O2 isexpected to be between 1.2 and 1.5 and the ellipticities of NO and CO might besmaller, but obviously larger than 1.0 which is the value for Ar (spherical). Theellipticity of O2 in collision with a Ag atom can easily be determined by using thesame pairwise additive Born-Mayer potentials (V(r) = A-e-Pr, with r the O-Agdistance) as used in the trajectory calculations. Inserting A = 818i eV, p = 5.03 A-1
and an intramolecular distance d — 1.21 A, results in an ellipticity e = 1.25 at anincident energy Ej = 1.5 eV, which is in agreement with the range mentioned above.If we use this value in the rigid rotor model, we find for the O2 case a rotationalexcitation (Er> ~ 0.2 eV «Er)/<Ef> = 0.3). As we know that <Er> + <Ef) in the rigidrotor model has the same value as (Ef) in the hard-cube model, we can combine thevalue (Er) « 0.2 eV with the known translational energy in the rigid rotor model(Ef) « 0.7 eV, to determine the mass of the surface cube: Mcube = 1.0'MAJ, which isin agreement with our previous statements.
In a similar way as for O2 we can determine the rotational excitation for CO atEj = 1.43 eV and ©i = 38°. The mean translational energy of the scattered COparticles (Ef) = 0.86 eV (see figure 3.3). The ellipticity of CO is about the same asfor O2 (e = 1.25), so that <Er)/<Ef) = 0.3 and consequently <Er) = 0.25, and similarlyas in the O2 case the mass of the surface cube MCUbe = 1.2MAg for CO scattering.
50 Chapter 3
The value for the rotational excitation is comparable with that of the trajectorycalculations (Er) = 0.19 eV. A source of uncertainty in the determination ofrotational excitation in the rigid rotor model, is the in NO experiments observedtrend that the energy transfer from translation inio rotation may be partlycompensated by a reduced amount of phonon excitation [1]. If this effect would alsoexist in scattering of other molecules, then the rotational excitation will beunderestimated. However, the fact that the calculated rotational excitation is notsmaller than derived from the trajectory calculations, suggests that this effect is notimportant.
Although the rigid rotor extension of the hard-cube model is able to describescattering with rotational excitation, we want to check the results against moresophisticated classical trajectory calculations which do not require fit parameters,like cube mass and ellipticity, and are therefore more suited to determine internalexcitation and a complete energy balance. Trajectory calculations on Ar scatteringat Ej = 1.6o eV and 0 , = 38° are in good agreement with our experiments. Thesame holds for calculations on CO at Ej = 1.43 eV and 0 j = 38°. Calculations onO2 scattering at Ej = 1.56 eV and 0j = 38° from a Ag(l l l ) surface, resulted in amean translational energy <Ef)caic = 0.90 eV and a mean internal (rotational)energy <Er)caic = 0.20 eV. When we compare (Ef)caic with the experimental value{Ef)exp ~ 0.7 eV, we find a difference of about 0.2 eV. Note that the calculatedtranslational and rotational energies for O2 and CO are both in good agreementwith the CO values of the rigid rotor model, while they do not correspond with therigid rotor results of O2. This suggests that there is a non-classical energy lossmechanism for O2 which causes in the rigid rotor model an underestimation ofrotational excitation «Er)/(Ef) constant) and cube mass.
4.3 Sticking and electronic effects
Sticking (chemisorption) at large Ej has been observed for other systems likee.g. O2 on W(110) [55]. If there is a substantial sticking, we have to observe aconsiderable decrease in the direct inelastic scattering signal [56]. However, we didnot observe such a drastic decrease, and we also did not observe angulardistributions exhibiting typical desorption behaviour. Therefore we can concludethat we did not see any appreciable sticking under the present experimentalconditions, which is in agreement with our measurements on sticking which will bepublished elsewhere [8].
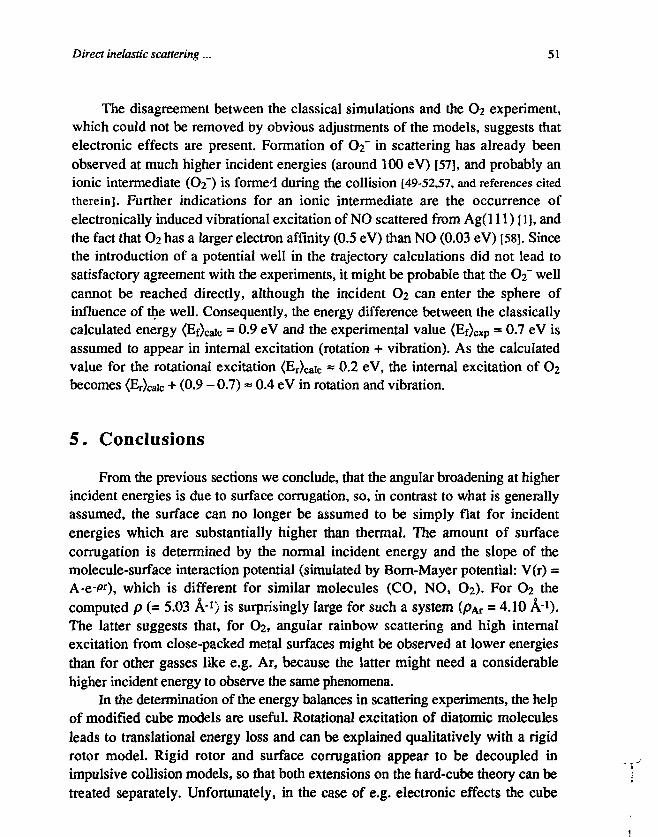
Direct inelastic scattering ... 51
The disagreement between the classical simulations and the O2 experiment,which could not be removed by obvious adjustments of the models, suggests thatelectronic effects are present. Formation of O2" in scattering has already beenobserved at much higher incident energies (around 100 eV) [57], and probably anionic intermediate (O2") is formed during the collision [49-52,57, and references citedtherein]. Further indications for an ionic intermediate are the occurrence ofelectronically induced vibrational excitation of NO scattered from Ag(l 11) [1], andthe fact that O2 has a larger electron affinity (0.5 eV) than NO (0.03 eV) [58]. Sincethe introduction of a potential well in the trajectory calculations did not lead tosatisfactory agreement with the experiments, it might be probable that the O2" wellcannot be reached directly, although the incident O2 can enter the sphere ofinfluence of the well. Consequently, the energy difference between the classicallycalculated energy (Ef^e = 0.9 eV and the experimental value (Ef)exp = 0.7 eV isassumed to appear in internal excitation (rotation + vibration). As the calculatedvalue for the rotational excitation (Er)caic » 0.2 eV, the internal excitation of O2becomes (Er>caic + (0.9 - 0.7) ~ 0.4 eV in rotation and vibration.
5. Conclusions
From the previous sections we conclude, that the angular broadening at higherincident energies is due to surface corrugation, so, in contrast to what is generallyassumed, the surface can no longer be assumed to be simply flat for incidentenergies which are substantially higher than thermal. The amount of surfacecorrugation is determined by the normal incident energy and the slope of themolecule-surface interaction potential (simulated by Born-Mayer potential: V(r) =A-ePr), which is different for similar molecules (CO, NO, O2). For O2 thecomputed p (= 5.03 A1) is surprisingly large for such a system (p^ = 4.10 A-1).The latter suggests that, for O2, angular rainbow scattering and high internalexcitation from close-packed metal surfaces might be observed at lower energiesthan for other gasses like e.g. Ar, because the latter might need a considerablehigher incident energy to observe the same phenomena.
In the determination of the energy balances in scattering experiments, the helpof modified cube models are useful. Rotational excitation of diatomic moleculesleads to translational energy loss and can be explained qualitatively with a rigidrotor model. Rigid rotor and surface corrugation appear to be decoupled inimpulsive collision models, so that both extensions on the hard-cube theory can betreated separately. Unfortunately, in the case of e.g. electronic effects the cube
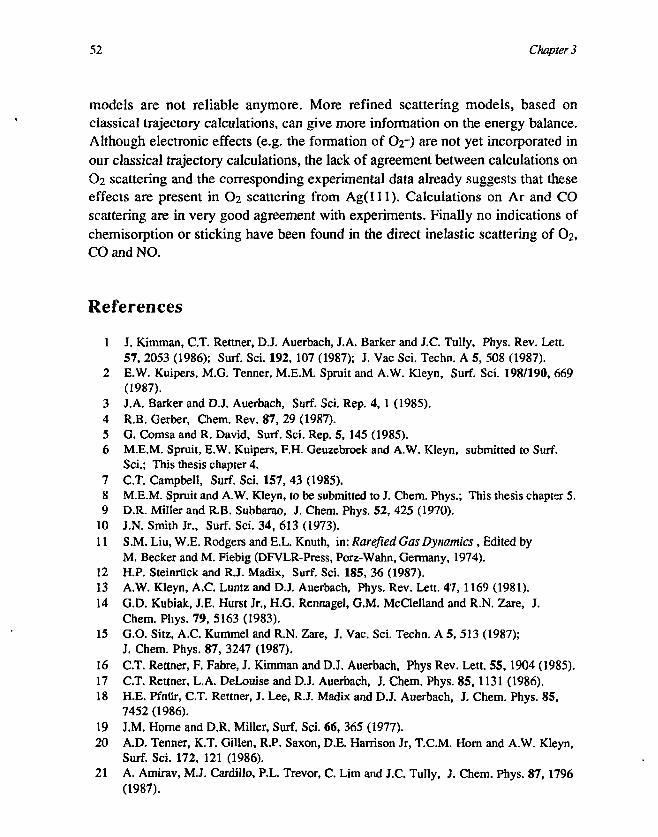
52 Chapter 3
models are not reliable anymore. More refined scattering models, based onclassical trajectory calculations, can give more information on the energy balance.Although electronic effects (e.g. the formation of O2-) are not yet incorporated inour classical trajectory calculations, the lack of agreement between calculations onO2 scattering and the corresponding experimental data already suggests that theseeffects are present in O2 scattering from Ag(l l l ) . Calculations on Ar and COscattering are in very good agreement with experiments. Finally no indications ofchemisorption or sticking have been found in the direct inelastic scattering of O2,CO and NO.
References
1 J. Kimman, C.T. Rettner, D.J. Auerbach, J.A. Barker and J.C. Tully, Phys. Rev. Lett.57, 2053 (1986); Surf. Sci. 192, 107 (1987); J. Vac Sci. Techn. A 5, 508 (1987).
2 E.W. Kuipers, M.G. Tenner, M.E.M. Spruit and A.W. Kleyn, Surf. Sci. 198/190, 669(1987).
3 J.A. Barker and D.J. Auerbach, Surf. Sci. Rep. 4, 1 (1985).4 R.B. Gerber, Chem. Rev. 87, 29 (1987).5 G. Comsa and R. David, Surf. Sci. Rep. 5, 145 (1985).6 M.E.M. Spruit, E.W. Kuipers, F.H. Geuzebroek and A.W. Kleyn, submitted to Surf.
Sci.; This thesis chapter 4.7 C.T. Campbell, Surf. Sci. 157, 43 (1985).8 M.E.M. Spruit and A.W. Kleyn, to be submitted to J. Chem. Phys.; This thesis chapter 5.9 D.R. Miller and R.B. Subbarao, J. Chem. Phys. 52, 425 (1970).
10 J.N. Smith Jr., Surf. Sci. 34, 613 (1973).11 S.M. Liu, W.E. Rodgers and E.L. Knuth, in: Rarefied Gas Dynamics, Edited by
M. Becker and M. Fiebig (DFVLR-Press, Porz-Wahn, Germany, 1974).12 H.P. Steinruck and R.J. Madix, Surf. Sci. 185, 36 (1987).13 A.W. Kleyn, A.C. Luntz and DJ. Auerbach, Phys. Rev. Lett. 47,1169 (1981).14 G.D. Kubiak, J.E. Hurst Jr., H.G. Rennagel, G.M. McClelland and R.N. Zare, J.
Chem. Phys. 79, 5163 (1983).15 G.O. Sitz, A.C. Kummel and R.N. Zare, J. Vac. Sci. Techn. A 5, 513 (1987);
J. Chem. Phys. 87, 3247 (1987).16 C.T. Rettner, F. Fabre, J. Kimman and D.J. Auerbach, Phys Rev. Lett. 55,1904 (1985).17 C.T. Rettner, L.A. DeLouise and D.J. Auerbach, J. Chem. Phys. 85, 1131 (1986).18 H.E. Pfnur, C.T. Rettner, J. Lee, R.J. Madix and D.J. Auerbach, J. Chem. Phys. 85,
7452 (1986).19 J.M. Home and D.R. Miller, Surf. Sci. 66, 365 (1977).20 A.D. Tenner, K.T. Gillen, R.P. Saxon, D.E. Harrison Jr, T.C.M. Horn and A.W. Kleyn,
Surf. Sci. 172, 121 (1986).21 A. Amirav, M.J. Cardillo, P.L. Trevor, C. Lim and J.C. Tully, J. Chem. Phys. 87,1796
(1987).
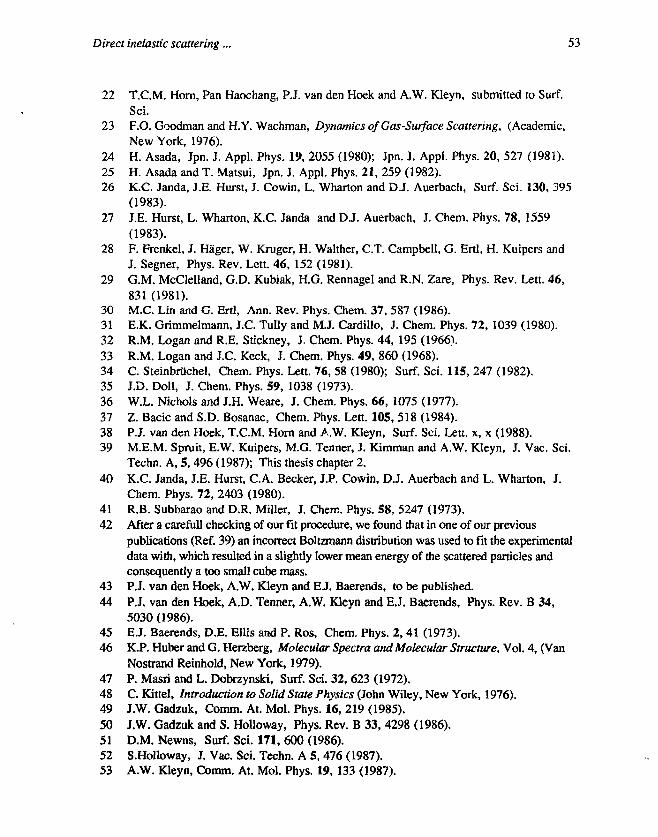
Direct inelastic scattering ... 53
22 T.C.M. Horn, Pan Haochang, P.J. van den Hoek and A.W. Kleyn, submitted to Surf.Sci.
23 F.O. Goodman and H.Y. Wachman, Dynamics of Gas-Surface Scattering, (Academic,New York, 1976).
24 H. Asada, Jpn. J. Appl. Phys. 19, 2055 (1980); Jpn. J. Appl. Phys. 20, 527 (1981).25 H. Asada and T. Matsui, Jpn. J. Appl. Phys. 21, 259 (1982).26 K.C. Janda, J.E. Hurst, J. Cowin, L. Wharton and D.J. Auerbach, Surf. Sci. 130, 395
(1983).27 J.E. Hurst, L. Wharton, K.C. Janda and D.J. Auerbach, J. Chem. Phys. 78, 1559
(1983).28 F. Frenkel, J. Hager, W. Kruger, H. Walther, C.T. Campbell, G. Ertl, H. Kuipers and
J. Segner, Phys. Rev. Lett. 46, 152 (1981).29 G.M. McClelland, G.D. Kubiak, H.G. Rennagel and R.N. Zare, Phys. Rev. Lett. 46,
831 (1981).30 M.C. Lin and G. Ertl, Ann. Rev. Phys. Chem. 37, 587 (1986).31 E.K. Grimmelmann, J.C. Tully and M.J. Cardillo, J. Chem. Phys. 72, 1039 (1980).32 R.M. Logan and R.E. Stickney, J. Chem. Phys. 44, 195 (1966).33 R.M. Logan and J.C. Keck, J. Chem. Phys. 49, 860 (1968).34 C. Steinbriichel, Chem. Phys. Lett. 76, 58 (1980); Surf. Sci. 115, 247 (1982).35 J.D. Doll, J. Chem. Phys. 59, 1038 (1973).36 W.L. Nichols and J.H. Weare, J. Chem. Phys. 66, 1075 (1977).37 Z. Bacic and S.D. Bosanac, Chem. Phys. Lett. 105, 518 (1984).38 P.J. van den Hoek, T.C.M. Horn and A.W. Kleyn, Surf. Sci. Lett, x, x (1988).39 M.E.M. Spruit, E.W. Kuipers, M.G. Tenner, J. Kimman and A.W. Kleyn, J. Vac. Sci.
Techn. A, 5,496 (1987); This thesis chapter 2.40 K.C. Janda, J.E. Hurst, C.A. Becker, J.P. Cowin, D.J. Auerbach and L. Wharton, J.
Chem. Phys. 72, 2403 (1980).41 R.B. Subbarao and D.R. Miller, J. Chem. Phys. 58, 5247 (1973).42 After a carefull checking of our fit procedure, we found that in one of our previous
publications (Ref. 39) an incorrect Boltzmann distribution was used to fit the experimentaldata with, which resulted in a slightly lower mean energy of the scattered particles andconsequently a too small cube mass.
43 P.J. van den Hoek, A.W. Kleyn and E.J. Baerends, to be published.44 P.J. van den Hoek, A.D. Tenner, A.W. Kleyn and E.J. Baerends, Phys. Rev. B 34,
5030 (1986).45 E.J. Baerends, D.E. Ellis and P. Ros, Chem. Phys. 2, 41 (1973).46 K.P. Huber and G. Herzberg, Molecular Spectra and Molecular Structure, Vol. 4, (Van
Nostrand Reinhold, New York, 1979).47 P. Masri and L. Dobrzynski, Surf. Sci. 32, 623 (1972).48 C. Kittel, Introduction to Solid State Physics (John Wiley, New York, 1976).49 J.W. Gadzuk, Comm. At. Mol. Phys. 16, 219 (1985).50 J.W. Gadzuk and S. Holloway, Phys. Rev. B 33, 4298 (1986).51 D.M. Newns, Surf. Sci. 171, 600 (1986).52 S.Holloway, J. Vac. Sci. Techn. A 5, 476 (1987).53 A.W. Kleyn, Comm. At. Mol. Phys. 19, 133 (1987).

54 Chapter 3
54 T.C.M. Horn, A.W. Kleyn and E.A. Gislason, J. Chem. Phys. 85, 7388 (1986).55 C.T. Rettner and D.J. Auerbach, Comm. At. Mol. Phys. 20, 153 (1987).56 B.E. Hayden and D.C. Godfrey, J. El. Spectr. Rel. Phen. 45, 351 (1987).57 Pan Haochang, T.C.M. Horn and A.W. Kleyn, Phys. Rev. Lett. 57, 3035 (1986);
J. El. Spectr. Rel. Phen. 45, 361 (1987).58 B.M. Smirnov, Negative Ions (McGraw-Hill, New York, 1982).
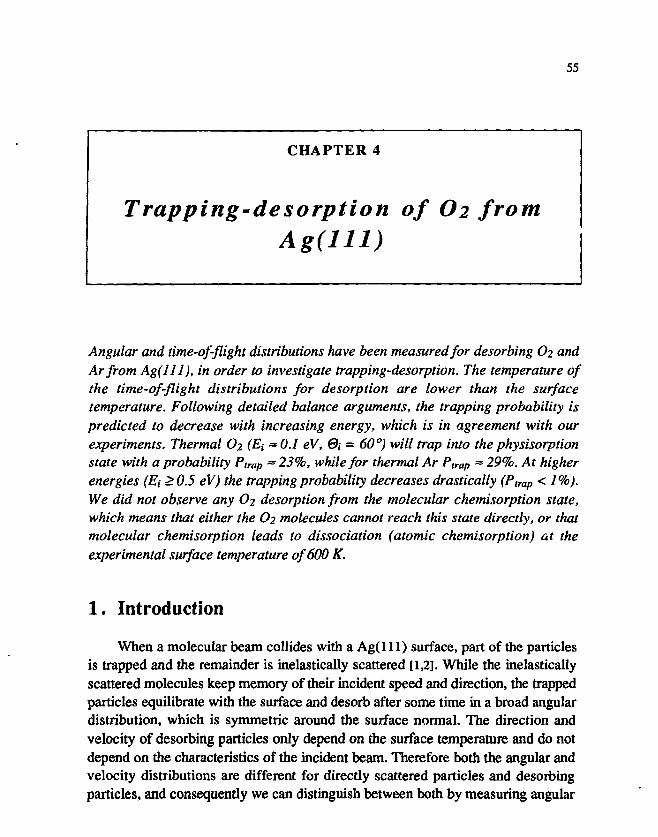
55
CHAPTER 4
Trapping-desorption of O2 fromAg(lll)
Angular and time-of-flight distributions have been measured for desorbing O2 andArfrom Ag(lll), in order to investigate trapping-desorption. The temperature ofthe time-of-flight distributions for desorption are lower than the surfacetemperature. Following detailed balance arguments, the trapping probability ispredicted to decrease with increasing energy, which is in agreement with ourexperiments. Thermal O2 (Ej =0.1 eV, 0; = 60°^ will trap into the physisorptionstate with a probability Ptrap ** 23%, while for thermal Ar Plrap ~ 29%. At higherenergies (Ei>0.5 eV) the trapping probability decreases drastically {Pimp < 1%).We did not observe any O2 desorption from the molecular chemisorption state,which means that either the O2 molecules cannot reach this state directly, or thatmolecular chemisorption leads to dissociation (atomic chemisorption) at theexperimental surface temperature of 600 K.
1. Introduction
When a molecular beam collides with a Ag(l 11) surface, part of the particlesis trapped and the remainder is inelastically scattered [1,2]. While the inelasticallyscattered molecules keep memory of their incident speed and direction, the trappedparticles equilibrate with the surface and desorb after some time in a broad angulardistribution, which is symmetric around the surface normal. The direction andvelocity of desorbing particles only depend on the surface temperature and do notdepend on the characteristics of the incident beam. Therefore both the angular andvelocity distributions are different for directly scattered particles and desorbingparticles, and consequently we can distinguish between both by measuring angular
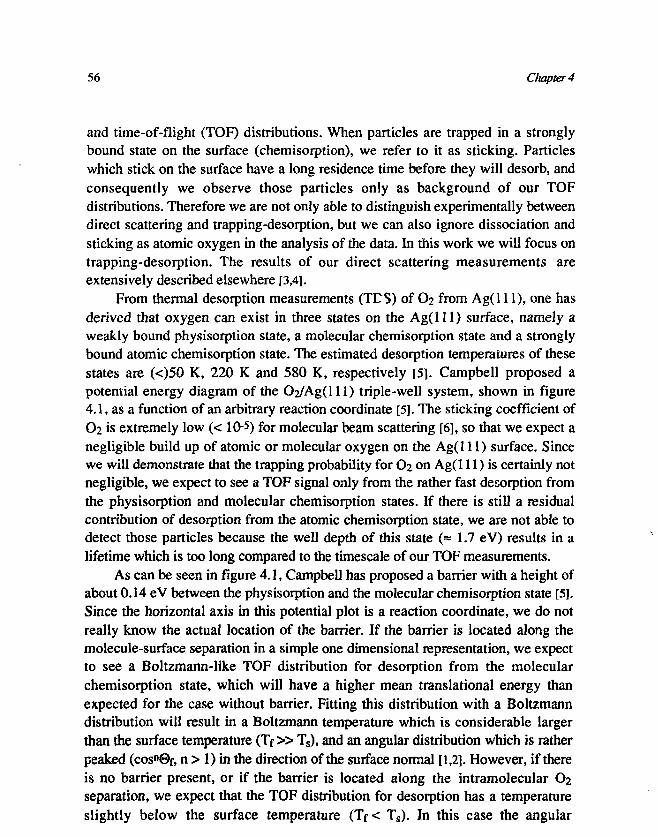
56 Chapter 4
and time-of-flight (TOF) distributions. When particles are trapped in a stronglybound state on the surface (chemisorption), we refer to it as sticking. Particleswhich stick on the surface have a long residence time before they will desorb, andconsequently we observe those particles only as background of our TOFdistributions. Therefore we are not only able to distinguish experimentally betweendirect scattering and trapping-desorption, but we can also ignore dissociation andsticking as atomic oxygen in the analysis of the data. In this work we will focus ontrapping-desorption. The results of our direct scattering measurements areextensively described elsewhere [3,4].
From thermal desorption measurements (TDS) of O2 from Ag(l l l ) , one hasderived that oxygen can exist in three states on the Ag( l l l ) surface, namely aweakly bound physisorption state, a molecular chemisorption state and a stronglybound atomic chemisorption state. The estimated desorption temperatures of thesestates are (<)50 K, 220 K and 580 K, respectively [5]. Campbell proposed apotential energy diagram of the C>2/Ag(lll) triple-well system, shown in figure4.1, as a function of an arbitrary reaction coordinate [5]. The sticking coefficient ofO2 is extremely low (< 105) for molecular beam scattering [6], so that we expect anegligible build up of atomic or molecular oxygen on the Ag(l 11) surface. Sincewe will demonstrate that the trapping probability for O2 on Ag(l 11) is certainly notnegligible, we expect to see a TOF signal only from the rather fast desorption fromthe physisorption and molecular chemisorption states. If there is still a residualcontribution of desorption from the atomic chemisorption state, we are not able todetect those particles because the well depth of this state (« 1.7 eV) results in alifetime which is too long compared to the timescale of our TOF measurements.
As can be seen in figure 4.1, Campbell has proposed a barrier with a height ofabout 0.14 eV between the physisorption and the molecular chemisorption state [5].Since the horizontal axis in this potential plot is a reaction coordinate, we do notreally know the actual location of the barrier. If the barrier is located along themolecule-surface separation in a simple one dimensional representation, we expectto see a Boltzmann-like TOF distribution for desorption from the molecularchemisorption state, which will have a higher mean translational energy thanexpected for the case without barrier. Fitting this distribution with a Boltzmanndistribution will result in a Boltzmann temperature which is considerable largerthan the surface temperature ( T r » Ts), and an angular distribution which is ratherpeaked (cosn@f, n > 1) in the direction of the surface normal [1,2]. However, if thereis no barrier present, or if the barrier is located along the intramolecular O2separation, we expect that the TOF distribution for desorption has a temperatureslightly below the surface temperature 0 7 < Ts). In this case the angular
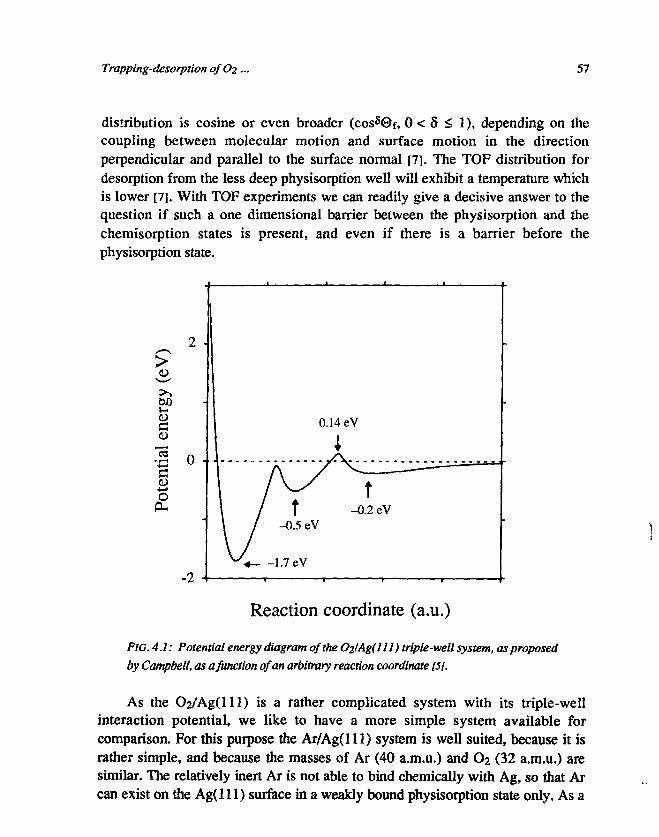
Trapping-desorption qfO2 — 57
distribution is cosine or even broader (coss0f, 0 < 8 < 1), depending on thecoupling between molecular motion and surface motion in the directionperpendicular and parallel to the surface normal [7]. The TOF distribution fordesorption from the less deep physisorption well will exhibit a temperature whichis lower [7]. With TOF experiments we can readily give a decisive answer to thequestion if such a one dimensional barrier between the physisorption and thechemisorption states is present, and even if there is a barrier before thephysisorption state.
>
E?S0 )
•B o •
* >
-2
0.14
iIV/ t' \ / -0.5eV
^•4 1.7eV
eV
t-0.2 eV
Reaction coordinate (a.u.)
FIG. 4.1: Potential energy diagram of the O2lAg(lll) triple-well system, as proposedby Campbell, as a function of an arbitrary reaction coordinate [S].
As the C>2/Ag(lll) is a rather complicated system with its triple-wellinteraction potential, we like to have a more simple system available forcomparison. For this purpose the Ar/Ag(lll) system is well suited, because it israther simple, and because the masses of Ar (40 a.m.u.) and O2 (32 a.m.u.) aresimilar. The relatively inert Ar is not able to bind chemically with Ag, so that Arcan exist on the Ag(l l l ) surface in a weakly bound physisorption state only. As a
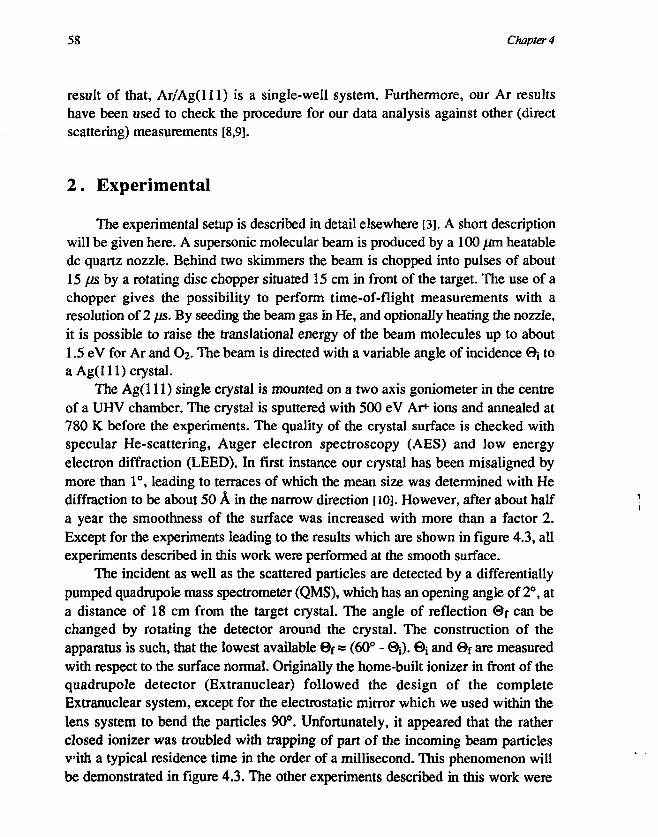
58 Chapter 4
result of that, Ar/Ag(lll) is a single-well system. Furthermore, our Ar resultshave been used to check the procedure for our data analysis against other (directscattering) measurements [8,9].
2. Experimental
The experimental setup is described in detail elsewhere [3]. A short descriptionwill be given here. A supersonic molecular beam is produced by a 100 /an heatabledc quartz nozzle. Behind two skimmers the beam is chopped into pulses of about15 fts by a rotating disc chopper situated 15 cm in front of the target. The use of achopper gives the possibility to perform time-of-flight measurements with aresolution of 2 /is. By seeding the beam gas in He, and optionally heating the nozzle,it is possible to raise the translational energy of the beam molecules up to about1.5 eV for Ar and O2. The beam is directed with a variable angle of incidence 0j toa Ag(l 11) crystal.
The Ag(l 11) single crystal is mounted on a two axis goniometer in the centreof a UHV chamber. The crystal is sputtered with 500 eV Ar+ ions and annealed at780 K before the experiments. The quality of the crystal surface is checked withspecular He-scattering, Auger electron spectroscopy (AES) and low energyelectron diffraction (LEED). In first instance our crystal has been misaligned bymore than 1°, leading to terraces of which the mean size was determined with Hediffraction to be about 50 A in the narrow direction [10]. However, after about halfa year the smoothness of the surface was increased with more than a factor 2.Except for the experiments leading to the results which are shown in figure 4.3, allexperiments described in this work were performed at the smooth surface.
The incident as well as the scattered particles are detected by a differentiallypumped quadrupole mass spectrometer (QMS), which has an opening angle of 2°, ata distance of 18 cm from the target crystal. The angle of reflection ©f can bechanged by rotating the detector around the crystal. The construction of theapparatus is such, that the lowest available ©f = (60° - ©i). ©j and ©f are measuredwith respect to the surface normal. Originally the home-built ionizer in front of thequadrupole detector (Extranuclear) followed the design of the completeExtranuclear system, except for the electrostatic mirror which we used within thelens system to bend the particles 90°. Unfortunately, it appeared that the ratherclosed ionizer was troubled with trapping of part of the incoming beam particlesvith a typical residence time in the order of a millisecond. This phenomenon willbe demonstrated in figure 4.3. The other experiments described in this work were
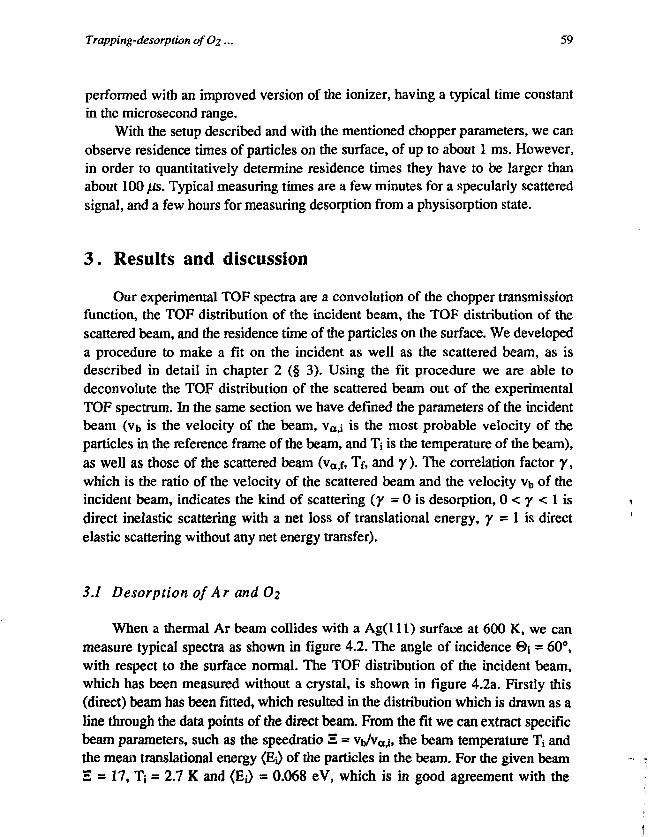
Trapping-desorption ofC>2... 59
performed with an improved version of the ionizer, having a typical time constantin the microsecond range.
With the setup described and with the mentioned chopper parameters, we canobserve residence times of particles on the surface, of up to about 1 ms. However,in order to quantitatively determine residence times they have to be larger thanabout 100 pis. Typical measuring times are a few minutes for a specularly scatteredsignal, and a few hours for measuring desorption from a physisorption state.
3 . Results and discussion
Our experimental TOF spectra are a convolution of the chopper transmissionfunction, the TOF distribution of the incident beam, the TOF distribution of thescattered beam, and the residence time of the particles on the surface. We developeda procedure to make a fit on the incident as well as the scattered beam, as isdescribed in detail in chapter 2 (§ 3). Using the fit procedure we are able todeconvolute the TOF distribution of the scattered beam out of the experimentalTOF spectrum. In the same section we have defined the parameters of the incidentbeam (vb is the velocity of the beam, vttij is the most probable velocity of theparticles in the reference frame of the beam, and Tj is the temperature of the beam),as well as those of the scattered beam (va<f, Tf, and y) . The correlation factor y,which is the ratio of the velocity of the scattered beam and the velocity Vb of theincident beam, indicates the kind of scattering (y = 0 is desorption, 0 < y < 1 isdirect inelastic scattering with a net loss of translational energy, y = 1 is directelastic scattering without any net energy transfer).
3.1 Desorption of Ar and O2
When a thermal Ar beam collides with a Ag(l 11) surface at 600 K, we canmeasure typical spectra as shown in figure 4.2. The angle of incidence ©i = 60°,with respect to the surface normal. The TOF distribution of the incident beam,which has been measured without a crystal, is shown in figure 4.2a. Firstly this(direct) beam has been fitted, which resulted in the distribution which is drawn as aline through the data points of the direct beam. From the fit we can extract specificbeam parameters, such as the speedratio S = Vb/va>j, the beam temperature Tj andthe mean translational energy (Ej) of the particles in the beam. For the given beamS = 17, Tj = 2.7 K and (Ej> = 0.068 eV, which is in good agreement with the
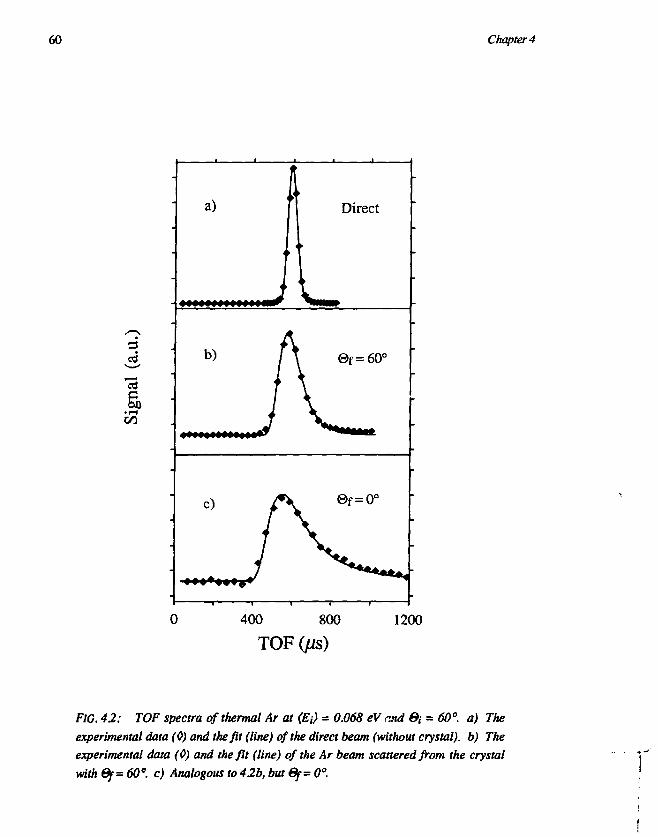
60 Chapter 4
Id
on
1200
F/G. 42: TOF spectra of thermal Ar at (Ei) = 0.068 eV and &i = 60°. a) Theexperimental data (0) and the fit (line) of the direct beam (without crystal), b) Theexperimental data (0) and the fit (line) of the Ar beam scattered from the crystalwith 0f=6O°. c) Analogous to 42b, but Sf= 0°.
Trapping-desorption of O2 ... 61
expected values for a supersonic beam of thermal Ar [8]. The distribution of thedirect beam then can be used for fitting the spectrum of scattered particles. As anexample we have taken the specularly reflected spectrum (0f = ©j = 60°), which isshown in figure 4.2b together with the best fit (line). From the fitted distributionwe can determine the specific scattering parameters, such as the correlation factory= 0.91, the beam temperature Tf = 75 K and mean translational energy of thescattered particles <Ef> = 0.078 eV. We see that the beam temperature Tf isconsiderably higher than the temperature Tj of the incident beam (= 2.7 K), but thatit is not yet comparable with the surface temperature Ts (= 600 K). Although thesurface temperature is most probably the origin of the heating, the collidingparticles do not equilibrate with the surface and therefore the heating is limited.The translational energy loss which is suggested by y< 1 is (over)compensated bythe heating of the scattered beam, so that the mean energy (Ef) can be higher thanthe mean incident energy. From these numbers it is clear that we observe directinelastic scattering under these conditions. Another spectrum of scattered particles,which is shown in figure 4.2c, has been measured in the direction of the surfacenormal (0f = 0°). From the fitted distribution we have derived the parametersy= 0, Tf = 560 K (± 20 K) and <Ef> = 0.096 eV. The fact that y = 0 is an indicationthat we see desorption. Contrary to the ©f = 60° case, the temperature of the beamTf is almost the same as the surface temperature Ts (= 600 K). The fact that Tf issomewhat smaller than Ts will be shown to occur also in the case of O2 scatteringfrom Ag(l 11), and will be discussed later.
If the experimental signal is built up by more than one contribution, or whenthe scattering process exhibits a non-Boltzmann behaviour, we have to replace the(shifted) Boltzmann distribution Sf (given in chapter 2 equation 2.4b) by a TOFdistribution which describes the expected situation. As an example we have takenthe scattering of O2 at (Ej) = 0.2 eV and ©i = 60° from a stepped Ag(l 11) surface,where the steps were exposed to the incident beam. Furthermore the ionizer infront of the quadrupole detector has a large time constant, which resulted in a tail atlarge flight times. The measured spectrum is shown in figure 4.3a. As can be seenin the same figure, the best fit (line) with the originally proposed shifted Boltzmanndistribution is not in agreement with the data. That the inaccuracy of the fit is notdue to the fit procedure becomes clear when we look to the Boltzmann curve,where we can see that fitting the leading edge with a Boltzmann distribution willautomatically prevent a good fit of the other edge. If we replace the Boltzmanndistribution (equation 2.4b) by a sum of two (shifted) Boltzmann distributions,representing scattering from terraces and from steps respectively, we get a muchbetter although not perfect agreement, as can be seen in figure 4.3b. Contrary to
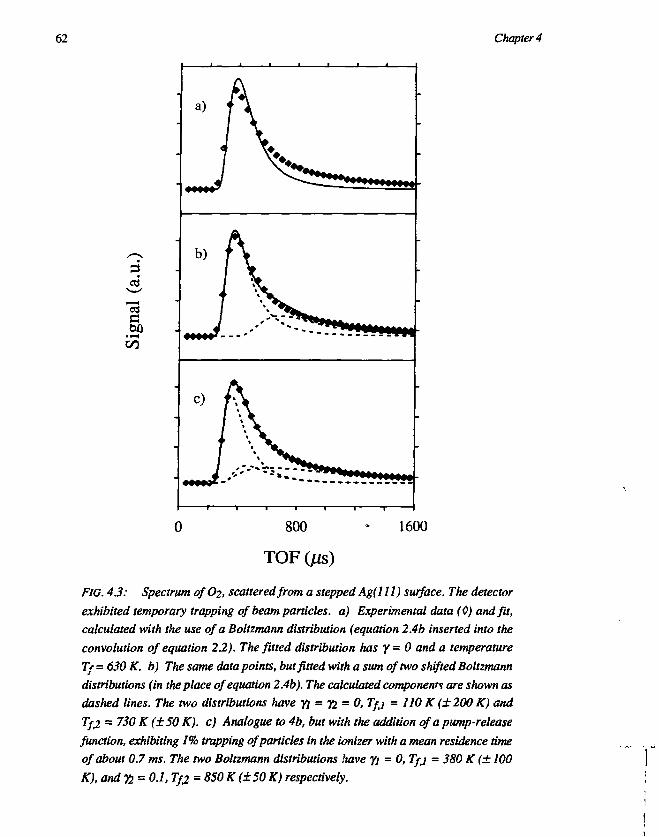
62 Chapter 4
*a
CO
0 800
TOF (/is)
1600
/7G. 4.3: Spectrum of02, scattered from a stepped Ag(lll) surface. The detector
exhibited temporary trapping of beam particles, a) Experimental data (0) and fit,
calculated with the use of a Boltzmann distribution (equation 2.4b inserted into the
convolution of equation 2.2). The fitted distribution has y= 0 and a temperature
T/=630K. b) The same data points, but fitted with a sum of two shifted Boltzmann
distributions (in the place of equation 2.4b). The calculated components are shown as
dashed lines. The two distributions have Yi = ft = 0, Tfj = 110 K (±200 K) and
Tf2 = 750 K (±50 K). c) Analogue to 4b, but with the addition of a pump-release
function, exhibiting 1% trapping of particles in the ionizer with a mean residence time
of about 0.7 ms. The two Boltzmann distributions liave Ji = 0, T/j = 380 K (± 100
K), andn = 0.1, Tp = 850 K (±50 K) respectively.
Trapping-desorption ofO2... 63
what we expect in the case of different scattering processes, the two distributionsappear to have the same y, namely yi - 7i = 0 , which points to desorptionprocesses. Furthermore, the temperatures of the two components (Tfti = 110 K,Tf,2 = 730 K) are very much different from the surface temperature Ts = 600 K,which suggests that either the two components are not due to desorption, or the fithas not found realistic components. The latter is in agreement with the observeddeviation between fit and data. Improving the fit possibly requires an additionalcontribution. We know that the ionizer exhibits trapping with probability pnap andwith a certain time constant £,. We have modeled this trapping by the functionNtrapped(t) = / dt* Nin(t*)-ptrap-e^t't*)/^. Adding this function to the assumedscattering distributions results in an almost perfect agreement between data and fit,as can be seen in figure 4.3c. In this case one y remains the same (y\ = 0) whichstill suggests that one component is due to desorption. The other y slightly increases(72 = 0.1), which could refer to direct inelastic scattering from e.g. steps. If thecomponent with y= 0 is desorption, then the temperature Tf,i = 380 K (± 100 K)has to be equal or smaller than the surface temperature Ts = 600 K, which is indeedthe case. The difference between Tf.i and Ts is larger than we have observed for Ar(see figure 4.2c). The temperature of the second component Tf,2 = 850 K (± 50 K)is much higher than the surface temperature Ts, which points to direct scatteringrather than desorption. The probability for trapping in the ionizer appeared to be1%, with a mean residence time of about 0.7 ms. Increasing the incident energy upto about 1 eV (0i = 60°) caused the desorption component to disappear. Anincrease of the scattering angle ©f from 0° up to specular (Ei = 0.2 eV), caused thedesorption contribution to disappear at the cost of the direct scattering component.The latter exhibited an increase of y from 0.1 at ©f=0° up to about 0.8 at 0f = 60°.
In the given example we were able to verify the relative contributions of thethree components of the distribution Sf, by rotating the crystal surface 180° andreplacing the ionizer by an open one. In this way the second (direct scattering) andthird (ionizer) contribution have been removed, leaving the first one, attributed totrapping followed by desorption, unchanged. This demonstrates that our analysiscan separate desorption from other contributions. The next experiments wereperformed with a smooth Ag(l l l ) surface.
Figure 4.4a shows an experimental TOF spectrum of O2, which has beenmeasured in the direction of the surface normal (@f = 0°), from the Ag( l l l )surface at temperature Ts = 600 K. The mean translational energy of the incidentbeam (Ej) = 0.1 eV at an incident angle ©i = 60°. The best fit of the experimentaldata was a non-shifted Boltzmann distribution (y- 0) with a temperature Tf = 475K (± 20 K). The fact that y= 0 and the quality of the fit are indications that we
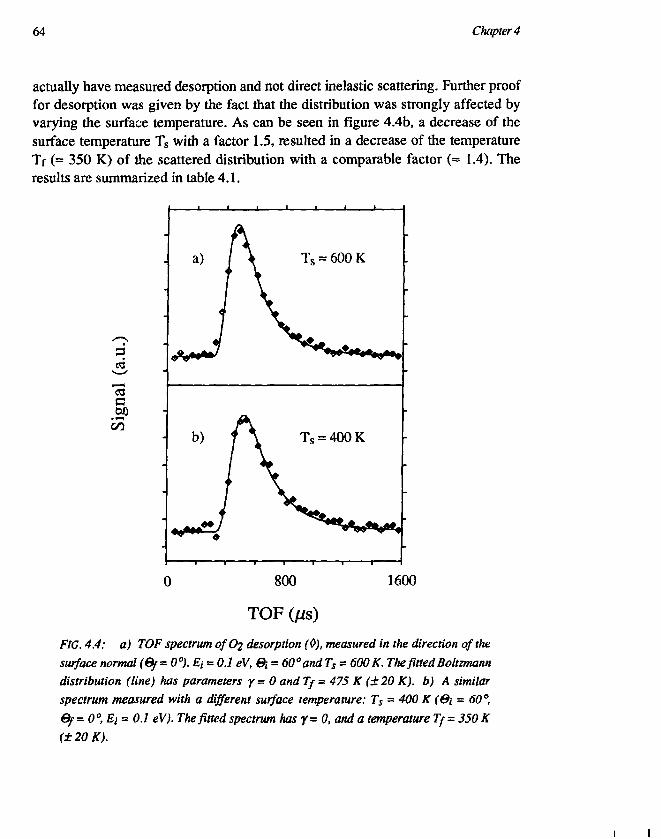
64 Chapter 4
actually have measured desorption and not direct inelastic scattering. Further prooffor desorption was given by the fact that the distribution was strongly affected byvarying the surface temperature. As can be seen in figure 4.4b, a decrease of thesurface temperature Ts with a factor 1.5, resulted in a decrease of the temperatureTf (= 350 K) of the scattered distribution with a comparable factor (= 1.4). Theresults are summarized in table 4.1.
as
COC
a) = 600 K
b) Ts = 400 K
800
TOF (fis)
1600
FIG. 4.4: a) TOF spectrum ofOi desorption (0), measured in the direction of the
surface normal (Of- 0°). Et = 0.1 eV, 9i = 60°andTs = 600 K. The fitted Boltzmann
distribution (line) has parameters y = 0 and Tf = 475 K (±20 K). b) A similar
spectrum measured with a different surface temperature: Ts = 400 K (&i = 60°,
fy=0°,Ej = 0.1 eV). The fitted spectrum hasy=O,anda temperature T/=350K
(±20 K).
Trapping-desorption of 02 — 65
The fact that the translational temperature Tf of a desorption distribution islower than the surface temperature Ts, has already been observed experimentallyfor Ar and CH4 from Pt ( l l l ) [11,12], and theoretically treated by Tully andMuhlhausen for scattering of Ar, Xe and NO from Ag(l l l ) [13-15]. The fact thatTf < Ts is not in contradiction with an equilibrium, and from detailed-balancearguments one can derive that it indicates that the trapping probability decreaseswith increasing incident energy [7,12]. This has been confirmed in our experiments,where we have measured that the trapping-desorption of O2 drastically decreasedwith incident energy.
3.2 Trapping probability
In order to determine the trapping probability Ptrap of thermal O2 on Ag(l 11),we have to distinguish between the number of particles N,jes that desorb (aftertrapping) and the number of particles N^ai that are scattered directly. Because wewill demonstrate elsewhere that sticking (strong binding) of O2 on Ag(l 11) is veryimprobable [6], the sum of trapping-desorbed particles (Naes) and directly scatteredparticles (Nscat) is equal to the number of incident particles (NO. If we assume thatthe angular distribution of desorption is a cosine around the surface normal in bothin-plane (@f) and out-of-plane (<]>f) direction, we can estimate NdCS, if we know thenumber of particles which desorb in the direction of the surface normal. Nscat canbe derived from the desorption-corrected experimental angular distribution (in-plane), if we assume that the angular distribution in the out-of-plane (<j>f) directionis the same as measured by Asada (FWHM * 16°) [9] and is not dependent on ©f.
The TOF spectrum for desorption, which is shown in figure 4.4a, has beenmeasured with a density detector, while we need a flux distribution to determine thetrapping probability. However, the fitted distribution can be converted into a fluxdistribution. After integration of the converted TOF distribution, we know thedesorption flux in the direction of the surface normal. With this value, and knowingthat the angular distribution of the desorption signal is a cosine in both in-plane andout-of-plane direction, we can determine the total desorption flux Njes- For thedetermination of N^at we need the angular flux distribution of O2 scattering, whichis shown in figure 4.5. This distribution was obtained by measuring TOF spectra asa function of 0f. The TOF spectra are firstly converted from density into flux, andsubsequently integrated. Because the measuring conditions of the data points in theangular distribution are different from those of the desorption spectrum (figure4.4a), the points in figure 4.5 have to be rescaled. This can be done by making sure
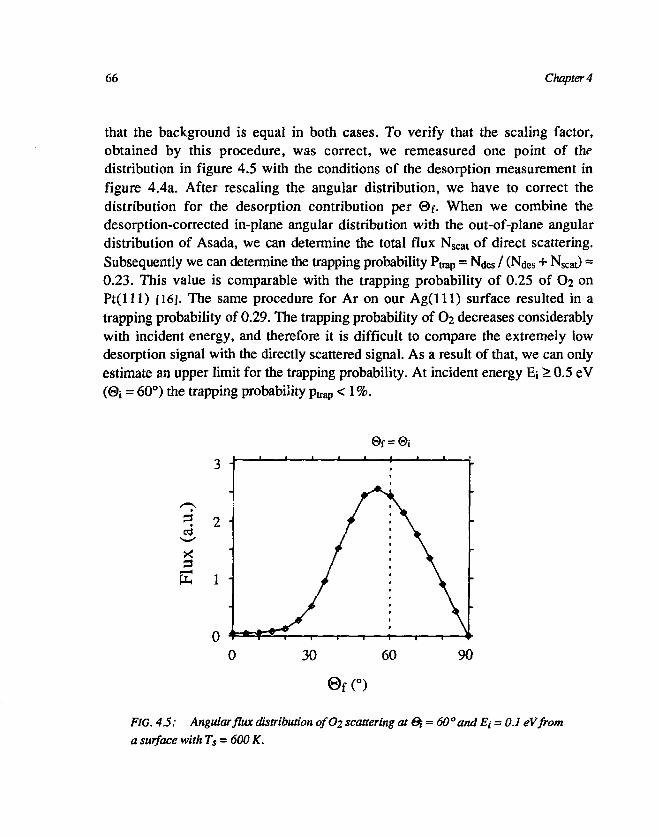
66 Chapter 4
that the background is equal in both cases. To verify that the scaling factor,obtained by this procedure, was correct, we remeasured one point of thedistribution in figure 4.5 with the conditions of the desorption measurement infigure 4.4a. After rescaling the angular distribution, we have to correct thedistribution for the desorption contribution per ©f. When we combine thedesorption-corrected in-plane angular distribution with the out-of-plane angulardistribution of Asada, we can determine the total flux Nscat of direct scattering.Subsequently we can determine the trapping probability Puap = N ^ / (Ndes + N^O =0.23. This value is comparable with the trapping probability of 0.25 of O2 onPt ( l l l ) [16]. The same procedure for Ar on our Ag( l l l ) surface resulted in atrapping probability of 0.29. The trapping probability of O2 decreases considerablywith incident energy, and therefore it is difficult to compare the extremely lowdesorption signal with the directly scattered signal. As a result of that, we can onlyestimate an upper limit for the trapping probability. At incident energy Ei > 0.5 eV(©i = 60°) the trapping probability ptrap < 1%.
= 2
x3
FIG. 45: Angular flux distribution o/<?2 scattering at &i = 60° and Ei = 0.1 eVfroma surface with Ts = 600 K.
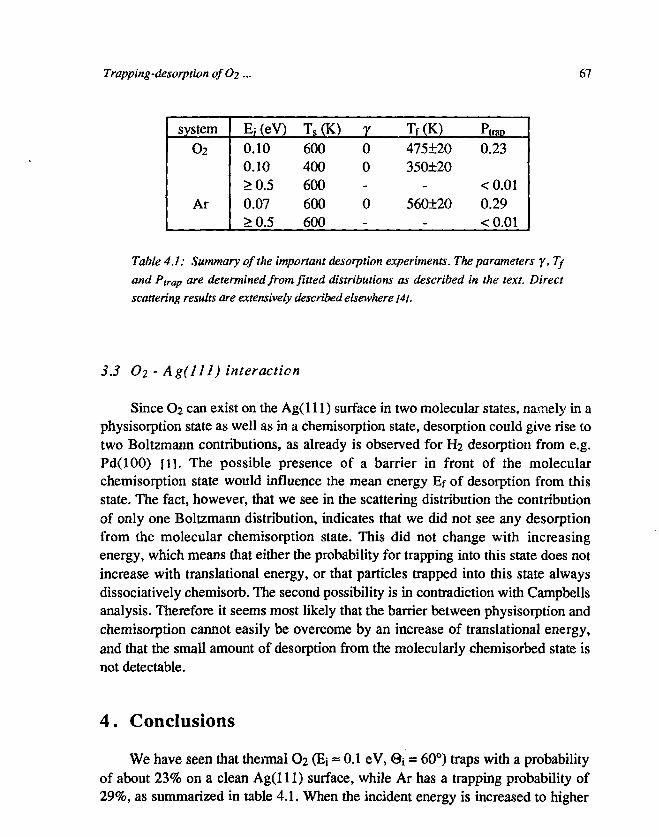
Trapping-desorption ofC>2 ... 67
system
0 2
Ar
E; (eV)0.100.10>0.50.07>0.5
TS(K)600400600600600
700-
0-
Tf(K)475±20350+20
-
560+20-
PtraD0.23
<0.010.29<0.01
Table 4.1: Summary of the important desorption experiments. The parameters y, Tf
and Ptrap are determined from fitted distributions as described in the text. Direct
scattering results are extensively described elsewhere [4],
3.3 O2 - Ag(lll) interaction
Since O2 can exist on the Ag(l 11) surface in two molecular states, namely in aphysisorption state as well as in a chemisorption state, desorption could give rise totwo Boltzmann contributions, as already is observed for H2 desorption from e.g.Pd(100) [l] . The possible presence of a barrier in front of the molecularchemisorption state would influence the mean energy Ef of desorption from thisstate. The fact, however, that we see in the scattering distribution the contributionof only one Boltzmann distribution, indicates that we did not see any desorptionfrom the molecular chemisorption state. This did not change with increasingenergy, which means that either the probability for trapping into this state does notincrease with translational energy, or that particles trapped into this state alwaysdissociatively chemisorb. The second possibility is in contradiction with Campbellsanalysis. Therefore it seems most likely that the barrier between physisorption andchemisorption cannot easily be overcome by an increase of translational energy,and that the small amount of desorption from the molecularly chemisorbed state isnot detectable.
4. Conclusions
We have seen that thermal O2 (Ei« 0.1 eV, Qx = 60°) traps with a probabilityof about 23% on a clean Ag(l 11) surface, while Ar has a trapping probability of29%, as summarized in table 4.1. When the incident energy is increased to higher
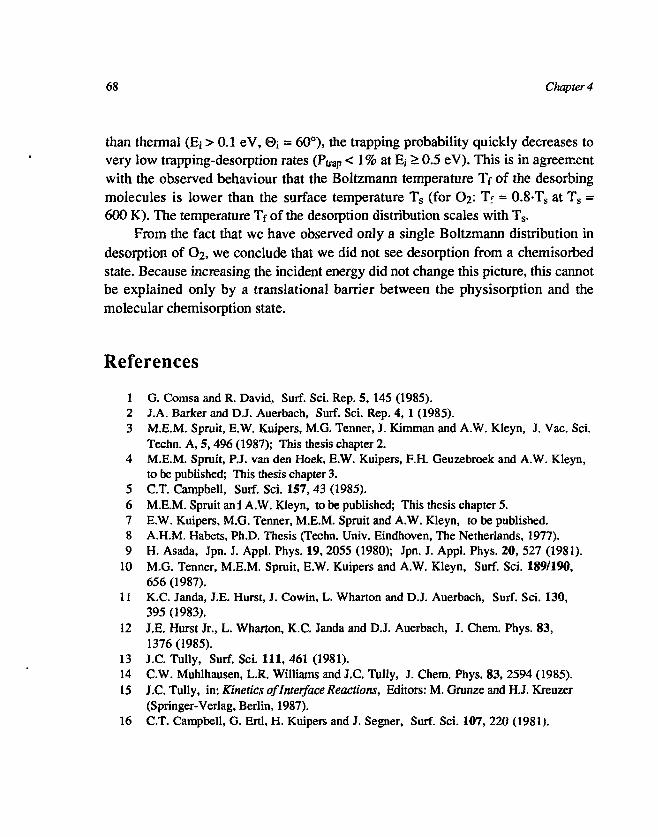
68 Chapter 4
than thermal (Ej > 0.1 eV, ©j = 60°), the trapping probability quickly decreases tovery low trapping-desorption rates (Ptrap < 1% at E; > 0.5 eV). This is in agreementwith the observed behaviour that the Boltzmann temperature Tf of the desorbingmolecules is lower than the surface temperature Ts (for O2: Tf = 0.8-Ts at Ts =600 K). The temperature Tf of the desorption distribution scales with Ts.
From the fact that we have observed only a single Boltzmann distribution indesorption of O2, we conclude that we did not see desorption from a chemisorbedstate. Because increasing the incident energy did not change this picture, this cannotbe explained only by a translational barrier between the physisorption and themolecular chemisorption state.
References
1 G. Comsa and R. David, Surf. Sci. Rep. 5, 145 (1985).2 J.A. Barker and D.J. Auerbach, Surf. Sci. Rep. 4, 1 (1985).3 M.E.M. Spruit, E.W. Kuipers, M.G. Tenner, J. Kimman and A.W. Kleyn, J. Vac. Sci.
Techn. A, 5,496 (1987); This thesis chapter 2.4 M.E.M. Spruit, PJ. van den Hoek, E.W. Kuipers, F.H. Geuzebroek and A.W. Kleyn,
to be published; This thesis chapter 3.5 C.T. Campbell, Surf. Sci. 157, 43 (1985).6 M.E.M. Spruit an i A.W. Kleyn, to be published; This thesis chapter 5.7 E.W. Kuipers, M.G. Tenner, M.E.M. Spruit and A.W. Kleyn, to be published.8 A.H.M. Habets, Ph.D. Thesis (Techn. Univ. Eindhoven, The Netherlands, 1977).9 H. Asada, Jpn. J. Appl. Phys. 19, 2055 (1980); Jpn. J. Appl. Phys. 20, 527 (1981).
10 M.G. Tenner, M.E.M. Spruit, E.W. Kuipers and A.W. Kleyn, Surf. Sci. 189/190,656(1987).
11 K.C. Janda, J.E. Hurst, J. Cowin, L. Wharton and DJ. Auerbach, Surf. Sci. 130,395 (1983).
12 J.E. Hurst Jr., L. Wharton, K.C. Janda and D.J. Auerbach, J. Chem. Phys. 83,1376 (1985).
13 J.C. Tully, Surf. Sci. I l l , 461 (1981).14 C.W. Muhlhausen, L.R. Williams and J.C. Tully, J. Chem. Phys. 83, 2594 (1985).15 J.C. Tully, in: Kinetics of Interface Reactions, Editors: M. Grunze and H.J. Kreuzer
(Springer-Verlag, Berlin, 1987).16 C.T. Campbell, G. Ertl, H. Kuipers and J. Segner, Surf. Sci. 107, 220 (1981).
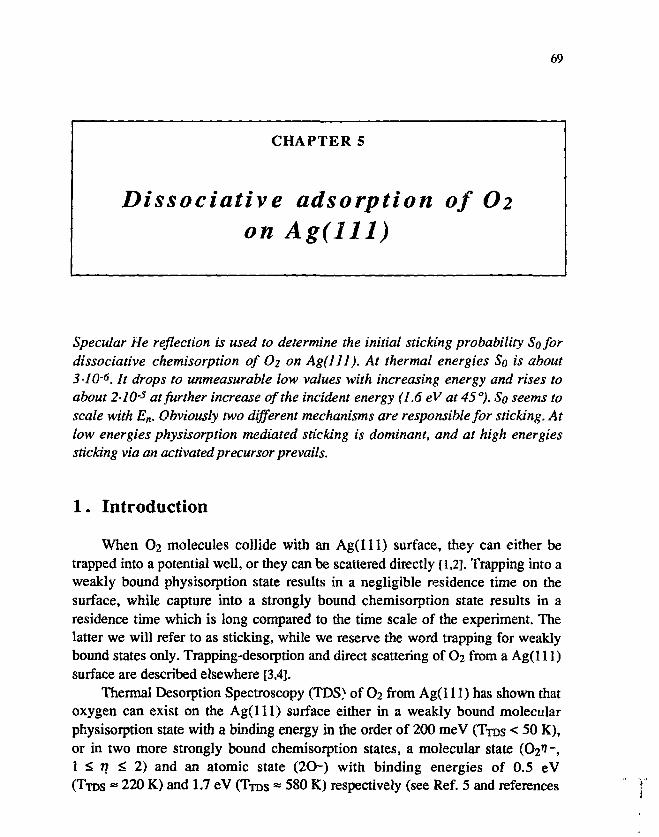
69
CHAPTER 5
Dissociative adsorption of O2on Ag(lll)
Specular He reflection is used to determine the initial sticking probability So fordissociative chemisorption of O2 on Ag(lll). At thermal energies So is about3-10'6. It drops to unmeasurable low values with increasing energy and rises toabout 2-lO~s at further increase of the incident energy (1.6 eV at 45°). So seems toscale with En. Obviously two different mechanisms are responsible for sticking. Atlow energies physisorption mediated sticking is dominant, and at high energiessticking via an activated precursor prevails.
1. Introduction
When O2 molecules collide with an Ag( l l l ) surface, they can either betrapped into a potential well, or they can be scattered directly [1,2]. Trapping into aweakly bound physisorption state results in a negligible residence time on thesurface, while capture into a strongly bound chemisorption state results in aresidence time which is long compared to the time scale of the experiment. Thelatter we will refer to as sticking, while we reserve the word trapping for weaklybound states only. Trapping-desorption and direct scattering of O2 from a Ag(l 11)surface are described elsewhere [3,4].
Thermal Desorption Spectroscopy (TDS) of O2 from Ag(l 11) has shown thatoxygen can exist on the Ag( l l l ) surface either in a weakly bound molecularphysisorption state with a binding energy in the order of 200 meV (TTDS < 50 K),or in two more strongly bound chemisorption states, a molecular state (CM",1 £ n <= 2) and an atomic state (2O-) with binding energies of 0.5 eV(TTDS = 220 K) and 1.7 eV (TTDS « 580 K) respectively (see Ref. 5 and references
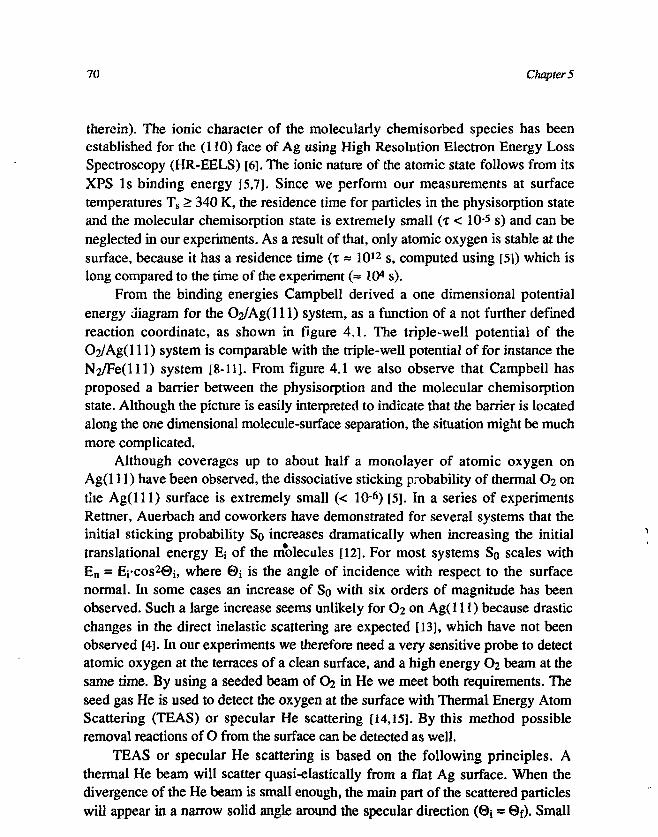
70 Chapter 5
therein). The ionic character of the molecularly chemisorbed species has beenestablished for the (110) face of Ag using High Resolution Electron Energy LossSpectroscopy (HR-EELS) [6]. The ionic nature of the atomic state follows from itsXPS Is binding energy [5,7]. Since we perform our measurements at surfacetemperatures Ts > 340 K, the residence time for particles in the physisorption stateand the molecular chemisorption state is extremely small (T < 10"5 s) and can beneglected in our experiments. As a result of that, only atomic oxygen is stable at thesurface, because it has a residence time (x = 1012 s, computed using [5]) which islong compared to the time of the experiment (= 104 s).
From the binding energies Campbell derived a one dimensional potentialenergy diagram for the O2/Ag(lll) system, as a function of a not further definedreaction coordinate, as shown in figure 4.1. The triple-well potential of theO2/Ag(l 11) system is comparable with the triple-well potential of for instance theN2/Fe(lll) system [8-11]. From figure 4.1 we also observe that Campbell hasproposed a barrier between the physisorption and the molecular chemisorptionstate. Although the picture is easily interpreted to indicate that the barrier is locatedalong the one dimensional molecule-surface separation, the situation might be muchmore complicated.
Although coverages up to about half a monolayer of atomic oxygen onAg(l 11) have been observed, the dissociative sticking probability of thermal O2 onthe Ag( l l l ) surface is extremely small (< 1O6) [5]. In a series of experimentsRettner, Auerbach and coworkers have demonstrated for several systems that theinitial sticking probability So increases dramatically when increasing the initialtranslational energy Ei of the molecules [12]. For most systems So scales withEn = Ej-cos2©i, where ©i is the angle of incidence with respect to the surfacenormal. In some cases an increase of So with six orders of magnitude has beenobserved. Such a large increase seems unlikely for O2 on Ag(l 11) because drasticchanges in the direct inelastic scattering are expected [13], which have not beenobserved [4]. In our experiments we therefore need a very sensitive probe to detectatomic oxygen at the terraces of a clean surface, and a high energy O2 beam at thesame time. By using a seeded beam of O2 in He we meet both requirements. Theseed gas He is used to detect the oxygen at the surface with Thermal Energy AtomScattering (TEAS) or specular He scattering [14,15]. By this method possibleremoval reactions of O from the surface can be detected as well.
TEAS or specular He scattering is based on the following principles. Athermal He beam will scatter quasi-elastically from a flat Ag surface. When thedivergence of the He beam is small enough, the main part of the scattered particleswill appear in a narrow solid angle around the specular direction (©i = 0f). Small
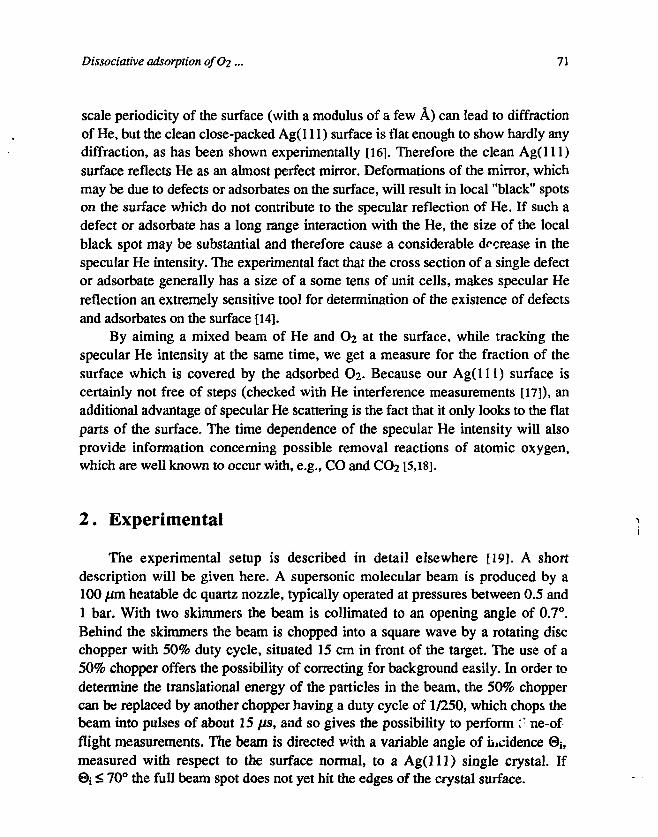
Dissociative adsorption o/(?2... 71
scale periodicity of the surface (with a modulus of a few A) can lead to diffractionof He, but the clean close-packed Ag(l 11) surface is flat enough to show hardly anydiffraction, as has been shown experimentally [16]. Therefore the clean Ag(l l l )surface reflects He as an almost perfect mirror. Deformations of the mirror, whichmay be due to defects or adsorbates on the surface, will result in local "black" spotson the surface which do not contribute to the specular reflection of He. If such adefect or adsorbate has a long range interaction with the He, the size of the localblack spot may be substantial and therefore cause a considerable decrease in thespecular He intensity. The experimental fact that the cross section of a single defector adsorbate generally has a size of a some tens of unit cells, makes specular Hereflection an extremely sensitive tool for determination of the existence of defectsand adsorbates on the surface [14].
By aiming a mixed beam of He and O2 at the surface, while tracking thespecular He intensity at the same time, we get a measure for the fraction of thesurface which is covered by the adsorbed O2. Because our Ag( l l l ) surface iscertainly not free of steps (checked with He interference measurements [17]), anadditional advantage of specular He scattering is the fact that it only looks to the flatparts of the surface. The time dependence of the specular He intensity will alsoprovide information concerning possible removal reactions of atomic oxygen,which are well known to occur with, e.g., CO and CO2 [5,18].
2. Experimental
The experimental setup is described in detail elsewhere [19]. A shortdescription v/ill be given here. A supersonic molecular beam is produced by a100 yon. heatable dc quartz nozzle, typically operated at pressures between 0.5 and1 bar. With two skimmers the beam is collimated to an opening angle of 0.7°.Behind the skimmers the beam is chopped into a square wave by a rotating discchopper with 50% duty cycle, situated 15 cm in front of the target. The use of a50% chopper offers the possibility of correcting for background easily. In order todetermine the translational energy of the particles in the beam, the 50% choppercan be replaced by another chopper having a duty cycle of 1/250, which chops thebeam into pulses of about 15 /is, and so gives the possibility to perform :' ne-offlight measurements. The beam is directed with a variable angle of incidence 0$,measured with respect to the surface normal, to a Ag( l l l ) single crystal. If©i < 70° the full beam spot does not yet hit the edges of the crystal surface.
72 Chapters
The Ag(l 11) crystal, which is mounted on a two axis goniometer in the centerof a UHV chamber, is sputtered with 500 eV Ar+ ions and annealed at 780 K beforethe experiments. The quality of the crystal surface is checked with specular He-scattering, Auger electron spectroscopy (AES) and low energy electron diffraction(LEED). The surface of our crystal appeared to be misaligned about 1° from the(111) plane. The crystal was Auger clean as seen by AES, and showed a clear lxlLEED pattern.
The incident as well as the scattered particles are detected by a differentiallypumped quadrupole mass spectrometer (QMS), which has an opening angle of 2°, ata distance of 18 cm from the target crystal. The angle of reflection ©f can bechanged by rotating the detector around the crystal. The construction of theapparatus is such, that the lowest available ©f = (60° - ©0, where ©f is measuredwith respect to the surface normal.
For the measurements described in this work not much care was taken to bakethe UHV system, because a Ag crystal is very inert. However, at a total backgroundpressure in the main chamber of 3-10^9 mbar, substantial partial pressures{- 10-9 mb) of H2 (mass = 2) and CO (mass = 28), and somewhat less (= 1010 mb) ofH2O (mass = 18) and CO2 (mass = 44) were present. When a 300 K He beam wasswitched on the background pressure in the main chamber increased up to about2-10-8 mbar. The flux of the beam behind the chopper was determined bymeasurements of the pressure rise, and appeared to be about 1.2-1015 molecules/s,assuming a pumping speed of the system of 5001/s as given by the manufacturer ofthe turbo molecular pump used to pump the UHV chamber.
3 . Results and discussion
3.1 Determination of the initial sticking probability
In order to determine the initial sticking probability So of O2 on the Ag(l 11)crystal, we have to expose the crystal to a known amount of O2. Because very largeexposures are necessary we used the molecular beam for dosing. Therefore wehave mixed a known amount (2%, which is enriched with a factor 2 [20]) of O2 intothe He beam. By this action (seeding), the mean translational energy of the O2molecules increased considerably (up to 0.5 eV), while the mean translationalenergy of He slightly decreases. We have determined the energies by performingTOF measurements, which were fitted with a shifted Boltzmann distribution [3].The translational energy of the O2 molecules can be varied by heating the nozzle to
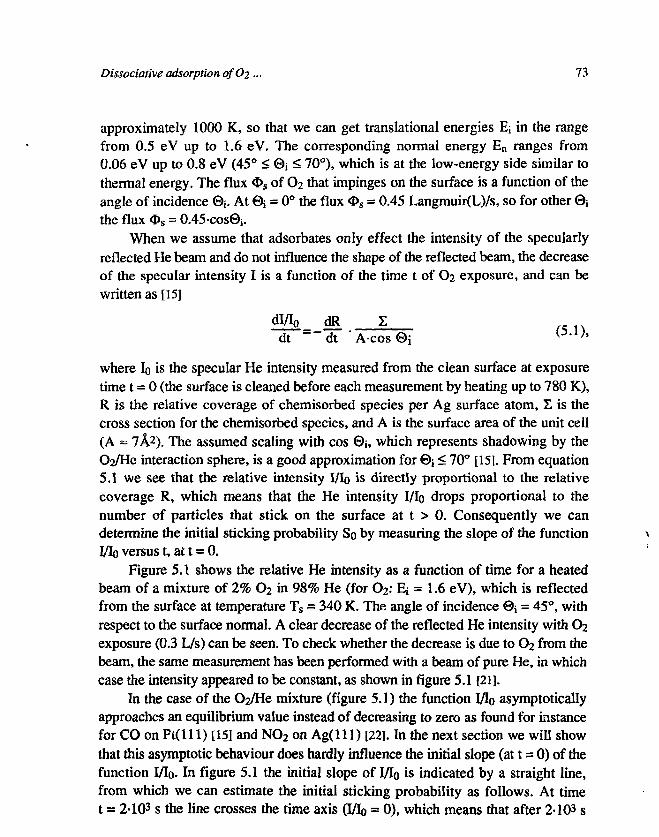
Dissociative adsorption 0/02 — 73
approximately 1000 K, so that we can get translational energies Ei in the rangefrom 0.5 eV up to 1.6 eV. The corresponding normal energy En ranges from0.06 eV up to 0.8 eV (45° < ©i < 70°), which is at the low-energy side similar tothermal energy. The flux <E>S of O2 that impinges on the surface is a function of theangle of incidence 6i. At ©i = 0° the flux Os = 0.45 Langmuir(L)/s, so for other 0jthe flux * s = O.45-cos0j.
When we assume that adsorbates only effect the intensity of the specularlyreflected He beam and do not influence the shape of the reflected beam, the decreaseof the specular intensity I is a function of the time t of O2 exposure, and can bewritten as [15]
_ . { 5 1 )
dt " dt Acos©i KD'lh
where Io is the specular He intensity measured from the clean surface at exposuretime t = 0 (the surface is cleaned before each measurement by heating up to 780 K),R is the relative coverage of chemisorbed species per Ag surface atom, Z is thecross section for the chemisorbed species, and A is the surface area of the unit cell(A ~ 7A2). The assumed scaling with cos ©j, which represents shadowing by the02/He interaction sphere, is a good approximation for ©j < 70° [15]. From equation5.1 we see that the relative intensity I/Io is directly proportional to the relativecoverage R, which means that the He intensity I/Io drops proportional to thenumber of particles that stick on the surface at t > 0. Consequently we candetermine the initial sticking probability So by measuring the slope of the functionl/Io versus t, at t = 0.
Figure 5.1 shows the relative He intensity as a function of time for a heatedbeam of a mixture of 2% O2 in 98% He (for O2: Ej = 1.6 eV), which is reflectedfrom the surface at temperature Ts = 340 K. The angle of incidence ©i = 45°, withrespect to the surface normal. A clear decrease of the reflected He intensity with O2exposure (0.3 L/s) can be seen. To check whether the decrease is due to O2 from thebeam, the same measurement has been performed with a beam of pure He, in whichcase the intensity appeared to be constant, as shown in figure 5.1 [21].
In the case of the 02/He mixture (figure 5.1) the function I/Io asymptoticallyapproaches an equilibrium value instead of decreasing to zero as found for instancefor CO on Pt ( l l l ) [15] and NO2 on Ag(l l l ) [22]. In the next section we will showthat this asymptotic behaviour does hardly influence the initial slope (at t = 0) of thefunction I/Io. In figure 5.1 the initial slope of I/Io is indicated by a straight line,from which we can estimate the initial sticking probability as follows. At timet = 2-103 s the line crosses the time axis (I/Io = 0), which means that after 2-103 s
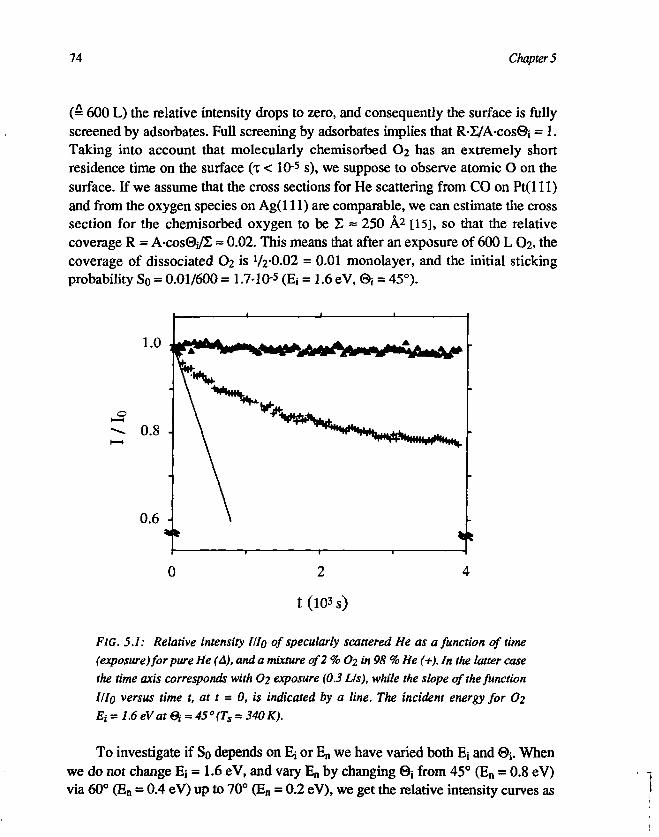
74 Chapter 5
(= 600 L) the relative intensity drops to zero, and consequently the surface is fullyscreened by adsorbates. Full screening by adsorbates implies that R-iyA-cos©; = 1.Taking into account that molecularly chemisorbed O2 has an extremely shortresidence time on the surface (T < 10"5 s), we suppose to observe atomic O on thesurface. If we assume that the cross sections for He scattering from CO on Pt(l 11)and from the oxygen species on Ag(l 11) are comparable, we can estimate the crosssection for the chemisorbed oxygen to be Z ~ 250 A2 [15], so that the relativecoverage R = A-cos0/£ = 0.02. This means that after an exposure of 600 L O2, thecoverage of dissociated O2 is 72-0.02 = 0.01 monolayer, and the initial stickingprobability So = 0.01/600 = 1.7-10-5 (Ei = 1.6 eV, 0; = 45°).
FIG. 5.1: Relative intensity IHQ of specularly scattered He as a function of time
(exposure) for pure He (A), and a mixture of 2 % O2 in 98 % He (+). In the latter case
the time axis corresponds with O2 exposure (0.3 L/s), while the slope of the function
HIQ versus time t, at t = 0, is indicated by a line. The incident energy for O2
Et =1.6eV at Bi = 45° (Ts = 340 K).
To investigate if So depends on Ej or En we have varied both Ei and 0j . Whenwe do not change Ej = 1.6 eV, and vary En by changing ©j from 45° (En = 0.8 eV)via 60° (En = 0.4 eV) up to 70° (En = 0.2 eV), we get the relative intensity curves as
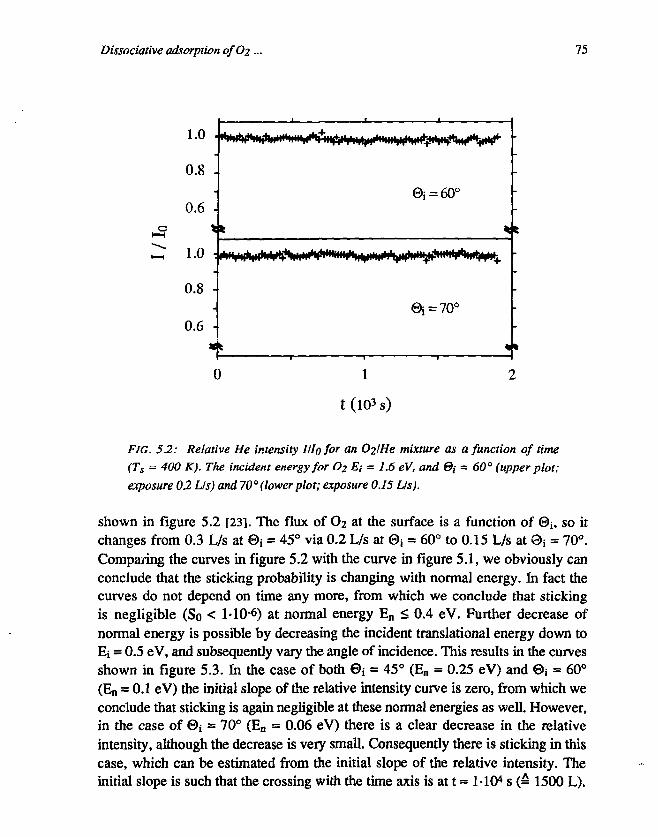
Dissociative adsorption ofC>2 ... 75
— 10
t (10 3 s)
FIG. 5.2: Relative He intensity I Ho for an 02/He mixture as a function of time(Ts = 400 K). The incident energy for O2 Ei = 1.6 eV, and ©/ = 60° (upper plot;exposure 02 LIs) and 70° (lower plot; exposure 0.15 Us).
shown in figure 5.2 [23]. The flux of O2 at the surface is a function of ©j, so itchanges from 0.3 L/s at 0* = 45° via 0.2 L/s at <8>t = 60° to 0.15 L/s at 0 i = 70°.Comparing the curves in figure 5.2 with the curve in figure 5.1, we obviously canconclude that the sticking probability is changing with normal energy. In fact thecurves do not depend on time any more, from which we conclude that stickingis negligible (So < MO"6) at normal energy En < 0.4 eV. Further decrease ofnormal energy is possible by decreasing the incident translational energy down toEi = 0.5 eV, and subsequently vary the angle of incidence. This results in the curvesshown in figure 5.3. hi the case of both ©i = 45° (En = 0.25 eV) and 0 i = 60°(En = 0.1 eV) the initial slope of the relative intensity curve is zero, from which weconclude that sticking is again negligible at these normal energies as well. However,in the case of ©i = 70° (En = 0.06 eV) there is a clear decrease in the relativeintensity, although the decrease is very small. Consequently there is sticking in thiscase, which can be estimated from the initial slope of the relative intensity. Theinitial slope is such that the crossing with the time axis is at t = 1-104 s (= 1500 L).
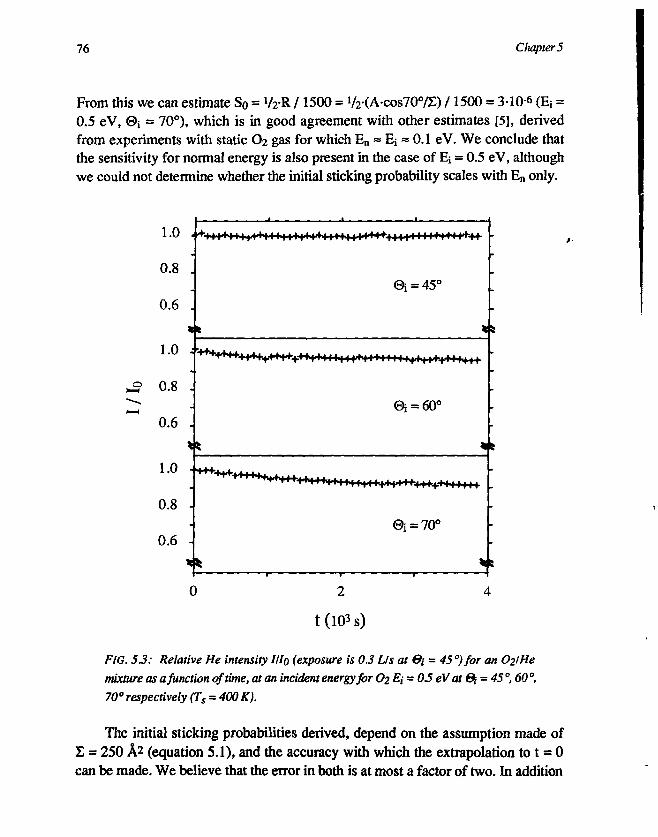
76 Chapters
From this we can estimate So = VrR /1500 = V2-(A-cos70°/E) / 1500 = 3-10-6 (^ =0.5 eV, ©i = 70°), which is in good agreement with other estimates [5], derivedfrom experiments with static O2 gas for which En ~ Ei « 0.1 eV. We conclude thatthe sensitivity for normal energy is also present in the case of Ei = 0.5 eV, althoughwe could not determine whether the initial sticking probability scales with En only.
1.0
0.8
0.6
1 0 •
0.8 .
0.6 .
1.0
0.8 -
0.6 -
') 11*1 >4ft*l I HH»U*HH*+I m+UH 1111 H 11
i = 45°
0
i = 60°
= 7O°
2
t (103 s)
FIG. 5.3: Relative He intensity Illo (exposure is 0.3 LIs at ©,- = 45°) for an 02/He
mixture as a function of time, at an incident energy for O2 Ei = 05eVat&i = 45 °, 60 ",
70° respectively (Ts = 400 K).
The initial sticking probabilities derived, depend on the assumption made ofS = 250 A2 (equation 5.1), and the accuracy with which the extrapolation to t = 0can be made. We believe that the error in both is at most a factor of two. In addition
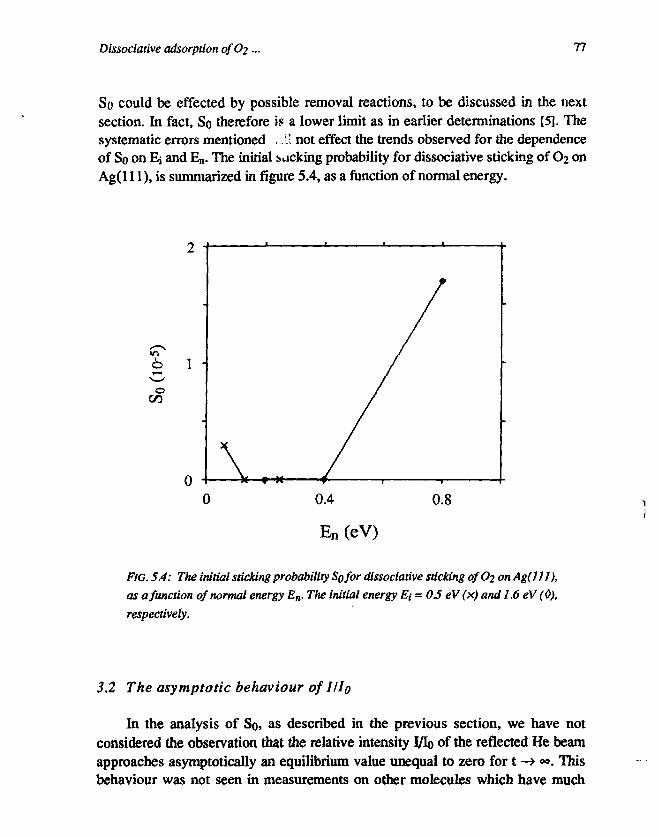
Dissociative adsorption o/C>2 ... 77
So could be effected by possible removal reactions, to be discussed in the nextsection. In fact, So therefore is a lower limit as in earlier determinations [5]. Thesystematic errors mentioned /:.!' not effect the trends observed for the dependenceof So on Ej and En. The initial sticking probability for dissociative sticking of O2 onAg(l 11), is summarized in figure 5.4, as a function of normal energy.
oCO
0
FIG. 5.4: The initial sticking probability So for dissociative sticking ofOi on Ag(lll),
as a function of normal energy En. The initial energy Ei = 05 eV (x) and 1.6 eV (0),
respectively.
3.2 The asymptotic behaviour of I Ho
In the analysis of So, as described in the previous section, we have notconsidered the observation that the relative intensity Vh of the reflected He beamapproaches asymptotically an equilibrium value unequal to zero for t —> «>. Thisbehaviour was not seen in measurements on other molecules which have much
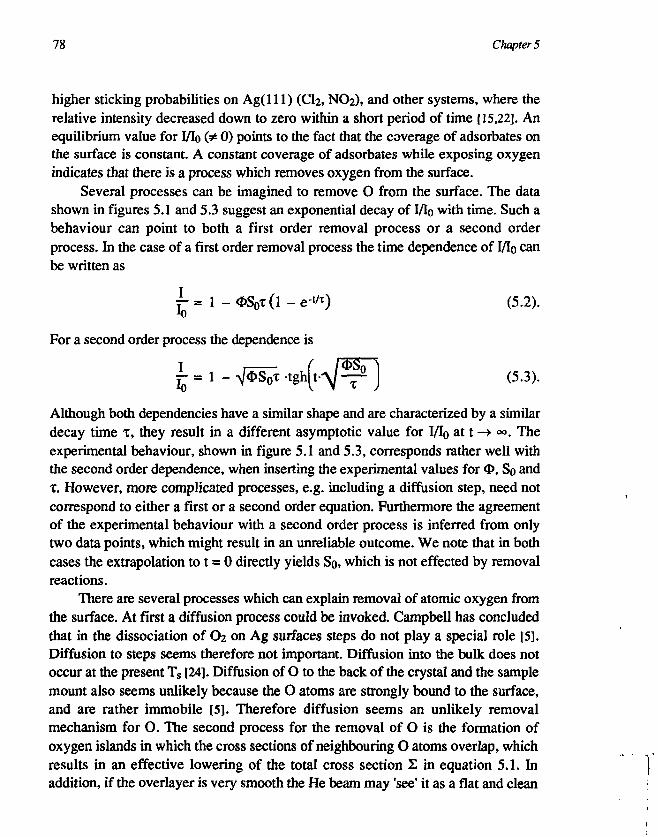
78 Chapters
higher sticking probabilities on Ag(l l l ) (Ch, NO2), and other systems, where therelative intensity decreased down to zero within a short period of time [15,22], Anequilibrium value for J/IQ (* 0) points to the fact that the coverage of adsorbates onthe surface is constant. A constant coverage of adsorbates while exposing oxygenindicates that there is a process which removes oxygen from the surface.
Several processes can be imagined to remove O from the surface. The datashown in figures 5.1 and 5.3 suggest an exponential decay of Vh with time. Such abehaviour can point to both a first order removal process or a second orderprocess. In the case of a first order removal process the time dependence of l/lo canbe written as
x) (5.2).
For a second order process the dependence is
(5.3).
Although both dependencies have a similar shape and are characterized by a similardecay time x, they result in a different asymptotic value for 1/IQ at t —> °°. Theexperimental behaviour, shown in figure 5.1 and 5.3, corresponds rather well withthe second order dependence, when inserting the experimental values for O, So andx. However, more complicated processes, e.g. including a diffusion step, need notcorrespond to either a first or a second order equation. Furthermore the agreementof the experimental behaviour with a second order process is inferred from onlytwo data points, which might result in an unreliable outcome. We note that in bothcases the extrapolation to t = 0 directly yields So, which is not effected by removalreactions.
There are several processes which can explain removal of atomic oxygen fromthe surface. At first a diffusion process could be invoked. Campbell has concludedthat in the dissociation of O2 on Ag surfaces steps do not play a special role [5].Diffusion to steps seems therefore not important. Diffusion into the bulk does notoccur at the present Ts [24]. Diffusion of O to the back of the crystal and the samplemount also seems unlikely because the O atoms are strongly bound to the surface,and are rather immobile [5]. Therefore diffusion seems an unlikely removalmechanism for O. The second process for the removal of O is the formation ofoxygen islands in which the cross sections of neighbouring O atoms overlap, whichresults in an effective lowering of the total cross section Z in equation 5.1. Inaddition, if the overlayer is very smooth the He beam may 'see1 it as a flat and clean
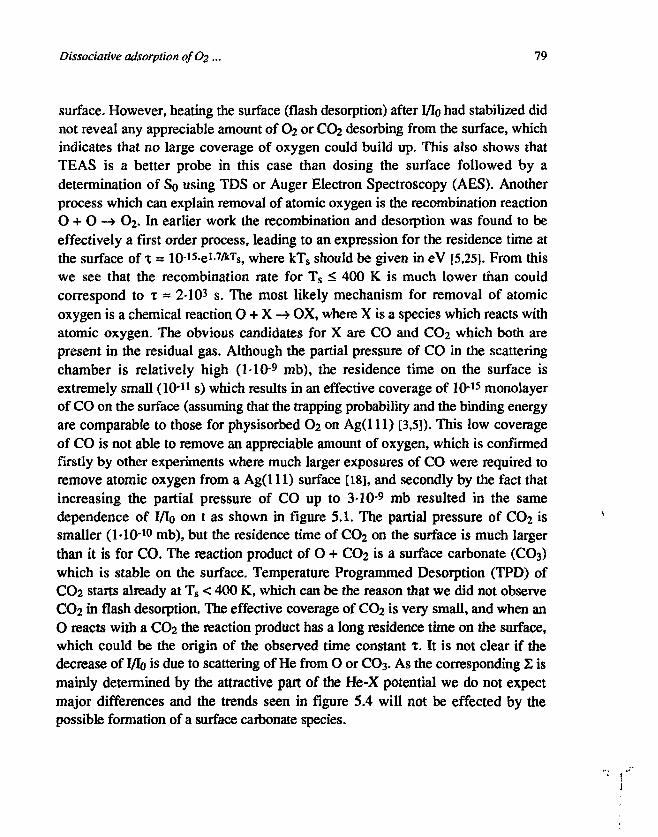
Dissociative adsorption ofC>2 ... 79
surface. However, heating the surface (flash desorption) after 3/Io had stabilized didnot reveal any appreciable amount of O2 or CO2 desorbing from the surface, whichindicates that no large coverage of oxygen could build up. This also shows thatTEAS is a better probe in this case than dosing the surface followed by adetermination of So using TDS or Auger Electron Spectroscopy (AES). Anotherprocess which can explain removal of atomic oxygen is the recombination reactionO + O —> O2. In earlier work the recombination and desorption was found to beeffectively a first order process, leading to an expression for the residence time atthe surface of x = 1015-e» -Ws, where kTs should be given in eV [5,25]. From thiswe see that the recombination rate for Ts < 400 K is much lower than couldcorrespond to T * 2-103 s. The most likely mechanism for removal of atomicoxygen is a chemical reaction O + X —> OX, where X is a species which reacts withatomic oxygen. The obvious candidates for X are CO and CO2 which both arepresent in the residual gas. Although the partial pressure of CO in the scatteringchamber is relatively high (MO-9 mb), the residence time on the surface isextremely small (10-11 s) which results in an effective coverage of 10-15 monolayerof CO on the surface (assuming that the trapping probability and the binding energyare comparable to those for physisorbed O2 on Ag(l l l ) [3,5]). This low coverageof CO is not able to remove an appreciable amount of oxygen, which is confirmedfirstly by other experiments where much larger exposures of CO were required toremove atomic oxygen from a Ag(l l l ) surface [18], and secondly by the fact thatincreasing the partial pressure of CO up to 3-10-9 mb resulted in the samedependence of I/Io on t as shown in figure 5.1. The partial pressure of CO2 issmaller (1-10-10 mb), but the residence time of CO2 on the surface is much largerthan it is for CO. The reaction product of O + CO2 is a surface carbonate (CO3)which is stable on the surface. Temperature Programmed Desorption (TPD) ofCO2 starts already at Ts < 400 K, which can be the reason that we did not observeCO2 in flash desorption. The effective coverage of CO2 is very small, and when anO reacts with a CO2 the reaction product has a long residence time on the surface,which could be the origin of the observed time constant T. It is not clear if thedecrease of I/1Q is due to scattering of He from O or CO3. As the corresponding 2 ismainly determined by the attractive part of the He-X potential we do not expectmajor differences and the trends seen in figure 5.4 will not be effected by thepossible formation of a surface carbonate species.
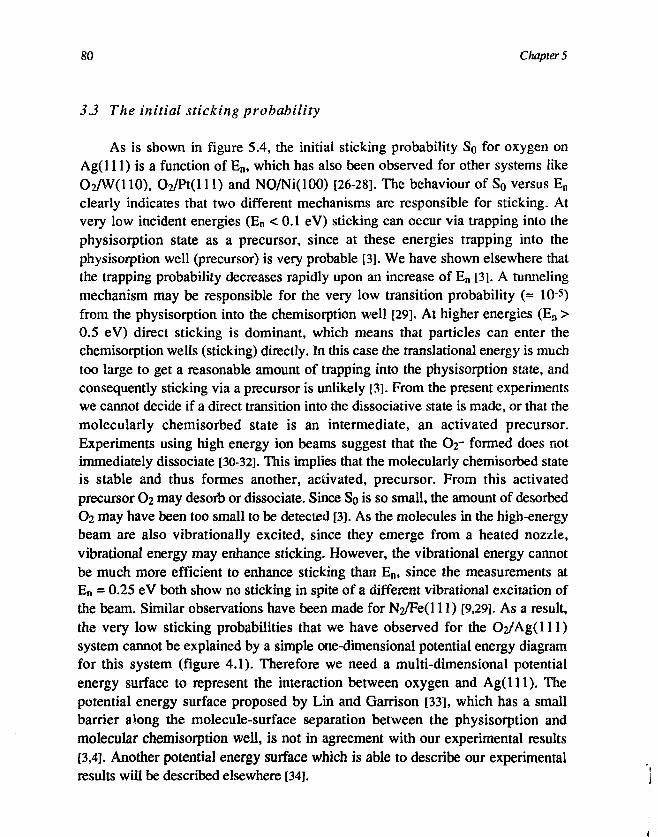
80 Chapters
3.3 The initial sticking probability
As is shown in figure 5.4, the initial sticking probability So for oxygen onAg(l 11) is a function of En, which has also been observed for other systems likeO2/W(110), O2/Pt(lll) and NO/Ni(100) [26-28]. The behaviour of So versus En
clearly indicates that two different mechanisms are responsible for sticking. Atvery low incident energies (En < 0.1 eV) sticking can occur via trapping into thephysisorption state as a precursor, since at these energies trapping into thephysisorption well (precursor) is very probable [3]. We have shown elsewhere thatthe trapping probability decreases rapidly upon an increase of En [3]. A tunnelingmechanism may be responsible for the very low transition probability (= 105)from the physisorption into the chemisorption well [29]. At higher energies (En >0.5 eV) direct sticking is dominant, which means that particles can enter thechemisorption wells (sticking) directly. In this case the translational energy is muchtoo large to get a reasonable amount of trapping into the physisorption state, andconsequently sticking via a precursor is unlikely [3]. From the present experimentswe cannot decide if a direct transition into the dissociative state is made, or that themolecularly chemisorbed state is an intermediate, an activated precursor.Experiments using high energy ion beams suggest that the O2- formed does notimmediately dissociate [30-32]. This implies that the molecularly chemisorbed stateis stable and thus formes another, activated, precursor. From this activatedprecursor O2 may desorb or dissociate. Since So is so small, the amount of desorbedO2 may have been too small to be detected [3]. As the molecules in the high-energybeam are also vibrationally excited, since they emerge from a heated nozzle,vibrational energy may enhance sticking. However, the vibrational energy cannotbe much more efficient to enhance sticking than En, since the measurements atEn = 0.25 eV both show no sticking in spite of a different vibrational excitation ofthe beam. Similar observations have been made for N2/Fe(l 11) [9,29]. As a result,the very low sticking probabilities that we have observed for the (VAgO 11)system cannot be explained by a simple one-dimensional potential energy diagramfor this system (figure 4.1). Therefore we need a multi-dimensional potentialenergy surface to represent the interaction between oxygen and Ag(l l l ) . Thepotential energy surface proposed by Lin and Garrison [33], which has a smallbarrier along the molecule-surface separation between the physisorption andmolecular chemisorption well, is not in agreement with our experimental results[3,4]. Another potential energy surface which is able to describe our experimentalresults will be described elsewhere [34].
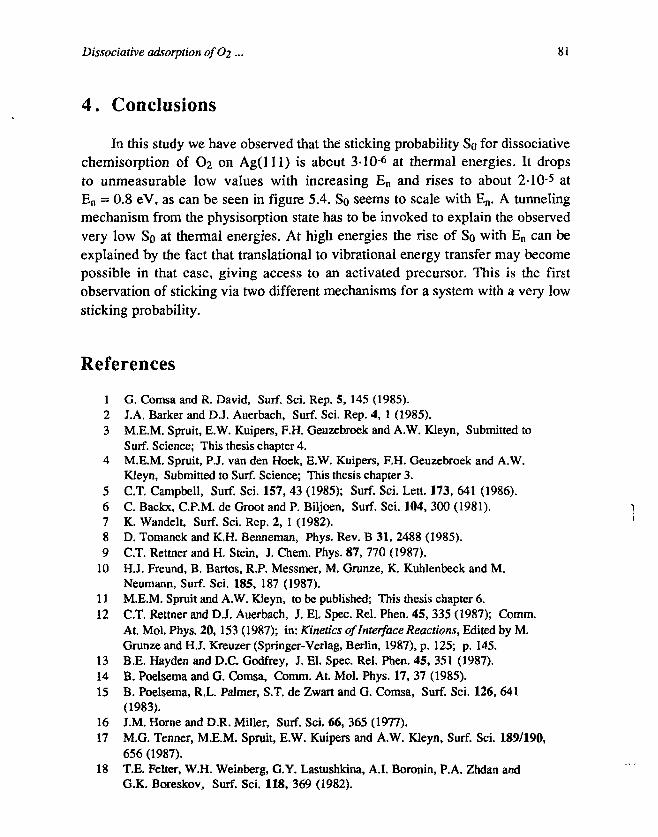
Dissociative adsorption ofOi... 81
4. Conclusions
In this study we have observed that the sticking probability So for dissociativechemisorption of O2 on Ag(l l l ) is about 3-1O6 at thermal energies. It dropsto unmeasurable low values with increasing En and rises to about 2-1O5 atEn = 0.8 eV, as can be seen in figure 5.4. So seems to scale with En. A tunnelingmechanism from the physisorption state has to be invoked to explain the observedvery low So at thermal energies. At high energies the rise of So with En can beexplained by the fact that translational to vibrational energy transfer may becomepossible in that case, giving access to an activated precursor. This is the firstobservation of sticking via two different mechanisms for a system with a very lowsticking probability.
References
1 G. Comsa and R. David, Surf. Sci. Rep. 5, 145 (1985).2 J.A. Barker and D.J. Auerbach, Surf. Sci. Rep. 4, 1 (1985).3 M.E.M. Spruit, E.W. Kuipers, F.H. Geuzebroek and A.W. Kleyn, Submitted to
Surf. Science; This thesis chapter 4.4 M.E.M. Spruit, P.J. van den Hoek, E.W. Kuipers, F.H. Geuzebroek and A.W.
Kleyn, Submitted to Surf. Science; This thesis chapter 3.5 C.T. Campbell, Surf. Sci. 157, 43 (1985); Surf. Sci. Lett. 173, 641 (1986).6 C. Backx, C.P.M. de Groot and P. Biljoen, Surf. Sci. 104, 300 (1981).7 K. Wandelt, Surf. Sci. Rep. 2, 1 (1982).8 D. Tomanek and K.H. Benneman, Phys. Rev. B 31, 2488 (1985).9 C.T. Rettner and H. Stein, J. Chem. Phys. 87, 770 (1987).
10 H.J. Freund, B. Bartos, R.P. Messmer, M. Grunze, K. Kuhlenbeck and M.Neumann, Surf. Sci. 185, 187 (1987).
11 M.E.M. Spruit and A.W. Kleyn, to be published; This thesis chapter 6.12 C.T. Rettner and D.J. Auerbach, J. El. Spec. Rel. Phen. 45, 335 (1987); Comm.
At. Mol. Phys. 20,153 (1987); in: Kinetics of Interface Reactions, Edited by M.Grunze and H.J. Kreuzer (Springer-Verlag, Berlin, 1987), p. 125; p. 145.
13 B.E. Hayden and D.C. Godfrey, J. El. Spec. Rel. Phen. 45, 351 (1987).14 B. Poelsema and G. Cotnsa, Comm. At. Mol. Phys. 17, 37 (1985).15 B. Poelsema, R.L. Palmer, S.T. de Zwart and G. Comsa, Surf. Sci. 126, 641
(1983).16 J.M. Home and D.R. Miller, Surf. Sci. 66, 365 (1977).17 M.G. Tenner, M.E.M. Spruit, E.W. Kuipers and A.W. Kleyn, Surf. Sci. 189/190,
656 (1987).18 T.E. Felter, W.H. Weinberg, G.Y. Lastushkina, A.I. Boronin, P.A. Zhdan and
G.K. Boreskov, Surf. Sci. 118, 369 (1982).
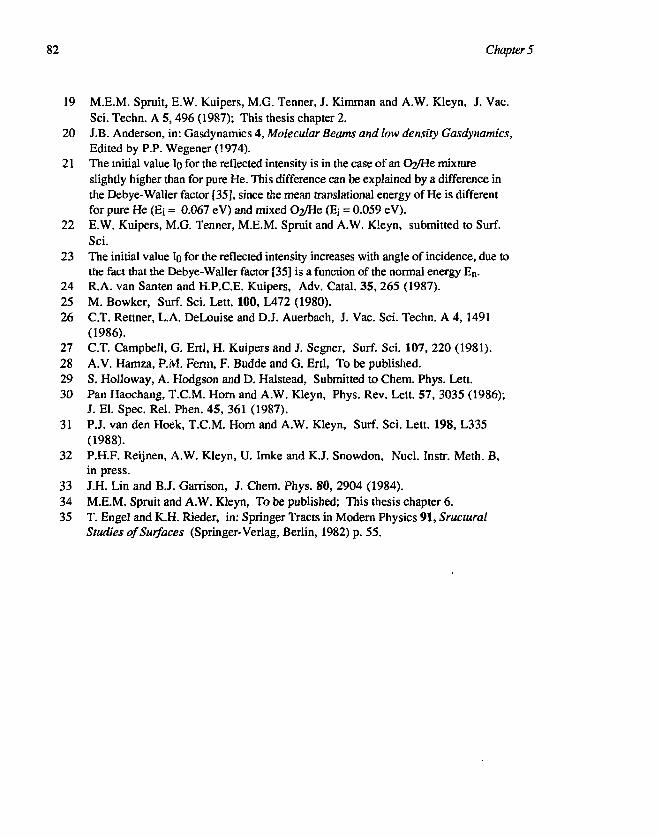
82 Chapter 5
19 M.E.M. Spruit, E.W. Kuipers, M.G. Tenner, J. Kimman and A.W. Kleyn, J. Vac.Sci. Techn. A 5,496 (1987); This thesis chapter 2.
20 J.B. Anderson, in: Gasdynamics 4, Molecular Beams and low density Gasdynamics,Edited by P.P. Wegener (1974).
21 The initial value Io for the reflected intensity is in the case of an O2/He mixtureslightly higher than for pure He. This difference can be explained by a difference inthe Debye-Waller factor [35], since the mean translational energy of He is differentfor pure He (E; = 0.067 eV) and mixed 02/He (Ej = 0.059 eV).
22 E.W. Kuipers, M.G. Tenner, M.E.M. Spruit and A.W. Kleyn, submitted to Surf.Sci.
23 The initial value To for the reflected intensity increases with angle of incidence, due tothe fact that the Debye-Waller factor [35] is a function of the normal energy En.
24 R.A. van Santen and H.P.C.E. Kuipers, Adv. Catal. 35, 265 (1987).25 M. Bowker, Surf. Sci. Lett. 100, L472 (1980).26 C.T. Rettner, L.A. DeLouise and D.J. Auerbach, J. Vac. Sci. Techn. A 4, 1491
(1986).27 C.T. Campbell, G. Ertl, H. Kuipers and J. Segner, Surf. Sci. 107, 220 (1981).28 A.V. Hamza, P.M. Ferm, F. Budde and G. Ertl, To be published.29 S. Holloway, A. Hodgson and D. Halstead, Submitted to Chem. Phys. Lett.30 Pan Haochang, T.C.M. Horn and A.W. Kleyn, Phys. Rev. Lett. 57, 3035 (1986);
J. El. Spec. Rel. Phen. 45, 361 (1987).31 P.J. van den Hoek, T.C.M. Horn and A.W. Kleyn, Surf. Sci. Lett. 198, L335
(1988).32 P.H.F. Reijnen, A.W. Kleyn, U. Imke and K.J. Snowdon, Nucl. Instr. Meth. B,
in press.33 J.H. Lin and B.J. Garrison, J. Chem. Phys. 80, 2904 (1984).34 M.E.M. Spruit and A.W. Kleyn, To be published; This thesis chapter 6.35 T. Engel and K.H. Rieder, in: Springer Tracts in Modern Physics 91, Sructural
Studies of Surfaces (Springer-Verlag, Berlin, 1982) p. 55.
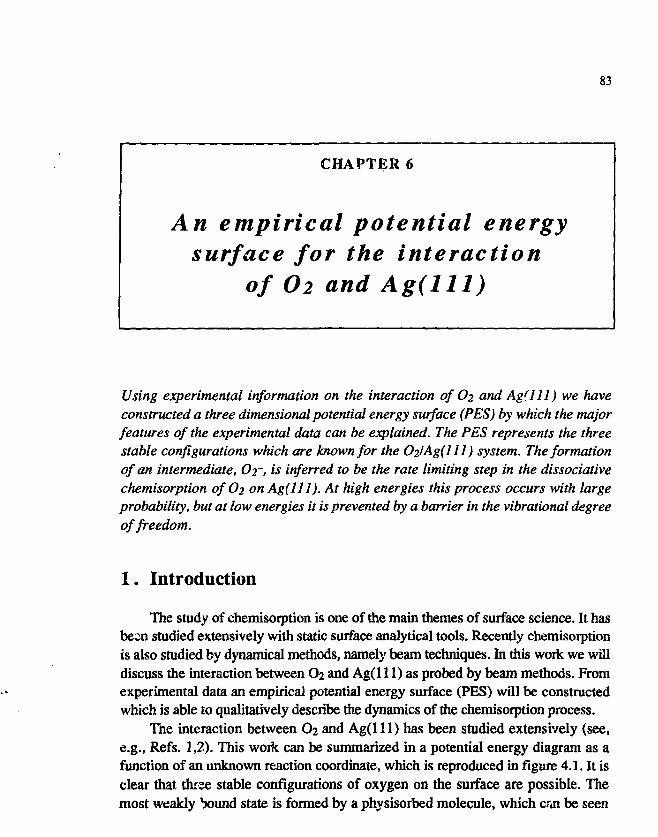
83
CHAPTER 6
An empirical potential energysurface for the interaction
of O2 and Ag(lll)
Using experimental information on the interaction of O2 and Agflll) we haveconstructed a three dimensional potential energy surface (PES) by which the majorfeatures of the experimental data can be explained. The PES represents the threestable configurations which are known for the 02>Ag{lll) system. The formationof an intermediate, O?-, is inferred to be the rate limiting step in the dissociativechemisorption of O2 on Agflll). At high energies this process occurs with largeprobability, but at low energies it is prevented by a barrier in the vibrational degreeof freedom.
1. Introduction
The study of chemisorption is one of the main themes of surface science. It hasbeen studied extensively with static surface analytical tools. Recently chemisorptionis also studied by dynamical methods, namely beam techniques. In this work we willdiscuss the interaction between O2 and Ag(l 11) as probed by beam methods. Fromexperimental data an empirical potential energy surface (PES) will be constructedwhich is able to qualitatively describe the dynamics of the chemisorption process.
The interaction between O2 and Ag( l l l ) has been studied extensively (see,e.g., Refs. 1,2). This work can be summarized in a potential energy diagram as afunction of an unknown reaction coordinate, which is reproduced in figure 4.1. It isclear that three stable configurations of oxygen on the surface are possible. Themost weakly bound state is formed by a physisorbed molecule, which crji be seen

84 Chapter 6
as an unchanged gas phase molecule, which desorbes at a surface temperatureTs < 50 K. An intermediate state is formed by the chemisorbed molecule, which ismore strongly bound, and which desorbs at Ts = 220 K. The chemisorbed moleculeis supposed to be a negative ion (O2-). The most stable bound state is formed bychemisorbed atomic O, which again seems to be ionic (O) , and which desorbs afterrecombination at Ts = 580 K. Capture of oxygen in the shallow physisorption ormolecular chemisorption well is refered to as trapping, while capture in thedeep atomic chemisorption well is referred to as sticking. The probability fordissociative chemisorption (sticking) of thermal oxygen is in ihe order of 10 6 atT s » 400 K [1,3].
If the barriers, shown in figure 4.1, can be easily overcome using translationalenergy, one expects drastic changes in the sticking probability as a function oftranslational energy. The simplest test i« to vary the incoming translational energyand see if the direct inelastic scattering disappears, when the beam energy issufficient to overcome the barrier from the physisorption state to thechemisorption states. Such a disappearance, which has been seen recently byHayden and Godfrey for dissociative chemisorption of CO on Cu(l 10) [4], was notobserved in extensive experiments on direct inelastic scattering of O2 fromAg(l 11) [5]. In fact, O2 behaves to first approximation very similar to Ar, and nosubstantial decrease or change of the direct inelastic scattering has been seen.Therefore we can infer, but not yet conclude, that there is a very high barrier tomolecular chemisorption when all energy is provided as translational energy.
The nature of such a barrier can also be examined by looking at measurements \of trapping or sticking followed by desorption. From the analysis by Campbell it isclear that desorption from the molecular chemisorption state will occur readily atTs > 300 K [1]. For beam energies above thermal one would expect an enhanceddesorption signal if the barrier can be overcome by translational energy. Inaddition, as the desorption is activated in that case, molecules will appear with amean translational energy which is larger than that of a Boltzmann distributionwith temperature Ts. Neither enhanced desorption nor activated desorption hasbeen observed [6]. However, there is substantial trapping into the physisorptionstate. The trapping probability for these molecules rapidly decreases with energyfrom about 0.25 at thermal energy to below 0.01 at primary bean, energy Ej >0.5 eV. This indicates that only appreciable trapping in the physisorption well ispresent.
To study atomic chemisorption is more difficult using a molecular beamexperiment, since the residence times are rather long and can be outside the 'time-of-flight window' of the molecular beam machine. Therefore we have used seeded
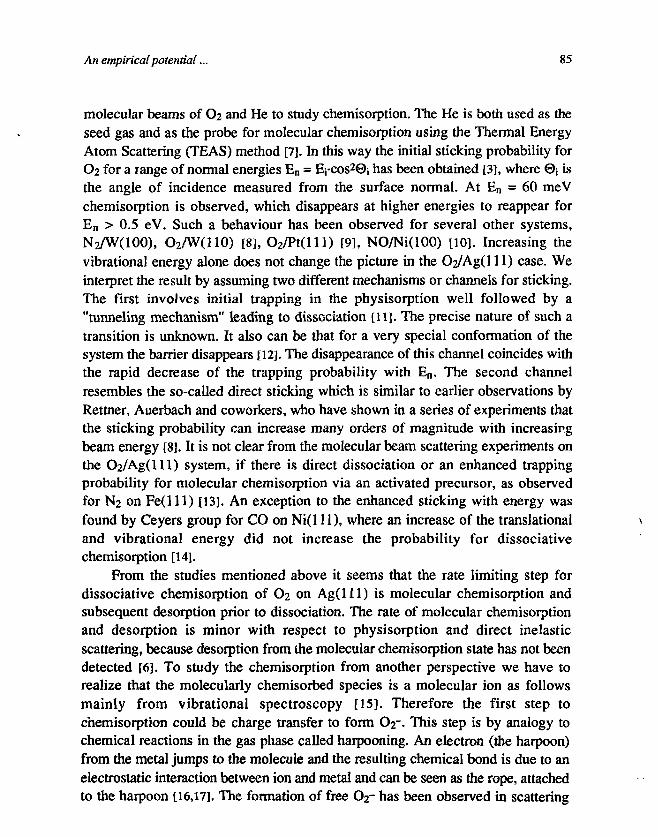
An empirical potential... 85
molecular beams of O2 and He to study chemisorption. The He is both used as theseed gas and as the probe for molecular chemisorption using the Thermal EnergyAtom Scattering (TEAS) method [7]. In this way the initial sticking probability forO2 for a range of normal energies En = Ej-cos2©i has been obtained [3], where 0j isthe angle of incidence measured from the surface normal. At En = 60 meVchemisorption is observed, which disappears at higher energies to reappear forEn > 0.5 eV. Such a behaviour has been observed for several other systems,N2/W(100), O2/W(110) [8], O2 /Pt(ll l) [9], NO/Ni(100) [10]. Increasing thevibrational energy alone does not change the picture in the 02/AgO 11) case. Weinterpret the result by assuming two different mechanisms or channels for sticking.The first involves initial trapping in the physisorption well followed by a"tunneling mechanism" leading to dissociation [11]. The precise nature of such atransition is unknown. It also can be that for a very special conformation of thesystem the barrier disappears [12]. The disappearance of this channel coincides withthe rapid decrease of the trapping probability with En. The second channelresembles the so-called direct sticking which is similar to earlier observations byRettner, Auerbach and coworkers, who have shown in a series of experiments thatthe sticking probability can increase many orders of magnitude with increasingbeam energy [8]. It is not clear from the molecular beam scattering experiments onthe C>2/Ag(lll) system, if there is direct dissociation or an enhanced trappingprobability for molecular chemisorption via an activated precursor, as observedfor N2 on Fe( l l l ) [13]. An exception to the enhanced sticking with energy wasfound by Ceyers group for CO on Ni(l 11), where an increase of the translationaland vibrational energy did not increase the probability for dissociativechemisorption [14].
From the studies mentioned above it seems that the rate limiting step fordissociative chemisorption of O2 on Ag(l l l ) is molecular chemisorption andsubsequent desorption prior to dissociation. The rate of molecular chemisorptionand desorption is minor with respect to physisorption and direct inelasticscattering, because desorption from the molecular chemisorption state has not beendetected [6]. To study the chemisorption from another perspective we have torealize that the molecularly chemisorbed species is a molecular ion as followsmainly from vibrational spectroscopy [15]. Therefore the first step tochemisorption could be charge transfer to form O2". This step is by analogy tochemical reactions in the gas phase called harpooning. An electron (the harpoon)from the metal jumps to the molecule and the resulting chemical bond is due to anelectrostatic interaction between ion and metal and can be seen as the rope, attachedto the harpoon [16,17]. The formation of free O2- has been observed in scattering
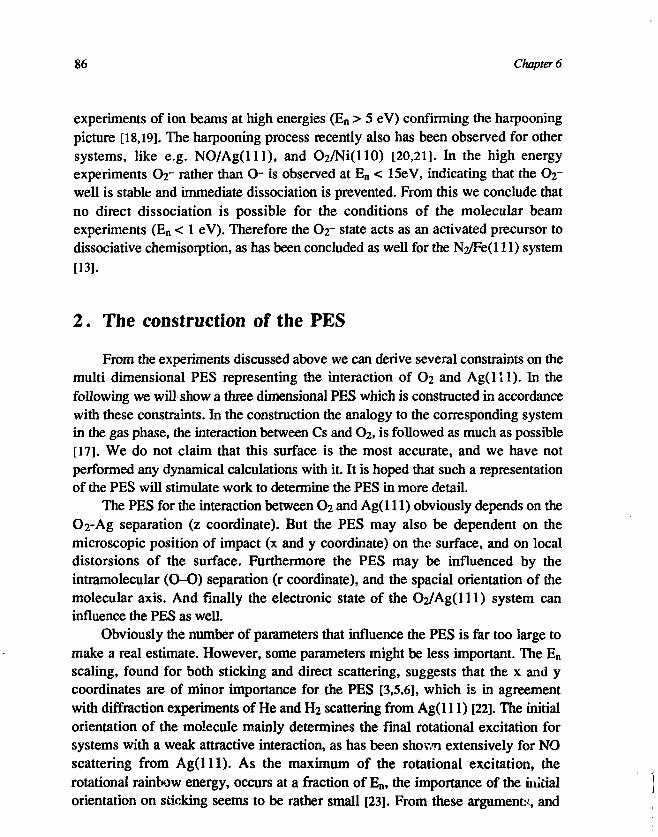
86 Chapter 6
experiments of ion beams at high energies (En > 5 eV) confirming the harpooningpicture [18,19]. The harpooning process recently also has been observed for othersystems, like e.g. NO/Ag(lll) , and O2/Ni(110) [20,21]. In the high energyexperiments O2- rather than O~ is observed at En < 15eV, indicating that the Oz~well is stable and immediate dissociation is prevented. From this we conclude thatno direct dissociation is possible for the conditions of the molecular beamexperiments (En < 1 eV). Therefore the Or~ state acts as an activated precursor todissociative chemisorption, as has been concluded as well for the N2/Fe(l 11) system[13].
2. The construction of the PES
From the experiments discussed above we can derive several constraints on themulti dimensional PES representing the interaction of O2 and Ag(l l l ) . In thefollowing we will show a three dimensional PES which is constructed in accordancewith these constraints. In the construction the analogy to the corresponding systemin the gas phase, the interaction between Cs and O2, is followed as much as possible[17]. We do not claim that this surface is the most accurate, and we have notperformed any dynamical calculations with it. It is hoped that such a representationof the PES will stimulate work to determine the PES in more detail.
The PES for the interaction between O2 and Ag(l 11) obviously depends on theO2-Ag separation (z coordinate). But the PES may also be dependent on themicroscopic position of impact (x and y coordinate) on the surface, and on localdistorsions of the surface. Furthermore the PES may be influenced by theintramolecular ( 0 - 0 ) separation (r coordinate), and the spacial orientation of themolecular axis. And finally the electronic state of the O2/Ag(lll) system caninfluence the PES as well.
Obviously the number of parameters that influence the PES is far too large tomake a real estimate. However, some parameters might be less important. The En
scaling, found for both sticking and direct scattering, suggests that the x and ycoordinates are of minor importance for the PES [3,5,6], which is in agreementwith diffraction experiments of He and H2 scattering from Ag(l 11) [22]. The initialorientation of the molecule mainly determines the final rotational excitation forsystems with a weak attractive interaction, as has been shown extensively for NOscattering from Ag( l l l ) . As the maximum of the rotational excitation, therotational rainbow energy, occurs at a fraction of En, the importance of the initialorientation on sticking seems to be rather small [23]. From these arguments, and
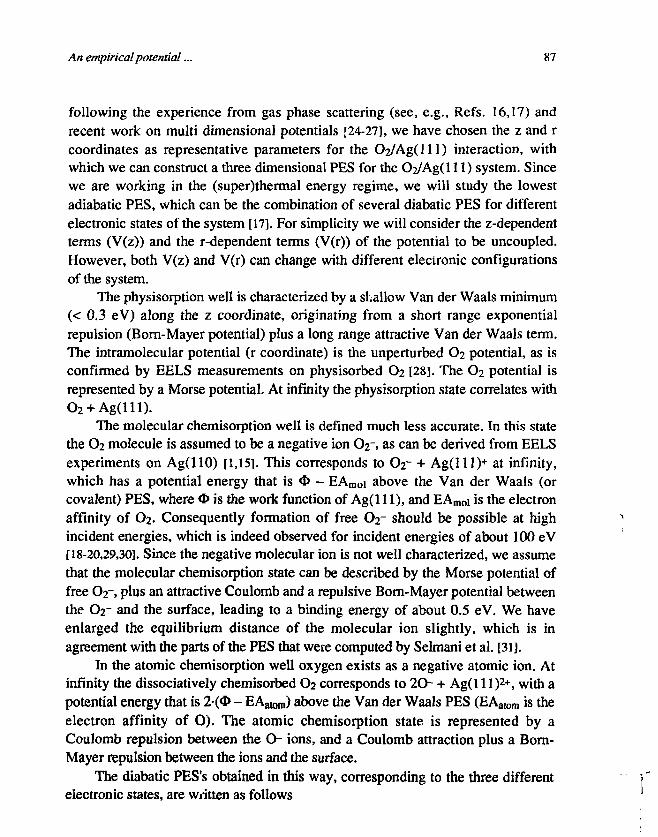
An empirical potential... 87
following the experience from gas phase scattering (see, e.g., Refs. 16,17) andrecent work on multi dimensional potentials [24-27], we have chosen the z and rcoordinates as representative parameters for the C>2/Ag(lll) interaction, withwhich we can construct a three dimensional PES for the C>2/Ag(l 11) system. Sincewe are working in the (super)thermal energy regime, we will study the lowestadiabatic PES, which can be the combination of several diabatic PES for differentelectronic states of the system [17]. For simplicity we will consider the z-dependentterms (V(z)) and the r-dependent terms (V(r)) of the potential to be uncoupled.However, both V(z) and V(r) can change with different electronic configurationsof the system.
The physisorption well is characterized by a shallow Van der Waals minimum(< 0.3 eV) along the z coordinate, originating from a short range exponentialrepulsion (Born-Mayer potential) plus a long range attractive Van der Waals term.The intramolecular potential (r coordinate) is the unperturbed O2 potential, as isconfirmed by EELS measurements on physisorbed O2 [28]. The O2 potential isrepresented by a Morse potential. At infinity the physisorption state correlates with
The molecular chemisorption well is defined much less accurate. In this statethe O2 molecule is assumed to be a negative ion O2-, as can be derived from EELSexperiments on Ag(110) [1,15]. This corresponds to O2- + Ag(lll)+ at infinity,which has a potential energy that is O - EAmoi above the Van der Waals (orcovalent) PES, where O is the work function of Ag(l 11), and EAmoi is the electronaffinity of O2. Consequently formation of free ( V should be possible at highincident energies, which is indeed observed for incident energies of about 100 eV[18-20,29,30]. Since the negative molecular ion is not well characterized, we assumethat the molecular chemisorption state can be described by the Morse potential offree OT, plus an attractive Coulomb and a repulsive Bom-Mayer potential betweenthe O2- and the surface, leading to a binding energy of about 0.5 eV. We haveenlarged the equilibrium distance of the molecular ion slightly, which is inagreement with the parts of the PES that were computed by Selmani et al. [31].
In the atomic chemisorption well oxygen exists as a negative atomic ion. Atinfinity the dissociatively chemisorbed O2 corresponds to 2 O + Ag(lll)2 + , with apotential energy that is 2-(O - EAatom) above the Van der Waals PES (EAatom is theelectron affinity of O). The atomic chemisorption state is represented by aCoulomb repulsion between the O ions, and a Coulomb attraction plus a Born-Mayer repulsion between the ions and the surface.
The diabatic PES's obtained in this way, corresponding to the three differentelectronic states, are written as follows
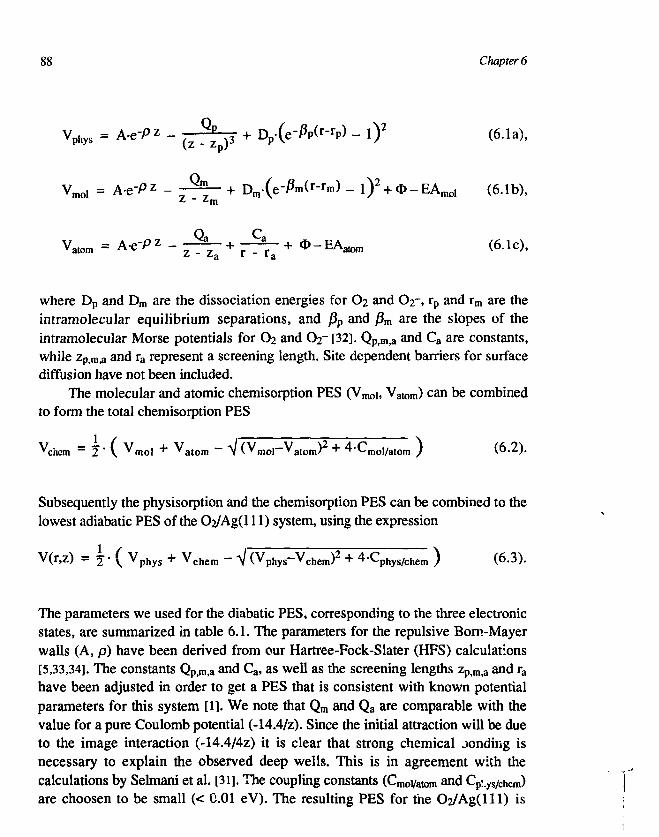
Chapter 6
Vphys = A-e-P * - j ^ ~ ^ + Dp-(e^pC-rp) - l ) 2 (6.1a),
O / \7V i = Ae 'P z - —^— + D •(e-Pm(r-rm) _ 1 ) +O-EA i (61b)
Z - Lm
'atom (6.1c),
where Dp and Dm are the dissociation energies for O2 and O2-, rp and rm are theintramolecular equilibrium separations, and J3P and J3m are the slopes of theintramolecular Morse potentials for O2 and ( V [32]. Qp,m,a and Ca are constants,while Zpiin>a and ra represent a screening length. Site dependent barriers for surfacediffusion have not been included.
The molecular and atomic chemisorption PES (Vmoi, Vatom) can be combinedto form the total chemisorption PES
Vchem = I • ( Vm o ] + Va(om - V (VmoJ-Va tom)2 + 4-Cmol/a,om ) (6.2).
Subsequently the physisorption and the chemisorption PES can be combined to thelowest adiabatic PES of the O2/Ag(ll 1) system, using the expression
V(r,z) = j - ( Vp h y s + Vchem - V(VphyS-Vchem)2 + 4-Cphys/chem ) (6.3).
The parameters we used for the diabatic PES, corresponding to the three electronicstates, are summarized in table 6.1. The parameters for the repulsive Born-Mayerwalls (A, p) have been derived from our Hartree-Fock-Slater (HFS) calculations[5,33,34]. The constants Qp,m,a and Ca, as well as the screening lengths zPinija and ra
have been adjusted in order to get a PES that is consistent with known potentialparameters for this system [1]. We note that Qm and Qa are comparable with thevalue for a pure Coulomb potential (-14.4/z). Since the initial attraction will be dueto the image interaction (-14.4/4z) it is clear that strong chemical jonding isnecessary to explain the observed deep wells. This is in agreement with thecalculations by Selmani et al. [31]. The coupling constants (Cmoi/atom and Cp:.yS/Chem)are choosen to be small (< C.01 eV). The resulting PES for the O2/Ag(lll) is
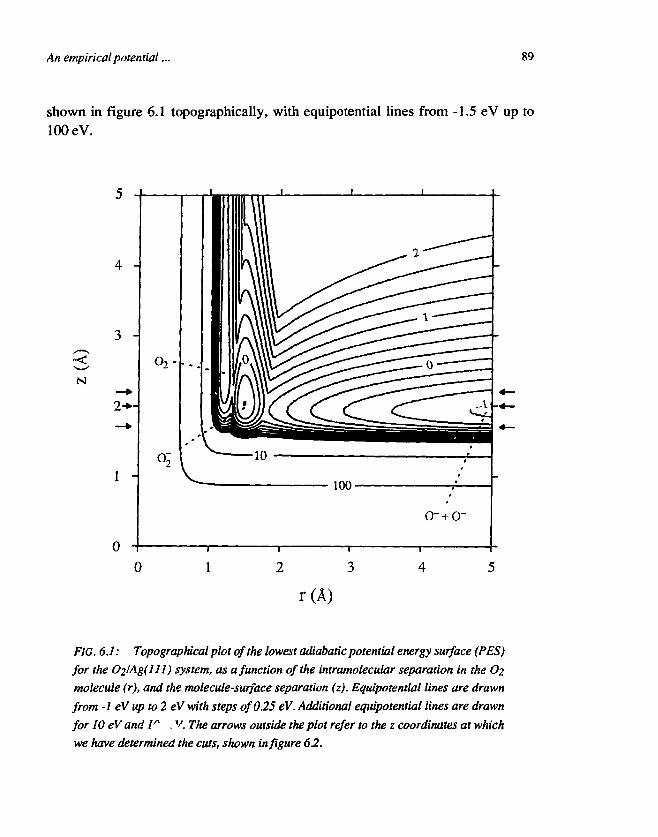
An empirical potential ... 89
shown in figure 6.1 topographically, with equipotential lines from -1.5 eV up to100 eV.
N
4 -
3 -
2-*~
1 -
0
FIG. 6.1: Topographical plot of the lowest adiabatic potential energy surface (PES)for the C>2lAg(lll) system, as a function of the intramolecular separation in the O2molecule (r), and the molecule-surface separation (z). Equipotential lines are drawnfrom -1 eV up to 2 eV with steps of 0.25 eV. Additional equipotential lines are drawnfor 10 eV and lr . v. The arrows outside the plot refer to the z coordinates at whichwe have determined the cuts, shown in figure 6.2.
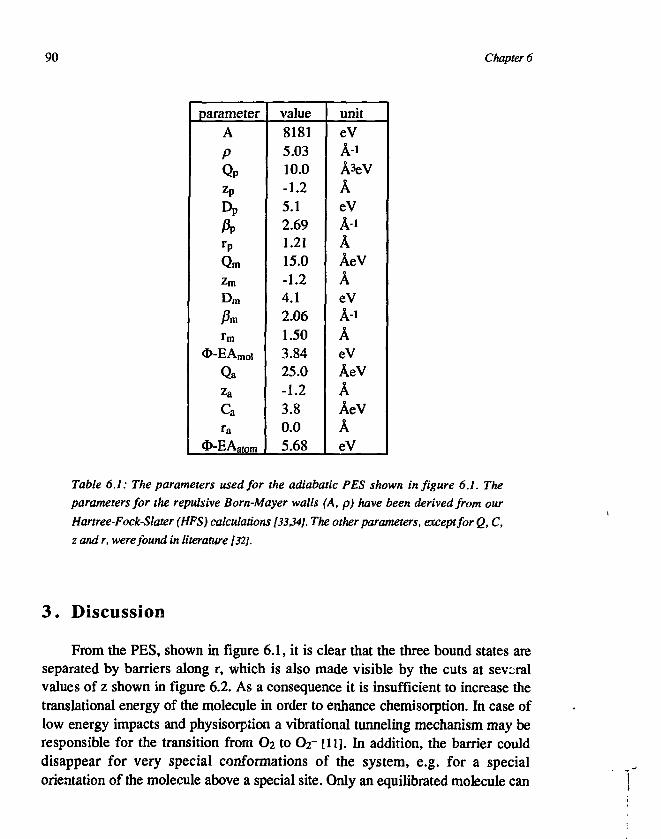
90 Chapter 6
parameterA
PQPzp
Dp
A>rpQmzm
Dm
Anrm
O-EAm0i
Qa
Za
Ca
ra
^-EAatom
value81815.0310.0-1.25.12.691.2115.0-1.24.12.061.503.8425.0-1.23.80.05.68
uniteVA-iA3eV
AeVA-i
AAeVAeVA-i
AeVAeVAAeVAeV
Table 6.1: The parameters used for the adiabatic PES shown in figure 6.1. The
parameters for the repulsive Born-Mayer walls (A, p) have been derived from our
Hartree-Fock-Slater (HFS) calculations [33 M]. The other parameters, except for Q, C,
z and r, were found in literature [32].
3. Discussion
From the PES, shown in figure 6.1, it is clear that the three bound states areseparated by barriers along r, which is also made visible by the cuts at severalvalues of z shown in figure 6.2. As a consequence it is insufficient to increase thetranslational energy of the molecule in order to enhance chemisorption. In case oflow energy impacts and physisorption a vibrational tunneling mechanism may beresponsible for the transition from O2 to Or [11]. In addition, the barrier coulddisappear for very special conformations of the system, e.g. for a specialorientation of the molecule above a special site. Only an equilibrated molecule can
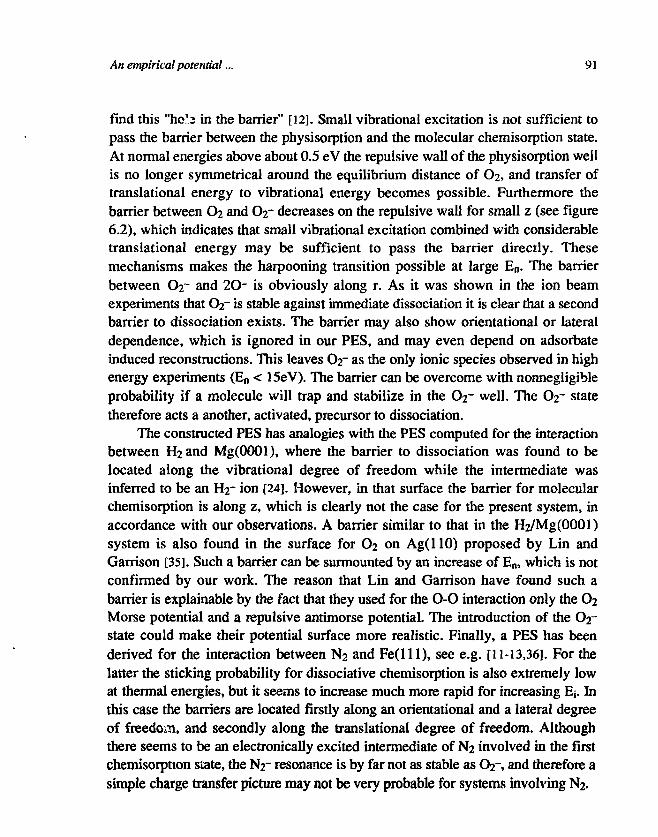
An empirical potential... 91
find this "he1:; in the barrier" [12]. Small vibrational excitation is not sufficient topass the barrier between the physisorption and the molecular chemisorption state.At normal energies above about 0.5 eV the repulsive wall of the physisorption wellis no longer symmetrical around the equilibrium distance of O2, and transfer oftranslational energy to vibrational energy becomes possible. Furthermore thebarrier between O2 and O2- decreases on the repulsive wall for small z (see figure6.2), which indicates that small vibrational excitation combined with considerabletranslational energy may be sufficient to pass the barrier directly. Thesemechanisms makes the harpooning transition possible at large En. The barrierbetween O2~ and 2O- is obviously along r. As it was shown in the ion beamexperiments that O2- is stable against immediate dissociation it is clear that a secondbarrier to dissociation exists. The barrier may also show orientational or lateraldependence, which is ignored in our PES, and may even depend on adsorbateinduced reconstructions. This leaves O2" as the only ionic species observed in highenergy experiments (En < 15eV). The barrier can be overcome with nonnegligibleprobability if a molecule will trap and stabilize in the O2- well. The O2- statetherefore acts a another, activated, precursor to dissociation.
The constructed PES has analogies with the PES computed for the interactionbetween H2and Mg(0001), where the barrier to dissociation was found to belocated along the vibrational degree of freedom while the intermediate wasinferred to be an H2~ ion [24]. However, in that surface the barrier for molecularchemisorption is along z, which is clearly not the case for the present system, inaccordance with our observations. A barrier similar to that in the H2/Mg(0001)system is also found in the surface for O2 on Ag(110) proposed by Lin andGarrison [35]. Such a barrier can be surmounted by an increase of En, which is notconfirmed by our work. The reason that Lin and Garrison have found such abarrier is explainable by the fact that they used for the 0 - 0 interaction only the O2Morse potential and a repulsive antimorse potential. The introduction of the O2-state could make their potential surface more realistic. Finally, a PES has beenderived for the interaction between N2 and Fe(l l l ) , see e.g. [11-13,36]. For thelatter the sticking probability for dissociative chemisorption is also extremely lowat thermal energies, but it seems to increase much more rapid for increasing Ei. Inthis case the barriers are located firstly along an orientational and a lateral degreeof freedom, and secondly along the translational degree of freedom. Althoughthere seems to be an electronically excited intermediate of N2 involved in the firstchemisorption state, the N2- resonance is by far not as stable as <>r, and therefore asimple charge transfer picture may not be very probable for systems involving N2.
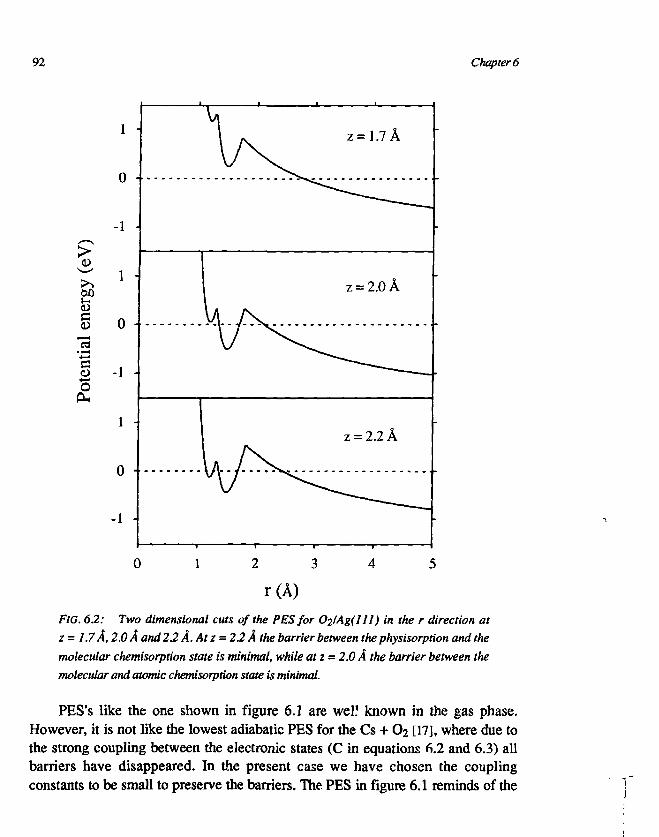
92 Chapter 6
isc
0
-1
1 -
§ 0 4
- 1 •
1 -
0 •
-1 -
0
= 1.7A
z = 2.0 A
= 2.2A
r(A)FIG. 6.2: Two dimensional cuts of the PES for O2/Ag(lll) in the r direction atz = 1.7 A, 2.0 A and 2.2 A.Atz = 2.2 A the barrier between the physisorption and themolecular chemisorption state is minimal, while atz = 2.0 A the barrier between themolecular and atomic chemisorption state is minimal.
PES's like the one shown in figure 6.1 are weV. known in the gas phase.However, it is not like the lowest adiabatic PES for the Cs + O2 [17], where due tothe strong coupling between the electronic states (C in equations 6.2 and 6.3) allbarriers have disappeared. In the present case we have chosen the couplingconstants to be small to preserve the barriers. The PES in figure 6.1 reminds of the
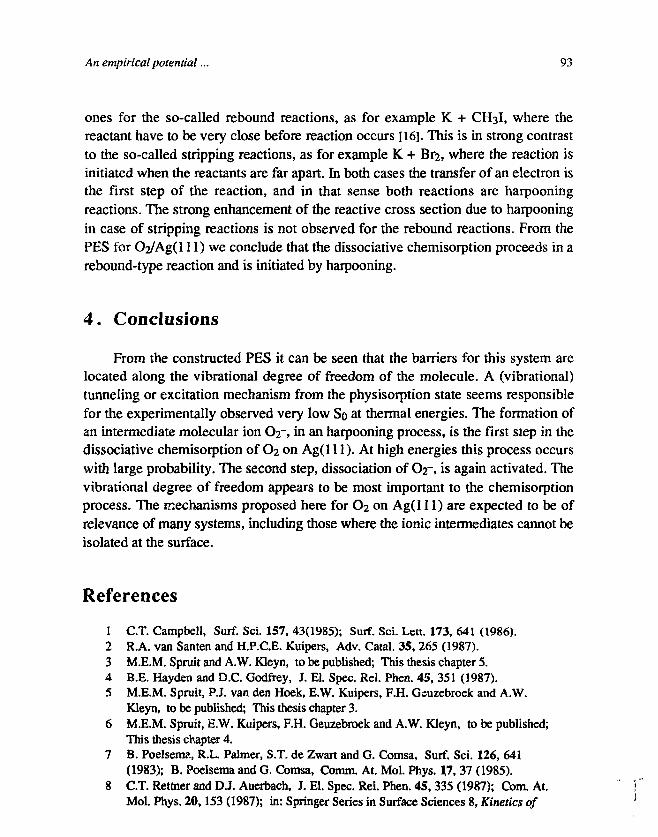
An empirical potential... 93
ones for the so-called rebound reactions, as for example K + CH3I, where thereactant have to be very close before reaction occurs [16]. This is in strong contrastto the so-called stripping reactions, as for example K + Br2, where the reaction isinitiated when the reactants are far apart. In both cases the transfer of an electron isthe first step of the reaction, and in that sense both reactions are harpooningreactions. The strong enhancement of the reactive cross section due to harpooningin case of stripping reactions is not observed for the rebound reactions. From thePES for O2/Ag(l 11) we conclude that the dissociative chemisorption proceeds in arebound-type reaction and is initiated by harpooning.
4. Conclusions
From the constructed PES it can be seen that the barriers for this system arelocated along the vibrational degree of freedom of the molecule. A (vibrational)tunneling or excitation mechanism from the physisorption state seems responsiblefor the experimentally observed very low So at thermal energies. The formation ofan intermediate molecular ion O2-, in an harpooning process, is the first step in thedissociative chemisorption of O2 on Ag(l 11). At high energies this process occurswith large probability. The second step, dissociation of ( V , is again activated. Thevibrational degree of freedom appears to be most important to the chemisorptionprocess. The mechanisms proposed here for O2 on Ag(l 11) are expected to be ofrelevance of many systems, including those where the ionic intermediates cannot beisolated at the surface.
References
1 C.T. Campbell, Surf. Sci. 157, 43(1985); Surf. Sci. Lett. 173, 641 (1986).2 R.A. van Santen and H.P.C.E. Kuipers, Adv. Catal. 35, 265 (1987).3 M.E.M. Spruit and A.W. Kleyn, to be published; This thesis chapter 5.4 B.E. Hayden and D.C. Godfrey, J. El. Spec. Rel. Phen. 4S, 351 (1987).5 M.E.M. Spruit, P.J. van den Hoek, E.W. Kuipers, F.H. Gsuzebroek and A.W.
Kleyn, to be published; This thesis chapter 3.6 M.E.M. Spruit, E.W. Kuipers, F.H. Geuzebroek and A.W. Kleyn, to be published;
This thesis chapter 4.7 B. Poelsema, R.L. Palmer, S.T. de Zwart and G. Comsa, Surf. Sci. 126, 641
(1983); B. Poelsema and G. Comsa, Comm. At. Mol. Phys. 1,7, 37 (1985).8 C.T. Rettner and D.J. Auerbach, J. El. Spec. Rel. Phen. 45,335 (1987); Com. At.
Mol. Phys. 20,153 (1987); in: Springer Series in Surface Sciences 8, Kinetics of
94 Chapter 6
Interface Reactions, Edited by M. Grunze and H.J. Kreuzer (Springer-Verlag,Berlin, 1987) p. 125; p. 145.
9 M.D. Williams, D.S. Bethune and A.C. Luntz, J. Chem. Phys. 88,2843 (1988).10 A.V. Hamza, P.M. Ferm, F. Budde and G. Ertl, To be published.11 S. Holloway, A. Hodgson and D. Halstead, Chem.Phys.Lett., in press.12 D. Tomanek and K.H. Bennemann, Phys. Rev. B 31, 2488 (1985).13 C.T. Rettner and H. Stein, J. Chem. Phys. 87, 770 (1987); Phys. Rev. Lett. 59,
2768 (1987).14 MB. Lee, J.D. Beckerle, S.L. Tang and S.T. Ceyer, J.Chem.Phys. 87, 723
(1987).15 C. Backx, C.P.M. de Groot and P. Biljoen, Surf. Sci. 104, 300 (1981).16 D.R. Herschbach, Adv. Chem. Phys. 10, 319 (1966); J.C. Polanyi, Ace. Chem.
Res. 5, 161 (1972); R.D. Levine and R.B. Bernstein, Molecular Collision Theory(Clarendon Press, Oxford, 1974).
17 A.W. Kleyn, J. Los and E.A. Gislason, Phys. Reports 90, 1 (1982).18 Pan Haochang, T.C.M. Horn and A.W. Kleyn, Phys. Rev. Lett. 57, 3035 (1986);
J. El. Spec. Rel. Phen. 45, 361 (1987).19 P.J. van den Hoek, T.C.M. Horn and A.W. Kleyn, Surf. Sci. Lett. 198, L335
(1988).20 P.H.F. Reijnen and A.W. Kleyn, To be published.21 S. Schubert, U. Imke, W. Heiland, K.J. Snowdon, P.H.F. Reijnen and A.W.
Kleyn, to be published.22 J.M. Home and D.R. Miller, Surf. Sci. 66, 365 (1977).23 J.A. Barker and D.J. Auerbach, Surf. Sci. Rep. 4, 1 (1985).24 J.K. N0rskov, A. Houm0ller, P. Johansson and B.L. Lundqvist, Phys. Rev. Lett.
46, 275 (1981).25 S. Holloway and J.W. Gadzuk, J. Chem. Phys. 82, 5203 (1985).26 S. Holloway, J. Vac. Sci. Techn. A 5, 476 (1987).27 C-Y. Lee and A.E. DePristo, J. Vac. Sci. Techn. A 5,485 (1987).28 D. Schmeisser, J.E. Demuth and Ph. Avouris, Phys. Rev. B 26, 4857 (1982).29 P.H.F. Reijnen, A.W. Kleyn, U. Imke and K.J. Snowdon, Nucl. Instr. Meth. B,
in press.30 P.H.F. Reijnen, A.W. Kleyn, U. Imke and K.J. Snowdon, To be published.31 A. Selmani, J.M. Sichel and D.R. Salahub, Surf. Sci. 157, 208 (1985); A.
Selmani, J. Andzelm and D.R. Salahub, Int. J. Quant. Chem. 29, 829 (1986).32 K.P. Huber and G. Herzberg, Molecular Spectra and Molecular Structure, Vol. 4,
(Van Nostrand Reinhold, New York, 1979).33 E.J. Baerends, D.E. Ellis and P. Ros, Chem. Phys. 2, 41 (1973).34 P.J. van den Hoek, A.D. Tenner, A.W. Kleyn and E.J. Baerends, Phys. Rev. B
34, 5030 (1986).35 J.H. Lin and B.J. Garrison, J. Chem. Phys. 80, 2904 (1984).36 H.J. Freund, B. Bartos, R.P. Messmer, M. Grunze, K. Kuhlenbeck and M.
Neumann, Surf. Sci. 185, 187 (1987).

95
Summary
The interaction of gasses and solid surfaces is widely investigated. Detailedstudy on these interactions requires investigation of molecule-surface collisions.Essentially there exist only two possible outcomes for such collisions. Firstly, amolecule can scatter directly from the surface, during which energy exchange withthe surface can occur, but not to that extend that the molecule "forgets" its initialmomentum. Secondly, the molecule can transfer so much translational energy incollision with the surface, that the molecule gets trapped in a potential well at thesurface. If the well is only shallow (physisorption), the weakly bound particle maygain energy from vibrating surface atoms, and subsequently desorb into the gasphase. Capture into a deeper well (chemisorption) is called sticking. The latter isbased on a chemical interaction. Following trapping or sticking, a variety ofreactions at the surface can occur, m this thesis we probe the dynamics of directscattering, trapping and sticking. For this kind of investigation molecular beammethods are necessary.
We have chosen to investigate mainly the (VAg interaction, and we have usedthe close-packed (111) plane of Ag as target surface. The Ag(l 11) surface exhibitsnegligible structure for scattering of thermal particles. Thermal desorptionspectroscopy of O2 from Ag(l 11) has revealed that oxygen can exist in three stateson the Ag( l l l ) surface, namely a weakly bound physisorption state, a molecularchemisorption state and a strongly bound atomic chemisorption state. The estimateddesorption temperatures of these states are (<)50 K, 220 K and 580 K, respectively.A potential energy diagram of the ( V A g O l l ) system has been proposed,exhibiting three bound states as a function of a reaction coordinate. The stickingcoefficient of O2 is extremely low (< 10-5) for thermal molecules.
In the scattering experiments we used a well-collimated supersonic molecularbeam, which collides with a Ag(l 11) single crystal in UHV. The measured angularand momentum distributions of the scattered particles give information on energytransfer as a function of angle of incidence ©i, angles of reflection 6f and incidenttranslational energy E;. The experimental setup is described in chapter 2.
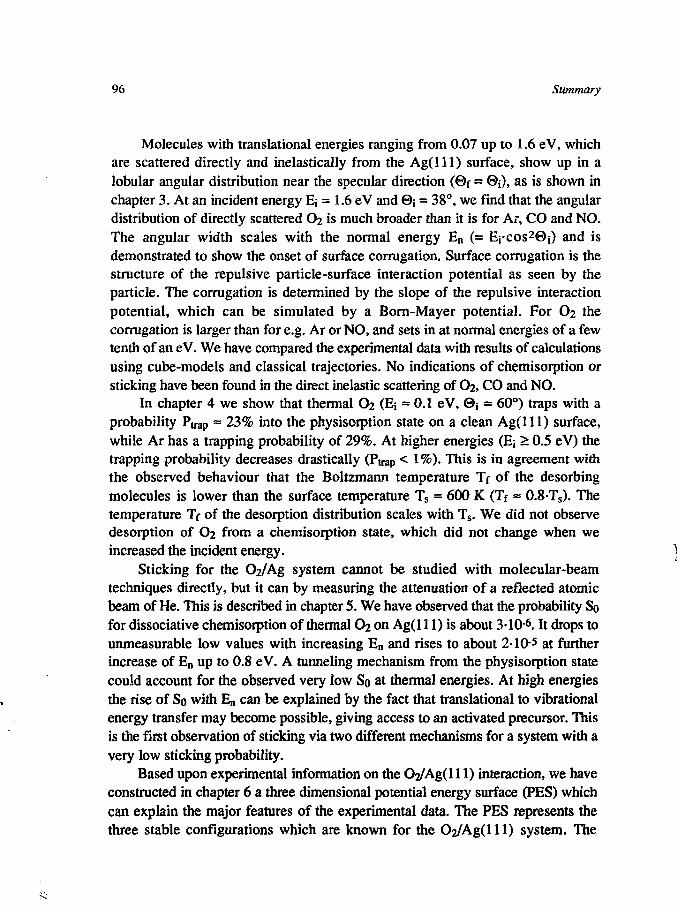
96 Summary
Molecules with translational energies ranging from 0.07 up to 1.6 eV, whichare scattered directly and inelastically from the Ag( l l l ) surface, show up in alobular angular distribution near the specular direction (0f = ©i), as is shown inchapter 3. At an incident energy Ej = 1.6 eV and 0j = 38°, we find that the angulardistribution of directly scattered O2 is much broader than it is for Ar, CO and NO.The angular width scales with the normal energy En (= Ej-cos20j) and isdemonstrated to show the onset of surface corrugation. Surface corrugation is thestructure of the repulsive particle-surface interaction potential as seen by theparticle. The corrugation is determined by the slope of the repulsive interactionpotential, which can be simulated by a Born-Mayer potential. For O2 thecorrugation is larger than for e.g. Ar or NO, and sets in at normal energies of a fewtenth of an e V. We have compared the experimental data with results of calculationsusing cube-models and classical trajectories. No indications of chemisorption orsticking have been found in the direct inelastic scattering of O2, CO and NO.
In chapter 4 we show that thermal O2 (Ej = 0.1 eV, 0 i = 60°) traps with aprobability Ptrap ~ 23% into the physisorption state on a clean Ag( l l l ) surface,while Ar has a trapping probability of 29%. At higher energies (Ej > 0.5 eV) thetrapping probability decreases drastically (Ptrap < !%)• This is in agreement withthe observed behaviour that the Boltzmann temperature Tf of the desorbingmolecules is lower than the surface temperature Ts = 600 K (Tf ~ 0.8-Ts). Thetemperature Tf of the desorption distribution scales with Ts. We did not observedesorption of O2 from a chemisorption state, which did not change when weincreased the incident energy.
Sticking for the 02/Ag system cannot be studied with molecular-beamtechniques directly, but it can by measuring the attenuation of a reflected atomicbeam of He. This is described in chapter 5. We have observed that the probability Sofor dissociative chemisorption of thermal O2 on Ag(l 11) is about 340-6. It drops tounmeasurable low values with increasing En and rises to about 2-10'5 at furtherincrease of En up to 0.8 eV. A tunneling mechanism from the physisorption statecould account for the observed very low So at thermal energies. At high energiesthe rise of So with En can be explained by the fact that translational to vibrationalenergy transfer may become possible, giving access to an activated precursor. Thisis the first observation of sticking via two different mechanisms for a system with avery low sticking probability.
Based upon experimental information on the O2/Ag(l 11) interaction, we haveconstructed in chapter 6 a three dimensional potential energy surface (PES) whichcan explain the major features of the experimental data. The PES represents thethree stable configurations which are known for the O2/Ag(lll) system. The
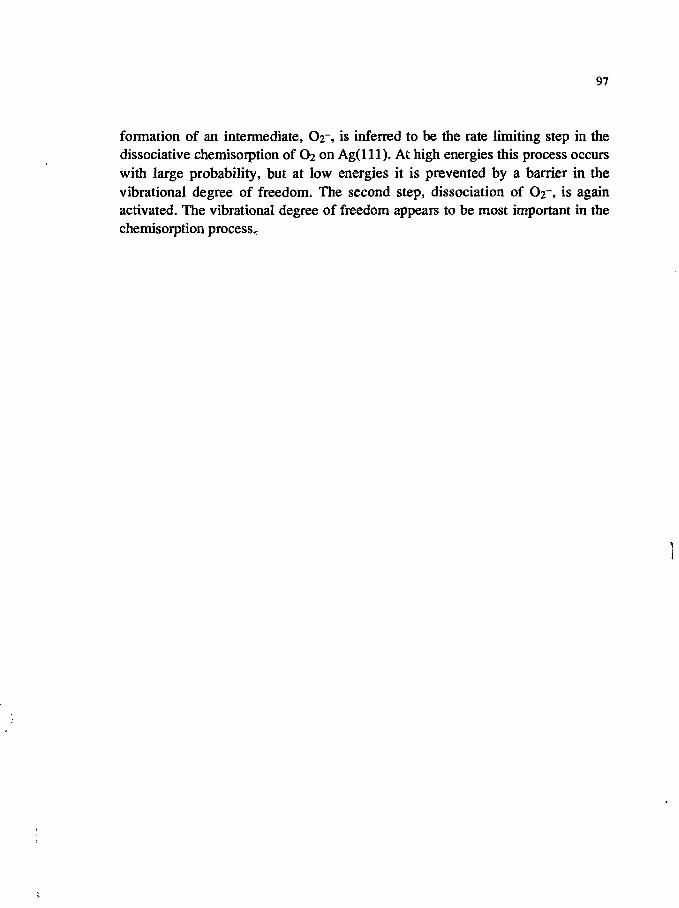
97
formation of an intermediate, O2~, is inferred to be the rate limiting step in thedissociative chemisorption of O2 on Ag(ll l) . At high energies this process occurswith large probability, but at low energies it is prevented by a barrier in thevibrational degree of freedom. The second step, dissociation of O2-, is againactivated. The vibrational degree of freedom appears to be most important in thechemisorption process^
99
Samenvatting
De wisselwerkingen van gassen met metaaloppervlakken staan sterk in debelangstelling. Een gedetailleerd onderzoek van deze wisselwerkingen vereist hetbestuderen van botsingen van moleculen met een oppervlak. In principe zijn ertwee mogelijkheden voor zulke botsingen. In de eerste plaats kan een molecuuldirect verstrooien aan het oppervlak, waarbij energie-overdracht tussen molecuulen oppervlak mogelijk is. In de tweede plaats kan het molecuul in de botsing zoveelenergie overdragen aan het oppervlak, dat het gevangen wordt ("trapping") in eenpotentiaalput voor het oppervlak. Indien de put ondiep is (physisorptie), kan hetzwakgebonden deeltje energie opnemen van vibrerende oppervlakatomen, zodathet vervolgens kan desorberen naar de gasfase. Het invangen in een diepere put(chemiesorptie) noemen we "sticking", hetgeen gebaseerd is op een chemischewisselwerking. Als een deeltje gevangen is door het oppervlak kunnen erverscheidene reacties plaatsvinden aan het oppervlak, üi dit proefschrift bestuderenwe de dynamica van directe verstrooiing, trapping en sticking. Voor dit soortonderzoek hebben we een moleculaire bundel nodig.
We hebben voornamelijk de wisselwerking van O2 met Ag bestudeerd,waarbij we het dichtstgepakte (lll)-vlak van Ag als verstrooiingsoppervlakgebruikt hebben. Het Ag(l 11) oppervlak vertoont nauwelijks enige structuur voorverstrooiende deeltjes met thermische energie. Met behulp van temperatuur-gestuurde desorptie heeft men aan kunnen tonen, dat O2 in drie stabiele toestandenop het Ag(l l l ) oppervlak kan bestaan, namelijk een zwakgebonden physisorptietoestand, een moleculaire chemiesorptie toestand en een sterkgebonden atomairechemiesorptie toestand. De bindingssterkte van deze toestanden wordt gekarak-teriseerd door de desorptietemperatuur, die respectievelijk (<)50 K, 220 K en580 K is. De kans dat thermische O2 op het Ag( l l l ) oppervlak in de atomairechemiesorptie toestand komt is uiterst klein (< 10-5).
In onze verstooiingsexperimenten hebben we gebruik gemaakt van eengecollimeerde supersonische moleculaire bundel, die gericht wordt op een Ag(l 11)monokristal in ultrahoog vacuüm. De gemeten hoek- en snelheidsverdelingen vande verstrooide deeltjes geven informatie over de energieoverdracht als functie van
100
de hoek van inval, ©j, de hoek van verstrooiing, ©f, en de inkomende translatie-energie, Ej. De meetopstelling is beschreven in hoofdstuk 2.
Moleculen, die met een translatie-energie tussen de 0.07 eV en de 1.6 eV directen inelastisch verstrooid worden aan een Ag(l l l ) oppervlak, verschijnen na debotsing in een tamelijk brede hoekverdeling in de buurt van de speculaire richting(0f = ©i), zoals beschreven is in hoofdstuk 3. Bij een energie Ej = 1.6 eV en©i = 38°, zien we dat de hoekverdeling van direct-verstrooide O2 veel breder is dandie van Ar, CO en NO. De breedte van de hoekverdeling schaalt met de normaleenergie En (=Ej-cos20j). We laten zien dat deze breedte aangeeft bij welke energiecorrugatie van het oppervlak begint op te treden. Corrugatie is de structuur van deafstotende wisselv. srkingspotentiaal tussen molecuul en oppervlak, zoals diegevoeld wordt door het molecuul. De corrugatie wordt bepaald door de helling vande afstotende wisselwerkingspotentiaal, die gesimuleerd kan worden door eenBorn-Mayer potentiaal. Voor O2 blijkt de corrugatie van Ag( l l l ) sterker te zijndan voor Ar, CO en NO, en zet al in bij enige tienden van een eV. We hebben deexperimentele resultaten vergeleken met resultaten uit berekeningen, die gebaseerdzijn op kubusmodellen en klassieke baanberekeningen. In de resultaten van directeverstrooiing van O2, CO en NO hebben we geen aanwijzingen gevonden voorchemiesorptie, ofwel sticking.
In hoofdstuk 4 laten we zien dat thermisch O2 (E; = 0.1 eV, 0j = 60°) een kansPuap heeft van ongeveer 23% om in de physisorptie toestand op een schoon Ag(l 11)oppervlak gevangen te worden. Voor Ar is deze kans ongeveer 29%. Bij hogereenergieën (E, > 0.5 eV) neemt de vangstkans drastisch af (Pirap < 1%). Dit isin overeenstemming met de waarneming, dat de Boltzmann temperatuur Tf vande desorberende moleculen lager is dan de oppervlaktetemperatuur Ts = 600 K(Tf ~ 0.8-Ts). De temperatuur Tf van de desorptieverdeling schaalt met Ts. Wehebben geen desorptie van O2 uit een chemiesorptie toestand waar kunnen nemen,noch bij thermische, noch bij hogere energie.
Sticking van O2 op Ag(l l l ) kan niet rechtstreeks bestudeerd worden met eenmoleculaire bundel. Het is echter wel mogelijk om sticking te bestuderen doormiddel van het meten van de verzwakking van een gereflecteerde bundel He. Dit isbeschreven in hoofdstuk 5. We hebben waargenomen dat de kans So op dissociatievechemiesorptie van thermische O2 aan een schoon Ag( l l l ) oppervlak ongeveer3-106 is. Voor hogere En daalt So tot een onmeetbaar kleine waarde, terwijlverdere verhoging van En to ongeveer 0.8 eV leidt tot een toename van So totongeveer 2-10-5. Een tunnelmechanisme vanuit de physisorptie toestand zou eenmogelijke verklaring voor de waargenomen So bij thermische energieën kunnenzijn. Een toename van So bij toenemende En kan verklaard worden door de
101
mogelijke omzetting van translationele energie naar vibrationele energie, zodat viaeen geactiveerde precursor de dissociatieve chemiesorptie toestand bereikbaarwordt. Dit is de eerste keer dat een combinatie van bovengenoemde twee processenis waargenomen voor een systeem met een zeer lage So.
Gebaseerd op de experimentele informatie over de wisselwerking van O2 metAg( l l l ) , hebben we in hoofdstuk 6 een potentiële-energie-oppervlak (PES) alsfunctie van de intranucleaire afstand in het O2 molecuul en de afstand van hetmolecuul tot het oppervlak geconstrueerd. Dit PES is in staat om de belangrijksteexperimentele waarnemingen te verklaren. Tevens representeert het PES de driebekende stabiele toestanden van het C>2/Ag(lll) systeem. Het formeren van eentussenprodukt, O2-, lijkt de beperkende stap voor dissociatieve chemiesorptie vanO2 op A g ( l l l ) te zijn. Bij hogere energieën vindt dit proces met hogewaarschijnlijkheid plaats, terwijl het bij lagere energieën voorkomen wordt dooreen barrière in de vibrationele vrijheidsgraad. De volgende stap, de dissociatie vanC>2~, is ook geactiveerd. Het blijkt dat de vibrationele vrijheidsgraad bijzonderbelangrijk is voor het chemiesorptieproces.
103
Nawoord
Met dit proefschrift sluit ik een boeiende tijd af, waarin ik alle fasen van eenomvangrijk experimenteel onderzoek van dichtbij mee kon maken. Hoewel ditboekje geen chronologische beschrijving is, geeft het toch een aardige indruk vanhet reilen en zeilen van het onderzoek. Echter, het zou de indruk kunnen wekkendat het alleen fysica is dat tot successen leidt. Niets is echter minder waar, want desteun en het vertrouwen van Marian in de goede afloop was voor mij minstens zobelangrijk om verder te gaan. En wie weet waar ik gestrand zou zijn indien mijnouders mij niet gestimuleerd hadden om te gaan studeren. Verder heb ik het ergplezierig gevonden om bij familie of vrienden de pure fysica wat te kunnencompenseren.
Desondanks neemt de fysica natuurlijk een belangrijke plaats in het onderzoekin. Door de vele contacten met mede labgenoten is het moeilijk uit te maken wieallemaal heeft bijgedragen aan de experimenten. Vandaar dat ik, buiten de namendie me op dit moment van schrijven te binnen schieten, iedereen wil bedanken diedirekt of indirekt betrokken is geweest bij het onderzoek. In de beginfase, waarinde meetopstelling letterlijk vanaf de grond opgebouwd is, is veel werk verrichtdoor de technici van de groep "Molbundels" (Ruud, Rinaldo, Henk, Jasper, Carel,Arjan) en van buiten die groep (Ben, Jan, Paul, Henk, Wim, Marco, Hans, ...).Voor het feitelijke experimenteren kwam een belangrijke bijdrage van de groeps-genoten, in het bijzonder degenen die aan dezelfde apparatuur en programmatuurwerkte (Edgar, Manfred, Frank, Paul, Torn). Verder was er ook nog inbreng van"veraf (Jacques, C. Rettner). Als last-but-not-least wil ik nog de begeleidingmemoreren van Aart, die alles op het juiste spoor moest proberen te houden, enJoop die ondanks mijn krappe tijdsplanning toch nog promotor wilde zijn.