Metabolic regulation of asparagine synthetase gene expression in maize (Zea mays L.) root tips
Upload
independentCategory
view
0download
0
MODELING THE IMPACT OF CLIMATE
CHANGE ON MAIZE (Zea mays L.)
PRODUCTIVITY IN THE PUNJAB
BY
TASNEEM KHALIQ M.Sc. (Hons) Agri.
94-ag-1056
A thesis submitted in partial fulfillment of the requirements for the degree of
DOCTOR OF PHILOSOPHY
IN
AGRONOMY FACULTY OF AGRICULTURE
UNIVERSITY OF AGRICULTURE FAISALABAD
PAKISTAN
2008


Oh Lord, Make me
An Instrument of Your Peace Where, there is Hatred Let me sow Love Where, there is Injury, Pardon Where, there is Doubt, Faith Where, there is Despair, Hope Where, there is Darkness, Light And where, there is Sadness, Enjoy
and affectionate
First step to take
To My beloved MOTHER
FATHER Who taught me The first word to speak The first alphabet to write and

ACKNOWLEDGEMENTS
pra ses and MIGHTY ALLAH, the benefice
erciful, whose blessings and exaltation flourished my thoughts and thrived my
mbitions to have the che forts in the form of this write-up f
e blooming ring of my humblest thanks from the
epest core o my heart PHET, the city of knowledge, HAZRAT
UHAMMA (Peace B
I feel h privi titude to my Supervisor,
r. Ashfaq Ahmad, A rtment of Agronomy, under whose
ynamic supe on, pr nthropic attitude
ncouragemen resea t.
Thanks re extend members Dr. Abid Hussain,
rofessor, Dep ent of ta Muhammad Ranjha, Professor, Ins
f Soil and En enta li, Director General Agriculture
xt. & AR) for their valu ating encouragement during the cour f
resent studies.
I shall issin g if do not extend my admiration and appreciatio o
r. Gerrit Hoogenboom odeling & Agro-meteorology, Dept f
iological & Agricutural University of Georgia, GA, USA who prov
chnical and m uppo pletion of these studies and in writing this
anuscript.
Finally I extend m se of gratitude to my affectionate g d
other, sisters other, w ly son (Ahmad Abdullah) for their prayers fo y
uccess and es ially my -u-rehman, Moazzam, M. Tayyab, Asghar Shahbaz,
. Ghaffar and an Raso ch at different locations. I am o
ankful to my ad Ibrahim, Naveed Ahmad Rand a
nd M. Wajid N im Jatoi the write up of this manuscript.
(Tasneem Kh )
February 28, 2
All i thanks are for AL nt, he t
m
a rish fruit of my modest ef rom
th sp blossoming knowledge. I offer
de f to the HOLY PRO
M D e upon Him) for humanity.
ighly leged to express the deep sense of gra
D ssociate Professor, Depa
d rvisi opitious guidance, keen interest, phila and
e t, the rch work presented in this dissertation was carried ou
a ed to the supervisory committee
P artm Agronomy, Dr. A titute
o vironm l Sciences and Dr. M. Anjum A
(E able advice and invigor se o
p
be m g somethin n t
D , Professor Crop M . o
B Engineering, The ided
te oral s rt for the successful com
m
y heartiest and sincere sen ran
m , br ife and love r m
s pec friends Atiq
A Irf ol Nasir who assist in my resear als
th fellows Dr. Shaheen Iqbal Muhamm, haw
a as who helped me during
aliq008
i

CONTENTS
CHAPTER PAGE TITLE Acknowledgements I List of Tables
ist of Figures V
L Viii
URE OMPONENTS
ivar fertilizer
TION PAR TH MODELING
NGE AND MAIZE PRODUCTION
D METHODS
cob eight (g)
t ha-1)
.4.7 eather data 39
List of Appendices ist of Abbreviations and symbols
X Xi L
1 INTRODUCTION 1 2 REVIEW OF LITERAT 5 2.1 YIELD AND YIELD C 5 2.1.1 Effect of cult 5 2.1.2 Effect of nitrogen 9 2.2 GROWTH AND INTERCEP 13 2.3 CROP GROW 16 2.4 CLIMATE CHA 23 3 MATERIALS AN 30 3.1 SITE AND SOIL 30 3.1.1 Soil analysis 31 3.2 DESIGN AND TREATMENTS 31 3.3 CROP HUSBANDRY 33 3.4 OBSERVATIONS 33 3.4.1 Development 35 3.4.2 Growth 35 Sampling 35 Leaf area index 36 Leaf area duration 36 Crop growth rate 36 Net assimilation rate 36 3.4.3 Interception of radiation 36 3.4.4 Radiation use efficiency 37 3.4.5 Final harvest 37 i No of plants m-2 at harvest 37 ii Plant height 38 iii Cob girth 38 iv Cob length 38 v Number of grain rows per cob 38 vi Number of grains per 38 vii Thousand grain w 38 viii Grain yield (t ha-1) 38 ix Total dry matter ( 38 x Harvest index (%) 38 xi Grain pith ratio (GPR) 38 xii
.4.6 Cob sheath ratio
tatistical analysis 38 39
33
SW
ii

CHAPTER TITLE PAGE 3..5 CROP GROWTH MODELING 39 3.5.1 Model description
valuation essment
CUSSION
NT
.4 F GROWTH
.4.1
.4.2 ate 4.4.3 Crop growth rate 68 4.5 COMPONENTS OF GRAIN YIELD 71 4.5.1. No of plants m-2 at harvest 71 4.5.2. Number of grain rows per cob 71 4.5.3. Number of grains cob-1 74 4.5.4. Number of grains m-2 77 4.5.5. Thousand grain weight (g) 79 4.5.6 Grain yield (t ha-1) 82 4.5.7 Total dry matter (t ha-1) 84 4.5.8 Harvest index (%) 87 4.5.9 Correlation between grain yield and components of yield 89 4.5.10 Grain pith ratio (GPR) 89 4.5.11 Cob sheath ratio (CSR) 92 4.6 GROWTH AND INTERCEPTED RADIATION 96 4.6.1 Fraction of intercepted radiation 96 4.6.2 Incident and Intercepted Radiation 96 4.6.3 Radiation Utilization Efficiency 102 4.7 CROP GROWTH MODELING 107 4.7.1 Cultivar coefficients and simulation 107 4.7.2 Model evaluation 112 4.7.2.1 Crop duration 112 4.7.2.3 Leaf area index 114 4.7.2.1 No of grain m-2 117 4.7.2.2 Mean grain weight (g) 120 4.7.2.3 Grain yield (kg ha-1) 120 4.7.2.4 Total dry matter (kg ha-1) 123
39 3.5.2 Model calibration and e 40 3.5.3 Climate change impact ass 41 3.5.4 Strategy analysis
43
4 RESULTS AND DIS 44 4.1 WEATHER 44 4.2 CROP DEVELOPME 44 4.2.1 Plant height (cm) 47 4.2.2 Days to 50% tasseling 49 4.2.3 Days to 50% silking 49 4.3 GROWTH 52 4.3.1 Leaf area index 52 4.3.2 Total dry matter accumulation 56 4.3.3 Cob girth (cm) 59 4.3.4 Cob length (cm) 69 4 ANALYSIS O 62 4 Leaf area duration 62 4 Net assimilation r 66
iii

CHAPTER TI PAGE TLE 4.7.2.5 Ha 123 rvest index 4.7.3
4.7.3. Model validation 1 Grain yield (kg ha-1)
127
PRODUCTIVITY 131
133 n temperature 135
135 137 140 142 143 143 145 148 148 150 154
REFERENCES 158 176
127 127
4.7.3.2 Total dry matter (kg ha-1) 4.8 IMPACT OF CLIMATE CHANGE ON MAIZE
4.8.1 Impact of CO2 levels 4.8.2 Impact of change i
a Hybrid Bemasal-202 b Hybrid Monsanto-919 4.8.4
c Hybrid Pioneer-31-R-88 Adaptation strategies
4.8.4.1 Evaluation of hybrid and planting date for 2020 a Yield analysis
b Economic and strategic analysis 4.8.4.1 Evaluation of hybrid and planting date for 2050 a Yield analy
sis strategic analysis
b Economic analysis 5 SUMMARY
APPENDICES
iv

LIST OF TABLESE E
TABL TITLE PAG3.1 Summary of field attributes, soil and crop management 30 3.2 Crop husbandry operations for the experiments during cropping
season 34
3.3 Climate change scenarios selected for study impact of climate change on maize productivity.
42
4.1 4.2
Phenological data of different maize cultivars during the year 2004Phenological data of different maize cultivars during the year 2005
(days) ays)
at
h
h
.25 ls affecting cob sheath tio at Sahiwal
5
45 46
4.3 Effect of cultivars and fertilizer levels on plant height (cm) at maturity
48
4.4 4.5
Effect of cultivars and fertilizer levels on days to tasseling Effect of cultivars and fertilizer levels on days to silking (d
50 51
4.6 Effect of cultivars and fertilizer levels on maximum leaf area indexat 55 days after sowing
53
4.7 4.8
Effect of cultivars and fertilizer levels on cob girth (cm) at maturityEffect of cultivars and fertilizer levels on cob length (cm) at
60 61
maturity Effect of cultivars and fertilizer levels on cumulative leaf area 4.9 duration (day) Effect of cultivars and fertilizer levels on net assimilation rate (g m
63
4.10 -
2 -1d ) Effect of cultivars and fertilizer levels on mean crop growth rate (g
-2 -1
67
4.11 m d ) Effect of cultivars and fertilizer levels on plant population m
69
4.12 -2 atharvest Effect of cultivars and fertilizer levels on number of grain rows
-1
72
4.13 cobEffect of cultivars and fertilizer levels on number of grain per cob
73
4.14 75 4.15 4.16
Effect of cultivars and fertilizer levels on number of grain m-2 78 80 Effect of cultivars and fertilizer levels on 1000- grain weight (g)
4.17 Effect of cultivars and fertilizer levels on grain yield (t ha-1)maturity
83
4.18 Effect of cultivars and fertilizer levels on total dry matter (t ha-1) atmaturity
86
4.19 4.20
Effect of cultivars and fertilizer levels on harvest index (%) Correlation between grain yield and yield components of maize
88 90
4.21 4.22
Effect of cultivars and fertilizer levels on grain pith ratio Effect of cultivars and fertilizer levels on cob sheath ratio
91 93
4.23 Interaction between hybrid and nitrogen levels affecting cob sheatratio at Faisalabad.
94
4.24 Interaction between hybrid and nitrogen levels affecting cob sheatratio at Sargodha. nteraction between hybrid and nitrogen leve
94
4 Ira
9
v
TABLE TITLE PAGE 4.26 Effect of cultivars and fertilizer levels on fraction of intercepted
radiation (Fi) at 55 days after sowing 99
4.27 Interaction between hybrid and nitrogen levels affecting fractionintercepted radiation at 55 days after sowing
of , at Sahiwal site.
y
.30 Effect of cultivars and fertilizer levels on radiation use efficiency for grain yield (g MJ-1)
105
4.31 Genetic coefficients of maize hybrids used for CSM-CERES-Maize model
108
4.32 Summary of observed and simulated results during model calibration with 300 kg N ha-1 treatment in 2005.
109
4.33 Comparison of simulated and observe days to anthesis at different nitrogen levels and locations during year 2005
113
4.34 Comparison of simulated and observe days to maturity at different nitrogen levels and locations during year 2005
115
4.35 Comparison of simulated and observe maximum leaf area index at different nitrogen levels and sites during year 2005
116
4.36 d-statistics of time course leaf area index at varying nitrogen levels and locations during 2004 and 2005
118
4.37 Comparison of simulated and observe no of grains m-2 at different nitrogen levels and locations during year 2005
119
4.38 Comparison of simulated and observe mean grain weight (g) at different nitrogen levels and locations during year 2005
121
4.39 Comparison of simulated and observe final grain yield (kg ha-1) at different nitrogen levels and locations during year 2005
122
4.40 Comparison of simulated and observe total dry matter at different nitrogen levels and locations during year 2005
124
4.41 d-statistics of time course total dry matter at varying nitrogen levels and locations during 2004 and 2005
125
4.42 Comparison of simulated and observe harvest index (%) at different nitrogen levels and locations during year 2005
126
4.43 Comparison of simulated and observe total dry matter at different nitrogen levels and sites during year 2004
130
4.44 Impact of CO2 concentration on phenology, growth and yield of maize hybrids grown at different locations
134
4.45 Impact of temperature and CO2 scenarios on phenology, growth, yield, and yield component of maize hybrid
136
4.46 Impact of temperature and CO2 scenarios on phenology, growth, yield, and yield component of maize hybrid
138
4.47 Impact of temperature and CO2 scenarios on phenology, growth, yield, and yield component of maize hybrid
141
100
4.28 Effect of cultivars and fertilizer levels on cumulative intercepted PAR (MJ m-2) at 105 days after sowing
101
4.29 Effect of cultivars and fertilizer levels on radiation use efficiencfor final total dry matter (g MJ-1)
103
4
vi

TABLE TITLE PAGE 4.48 Simulated grain g planting dates
and sites for changed temperature scenario in 2020 146 yield for different hybrids at varyin
4.49 Dominance analysis of differe ng dates and hybrids for 2
S a
151
D2
152
nt planti020 at various regions of Punjab, Pakistan imulated grain yield for different hybrids at varying planting dates
147
4.50nd sites for changed temperature scenario in 2050 ominance analysis of different planting dates and hybrids for 050 at various regions of Punjab, Pakistan
4.51
vii

LIST O URES F FIG FIGURES TITLE PAGE 3.1 Modeling the impact of climate change on maize (zea mays. l)
productivity in the Punjab. 32
4.1 Average monthly maximum and minimum air temperature, solar radiation, and total monthly rainfall for the experimental sites.
44
4.2 Change in pooled leaf area index of three hybrids with time at (a) Faisalabad (b) Sargodha and (c) Sahiwal; Bars represent LSD at 5%. Change in pooled leaf area index with time at different N rates for (a) Faisalabad (b) Sargodha and (c) Sahiwal; Bars represent
54
4.3 55
4.5 rgodha and (c) Sahiwal; Bars represent LSD at
%.
58
4.6 Relationship between pooled final TDM and cumulative leaf area duration at (a) Faisalabad (b) Sargodha (c) Sahiwal (d) pooled for all locations
64
4.7 Relationship between pooled grain yield and cumulative LAD at (a) Faisalabad (b) Sargodha (c) Sahiwal locations (d) pooled for all locations
65
4.8 Relationship between pooled grain yield and number of grains cob-1 at (a) Faisalabad (b) Sargodha (c) Sahiwal locations and (d) Pooled for all locations
76
4.9 Relationship between pooled grain yield and 1000 grain weight at (a) Faisalabad (b) Sargodha (c) Sahiwal (d) pooled for all locations
81
4.10 Relationship between pooled grain yield and total dry matter at (a) Faisalabad (b) Sargodha (c) Sahiwal (d) pooled for all locations.
85
4.11 Change in fraction of intercepted radiation with time at (a) Faisalabad (b) Sargodha and (c) Sahiwal; Bars represent LSD at 5%
97
4.12 Change in pooled fraction of intercepted radiation with time at (a) Faisalabad (b) Sargodha and (c) Sahiwal; Bars represent LSD at 5%
98
4.13 Relationship between pooled final TDM and cumulative intercepted PAR at Faisalabad (b) Sargodha and (c) Sahiwal
106
4.14 Observed and simulated biomass for three hybrids grown at different locations during the year 2005
110
LSD at 5%. Change in pooled TDM of three hybrids with time at (a) Faisalabad (b) Sargodha and (c) Sahiwal; Bars represent LSD at 5%. Change in pooled TDM with time at different N rates for (a)
aisalabad (b) Sa
4.4 57
F5
viii

FIGURES TITLE PAGE Compariso e hybrids
rown at different locations du 005. 111 n of observed and simulated LAI for thre4.15
g ring the 24.16 Re
th lidation. 1
O hybrids grown at di
12
Rfova
3
Peplanting date (days) from the planting date in 2005. The bars remodel yields obtained in 30 ycl
4
Pe in planting date (days) from the planting date in 2005. The bars represent (0th, 25th, median, 75th and 100th) percentile of the model yields obtained in 30 years simulations for changed climate in 2050.
149
lationship between observe ulated grain yield for ree hybrids grown at different locations during the va
d and sim 28
4.17 bserved and simulated biomass for threefferent locations during the year 2004.
9
4.18 elationship between observed and simulated total dry matter r three hybrids grown at different locations during the lidation.
1 2
4.19 rcentile distribution of yield as affected by deviation in 1
present (0th, 25th, median, 75th and 100th) percentile of the ears simulations for changed
imate in 2020. rcentile distribution of yield as affected by deviation
4
4.20
ix

LIST OF APPENDICES APPENDIX TITLE PAGE3.1 Physical and chemical analysis of experimental soil 176 3.2 3.3
Soil characteristics of 177 Soil char 178
Soil char 179 Monthly m(Aug 20
178
Monthly ditions during crop growth season(Aug 2005 – Dec. 2005)
8
Average p growth seasons (2004 & 2005)
179
Comparison of si -1) at varyin ns during year 2004
180
Faisalabad location acteristics of Sargodha location
3.4 4.1
acteristics of Sahiwal location ean weather conditions during crop growth season
04 – Dec. 2004) 4.2 mean weather con 17
4.3 of weather conditions during cro
4.4 mulated and observed final grain yield (kg hag nitrogen levels and locatio
x

LIST OF ABBREVIATIONS AND SYMBOLS
ABBREVIATIONS OR SYMBOLS
UNITS
DESCRIPTION
* Significant at or below 5% (P < 0.05) -
** Significant at or below 1% (P < 1.01) -
CGR Crop growth rate g m-2d-1
ET Evapotranspiration mm
Fi Fraction of radiation intercepted -
K Extinction Coefficient for short wave radiation -
LSD
R2 Percent variance accounted for %
RUE
Least significant difference -
LAI Leaf area index -
NS Non significant -
PAR Photo synthetically active radiation MJ m-2
R Coefficient of correlation -
Radiation utilization efficiency g MJ-1
Sa Absorbed PAR MJ m-2
T Temperature oC
Tb Base temperature oC
TDM Total dry matter g m-2
RMSE Root mean square error -
MPD Mean percentage difference %
GM Gross margin $ ha-1
xi

CHAPTER I
INTRODUCTION
Maize is one of the world’s major food crops, feeding the humanity since ages. The
expand
eet the needs of ever increasing population.
e results were
confirm th
tion from +
ed use of maize in industry gives this crop a prominent place in agricultural
economy. In Pakistan, maize occupies third position after wheat and rice and 98 % of the
crop is grown in Punjab and N.W.F.P. Pakistan grows about 1026 thousand hectares with
annual production of 2968 thousand tones of grain and average yield of 2893 kg ha-1
(GOP, 2007).
The future prosperity and economic stability of Pakistan mainly depends upon the
quantum of material resources and their judicious exploitation and utilization. The
population of Pakistan is increasing at an alarming rate of 2.6 % per annum (GOP, 2007).
Therefore, there is dire need for advanced planning and research to increase food
production and improve quality in order to m
Agriculture is highly dependent on weather, and therefore, changes in global
climate could have major effects on crop yields, and thus food supply. Intergovernmental
panel on climate change (IPCC) reported that average global temperatures have increased
by about 0.6 °C since the industrial revolution. Green house gases (GHGs) increased
concentration in the atmosphere is the major cause of global warming. Thes
ed by a recent study by Brohan et al. (2006) showing that 20 century was the
warmest century, 1990s the warmest decade of the millennium and ten of the warmest
years in the series have now occurred in the past 11 years (1995-2005). Future changes in
global average temperatures are expected to be between 1.4 °C and 5.8 °C over the 21st
century (IPCC, 2001). The study of historical environmental data (1961-1990) of
Pakistan indicated a rise in temperature ranging from 0.1 to 0.2 °C per decade while the
change in precipita 1.0 to +1.5 % per decade was observed for most of the
regions (GOP/ UNEP, 1998).
Interest in the consequences of increasing atmospheric CO2 concentration and its
role in influencing climate change can be traced as far back as 1827, although more
1

commonly attributed to the work of Arrhenius (1896) and Chamberlain (1897), as cited in
Chiotti and Johnston (1995). Temperature exerts a major effect on crop growth rate and
plants development and growth can be retarded when the temperature is either too low or
too high (Ong and Monteith, 1985).
The variability of the climate, under current and future climate scenarios, has been
a topic of recent interest for a number of reasons. The consequences of changes in
variability may be as important as those that arise due to variations in mean climatic
variables (Rind, 1991; Liang et al., 1995; Semenov and Barrow, 1997; Carnell and
Senior, 1998; Hulme et al., 1999). While most studies of climate change impacts on
agricul
in temperature, precipitation, length of growing season, and timing of extreme or
critical thresho
ture have analyzed effects of mean changes of climatic variables on crop
production, impacts of changes in climate variability have been much less studied
(Mearns, 1995; Mearns et al., 1997). Concern over climatic change has reached global
dimensions and concerted international efforts have been initiated in recent years to
address this problem (IPCC, 1990, 1995).
The effect of possible changes in climatic variability remains a significant
uncertainty that deserves additional attention within integrated climate change
assessments (Barrow et al., 1996; Mearns et al., 1996; Semenov et al., 1996). The study
of economic effects of climate change on agriculture is particularly important because
agriculture is among the more climate sensitive sectors (Kane et al., 1992).
Changes in climate will interact with adaptations to increase agricultural
production affecting crop yields and productivity in different ways depending on the
hybrids and cropping systems in a region. Important direct effects will be through
changes
ld events relative to crop development (Saarikko and Carter, 1996). Also,
an increased atmospheric CO2 concentration could have a beneficial effect on the growth
of some species.
Indirect effects will include potentially detrimental changes in diseases, pests,
and weeds, the effects of which have not yet been quantified in most studies. Evidence
continues to support the findings of the IPCC that “global agricultural production could
2

be maintained relative to baseline production” for a growing population under 2 x CO2
equilibrium climate conditions (Rosenzweig and Hillel, 1998, 1993). In middle and high
latitudes, climate change will extend the length of the potential growing season, allowing
earlier planting of crops in the spring, earlier maturation and harvesting, and the
possibility of two or more cropping cycles during the same season. Climate change also
will modify rainfall, evaporation, runoff, and soil moisture storage. Both changes in total
seasonal precipitation or in its pattern of variability are important to agriculture. Moisture
stress and /or extreme heat during flowering, pollination, and grain filling are harmful to
most crops, such as maize, soybeans, and wheat (Rosenzweig and Hillel, 1993, 1998).
Potential effects of climate change are difficult to assess, not only because of the
uncertainty in the magnitude of changes in climate variables, but also because of
uncertainties in crop resp
needed to provide decision-markers with the information they need to develop
approp
that yields n some regions (at low latitudes) primarily
because of the shorter crop growth duration under elevated temperature and increase in
other (at higher latitudes)
crop production in arid e affected more as compared
to in t
because
evapotranspiration by affecting saturation vapour pressure deficit and yields decrease for
irrigate
climate of
project.
agronomic
researchers
variability. Various research groups have used these models for decision making in
agriculture system. Decision Support System for Agro technology Transfer (DSSAT v
4.0) is one of the most comprehensive decision support systems (Tsuji et al., 1994;
Hoogenboom et al., 2004) that include different cropping system models and analytical
onses to weather, soil and management factors. Assessments are
riate plans to reduce the exposed climate changes or adapt them. Results suggest
of many crops would decrease i
under the climate changes scenarios (Monteith, 1981). Thus
and semiarid tropical areas would b
emperate regions. Water stress will become more severe under climate change
higher temperature coupled with higher radiation receipts increase
d crops less as compared to for dry land crops. The implications of changes in the
our country or region on the growth and yield of maize form the basis of this
Crop simulation models have been emerged as an artistic tool for
management strategy evaluation (Sinclair and Seligman, 1996) and helped
in ascertainment of relationships among environment, management and yield
3

tools. CSM-CERES-Maize (Ritchie et al., 1998b; Jones et al., 2003) model of DSSAT
mily simulates daily crop growth from sowing to maturity by using soil, weather and
crop management pa decision making in
crop production under variety of e odel for
evaluation of planting date and yield forecasting in subtropical environment other
iss, 1990; Keating et al., 1991),
io analysis (Dejonge et al., 2007), nitrogen leaching and
manage
fa
rameters. Scientists had been used this model for
nvironment. Soler et al. (2007) used this m
scientists used for Plant population (Piper and We
irrigat n and economic
ment studies (Pang et al., 1997; Paz et al., 1999; Asadi and Clement, 2003;
Johanna et al., 2006; Thorp et al., 2006). Zalud and Dubrovsky, (2002) and Cedron et al.
(2005) used this model for climate change risk management studies. DSSAT model
facilitates researchers in decision making through seasonal, spatial and rotational analysis
drivers to improve the efficiency and profitability of cropping systems.
The present study was, therefore, conducted with the following objectives:
1. To determine the effect of cultivars and nitrogen rates on growth,
development and yield of maize.
2. To analyze the effect of cultivars and nitrogen rates on growth, intercepted
radiation and radiation use efficiency of maize.
3. To evaluate the capability of CSM-CERES-Maize model for simulation of
growth, development and yield of maize hybrids planted at different locations.
4. To evaluate the application of CSM-CERES-Maize model for assessing the
impact of climate change on maize productivity under the growing conditions
of Punjab (Pakistan).
5. To determine ecologically and economically optimum management strategy
by using seasonal analysis tool of model, to mitigate the impact of climate
change on maize productivity, for irrigated maize under semiarid conditions
of Pakistan.
4

CHAP
2.1.
s per plant (0.945) and number of grains per cob (518.1) were maximum in C-7878.
The co
ture (LNS), non-leafy reduced stature (NLRS), and conventional hybrid checks
of early
at the
other.
for 50 % silking (63) was recorded in hybrids 3043 .
TER-2
REVIEW OF LITERATURE
YIELD AND YIELD COMPONENT 2.1.1 Effect of cultivar
Khan et al. (1999) worked on the performance of six maize hybrids i.e. C-922, C-
7878, C-7777, P-3163 and R-4208 for grain yield. They indicated that hybrid P-3163
produced maximum plant height (229 cm), cob length (16.05 cm) and 1000-grain weight
(249.3 g). The hybrid C-7777 produced highest grain yield (7.25 t ha-1) while number of
cob
rn hybrid R-4208 proved to be inferior variety regarding yield and yield
components.
Costa et al. (2002) evaluated effect of nitrogen rates on maize genotypes. The
genotypes were leafy reduced stature (LRS), non-leafy normal stature (NLNS), leafy
normal sta
(P3979) and late maturity (P3905). The genotype 3905 consistently yielded best
12.39 and 10.29 t ha-1 in 1997 and 1998, respectively, while the NLRS hybrid performed
worst; however, the genotypic grain yield ranking varied between sites. Overall, the LRS
outyielded its conventional counterpart (P3979) by 12 % at one site and by 26 %
Younas et al. (2002) conducted an experiment on twelve hybrids to evaluate the
maize hybrids for yield and yield associated traits. Results indicated that hybrids were
significantly different from one an others for all the characters such as the highest value
of ear length 20.46 cm was observed in hybrid 3130, while minimum ear length of 16.75
cm was recorded for hybrid Super early, maximum kernel rows per ear i.e. 15 rows was
obtained for Pop-9815, maximum 1000-kernel weight of 395.16 g was observed in
hybrids Ghauri, maximum grain yield (9916 kg ha-1) was obtained from hybrid C-919,
minimum grain yield (6846 kg ha-1) was recorded for the hybrid 3043 and maximum days
5

Banerjee et al. (2003) observed the effect of nitrogen rates (50, 100 and 150 kg N
ha-1) on the growth and light interception of pop corn cultivars V. L. Amber and Amber.
V. L. A
to tasseling (82.96), thousand grain
weight
Hybrid 8522-2 and 8644-3) and
TZPB-
ty during the grain filling period when maximum leaching
mber was superior from Amber in terms of leaf area, dry matter, plant height,
crop yield and light interception at all growth stages. According to his finding leaf area,
dry matter, light interception and grain yield increased with increasing nitrogen rates.
Kogbe and Adediran (2003) conducted field trials testing the effect of five N rates
(0, 50, 100, 150 and 200 kg N ha-1) on three hybrids (8516-12, 8321-18 and 8329-15) and
two open pollinated maize varieties (TZSR-Y and TZSR-W) in Nigeria. They reported
that hybrid maize gave higher yields and used N more efficiently as compared to the open
pollinated varieties. They further concluded that hybrid 8516-12 showed higher N use
efficiency as compared to other varieties and all hybrids responded up to 150 and 200 kg
N.
Masood et al. (2003) conducted a trial to study the performance of various maize
varieties at different NP levels and reported that days
(268 g) , biological yield (20293 kg ha-1) and grain yield (3193 kg ha-1) was
significantly affected by varieties. Hybrid No.922 out yielded as compared to other
varieties.
Okeleye and Oyekanmi (2003) studied 3 N fertilizer levels (0, 50 and 100 Kg N
ha-1) on the growth and grain yield of 2 maize hybrids (
SR as control. They observed the increase in growth rate at 50 and 100 Kg N ha-1.
Significant interaction was recorded between hybrids and N rates for grain yield.
Oikeh et al. (2003) studied differential N uptake by maize cultivars under N
fertilization in West Africa and reported that cultivar TZB-SR accumulated more N in the
aboveground plant parts in both years as compared to the other cultivars. All, except the
semi-prolific late (SPL) variety, met about 50–60% of their N demand by the time of
silking (64–69 DAP). In both years, SPL had the greatest capacity to take up N during the
grain filling period, and it had the highest grain-N concentration and the least apparent N
loss through leaching in the second year. There were no significant differences in soil N
dynamics among cultivars in both years. They concluded that the use of maize cultivars
with high N uptake capaci
6

losses o
ein contents, after anthesis more for the earlier
release
ccur could enhance N recovery and may be effective in reducing leaching losses
of mineral N.
O’Neill et al. (2004) conducted an experiment to identify appropriate mechanisms
by characterizing agronomic responses of 12 hybrids from three different eras (‘B73 x
Mo17’ from 1970s and three early 1990s and eight late 1990s Pioneer brand hybrids) to
varying water and N supply. This was done by growing the hybrids under varying N (0
and 200 kg ha-1) for field study and measuring yield and other agronomic variables.
Individual hybrids varied in ability to maintain yield under N stress. For example, under
deficit N, ‘34R07’ produced 42 % more grain yield as compared to ’33G27’ while they
yielded similarly under adequate N. Agronomic variables such as kernel number per unit
area were highly correlated with grain yield (r2 = 0.98), indicating hybrid ability to
maximize kernel number under varying N supply was critical to maximizing yield.
Determining physiological mechanisms associated with maintaining kernel number under
stress should be a high priority of breeding programs.
Rasheed et al. (2004) studied the effect of four NP rates (0-0, 110-85, 160-135
and 210-185 Kg ha-1) on grain yield of two maize hybrids. All the fertilizer rates
significantly increased grain yield, 100-grain weight, and grain number per ear of both
the hybrids over control. Hybrids C-707 produced significantly the highest grain yield
5720 Kg ha-1 when fertilized with 210- 185 Kg NP ha-1.
Ding et al. (2005) compared six hybrids to check their response under N
deficiency for grain weight, plant weight, harvest index, leaf area and photosynthetic
traits. They reported that dry matter production after flowering of the N-deficient plants
was significantly lower as compared to that of the control plants in all hybrids, especially
in the older hybrids, and was mostly due to differences in the rate of decrease in
photosynthetic capacity during this stage. N deficiency accelerated senescence, i.e.
decreased chlorophyll and soluble prot
d hybrids as compared to for the later ones. They concluded that compared with
older (earlier released) hybrids, newer (later released) hybrids maintained greater plant
and grain weight under N deficiency because their photosynthetic capacity decreased
more slowly after anthesis.
7

D’Andrea et al. (2006) conducted a study in Argentina to analyze the response to
contrasting N availability of morphophysiological traits in a set of 12 maize inbred lines,
from different origins (USA and Argentina) and breeding eras (from 1952 onward).
Traits included in the analysis were related to canopy structure, light interception, shoot
biomass production, yield components and grain yield. They concluded that differences
recorded for these parameters were significant among genotypes. They recorded that days
to anth
y
aspects for the understanding of genotypic differences in biomass partitioning around
maize.
yield across years as Hai He > LD10 > YR1 > Tun004 and for stability of performance as
esis ranged from 66.8 (LP662) to 73.5 (B101) among different hybrids during year
2000-2001 while equivalent values for days to anthesis in 2001-2002 ranged from 67.9
(LP662) to 78.0 (LP611). Hybrid LP611 also showed good results by producing 3.8, 4.3
LAI, 0.70 and 0.84 fraction of intercepted PAR (Fi), during year 2000-01 and 2001-02
respectively. Maximum kernel number per plant (KNP) (264), Plant grain yield (PGY)
(53.5 g plant-1) and HI (0.32) were recorded from LP561, LP662 and LP561 respectively
in 2000-01, while these parameters observed best in LP662 (434 KNP and PGY103.2 g
plant-1) and HI (0.41) in B100 during year 2001-02. Biomass production was also
significantly affected by hybrids; hybrid LP611 gave maximum shoot biomass 1222 g m-2
in 2000-01 while maximum biomass (2219 g m-2) at maturity was recorded in hybrid
LP2541 in 2001-02. They also reported significant differences in plant growth rate (PGR)
that was ranged from 0.99 to 6.12 g plant-1d-1 among different hybrids. They further
narrated that grain yield responded significantly (P< 0.01) to the variation in kernel
number (r2 = 0.79 and r2 = 0.75) and this variation was promoted by differences among
genotypes. An important finding of their work was the detection in some inbreds of a
reduced efficiency for converting biomass produced around silking to reproductive sinks
under N deficient conditions. This feature, together with the early arrest of ear
development, are key aspects for inbred LP2541 in the N stress environment, were ke
silking and tolerance to stress in
Fan et al. (2007) evaluated grain yield stability of 13 Chinese hybrids tested
across 10 locations in 2002 and 2003 via GGE biplot analysis and Kang’s yield-stability
statistic (YSi). The YSi identified, among the top five hybrids, LD10, Hai He, and YR1
was common between years. The GGE biplot analysis ranked hybrids with above-average
8

LD10, Hai He, Tun004, and YR1. The GGE biplots revealed that Hai He had the highest
yield in seven and LD10 in 10 environments. GGE biplot and YSi identified QC3,
XHD89
d by 47 – 70 % in 2004 as compared with medium-N and high-N treatments,
respect
e. Grain yield of hybrids ranged from 1.5 to 4.3,
6.1 to 9
,
medium
f N application
onstituent of cell components.
2ck, and R313 as the least desirable hybrids. The YSi indicated ZZY6 and SB21-
3 to be the most unstable hybrids between years. The only hybrid showing stable
performance across locations was Tun004 in 2002. Overall, YSi versus GGE distance
correlation (r) = -0.92**.
Worku et al. (2007) evaluated 16 maize hybrids under 9 different environments i.
e. Harare 2003 low-N (Z03N1), Harare 2003 medium-N (Z03N2), Harare 2003 high-N
(Z03N3), Kiboko low-N (K03N1), Kiboko medium-N (K03N2), Kiboko high-N
(K03N3), Harare 2004 low-N (Z04N1), Harare 2004 medium- N (Z04N2), and Harare
2004 high-N (Z04N3). They reported that the nine environments significantly (P < 0.01)
varied in grain yield, N uptake, N utilization and N harvest index. Z03N1 was the lowest
yielding (2.90 t ha-1) environment, while Z03N3 was the highest yielding (12.71 t ha-1)
environment. Severe stress under low-N at Harare reduced grain yield by 65 – 77 % in
2003 an
ively. At Kiboko, low-N stress in K03N1 reduced grain yield by 25 and 40 % as
compared with K03N2 and K03N3, respectively, indicating that the severity of low-N
stress was less as compared to at Harar
.8, and 10.6 to 14.9 t ha-1 in 2003 and 2.2 to 4.4, 4.6 to 9.4, and 8.7 to 13.5 t ha-1
in 2004 for Harare low-N, medium-N, and high-N experiments, respectively, while grain
yield ranged from 3.7 to 7.3, 5.8 to 10.9, and 5.5 to 13.2 t ha-1 for Kiboko low-N
-N, and high-N experiments, respectively. Differences between the hybrids and
hybrid × environment interactions were significant (P < 0.01) which became more
pronounced as the difference in N stress intensity between two environments increased.
2.1.2 Effect o
The growth and yield of a crop can be adversely affected by deficient or
excessive supply of any one of essential nutrients. However, in intensive
agriculture nitrogen is the major nutrient determining crop yield. Nitrogen plays
a central role in plant growth as an essential c
9

Conseq
f dry matter production.
Second
f heavily fertilized crop are mechanically much weaker,
leadin
ht, grain yield, biological yield
and pla
uently a deficiency in the supply of nitrogen has a profound influence on
grain yield.
Nitrogen fertilizer influences cereal crop in a number of ways. First,
increased nitrogen supply, through its effects on leaf size and longevity, results
in increased size and duration of the crop canopy (leaf area index and leaf area
duration). In turn, these increases result in higher rates o
ly, the amount and timing of nitrogen fertilizer treatments can also
influence the development of the individual plants of the stand, with important
implications for the components of grain yield. Thirdly, the quality as well as
quantity of harvested grain is determined by fertilizer practice. For example, late
and/or heavy nitrogen application can result in grains un-accepTable to industry
because of their high nitrogen/protein contents. Finally, the larger leaves and
taller stalks (stems) o
g to potential yield losses by lodging and various types of pathogenic
attack.
Mahmood (1997) applied N with 0, 100, 200 and 300 kg ha-1 to maize cv.
Golden and obtained maximum grain yield of 6.69 t ha-1 and protein content of 10.38%
with application of N with 300 kg ha-1.
Haque and Hamid (1998) conducted a field experiment in 1993/94 in Bangladesh
on maize cv. Barnali. Crop received 0-150 Kg N ha-1, increased canopy development,
plant height, dry matter yield and crop growth rate (CGR) with increase in nitrogen rate.
Ogunlela et al. (1998) conducted an experiment on growth and yield component
of field grown maize by using nitrogen fertilization ranging 50 to 200 kg N ha-1. They
estimated that ear diameter, kernel depth, grain and number of ear per plant, plant height
and dry matter production increased with nitrogen fertilization while tasseling in maize
was hastened.
Ali et al. (1999) observed the effect of various doses of nitrogen at the rate of 130,
180 and 230 kg N ha-1. They reported that 1000-grain weig
nt height was increased with increased nitrogen and further reported that increased
nitrogen rates delayed silking, tasseling and maturity.
10

Sangoi et al. (2001) evaluated the effect of N rates on grain yield and N use
efficiency of hybrids and reported that new hybrids Ag 9012 had higher grain yield as
compared to older hybrids regardless of N rates. Under higher doses of N, the old hybrids
Ag 12 and Ag 28 took up more N and presented higher values of shoot dry matter at
maturity as compared to Ag 9012. Nonetheless, they set less grain per ear which
contributed to decrease their grain yield and N use efficiency.
Akbar et al. (2002) worked on sweet corn by using nitrogen levels (0, 100, 150
and 200 kg N ha-1). They reported that maximum, days to tasseling (57.35 DAS), days to
silking (69.50 DAS), days to maturity (102.7 DAS), plant height (140.23 cm), and
biological yield (12291.1 kg ha-1) were recorded for (200 kg N ha-1). Nitrogen level (150
kg N ha-1) resulted in greater grain yield (2006 kg ha-1), 1000-grain weight (132.7 g) and
number
oductivity in both years
over co
er
nitroge
lication also increased CGR over control or lower rate of nitrogen
applica
of ear per plant (1.45). It showed that increasing nitrogen levels have significant
effect on all parameters.
Abbas (2005) conducted a field study during 1997 and 1998 to find out the effect
of 4 rates of nitrogen (0, 100, 200 and 300 kg N ha-1) on maize under varying levels of
irrigation. He observed an increase in N rates enhanced crop pr
ntrol and lesser rate of nitrogen. Averaged over the two years maximum number
of cobs m-2 (8.17), number of grains m-2 (3452), 1000- grain weight (228 g), total dry
matter (15.4 t ha-1) and grain yield (6.29 tha-1) were recorded from plots fertilized with
300 kg N ha-1. These measurements were significantly higher as compared to low
n rates. They further concluded that increasing rate of nitrogen application
increased LAI over nil or lower rate of nitrogen application and the response was
cubic in 1997 and quadratic in 1998. Maximum LAI (4.43) in 1997 was recorded
in treatment 300 kg ha-1, and equivalent value in 1998 was 4.24. Increasing rate
of nitrogen app
tion in both the seasons, and this response was cubic in nature. Averaged
over two years, maximum mean CGR was recorded 19.21 g m-2 d-1 in treatment
(300 kg N ha-1).
Ding et al. (2005) compared six hybrids to study N deficiency effects on grain
weight, plant weight, harvest index, leaf area and photosynthetic traits. N deficiency
decreased grain yield and plant weight in all hybrids, especially in the older hybrids.
11

However, there was no significant difference in harvest index, rate of light-saturated
photosynthesis (Psat) 20d before flowering, leaf area or plant weight at flowering
between the N-deficient and control plants of all hybrids. Dry matter production after
flowering of the N-deficient plants was significantly lower as compared to that of the
control plants in all hybrids, especially in the older hybrids, and was mostly due to
differences in the rate of decrease in photosynthetic capacity during this stage. N
deficiency accelerated senescence, i.e. decreased chlorophyll and soluble protein
conten
nd 250-150-100 kg NPK ha-1 and observed that increased rate of NPK delayed
tasseling, silking and maturity and increased the number of cobs per plant, number of
in weight, biological yield and
grain yield ha-1
cal traits of maize inbred lines. Traits
included in the analysis were related to canopy structure, light interception, shoot
biomas
a given leaf stage (i.e. Vn), (ii) the light attenuation coefficient value was not affected by
ts, after anthesis more for the earlier released hybrids as compared to for the later
ones. They concluded that compared with older (earlier released) hybrids, newer (later
released) hybrids maintained greater plant and grain weight under N deficiency because
their photosynthetic capacity decreased more slowly after anthesis.
Hassan (2005) studied the effect of NPK at the rate of 0-0-0, 150-100-50, 200-
125-75, a
grain rows per cob, number of grains per cob, 1000-gra
while plant height showed non significant effect.
Inman et al. (2005) worked on nitrogen uptake at levels ranging from 56 to 268
kg N ha-1 in maize and reported that nitrogen uptake and grain yield response to applied
nitrogen were found to be statistically significant. Maximum grain yield (11.6 t ha-1) was
obtained from the plot fertilized with 268 kg N ha-1 in site-specific management zone.
Oktem and Oktem (2005) conducted an experiment on sweet corn as second crop
to investigate effect of different nitrogen application rates (150, 200, 250, 300 and 350 kg
N ha-1) on some ear characteristics. They observed that increasing nitrogen application up
to 350 kg N ha-1 increased cob length (20.88 cm), ear diameter (4.44 cm), kernel number
per cob (545.4).
D’Andrea et al. (2006) conducted a study in Argentina to analyze the response to
contrasting N availability of morphophysiologi
s production and grain yield. Results indicated that (i) the start of N effects on
canopy size was more related to a threshold crop leaf area index (about 2) as compared to
12

N availability, (iii) variations in kernel number per plant were explained by prolificacy (r2
= 0.59), and (iv) differences in harvest index were related to kernel number per plant (r2 =
0.77). T
Shapiro and Wortmann (2006) conducted field experiments for 3 years to study
the effects of four N rates on m
r unit area. The principal means for enhancing TDM include
a) opt
he most important finding of their research was the detection in some inbreds of a
particular response of kernel number to plant growth rate around silking, different from
the general model established for hybrids. In these inbreds an additional effect of N
availability was detected as reduced kernel set at a given plant growth rate under N
deficient conditions (i.e. reduced reproductive efficiency).
aize crop performance. Nitrogen rates ranged from 0 to
252 kg N ha-1. Nitrogen application resulted in mean increases of 22% more biomass
production and 24% more grain yield. The N response function was linear in 1996,
quadratic in 1997, and quadratic with decreased yields at the high N rate (252 kg N ha-1)
in 1998.
2.2. GROWTH AND INTERCEPTED PAR
The first prerequisite for high yields is a high production of total dry
matter (TDM) pe
imizing the assimilate area LAI (leaf area index) and LAD (Leaf area
duration) to enhance the interception of photosynthetically active radiation
(PAR), b) improving the radiation use efficiency, c) redistribution of
photosynthates in order to maximize economic yield. TDM of a crop is
proportional to the total amount of intercepted radiation, which is itself largely
determined by the size of leaf area and its distribution with time (Biscoe and
Gallagher, 1978). Andrade et al. (1993) reported a linear relationship between
growth and intercepted PAR in maize. Nitrogen application increases DM
production and restrictions of growth attributable to minerals are usually matters
of supply and size of absorbing regions.
The importance of leaf area as a determinant of radiation interception has been
long appreciated and well recognized. Watson (1952) attributed productivity differences
13

in field crops to variation in LAI and identified early canopy closure as a crucial
determinant of initial crop growth rate in well husbanded crops.
The LAI is the product of plant population and leaf area per plant; the
latter is the product of leaf number and size. Apart from sowing the crop earlier,
the ma
hich highest
saturati
produced on the main stem of
maize
se there is no tillering in
moder
s with
plantin
, ensuring ventilation within the canopy and a minimum of close
overlapping. Leaves are attached to the stalk at angles that give generally
in inputs that affect leaf area per plant and which the grower can control
are nitrogen and water. These affect the sizes of individual leaves rather as
compared to the rate of production (Nunez and Kamprath, 1969).
Early studies of crop growth analysis assumed that at a given efficiency of
utilization of intercepted PAR, crop growth rate (CGR) was proportional to the fraction
of PAR intercepted, and reached a ceiling when interception was complete. It has been
reported that LAI of 3 is generally required for the interception of 90-95% of incoming
radiation (Hipps et al., 1983). In maize the value of intercepted PAR at w
on occurred increased with LAI 5.0 (Tetio-Kagho and Gardener, 1988). For most
crops and irrespective of climate, an LAI of 4-6 is sufficient to intercept more as
compared to 90 % incident radiation to ensure that a maximum growth rate is achieved
(Monteith and Elston, 1983). How soon it is achieved depends on the rate at which LAI
initially increases.
Plant canopies intercept radiation with varying degrees of efficiency
associated chiefly with their LAI. Several characteristics of maize contribute to
highly efficient foliage canopies. The leaf area
plants does not decrease in inverse proportion to an increase in plant
density (Duncan, 1975). Therefore, the LAI of a maize canopy can be controlled
within wide limits by the density of planting becau
n varieties. In this way maize differs from many other crops. Loomis et al.
(1968) reported LAI varying from 3.5 to 8.5 in mature maize canopie
g densities from 75000 to 125000 plants ha-1. Maize leaves have the
highly efficient C4 pathway of photosynthesis and thus utilize intercepted
radiation with high efficiency even under intense light. Leaves are well separated
on the stalk
14

favora
AI of maize have been reported as great
as 4.7 t
ces in yield are
therefo
ion and growth of maize in
Australia and found a RUE of 1.5-1.7 g MJ-1 with the application of 80 kg N ha-1.
een intercepted radiation and
in maize and found a significant positive
associa
ble light exposure. However, the most serious is the growth habit of leaves
being attached to a single stalk and the maximum light efficiency requires
vertical leaves (Duncan, 1971). Values for L
o 7.8 (Lindquist et al., 2005).
Factors which determine the development and senescence of leaves are much
more significant discriminates of yield as compared to the photosynthetic capacity of
leaves as suggested by Monteith and Elston (1983). Thus, differen
re a result of differences in the duration of canopies rather as compared to the rate
at which they produce DM. This inference that CGR is much more conservative as
compared to growth duration emerged long ago. Watson (1952) concluded that leaf area
duration (LAD-integral of LAI) rather as compared to NAR is the major factor
determining differences in yield among crop species or agronomic practices.
Muchow (1988) observed a significant increase in leaf area development and leaf
area expansion with increase in N rates and the efficiency with which intercepted
radiation is used to produce biomass is dependant on leaf N. Photosynthetic rate increases
almost linearly with specific leaf nitrogen (SLN) over the range of 0.5-1.6 g m-2 such that
leaf N explained the increased RUE with higher rates of N applied.
Kiniry et al. (1989) reported that the amount of dry matter produced by maize was
proportional to the intercepted PAR, and noted that 3.5 g of above ground dry matter was
produced in maize by the utilization of 1 MJ of PAR.
Muchow (1989) reported that high biomass accumulation in maize was associated
with long growth duration especially the duration of grain filling and thus high
accumulated intercepted PAR and radiation use efficiency.
Watiki et al. (1993) studied radiation intercept
Andrade et al. (1993) studied relationship betw
flowering and kernel number per unit area
tion and 5.9 kernels MJ-1 radiation utilization were obtained under shading
experiments.
15

Kiniry and Knievel (1995) studied maize seed number to solar radiation
intercepted soon after anthesis. They observed that there was a linear response of seed
number per plant to intercepted PAR per plant.
Flanet et al. (1996) reported light extinction coefficient (k) of corn and other
crops at temple, Tx. that was 0.473, 0.398 and 0.336 at row spacing of 0.35 m, 0.66 m
and 1.00 m respectively with the use of 110 kg N ha-1. Data indicated that k was not
affected by stage of development however time of day did not affect k.
Edwards et al. (2005) studied the light Interception and yield potential of short-
season maize hybrids in the mid southern USA and reported that maize biomass at
maturity had a linear relationship with cumulative intercepted photosynthetically active
radiation (CIPAR) from emergence to maturity. According to the predicted line,
aboveground biomass at harvest increased 3.3 g MJ-1 of CIPAR intercepted.
Lindquist et al. (2005) conducted research to quantify the biomass and leaf area
index (LAI) accumulation, extinction coefficient and RUE in maize under conditions of
optimal growth and reported that total above ground biomass at maturity ranged from
2257 g m-2 in 1998 to 2916 g m-2 in 2001 that is greater as compared to the biomass
achieved in most previous studies on RUE in maize, peak LAI ranged from 4.8 to 7.8.
Maize extinction coefficient (k) during vegetative growth was within the range of
recently published values (0.49 + 0.03) with no clear pattern of differences in k among
years. Seasonal changes in interception of PAR were similar across all but one year. They
further estimated RUE by two methods i.e. 3.74 (+ 0.20) g MJ-1and 3.84 (+0.08) g MJ-1
and reported that RUE did not decline during grain filling. They further concluded
models that rely on RUE for biomass accumulation should use RUE of 3.8 g MJ-1 PAR
for pre
ng the stage of crop development, the growth rate and the partitioning of biomass
into growing organs. All of these processes are dynamic and are affected by
dicting optimum yields without growth limitations.
2.3 CROP GROWTH MODELING The simulation of crop development, growth and yield is accomplished through
evaluati
16

environ
segments to
provide a simulation of all or part of a complex system (Reckman et al., 1996). Within
the context of
ably quantified, the yield results are usually within accepTable
limits.
mental and cultivar specific factors. The description of key processes in crops
provides a means of quantifying how cultivars differ and helps provide a system of
simulating grain yield production using crop models (Kiniry et al., 2001). Amthor and
Loomis (1996) discussed mechanistic models simulating cropping systems at one level
are best described by processes at a lower level. Likewise, Sinclair and Seligman (1996)
discussed how crop-level simulation models should simulate processes at the whole plant
level and whole plant simulation should be simulated at the organ level.
Agronomic research has focused on formalizing and summarizing knowledge of
growth and yield of field crops including maize. When mathematical principles are
combined to be presented as a cause-effect process, the relationship can be referred as a
mechanistic model. Mechanistic representations may be combined in logical
this review, a crop model can be defined as a quantitative scheme for
predicting the growth, development and yield of a crop, given a set of variables
(Monteith, 1996). Crop simulations are now being used in agronomy for research,
education, extension and crop management (Van Evert and Campbell, 1994). A thorough
review on potential uses and limitations of crop models was published in Agronomy
Journal (1996) by the ASA. Whistler et al. (1986) and Hoogenboom (2000) described a
wide range of major areas in which the application of models is well established. Several
maize models such as Hybrid maize, Root Zone Water Quality Model (RZWQM),
Agricultural Production Systems Simulator (APSIM), Model for World Food Studies i.e.
WOFOST and Agricultural Land Management Alternatives with Numerical Assessment
Criteria (ALMANAC) had been used for simulation of crop growth, yield and evaluation
management strategies.
Ritchie et al. (1998) studied growth, development and yield of cereal crops
included Decision Support System for Agro-technology Transfer (DSSAT) using CERES
Crop simulation model. The CERES model has been tested over a wide range of
environments. Results obtained showed that when the weather, cultivar and management
information are reason
17

Sinclair and Muchow (1995) developed a relatively simple, mechanistic model of
maize growth and development to account for the influence of soil and crop nitrogen
budgets. The soil nitrogen budget was simulated by a supply function that depends on
cumulative and daily thermal units, soil water content and soil N availability. The
comparison of simulated and experimental crop N uptake through the season showed
especially good agreement for 0 to 12 g N m-2 fertilizer treatments, at 24 and 42 g N m-2,
the simulated crop N uptake was greater as compared to observed. Nevertheless,
comparable seasonal patterns between simulations and observations at all fertility levels
were obtained for accumulated total biomass and grain. Final grain yields for all fertility
treatments were simulated to be within 8 % of the observed. Yield estimated under low
soil N levels tended to be more sensitive to minimum grain N concentration.
Jagtap et al. (1999) tested CERES-Maize model (DSSAT V.2.1) for Long-term
assessm
would yield better as compared to 120-150 day varieties (LDV) at
Mokwa and Ibadan, with superior NUE. The risk of crop failure with no N input was,
however, substantial. Although response to N vari
ent of nitrogen and variety technologies on attainable maize yields in Nigeria
during 1992-95. Historical weather data spanning 20 years were used at the target
production environments to generate probabilistic estimates of maize yields; nitrogen use
efficiency (NUE) associated with fertilizer and variety technologies. Analysis showed
with high probability that, under rainfed conditions and N fertilizer input, the 90-110 day
varieties (MDV)
ed dramatically from year to year in
association with the rainfall, there appears to be no advantage in adjusting N-input
strategy for a variety. NUE was predicted to be best at the 60 kg N ha-1 input strategy,
indicating potentials of further yield increase if methods of enhancing NUE at the higher
N input levels could be further investigated. The NUE was found to be always lowest at
Ibadan, in the derived savanna transition zone where rainfall and cloud cover were
higher. Finally they concluded that DSSAT simulation allowed rapid assessment of the
suitability of competing technologies for decision support in production systems that
involve risk.
Ben Nouna et al. (2000) tested CERES-Maize model in a semi-arid
Mediterranean environment during a period of 2 years under three different soil moisture
18

conditions (well-watered and two limited irrigation regimes). In well-watered plots,
growth and yield were adequately simulated by the model (differences between simulated
values and observations were less as compared to 10 %). Results suggested that the
absence of air humidity among the model inputs did not limit the CERES-Maize
performance, even under dry-air conditions. On the contrary, under mild soil water
shortage, C
Probert et al. (2001) collected climate data of seven sites and used as input for the
maize
ly over predicted total N
uptake and under predicted total N leached and soil moisture content. The relation
between results obtained from experiment (Yo) and simulation (Ys) was expressed by the
equation Ys= 1.058Yo with R2=0.97 for grain yield, Ys=0.7396Yo with R2=0.86 for
ERES-Maize underestimated the leaf area index (LAI) (up to 26 % for
maximum LAI), above-ground biomass (up to 23 %) and grain yield (up to 15 %).
Mismatches between observations and predictions increased with water stress level (by
up to 46, 29 and 23 % for maximum LAI, biomass and grain yield, respectively). It was
suggested that the functions describing leaf growth and senescence and those calculating
the soil water deficit functions should be modified to adapt CERES-Maize to
Mediterranean environments.
model CMKEN to explore a number of management options that impinge on
maize yields and reported that the cultivar Katumni composite B is well adapted for
whole region as compared to other cultivars. They further concluded that yield potential
is strongly dependent on rainfall regime and soil type, nitrogen rates also vary with
rainfall regime.
Asadi et al. (2003) used CERES-Maize of DSSAT v3.5 model to simulate nitrate
leaching, nitrogen uptake, grain yield and soil moisture content in the central region of
Thailand. The validation data was obtained from a two-year study with conventional
tilled corn (Zea mays L.) during 1999 and 2000. Nitrogen source was urea and there were
four N treatments which include 0, 100, 150, and 200 kg N ha-1. The soil was irrigated
and fertigated with sprinkler irrigation system throughout the season. Inputs to the model
included site information, daily weather data, soil properties, soil initial conditions,
irrigation and fertilizer management and crop performance data. The model over
predicted corn grain yield slightly for some treatments, general
19

nitrate
leaching and N uptake under
irrigated tropical conditions.
s a linear relationship between N rates and days to silking
and maturity with R values of 0.70 for most of the cultivars, indicating that N strongly
influen
model
for more accurate phenology prediction in low-N tropical soils.
leaching, and Ys=1.1103Yo with R2=0.99 for total N uptake. The study showed
that the CERES-Maize of DSSAT model may be applied with confidence to study effects
of N and irrigation management on maize yield, nitrate
Ritchie and Alagarswamy (2003) revised CERES- maize model. Thermal duration
of a critical window for kernel number plant-1 (KNP) simulation was 327 °C days. The
KNP was curvilinear related to cumulative intercepted photosynthatically active radiation
plant-1 (CIPAR) during the critical window. Apical ears produced maximum KNP at a
plateau CIPAR of 64 MJ, and prolific hybrids produced secondary ears when CIPAR
exceeded 64 MJ. Below a threshold CIPAR of 11 MJ, all plants were barren, and a
barrenness coefficient expressed genetic differences among old and modern hybrids to
produce KNP in high plant density.
Gungula et al. (2003) tested the phenology module of CERES-Maize model
version 3.5 under varying N rates as a step toward adapting the model in the Southern
Guinea Savanna of Nigeria. Data on seven late-maturing cultivars of maize (Zea mays L.)
grown under 0, 30, 60, 90, and 120 kg N ha-1 in the field for two seasons were used for
running the model. There wa2
ced phenology. Predictions of days to silking at high nitrogem rates (90 and 120
kg N ha-1) were close, with most prediction errors of <2 d. The highest deviations in the
calibration results were 4 and 2 d for 90 and 120 kg N ha-1, respectively, while in the
validation results, they were 1 and 2 d. Similarly, days to maturity were closely predicted
by the model at high N rates with <2-d deviations for most predictions. At low N rates,
however, there were greater deviations in model predictions. They recommended that the
CERES-Maize model can be reliably used for predicting maize phenology only under
non limiting N conditions. Thus, a N stress factor needs to be incorporated into the
20

Yang et al. (2004) evaluated CERES-maize model for its ability to simulate maize
dry matter accumulation under optimal growth conditions and confirmed that this model
consistently under predicted biomass yield by 10 to 20 %.
Cedron et al. (2005) evaluated the performance of three different recent versions
of CERES-Maize ((i) CERES-Maize-2003 (called thereafter CERES-2003), the most
recent version proposed by Kiniry; (ii) that included in DSSAT V3.5 official release or
CERES-3.5 and (iii) the recently released version with DSSAT V4.0 or CERES-4.0) in a
cool environment, where water and nutrients are fully available, and to document and
discuss the equations causing differences in model predictions among versions. These
versions were tested against field data sets, obtained in northwest Spain between 1998
and 2002. CERES-4.0 simulated more closely the biomass and grain yield under this
relatively cool environment. CERES-2003 showed the poorest performance, mainly due
to 64 % dry weight loss programmed to occur with dry matter translocation from stem to
grain. Reasons for CERES-4.0 advantage are related to the new look-up temperature
functio
t management zones (MZs) and
estimate optimal N rates based on long-term weather conditions. Three years of corn
ns affecting radiation use efficiency (PRFT) and grain filling rate (RGFILL) that
in V 4.0, create less sensitivity to temperature. Nevertheless, under these growing
conditions CERES-4.0 predictions may benefit from slightly more temperature sensitive
PRFT or RGFILL functions.
Yang and Alley (2005) developed a mechanistic model for describing corn plant
leaf area distribution and was evaluated with 77 independent data sets from 64 genotypes
–by-environment combinations during 1989 to 2001. They concluded that the model was
applicable to widely different combinations of genotypes and environments and the
model was suitable for all leaves. Validation of the model for predicting leaf area was
conducted and further reported that predicted leaf area was within 10 % of the measured
leaf area for 27 of the 30 cultivars with maximum deviation of being 14 %. The
correlation of predicted leaf area with measured leaf area equaled 0.94 for all data.
Miao et al. (2006) evaluated the potential of applying a crop growth model to
simulate corn yield at various N levels in differen
21

yield d
to 250 kg ha-1. Economic analyses indicated that applying N
fertilizer at year, hybrid, and MZ- specific EONR had the potential to increase net return
by an average of US$49 (33G26) or US$52 (33J24) ha-1 over a URN (uniform rate N)
-specific EONRs across
y of CERES-Maize yield predictions to
uncerta
ata were used to calibrate a modified version of the CERES-Maize (Version 3.5)
model for a commercial field previously divided into four MZs in eastern Illinois. The
model performance in simulating corn yield for two hybrids (33G26 and 33J24) at five N
levels (0, 112, 168, 224, 336 kg N ha-1) in two independent years was evaluated. The
model explained approximately 59 and 93 % of yield variability during calibration and
validation, respectively. The model performed well at non-zero N rates, with most of the
simulation errors being <10 %. Model-estimated economically optimum nitrogen rate
(EONR) varied from 70
application at 170 kg ha-1. Applying average hybrid- and MZ
years did not consistently improve economic returns over URN application; however,
applying the hybrid and MZ-specific N rates that maximized long-term net returns would
improve economic return by an average of US$ 22 (33G26) and US$ 14 (33J24) ha-1.
Bert et al. (2007) evaluated the sensitivit
inty in a set of soil-related parameters and solar radiation in the Argentine
Pampas. Maize yields were simulated using a 31 years climatic record for a range of
values of a group of important model input variables. The input variables considered (and
the range evaluated) were: soil nitrogen content at sowing (from 20 to 80 Kg ha-1), soil
organic matter content (from 1.75 % to 4%), soil water storage capacity (from 150 to 200
mm), soil water content at sowing (from 50 % to 100 % of total available water), soil
infiltration curve number (from 76 to 82) and daily solar radiation (from -20 % to 12 %
of the historical values). Under the scenarios evaluated, the model results showed higher
sensitivity to changes in radiation (normalized sensitivity were -0.69 and 0.45 for rain fed
and irrigated conditions, respectively) as compared to for the soil variables (normalized
sensitivity ranged from 0.20 to 0.28). The CERES-Maize model was found to have
similar sensitivity for the different soil inputs. Furthermore, some of the variables
evaluated (soil curve number, soil water content at sowing and radiation under rainfed
conditions) showed an important non-linear response.
22

Soler et al. (2007) evaluated the Cropping System Model (CSM)-CERES-Maize
for its ability to simulate growth, development, grain yield for four different maturity
maize hybrids grown off-season in a subtropical region of Brazil, under rainfed and
irrigated conditions. The evaluation of the CSM-CERES-Maize showed that the model
was able to simulate phenology and grain yield for the four hybrids accurately, with
normalized RMSE (expressed in percentage) less as compared to 15 %. Total biomass
and LAI were also reasonably well simulated, especially for the hybrids Exceler, DAS
CO32, and DKB 333B.
2.3. CLIMATE CHANGE AND MAIZE PRODUCTION
Climate change is expected to affect agriculture very differently in different parts of the
world (Parry et al., 1999). The resulting effects among various continents depend on
current
spheric CO2 on rice production in Bangladesh,
Indone
ly affect both wheat and, more severely, rice productivity in
Northw
climatic and soil conditions, availability of resources and infrastructure use to
cope with change. These differences are also expected to greatly influence the
responsiveness to climatic change (Parry, 2000).
Major impacts on crop growth and production will come from increases in CO2
levels, changes in temperature, precipitation, pests and diseases, etc. Global warming, in
Asia, will affect the scheduling of the cropping season as well as the duration of the
growing period of the crop in all the major crop producing areas. According to Lou and
Lin (1999) areas in middle and higher latitudes will experience increases in crop yields,
while yields in areas in the lower latitudes will generally decrease. The impact of rise in
temperature and increases in atmo
sia, Malaysia, Myanmar, the Philippines, South Korea and Thailand suggest that
the positive effects of enhanced photosynthesis due to doubling of CO2 are cancelled out
for increases in temperature beyond 2°C (Mathews et al., 1995). In India, Lal et al.
(1998) noted that the rice crop is vulnerable to an increase in minimum temperature,
resulting in a net decline in yield. Acute water shortage conditions combined with
thermal stress should adverse
est India, even under the positive effects of elevated CO2 in the future.
23

Rosenzweig (1990) used CERES-Wheat and CERES-Maize models to simulate
the effects of climate change under doubled CO2 conditions on yields of wheat and maize
grown in the Southern Great Plains of the United States. These models were modified to
account for the direct effects of CO2 on daily growth (by modifying daily net assimilation
and efficiency of light use) and on evapotranspiration (ET) (Peart et al., 1989).
Efficiencies of light use were assumed to increase 25% in wheat and 10% in maize for
doubled CO2 concentrations. Potential plant transpiration was modified by using the
Penman-Monteith relationship between potential ET and stomatal conductance, and by
decreasing stomatal conductance under double CO2 using relationships published by
Rogers et al. (1983). Climate scenarios from two GCMs were used in the study: the
Goddard Institute for Space Studies or GISS model (Hansen et al., 1983), and the
Geophysical Fluid Dynamics Laboratory or GFDL model (Manabe and Wetherald,
1987).
Jones et al. (1995) reported that two wheat models have been used to simulate
climate-change effects on wheat production in Europe. The WOFOST model (van Diepen
et al., 1989) simulates daily increments of crop growth using daily weather data. It
simulates potential production based on weather variables alone, and can also simulate
effects of water-limitation on production. Wolf (1993) used WOFOST with weather and
soil data for 201 locations across Europe and three GCM scenarios to simulate the effects
of climate change on yields of winter wheat. He modified the model to simulate CO2
effects on photosynthesis, transpiration, and specific leaf area and found that water-
limited yields of winter wheat increased under all scenarios (by 1 to 2.3 t ha-1) when the
direct effects of CO2 were included.
The use of simulation models to predict the likely effects of climate change on
crop production is, of necessity, an evolving science. As both general circulation models
and crop simulation models become more sophisticated, as more high quality historical
weather data for a larger number of sites become available, and as better physiological
data become available to model maize responses to climate change variables, predictions
will become more accurate.
Makadho (1996) used Global Circulation Models (GCMs) and the dynamic crop
growth model CERES-Maize to assess the potential effects of climate change on corn
24

(Zea mays L.) in Zimbabwe. He reported that at Harare the observed yield was 9.5 %
lower as compared to the simulated yield, and the observed season length was 2.3 %
shorter as compared to the simulated season length. In Gweru, the mean observed yield
was 3 % lower as compared to the simulated yield and the observed season length was
1.6 % longer as compared to the simulated season length. After calibration he used
CERES-Maize model to simulate the impact of climate change on maize productivity at 4
location
he predicted
change
the
2020s
s. Model simulations suggested that corn productivity in Zimbabwe will decrease
dramatically under non-irrigated or irrigated conditions in some regions of agricultural
production. The reductions in corn yields were primarily attributed to ambient
temperature increases which shorten the crop growth period, particularly the grain-filling
period.
Alexandrov and Hoogenboom (2000) investigated climate variability in Bulgaria
and determined the overall impact on agriculture. Several transient climate change
scenarios, using global climate model (GCM) outputs, were created. The Decision
Support System for Agrotechnology Transfer (DSSAT) version 3.5 was used to assess
the influence of projected climate change on grain yield of maize in Bulgaria. Under a
current level of CO2 (330 ppm), the GCM scenarios projected a decrease in yield of
maize, caused by a shorter crop growing season due to higher temperatures and a
precipitation deficit. The duration of the regular crop-growing season for maize was
between 5 (HadCM2) and 20 (GFDL-R15) days shorter in the 2020s. Maturity dates for
maize were expected to occur between 11 and 30 days earlier in the 2050s. T
s in the crop growing duration for maize in the 2050s were less for the HadCM2,
CGCM1, and CSIRO-Mk2b climate change scenarios as compared to the changes
predicted by the ECHAM4 and GFDL-R15 models. The GCM climate change scenarios
for the 2080s projected a decrease in maize growing season by 17 (CSIRO-MK2b) to 39
(ECHAM4 and CGCM1) days. They concluded, this will cause a shift in harvest maturity
dates for maize from September to August at the end of the next century. Because maize
is a C4 crop, an increased level of CO2 alone had no significant impact on either maize
crop growth, and development or final yield. Maize yield decreased by 3–8 % in
for the ECHAM4, CGCM1, and CSIRO-Mk2b model scenarios. The projected
decrease was highest for the GFDL-R15 model, e.g. between 8 and 14 %, while the
25

HadCM2 scenario projected an increase from 4 to 12 % for the next decades. The
decrease in simulated maize yield for the 2050s ranged for most stations from 10 to 20 %
for the ECHAM4, CGCM1, CSIRO-Mk2b, and GFDL-R15 GCM scenarios. The largest
decrease in maize yield is expected to occur at the end of the century. Adaptation
measures to mitigate the potential impact of climate change on maize crop production in
Bulgaria included possible changes in sowing date and hybrid selection.
Southworth et al. (2000) studied the consequences of future climate change and
changing climate variability on maize yields in the mid western United States for 10
representative agricultural areas across the mid western Great Lakes region, a five-state
area including Indiana, Illinois, Ohio, Michigan, and Wisconsin and reported that a
seasonal rise in temperature increased the developmental rate of the crop, resulting in an
earlier harvest. Heat stress may result in negative effects on crop production. Conversely,
increased rainfall in drier areas may allow the photosynthetic rate of the crop to increase,
resulting in higher yields. They recommended that properly validated crop simulation
models can be used to combine the environmental effects on crop physiological processes
and to evaluate the consequences of such influences. They concluded that generally,
crops grown in northern states had increased yields under climate change, with those
grown
conditions using the CERES-Maize model to obtain a quantitative understanding of
in the southern states of the region having decreased yields under climate change.
This analysis highlighted the spatial variability of crop responses to changed
environmental conditions. In addition, scenarios of increased climate variability produced
diverse yields on a year-to-year basis and had increased risk of a low yield.
Zalud and Dubrovsky (2002) used CERES-Maize to estimate direct and indirect
effect of increased concentration of atmospheric CO2 on maize yield and reported that the
standard error between the observed and modeled yield was 11 %. The stress yield would
increase 36-41% in the present climate and by 61-66 % in 2 x CO2 climates. The
potential yield would increase only by 9-10 %. They further concluded that the increased
temperature shortens the phenological phases and does not allow for the optimal
development of the crop. The simultaneous decrease of precipitation and increase of
temperature and solar radiation deepens the water stress, thereby reducing the yield.
Bannayan et al. (2004) conducted a study to simulate controlled-environment
26

different maize cultivar responses to a range of temperature and photoperiod
combinations. Nine day length treatments ranging from 8 h to 16 h, together with
minimu
. Results
from th
m temperature (Tmin) treatments ranging from 5 °C to 35 °C and maximum
temperature (Tmax) treatments ranging from 15 °C to 45 °C, were applied to nine maize
(Zea mays L.) cultivars. Increasing Tmax up to 35 oC at any given Tmin enhanced biomass
production for all cultivars; a further increase of Tmax above 35 °C had a negative impact
on biomass. Increasing temperature also accelerated developmental rates for both
anthesis and maturity. An identical mean temperature obtained from various Tmin or Tmax
combinations resulted in a different crop performance, indicating specific responses to
either high or low values of Tmin or Tmax. The highest potential yield levels were found at
rather low temperature combinations of a Tmax of 20 °C and a Tmin of 10 °C; yield varied
from 10.2 t ha−1 to 23.2 t ha−1 for these conditions, mainly caused by extremely long
growing seasons. Photoperiod showed no effect across all treatments, due to a low
sensitivity to changes in day length for the cultivars used in this study. They concluded
that crop simulation models can help provide an understanding of weather and crop
interactions for a complex environment that are rather difficult to conduct under
controlled environment conditions and are resource intensive.
Erda et al. (2005) used a regional climate change model (PRECIS) for China to
simulate China’s climate and to develop climate change scenarios for the country
at project suggested that, depending on the level of future emissions, the average
annual temperature increase in China by the end of the twenty-first century may be
between 3 and 4°C. They predicted changes in yields of key Chinese food crops: rice,
maize and wheat. Modeling suggested that climate change without CO2 fertilization could
reduce rice, maize and wheat yields by up to 37 % in the next 20-80 years. They further
reported that CO2 enrichment under field conditions consistently increased biomass and
yields in the range of 5–15 %; however CO2 concentration elevated to 550 ppm as
compared to 450 ppm will probably cause some deleterious effects in grain quality. It
seems likely that the extent of CO2 fertilization effect will depend upon other factors such
as optimum irrigation and nutrient applications. They also found that higher temperature
may shorten the growth period by between 4 and 8 days in maize. Yield decreases would
27

be greatest if higher temperatures occur during the period when the maize ears are
swelling.
Abraha and Savage (2006) described an assessment of simulated potential maize
(Zea mays) grain yield using (i) generated weather data and (ii) generated weather data
modified by plausible future climate changes under a normal planting date and dates 15
days earlier and 15 days later using CropSyst, a cropping systems simulation model in
South Africa. Maize grain yields simulated using the observed and generated weather
data series with different planting dates were compared. The simulated grain yields for
the res
pitation.
The results indicate that analysis of the implications of variations in the planting date on
maize production may be most useful for site-specific analyses of possible mitigation of
the impacts of climate change through alteration of crop management practices.
era et al. (2006) studied the effect of individual versus simultaneous changes in
radiation (R), precipitation (P), and temperature (T) on plant response such as crop yields
in a C 4 plant by using the DSSAT: including CROPGRO (soybean), and
CERES-Maize (maize) models. Observed weather and field conditions corresponding to
1998 were used as the control. In the first set of experiments, the CROPGRO (soybean)
and CERES-Maize (maize) responses to individual changes in R and P (25 %, 50 %,
75%, and 150 %) and T (±1, ±2 °C) with respect to control were studied. In the second
set, R, P, and T were simultaneously changed by 50 %, 150 %, and ±2 °C, and the
interactions and direct effects of individual versus simultaneous variable changes were
analyzed. They reported that (i) precipitation changes were most sensitive and directly
affected yield and water loss due to evapotranspiration; (ii) radiation changes had a non-
linear effect and were not as prominent as precipitation changes; (iii) temperature had a
pective planting dates were not statistically different from each other. The
generated baseline weather data were modified by synthesized climate projections to
create a number of climatic scenarios. The climate changes corresponded to a doubling of
CO2 concentration to 700 µll-1 without air temperature and water regime changes, and a
doubling of CO2 concentration accompanied by mean daily air temperature and
precipitation increases of 2 °C and 10%, 2 °C and 20 %, 4 °C and 10 %, and 4 °C and
20%, respectively. Under increased CO2 concentration regimes, maize grain yields were
much more affected by changes in mean air temperature as compared to by preci
M
3 and a C
28

limited impact and the response was non-linear. The results from the second set of
xperiments indicated that simultaneous change analyses did not necessarily agree with
those from indiv . Their analysis
indicated that for the changing clim
edbacks showed a non-linear effect on yield. The results also indicated C3 crops are
sensitive as compared to C4; however, the temperature–
radiatio
n crop phenology and yields were
spatially diverse across China. The study also highlighted the need for further
investigatio
physiological processes and mechanisms governing crop growth and production.
e
idual changes, particularly for temperature changes
ate, precipitation, temperature, and radiative
fe
generally considered more
n related changes shown in this study also affected significant changes in C4
crops.
Tao et al. (2006) studied climate change and trends in phenology and yield of
field crops (rice, wheat, maize) in China and reported that significant warming trends
were observed at most of the investigated stations, and the changes in temperature had
shifted crop phenology and affected crop yields during the two decades. The observed
climate change patterns, as well as their impacts o
ns of the combined impacts of temperature and CO2 concentration on
29

30
3.1. S
pping system model (CSM) - CERES – Maize (DSSAT V 4.0) to study the impacts
of fu n maize yield in the Punjab (Pakistan). Additional information
regardi
Location titude Longitude Altitude Soil Series Climatic zone
CHAPTER -3
MATERIALS AND MMEETTHHOODDSS
ITE AND SOIL Field trials were conducted at the Agronomic Research Area, University of
Agriculture, Faisalabad, Maize and Millet Research Institute, Sahiwal and Adaptive
Research Farm Sargodha under irrigated semi arid conditions of Punjab province of
Pakistan over a period of two autumn seasons (2004 and 2005) to evaluate the application
of cro
ture climate change o
ng experiment and soil is given in Table 3.1.
Table3.1. Summary of field attributes, soil and crop management
La
Nº Eº (m) USDA Classification
Lyallpur
Faamy, silik., therm)
Dry
Semi-Arid
Bhalwal
Sargodha 32o 04´ 72o 67´ 188 (Fine-silty, mixed, hyperthermic
typic calciargids)
Arid
Jaranwala
S 172 (Coarse-silty, Mixed,
hyperthermic Typic
Calciargids)
Wet
Semi-Arid ahiwal 30o 40´ 73o 06´
isalabad 31o 26´ 73o 04´ 184 (Fine lo

3.1.1 Soil Analysis
A composite soil sample to a depth of 30 cm was obtained from the experimental
wi oil Auger prior to s ng of crop. The sample was analyzed for its physico-
mical properties.
Mechanical analysis
Percentage of sand, silt and clay was determined by Bouyoucos hydrometer
metaphosphate as a dispersing agent. Textural class was
rm the intern ral triangle (M e et al., 1959) Appendix
sho isalabad s y clay loam in texture, whereas in case of
godh l the soil t oam and heavy loam, resp vely pend
.
Chemical analysis
ical properties using the method as
crib om nd Pratt 1).Ap dix 3.1 shows all th ee s had
r ore r, soils of sites e rated a fic in the in el nts l
d h teri h soil series is attached in appendices3.2,
a .4.
. DE GN AND TREATEMENTS e ex nt was ut us CD with Split Plot arrangeme eepi
r rep tion net plo as 4.2 m x 10 m.
The trea were nder:
= main plot)
B al-202
= Monsanto-919
= Pioneer 31-R-88
area
che
method using 1% sodium hexa
dete
3.1
Sar
3.1)
des
nea
N, P
3.3
3.2
fou
A
H
th s owi
ined
ws
a a
by using atio
oil
ex
nal textu oodi
that
ient
that at Fa was sand
nd Sahiwa ture was l ecti
e thr
ma
(Ap
ites
eme
nt k
ix
pH
ike
ng
Soil was analyzed for its various chem
ed b
8.00
y H er a (196
the
pen
to
, an
nd 3
. M ove wer s de
K etc. Detailed c arac
la
t si
as u
stics of eac
SI Th
lica
perime id o
ze w
ing RB
s. The
tments
Hybrids (
1
H
= emas
2
H3
31

32
of cli an a ( a mays productivity in the Punjab
E.
Fig.3.1. Layout plan for modeling the impact mat
N.
e ch ge on m ize Ze
A.
. L)
H1 H1 H2 H3 H2 H3 N E A
N5
N3
1
C E N T R A L
N4
N5
N3
N1
N1
N4
N2
N4
N3
N1
N5
N2
N3
N5
N2
N4
N
N5
N1
N3
N4
N2
N1
N3
N2
N2
N5
N4
r channel Wate H2 H1 H2 H3 H1 H3
N E A
N3
N1
N4
N5 N3
N5
P A T H
N2
N5
N2
N1
N4
N3
N4
N2
N3
N E A
N2
N2
N5
N4
N1
N3
N2
N4
N1
N4
N5
N1
N3
N1
N5
M A I N W A T E R C H A N N E L
N. E. A
Design: t Design Replicati : 70 cm P x P: 20 cm
Treatments: A. Cultivars (Main plot) H1: Bemasal-2 H3 8
B. ogen Levels ( N1: 150 kg ha-1 dard) N3 N4: 300 kg ha-1 N5: 350 kg ha-1
Fer ers
K: 100 kg ha ha-1
Split Plo
Nitr
tiliz
Net Plot Size: 4.2 x 8 m
02 H
on: 4 R x R
2: Monsanto-919 Sub-plot)
: Pioneer-31-R-8
N : 200 kg ha2-1(stan
: 250 kg ha-1
-1 P: 100 kg ha-1 Seed Rate: 25 kg

B
1 = 150 (kg N
00 (kg N
g N
N
350 (kg N -1
ure 3.1 indi o i o
unjab
e for hybrid maize 2 wever just to
I started r g a
recommended dose.
3.3. CRO HUSBACr at all loca ing
ridges keeping plant to plant distance of 2 n
Phosphoru nd Potass e 0
phosphoru nd potassiu p he r O
and all
of N was used in two sp t fte a i
All other ltural prac ing
measures re kept no th t a a s
operations the three lo u se
3.4. OBS VATIO
the plot a s t e
half for the final harvest data.
= Nitrogen Fertilizer Rates (sub plot)
N ha-1)
N2 = 2 ha-1) (standard)
N = 250 (k3 ha-1)
N = 300 (k4 g ha-1)
N5 = ha )
Fig cates a c mmon sow ng plan f maize crop planted at three
locations. In P soils are deficient of nitrogen and organic matter. Existing
recommended rat
avoid erro
00 kg N ha-1 is not optimum level. Ho
r, esearch with 150 k N ha-1 th t was 50 kg N ha-1 below the
P NDRY op tions was sown dur the month of August on 70 cm spaced
0 cm usi g a seed rate of 25 kg ha . -1
s a ium were used at th rate of 10 kg ha-1 in all plots. Nitrogen,
s a m were a plied in t form of u ea, TSP and SOP (K2S 4), 1/3rd
dose of nitrogen of the P and K fertilizer were applied at sowing. Remaining 2/3rd
lits, first a 15 days a r sowing nd second at the tassel ng stage.
cu tices such as thinn , hoeing, irrigation and plant protection
we rmal for e crop a ll sites. T ble 3.2 shows variou cultural
at cations d ring both asons.
ER NS
Half of rea was u ed for grow h and dev lopmental studies and the other
33

Table 3.2: Crop husbandry operations for the experiments during cropping season
Operations Faisalabad Sargodha Sahiwal 2004 2005 2004 2005 2004 2005 Sowing dates 11.08.04 03.08.05 9.08.04 08.08.05 12.08.04 05.08.05
Crop establishment 18.08.04 11.08.05 17.08.04 16.08.05 20.08.04 13.08.05Fertilizer P (SSP) @ 100 kg ha-1 11.08.04 03.08.05 9.08.04 08.08.05 12.08.04 05.08.05K (SOP) @100 kg ha-1 11.08.04 03.08 08.08.05 12.08.04 05.08.05
tments 12.08.04 05.08.05
6.08.04 18.08.05 24.08.04 22.08.05 27.08.04 20.08.053rd Dose Hand w
.05 9.08.04N (Urea) Nitrogen was applied in three doses in all trea1st Dose 11.08.04 03.08.05 09.08.04 08.08.05 2nd Dose 2
30.09.04 24.09.05 28.09.04 27.09.05 02.10.04 27.09.05eeding 31.08.04 22.08.05 25.08.04 25.08.05 30.08.05 23.08.05
Plant protection measures
Application of Furadan @ 25 kg ha-1
1 01.09.04 24.08.05 29.08.04 28.08.05 04.09.04 26.08.0513.10.04 08.10.05 10.10.04 11.10.05 15.10.04 10.10.05
Irrigation 2
1 11.08.04 03.08.05 09.08.04 08.08.04 12.08.04 05.08.052 18.08.04 10.08.05 16.08.04 15.08.05 20.08.04 13.08.053 28.08.04 18.08.05 23.08.04 22.08.05 27.08.04 20.08.05
09.09.05 14.09.04 13.09.05 19.09.04 12.09.05.09.04 24.09.05 28.09.04 27.09.05 02.10.04 27.09.05
14.10.04 09.10.05 12.10.04 11.10.05 16.10.04 12.10.05
4 02.09.04 25.08.05 31.08.04 30.08.05 05.09.04 28.08.055 16.09.046 3078 29.10.04 24.10.05 25.10.04 25.10.05 30.10.04 27.10.05
Sampling date 1 26.08.04 18.08.05 24.08.04 23.08.05 27.08.04 20.08.052 05.09.04 28.08.05 03.09.04 02.09.05 06.09.04 30.08.053 15.09.04 07.09.05 13.09.04 12.09.05 16.09.04 09.09.054 25.09.04 17.09.05 23.09.04 22.09.05 26.09.04 19.09.055 05.10.04 27.09.05 03.10.04 02.10.05 06.10.04 29.09.056 15.10.04 07.10.05 13.10.04 12.10.05 16.10.04 09.10.057 25.10.04 17.10.05 23.10.04 22.10.05 26.10.04 19.10.058 04.11.04 27.10.05 02.11.04 01.11.05 05.11.04 29.10.059 14.11.04 06.11.05 12.11.04 11.11.05 15.11.04 08.11.05
27.11.04 16.11.05 02.12.04 26.11.05 05.12.04 29.11.05Final harvest
34

3.4.1. C
In both years five plants were selected lot for recording the
development events, such as emergence, tasseling, silking,
and maturity.
al time (growing degree days) was calculated according to Gallagher et al.
(1983). It calculates thermal tim perature above a base
temperature (Tb).
ROP DEVELOPMENT
at random in each p
calendar timing of different
Therm
e (Tt) as a function of mean tem
Tt = TbTT−
+Σ2
.)minmax(
Where Tb is base temperature taken as 8 °C for Maize (FAO, 1978)
g. The average numbers of days taken to 50 % tasseling
were calculated from date of planting.
Da
% silking and mean days to silking were worked out from date of
3.4.2. CROP GROWTH
Sampling
One meter long row from each plot was harvested at ground level after ten days
interva
, tassel and cob) was determined. A sub-sample in each fraction was
onstant weight. Total dry matter (TDM) was
obtained by summing weight of all the com
COR Inc. Lincoln, NE). From the measurements of leaf area and dry weights following
parameters were calculated.
Days to 50 % tasseling
For this observation five plants were selected from each plot at random, tagged
and noted the date of tasselin
ys to 50 % silking
The same tagged plants in each plot were kept under observation and observed
their date of 50
sowing.
l leaving appropriate borders. Fresh and dry weight of component fractions of
plant (leaf, stem
taken to dry in an oven at 70 °C to a c
ponents. Also, an appropriate sub-sample of
green leaf lamina was used to record leaf area on an area meter (Licor model 3100, LI-
35

Leaf area index
Leaf area index (LAI) was calculated as the ratio of leaf area to land area.
(Watson, 1952).
Leaf area du ach sampling date was estimated according to
Hunt (1978).
Where LAI1 and LAI2 were the leaf area indices at time T1 and T2, respectively.
umulative LAD at final harvest was calculated by adding all LADs values.
Crop g
1)
Where W1 and W2 were the total dry weights harvested at times T1 and T2
respect
et assimilation rate (g m-2 d-1)
milation rate (NAR) was estimated by using the formula of
Hunt
3.4.3. RADI
by the green surfaces of the crop canopy
was calculated after ten days interval for each plot from Beer’s law.
Fi = 1- exp (-k x LAI)
LAI = Leaf area / Land area
Leaf area duration (days)
ration (LAD) for e
LAD = (LAI1+LAI2) x (T2 – T1) / 2
C
rowth rate (gm-2d-1)
Crop growth rate was calculated as proposed by Hunt (1978) at each sampling
date.
CGR = (W2-W1) / (T2- T
ively. Mean CGR was calculating by averaging all CGRs calculated at each
destructive harvest.
N
The mean net assi
(1978).
NAR = TDM / LAD
Where, TDM and LAD are the total dry matter and leaf area duration respectively
at final harvest.
ATION INTERCEPTION
Fraction of intercepted Radiation (Fi)
36

Where, k is an extinction coefficient for total solar radiation equal to 0.7 for maize
Lin
alues of Fi
AR (Si), during the season.
total PAR intercepted by the crop was calculated by multiplying Fi
with 0.
3.4.4. R
for TDM (RUETDM) and seed yield (RUEGY) was
calcula d PAR
UEGY = Grain Yield / ∑Sa
onteith, 1977).
T
was t ponents. All plants were thrashed
mechanically for the . The following data
ndard procedure: i. Nu
final harvest and it was
area to get plants m-2.
dquist et al., 2005).
The amount of intercepted PAR (Sa) was determined by multiplying v
with daily incident P
Sa = Fi x Si
The amount of
5 PAR of incident radiation (Szeicz, 1974).
ADIATION USE EFFICIENCY
Radiation use efficiency
ted as the ratio of total biomass and grain yield to cumulative intercepte
(∑sa).
RUETDM = TDM / ∑Sa
R
Alternatively, radiation use efficiency was estimated by regressing yield against
accumulated intercepted radiation (M
3.4.5. FINAL HARVES
An area (2.1 x10 m) from each plot was harvested and a sub-sample of 10 plants
aken for the determination of different yield com
estimation of plot yield and converted into t ha-1
were collected according to sta
mber of plants m-2 at harvest
Total number of plants in each plot was counted at
divided to total plot
37

ii. Plant height (cm)
Ten
plot with the help of Vernier calliper
and then mean was taken.
iv. Cob length (cm)
bs was taken from each plot with the help of measuring tape
and
viii. rain yield (t ha-1)
t basis and then converted to t ha-1.
. Total dry matter (t ha-1)
whole plot was harvested, weighed and converted into t ha-1.
x. Ha
shelling.
plants were harvested at random from each plot at ground level. Their height was
measured with the help of measuring tape and average height was calculated.
iii. Cob girth (cm)
Cob girth of ten cobs was taken from each
Cob length of ten co
then average was taken.
v. Number of grain rows per cob
Number of grain rows of ten cobs from each plot were counted and then averaged.
vi. Number of grains per cob
Number of grains per cob from each plot were counted and then averaged.
vii. Thousand grain weight (g)
A sample of 1000 grains was taken from each plot, oven-dried and weighed
through an electric balance.
G
Grain yield was recorded on sub-plo
ix
For biological yield
rvest index (%)
Harvest index (HI) was calculated as the ratio of grain yield to biological
yield, and expressed in percentage.
H.I = (Grain yield / Biological yield) x100
xi. Grain pith ratio (GPR)
Grain pith ratio was calculated as the ratio of grain weight to pith weight after cob
shelling. GPR = Grain yield / Pith yield
xii. Cob sheath ratio
Ten cobs were weighed with sheath and with out sheath and cob sheath
ratio were calculated as the ratio of cob weight to sheath weight after cob
38

3.4.6. Statistical Analysis
All the data obtained were analyzed by employing split plot design using
“MSTATC” statistical package on a computer. The effect of nitrogen levels was analyzed
using polynomial contrasts with in the analysis of variance structure. Differences among
treatment means were compared by the least significant difference (LSD) test at 0.05p as
during 2004 and 2005 and long term means from 1976 to 2005.
tion, Solar radiation), site information (latitude, longitude, altitude,
soil physical, chemical and morphological properties), crop management information
regarding tillage, plant population, planting geometry, seed rate, sowing depth,
application of irrigation, fertilizers and a set of genetic coefficients that describes hybrids
suggested by Steel and Torrie, 1984.
3.4.7. WEATHER DATA
Standard weather data were obtained for each site using nearest weather station.
Each station provided daily maximum and minimum air temperature (ºC), rainfall (mm),
and daily sunshine hours (h). Decision support system for agro-technology transfer
(DSSAT) system’s component Weatherman used these sun shine hours for calculation of
daily solar radiation (MJ m-2 day-1). Thirty years historical observed data on these
parameters were also obtained from Pakistan Meteorological Department and used as
input data for CSM-CERES-Maize. Figure 4.1 presents summary of weather variables
3.5. CROP GROWTH MODELING
3.5.1. Model Description
CERES-Maize model (Jones and Kiniry, 1986; Ritchie et al., 1989) was
developed by the scientists of IBSNAT (International Benchmark Sites Network) project
and was run within DSSAT (Hoogenboom et al., 1994) environment. This model has
capabilities to simulate daily crop growth, development and yield under diversified
climatic and soil conditions with different agronomic managements and thus it was
selected for the study. Daily weather observations (maximum temperature, minimum
temperature, Precipita
39

in terms of development and grain biomass are required to run the model. Detailed
description of CERES-Maize model can be obtained in Jones and Kiniry (1986), Ritchie
et al. (1998 a, b), Lizaso et al. (2001, 2003), Zalud and Dubrovsky (2002) and Ritchie
and Algarswamy (2003).
3.5.2. Model Calibration and Evaluation
Calibration is a process of adjusting some model parameters to the local
conditions .It is also necessary for getting genetic coefficients for new cultivars used in
modeling study. So the model was calibrated with data (that included phenology,
biomas n
8). To select the
ost suitable set of coefficients an iterative approach proposed by Hunt et al. (1993) was
descriptions are given in Table 4.34.
performance was evaluated by calculating
differen
observed grain yield was calculated.
Time c
s, LAI, a d yield components) collected during 2005 at all locations against
treatment 300 kg N ha-1 that shows best performance in the field trials. Cultivar
coefficients were determined successively starting from P1, P2, P5 and PHINT deals with
vegetative growth and phenology of plant followed by G1, G2 that describes grain
number per cob and grain filling rate respectively (Hunt and Boote, 199
m
used. Calculated coefficients and their detailed
To check the accuracy of model simulations it was run with data recorded against
remaining four treatments for all locations during the year 2005. The data of year 2004
was used for validation. During all this process available data on anthesis date, maturity
date, yield components, grain yield, total crop biomass and maximum leaf area was
compared with simulated values. Simulation
t statistic indices like root mean square error (RMSE) (Wallach and Goffinet,
1989) and mean percentage difference (MPD) across all locations. For individual
nitrogen levels error (%) between simulated and
ourse simulation of crop biomass and LAI was assessed by an index of agreement
(d) (Willmott, 1982) that is an aggregate over all indicators. These measurements were
calculated as follows
40

( )0 . 5
2
1
n
i ii
p o=
⎡ ⎤⎢⎣∑
( )
( )
( )
1
2
12
1
/
E r r o r ( % ) = 1 0 0
d = 1 -
n
i i
n
i ii
n
i ii
R M S E n
o p
p oo
p o
p o
=
=
=
= − ⎥⎦⎡ ⎤⎛ − ⎞⎢ ⎥1 0 0 / i i n
o
M P D = ⎜ ⎟⎢ ⎥⎝ ⎠⎣ ⎦
−⎛ ⎞⎜ ⎟⎝ ⎠
⎡ ⎤−⎢ ⎥
⎢ ⎥⎢ ⎥′ ′+⎢ ⎥⎣ ⎦
∑
∑
∑
and Oi are the predicted and observed udied variables,
respectively and n is the number of observations. Linear regression analysis between
simulated and observed grain yield and biomass at harvest was done to evaluate the
perform tions. Model perform oved as R2 and d
value approaches to unity while RMSE, MPD and error proceed to zero.
3.5.3. Climate Change Impact Assessment
cation analysis is needed while conduc to document shift
in spatial boundaries of crop potential areas, changes in productivity and crop water use
etc. So trial was conducted on three locations representing various climatic regions in the
Punjab. Three locations that were selected
their environmental and soil characteristics.
The clim e scenarios formulated by Pakistan Meteorological Department
using synthetic model guided by General Circulation Model (GCM) out put were selected
f nge impact assessment (Table 3.3)
The climate change impacts on crop growth and yield were assessed with use of
crop growth model run with weather series representing both the present and changed
clim order that the findings obtained by a com
climates have a statistical significance, m years) crop model simulations
were run for each scenario.
The descriptive statistics, such as means, standard deviations, and percentile
ed and used for impact assessment. This approach is
Where Pi values for st
ance of model at different loca ance impr
The multi-lo ting studies
for the study are presented in Table 3.1 with
ate chang
or climate cha
ates. In parison of yields for different
ulti-annual (30
characteristics were determin
41

Table-3.3: Climate change scenarios selected for study impact of climate change on
maize productivity.
Climate change scenarios Limits/ Periods
Temperature + 0.3 ºC decade-1
Rainfall + 1.0% decade-1
Carbon dioxide 360, 550 ppm
Climatic data base line 1976-2005
Agriculture data base line 2005
Prediction Period 2020,2050
Prediction scenarios
Variable 2020 2050
Temperature +0.9 ºC +1.8 ºC
Rainfall No change in rainfall
+ 3% rainfall
No change in rainfall
+ 6% rainfall
Source: GOP/UNEP, 1998.
42

43
ecisive (in a statistical sense) as compared to the use of single values
related to individua
from normal, the because of their
robustness. On the other hand, as the samp estimates of the percentiles are loaded by
ay be more suitable in case the time series is
not eno
the optimum planting date, and variety for
each lo ation, seasonal analysis driver was run with 7 planting dates. The value of the
rval (D0 – 20 days and D0 + 40 days), where D0 is
the planting date of 2005 for each location and hybrid. Thirty years observed historical
were us
planting date (PD) varied within the inte
great error, means and standard deviations m
ugh.
Crop model simulations were run with observed pedological, physiological, and
crop management data during 2005. Observed weather series during 2005 was used in the
present climate simulations. The weather series for simulations in the changed climate
was obtained by a direct modification of observed series according to the climate change
scenarios. The impact of climate change was estimated by comparing model crop yields
simulated with use of weather series representing the present climate and the changed
climate.
3.5.4. Strategy Analysis
After assessment of climate change impact on maize productivity for all locations
seasonal analysis tool of DSSAT was run with different management options, such as
planting date, and varietal comparison, to mitigate the impact of climate change and
sustained the crop productivity. To determine
c
(370.0 $/ha) that was constant for all treatments. Biophysical and strategic analysis
options were used to compare the results under different options. Grain yield and net
monetary return ha-1 were compared by percentile distribution for each location.
weather data were used for assessment of best management option to maximize grain
yield and net return under changed climate scenarios. Measurements made about
experimental sites during year 2005 ed as initial conditions for series of model
runs. Gross margin ($ ha-1) for each nitrogen level was determined by following formula
GM Y P N C V= × − × −
Where Y is grain yield (kg ha-1), P is pr
application rate (kg ha-1), C is cost of nitroge
considered more d
l years. Since the distribution of yields may be asymmetric and far
use of percentiles might be more appropriate
le
ice of maize (111.51 $/t), N is nitrogen
n (0.39 $/kg) and V is base production cost

44
CHAPTER-4
RESULTS AND DISCUSSION
4.1 WEATHER igu 1 s w n and
m o D n b p a s the
iwal site was relatively hotter as compared to Sargodha and Faisalabad sites. Mean
perature re higher by approximately 1-2 oC at the Sahiwal whereas Sargodha was
lightly c S i
re was similar at all the three sites; temperatures were higher from
rd maturity of the crop. Rainfall was
w precipitation at 134 mm as compared to
2004. Comparable rainfall, in 2005, was
v l a ring
re generally close to the long term means
thermal time (Growing Degree Days) from
s ng 2 4. Equivalent values in 2005 were 1273 to 1305 for Bemasal-202, 1328 to
average Monsanto-919 took m
Bemasal-202 4) and Pioneer-31-R-88 (53).
T mal duration sowing to maturit ried fro
Bemasal-202, 2086 to 2141 for Monsanto-919 and 1988 to 2013 C days for Pioneer-31-
R-88 during 2004 h
919 and 2017 to 2054 o ng 2005 respectively at various
F re 4.
eans (1976-2005) for each locati
pre ents the summary of eather v
n.
aria
uri
bles
g
duri
oth
g 2
cro
004
ping
and
se
2005
sonlong term
Sah
tem
also s
average temperatu
August to October and then decreased towa
experienced during m
during grow
Sargodha (148 mm) and Sahiwal (182 mm) in
159 mm, 219 mm and 242 mm, respec
2005 as compared to 2004. Radiation levels we
during both the seasons. (Appendix 4.1, 4.2)
4.2. CROP DEVELOPMENT
sowing to silking stage ranged from1270 to 1327 for hybrid Be
for Monsanto 919 and 1233 to 1271
site
1389 for Monsanto 919 and 1295 to 1307
s we
warmer as ompared to ah wal by 0.5-1 oC. However, the pattern of
onsoon (August to September) and was variable at all the three sites
ing seasons: Faisalabad had lo
ti ely. In general al sites have more rainf ll du
Data (Tables 4.1, 4.2) indicated that
duri
ma
resp
sal-202, 1290 to 1327
ectively oC days for Pioneer-31-R-88 at different
00
(5
oC days for Pioneer-31-R-88 respectively. On
ber of ore num days to silking (56) as compared to
her from
to 2
y va m 1975 to 2040 for o
and 2017 070 for ybrid Bemasal-202, 2042 to 2161 for Monsanto-
C days for Pioneer-31-R-88 duri

45
Table 4.1: Phenological data of different maize cultivars during the year 2004
*Base temperature = 8°C
Calendar Date Calendar days Thermal time (◦C days)*
Stage
Variety
Faisalabad Sargodha Sahiwal Faisalabad Sargodha Sahiwal Faisalabad Sargodha Sahiwal
B -202 11-08-04 09-08-04 12-08-04 0 0 0 0 0 0
M -919 11-08-04 09-08-04 12-08-04 0 0 0 0 0 0Sowing
P-31-R-88 11-08-04 09-08-04 12-08-04 0 0 0 0 0 0
B -202 15-08-05 13-08-04 16-08-04 4 4 4 126 113 129
M -919 16-08-04 14-08-04 16-08-04 5 5 4 153 138 129Emergence
P-31-R-88 15-08-04 13-08-04 16-08-04 4 4 4 126 113 129
B 1205 -202 29-09-04 26-09-04 29-09-04 49 48 48 1142 1148
M 1205 -919 29-09-04 28-09-04 05-10-04 49 50 54 1187 1270Tasseling
P-31-R-88 27-09-04 24-09-04 30-09-04 47 46 49 1157 1101 1171
B -202 05-10-04 02-10-04 05-10-04 55 54 54 1327 1277 1270
M -919 05-10-04 07-10-04 06-10-04 55 56 58 1327 1315 1290Silking
P-31-R-88 02-10-04 30-09-04 04-10-04 52 52 53 1271 1233 1251
B 101 105 102 -202 20-11-04 22-11-04 22-11-04 2040 2012 1975
M 108 -919 27-11-04 29-11-04 02-12-04 112 112 2141 2086 2088
20122013103 105 9923-08-0422-11-0418-08-04P-31-R-88 1988
Maturity

46
o nt m e l rs du e a 0
*Base tem = 8°
ays The
Table 4.2: Phenol gical data of differe
C
Calendar Date
aiz cu tiva
Calendar d
ring th ye r 2 05
perature
rmal time (◦C days)*
Stage hiwal
Variety
Faisalabad Sargodha Sahiwal Faisalabad Sargodha Sahiwal Faisalabad Sargodha Sa
B-202 03-08-05 08-08-05 05-08-05 0 0 0 0 0 0
M-919 03-08-05 08-08-05 05-08-05 0 0 0 0 0 0 Sowing
0 P-31-R-88 03-08-05 08-08-05 05-08-05 0 0 0 0 0
B-202 08-08-05 13-08-05 10-08-05 5 5 5 152 1 150 40
M-919 08-08-05 13-08-05 10-08-05 5 5 5 152 1 150 40 Emergence
1 150 P-31-R-88 08-08-05 13-08-05 10-08-05 5 5 5 152 40
B-202 19-09-05 25-09-05 22-09-05 47 48 48 821 1163 1172
M-919 23-09-05 29-09-05 28-09-05 51 52 54 914 1251 1307 Tasseling
1 195 P-31-R-88 18-09-05 27-09-05 23-09-05 46 50 49 797 207 1
285 B-202 24-09-05 30-09-05 27-10-05 52 53 53 1305 1273 1
M-919 28 328 -09-05 03-10-05 29-10-05 56 56 55 1389 1338 1Silking
24 1 307 P-31-R-88 -09-05 01-10-05 28-10-05 52 54 54 1305 295 1
B-202 04 031 -11-05 14-11-05 08-11-05 93 98 95 2070 2017 2
M-919 10 138 -11-05 19-11-05 16-11-05 99 107 103 2161 2042 2Maturity
03 2 017 96 2054 98 -11-05 14-11-05 09-11-05 92 P-31-R-88 017 2

s o
aturity (107 vs 99) as compare to other varieties. The crop sown at the Faisalabad site
ore therma
in temperatures.
lant Height (cm)
Date in Table 4. ted non di s in ight at
and Sahiwal si ing 2004 05 whi s highl significant at
ere plants w taller (190 ) d 2004. It might be due
vironment (low temperature and higher relative humidity) for vegetative
ng 200 e to ix v ver all
were 2004 t
ars on plant height w nt m es with
nd, averaged ov ocations Pioneer-31-R-88 gave maximum plant height
ollowed by B asal-202 that m Statistically minimum plant
noted in case of Monsanto-919.
se of Ni ation le h s linear
adratic at d cubic at Sargodha respectively. Averaged over
) w by t N ha-1)
ith treatm kg pr cm nts. N3
enhanced by tha c gher as
to standard rate 00 kg N ha at gave 1 . Statistically minimum
68.8 cm) was recorded in plots that were fertilized with150 kg N ha-1 (N1).
d plant height ma e attributed to more vegetative developm t that caused
utual shading and internodal extension. These r tiate the findings
et al., (2004) who have also reported the promotive
effects of nitrogen on plant height of maize. The interactive effects of cultivars and
were found to be statistically
lants go height (1 at Sa cation s compare to
differences as
oth years (Appendix 4.1, and 4.2).
ites during the growing season. On average Mosanto-919 took 8 % more no of days t
m
accumulated m l time as compared to Sargodha and Sahiwal probably due to
differences
4.2.1 P
3 indica significant fference plant he
Faisalabad tes dur and 20 le it wa y
Sargodha wh ere vs 166 cm uring
favourable en
growth period duri 4 as compar 2005(Append 4.1, 4.2). A eraged o
locations crop plants taller during as compared o 2005.
Effect of cultiv as significa at all experi ental sit
similar tre er the l
(193.24 cm) f em gave 182.98 c .
height (165.83 cm) was
The respon trogen applic at different vels on plant eight wa
at Faisalabad, qu Sahiwal an
location maximum plant height (191 cm as produced -1
N4 treatmen (300 kg
that was at par w-1
ents N5 (350 N ha ) that oduced 187 tall pla
(250 kg N ha ) plant height 181.9 cm -1
t was signifi antly hi
compared N2 (2 ) th 75 cm
plant height (1
Increase y b en
increased m esults substan
of Mohsan (1999) and Rasheed
nitrogen levels non significant.
Over all p t more 88 cm) hiwal lo a
Sargodha (178 cm) and Faisalabad (176 cm). It might be due to climatic
Sahiwal location got maximum rainfall during b
47

Table 4.3: Effect of cultivars and fertilizer levels on plant height (cm) at maturity
Treatment FFaaiissaallaabbaadd Sargodha Sahiwal Mean
A) Year
2004 179.26 189.92 a 192.04 187.07
2005 172.32 166.06 b 184.49 174.29
LSD 5% 14.25 12.93 14.89
Significance NS ** NS
B) Hybrids
H1 = Bemasal-202 178.32 a 177.94 ab 192.67 a 182.98
H2 = Monsanto-919 155.76 b 167.21 b 174.52 b 165.83
H3 = Pioneer-31-R-88 193.29 a 188.82 a 197.61 a 193.24
LSD 5% 16.88 14.85 18.10
Significance ** * *
C) Nitrogen Levels
N1 = 150 kg ha-1 165.68 d 166.53 d 174.18 c 168.80
N2 = 200 kg ha-1 172.26 c 172.19 c 180.60 c 175.02
N3 = 250 kg ha-1 175.98 bc 178.63 b 191.14 b 181.92
N4 = 300 kg ha-1 184.21 a 188.48 a 199.08 a 190.59
N5 = 350 kg ha-1 180.93 ab 184.12 a 196.33 ab 187.13
LSD 5% 5.96 5.40 6.56
Signific
** **
* *
Cubic NS
ance ** ** **
Linear **
Quadratic NS
* NS
Interaction NS NS NS
Mean 175.79 177.99 188.27
Means sharing different letters in a column differ significantly at P = 0.05 *, ** = Significant at 5% and 1%, respectively, NS = Non-significant
48

4.2.
Table 4.4 presents the effect of treatments on number of days to 50 % tasseling.
h seasons had e e l sta ever,
0.59 % more days for 50 % tasseling (49.2 vs 48.9) in 2005 as compared to
Effect of cultivars o to 50 % t was found highly significant on all
similar trend; Monsanto-919 took maximum days (52) followed by Bemasal-
eer 31-R-88 t ook 48 days h. These results are in agreement with
(2002) and masood et al. (2003) who had also reported variation in days to
50 % tasseling among different hybrids.
ar at all loc tions. Max m days to 50 %
ent (300 kg N ha
5 (350 kg N ha ) which took 50 % tasseling in 50.25 days after
treatment (250 kg N ha-1) took 48.95days to tasseling that was significantly
dard rate N2 (200 kg N ha-1) which took 48.29 days. Statistically
tasseling (47.34) were taken in plots that were fertilized with150
The proba ould rog anc etative
elayed repr ge. S w ort asood
hile contr M ) itrogen
ed flowerin plan act mo factors
statistically ant.
erage number of to tasselin were higher at Sahiwal (50) followed by
and Faisalaba 8).
ys to 50 % Silking
n values of the in Table 4.5 wed the e of treatm nts on no of
50 % silking. Seas Faisalabd nd Sargodha
significant at S al location, e silking o ed one day arlier (55 vs
ing 2004 as compared to 2005.
ilar
no of days to 50 % silking (56) followed
ok 54 days. Statistically minimum days to 50 % silking (53) were
2 Days to 50 % Tasseling
Climate of bot no significant ffect on this d velopmenta ge. How
plants took
2004.
n days asseling
sites with
202 and Pion hat t eac
Younas et al.
Fertilizer levels respon
tasseling (50.49) were taken by crop sown with N
se was line a imu
4 treatm -1) that was at
par with treatments N -1
sowing. N3
more as compared to stan
minimum days to 50 %
kg N ha-1 (N1). ble reason c be that nit en had enh ed veg
growth, which d oductive sta imilar results ere also rep ed by M
et al., (2003) w adictory with ohsan (1999 who reported that n
deficiency delay g in maize ts. The inter ive effects a ng all
were found to be non signific
Av days g
Sargodha (49) d (4
4.2.3 Da
Mea data sho ffects e
days to onal effects were non significant at a
while highly ahiw wher ccurr e
54) dur
Effect of cultivars on days to 50 % silking was highly significant with sim
trend at all sites, Monsanto-919 took maximum
by Bemasal-202 that to
49

T
able 4.4: Effect of cultivars and fertilizer levels on days to tasseling (days)
Treatment FFaaiissaallaabbaadd Sargodha Sahiwal Mean
A) Year
2004 48.46 48.27 50.03 48.92
2005 47.88 49.62 50.13 49.21
LSD 5% 2.17 2.30 0.29
Significance NS NS NS
B) Hybrids
H1 = Bemasal-202 48.10 b 48.03 b 47.60 b
47.91
H2 = Monsanto-919 50.06 a 51.04 a 53.69 a 51.59
H = Pioneer-31-R-88 3
LSD 5%
46.36 c 47.77 b 48.96 b 47.70
1.50 1.58 1.59
Significance ** ** **
C) Nitrogen Levels
N1 = 150 kg ha-1
-1 46.72 d 47.36 d 47.94 c 47.34
N2 = 200 kg ha-1
47.54 c 47.93 cd 49.42 b 48.29
N3 = 250 kg ha-1
48.14 bc 48.80 bc 49.92 b 48.95
N4 = 300 kg ha-1
49.30 a 50.68 a 51.50 a 50.49
N5 = 350 kg ha 49.15 ab 49.96 ab 51.65 a 50.25
Cubic NS NS NS
Interaction NS NS NS
LSD 5% 1.24
Significance ** ** **
Linear ** ** **
Quadratic NS NS NS
Mean 48.17 48.94 50.08
Means sharing different letters in a column diffe% and 1%, respectively
r significantly at P = 0.05 *, ** = Significant at 5NS = Non-significant
50

Table 4.5: Effect of cultivars and fertilizer levels on days to silking (days)
Treatment FFaaiissaallaabbaadd Sargodha Sahiwal Mean
A) Year
2004 54.09 53.72 54.83 a 54.21
2005 53.53 54.78 54.13 b 54.15
LSD 5% 2.76 2.73 0.86
Significance NS NS **
B) Hybrids
H1 = Bemasal-202 53.58 b 53.32 b 53.53 b 53.48
H2 = Monsanto-919 55.25 a 56.14 a 56.55 a 55.98
H3 = Pioneer-31-R-88 52.60 b 53.29 b 53.38 b 53.09
LSD 5%
** **
C) Nitrogen Levels
1.59 1.82 1.62
Significance **
N1 = 150 kg ha-1 52.02 c 52.48 c 52.71 c 52.40
53.06 bc 53.39 bc 53.79 bc 53.41
3 = 25
Linear
N2 = 200 kg ha-1
N 0 kg ha-1 53.89 ab 54.37 ab 54.50 ab 54.25
N4 = 300 kg ha-1 55.07 a 55.51 a 55.67 a 55.42
N5 = 350 kg ha-1 55.02 a 55.51 a 55.75 a 55.43
LSD 5% 1.50 1.52
Significance ** ** **
** ** **
Quadratic NS NS NS
Cubic NS NS NS
Interaction NS NS NS
Mean 53.81 54.25 54.48
Means sharing different letters in a column differ significantly at P = 0.05 *, ** = Significant at 5% and 1%, respectively NS = Non-significant
51

recorded in case of Pioneer-31-R-88. These results are in agreement with Younas et al.
002) and Ahmadani (2004) who ty among hybrids to attain
er levels response to silking was line ll
Maximum days to 50 % silking (55) were taken by treatment (350 kg N ha-1)
s at par with treatm 0 kg N N3 (250 kg N ha-1 took 55
nd 54 days respectiv er a to ard rate
g N ha-1) where ys were rec Statistica nimum days to 50 %
ere taken in p that were fertilized with150 kg N ha-1 (N1). These results
the findings of Rasheed et al., (2004) who concluded that luxury
ients e numb days to 50 . T eractive
ors we be sta lly non sig
r of king were higher at 5) wed by
ndex
steadily nd rea um value at 55 DAS at all the
er LAI de l the tr d rea im alues at
o 2.5 by igs.4. Such n L as more
er N leve 200 K omp N s due to
scence of leaves in former as compared to the latter.
ason had sign nt effect on m mum LAI at all the location, throughout
th (Table 4.6). Crop had greater LAI in 2005 as compared to 2004 and maximum
hed at 4.74, 4.66 and 4.60 at Fais bad, Sargodha and Sahiwal respectively.
ent LAI values were 70, 4.71 and 4.29, respectively ((Table 4.6).
Cultivar differences in maximum LAI development were non-significant at
Sargodha and Significant at Faisalabad and Sahiwal. Av
m LAI value (4.6 as registere hybrid Pioneer-31-R-88 that was
um LAI (4.58)
(2 also reported variabili
flowering.
Fertiliz ar and highly significant at a
locations.
that wa ents N4 (35 ha-1) and ) that
days a ely that was significantly high s compared stand
N2 (200 k 53 da orded. lly mi
silking (52) w lots
substantiate
consumption of nutr nhanced the er of % silking he int
effects among all fact re found to tistica nificant.
Average numbe days to sil Sahiwal (5 follo
Sargodha (54) and Faisalabad (54).
4.3. GROWTH
4.3.1. Leaf Area I
LAI values increased a ched at maxim
locations; thereaft clined in al eatments an ched its min um v
less as compared t 105 DAS (F 2 and 4.3). reduction i AI w
pronounced at low ls (150 and g ha-1) as c ared to high level
early sene
The se ifica axi
the grow
values reac ala
Equival 4.
eraged over locations the
maximu 7) w d from
statistically at par with hybrid Bemasal-202 that had LAI 4.59. The minim
was recorded in case of Monsanto-919.
52

Table 4.6: Effect of cultivars and fertilizer levels on maximum leaf area index at 55 days after sowing
Treatment FFaaiissaallaabbaadd Sargodha Sahiwal Mean
A) Year
2004 4.70 b 4.71 a 4.29 b 4.30
2005 4.74 a 4.66 b 4.60 a 4.42
LSD 5% 0.01 0.001 0.02
Significance ** ** **
B) Hybrids
H1 = Bemasal-202 4.85 a 4.73 4.63 a 4.59
H2 = Monsanto-919 4.56 b 4.59 4.16 b 4.58
H3 = Pioneer-31-R-88 4.75 ab 4.74 4.55 a 4.67
LSD 5% 0.24 0.24 0.23
Significance * NS **
C) Nitrogen Levels
N1 = 150 kg ha-1 4.04 d 3.96 d 3.80 d 3.93
N2 = 200 kg ha-1 4.41 c 4.36 c 4.18 c 4.32
N3 = 250 kg ha-1 4.85 b 4.81 b 4.52 b 4.73
N4 = 300 kg ha-1 5.20 a 5.19 a 4.87 a 5.09
N5 = 350 kg ha-1 5.11 a 5.12 a 4.84 a 5.02
LSD 5% 0.20 0.19 0.18
Significance ** ** **
Linear ** ** **
Quadratic ** * **
Cubic * * NS
Interaction NS NS NS
Mean 4.72 4.69 4.46
Means sharing different letters in a column differ significantly at P = 0.05 *, ** = Significant at 5% and 1%, respectively NS = Non-significant
53

(b)
Leaf
are
a in
dex
-0.50.00.51.01.52.02.53.03.54.04.55.0
(c)
Days after sowing
0 10 20 30 40 50 60 70 80 90 100 110
Leaf
are
a in
dex
-0.50.00.51.01.52.02.53.03.54.04.55.0
Bemasal-202Monsanto-919Pioneer-31-r-88LSD
(a)
Leaf
are
a in
dex
-0.50.00.51.01.52.02.53.03.54.04.55.05.5
Fig 4.2: Change in pooled leaf area index of three cultivars with time at (a) Faisalabad (b) Sargodha and (c) Sahiwal; Bars represent LSD at 5%
54

(b)
Leaf
are
a in
dex
-0.50.00.51.01.52.02.53.03.54.04.55.0
150 kg N ha-1
200 kg N ha-1
250 kg N ha-1
(c)
Days after sowing
0 10 20 30 40 50 60 70 80 90 100 110
Leaf
are
a in
dex
-0.50.00.51.01.52.02.53.03.54.04.55.0
300 kg N ha-1
350 kg N ha-1
LSD
(a)Le
af a
rea
inde
x
-0.50.00.51.01.52.02.53.03.54.04.55.05.5
Fig 4.3: Change in pooled leaf area index with time in response five nitrogen levels at (a) Faisalabad (b) Sargodha and (c) Sahiwal; Bars represent LSD at 5%
55

Maximum LAI was significantly affected by nitrogen levels at all sites. The trend
at all sites. (Fig.4.3 a, b, c). Averaged over locations Pea
as also similar k LAI reached
to a value 5.09 at 55 DAS in the N4 (300 kg N ha-1) treatments that at par with N5 (350 kg -1 -1
had max N ha )
AI (3.93) was recorded in N1 (150 kg N ha). Greater LAI could be attributed to
leaf expansion i.e. length and breadth due to high N levels.
Greater
ig.4.2 and
4.3).
gs. 4.4 & 4.5). Year effect on TDM accumulation of
maize
in the N4 (300 kg N ha ) treatments that at par with N5 (350 kg N ha )
treatme -2
-1 ximum TDM (1784 g m ) that was statistically greater as
compar -1
-2 (1524 g m ) was recorded in N1 (150
n TDM with higher level of nitrogen was due to better crop
w
N ha ) treatments at all locations that gain maximum LAI (5.02). N3 (250 kg N ha ) treat
imum LAI (4.73) that was statistically greater as compared to N2 (200 kg -1
the standard treatment producing maximum LAI (4.32). Statistically minimum value for
peak L
significant increases in
leaf expansion in maize was ascribed to higher rate of cell division and cell
enlargement by Wright (1982). Promotive effect of N on LAI of maize has been reported
by Bangarwa et al. (1988) and D’Andrea et al. (2006) Generally LAI increased up to 55
DAS when tasseling was started thereafter, LAI declined until final harvest (F
4.3.2. Total Dry Matter Accumulation
Total dry matter (TDM) production increased steadily after crop establishment
until maturity in all the treatments (Fi
was significant. The crop accumulated more TDM during 2005 as compared to
2004. Cultivars significantly affected TDM at all sites (Fig 4.4).Hybrid Bemasal-202 and
Pioneer 31-R-88 accumulated statistically non significant TDM through out the season,
while hybrid Monsanto-919 accumulated statistically lesser TDM as compared to other
hybrids. Averaged overall locations, maximum TDM was 1798 gm-2 accumulated by
Bemasal-202 followed by Pioneer-31-R-88 that produced TDM 1758 g m-2 as compared
to 1682 gm-2 by Monsanto-919 at final harvest (105 DAS).
Generally TDM production responded positively to N application. Figure 4.5
showed that averaged over locations maximum TDM accumulated to a value 1891 g m-2
at 105 DAS -1 -1
nts at all locations that accumulated maximum TDM (1868 gm ). N3 (250 kg N
ha ) treatment produced ma -2
ed to N2 (200 kg N ha ) the standard treatment producing maximum TDM (1665
g m ). Statistically minimum value for final TDM -2
-1kg N ha ). The increase i
56

(b)
Tota
l dry
mat
ter (
g m
-2)
0
200
400
600
800
1000
1200
1400
1600
1800
(c)
Days a wingfter so
0 10 20 3 40 50 60 70 90 1 1100 80 00
Tota
l dry
mat
ter (
g m
-2)
0
200
400
600
800
1000
1200
1400
1600
1800
Bemasal-202Monsanto-919Pioneer-31-R-88LSD
(a)
Tdr
y m
er (g
m
0
400
800
00
00
1600
1800
2000
-2)
12
14
1000att
200
600
otal
ange in pooled t dry matter o e cultivars h time at (a) Faisalabad (b) Sargodha and (c) Sahiwal; D at 5%
Fig 4.4: Ch otal f thre witBars represent LS
57

(b)
Tota
l dry
mat
ter (
g m
-2)
0200400600800
10001200140016001800
150 kg N ha-1
200 kg N ha-1
250 k -1g N ha
(c)
Days after sowing
0 10 20 3 0 80 9 000 40 5 60 70 0 1 110
Tota
l dry
mat
ter (
g m
-2)
0200400600800
100120
00
140016001800
300 kg N ha-1
350 kg N ha-1
LSD
(a)T
-2)
otal
dry
mat
ter (
g m
200
18001600
2000
14001200
8001000
400600
0
5: Change in pooled t dry matter wi e in response of five nitrogen levels at (a) Faisalabad (b) Sargodha and (c) Sahiwal; Bars re ent LSD at 5%
Fig 4. otal th timpres
58

growth, which gave maxim lant height, L nd ultimately produced more biological
yield.
Cob Girth (cm)
icant at cob girth. Average
d greater cob girth in 2005 as compared to 2004. The values were
cm respectively in 2005.
register
3 (250 kg N ha-1) had 4.43 cm cob girth that was
significantly higher as compared to standard rate N2 (200 kg N ha-1) which produced cobs
nimum cob girth (4.11 cm) was recorded in plots that
ha-1 (N ). These results substantiate the findings of Rasheed
et al., (
ificant.
. Cultivars had significant effect of on
cob leng
um p AI a
4.3.3.
Table 4.7 indicated that seasonal effect was non signif
over locations Crop ha
4.41, 4.46 and 4.37 cm at Faisalabad, Sargodha and Sahiwal respectively in 2004.
Equivalent cob girth values were 4.37, 4.43 and 4.40
Significant effect of cultivars was observed on cob girth at all locations. Average
over the locations Pioneer-31-R-88 had maximum cob girth (4.64 cm) followed by
Bemasal-202 that gave 4.32 cm, while statistically minimum cob girth (4.26 cm) was
measured in case of Monsanto-919.
Fertilizer levels response was highly significant at all locations. It was quadratic
at the Faisalabad and Sargodha sites, while linear and cubic responses of N were
observed at Sargodha site. Average over locations the maximum cob girth (4.62 cm) was
ed in treatment N4 (300 kg N ha-1) which was at par with treatments N5 (350 kg N
ha-1) that had cob girth (4.55 cm). N
with girth 4.33 cm. Statistically mi
were fertilized with150 kg N 1
2004) who concluded that increasing level of nitrogen significantly increased cob
girth (cm).
The interactive effect between cultivars and nitrogen levels were found to be
statistically non sign
Over all average plants produced cobs with girth (4.44 cm) at Sargodha location
as compare to Sahiwal and Faisalabad (4.39 cm).
4.3.4 Cob Length (cm)
Data regarding cob length (Table 4.8) indicated that year effect was non
significant on cob length. Averaged over locations, crop produced cobs with length 19.25
cm and 19.15 cm in 2004 and 2005 respectively
th at all locations; Bemasal-202 produced maximum cob length (19.51 cm)
59

T
T
able 4.7: Effect of cultivars and fertilizer levels on cob girth (cm) at maturity
reatment FFaaiissaallaabbaadd Sargodha Sahiwal Mean
A) Year
2004 4.41 4.46 4.37 4.41
2005 4.37 4.43 4.40 4.40
0.1LSD 5% 0.17 7 0.16
Sig
B) Hybrids
nificance NS NS NS
H = Be1 masal-202 4.34 b 4.41 b 4.20 b 4.32
Significance ** ** **
H = Monsanto-9192 4.28 b 4.21 c 4.29 b 4.26
H = Pioneer-31-R-88 3 4.55 a 4.70 a 4.67 a 4.64
LSD 5% 0.15 0.13 0.21
C) Nitrogen Levels
N1 = 150 kg ha-1
-1 4.06 c 4.17 c 4.11 d 4.11
N2 = 200 kg ha-1
4.39 b 4.27 c 4.32 c 4.33
N3 = 250 kg ha 4.45 ab 4.43 b 4.41 bc 4.43 -1 4.54 a 4.62 -1 4.52 a 4.63 a 4.50 ab 4.55
tion
N4 = 300 kg ha 4.71 a 4.60 a
N5 = 350 kg ha
LSD 5% 0.12 0.12 0.14
Significance ** ** **
Linear ** ** **
Quadratic ** NS **
Cubic NS ** NS
Interac NS NS NS
Mean 4.39 .44 39 4 4.
Means sharing different letters in a column differ significan nificant at 5% 1%, respectiv
on-significant
tly at P = 0.05*, ** = Sig and ely NS = N
60

Table 4.8: Effect of cul s and fertili vels on Co ngth (cm) a maturity
T ent llaabbaadd odha wal Mean
tivar zer le b le t
reatm FFaaiissaa Sarg Sahi
A) Year
2004 18.97 19.32 19.46 19.25
2005 18.44 19.32 19.68 19.15
LSD 5% 0.75 1.09 0.85
Significance NS NS NS
B) Hybrids
H1 = Bemasal-202 18.46 b 19.87 a 20.18 a 19.51
H2 = Monsanto-919 18.16 b 18.55 b 18.63 b 18.54
H3 = Pioneer-31-R-88 19.48 a 19.54 a 19.91 a 19.20
LSD 5% 0.88 0.92 0.93
Significance * * **
C) Nitrogen Levels
N1 = 150 kg ha-1 17.18 d 18.22 b 17.79 d 18.50
N2 = 200 kg ha-1 17.90 c 18.72 b 18.89 c 18.50
N3 = 250 kg ha-1 19.01 b 19.50 a 19.71 b 19.41
N4 = 300 kg ha-1 20.03 a 20.08 a 21.08 a 20.40
N5 = 350 kg ha-1 19.39 ab 20.08 a 20.40 ab 19.95
LSD 5% 0.66 0.64 0.69
Significance ** ** **
Linear ** ** **
Quadratic ** NS **
Cubic ** NS *
Interaction NS NS NS
Mean 18.70 19.32 19.57
Means sharing different letters differ significantly at P = 0.05 *, ** = Significant at 5% and 1%, respectively NS = Non-significant
61

followed by Pioneer-31-R-88 that gave 19.20 cm. Statistically minimum cob length
(18.54 cm) was measured in case of Monsanto-919.
Fertilizer levels response was highly significant at all locations. Maximum cob
length (20.40 cm) were given by N4 treatment (300 kg N ha-1) which was at par with
treatments N5 (350 kg N ha-1) that produced cobs with length (19.95 cm). N3 (250 kg N
ha-1) gave 19.41 cm that was significantly higher as compared to standard rate N2 (200 kg
N ha-1) during 2005 which gave 18.50 cm. Statistically minimum cob length (17.73 cm)
was given by plots that were fertilized with150 kg N ha-1 (N1). The interactive effect
between cultivars and nitrogen levels were found to be statistically non significant.
Over all, mean cob length was recorded 18.70, 19.32, and 19.57 cm at Faisalabad,
Sargodha and Sahiwal respectively.
4.4. ANALYSIS OF GROWTH
4.4.1. Leaf Area Duration
Table 4.9 presents the effect of treatments on cumulative leaf area duration (LAD)
at all the locations. The seasonal effect on LAD was significant at all locations. Averaged
over locations crop exhibited LAD 3 % (288 days vs 281 days) longer in 2004 as
compared to 2005.
Cultivar differences in LAD were significant at the Faisalabad and Sahiwal
locations where Bemasal-202 had longer LAD (294.84 and 284.76 days) that was at par
with Pioneer-31-R-88 that accumulated LAD (291.43 and 281.79 days). The minimum
values for LAD (281.89 and 264.96 days) were recorded from hybrid Monsanto-919.
While at Sargodha values for LAD were 285.30, 290.03 and 288.46 for Bemasal-202,
Monsanto-919 and Pioneer-31-R-88 respectively
N application affected the LAD in cubic manner at all locations. N4 treatment
(300 kg N ha-1) showed longer LAD that was at par with N5 at Sahiwal and statistically
higher at Faisalabad and Sargodha sites. Averaged over locations the maximum LAD
(
(3 s
ecorded for N3 (205 kg N ha-1) that was statistically higher as compared to standard level
of N (200 kg N ha-1) N2. The minimum value of LAD (225.11 days) was recorded from
327.37 days) was recorded from plots fertilized with of 300 kg N ha-1 followed by N5
50 kg N ha-1) that produced LAD (318.28 days). The LAD value 293.32 days wa
r
62

Table 4.9: Effect of cultivars and fertilizer levels on cumulative leaf area duration
(day)
Treatment FFaaiissaallaabbaadd Sargodha Sahiwal Mean
A) Year
2004 292.57 a 294.77 a 277.58 a 288.31
2005 286.21 b 281.09 b 276.76 b 281.35
LSD 5% 0.43 0.60 0.51
Significance ** ** *
B) Hybrids
H1 = Bemasal-202 294.84 a 285.30 284.76 a 288.30
H2 = Monsanto-919 281.89 b 290.03 264.96 b 278.96
H3 = Pioneer-31-R-88 291.43 ab 288.46 281.79 a 287.23
LSD 5% 9.72 9.40 7.49
Significance * NS **
C) Nitrogen Levels
N1 = 150 kg ha-1 229.11 e 227.67 e 218.54 d 225.11
N2 = 200 kg ha-1 263.78 d 263.06 d 253.36 c 260.07
N3 = 250 kg ha-1 298.49 c 296.97 c 284.51 b 293.32
N4 = 300 kg ha-1 333.02 a 331.18 a 317.91 a 327.37
N5 = 350 kg ha-1 322.54 b 320.77 b 311.53 a 318.28
LSD 5% 7.18 7.37 6.98
Significance ** ** **
Linear ** ** **
Q
Cubic
Interaction NS NS NS
uadratic ** ** **
** ** **
Mean 289.39 287.93 277.17
M*
eans sharing different letters in a column differ significantly at P = 0.05 , ** = Significant at 5% and 1%, respectively
NS = Non-significant
63

(a)
y2000
(b)
y = 2.7446x + 1006.4
0
1600
2000 = 3.3153x + 801.48
1200)
R2 = 0.88R2 = 0.94
1600
40
800
1200
TDM
(gm
-2)
400
800TDM
(gm
-2
00 100 200 300 400
Leaf area duration (days)
00 100 200 300 400
Leaf area duration (days)
Fig 4.6: Relationship between two years pooled final TDM and cumulative leaf area
duration at (a) Faisalabad (b) Sargodha (c) Sahiwal (d) pooled for all locations
(d)(C)
2000y = 4.8178x + 345.98
R2 =0.99
1500
y = 3.7555x + 676.62R2 = 0.86
1600
0
800
1200
2000
m-2
)
m-2
)
0
005
10
M (g
TDM
(g00
TD
400
0 100 200 300 400
Leaf area duration (days)
0 100 200 300 400
Leaf area duration (days)
64

(b)
y = 1.8111x + 234.75R2 = 0.59
0
100 200 300 400
rea dura ys)
(b)
y = 1.8111x + 234.75R
0
200
600
0 100 200 300 400
ration
m-2
)
1000 1000
2 = 0.59
400
ain
yi
800
00
200
Gr
40
ain
yi
600m-2
)
800
Leaf area du (days)
Gr
eld
(g
Leaf a tion (da
eld
(g
ulative LAD at (a)
Faisalabad (b) Sargodha (c) Sahiwal lo
(c)
y = 2.8931x - 103.36R2 = 0.90
100 200 0 400
Leaf area dura days)
(d)
y = + 65.8652 = 0.70
0
800
00
0 200 300 400
area duration (days)
-2)
0
200
400n yi
eld
600
(gm
800
1000
0 30
tion (
Gra
i-2
)
2.3228xR
200
400
Gra
in
600
(gm
10
100
Leaf
yie
ld
Fig 4.7: Relationship between two years pooled grain yield and cum
cations (d) pooled for all locations
65

treatme
0. 99**) and
Pooled
iation (Fig. 4.7),
m-2 d-1 to 2.89 g m-2 d-1 grain yield was produced. Similar
results
represents the net photo
nimum NAR
nt N1 (150 kg N ha-1) that was below standard rateN2. Averaged over the sites,
mean cumulative LAD was 289, 288 and 277 days at Faisalabad, Sargodha and Sahiwal
respectively.
Interaction between year and cultivar was significant at Faisalabad and Sahiwal
sites (Table 4.9).
Differences in TDM or grain yield in response to agronomic treatments may or
may not be explained by differences in their maximum LAIs. Therefore, variations in
yield between treatments are sometimes accounted for leaf area duration (LAD).To
examine the importance of photo synthetic surface (area) during growth (planting to
maturity) LAD values were calculated (Table 4.9).
The relationship between final TDM and LAD (Fig. 4.6) was significant and
positive at Faisalabad (R2 = 0.94**), Sargodha (R2 = 0.88**), Sahiwal (R2 =
for all locations (R2 = 0.86**). Grain yield and LAD was also linearly related at all
the sites, and the regression accounted for 63, 59, 90 and 99 % of the var
showing that about 1.81 g
were reported for cereals.
The relationship between TDM or grain yield and LAD will, however, depend on
climatic conditions prevailing during a particular season, thus making it difficult to
generalize over different sites and seasons (Monteith, 1981).
4.4.2. Net Assimilation Rate
The average net assimilation rate (NAR) of a crop
synthetic production per unit LAD (Hunt, 1978).
The year affected the average NAR at Sargodha and Sahiwal but not at Faisalabad
(Table 4.10). Averaged over all sites, mean NAR was 8.12 % (6.39 vs 5.91 g m-2 d-1)
higher in 2005 as compared to 2004.
Cultivar differences in average NAR were also significant at Sargodha and
Sahiwal where hybrid Bemasal-202 had maximum NAR (6.53 g m-2 d-1 & 6.11 g m-2 d-1)
followed by hybrid Pioneer-31-R-88 (6.38 & 6.09 g m-2 d-1 ). The mi
exhibited by hybrid Monsanto-919 that was 6.07 g m-2 d-1 and 5.67 g m-2 d-1 at Sargodha
and Sahiwal, respectively (Table 4.10).
66

Table 4.10: Effect of cultivars and fertilizer levels on net assimilation rate (g m-2 -1)
ent FFaaiissaallaabbaadd Sargodha Sahiwal Mean
d
Treatm
A) Year
2004 5
a 6.39
5 4
e NS ** **
6.07 5.97 b 5.70 b .91
2005 6.29 6.69 6.21 a
LSD 5% 0.2 0.3 0.13
Significanc
B) Hybrids
H = Bemasal-202 1
H = Monsanto-919
6.28 6.53 a 6.11 a 6
5
neer-31-R-88 ab 6.23
6
NS * *
evels
.31
2
H
6.05 6.07 b 5.67 b .93
3 = Pio 6.21 6.38 6.09 a
LSD 5% 0.51 0.3 0.29
Significance
C) Nitrogen L
N = 150 kg ha-11
N = 200 kg h -1
6.84 a 7.11 a 6.08 6.68
a 5.93 6
a 6
a 5-1 5.93 5.89
0.34
NS
**
**
ction
2
N = 250 kg h -1
6.46 b 6.66 b .35
3
N = 300 kg h -1
6.05 c 6.21 c 5.94 .07
4
N = 350 kg ha
5.72 c 5.77 d 5.90 .79
5 5.83 c 5.89 cd
LSD 5% 0.08 0.33
Significance ** **
Linear ** **
Quadratic ** **
Cubic NS NS NS
Intera NS NS NS
Mean 6.18 6.33 5.96
Means sharing different letters in a column differ significantly at P = 0.05 , ** = Significant at 5% and 1%, respectively S = Non-significant
*N
67

N application at different levels significantly affected NAR at Faisalabad and
Sargodha. Differences among N levels were, however, non-significant at Sahiwal.
Averaged over locations maximum NAR (6.68) was recorded from treatment N1 (150 kg
N ha-1) followed by N2 (200 kg N ha-1) that had NAR 6.35 g m-2 d-1.Nitrogen levels (N3,
N4 and N5) higher as compared to standard level N2 exhibited statistically lesser NARs
6.07, 5.79, and 5.89 g m-2 d-1 respectively, however these values were statistically at par
site, crop had 10 % higher
cant at Sahiwal site where cv.
emasa
mum mean CGR (21.37 g m-2 d-1) was
with one another. Lesser levels of nitrogen produced lesser LAI that might have ensured
more light penetration in to the crop canopy which in turn cause high rate of
photosynthesis. Besides more light penetration into the crop canopy might have
suppressed the respiratory losses as enzymes responsible for respiration are less active in
illuminated environment. Thus an increase in the rate of photosynthesis and reduction in
respiratory losses probably resulted in high NAR at lower level of nitrogen.
Averaged over the locations, mean values of NAR were 6.18 g m-2 d-1, 6.33 g m-2
d-1 and 5.96 g m-2 d-1 at Faisalabad, Sargodha and Sahiwal, respectively.
4.4.3. Crop Growth Rate
Table 4.11 showed the effect of treatments on mean crop growth rate (CGR).
Seasonal effect was differentially significant at all location; mean CGR was higher 7 %
(20.48 vs 19.21 g m-2 d-1) and 14 % (19.74 vs 17.38 g m-2 d-1) in 2005 at Sargodha and
Sahiwal locations respectively in contrast at the Faisalabad
CGR (21.47 vs 19.49 g m-2d-1) in 2004. Averaged over locations crop had 3 % higher
CGR (19.90 vs 19.35 g m-2d-1) in 2005 as compared to 2004.
Cultivar differences in mean CGR were non-significant at Faisalabad and
Sahiwal. However cultivar differences were signifi
B l-202 out performed and showed higher mean CGR (19.17 g m-2 d-1) that was
statistically at par with hybrid Pioneer-31-R-88 which grew with mean CGR (18.51 g m-2
d-1). The minimum mean CGR (18.00 g m-2 d-1) was recorded in case of hybrid
Monsanto-919. Averaged over the sites, mean CGR was 20.18 g m-2 d-1 in hybrid
Bemasal-202, 19.70 g m-2 d-1 in cv. Pioneer-31-R-88 and (Table 4.11).
At all sites, N application significantly enhanced mean CGR over standard level
of N (200 kg N ha-1). Differences among N levels were also significant at all the locations
(Table 4.11). Averaged over the locations, maxi
68

T ble 4.1
Treatment FFaaiissaallaabbaadd Sargodha Sahiwal Mean
a 1: Effect of cultivars and fertilizer levels on mean crop growth rate (g m-2 d-1)
A) Year
2004 21.47 a 19.21 b 17.38 b 19.35
2005
ance ** * **
B) Hyb
19.49 b 20.48 a 19.74 a 19.90
LSD 5% 0.34 0.96 0.29
Signific
rids
H1 = Bemasal-202 21.07 20.31 a 19.17 a 20.18
H2 = Monsanto-919 19.82 19.18 b 18.00 b 19.00
H3 = Pioneer-31-R-88 20.54 20.05 ab 18.51 ab 19.70
LSD 5% 1.75 1.06 0.73
Significance NS * *
C) Nitrogen Levels
N1 = 150 kg ha-1 17.69 d 17.85 c 15.43 d 16.99
N2 = 20
1.00
Signific
Interaction
0 kg ha-1 19.75 c 19.25 b 17.24 c 18.75
N3 = 250 kg ha-1 20.78 b 20.25 a 19.08 b 20.03
N4 = 300 kg ha-1 22.40 a 21.05 a 20.66 a 21.37
N5 = 350 kg ha-1 21.78 a 20.82 a 20.39 a 21.00
LSD 5% 0.94 0.92
ance ** ** **
Linear ** ** **
Quadratic ** ** **
Cubic NS NS NS
NS NS NS
Mean 20.48 19.84 18.56
Means sharing different letters in a column differ significantly at P = 0.05 *, ** = Significant at 5% and 1%, respectively NS = Non-significant
69

recorded in plots fertilized with 300 kg N ha-1 i.e. N4 that was statistically at par with
N5(350 kg N ha-1 ) growing R -1 sow 3 level
of nitrogen (250 kg N ha-1) grew with mean CGR (20.03 g m d ) that was statistically
ompared to standard rate of nitrogen N2 (200 kg N ha -1 ) that exhibited the
f mean CGR18.75 g d-1 . The m m mean (16.99 g -1) was
d in plots fertilized with 150 kg N ha-1
expound the fact rmining grain yield in different treatments, the plant
xamined thro ut the seaso rowth ana showed t t treatment
AD, NAR and CGR were associated with those in final grain yield (Table
Figs.4. ). TDM p ion durin wth espe before
red imp t for determ n of num f grains it land
orie the tre as cultivar and
aving higher LAD R during owth pr a great r number of
it area, and tr ents like les N levels, h g lower LAD or CGR
roduced small number of grains per cob as well as per unit area.
re reported hearman et 005) Tak l. (2006) and, working
ize. D’An t al. (2008 noted sim ffects in . Thus,
rge sink ay be a prerequisite through high TDM production
y be a pre ite for a hig ain yield.
to the d pment of sink org large am of non
carbohydrates (N cumulated g growt have e isted in the
ate and could bute to incr grain filli nd thus fin l grain yield
its translocation to g (Takai et al 06).
mentioned abov was sugges that a hig CGR during flowering
s) may be prerequisite to attain a hi grain yiel
ents during the period ma ave resulted from the variation in
environmental conditions. In particular, radiation directly influences the plant biomass
ani, 1985). Interestingly, there was
n the amount of intercepted radiation among treatments during the
rowth period. Thus, differences in CGR could be ascribed to variations in the amount of
tercepted light as well as its efficiency of use.
with mean CG (21.00 g m-2 d ). The crop-2 -1
n at N
higher as c
value o m-2 inimu CGR m-2 d
recorde (N ). 5
To ors dete
growth was e ugho n. G lysis ha
differences in L
4.9, 4.10, 4.11 and 6, 4.7 roduct g gro cially
flowering is conside ortan inatio ber o per un
area as sink capacity (H et al., 2003). In this study, atments such
N levels h or CG the gr oduced e
grains per un eatm ser avin
values during growth p
Similar results we by S al. (2 ai et a
on wheat and Ma drea e ) also ilar e maize
achievement of la size m
during growth, ma requis her gr
In addition evelo large an, a ount
structural SC) ac durin h may x
mobilizable st contri eased ng a a
through rains ., 20
As e, it ted her
(anthesi gher d. Thus differences in CGR
among treatm y h
production (Monteith, 1977; Horie and Sakurat
significant difference i
g
in
70

Generally, CGR is composed of RUE, Sa, K and LAI. Among these components a
gnificant difference was clearly observed in RUE during growth (Table 4.29).
ONENTS OF GRAIN YIELD
lant Population m-2
Seasonal effect on tion vest on sign at all
nd it was 6.93 an plants m-2 g 2004 a 5, respe ively (Table
differences in plant population m-2 were non-significant. Average over the
n plant population m-2 wa hyb
els of n did gnificantly plant population m-2
rage mean ed o 6 ts m-2
tments with gran -2 at Sargodha and 6.93 m-2 at
Sahiwal. Sim plant densiti mong treatm s were pos bly because
ination and less mortality rate.
grain row -1
ber of grain rows per
cobs got m 2004 while equivalent value was (13.90)
during 2005. However, seasonal eff
Sahiwal was found non significant. Mean va
during 2004 and 2005 respectively (Table 4.13).
ber of grain rows cob-1 were highly significant at all
experimental sites. Pioneer-31-R-88 produced maximum grain rows 15.66 followed by
Be -1. Minimum -1 (13.71)
were noted in case of Monsanto-919. These results are in ag ent with Younas et al.
(2002) who also reported that 15 rows were recorded from Pop-9815 followed by Pop-
ernel rows 14 reatment (300 kg N ha-1), which was statistically at par
tment (350 kg N ha l locations roduced ), N3 (250 kg N ha-1),
2 (200 kg N ha-1) producing 14.48, 14.16 grain rows cob-1 respectively. Statistically
were fertilized
ntiate the findings of Mohsan (1999) who
si
4.5. COMP
4.5.1. P at harvest
plant popula m-2 at har was n ificant
locations a d 6.90 durin nd 200 ct
4.12).
Hybrid
three locations, mea s 6.92 in all rids.
Increasing lev itrogen also not affect si
at the final harvest. Ave d over sites values rang from 6.91 t .92 plan
in all trea d mean value of 6.90 m
Faisalabad and ilar es a ent si
of gap filling after germ
4.5.2. Number of s cob
Year effect on num cob was significant at Faisalabad where
ore no of grain rows (14.85) in
ect on number of grain rows cob-1 at Sargodha and
lues over location were 14.57 and 14.27
Hybrid differences in the num
masal-202 that produced 13.88 grain rows cob grain rows cob
reem
9864 having k .50. T
with trea -1) at al , that p (14.70
N
minimum number of grain rows cob-1 (13.79) was produced in plots that
with 150 kg N ha (N-11). These results substa
71

Table 4.12: Effect of cultivars and fertilizer levels on plant population m-2 at harvest
Treatment FFaaiissaallaabbaadd Sargodha Sahiwal Mean
A) Year
2004 6.96 6.90 6.94 6.93
2005 6.89 6.89 6.93 6.90
LSD 5% 0.072 0.59 0.03
Significance NS NS NS
B) Hybrids
H1 = Bemasal-202 6.93 6.90 6.92 6.92
H2 = Monsanto-919 6.93 6.89 6.94 6.92
H3 = Pioneer-31-R-88 6.93 6.89 6.94 6.92
LSD 5% 0.031 0.031 0.027
Significance NS NS NS
C) Nitrogen Levels
N1 = 150 kg ha-1 6.92 6.90 6.94 6.92
N2 = 200 kg ha-1 6.93 6.91 6.93 6.92
N3 = 250 kg ha-1 6.94 6.90 6.93 6.92
N4 = 300 kg ha-1 6.92 6.90 6.95 6.92
N5 = 350 kg ha-1 6.92 6.88 6.93 6.91
LSD 5% 0.055 0.055 0.045
Significance NS NS NS
Linear NS NS NS
Quadratic NS NS NS
Cubic NS NS NS
Interaction NS NS NS
Mean 6.93 6.90 6.93
NS = Non-significant
72

Tabl
FF S Sa Me
e 4.13: Effect of cultivars and fertilizer levels on number of grain rows cob-1
Treatment aaiissaallaabbaadd argodha hiwal an
A) Year
2004 1 1 14 4.
1 1 14 14.
0 0 0.
* N NS
B) Hybrids
4.85 a 4.60 .25 1 57
2005 3.90 b 4.28 .63 27
LSD 5% .59 .33 59
Significance S
H1 = Bemasal-202 1 14.02 b 13 13.
1 13.85 b 13 13.
1 15.44 a 15 5.
0 0 0.
* * **
4.00 b .63 b 88
H2 = Monsanto-919 3.33 b .95 b 71
H3 = Pioneer-31-R-88 5.79 a .75 a 1 66
LSD 5% .71 .76 72
Significance * *
C) Nitrogen Levels
N1 = 150 kg ha-1 1 1 3 .
1 1 14 4.
1 1 14 14.
1 1 15 14.
1 1 14 14.
0 0.44 0.41
* * **
* ** **
N * NS
N NS NS
NS NS NS
3.80 c 3.70 c 1 .88 c 13 79
N2 = 200 kg ha-1 4.21 b 4.19 b .09 c 1 16
N3 = 250 kg ha-1 4.35 b 4.55 ab .53 b 48
N4 = 300 kg ha-1 4.90 a 4.96 a .02 a 96
N5 = 350 kg ha-1 4.60 ab 4.79 a .70 ab 70
LSD 5% .41
Significance * *
Linear *
Quadratic S
Cubic S
Interaction
Mean 14.37 14.44 14.44
r significantly at P = 0.05 Means sharing different letters in a column diffe
*, ** = Significant at 5NS = Non-significant
% and 1%, respectively
73

concluded increasing levels of nitrogen enhanced the number of grain rows cob-1 and
reported that 14.10 grain rows cob-1 was recorded at 300 kg N ha-1.
Overall mean values for the number of grain rows cob-1 were 14.37 at Faisalabad
and 14.44 at Sargodha and Sahiwal.
4.5.3. Number of grains cob-1
Number of grains per cob is an important parameter which contributes materially
towards final grain yield in maize. It is evident from Table 4.14 that year effect on
number of grains cob-1 was highly significant at all locations. Averaged over location
number of grains cob-1 was more (429.93) in 2005 as compared to equivalent value
(364.28) in 2004. The probable reason was excellent growth of crop due to favourable
climatic condition, as all experimental sites had more rainfall 160, 219 and 242 mm at the
Faisalabad, Sargodha and Sahiwal during 2005 as compared to 2004 when equivalent
value were 134 ,148 and 182 mm respectively.
Hybrid differences in the number of grains cob-1 were significant at Faisalabad
and Sahiwal while found non significant at Sargodha. The higher number of grains cob-1
was produced by hybrid Bemasal-202 (407.27) followed by Pioneer-31-R-88 that
produced 404.09 grains cob-1. Minimum number of grains cob-1 (379.95) was recorded in
case of Monsanto-919. The possible cause could be the genotypic contrast in response of
number of grains cob-1 to plant growth rate under different N regimes as reported by D’
Andrea et al. (2008). These results are also in agreement with Ahmadani (2004) who also
reported that 360 grains cob-1 was recorded from R-2210 followed by RH-2310 having
311 kernels cob-1.
Fertilizer levels response was highly significant at all locations. Response of
nitrogen rate was quadratic at Faisalabad and Sahiwal while it was linear at Sargodha.
Maximum number of grains cob-1(429.56) were produced in N4 treatment (300 kg N ha-1)
which was at par with treatments N5 (350 kg N ha-1) which produced 426.05 grains cob-1,
N3 (250 kg N ha-1) treatment produced 378.69 grains cob-1 that statistically more as
Stat ere
rtilized with150 kg N ha-1 (N1). The probable reason for lesser grain number cob-1 was
N deficiency which reduced biomass production traits (i.e. leaf area, light capture, and
compared to standard treatment N2 (200 kg N ha-1) that produced 378.69 grains cob-1.
istically minimum number of grains cob-1 (346.08) was produced in plots that w
fe
74

Table 4.14: Effect of cultivars and fertilizer levels on number of grain cob-1
Treatment FFaaiissaallaabbaadd Sargodha Sahiwal Mean
A) Year
2004 395.11 b 345.71 b 352.02 b 364.28
2005
2.54
Signifi
436.61 a 419.96 a 433.22 a 429.93
LSD 5% 7.77 30.34
cance ** ** **
B) Hybrids H1 = Bemasal-202 409.77 b
378.86 433.18 a 407.27
H2 = Monsanto-919 401.78 b 371.03 367.04 b 379.95
H3 = Pioneer-31-R-88 436.01 a 398.60 377.65 a 404.09
LSD 5% 21.42 56.09 26.59
Significance * NS **
C) Nitrogen Levels
N1 = 150 kg ha-1 362.59 d 349.38 c 326.26 c 346.08
N2 = 20
17.63
Signifi
0 kg ha-1 394.83 c 369.07 bc 372.15 c 378.69
N3 = 250 kg ha-1 424.04 b 388.31 ab 403.04 b 405.13
N4 = 300 kg ha-1 452.01 a 403.60 a 433.08 a 429.56
N5 = 350 kg ha-1 445.79 a 403.80 a 428.57 a 426.05
LSD 5%
cance ** ** **
Linear ** ** **
Quadratic * NS **
Cubic NS NS NS
Interaction NS NS NS
Mean 415.85 382.83 392.62
Means sharing different letters in a column diffe significantly at P = 0.05 *, ** = Significant at 5% and 1%, respectively NS = Non-significant
r
75

(a) (b)
585.
400
1000
0 30 6 800
o
y = 3.5056x -R2 = 0.80
84
200
600in y
i
800 m-2
)
1200
20 0 400 500 00 700
No of grains c b-1
Gra
eld
(g
y = 2.45R2
120037x - 292 = 0.67
800
0 500
ains
.78
200
400
600in
1000
200 300 40 600 700 800
No of gr cob-1
Gra
yiel
d (g
m-2)
(d)
y = 1.9557x - 49.145
200
1200
200 30 00 500 6 700 800
o of grains co
(c)
x - 223.99R2 = 0.86
0200 300 400 500 0 700 800
No of grain b-1
y 2.34961200
=
20
400
600
Gra
in
800
(g m
1000
-2)
60
s co
yie
ld
R2 = 0.52
400
600
Gra
in
800
(g m
1000
0 4 00
N b-1
yie
ld-2
)
Fig 4.8: Relationship between two years pooled grain yield and number of grains cob-1 at
ad (b) Sargo iwal loca s (a) Faisalab dha (c) Sah tions and (d) Pooled for all location
76
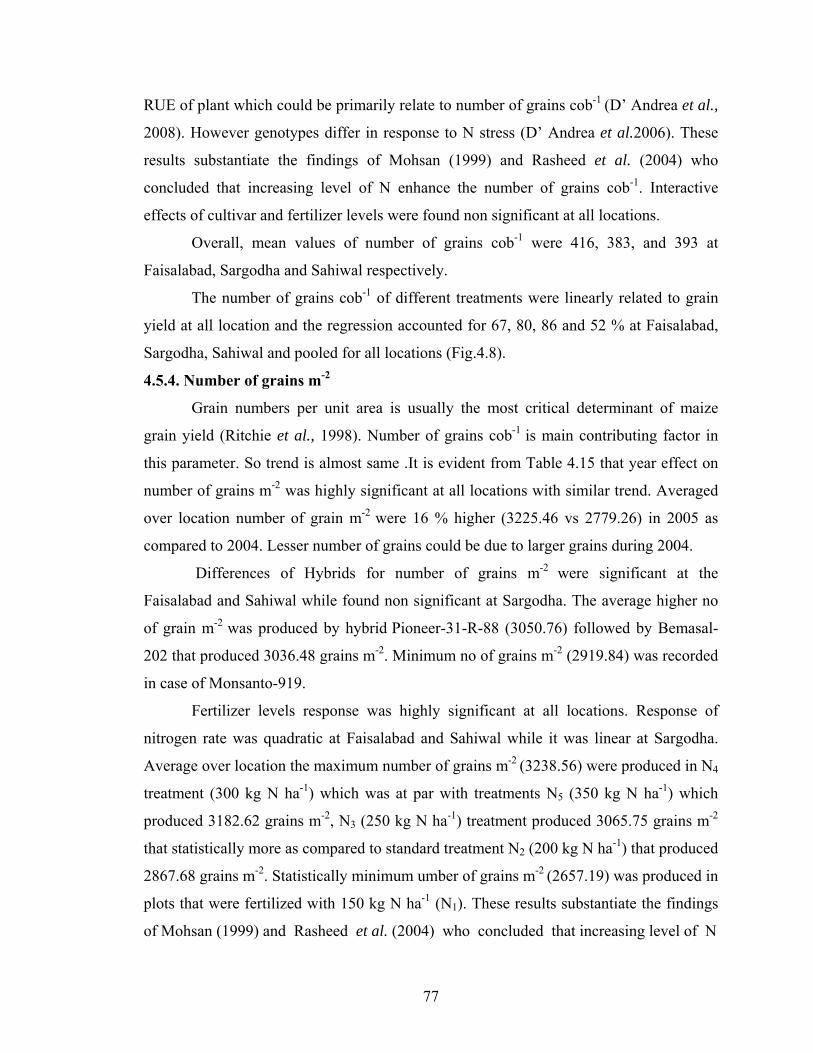
RUE of plant which could be primarily relate to number of grains cob-1 (D’ Andrea et al.,
2008).
stantiate the findings of Mohsan (1999) and Rasheed et al. (2004) who
conclu m
non significant at all locations.
ues of number of grains cob-1 were 416, 383, and 393 at
Faisala
effect on
number
rtilizer levels response was highly significant at all locations. Response of
nitroge
However genotypes differ in response to N stress (D’ Andrea et al.2006). These
results sub
ded that increasing level of N enhance the nu ber of grains cob-1. Interactive
effects of cultivar and fertilizer levels were found
Overall, mean val
bad, Sargodha and Sahiwal respectively.
The number of grains cob-1 of different treatments were linearly related to grain
yield at all location and the regression accounted for 67, 80, 86 and 52 % at Faisalabad,
Sargodha, Sahiwal and pooled for all locations (Fig.4.8).
4.5.4. Number of grains m-2
Grain numbers per unit area is usually the most critical determinant of maize
grain yield (Ritchie et al., 1998). Number of grains cob-1 is main contributing factor in
this parameter. So trend is almost same .It is evident from Table 4.15 that year
of grains m-2 was highly significant at all locations with similar trend. Averaged
over location number of grain m-2 were 16 % higher (3225.46 vs 2779.26) in 2005 as
compared to 2004. Lesser number of grains could be due to larger grains during 2004.
Differences of Hybrids for number of grains m-2 were significant at the
Faisalabad and Sahiwal while found non significant at Sargodha. The average higher no
of grain m-2 was produced by hybrid Pioneer-31-R-88 (3050.76) followed by Bemasal-
202 that produced 3036.48 grains m-2. Minimum no of grains m-2 (2919.84) was recorded
in case of Monsanto-919.
Fe
n rate was quadratic at Faisalabad and Sahiwal while it was linear at Sargodha.
Average over location the maximum number of grains m-2 (3238.56) were produced in N4
treatment (300 kg N ha-1) which was at par with treatments N5 (350 kg N ha-1) which
produced 3182.62 grains m-2, N3 (250 kg N ha-1) treatment produced 3065.75 grains m-2
that statistically more as compared to standard treatment N2 (200 kg N ha-1) that produced
2867.68 grains m-2. Statistically minimum umber of grains m-2 (2657.19) was produced in
plots that were fertilized with 150 kg N ha-1 (N1). These results substantiate the findings
of Mohsan (1999) and Rasheed et al. (2004) who concluded that increasing level of N
77

-2Table 4.15: Effect of cultivars and fertilizer levels on number of grain m
Treatment FFaaiissaallaabbaadd Sargodha Sahiwal Mean
A) Year
2004
4 b 5 a 9 a 3225.46
9 .51 0
** ** **
3509.61 a 2385.20 b 2442.96 b 2779.26
2005 3029.1 3646.4 3000.7
LSD 5% 54.4 230 23.9
Significance
B) Hybrids
H1 = Bemasal-202 3127.06 b 2984.59 2997.78 a 3036.48
H2 = Monsanto-919
eer-31-R-88 1 a 9 7 b
.80 .30 .10
NS **
3212.35 b 2999.69 2547.49 b 2919.84
H3 = Pion 3468.7 3063.1 2620.3 3050.76
LSD 5% 173 183 187
Significance **
C) Nitrogen Levels
N1 = 150 kg ha-1 2657.19 -1 2867.68 -1 3065.75 -1 3238.56 -1 3182.62
2874.39 d 2833.25 c 2263.93 d
N2 = 200 kg ha 3101.76 c 2922.07 bc 2579.20 c
N3 = 250 kg ha 3358.84 b 3046.68 ab 2791.73 b
N4 = 300 kg ha 3526.19 a 3182.39 a 3007.09 a
N5 = 350 kg ha
LSD 5%
3485.69 ab
139.50
3094.75 a
157.40
2967.43 a
122.00
Significance ** ** **
Linear ** ** **
Quadratic ** NS **
Cubic NS NS NS
Interaction NS NS NS
Mean 3269.37 3015.83 2721.88
Means sharing different letters in a column diffe% and 1%, respectively
r significantly at P = 0.05 *, ** = Significant at 5NS = Non-significant
78

enhance the number of grains per unit area. Interactive effects of cultivar and fertilizer levels were found non significant at all
locations.
Overall, mean values of number of grains m-2 were 3269, 3016, and 2722 at
Faisalabad, Sargodha and Sahiwal respectively.
4.5.5. 1000 grain weight
Mean grain weight is an important yield contributing factor, which plays a
decisive role in showing the potential of a variety. Significant differences were found
between two years at all three sites (Table 4.16). Averaged over locations, crop produced
18 % higher grain weight (319.22 vs 271.03 g) during 2004 as compared to 2005.
Favuorable climatic conditions (lesser temperature and higher relative humidity) during
cropping season particularly at grain filling stage might be the reason of higher grain
weight during 2004 (Appendix 4.1, 4.2). O, Neil et al., (2004) also reported a greater
yield response for corn with N application under adequate soil water conditions.
Data regarding thousand grain weights revealed that it was significantly affected
by different cultivars at all location with similar trend. Averaged over locations, heavier
grains were recorded from hybrid Bemasal-202 (313.99 g) followed by Pioneer 31-R-88
that produced 307.94 g, while lighter grains were noted in case of Monsanto-919 (263.45
g). It might be due to genetic potential of hybrids as Sangoi et al. (2001) reported that the
modern day hybrid Ag 9012 is more productive as compared to the older hybrids. These
results were also in agreement with Younas et al. (2002) who also reported that 395.16 g
1000 grain weight was recorded from Ghauri followed by 3043 having 1000 grain weight
349.28g.
Fertilizer levels response was linear at the Faisalabad and Sahiwal while cubic at
Sargodha. Averaged over locations the maximum 1000 grain weight (319.25 g) was
produced in N treatment (300 kg N ha-1) which was at par with treatments N (350 kg N
h
300.69 g tha 2 kg N ha-1)
which produced 279.03 g. The minimum 1000 grain weight (263.21) was registered in
plots that were fertilized with150 kg N ha-1 (N1). The results suggested that the adequate
N supply might have enhanced the source efficiency (more dry matter accumulation per
4 5
a-1) that produced 1000 grain weight (313.45 g). N3 (250 kg N ha-1) treatment produced
t was significantly higher as compared to standard rate N (200
79

Table 4.16: Effect of cultivars and fertilizer levels on 1000- grain weight (g)
Treatment FFaaiissaallaabbaadd Sargodha Sahiwal Mean
A) Year
2004
282.25 b 264.19 b 271.03
LSD 5%
304.81 a 334.48 a 318.37 a 319.22
2005 266.63 b
13.48 15.10 11.46
Significance ** ** **
B) Hybrids
H1 = Bemasal-202 311.38 a 321.72 a 308.87 a 313.99
H2 = Monsanto-919 252.42 b 278.77 b 259.14 b 263.45
H3 = Pioneer-31-R-88 293.36 a 324.61 a 305.85 a 307.94
LSD 5% 23.34 26.32 22.83
Significance ** ** **
C) Nitrogen Levels
N1 = 150 kg ha-1 263.52 d 267.50 d 258.60 c 263.21
N
N
N
N
LSD 5%
Significance **
Linear **
Quadratic NS
Cubic NS
2 = 200 kg ha-1 275.54 cd 288.98 c 272.56 c 279.03
3 = 250 kg ha-1 288.98 bc 318.37 b 294.72 b 300.69
4 = 300 kg ha-1 305.46 a 338.58 a 313.71 a 319.25
5 = 350 kg ha-1 295.13 ab 328.40 ab 316.83 a 313.45
14.93 13.19 14.58
** **
** **
** NS
* NS
Interaction NS NS NS
Mean 285.72 308.37 291.28
Means sharing different letters in a column differ significantly at P = 0.05 *, ** = Significant at 5% and 1%, respectively NS = Non-significant
80

(a) (b)
y =1000
4.2364x - 482.82R2 = 0.94
600
0
300 3
ain weight (
200
400
Gr
80
200 250 50 400
1000-gr g)
ain
yiel
d (g
m-2
)y = 2.
1000875R2 = 0.98
0
800
250 501000 g)
a y
ield
4x - 130.44
200200
40
Gr
600
(g
300 3 400-grain weight (
inm
-2)
(c)
.9175x - 442.576
00 250 300 3 400
1000-grain weight (
y = 31000
R2 =0.9
800
2002
400
Gr
600eld
(g
50
g)
ain
yi m
-2)
(d)
y = 3.287 2.79R2 = 0.87
800
000
200 250 0 350 400
100 in weight (g)
6x - 24
200
400
Gr
600eld
(g1
30
0-gra
ain
yi m
-2)
ain weight at (a)
aisalabad (b) S ha (c) Sahiwal (d) pooled for all locations
Fig.4.9: Relationship between two years pooled grain yield and 1000 gr
F argod
81

unit are
ight was lower (286 g) at Faisalabad as compared to
Sargod
g 2005 at these experimental sites. The yield differences between
the ye
fferent patterns of rainfall and relative
humidi
the results discussed earlier
et al. (2008) also reported year difference (8.97 vs 7.11 t ha-1)
in maiz
31-R-88 producing (7.75 t ha-1) that were statistically
a/ time)[Table 4.18] as well sink capacity (kernel weight). An increase in grain
weight of maize in response to N fertilization has also been reported by Mohsan (1999).
The interactive effect between cultivars and nitrogen levels were found to be
statistically non significant.
Overall, mean grain we
ha (308 g) and Sahiwal (291 g).
Grain weights of different treatments was linearly related to grain yield at all
location and the regression accounted for 94, 98, 96 and 87 % at Faisalabad, Sargodha,
Sahiwal and pooled for all locations respectively (Fig. 4.9).
4.5.6. Grain Yield
Year effects on grain yield of maize were highly significant at Sargodha and
Sahiwal sites while it was non significant at Faisalabad site (Table 4.17). Grain yield was
recorded 10 % (7.20 vs 7.92 t ha-1) and 14 % (6.52 vs 7.45 t ha-1) more at Sargodha and
Sahiwal sites respectively in 2005 as compared to 2004. It is mainly attributed to more
number of grains durin
ars might be ascribed to different daily variation in maximum and minimum
temperatures resulting in different daily leaf temperature across the year, more total
rainfall during 2005 as compared to 2004, di
ty over the two years and other temporal variations in the environment. Such
environmental variations across the year also resulted in better growth and development
of maize in 2005 as compared to 2004 which is evident from
in this chapter. D’Andrea
e yield in 2000 and 2001.
Hybrid differences in grain yield were significant all location with similar trend.
Averaged over locations, maximum grain yield (7.91 t ha-1) was recorded in case of
Bemasal-202 followed by Pioneer-
at par with each other. The minimum grains yield (6.98 t ha-1) was produced by
Monsanto-919. these findings are in line of Younas et al. (2002) who compared maize
hybrids and concluded that C-919 out yielded all other hybrids by producing 9.92 t ha-1 as
against the lowest yield 6.85 t ha-1 produced by the hybrid 3043.
82

Table 4.17: Effect of cultivars and fertilizer levels on grain yield (t ha-1) at maturity
Treatment FFaaiissaallaabbaadd Sargodha Sahiwal Mean
Year
2004 7.29 7.20 b 6.52 b 7.00
2005 7.26 7.92 a 7.45 a 7.54
LSD 5% 0.17 0.06 0.03
Significance NS ** **
Hybrids H1 = Bemasal-202 8.04 a 8.10 a 7.59 a 7.91
H2 = Monsanto-919 5.96 b 6.56 b 5.98 b 6.17
H3 = Pioneer-31-R-88 7.81 a 8.03 a 7.39 a 7.75
LSD 5% 0.74 0.45 0.40
Significance ** ** **
Nitrogen Levels
N1 = 150 kg ha-1 6.06 d 6.44 d 5.37 d 5.96
N2 = 200 kg ha-1 6.79 c 7.09 c 6.33 c 6.74
N3 = 250 kg ha-1 7.43 b 7.74 b 7.27 b 7.48
N4 = 300 kg ha-1 8.12 a 8.33 a 8.05 a 8.17
N5 = 350 kg ha-1 7.96 a 8.22 a 7.91 a 8.03
LSD 5% 0.43 0.39 0.41
Significance ** ** **
Linear ** ** **
Quadratic * ** **
Cubic NS NS NS
Interaction NS NS NS
Mean 7.27 8.23 8.49
M*, ** = SigniNS = Non-significant
eans sharing different letters in a column differ significantly at P = 0.05 ficant at 5% and 1%, respectively
83

Data in Table 4.17 showed that different nitrogen levels markedly increased gra
eatment. A
in
yield over standard (200 kg N ha-1) tr t all locations response of nitrogen was
ture. Averag s er g N elow
standard treatment) produced significantly less grain yield (5.96 t ha ) as compared to
zed at higher levels.
Maximum grain yield (8.17 t ha-1) wa in p w kg N
ich was statistically a th yield (8 t N5 ha-1 50 kg
ve grain yield 6.74 , while stan reatment 0 kg N h -1) produced
ower yield (5. ha-1) as com ed to higher ls of nitro n. Nitrogen
fertilized at lesser levels of nitrogen might be the cause of lesser LAI and
ower radiation intercepti rate the kernel
eld (Gir 1987 98 nd 1989;
5). sub fin r s who
ilar effects of nitrogen levels on yield in maize ( Sabir et al., 2000; Kogbe
t of hybrid and nitrogen level was non-significant in both years.
ain yield (7.27 Fa co to at
a-1) and Sahiwal (8.49 t ha-1
of differe s wa late al on and
ession acc 94, 98, 96 and 87 % at Faisalabad, Sargodha,
d for all lo ctiv 0).
al Dry Matter
Table 4.18) sh ed that seaso effect on t dry matter (TDM) was
nt at Sargodha and iwal, while a isalabad differences in TDM were non
Averaged over locations crop produced 7% more TDM (18.02 vs 16.91 t ha-1)
005 as compared to 2004.
er production inal harvest,
in similar trend. Averaged over location maximum TDM was accumulated by -1 -R-88 that
um TDM accumulation was recorded in
quadratic in na ed over location , plots fertiliz with 150 k-1
ha-1 (b
plots fertili
s recorded lot fertilized ith 300
ha-1wh t par wi .03 t ha-1) a (350 kg N ). N (23
N ha-1) ga t ha-1 dard t N2 (20 a
considerably l 96 t par leve ge
stress in plots
LAD that leads to l on, growth , RUE and refore
number and grain yi ardin et al., ; Muchow, 1 8; Sinclair a Horie,
Uhart and Andrade, 199 These results stantiate the dings of othe worker
also noted sim
and Adediran, 2003).
Combined effec
Overall, mean gr was lower t ha-1) at isalabad as mpared
Sargodha (8.23 t h ).
Grain yield nt treatment s linearly re d to TDM at l locati
the common regr ounted for
Sahiwal and poole cations, respe ely (Fig. 4.1
4.5.7. Tot
Data ( ow nal otal
significa Sah t Fa
significant.
during 2
Total dry matt , at f was significantly affected by hybrids at all
locations
Bemasal-202 (17.98 t ha ) that was statistically at par with Pionear-31
produced total dry matter17.58 t ha-1. Minim
hybrid Monsanto-919.
84

Fig 4.10: Relationship between two years pooled grain yield and total dry matter at (a)
Faisalabad (b) Sargodha (c) Sahiwal (d) pooled for all locations
(a)
y = 0.7288x - 555.72R2 = 0.84
0
200
400
600
800
1000
0 500 1000 1500 2000 2500
TDM (g m-2)
Gra
in y
ield
(g m
-2)
(b)
y = 0.7473x - 586.52R2 = 0.87
0
200
400
600
800
1000
0 500 1000 1500 2000 2500
TDM (g m-2)G
rain
yie
ld (g
m-2
)
(C)
y = 0.5935x - 299.28R2 = 0.88
800
1000
0
200
0 500 1000 1500 2000 2500
TDM (g m-2)
400 yie
ld-2)
600
(g m
Gra
in
(d)
y = 0.6339x - 379.441000
R2 = 0.85
400
800
TDM (gm-2)
Gra
in y
iel
0
200
0 500 1000 1500 2000 2500
600
d (g
m-2
)
85

Tabl t maturity
l
e 4.18: Effect of cultivars and fertilizer levels on total dry matter (t ha-1) a
Treatment FFaaiissaallaabbaadd Sargodha Sahiwa Mean
A) Year
2004 17.57 b b
a a
17.40 15.75 16.91
2005 17.64 18.54 17.88 18.02
LSD 5% 0.77 0.86 0.26
Significance NS * **
B) Hybrids
H1 = Bemasal-202 18.21 a 17.98
H2 = Monsanto-919 16.79 b 17.36 b 16.31 b 16.82
H3 = Pioneer-31-R-88 17.82 ab 18.16 ab 16.78 ab 17.58
LSD 5% 1.38 0.96 0.66
Significance * * *
C) Nitrogen Levels
18.38 a 17.36 a
N1 = 150 kg ha-1 15.58 d 16.16 c 13.97 d 15.24
N2 = 200 kg ha-1 16.90 c 17.43 b 15.62 c 16.65
N3 = 250 kg ha-1 17.90 b 18.33 a 17.28 b 17.84
N4 = 300 kg ha-1 18.95 a 19.06 a 18.72 a 18.91
N5 = 350 kg ha-1 18.69 ab 18.86 a 18.48 a 18.68
LSD 5% 0.94 0.83 0.91
Significance ** ** **
Linear ** ** **
Quadratic * ** **
Cubic NS NS NS
Interaction NS NS NS
Mean 17.61 17.97 16.81
Means sharing different letters in a column differ significantly at P = 0.05 *, ** = Significant at 5% and 1%, respectively NS = Non-significant
86

The response of TDM production to increasing levels of nitrogen was highly
significant at all locations. Quadratic response of nitrogen to TDM was observed at all
three locations. Averaged over locations the maximum total dry matter (18.91 t ha-1) was
produced by N4 (300 kg N ha-1) treatment which was statistically at par with N5 (350 kg N
ha-1) treatment, which gave TDM of 18.68 t ha-1 followed by treatment N3 (250 kg N ha-1)
producing 17.84 t ha-1. Standard nitrogen level N2 (200 kg N ha-1) produced lesser yield
TDM (16.65 t ha-1) as compared to high levels N3, N4 and N5, respectively while
minimum TDM was recorded in treatment N1 (100 kg N ha-1) that was 15.24 t ha-1. The
increase in TDM with higher level of nitrogen was due to better crop growth, which gave
maximum plant height, LAI and ultimately produced more biological yield. Similar
results were found by Mohsan (1999) who reported that nitrogen fertilizer application
increased weight of grains per cob, 1000-grain weight, grain yield and stover yield of
maize crop. Corn biomass increased with applied N in a quadratic manner was reported
by Shapiro et al. (2006). Total dry matter production in maize was also directly
proportional to radiation interception as reported by Kiniry et al., (1999).
The interactive effect between cultivars and nitrogen levels were found to be
statistically non significant. These observations are fully supported by Khan et al. (1999)
and Sharar et al. (2003).
Overall, mean total dry matter accumulation at harvest was lower (17 t ha-1) at
Sahiwal as compared to Faisalabad and Sargodha (18 t ha-1).
4.5.8. Harvest Index
Harvest index shows the physiological efficiency of plants to convert the fraction
of photoassimilates to grain yield. Table 4.19 showed that year effect on harvest index
(HI) of maize was non significant at all locations. However crop had an average HI
41.20, 41.76 % in 2004 and 2005, respectively.
Hybrid differences in harvest index (HI) were significant at all locations. Averaged over
locations the hybrid Pioneer-31-R-88 had higher harvest index (43.94 %), which was
statistically at par with Bemasal-202 giving HI (43.94 %). Monsanto-919 gave
statistically less harvest index 39.37%. Substantially high HI for Pioneer -31 –R -88
and Bemasal - 202 might be attributed to its genotypic superiority to utilize more.
87

Table 4.19: Effect of cultivars and fertilizer levels on harvest index (%)
Treatment FFaaiissaallaabbaadd Sargodha Sahiwal Mean
A) Year
2004 41.29 41.10 41.21 41.20
2005 41.09 42.67 41.52 41.76
LSD 5% 1.97 2.06 0.67
Significance NS NS NS
B) Hybrids
H1 = Bemasal-202 44.14 a 43.76 a 43.62 a 43.84
H2 = Monsanto-919 35.66 b 37.72 b 36.60 b 36.66
H3 = Pioneer-31-R-88 43.78 a 44.17 a 43.88 a 43.94
LSD 5% 1.95 1.54 1.51
Significance ** ** **
C) Nitrogen Levels
N1 = 150 kg ha-1 38.84 c 39.94 c 38.57 c 39.12
N2 = 200 kg ha-1 40.10 bc 40.67 bc 40.54 b 40.44
N3 = 250 kg ha-1 41.44 ab 42.43 ab 42.02 ab 41.97
N4 = 300 kg ha-1 42.96 a 43.61 a 42.94 a 43.17
N5 = 350 kg ha-1 42.61 ab 42.78 a 42.74 a 42.71
LSD 5% 2.55 1.83 1.79
Significance ** ** **
Linear ** ** **
Quadratic NS NS *
Cubic NS NS NS
Interaction NS NS NS
Mean 41.19 41.89 41.36
Means sharing different letters in a column differ significantly at P = 0.05 *, ** = Significant at 5% and 1%, respectively NS = Non-significant
88

photoassimilates for grain yield formation
Application of nitrogen fertilizer at different levels showed highly significant
effect on harvest index at all locations. These effects were linear at Faisalabad and
Sargodha while quadratic in nature at Sahiwal. Averaged over locations N4 treatment
(300 kg N ha-1) gave maximum HI (43.17 %) which is at par with treatment N5 (350 kg N
ha-1) giving 42.71 % and N3 (250 kg N ha-1) that gave 41.66 %. Standard treatment N2
(200 kg N ha-1) gave 40.44 % that is significantly lower as compared to N3, N4 and N5.
Statistically less harvest index was recorded in treatment N1 (150 kg N ha-1) that was
39.12 %. Results suggested that an optimum supply of nitrogen is essential for optimizing
partitioning of dry matter between grain and other parts of maize plant. Higher the
efficiency of converting dry matter into economic yield, higher will be the value of
harvest index (%). Many workers (Bangarwa et al., 1988), Sabir et al. 2000) also
reported similar results.
Overall, mean HI was 41.19 %, 41.89 % and 41.36 % at Faisalabad, Sargodha
and Sahiwal, respectively.
4.5.9. CORRELATION BETWEEN GRAIN YIELD AND COMPONENTS OF YIELD
Simple linear correlation analysis between grain yield and different components
of yield is presented in Table 4.20. The data showed highly positive correlation between
grain yield and different components of yield such as number of grains cob-1, number of
grains m-2 and 1000-grain weight. A highly significant association of grain yield among
plant height, TDM, HI was also shown. These significant associations are consistent with
earlier findings on maize (Mohsan, 1999; Rasheed, 2002 and Ahmaddani, 2004).
4.5.10. Grain Pith Ratio (GPR)
Seasonal effect on GPR was non significant at Faisalabad and Sahiwal sites while
it was significant at Sargodha site where GPR was 3 % higher (4.04 vs 3.91) was
recorded during 2005 as compared to 2004 (Table 4.21).
Data regarding grain pith ratio revealed that it was significantly affected by different
cultivars at all location in a similar trend. Averaged over locations Bemasal-202 that gave
maximum grain pith ratio (4.18) followed by Pioneer-31-R-88 that gave 3.97.
Statistically minimum grain pith ratio (3.60) was measured in case of Monsanto-919.
89

Table 4.20: Correlation between grain yield and yield components of maize
*, ** = Significant at 5% and 1% probability
Correlation co-efficient (r) Character
Faisalabad Sargodha SahiwalPooled (n=24)
Plant height 0.87 ** 0.93 ** 0.96 ** 0.66 **
Number of grains cob-1 0.82 ** 0.89 ** 0.93 ** 0.72 **
Number of grains m-2 0.71 * 0.80 ** 0.93 ** 0.63 **
1000 grain weight 0.97 ** 0.99 ** 0.98 ** 0.93 **
Total dry matter 0.92 ** 0.93 ** 0.94 ** 0.92 **
Harvest index 0.94 ** 0.92 ** 0.70 * 0.89 **
90

Table 4.21: Effect of cultivars and fertilizer levels on grain pith ratio
Treatment FFaaiissaallaabbaadd Sargodha Sahiwal Mean
A) Year
2004 3.80 3.91 b 3.96 3.89
2005 3.90 4.04 a 3.90 3.94
LSD 5% 0.14 0.08 0.18
Significance NS * NS
B) Hybrids
H1 = Bemasal-202 3.99 a 4.25 a 4.30 a 4.18
H2 = Monsanto-919 3.57 b 3.72 c 3.53 c 3.61
H3 = Pioneer-31-R-88 3.40 a 3.96 b 3.94 b 3.97
LSD 5% 0.22 0.20 0.17
Significance ** ** **
C) Nitrogen Levels
N1 = 150 kg ha-1 3.39 d 3.42 d 3.45 d 3.42
3 3. 3.8 3.79
3 4. 3.9 3.96
4 4. 4.2 4.28
4 4. 4.1 4.15
LSD 5% 0.24 0.24 0.22
Significance ** ** **
Linear ** ** **
Quadratic ** ** *
Cubic NS NS NS
Interaction NS NS NS
N2 = 200 kg ha-1 .73 c 82 c 0 c
N3 = 250 kg ha-1 .90 bc 03 bc 4 bc
N4 = 300 kg ha-1 .20 a 35 a 9 a
N5 = 350 kg ha-1 .06 ab 25 ab 4 ab
Mean 3.85 3.98 3.93
Means sharing different letters in a column differ significantly at P = 0.05 *, ** = Significant at 5% and 1%, respectively NS = Non-significant
91

Fertilizer levels response was highly significant at all locations. Maximum grain
pith ratio (4.28) was given by N4 treatment (300 kg N ha-1) which was at par with
treatments N5 (350 kg N ha-1) that gave 4.15 GPR. The treatment N3 (250 kg N ha-1) gave
GPR 3.96 that was significantly higher as compared to standard rate N2 (200 kg N ha-1)
which gave 3.73 and at par with N5. Statistically minimum grain pith ratio (3.39) was
given by plots that were fertilized with150 kg N ha-1 (N1). Interactive effects between
cultivars and nitrogen levels were found to be statistically non significant at all
experimental sites.
The mean values of GPR were 3.85, 3.98 to 3.93 at Faisalabad, Sargodha and
Sahiwal respectively.
4.5.11. Cob Sheath Ratio (CSR)
Table 4.22 indicated that seasonal effect was significant at Faisalabad and
Sahiwal where cob sheath ratios were higher in 2005 as compared to 2004 at both
locations. Averaged over locations, the value of CSR was 14.37 in 2005 and 12.17 in
2004.
Data showed that cultivar affected cob sheath ratio significantly at all
experimental sites with similar trend; on an average Pioneer-31-R-88 gave maximum cob
sheath ratio (14.75) followed by Bemasal-202 that gave 14.22. Statistically minimum cob
sheath ratio (10.85) was measured in case of Monsanto-919.
Fertilizer levels response was highly significant (Cubic) in at all locations.
Average over locations the maximum cob sheath ratio (14.90) was given by N4 (300 kg N
ha-1) treatment which was at par with treatments N5 (350 kg N ha-1) that gave CSR
(14.27). N3 (250 kg N ha-1) gave CSR 13.56 that was significantly higher as compared to
standard rate N2 (200 kg N ha-1) which gave 12.53. Statistically minimum cob sheath
ratio (11.10) was given by plots that were fertilized with150 kg N ha-1 (N1).
The interactive effect between cultivars and nitrogen levels were found to be
statistically significant at all locations (Table 4.23, 4.24 and 4.25). Maximum cob sheath
ratios were recorded in hybrid Pioneer-31-R-88 at 300 kg N ha-1 at all three sites that was
statistically at par with 350 kg N ha-1 in same hybrid and with Bemasal-202 at same
fertilizer level.
92

Table 4.22: Effect of cultivars and fertilizer levels on cob sheath ratio
Treatment FFaaiissaallaabbaadd Sargodha Sahiwal Mean
A) Year
2004 11.89 b 12.36 12.26 b 12.17
2005 18.25 a 12.53 12.34 a 14.37
LSD 5% 0.60 0.45 0.01
Significance ** NS **
B) Hybrids
H1 = Bemasal-202 15.67 b 13.58 a 13.41 a 14.22
H2 = Monsanto-919 11.80 c 10.46 b 10.28 b 10.85
H3 = Pioneer-31-R-88 17.74 a 13.29 a 13.22 14.75
LSD 5% 0.77 0.46 0.24
Significance ** ** **
C) Nitrogen Levels
N1 = 150 kg ha-1 12.90 d 10.36 d 10.04 e 11.10
N2 = 200 kg ha-1 14.26 c 11.64 c 11.69 d 12.53
N3 = 250 kg ha-1 15.47 b 12.70 b 12.51 c 13.56
N4 = 300 kg ha-1 16.70 a 14.00 a 14.00 a 14.90
N5 = 350 kg ha-1 16.02 ab 13.53 a 13.26 b 14.27
LSD 5% 0.81 0.60 0.47
Significance ** ** **
Linear ** ** **
Quadratic * ** **
Cubic * * *
Interaction
B x C
**
**
**
Mean 15.07 12.44 12.30
Means sharing different letters differ significantly at P = 0.05 *, ** = Significant at 5% and 1%, respectively NS = Non-significant
93

Table4.23: Interaction between hybrid and nitrogen levels affecting cob sheath
ratio at Faisalabad.
Hybrids Nitrogen levels
Bemasal-202 Monsanto-919 Pioneer-31-R-88
N1 = 150 kg ha-1 13.30 gh 10.47 j 14.93 ef
N2 = 200 kg ha-1 14.61 fg 11.85 ij 16.31 de
N3 = 250 kg ha-1 16.19 de 11.86 ij 18.36 bc
N4 = 300 kg ha-1 17.40 cd 12.74 hi 19.96 a
N5 = 350 kg ha-1 16.84 d 12.08 hi 19.15 ab
LSD 5%= 1.40
Means sharing different letters in column differ significantly at P = 0.05
Table 4.24: Interaction between hybrid and nitrogen levels affecting cob sheath
ratio at Sargodha.
Hybrids Nitrogen levels
Bemasal-202 Monsanto-919 Pioneer-31-R-88
N1 = 150 kg ha-1 11.95 e 9.00 i 10.11 gh
N2 = 200 kg ha-1 13.21 cd 9.39 hi 12.32 de
N3 = 250 kg ha-1 13.46 c 10.59 fg 14.03 bc
N4 = 300 kg ha-1 14.78 ab 11.78 e 15.43 a
N5 = 350 kg ha-1 14.50 ab 11.56 ef 14.53 ab
LSD 5%= 1.04
Means sharing different letters in column differ significantly at P = 0.05
94

Table 4.25: Interaction between hybrid and nitrogen levels affecting cob sheath
ratio at Sahiwal
Hybrids Nitrogen levels
Bemasal-202 Monsanto-919 Pioneer-31-R-88
N1 = 150 kg ha-1 11.11 gh 8.89 j 10.16 i
N2 = 200 kg ha-1 13.26 ef 9.21 j 12.59 f
N3 = 250 kg ha-1 13.42 de 10.48 hi 13.63 cde
N4 = 300 kg ha-1 14.83 ab 11.60 g 15.54 a
N5 = 350 kg ha-1 14.39 bc 11.18 gh 14.20 bcd
LSD 5% = 0.81
Means sharing different letters in column differ significantly at P = 0.05
95

Overall, mean CSR was 15.07, 12.44 and 12.30 at Faisalabad, Sargodha and
Sahiwal, respectively.
4.6 GROWTH AND INTERCEPTED RADIATION
4.6.1. Fraction of Intercepted Radiation
Generally, fraction of intercepted radiation (Fi) values steadily increased and
reached maximum value at 55 DAS at all the locations; thereafter it slightly declined in
all the treatments and reached its minimum values at about 0.65 to 0.80 by 105 DAS
(Figs. 4.11, 4.12).
The year had significant effect on maximum value of Fi at all the location.
Averaged over locations enhanced value of Fi (0.961 and 0.956) at 55 DAS was recorded
in 2005 at Faisalabad and Sahiwal locations respectively, while equivalent values for Fi
in 2004 were 0.960 and 0.947 at these sites. However at Faisalabad site, higher value
(0.960) for fraction of intercepted radiation (Fi) was recorded in 2004 as compared to
2005 (0.958).
Cultivars differences in maximum Fi were significant at Faisalabad and Sahiwal
sites. However, these differences were non significant at Sargodha. On an average,
maximum Fi values at 55 DAS were 0.957, 0.956 and 0.0.960 in Bemasal-202,
Monsanto-919 and Pioneer-31-R-88 respectively (Table 4.26).
The Fi was significantly affected by nitrogen levels at all locations through out
the growth (Fig. 4.12). Generally increasing level of N significantly increased Fi up to
final harvest at DAS 105. These differences in Fi were mainly attributable to differences
in LAIs among different treatments.
4.6.2. Incident and Intercepted Radiation
Table 4.28 presents the effect of treatments on the amount of intercepted
photosynthetically active radiation (PAR) during the growth cycle at all the sites. The
values of intercepted PAR were 76, 68 and 66 % at Faisalabad, Sargodha and Sahiwal
sites, respectively.
Climatic conditions of a year significantly increased interception of PAR at
Sargodha and Sahiwal. At Faisalabad site these differences were non significant.
Averaged over locations, climatic conditions of 2005 increased intercepted PAR by 5 %
96

(b)
Fi
0.0
0.2
0.4
0.6
0.8
1.0
(c)
Days after sowing
0 10 20 30 40 50 60 70 80 90 100 110
Fi
0.0
0.2
0.4
0.6
0.8
1.0
Bemasal-202Monsanto-919Pioneer-31-r-88LSD
(a)
Fi
0.0
0.2
0.4
0.6
0.8
1.0
1.2
Fig 4.11: Change in pooled fraction of intercepted radiation of three cultivars with time at
(a) Faisalabad (b) Sargodha and (c) Sahiwal; Bars represent LSD at 5%
97

(b)
Fi
0.0
0.2
0.4
0.6
0.8
1.0
150 kg N ha-1
200 kg N ha-1
250 kg N ha-1
(c)
Days after sowing
0 10 20 30 40 50 60 70 80 90 100 110
Fi
0.0
0.2
0.4
0.6
0.8
1.0
300 kg N ha-1
350 kg N ha-1
LSD
(a)
Fi
0.0
0.2
0.4
0.6
0.8
1.0
1.2
Fig 4.12: Change in pooled fraction of intercepted radiation in response of 5 N rates with
time at (a) Faisalabad (b) Sargodha and (c) Sahiwal; Bars represent LSD at 5%
98

Table 4.26: Effect of cultivars and fertilizer levels on fraction of intercepted radiation (Fi) at 55 days after sowing
Treatment FFaaiissaallaabbaadd Sargodha Sahiwal Mean
A) Year
2004 0.960 b 0.960 a 0.947 b 0.943
2005 0.961 a 0.958 b 0.956 a 0.950
LSD 5% 0.001 0.001 0.001
Significance ** ** **
B) Hybrids
Bemasal-202 0.964 a 0.961 0.958 a 0.957
Monsanto-919 0.955 b 0.956 0.940 b 0.956
Pioneer-31-R-88 0.962 a 0.961 0.956 a 0.960
LSD 5% 0.005 0.005 0.005
Significance * NS **
C) Nitrogen Levels
N1 = 150 kg ha-1 0.940 d 0.937 d 0.928 d 0.935
N2 = 200 kg ha-1 0.952 c 0.950 c 0.943 c 0.948
N3 = 250 kg ha-1 0.966 b 0.965 b 0.957 b 0.963
N4 = 300 kg ha-1 0.974 a 0.973 a 0.966 a 0.971
N5 = 350 kg ha-1 0.971 ab 0.971 a 0.965 a 0.969
LSD 5% 0.006 0.006 0.006
Significance ** ** **
Linear ** ** **
Quadratic ** ** **
Cubic NS NS NS
Interaction
B x C
NS
NS
*
Mean 0.961 0.959 0.952
Means sharing different letters in a column differ significantly at P = 0.05 *, ** = Significant at 5% and 1%, respectively NS = Non-significant
99

Table 4.27: Interaction between hybrid and nitrogen levels affecting fraction of
intercepted radiation at 55 days after sowing, at Sahiwal site.
Hybrids Nitrogen levels
Bemasal-202 Monsanto-919 Pioneer-31-R-88
N1 = 150 kg ha-1 0.942 ef 0.905 h 0.936 f
N2 = 200 kg ha-1 0.952 bcd 0.925 g 0.950 cde
N3 = 250 kg ha-1 0.961 ab 0.949 de 0.960 abc
N4 = 300 kg ha-1 0.970 a 0.961 ab 0.968 a
N5 = 350 kg ha-1 0.967 a 0.960 ab 0.968 a
LSD 5%= 0.001
Means sharing different letters in column differ significantly at P = 0.05
100

Table 4.28: Effect of cultivars and fertilizer levels on cumulative intercepted PAR (MJ m-2) at 105 days after sowing
Treatment FFaaiissaallaabbaadd Sargodha Sahiwal Mean
A) Year
2004 732.03 673.00 b 683.35 b 696.13
2005 759.34 679.59 a 750.70 a 729.88
LSD 5% 53.28 3.13 25.33
Significance NS ** **
B) Hybrids
H1 = Bemasal-202 750.26 665.26 b 724.88 b 713.46
H2 = Monsanto-919 738.86 691.12 a 684.27 c 704.75
H3 = Pioneer-31-R-88 747.94 672.51 b 741.93 a 720.79
LSD 5% 13.02 7.67 16.62
Significance NS ** **
C) Nitrogen Levels
N1 = 150 kg ha-1 695.29 d 628.72 d 665.11 d 663.04
N2 = 200 kg ha-1 732.04 c 662.01 c 700.34 c 698.13
N3 = 250 kg ha-1 757.47 b 685.93 b 728.27 b 723.89
N4 = 300 kg ha-1 775.31 a 705.30 a 752.15 a 744.25
N5 = 350 kg ha-1 768.32 ab 699.52 a 739.28 ab 735.71
LSD 5% 12.64 6.47 17.68
Significance ** ** **
Linear ** ** **
Quadratic ** ** **
Cubic NS * NS
Interaction NS NS NS
Mean 745.69 676.30 717.03
Means sharing different letters in a column differ significantly at P = 0.05 *, ** = Significant at 5% and 1%, respectively NS = Non-significant
101

(729.88 vs 696.13 M Jm-2) as compared to 2004. Average amount of PAR intercepted
was 732, 673 and 683 M Jm-2 at Faisalabad, Sargodha and Sahiwal in 2004, respectively.
Equivalent values in 2005 were 759, 680 and 751MJm-2, respectively (Table 4.28).
Cultivar differences in intercepted PAR were non-significant at Faisalabad site
and significant at Sargodha and Sahiwal sites. Averaged across all sites, mean intercepted
PAR was 714, 705 and 721M Jm-2 in hybrid Bemasal-202, Monsanto-919 and Pioneer-
31-R-88, respectively (Table 4.28).
Nitrogen levels significantly affected the amount of intercepted PAR at all
locations. These responses were quadratic in nature at Faisalabad and Sahiwal sites and
cubic at Sargodha; increasing level of N significantly increased PAR interception up to
300 kg N ha-1(N4) after that a slight decrease was observed at 350 kg N ha-1(N5) that was
not statistically different from N4.(Table 4.28). Averaged over all sites, mean PAR
intercepted was 744.25 M Jm-2 at N4 followed by N5 (735.71 M Jm-2). The N3 (250 kg N
ha-1) treatment enhance 4 % (723.89 vs 698.13 MJm-2) interception of PAR over standard
level of nitrogen (N2). The minimum interception of PAR was recorded in plots fertilized
with 150 kg N ha-1i.e. 663.04 M Jm-2.
4.6.3. Radiation Utilization Efficiency
Table 4.29 presents the effect of treatments on radiation use efficiency for TDM
(RUETDM) at all the locations. Seasonal effect on RUETDM were non significant at
Faisalabad and Sargodha sites where maximum values for RUETDM were 2.66 and 2.59 g
MJ-1 in 2004 respectively. Equivalent values for RUETDM were 2.81 and 2.73 in 2005.
Year effect on RUETDM at Sahiwal site was significant where climatic conditions of 2005
enhanced 13 % RUETDM (2.59 vs 2.30 g MJ-1) over 2004. Averaged at all three sites mean
RUETDM was 2.52 g MJ-1 and 2.71 g MJ-1 in 2004 and 2005, respectively.
Cultivar differences in RUETDM were significant at the Sargodha and Sahiwal
locations and non significant at the Faisalabad site. Averaged over locations the hybrid
Bemasal-202 used radiation more efficiently (2.69 g MJ-1) for TDM accumulation
followed by Pioneer-31-R-88 (2.64 g MJ-1). Whereas hybrid Monsanto-919 was lesser
efficient user of radiation (2.51g MJ-1) for TDM accumulation as compared to formers
(Table 4.29).
102

Table 4.29: Effect of cultivars and fertilizer levels on radiation use efficiency for final Total Dry Matter (g MJ-1)
Treatment FFaaiissaallaabbaadd Sargodha Sahiwal Mean
A) Year
2004 2.66 2.59 2.30 b 2.52 2005 2.81 2.73 2.59 a 2.71 LSD 5% 0.22 0.14 0.03
Significance NS NS **
B) Hybrids
H1 = Bemasal-202 2.77 2.76 a 2.53 a 2.69 H2 = Monsanto-919
2.75 2.51 H3 = Pioneer-31-R-88 2.68 2.70 a 2.55 a 2.64 LSD 5% 0.24 0.14 0.11
Significance NS ** **
C) Nitrogen Levels
2.51 b 2.26 b
N1 = 150 kg ha-12.55 c 2.57 b 2.22 c 2.45
N2 = 200 kg ha-12.68 bc 2.64 ab 2.32 c 2.55
N3 = 250 kg ha-12.76 ab 2.68 ab 2.47 b 2.63
N4 = 300 kg ha-12.83 ab 2.71 a 2.64 a 2.73
N5 = 350 kg ha-12.85 a 2.70 a 2.59 ab 2.71
LSD 5% 0.16 0.12 0.13
Significance ** * **
Linear ** ** **
Quadratic ** NS **
Cubic NS NS NS
Interaction NS NS NS
Mean 2.73 2.66 2.45
Means sharing different letters in a column differ significantly at P = 0.05 *, ** = Significant at 5% and 1%, respectively NS = Non-significant
103

Significant differences were found in RUETDM among N treatments at Faisalabad
and Sahiwal, where increasing level of N increased RUETDM over standard treatment N2
(200 kg N ha-1) at mean value of RUETDM (2.55 g MJ-1) was recorded. Averaged over
three sites, mean RUE was 2.73 g MJ-2, 2.71 g MJ-2 and 2.63 g MJ-2 in full N4, N5 and N3
treatments, respectively (Table 4.32). The minimum value of mean RUETDM was
registered from plots fertilized with 150 kg N ha-1 (N1). Overall, average RUETDM were
2.73, 2.66 and 2.45 g MJ-1 at Faisalabad, Sargodha and Sahiwal, respectively. Interaction
between cultivar and nitrogen rate was non-significant at all location.
Table 4.30 shows the effect of treatments on radiation use efficiency for grain
yield (RUEGY) at different experimental sites. Seasonal effects were significant on
RUEGY at Sargodha and Sahiwal sites in similar trend. Crop used radiation more
efficiently in 2005 as compared to 2004. Differences in RUEGY between year at the
Faisalabad site were non significant. The values of RUE GY varied from 0.95 g to 1.22 g
MJ-1 between different years.
Effects of cultivars were significant at all three sites. Averaged over locations,
hybrid Bemasal-202 out performed in RUEGY (1.19 g MJ-1) followed by hybrid Pioneer-
31-r-88 (1.18 g MJ-1) that was statistically at par with former, whereas hybrid Monsanto-
919 was found lesser efficient user of radiation in grain yield (0.92 g MJ-1).
Nitrogen application affected RUEGY in a cubical manner at all locations.
(Table4.30). In general increasing level of N significantly increased RUE GY up to 300 kg
N ha-1 after that there was no significant increase in RUEGY. Averaged at all locations,
RUEGY varied from 0.96 g MJ-1 to 1.20 g MJ-1 among various N application treatments.
Interactive effects on RUEGY of all factors were non significant at all location.
The mean RUEGY at three sites were 1.12, 1.14 and 1.03 g MJ-1 at Faisalabad, Sargodha
and Sahiwal.
The TDM accumulation was linearly related with the cumulative intercepted PAR
at all the locations. The common regression accounted for 94, 68 and 80 % at Faisalabad,
Sargodha and Sahiwal, respectively. (Fig.4.13 a, b, c), gave values of 3.15 to 4.50 g MJ-1.
104

Table 4.30: Effect of cultivars and fertilizer levels on radiation use efficiency for grains (g MJ-1)
Treatment FFaaiissaallaabbaadd Sargodha Sahiwal Mean
A) Year
2004 1.10 1.07 b 0.95 b 1.04
2005 1.15 1.22 a 1.10 a 1.15
LSD 5% 0.06 0.01 0.02
Significance NS ** **
B) Hybrids
H1 = Bemasal-202 1.23 a 1.24 a 1.10 a 1.19
H2 = Monsanto-919 0.98 b 0.93 b 0.86 b 0.92
H3 = Pioneer-31-R-88 1.17 a 1.26 a 1.12 a 1.18
LSD 5% 0.13 0.07 0.07
Significance ** ** **
C) Nitrogen Levels
N1 = 150 kg ha-1 0.99 c 1.03 c 0.85 d 0.96
N2 = 200 kg ha-1 1.07 b 1.09 bc 0.95 c 1.04
N3 = 250 kg ha-1 1.14 ab 1.15 b 1.05 b 1.11
N4 = 300 kg ha-1 1.21 a 1.23 a 1.15 a 1.20
N5 = 350 kg ha-1 1.21 a 1.21 a 1.12 a 1.18
LSD 5% 0.08 0.06 0.06
Significance ** ** **
Linear ** ** **
Quadratic ** ** **
Cubic NS NS NS
Interaction NS NS NS
Mean 1.12 1.14 1.03
Means sharing different letters in a column differ significantly at P = 0.05 *, ** = Significant at 5% and 1%, respectively NS = Non-significant
105

106
Fig 4.13: Relationship between two years pooled final TDM and cumulative intercepted
PAR at Faisalabad (b) Sargodha and (c) Sahiwal
(c)
y = 4.5045x - 1548.5R2 = 0.80
500
800
1100
1400
1700
2000
2300
500 600 700 800 900
PAR (MJm -2)
TDM
(gm
-2)
(a)
y = 4.3573x - 1488.3R2 = 0.94
500
800
1100
1400
1700
2000
500 600 700 800 900
PAR (MJm -2)
TDM
(gm
-2)
(b)
y = 3.153x - 335.67R2 = 0.68
500
800
1100
1400
1700
2000
500 600 700 800 900
PAR (MJm-2)
TDM
(gm
-2)

4.7. CROP GROWTH MODELING 4.7.1. Cultivar coefficients and simulation
CSM-CERES-Maize requires a set of six eco-physiological coefficients for
simulation of phenology, growth and grain yield of cultivar. Since such data were not
available, the genetic coefficients of different hybrids were estimated by repeated
interactions until a close match between simulated and observed phenology, growth and
yield was obtained (Table 4.31). Monsanto-919 had maximum value 350 (°C day) and
765 (°C day) for P1 and P5 respectively that indicates it was longer duration hybrid as
compared to Bemasal-202 and Pioneer-31-R-88. Minor differences were recorded in P2
values that were 0.7, 0.6 and 0.8(day) for Bemasal-202, Monsanto-919 and Pioneer-31-R-
88 because of decreasing day length during the growing season at all locations. The value
of G2 ranged from 820 to 850 for all hybrids.Monsanto-919 had minimum kernel filling
rate (G3) i.e.6.50 mg day-1 while 9.90 and 9.84 mg day-1 was estimated for Bemasal-202
and Pioneer-31-R-88 respectively. PHINT (Phylochron interval) value ranged from 38.80
°C day for Bemasal-202, 43.00°C day for Monsanto-919 and 39.80°C day for Pioneer-
31-R-88.
The model performed good in simulation of growth (Figs. 4.15, 4.16) phenology,
grain yield and biomass (Table 4.32) during calibration process for all hybrids.
Calibration results showed that model predicted equal number of days to
flowering with RMSE 0.58 and Mean Percentage Difference (MPD) of 0.62 and 0.58 for
hybrid Bemasal-202 and Monsanto-919, respectively. There was only one day difference
was recorded between observed and simulated days to flowering for hybrid Pioneer-31-
R-88 with RMSE 1.0 day and MPD 1.82 between simulated and observed values for all
locations. CSM-CERES-Maize simulated same number of days from planting to
physiological maturity as observed for all hybrids with RMSE 0.82, 1.00, 0.82 day and
MPD 0.69, 0.96, 0.69 for B-202, M-919 and P-31-R-88.
Maximum LAI was simulated with RMSE 0.43, 0.16 and 0.37 for hybrids
Bemasal-202, Monsanto-919 and Pioneer-31-R-88 respectively. However mean
percentage difference among simulated and observed values was 8.20, 2.73 and 7.07 for
respective hybrids (Table 4.32). Time course simulation of LAI is presented in Fig.4.16.
107

Table 4.31: Genetic coefficients of maize hybrids used for CSM-CERES-Maize model
P1: Thermal time from seedling emergence to the end of the juvenile phase (expressed in
degree days, ◦C day, above a base temperature of 8 ◦C) during which the plant is not
responsive to changes in photoperiod.
P2: Extent to which development (expressed as days) is delayed for each hour increase in
photoperiod above the longest photoperiod at which development proceeds at a
maximum rate (which is considered to be 12.5 h).
P5: Thermal time from silking to physiological maturity (expressed in degree days above
a base temperature of 8 °C).
G2: Maximum possible number of kernels per plant.
G3: Kernel filling rate during the linear grain filling stage and under optimum conditions
(mg d−1).
PHINT: Phyllochron interval; the interval in thermal time (degree days) between
successive leaf tip appearances (Hoogenboom et al., 1994).
Hybrid
P1 (°C d)
P2 (d)
P5 (°C d)
G2
G5 (mg d-1)
PHINT (°C d)
B-202 340.0 0.700 740.0 820.0 9.90 38.80
M-919 350.0 0.600 765.0 821.0 6.50 43.00
P-31-R-88 320.0 0.800 730.0 850.0 9.84 39.80
108

Table 4.32: Summary of observed and simulated results during model calibration with data recorded from at 300 kg N ha-1 in 2005 at all locations
Variable Unit Hybrid aObs bSim cRMSE dMPD
eB-202 54 54 0.58 0.62
Anthesis day fM-919 57 57 0.58 0.58
gP-31-R-88 55 54 1.00 1.82
B-202 96 96 0.82 0.69
Maturity day M-919 104 104 1.00 0.96
P-31-R-88 96 96 0.82 0.69
B-202 5.29 4.85 0.43 8.20
Maximum LAI M-919 5.02 4.88 0.16 2.73
P-31-R-88 5.23 4.86 0.37 7.07
B-202 9173 9821 649.03 7.06
Mat Yield kg ha-1 M-919 7350 7550 201.53 2.73
P-31-R-88 8969 9727 762.59 8.46
B-202 20025 20246 238.07 1.11
Total Biomass kg ha-1 M-919 19212 19567 389.65 1.87
P-31-R-88 19523 20143 626.86 3.18 a Observed b Simulated c Root mean square error d Mean percentage differencee Bemasal-202 f Monsanto-919 g Pioneer-31-R-88
109

110
Bemasal-202Bi
omas
s (k
g ha
-1)
0
4000
8000
12000
16000
20000
24000
Sim Biomass at 150kg N ha-1
Obs Biomass at 150 kg N ha-1
Pioneer-31-R-88
Fais
alab
ad
Monsanto-919
Bemasal-202
Biom
ass
(kg
ha-1
)
0
4000
8000
12000
16000
20000
Sim Biomass at 300 kg N ha-1
Obs Biomass at 300 kg N ha-1
Pioneer-31-R-88
Sar
godh
a
Monsanto-919
Bemasal-202
Days after sowing
0 20 40 60 80 100
Biom
ass
(kg
ha-1
)
0
4000
8000
12000
16000
20000Monsanto-919
Days after sowing
0 20 40 60 80 100
Pioneer-31-R-88
Days after sowing
0 20 40 60 80 100 120
Sah
iwal
Fig. 4.14: Observed and simulated biomass for three hybrids grown at different
locations during the year 2005; 300 kg N ha-1was used for calibration of model.

Bemasal-202
Leaf
are
a in
dex
0
1
2
3
4
5
6
Sim LAI at 150 kg N ha-1
Obs LAI at 150 kg N ha-1
Monsanto-919
Bemasal-202
Leaf
are
a in
dex
0
1
2
3
4
5
Sim LAI at 300 kg N ha-1
Obs LAI at 300 kg N ha-1
Pioneer-31-R-88
Sarg
odha
Monsanto-919
Bemasal-202
Days after sowing
0 20 40 60 80 100
Leaf
are
a in
dex
0
1
2
3
4
5Monsanto-919
Days after sowing
0 20 40 60 80 100
Pioneer-31-R-88
Days after sowing
0 20 40 60 80 100 120
Sahi
wal
Pioneer-31-R-88
Fais
alab
ad
Fig. 4.15: Comparison of observed and simulated LAI for three hybrids grown at
different locations during the 2005; 300 kg N ha-1was used for calibration of model.
111

112
There was a good agreement between observed and simulated grain yield with
RMSE ranging from 201.53 kg ha-1 for M-919, 649.03 for B-202 and 762.59 for P-31-R-
88. The value of MPD was 2.90, 8.20, and 8.46 for M-919, B-202 and P-31-R-88
respectively. The simulation of total crop biomass at harvest was also well with RMSE
238.07, 389.65 and 626.86 kg ha-1 among simulated and observed values for M-919, B-
202 and P-31-R-88 respectively at three locations. The MPD among observed and
simulated values was very low i.e. 1.11, 1.87 and 3.18 for Monsanto-919, Bemasal-202
and Pioneer-31-R-88, respectively. Time course simulation of crop biomass is presented
in Fig.4.15. Model simulated slightly more crop biomass at early stage as compared to
observed values but at final stage simulation was very good. Well simulation of
phenology, grain yield and biomass by CSM-CERES-Maize for different hybrids under
irrigated conditions had been previously reported by Gungula et al. (2003) and Soler et
al. (2007).
4.7.2. Model evaluation
Accuracy of the model simulations and performance of genetic coefficients were
assessed by running model with independent data set collected during the year of 2005
against nitrogen treatments 150, 200, 250 and 350 kg ha-1 at Faisalabad, Sargodha and
Sahiwal locations. The corresponding simulation results are explained as under.
4.7.2.1 Crop duration
i) Days to anthesis
The time for anthesis were delayed with increase in N level (Table 4.33) in all
hybrids at all locations. This was an indication that maize development and phenology
were influenced by N levels in the soil. The differences in anthesis dates among hybrids
at particular N rates suggested that the effects of N stress levels on maize phenology
differed among varieties even when those varieties are adapted to the ecological zone.
This was not reflected in the model predictions. At higher N rate (350 kg N ha-1) days to
anthesis were closely predicted with the highest deviations of -2 % (Table 4.33). At low
N levels, there were greater differences between predicted and observed values, with the
highest deviation observed from the 150 kg N ha-1 treatment at all locations. At this level
of nitrogen, average error between simulated and observed values ranged from 5 to 7 %
at different locations. This showed that days to anthesis were affected by N rates, but this

Table 4.33: Comparison of simulated and observe days to anthesis at different nitrogen levels and locations during year 2005
N Levels Bemasal-202 Monsanto-919 Pioneer-31-R-88 Av Kg ha-1 Sima Obsb Error (%) Sim Obs Error (%) Sim Obs Error (%) Sim Obs Error (%)
Faisalabad 150 53 51 3.9 56 54 3.7 53 51 3.9 54 52 3.8 200 53 51 3.9 56 55 1.8 53 52 1.9 54 53 2.5 250 53 52 1.9 56 56 0.0 53 53 0.0 54 54 0.6 350 53 53 0.0 56 57 -1.8 53 54 -1.9 54 55 -1.2
cRMSE (kg ha-1) 1.50 1.23 1.23 dMPD 2.44 1.82 1.92 Sargodha
150 55 51 7.8 58 55 5.5 55 52 5.8 56 53 6.3 200 55 52 5.8 58 56 3.6 55 54 1.9 56 54 3.7 250 55 53 3.8 58 57 1.8 55 55 0.0 56 55 1.8 350 55 55 0.0 58 58 0.0 55 56 -1.8 56 56 -0.6
RMSE (kg ha-1) 2.69 1.87 1.66 MPD 4.35 2.70 2.35 Sahiwal
150 54 52 3.8 57 53 7.5 54 52 3.8 55 52 5.1 200 54 52 3.8 57 55 3.6 54 53 1.9 55 53 3.1 250 54 53 1.9 57 56 1.8 54 54 0.0 55 54 1.2 350 54 54 0.0 57 57 0.0 54 55 -1.8 55 55 -0.6
RMSE (kg ha-1) 1.50 2.29 1.23 MPD 2.39 3.24 1.89
Av 54 52 3.1 57 56 2.3 54 53 1.1 55 54 2.2 a Simulated c Root mean square error * 300 kg N ha-1 was used for calibration b Observed d Mean percentage difference
113

had not been incorporated into the model. Hence, the model is not able to predict the
effects of N stress on anthesis.
Days to anthesis were delayed with increased N availability. This confirms the
findings of Ali et al. (1999) and Akbar et al. (2002). Kiniry (1991) and Gungula et al.
(2003) also reported that the CERES-Maize model assumes optimum N conditions in
predicting maize phenology.
Overall error between simulated and observed days to anthesis across all location
and N treatments was 2% during the year 2005. Model simulated days to anthesis at all
three locations with RMSE value ranging from 1.23 to 2.69 days, while the mean
percentage difference (MPD) among simulated and observed values ranged from 1.82 to
4.35.
ii) Days to maturity
Similar trend was observed in simulation of days to maturity as in simulation of
days to anthesis. CSM-CERES-Maize model did not consider the effect of N availability
on days to maturity by predicting same number of days to maturity at all N levels (Table
4.34). In general, error between simulated and observed days to maturity was lesser at
higher nitrogen levels as compared to lower. Over all, model simulated crop duration
with an average 1 % error. Root mean square error (RMSE) ranged from 0.87 to 2.74
days at all experimental sites for tested hybrids while the range of MPD was 0.73-2.58.
These results showed the model was able to predict maize phenology accurately at
higher N levels, but under N stress conditions, there could be greater deviations in model
predictions. The model can give better predictions under optimal N conditions only in
Pakistan. For accurate phenology predictions in N-deficient tropical soils, a N stress
factor needs to be incorporated into the model for farmers and researchers to be able to
use it with confidence. Similar recommendations were given by Kiniry (1991) and
Gungula et al. (2003).
4.7.2.2. Leaf area index
Evaluation of LAI with CSM-CERES-Maize model using the data from
experiment conducted in 2005 at different locations and nitrogen levels showed that the
best prediction was for the hybrid Monsanto-919 with an average error (0.1 %) and
RMSE ranging from 0.16 to 0.31 at different locations while the highest RSME (0.51)
114

115
Table 4.34: Comparison of simulated and observe days to maturity at different nitrogen levels and locations during year 2005
N Levels Bemasal-202 Monsanto-919 Pioneer-31-R-88 Av kg ha-1 Sima Obsb Error (%) Sim Obs Error (%) Sim Obs Error (%) Sim Obs Error (%)
Faisalaba
c
d
Sargodha
RMSE (kg haMPD Sahi
RMSE (kg haMPD
a
b
d 150 93 92 1.1 99 98 1.0 93 91 2.2 95 94 1.4 200 93 92 1.1 99 99 0.0 93 92 1.1 95 94 0.7 250 93 93 0.0 99 99 0.0 93 93 0.0 95 95 0.0 350 93 94 -1.1 99 101 -2.0 93 94 -1.1 95 96 -1.4
RMSE (kg ha-1) 0.87 1.12 1.23 MPD 0.81 0.75 1.09
150 100 96 4.2 109 105 3.8 100 96 4.2 103 99 4.0 200 100 97 3.1 109 107 1.9 100 97 3.1 103 100 2.7 250 100 98 2.0 109 108 0.9 100 98 2.0 103 101 1.6 350 100 99 1.0 109 108 0.9 100 99 1.0 103 102 1.0
-1) 2.74 2.35 2.74 2.58 1.78 2.58
wal 150 96 94 2.1 103 102 1.0 96 95 1.1 98 97 1.4 200 96 95 1.1 103 102 1.0 96 95 1.1 98 97 1.0 250 96 95 1.1 103 103 0.0 96 96 0.0 98 98 0.3 350 96 96 0.0 103 104 -1.0 96 97 -1.0 98 99 -0.7
-1) 1.23 0.87 0.87 1.06 0.73 0.78
Av 96 95 1.3 104 103 0.63 96 95.25 1.1 99 98 1.0
Simulated c Root mean square error Observed d Mean percentage difference

Table 4.35: Comparison of simulated and observe maximum leaf area index at different nitrogen levels and sites during year 2005
N Levels Bemasal-202 Monsanto-919 Pioneer-31-R-88 Av kg ha-1 Sima Obsb Error (%) Sim Obs Error (%) Sim Obs Error (%) Sim Obs Error (%)
Faisalabad 150 3.65 4.14 -11.8 3.53 3.96 -10.9 3.63 4.24 -14.4 3.60 4.11 -12.4 200 4.21 4.45 -5.4 4.08 4.32 -5.6 4.18 4.51 -7.3 4.16 4.43 -6.1 250 4.55 4.93 -7.7 4.49 4.82 -6.8 4.54 4.98 -8.8 4.53 4.91 -7.8 350 5.16 5.29 -2.5 5.19 4.98 4.2 5.14 5.15 -0.2 5.16 5.14 0.5
cRMSE (kg ha-1) 0.34 0.31 0.41 dMPD 6.85 6.87 7.68 Sargodha
150 3.54 3.95 -10.4 3.61 3.88 -7.0 3.59 3.81 -5.8 3.58 3.88 -7.7 200 4.08 4.24 -3.8 4.35 4.20 3.6 4.13 4.34 -4.8 4.19 4.26 -1.7 250 4.56 4.82 -5.4 4.91 4.70 4.5 4.62 4.79 -3.5 4.70 4.77 -1.5 350 4.94 5.23 -5.5 5.21 5.02 3.8 5.01 5.18 -3.3 5.05 5.14 -1.7
RMSE (kg ha-1) 0.29 0.21 0.19 MPD 6.27 4.70 4.36 Sahiwal
150 3.50 4.25 -17.6 3.30 3.33 -0.9 3.45 4.11 -16.1 3.42 3.90 -12.3 200 4.02 4.56 -11.8 3.79 3.84 -1.3 3.97 4.49 -11.6 3.93 4.30 -8.6 250 4.44 4.85 -8.5 4.21 4.36 -3.4 4.41 4.72 -6.6 4.35 4.64 -6.2 350 5.19 5.22 -0.6 5.02 4.75 5.7 5.15 5.19 -0.8 5.12 5.05 1.3
RMSE (kg ha-1) 0.51 0.16 0.45 MPD 9.63 2.83 8.74
Av 4.32 4.66 -7.6 4.31 4.35 -1.18 4.32 4.63 -6.9 4.32 4.54 -5.2 a Simulated c Root mean square error * 300 kg N ha-1 was used for calibrationb Observed d Mean percentage difference
116

and MPD (9.6) was obtained for the hybrid Bemasal-202 (Table 4.35). Overall there was
an underestimation of LAI in model predictions for all hybrids and nitrogen levels with
an average error of 5 %. This simulation error was higher up to 12% at lower level of
nitrogen (Table 4.35).
Due to enormity of data only comparison of simulated and observed LAI at 150
kg N ha-1(minimum N level) and 300 kg N ha-1 (best treatment) are presented in Fig 4.16.
Model simulated LAI well at higher nitrogen rates as compared to lesser .While a general
trend was noted that model simulated LAI higher as compared to observed in at early
stages but later on simulated leaf area was lesser as compared to observed (Fig. 4.15). It
might be due rapid senescence of leaves in model. These results are also supported by
previous work conducted by using CERES-Maize model, which suggest that functions
that describe leaf growth and senescence could be modified to improve the simulation of
LAI for specific environments (Ben Nouna et al., 2000, Soler et al., 2007). The d-
statistics for the comparison of simulated and observed LAI are given in Table 4.36.
Higher values of d-index show more accurate simulation of LAI. d- Index values ranged
from 0.70 to 0.99 for all treatments at different locations during 2005 (Table 4.36). Model
simulated lesser LAI at 150 kg N ha-1 and more at all other nitrogen levels but there was
no significant difference (P< 0.05) in simulated and observed crop LAI.
4.7.2.3. No of grain m-2
Grain number per unit area is usually the most critical determinant of crop yield
(Ritchie et al., 1998a). Data regarding number of grains m-2 (Table 4.37) showed that the
model simulated number of grains m-2 reasonably with RMSE ranging from 130 to 331
grains, while values of MPD ranged from 4 to 10 among hybrids and experimental sites.
Overall model simulations were fairly good with an average error among simulated and
observed value was 3.4% during the year 2005.
Generally model simulated number of grains m-2 fairly good at all nitrogen levels.
At Faisalabad and Sargodha model simulated with higher error 15 % and 6% respectively
at 150 kg N ha-1 that was the highest error between simulated and observed values. In
contrast at Sahiwal, model simulated with higher error 10% at 350 kg N ha-1 as compared
to all other levels of nitrogen levels. Nitrogen stress and difference in precipitation
during growing season might affect the performance of model. During growing season
117

118
Table 4.36: d-statistics of time course leaf area index at varying nitrogen levels and locations during 2004 and 2005.
N Levels Bemasal-202 Monsanto-919 Pioneer-31-R-88
kg ha-1 2004 2005 2004 2005 2004 2005
Faisalabad
150 0.78 0.74 0.86 0.77 0.80 0.71
200 0.88 0.82 0.95 0.87 0.91 0.81
250 0.96 0.90 0.98 0.94 0.97 0.91
300 a 0.98 0.96 0.99 0.97 0.98 0.96
350 0.99 0.98 0.98 0.98 0.99 0.98
Sargodha
150 0.87 0.90 0.91 0.93 0.89 0.91
200 0.97 0.97 0.98 0.97 0.97 0.98
250 0.99 0.98 0.99 0.98 0.99 0.99
300 a 0.99 0.98 0.99 0.99 0.98 0.97
350 0.99 0.99 0.99 0.99 0.99 0.99
Sahiwal
150 0.75 0.73 0.74 0.85 0.70 0.76
200 0.85 0.81 0.87 0.90 0.81 0.84
250 0.92 0.88 0.96 0.95 0.92 0.91
300 a 0.97 0.91 0.99 0.98 0.98 0.94
350 0.99 0.98 0.99 0.98 0.99 0.99 a treatment in 2005 used for calibration

Table 4.37: Comparison of simulated and observe no of grains m-2 at different nitrogen levels and locations during year 2005
N Levels Bemasal-202 Monsanto-919 Pioneer-31-R-88 Av
kg ha-1 Sima Obsb Error (%) Sim Obs Error (%) Sim Obs Error (%) Sim Obs Error (%)
Faisalabad 150 2199 2581 -14.8 2247 2613 -14.0 2324 2766 -16.0 2257 2653 -14.9 200 2725 2846 -4.3 2832 2705 4.7 2928 2935 -0.2 2828 2829 0.0 250 3237 3023 7.1 3253 3131 3.9 3347 3205 4.4 3279 3120 5.1 350 3447 3229 6.8 3433 3203 7.2 3555 3355 6.0 3478 3262 6.6
cRMSE (kg ha-1) 252 233 253 dMPD 8.22 7.44 6.65 Sargodha
150 2786 2497 11.6 2559 2497 2.5 2882 2796 3.1 2742 2597 5.6 200 2998 2739 9.5 2900 2697 7.5 3100 2937 5.5 2999 2791 7.5 250 3077 2946 4.4 3000 2890 3.8 3182 3040 4.7 3086 2959 4.3 350 3110 3059 1.7 3030 2926 3.6 3216 3182 1.1 3119 3056 2.1
RMSE (kg ha-1) 206 130 118 MPD 6.79 4.34 3.59 Sahiwal
150 2546 2662 -4.4 2383 2250 5.9 2628 2530 3.9 2519 2481 1.5 200 2965 3178 -6.7 2822 2776 1.7 3087 2724 13.3 2958 2893 2.3 250 3309 3272 1.1 3254 2865 13.6 3418 2977 14.8 3327 3038 9.5 350 3573 3317 7.7 3531 3145 12.3 3691 3373 9.4 3598 3278 9.8
RMSE (kg ha-1) 177 283 331 MPD 4.98 8.35 10.36
Av 2998 2946 1.6 2937 2808 4.38 3113 2985 4.16 3016 2913 3.4 a Simulated c Root mean square error * 300 kg N ha-1 was used for calibration b Observed d Mean percentage difference
119

August – November Faisalabad had minimum rainfall (159.5 mm) so at minimum
nitrogen level model simulated more as compared to observed number of grains m-2,
while at Sahiwal location maximum rainfall (242mm) was recorded during growing
season 2005.
4.7.2.4. Mean grain weight
Grain weight, in general, was simulated well for all hybrids and experimental sites
during evaluation (Table 4.38). The hybrid Mosanto-919 had the lowest average error
(2.9%), while the average error for the hybrid Bemasal-202 and Pioneer-31-R-88 was 3.5
and 3.7 %, respectively. The RMSE values varied from 0.007 to 0.027 g among all
hybrids and locations. Mean percent difference (MPD) among observed and simulated
value of grain weight was also higher (7.38 to 9.58) in hybrid Monsanto-919 at all
locations, however MPD ranged from 2.44 to 5.67 for hybrid Bemasal-202 and Pioneer-
31-R-88 at different sites, while MPD 9.08 was recorded at Faisalabad for hybrid
Bemasal-202. Average error among different nitrogen levels varied from 0.5 to 7.4 % in
different hybrids. Over all, model simulated mean grain weight with only 1 % error
(Table 4.38), indicating that the model CSM-CERES-Maize have ability to simulate the
mean grain weight. In some cases the model showed a trend to compensate between grain
number and grain weight, which could explain the good yield prediction (Sadler et al.,
2000).
4.7.2.5. Grain yield
The simulation results of grain yield are shown in Table 4.39. In general model
simulated fairly well at all three locations with RMSE value ranging from 443 kg ha-1 to
1056 kg ha-1, while the mean percentage difference (MPD) among simulated and
observed values ranged from 6.8 to 10.9. Overall, error between simulated and observed
yield across all location and N treatments was 8 % during the year 2005.
Generally model simulated grain yield fairly well at all nitrogen levels. At
Faisalabad model simulated 5.9 % less yield at 150 kg N ha-1.Highest error was recorded
against 350 kg N ha-1 At Sahiwal where model simulated 17.4 % more yield as compared
to observed while at all other levels of nitrogen model performed well for all locations
where error ranged from 5.4 to 12.2 %. Nitrogen stress and difference in precipitation
during growing season might affect the performance of model. During growing season
120

Table 4.38: Comparison of simulated and observe mean grains weight (g) at different nitrogen levels and locations during year 2005
N Levels Bemasal-202 Monsanto-919 Pioneer-31-R-88 Av kg ha-1 Sima Obsb Error (%) Sim Obs Error (%) Sim Obs Error (%) Sim Obs Error (%)
Faisalabad 150 0.287 0.263 9.3 0.209 0.215 -2.7 0.263 0.259 1.5 0.253 0.246 3.1 200 0.282 0.277 1.8 0.208 0.225 -7.3 0.257 0.271 -5.1 0.249 0.258 -3.3 250 0.277 0.280 -1.1 0.208 0.240 -13.3 0.262 0.286 -8.5 0.249 0.269 -7.4 350 0.291 0.288 1.0 0.208 0.244 -14.8 0.275 0.298 -7.6 0.258 0.277 -6.7
cRMSE (kg ha-1) 0.012 0.026 0.018 dMPD 3.32 9.52 5.67 Sargodha
150 0.260 0.238 9.2 0.260 0.214 21.6 0.256 0.278 -8.0 0.259 0.243 6.3 200 0.289 0.260 11.1 0.260 0.237 9.7 0.282 0.291 -3.2 0.277 0.263 5.4 250 0.307 0.284 8.1 0.260 0.265 -1.9 0.300 0.314 -4.5 0.289 0.288 0.5 350 0.323 0.299 7.9 0.260 0.274 -5.1 0.314 0.333 -5.8 0.299 0.302 -1.1
RMSE (kg ha-1) 0.025 0.027 0.017 MPD 9.08 9.58 5.38 Sahiwal
150 0.252 0.246 2.5 0.229 0.219 4.4 0.244 0.236 3.2 0.241 0.234 3.3 200 0.259 0.268 -3.3 0.228 0.232 -1.7 0.247 0.255 -3.1 0.245 0.252 -2.8 250 0.266 0.274 -3.0 0.228 0.249 -8.6 0.255 0.276 -7.8 0.249 0.266 -6.4 350 0.307 0.310 -1.0 0.228 0.267 -14.8 0.295 0.283 4.1 0.276 0.287 -3.6
RMSE (kg ha-1) 0.007 0.023 0.013 MPD 2.44 7.38 4.57
Av 0.283 0.274 3.5 0.232 0.240 -2.9 0.271 0.282 -3.7 0.262 0.265 -1.0 a Simulated c Root mean square error * 300 kg N ha-1 was used for calibration b Observed d Mean percentage difference
121

122
Table 4.39: Comparison of simulated and observe final grain yield (kg ha-1) at different nitrogen levels and locations during year 2005
N Levels Bemasal-202 Monsanto-919 Pioneer-31-R-88 Av kg ha-1 Sima Obsb Error (%) Sim Obs Error (%) Sim Obs Error (%) Sim Obs Error (%)
Faisalaba
c
d
Sargodha
RMSE (kg haMPD 9.1 Sahi
RMSE (kg haMPD
a
b
d 150 6322 6575 -3.8 4703 5167 -9.0 6110 6417 -4.8 5712 6053 -5.9 200 7687 7200 6.8 5903 5625 4.9 7525 7197 4.6 7038 6674 5.4 250 8963 7920 13.2 6767 6182 9.5 8757 8082 8.4 8162 7395 10.3 350 10027 8770 14.3 7141 6752 5.8 9794 8530 14.8 8987 8017 11.6
RMSE (kg ha-1) 861.6 443.3 750.9 MPD 9.5 7.3 8.1
150 7237 6980 3.7 6662 6090 9.4 7371 7100 3.8 7090 6723 5.6 200 8663 7630 13.5 7541 6910 9.1 8733 7670 13.9 8312 7403 12.2 250 9448 8550 10.5 7800 7370 5.8 9540 8450 12.9 8929 8123 9.7 350 10037 9230 8.7 7878 7660 2.8 10085 9050 11.4 9333 8647 7.7
-1) 805 489 930 6.8 10.5
wal 150 6418 6319 1.6 5447 5129 6.2 6402 5860 9.2 6089 5769 5.7 200 7682 7424 3.5 6435 5607 14.8 7624 7163 6.4 7247 6731 8.2 250 8796 8153 7.9 7403 6777 9.2 8700 8167 6.5 8300 7699 7.9 350 10967 8975 22.2 8032 7393 8.6 10874 8958 21.4 9958 8442 17.4
-1) 1056 630 1056 8.8 9.7 10.9
Av 8521 7811 8.5 6809 6389 6.4 8460 7720 9.04 7930 7306 8.0 Simulated c Root mean square error * 300 kg N ha-1 was used for calibrationObserved d Mean percentage difference

123
August – November Faisalabad had minimum rainfall (159.5 mm) so at minimum
nitrogen level model simulated lesser as compared to observed yield, while at Sahiwal
location maximum rainfall (242mm) was recorded during growing season 2005. Similar
type of results and conclusion also reported by Jara and Stockle (1999), Miao et al.
(2006) and Soler et al. (2007)
These evaluation results showed that genetic coefficients estimated for each
variety are robust and model calibrated once for a cultivar can accurately simulate growth
and yield.
4.7.2.6. Total dry matter
CSM-CERES-Maize was able to simulate time course crop biomass in good
agreement with observed biomass during evaluation with data collected during 2005. Due
to enormity of data only comparison of simulated and observed crop biomass at
minimum and best performing treatment of nitrogen are presented in fig 4.15. The d-
statistics for the comparison of simulated and observed crop biomass are given in Table
4.40. Higher values of d-index showed more accurate simulation of crop biomass. d-
Index values ranged from 0.97 to 0.99 for all treatments at all three locations (Table
4.41). CSM-CERES-Maize model simulated crop biomass slightly lesser at 150 kg N ha-1
and more at all other nitrogen levels but there was no significant difference (P< 0.05) in
simulated and observed crop biomass. Similar trend was observed for all hybrids (Table
4.40).
A good estimation of biomass by CSM-CERES-Maize for different hybrids under
irrigated and rain fed condition had been also reported by Soler et al. (2007) while Ben-
Nouna et al. (2000) has reported some disagreement between simulated and observed
biomass.
4.7.2.7. Harvest Index
Harvest Index (HI) is the ratio of grain yield and TDM. Similar trend was noted in
model simulation of HI as in grain yield and biomass simulation. The error among
simulated and observed value was higher in lower nitrogen treatments (Table 4.42).
Model simulated HI fairly well with an average error 8% between simulated and
observed HI. This error was higher in lower N rates and lesser at 350 kg N ha-1 or higher.
RMSE values ranged from 1.5 to 6 % for different hybrids sown at different location.

124
Table 4.40 : Comparison of simulated and observe total dry matter at different nitrogen levels and sites during year 2005
N Levels Bemasal-202 Monsanto-919 Pioneer-31-R-88 Av
kg ha-1 Sima Obsb Error (%) Sim Obs Error (%) Sim Obs Error (%) Sim Obs Error (%)
Faisalaba
c
d
Sargodha
RMSE (kg haMPD Sahi
RMSE (kg haMPD
a
b
d 150 14478 15694 -7.75 14038 15262 -8.02 14303 15772 -9.31 14273 15576 -8.37 200 17243 16823 2.50 16635 16487 0.90 17122 17072 0.29 17000 16794 1.23 250 19094 17996 6.10 18255 17365 5.13 18972 18445 2.86 18774 17935 4.67 350 20424 19414 5.20 19220 18292 5.07 20437 18772 8.87 20027 18826 6.38
RMSE (kg ha-1) 985 891 1141 MPD 5.39 4.78 5.33
150 15981 16650 -4.02 16270 16688 -2.50 16145 16532 -2.34 16132 16623 -2.96 200 18213 17909 1.70 18581 18174 2.24 18329 17814 2.89 18374 17966 2.27 250 19302 19105 1.03 19514 18883 3.34 19451 18908 2.87 19422 18965 2.41 350 20122 19814 1.55 19966 19146 4.28 20230 19544 3.51 20106 19501 3.10
-1) 410 594 543 2.08 3.09 2.90
wal 150 14324 15170 -5.58 13958 14792 -5.64 14209 14372 -1.13 14164 14778 -4.16 200 17017 17050 -0.19 16520 15910 3.83 16828 16570 1.56 16788 16510 1.69 250 19077 18500 3.12 18507 18080 2.36 18810 18280 2.90 18798 18287 2.80 350 22359 20110 11.18 20952 19370 8.17 22075 19790 11.55 21795 19757 10.32
-1) 1236 969 1183 5.02 5.00 4.28
Av 18136 17853 1.24 17701 17371 1.60 18076 17656 2.04 17971 17627 1.62 Simulated c Root mean square error * 300 kg N ha-1 was used for calibrationObserved d Mean percentage difference
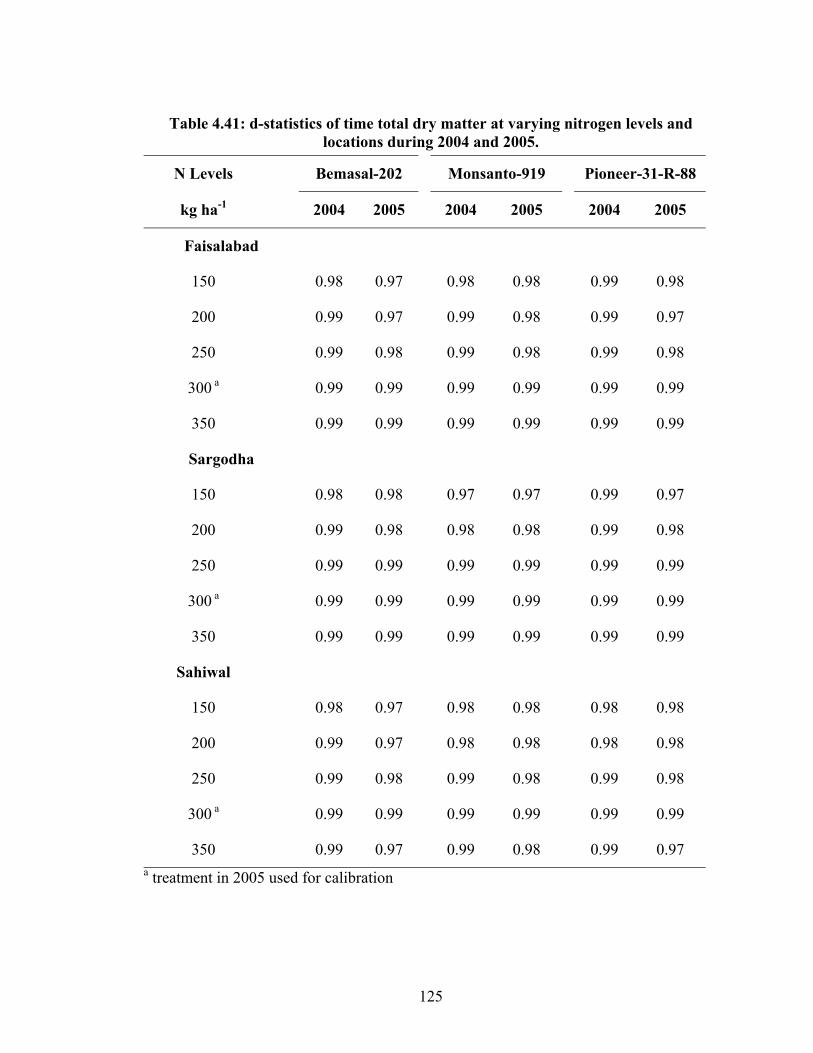
Table 4.41: d-statistics of time total dry matter at varying nitrogen levels and
locations during 2004 and 2005.
N Levels Bemasal-202 Monsanto-919 Pioneer-31-R-88
kg ha-1 2004 2005 2004 2005 2004 2005
Faisalabad
150 0.98 0.97 0.98 0.98 0.99 0.98
200 0.99 0.97 0.99 0.98 0.99 0.97
250 0.99 0.98 0.99 0.98 0.99 0.98
300 a 0.99 0.99 0.99 0.99 0.99 0.99
350 0.99 0.99 0.99 0.99 0.99 0.99
Sargodha
150 0.98 0.98 0.97 0.97 0.99 0.97
200 0.99 0.98 0.98 0.98 0.99 0.98
250 0.99 0.99 0.99 0.99 0.99 0.99
300 a 0.99 0.99 0.99 0.99 0.99 0.99
350 0.99 0.99 0.99 0.99 0.99 0.99
Sahiwal
150 0.98 0.97 0.98 0.98 0.98 0.98
200 0.99 0.97 0.98 0.98 0.98 0.98
250 0.99 0.98 0.99 0.98 0.99 0.98
300 a 0.99 0.99 0.99 0.99 0.99 0.99
350 0.99 0.97 0.99 0.98 0.99 0.97 a treatment in 2005 used for calibration
125
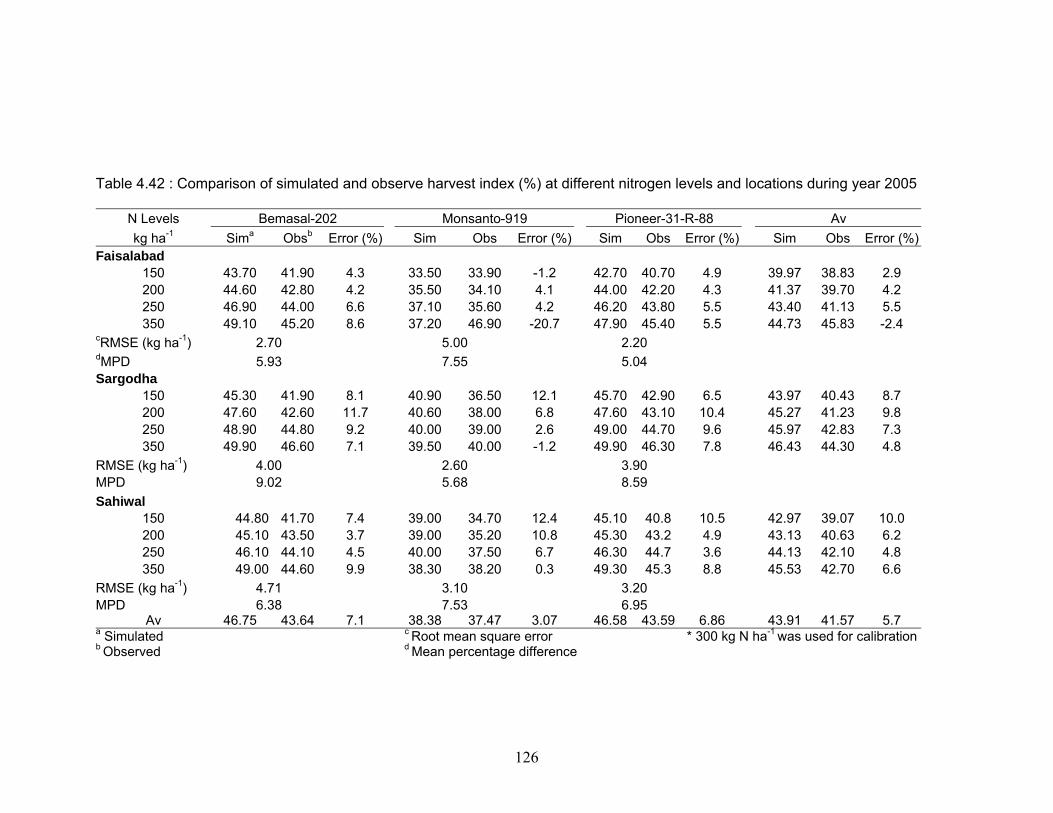
126
Table 4.42 : Comparison of simulated and observe harvest index (%) at different nitrogen levels and locations during year 2005
N Levels Bemasal-202 Monsanto-919 Pioneer-31-R-88 Av kg ha-1 Sima Obsb Error (%) Sim Obs Error (%) Sim Obs Error (%) Sim Obs Error (%)
Faisalaba
c
d
Sargodha
RMSE (kg haMPD 9.02 Sahi
RMSE (kg haMPD
a
b
d 150 43.70 41.90 4.3 33.50 33.90 -1.2 42.70 40.70 4.9 39.97 38.83 2.9 200 44.60 42.80 4.2 35.50 34.10 4.1 44.00 42.20 4.3 41.37 39.70 4.2 250 46.90 44.00 6.6 37.10 35.60 4.2 46.20 43.80 5.5 43.40 41.13 5.5 350 49.10 45.20 8.6 37.20 46.90 -20.7 47.90 45.40 5.5 44.73 45.83 -2.4
RMSE (kg ha-1) 2.70 5.00 2.20 MPD 5.93 7.55 5.04
150 45.30 41.90 8.1 40.90 36.50 12.1 45.70 42.90 6.5 43.97 40.43 8.7 200 47.60 42.60 11.7 40.60 38.00 6.8 47.60 43.10 10.4 45.27 41.23 9.8 250 48.90 44.80 9.2 40.00 39.00 2.6 49.00 44.70 9.6 45.97 42.83 7.3 350 49.90 46.60 7.1 39.50 40.00 -1.2 49.90 46.30 7.8 46.43 44.30 4.8
-1) 4.00 2.60 3.90 5.68 8.59
wal 150 44.80 41.70 7.4 39.00 34.70 12.4 45.10 40.8 10.5 42.97 39.07 10.0 200 45.10 43.50 3.7 39.00 35.20 10.8 45.30 43.2 4.9 43.13 40.63 6.2 250 46.10 44.10 4.5 40.00 37.50 6.7 46.30 44.7 3.6 44.13 42.10 4.8 350 49.00 44.60 9.9 38.30 38.20 0.3 49.30 45.3 8.8 45.53 42.70 6.6
-1) 4.71 3.10 3.20 6.38 7.53 6.95
Av 46.75 43.64 7.1 38.38 37.47 3.07 46.58 43.59 6.86 43.91 41.57 5.7 Simulated c Root mean square error * 300 kg N ha-1 was used for calibrationObserved d Mean percentage difference

127
The best simulation results were noted in hybrid Monsanto-919 with minimum value of
error (4%) and MPD values 5.16, 2.94, 4.42 were recorded at Faisalabad, Sargodha and
Sahiwal, respectively. However values of MPD ranged from 6 to 14 for the hybrid
Bemasal-202 and Pioneer 31-R-88.
4.7.3. Validation
Further validity of CSM-CERES-Maize model was evaluated by comparing
simulated and observed data collected during year 2004 for five Nitrogen rates 150, 200,
250, 300, 350 kg N ha-1 at all locations. The corresponding simulation results are
explained as follows
4.7.3.1. Grain Yield
The corresponding simulation results of grain yield are shown in Appendix 4.4.
There was good agreement between observed and simulated grain yield, model simulated
7682 kg ha-1 average grain yield that is 9.3 % more as compared to average observed
grain yield (7005). Overall RMSE ranged from 185 to 1181 kg ha-1 for different hybrids
and location while range of MPD was 2.7 to 15.2. Model simulated reasonably good for
all nitrogen levels with an average error ranging from 2.0 to 14.5 %. The model
performance was better in year 2005 with 8% error as compared to year 2004 during that
error between simulated and observed grain yield was 9.3 %. It might be due to
difference in precipitation as during 2005 all locations had more rainfall as compared to
2004 (Appendix 4.1 & 4.2). The role of rainfall differences in performance of CERES-
Maize model had also been reported by Miao et al. (2006) and Jara and stockle (1999).
Figure 4.16 showed that there was a close fit between simulated and observed
results at different locations. For all treatments, percentage variance (R2) varied 0.87 to
0.98 for different hybrids sown at different sites.
4.7.3.2. Total Dry Matter
CSM-CERES-Maize was able to simulate time course crop biomass in good agreement
with observed biomass during validation with data collected during 2004. Due to
enormity of data only comparison of simulated and observed crop biomass at minimum
rate (150 kg N ha-1) and best performing treatment of nitrogen (300 kg N ha-1) are
presented in Fig 4.17. The d-statistics for the comparison of simulated and observed crop
biomass are given in Table 4.43. Higher values of d-index showed more accurate

Bemasal-202
Obs
erve
d
4000
6000
8000
10000
12000 y^ = 0.7103x + 1795.1 R2 = 0.93RMSE = 911 MPD = 9.7
Monsanto-919 Pioneer-31-R-88
Fais
alab
ad
Bemasal-202
Obs
erve
d
4000
6000
8000
10000
Monsanto-919 Pioneer-31-R-88
Sarg
odha
Bemasal-202
4000 6000 8000 10000
Obs
erve
d
4000
6000
8000
10000
Pioneer-31-R-88
4000 6000 8000 10000 12000
Sahi
wal
Monsanto-919
4000 6000 8000 10000
1:1 Linegrain yield
Simulated Simulated Simulated
y^ = 0.9203x + 36.9 R2 = 0.89RMSE = 501 MPD = 8.1
y^ = 0.6955x + 1632.1 R2 = 0.98RMSE = 1148 MPD =13.6
y^ = 0.859x + 139.3 R2 = 0.87 RMSE = 1181 MPD = 14.5
y^= 1.2733x - 1805.4 R2= 0.93RMSE = 185 MPD = 2.7
y^ = 0.7588x + 973.8 R2 = 0.92RMSE = 1226 MPD = 15.2
y^ = 0.9977x - 591.8 R2 = 0.97RMSE = 642 MPD = 8.8
y^= 1.021x - 381.4 R2= 0.95RMSE = 307 MPD = 4.9
y^ = 1.1415x - 1441.6 R2 = 0.96RMSE = 470 MPD = 6.3
Fig. 4.16: Relationship between observed and simulated grain yield for three hybrids
grown with 5 N level at different locations during the validation of model with data of 2005; 300 kg N ha-1was used for calibration of model.
128

B-2002
Biom
ass
(kg
ha-1
)
0
4000
8000
12000
16000
20000
24000
Sim Biomass at 150kg N ha-1
Obs Biomass at 150 kg N ha-1
P-31-R-88
Fais
alab
ad
M-919
B-2002
Biom
ass
(kg
ha-1
)
0
4000
8000
12000
16000
20000
Sim Biomass at 300 kg N ha-1
Obs Biomass at 300 kg N ha-1
P-31-R-88
Sar
godh
a
M-919
B-2002
Days after sowing
0 20 40 60 80 100
Bio
mas
s (k
g ha
-1)
0
4000
8000
12000
16000
20000
M-919
Days after sowing
0 20 40 60 80 100
P-31-R-88
Days after sowing
0 20 40 60 80 100 120
Sahi
wal
Fig. 4.17: Observed and simulated biomass for three hybrids grown at different
locations during the year 2004.
129

130
Table 4.43 : Comparison of simulated and observe total dry matter at different nitrogen levels and sites during year 2004
N Levels Bemasal-202 Monsanto-919 Pioneer-31-R-88 Av kg ha-1 Sima Obsb Error (%) Sim Obs Error (%) Sim Obs Error (%) Sim Obs Error (%)
d 150 15179 16279 -6.76 14371 14854 -3.25 14859 15620 -4.87 14803 15584 -5.01 200 17861 17868 -0.04 16659 15901 4.77 17338 17294 0.25 17286 17021 1.56 250 19460 18639 4.40 17529 16693 5.01 18697 18303 2.15 18562 17878 3.82 300 20170 19986 0.92 17877 17524 2.01 19581 18908 3.56 19209 18806 2.14 350 20547 19692 4.34 17980 17119 5.03 20058 18890 6.18 19528 18567 5.18
-1) 728 689 715 3.29 4.01 3.40
150 15414 16108 -4.31 14402 15055 -4.34 15198 15906 -4.45 15005 15690 -4.37 200 17801 17387 2.38 16049 15766 1.80 17492 17513 -0.12 17114 16889 1.33 250 19203 18361 4.59 16805 16549 1.55 18881 18196 3.76 18296 17702 3.36 300 19746 19545 1.03 17034 17022 0.07 19480 18954 2.78 18753 18507 1.33 350 19954 19078 4.59 17128 16928 1.18 19664 18615 5.64 18915 18207 3.89
-1) 659 350 685 3.38 1.79 3.35
l 150 12862 13492 -4.67 12134 12941 -6.24 12480 13073 -4.54 12492 13169 -5.14 200 15652 15226 2.80 14619 14382 1.65 15052 14561 3.37 15108 14723 2.61 250 17509 17137 2.17 15837 15156 4.49 16667 16533 0.81 16671 16275 2.43 300 18615 18356 1.41 16493 16277 1.33 17579 17536 0.25 17562 17390 0.99 350 19370 18023 7.47 16853 16353 3.06 18148 17210 5.45 18124 17195 5.40
-1) 721 542 546 3.70 3.35 2.88
Av 17956 17678 1.35 16118 15901 1.21 17412 17141 1.35 17162 16907 1.51 c Root mean square error * 300 kg N ha-1 was used for calibration
Faisalaba
cRMSE (kg hadMPD Sargodha
RMSE (kg haMPD Sahiwa
RMSE (kg haMPD
a Simulated b Observed d Mean percentage difference

131
simulation of crop biomass. d- Index values ranged from 0.97 to 0.99 for all treatments at
all three locations (Table 4.41). CSM-CERES-Maize model simulated crop biomass
slightly lesser at 150 kg N ha-1 and more at all other nitrogen levels but there was no
significant difference (P< 0.05) in simulated and observed crop biomass. Similar trend
was observed for all hybrids.
Table 4.43 showed that there was good agreement between observed and
simulated total dry matter, model simulated 17162 kg ha-1 average TDM that was 1.5 %
more as compared to average observed TDM (16907 kg ha-1). Overall, RMSE ranged
from 350 to 728 kg ha-1 for different hybrids and location while range of MPD was 1.8 to
4.0. Model simulated reasonably good for all nitrogen levels with an average error
ranging from 1 to 5.4 %.
A comparison simulated and observed total dry matter at final harvest is presented
in fig. 4.18. A close fit (R2 varied from 0.92 to 0.99) was noted between observed and
simulated results for different hybrids sown at different locations indicating that with
correct inputs of nitrogen and varietal characteristics, the CSM-CERES-Maize captured
maize total dry matter response over different varieties, nitrogen rates, locations and
seasons in a satisfactory way. The outliers in the simulation results were due to
conditions that were not taken into account by the model, such as pest infestation,
shading from trees, spraying of pesticides and intercultural practices (Dzotsi et al., 2003).
Overall, results showed that performance of CSM-CERES- Maize model was
good during evaluation and validation under given set of conditions and this can further
be used to design precise agronomic practices for sustainable yield of maize crop in semi
arid climatic conditions as reported by others (Zalud and Dubrovsky, 2002; Dzotsi et al.,
2003; Cedron et al., 2005; Soler et al., 2007)
4.8. CLIMATE CHANGE IMPACTS ON MAIZE PRODUCTIVITY The impacts of climate change on phenology, growth, and yield of maize were
assessed with the use of CSM-CERES-Maize model run with weather series presenting
both the present and changed climates. In order that the findings obtained by a
comparison of model yields for different climates are reliable and more realistic, multi
annual crop model simulations were run for each scenario. Comparison of simulations

Bemasal-202
Obs
erev
ed
12000
14000
16000
18000
20000
22000
24000
Pioneer-31-R-88
Fais
alab
ad
Monsanto-919
Bemasal-202
Obs
erev
ed
12000
14000
16000
18000
20000
22000
Pioneer-31-R-88
Sarg
odha
Monsanto-919
Bemasal-202
Simulated
1200
0
1400
0
1600
0
1800
0
2000
0
2200
0
Obs
erev
ed
12000
14000
16000
18000
20000
22000
Pioneer-31-R-88
Simulated
1200
0
1400
0
1600
0
1800
0
2000
0
2200
0
2400
0
Sahi
wal
Monsanto-919
Simulated
1200
0
1400
0
1600
0
1800
0
2000
0
2200
0
1:1 Line
y^ = 0.6675x + 6047.8 R2 = 0.95RMSE = 728 MPD = 3.3
y^ = 0.6791x + 4953.4 R2 = 0.92RMSE = 689 MPD = 4.0
y^ = 0.7106x + 5004.5 R2 = 0.94RMSE = 659 MPD = 3.4
y^ = 0.7135x + 4645.9 R2 = 0.93RMSE = 350 MPD = 1.79
y^ = 0.6599x + 5855.3 R2 = 0.99RMSE = 715 MPD = 3.4
y^ = 0.6432x + 6166.9 R2 = 0.98RMSE = 685 MPD = 3.4
y^ = 0.6432x + 6166.9 R2 = 0.96RMSE = 546 MPD = 2.9
y^ = 0.7135x + 4645.9 R2 = 0.96RMSE = 542 MPD = 3.4
y^ = 0.7106x + 5004.5 R2 = 0.97RMSE = 721 MPD = 3.7
Fig. 4.18: Relationship between observed and simulated total dry matter for three hybrids grown with 5 N rates at different locations during the validation of
model with data 2004.
132

133
under current and future changed climate was determined to study the impact of climate
change on maize productivity. The crop simulations were run with observed pedological,
physiological and cultivation data specific for each individual year and site. Observed
weather series for 2005 were used in present climate simulations. The weather series for
simulations in the future changed climate were obtained by a direct modification in 30
years observed weather series according to climate change scenarios (Table 3.3) as
suggested by GOP/ UNEP (1998).
4.8.1. Impact of CO2 Levels
Table 4.44 showed model simulations that elaborate the impact of change in CO2
concentration i.e. from 360 ppm to 550ppm, under present temperature and precipitation,
on phenology, grain yield and total dry matter of maize hybrids grown at different
experimental sites. The increase in CO2 concentrations had no effects on crop duration at
all experimental sites.
A little increase in maximum leaf area index (LAI) was observed with increasing
level of CO2 from 360 ppm to 550 ppm at all three sites. The difference between both
concentrations was ranged from -0.42 to 2%. Similarly increasing CO2 concentration has
promotive effects on number of grains m-2. The increment was an average over hybrids
3.6, 4.6 and 4.4 % at Faisalabad, Sargodha and Sahiwal, respectively. Mean grain weight
was negatively (-1.12 and -2.1%) affected by CO2 increase at Faisalabad and Sargodha. It
was unaffected by change in CO2 concentration at Sahiwal (Table 4.44).
A slight increase in total dry matter (TDM) was recorded at all the three locations
with increases in CO2 concentration without change in temperature and rainfall. The
average over hybrids, differences were 2.08% (20683 vs 21113), 3.79% (21127 vs
21928) and 3.35% (21052 vs 21758) at Faisalabad, Sargodha and Sahiwal, respectively.
Similarly increase in CO2 concentration from 360 ppm to 550 ppm had significant effects
on grain yield at all locations. These effects were considerably higher (11.28%) more
yield at Sahiwal as compared to 2.12 and 3.72% at Faisalabad and Sargodha locations
with 550 ppm CO2. The more efficient use of CO2 fertilization at Sahiwal might be due to
more precipitation and relatively higher temperature at Sahiwal as compared to
Faisalabad and Sargodha. Similar results were reported by Bunce (2000) who showed
that higher ambient CO2 will allow reducing the transpiration rate through decreased

134
Table 4.44-:Impact of CO2 concentration on phenology, growth and yield of maize hybrids grown at different locations Variable Bemasal-202 Monsanto-919 Pioneer-31-R-88 Av
360 ppm 500 ppm
Diff (%)
360 ppm
500 ppm
Diff (%) 360 ppm 500 ppm
Diff (%) 360 ppm 500 ppm
Diff (%)
Faisalabad Crop duration (d) 103 103 0 109 109 0 103 103 0 105 105 0 Max. L A I 4.73 4.74 0.21 4.73 4.71 -0.42 4.72 4.74 0.42 4.73 4.73 0.07 TDM (kg ha-1) 21113 21539 2.02 19870 20336 2.34 21067 21465 1.89 20683 21113 2.08 No of grains m-2 3085 3195 3.55 3084 3197 3.67 3178 3292 3.59 3116 3228 3.60 Mean grain weight 0.330 0.320 -3.03 0.25 0.25 0.00 0.31 0.31 0.00 0 0 -1.12 Grain yield (kg ha-1) 10022 10187 1.64 7684 7965 3.65 9999 10140 1.41 9235 9431 2.12
Sargodha Crop duration (d) 106 106 0 113 113 0 101.6 101.6 0 107 107 0 Max. L A I 5.15 5.24 1.75 5.16 5.25 1.74 5.02 5.12 1.99 5.11 5.20 1.83 TDM (kg ha-1) 21889 22695 3.68 20263 21088 4.07 21228 22000 3.64 21127 21928 3.79 No of grains m-2 3033 3173 4.60 2993 3130 4.57 3159 3307 4.69 3062 3203 4.62 Mean grain weight 0.360 0.350 -2.78 0.270 0.270 0.00 0.340 0.330 -2.94 0.323 0.317 -2.06 Grain yield (kg ha-1) 10768 11136 3.41 8030 8395 4.55 10641 11003 3.40 9813 10178 3.72
Sahiwal Crop duration (d) 98 98 0 104 104 0 98 98 0 100 100 0 Max. L A I 5.11 5.18 1.37 5.12 5.14 0.39 5.10 5.16 1.18 5.11 5.16 0.98 TDM (kg ha-1) 21623 22336 3.29 19875 20586 3.58 21659 22352 3.20 21052 21758 3.35 No of grains m-2 3200 3339 4.34 3200 3343 4.46 3307 3452 4.37 3236 3378 4.39 Mean grain weight 0.320 0.320 0 0.23 0.23 0 0.31 0.31 0 0.287 0.287 0 Grain yield (kg ha-1) 1186 1577 32.95 7357 7684 4.44 10236 10622 31.17 3260 3627 11.28

135
stomatal conductance especially at higher temperature. This would lead to improve water
use efficiency (WUE) and there by to a lower probability of water stress occurrence
(Kimbal, 1983). Trnka (2004) also reported that increased CO2 contributed to the
intensified photosynthesis and improved WUE. Abraha (2006) also reported that
doubling of CO2 caused an increase in simulated grain yield of maize by an average
16.40 % as compared to baseline grain yield at 350 ppm.
7.8.2. Impact of change in temperature
Temperature exerts a major effect on the rate at which plants develop and growth
can be retarded when the temperature is either too low or too high (Ong and Monteith,
1985). The results of this study (Table 4.45, 4.46 and 4.47) showed that increase in
temperature shortened the crop duration from planting to physiological maturity, retard
growth and decreased yield as compared to current at all locations. However, response of
hybrids were diverse at different sites discussed as under
a) Hybrid Bemasal-202
Table 4.45 showed that 0.9 °C increase in temperature that is expected in 2020
reduced crop duration from 5 to 6 % at different locations under both 360 ppm and 550
ppm CO2 concentrations. This reduction in crop duration was higher (6 to 10%) with
increase in temperature 1.8 °C i.e. expected in 2050. There were no interactive effects of
temperature and CO2 were noted on crop phenology.
The increase in temperature had also negative effects on leaf area index (LAI)
however these effects were lesser under 550 ppm CO2 concentrations as compared to 360
ppm. The reduction in LAI were 2 to 6 % and 6 to 15 % at 0.9 °C (in 2020) and 1.8 °C
(in 2050) increase in temperature, respectively under 360 ppm CO2 concentration.
Increase in CO2 however reduced the negative impacts of high temperature at all
locations. The reduction in LAI was 0.6 to 3 % and 4 to 11 % at 0.9 °C and 1.8 °C
increase in current mean temperature, respectively under 550 ppm CO2 concentration.
Total dry matter (TDM) accumulation was also negatively affected like LAI by
increase in current mean temperature. The reduction in TDM as compared to current were
ranged from 5 to 8 % and 13 to 18 % at 0.9 °C and 1.8 °C increase in temperature,
respectively with 360 ppm CO2 concentration, while the equivalent reduction in TDM at

136
Table 4.45: Impact of temperature and CO2 scenarios on phenology, growth, yield, and yield component of maize hybrid Bemasal-202 grown at different sites
Variable Faisalabad Sargodha Sahiwal
Temperature Current 0.9 °C Diff a (%) 1.8 °C Diff
(%) Current 0.9 °C Diff (%) 1.8 °C Diff
(%) Current 0.9 °C Diff (%) 1.8 °C Diff
(%) CO2 Concentration 360 ppm
Crop duration (d) 103 98 -5.16 94 -8.98 106 99 -6.03 95 -10.32 98 94 -3.64 92 -6.37
Max. L A I 4.73 4.62 -2.33 4.42 -6.55 5.15 4.84 -6.02 4.37 -15.15 5.11 4.86 -4.89 4.48 -12.33
TDM (kg ha-1) 21113 19990 -5.32 18411 -12.80 21889 20081 -8.26 17868 -18.37 21623 19877 -8.08 17810 -17.63
No of grains m-2 3085 3079 -0.18 2962 -4.00 3033 2977 -1.85 2844 -6.25 3200 3060 -4.38 2862 -10.57
Mean grain weight(g) 0.33 0.31 -6.06 0.29 -12.12 0.36 0.33 -8.33 0.30 -16.67 0.32 0.30 -6.25 0.28 -12.50
Grain yield (kg ha-1) 10022 9434 -5.86 8559 -14.60 10768 9767 -9.30 8615 -20.00 10186 9035 -11.30 7979 -21.67
CO2 Concentration 550 ppm
Crop duration (d) 103 98 -5.16 94 -8.98 106 99 -6.03 95 -10.32 98 94 -3.64 92 -6.37
Max. L A I 4.73 4.70 -0.63 4.54 -4.02 5.15 4.98 -3.30 4.57 -11.26 5.11 5.01 -1.96 4.66 -8.81
TDM (kg ha-1) 21113 20633 -2.27 19219 -8.97 21889 21053 -3.82 18939 -13.47 21623 20784 -3.88 18799 -13.06
No of grains m-2 3085 3201 3.77 3094 0.30 3033 3123 2.96 2995 -1.27 3200 3201 0.02 3004 -6.12
Mean grain weight(g) 0.33 0.30 -9.09 0.29 -12.12 0.36 0.33 -8.33 0.30 -16.67 0.32 0.30 -6.25 0.28 -12.50
Grain yield (kg ha-1) 10022 9714 -3.08 8886 -11.33 10768 10209 -5.20 9071 -15.76 10186 9440 -7.32 8375 -17.78 a Difference from current

550 ppm CO2 concentration ranged from 2 to 4 % and 9 to 14 % at all three locations for
0.9 °C and 1.8 °C increase in current mean temperature.
Temperature effects on yield are complex. Crop responses to a change in
temperature depend on the temperature optima of photosynthesis, growth, and yield, all
of which may differ (Conroy et al., 1994).
Yield and yield components were negatively affected (Table 4.45) by increase in
temperature under both 360 ppm and 550 ppm CO2 scenarios. According to model
simulations in 2020 with 0.9 °C increase in current temperature yield of maize hybrid
Bemasal-202 will reduced up to 6 % (10022 vs 9434), 9 % (10768 vs 9767) and 11%
(10186 vs 9035) at Faisalabad, Sargodha and Sahiwal respectively under 360 ppm CO2
concentration. However increase in CO2 concentration from 360 to 550 ppm at this
temperature scenario had some promotive effect on maize productivity and differences
between current crop yield and yield under future climate change scenarios (550 ppm
CO2 with 0.9 °C increase in present temperature) reduced up to 3% (10022 vs 9714), 5 %
(10768 vs 10209) and 7 % (10186 vs 9440) at Faisalabad, Sargodha and Sahiwal,
respectively.
Increase in temperature 1.8 °C as predicted for 2050 will be highly hazardous for
maize productivity in Pakistan. Table 4.45 showed that increase in temperature will
reduce grain yield by 15, 20, and 22 % at Faisalabad, Sargodha and Sahiwal, respectively
with out changing CO2 concentration (360 ppm). The reduction in simulated grain yield
was ranged from 11 to 18 % under 550 ppm CO2 concentration and 1.8 °C increase in
present temperature at different locations. The reduction in grain yield under future
climate change scenarios might be attributed to negative effects of climate extremes on
number of grains m-2 and mean grain weight (Table 4.45).
b) Hybrid Monsanto-919
Temperature affected Monsanto-919 in a similar way as in Bemasal-202.
However grain yield of Monsanto-919 was affected more by higher temperature and CO2
scenarios as compared to other hybrids (Table 4.46).
Table 4.46 showed that 0.9 °C increase in temperature that is expected in 2020
reduced crop duration from 5.5 to 6.8 % at different locations under both 360 ppm and
550 ppm CO2 concentrations. This reduction in crop duration was higher (9 to 12 %) with
137

Table 4.46: Impact of temperature and CO2 scenarios on phenology, growth, yield, and yield component of maize hybrid Monsanto-919 grown at different sites
Variable Faisalabad Sargodha Sahiwal
Temperature Current 0.9 °C Diff a (%) 1.8 °C Diff
(%) Current 0.9 °C Diff (%) 1.8 °C Diff
(%) Current 0.9 °C Diff (%) 1.8 °C Diff
(%)
CO2 Concentration 360 ppm
Crop duration (d) 109 103 -5.57 98 -10.24 113 105 -6.79 100 -11.24 104 98 -5.55 95 -8.92
Max. L A I 4.73 4.69 -0.85 4.47 -5.50 5.16 4.94 -4.26 4.53 -12.21 5.12 4.88 -4.69 4.53 -11.52
TDM (kg ha-1) 19870 18666 -6.06 16850 -15.20 20263 18424 -9.08 16390 -19.11 19875 17862 -10.13 15826 -20.37
No of grains m-2 3084 3075 -0.29 2977 -3.48 2993 2966 -0.91 2834 -5.31 3200 3074 -3.93 2881 -9.98
Mean grain weight(g) 0.25 0.23 -8.00 0.21 -16.00 0.27 0.24 -11.11 0.22 -18.52 0.23 0.21 -8.70 0.20 -13.04
Grain yield (kg ha-1) 7684 6952 -9.53 6151 -19.96 8030 7056 -12.13 6148 -23.44 7357 6434 -12.55 5656 -23.11
CO2 Concentration 550 ppm
Crop duration (d) 109 103 -5.66 98 -10.24 113 105 -6.79 100 -11.24 104 98 -5.55 95 -8.92
Max. L A I 4.73 4.72 -0.21 4.55 -3.81 5.16 5.05 -2.13 4.71 -8.72 5.12 4.98 -2.73 4.69 -8.40
TDM (kg ha-1) 19870 19303 -2.85 17626 -11.29 20263 19323 -4.64 17340 -14.42 19875 18676 -6.03 16704 -15.95
No of grains m-2 3084 3197 3.67 3110 0.85 2993 3108 3.84 2981 -0.42 3200 3218 0.54 3025 -5.47
Mean grain weight(g) 0.25 0.23 -8.00 0.21 -16.00 0.27 0.24 -11.11 0.22 -18.52 0.23 0.21 -8.70 0.20 -13.04
Grain yield (kg ha-1) 7684 7226 -5.96 6425 -16.39 8030 7394 -7.92 6464 -19.50 7357 6733 -8.48 5939 -19.27
a Difference from current
138

increase in temperature 1.8 °C i.e. expected in 2050 at all sites. No interactive effects of
temperature and CO2 were noted on crop phenology.
The increase in temperature had negative effects on leaf area index (LAI)
however these effects were lesser under 550 ppm CO2 concentrations as compared to 360
ppm. The reduction in LAI were 0.85 to 4.7 % and 5.5 to 12.2 % at 0.9 °C (in 2020) and
1.8 °C (in 2050) increase in temperature, respectively under 360 ppm CO2 concentration.
Increase in CO2 however reduced the negative impacts of high temperature at all
locations. The reduction in LAI was ranged from 0.21 to 2.7 % and 3.8 to 8.7 % at 0.9 °C
and 1.8 °C increase in current mean temperature, respectively under 550 ppm CO2
concentration at all three sites.
Total dry matter (TDM) accumulation was also negatively affected like LAI by
increase in current mean temperature. The reduction in simulated TDM as compared to
current were ranged from 6 to 10 % and 15 to 20 % at 0.9 °C and 1.8 °C increase in
temperature, respectively with 360 ppm CO2 concentration. While the equivalent
reduction in TDM at 550 ppm CO2 concentration were ranged from 0.2 to 2.7 % and 3.8
to 8.7 % at all three locations for 0.9 °C and 1.8 °C increase in current mean temperature,
respectively.
Yield and yield components were negatively affected (Table 4.46) by increase in
temperature under both 360 ppm and 550 ppm CO2 scenarios. According to model
simulations for 2020 with 0.9 °C increase in current temperature, yield of maize hybrid
Monsanto-919 will reduced up to 9.5 % (7684 vs 6952), 12.1 % (8030 vs 7056) and
12.5% (7357 vs 6434) at Faisalabad, Sargodha and Sahiwal respectively under 360 ppm
CO2 concentration. However increase in CO2 concentration from 360 to 550 ppm at this
temperature scenario had some promotive effect on maize productivity and differences
between current crop yield and yield under future climate change scenarios (550 ppm
CO2 with 0.9 °C increase in present temperature) reduced up to 6 % (7684 vs 7226), 8 %
(8030 vs 7394) and 8.5 % (7357 vs 6733) at Faisalabad, Sargodha and Sahiwal,
respectively.
Increase in temperature 1.8 °C as predicted for 2050 will be highly hazardous for
maize productivity in Pakistan. Table 4.46 showed that increase in temperature will
reduce grain yield 20% at Faisalabad and 23 % at Sargodha and Sahiwal, with out
139

changing CO2 concentration (360 ppm). The reduction in simulated grain yield was
ranged from 16 to 20 % under 550 ppm CO2 concentration and 1.8 °C increase in present
temperature at different locations. The reduction in grain yield under future climate
change scenarios might be attributed to negative effects of climate extremes on number
of grains m-2 and mean grain weight (Table 4.46).
c) Hybrid Pioneer-31-R-88
Table 4.47 showed that 0.9 °C increase in temperature that is expected in 2020
reduced crop duration 5.5, 4.4 and 3.9 % at Faisalabad, Sargodha and Sahiwal location
under both 360 ppm and 550 ppm CO2 concentrations. This reduction in crop duration
was higher (6.7 to 9.2%) with increase in temperature 1.8 °C i.e. expected in 2050. There
were no interactive effects of temperature and CO2 were noted on crop phenology
The increase in temperature had negative effects on leaf area index (LAI)
however these effects were lesser under 550 ppm CO2 concentrations as compared to 360
ppm. The reduction in LAI were ranged from 1.69 to 4.8 % and 5.7 to 13.2 % at 0.9 °C
(in 2020) and 1.8 °C (in 2050) increase in temperature, respectively under 360 ppm CO2
concentration. Increase in CO2 however reduced the negative impacts of high temperature
at all locations. The reduction in LAI was ranged from 0.42 to 2 % and 3.8 to 9 % at 0.9
°C and 1.8 °C increase in current mean temperature, respectively under 550 ppm CO2
concentration at all three sites.
Total dry matter accumulation was also negatively affected like LAI by increase
in current mean temperature. The reduction in simulated TDM as compared to current
were ranged from 5.2 to 7.8 % and 12.2 to 17.4 % at 0.9 °C and 1.8 °C increase in
temperature, respectively with 360 ppm CO2 concentration. While the equivalent
reduction in TDM at 550 ppm CO2 concentration were ranged from 2.2 to 3.7 % and 8.5
to 12.8 % at all three locations for 0.9 °C and 1.8 °C increase in current mean
temperature, respectively.
Yield and yield components were negatively affected (Table 4.47) by increase in
temperature under both 360 ppm and 550 ppm CO2 scenarios. According to model
simulations for 2020 with 0.9 °C increase in current temperature, yield of maize hybrid
Pioneer-31-R-88 will reduced up to 5.4 % (9999 vs 9461), 8.6 % (10641 vs 9729) and
11.1 % (10236 vs 9097) at Faisalabad, Sargodha and Sahiwal respectively under 360 ppm
140

141
Table 4.47: Impact of temperature and CO2 scenarios on phenology, growth, yield, and yield component of maize hybrid Pioneer-31-R-88 grown at different sites
able Faisalabad Sargodha Sahiwal
perature Current 0.9 °C Diff a (%) 1.8 °C Diff
(%) Current 0.9 °C Diff (%) 1.8 °C Diff
(%) Current 0.9 °C Diff (%) 1.8 °C Diff
(%)
Concentration 360 ppm
p duration (d) 103 97 -5.47 94 -9.22 102 98 -4.41 94 -7.72 98 94 -3.89 91 -6.72
. L A I 4.72 4.64 -1.69 4.45 -5.72 5.02 4.78 -4.78 4.36 -13.15 5.10 4.89 -4.12 4.49 -11.96
M (kg ha-1) 21067 19969 -5.21 18500 -12.19 21228 19726 -7.08 17806 -16.12 21659 19980 -7.75 17886 -17.42
f grains m-2 3178 3175 -0.09 3071 -3.37 3159 3090 -2.19 2937 -7.02 3307 3159 -4.48 2965 -10.35
n grain weight(g) 0.31 0.30 -3.23 0.28 -9.68 0.34 0.32 -5.88 0.29 -14.71 0.31 0.29 -6.45 0.27 -12.90
n yield (kg ha-1) 9999 9461 -5.38 8671 -13.28 10641 9729 -8.57 8643 -18.78 10236 9097 -11.13 8123 -20.65
Concentration 550 ppm
p duration (d) 103 97 -5.47 94 -9.22 102 98 -4.41 94 -7.72 98 94 -3.89 91 -6.72
. L A I 4.72 4.70 -0.42 4.54 -3.81 5.02 4.92 -1.99 4.57 -8.96 5.10 5.02 -1.57 4.67 -8.43
M (kg ha-1) 21067 20597 -2.23 19281 -8.48 21228 20678 -2.59 18876 -11.08 21659 20869 -3.65 18884 -12.81
f grains m-2 3178 3302 3.91 3208 0.96 3159 3243 2.65 3094 -2.06 3307 3305 -0.07 3113 -5.88
n grain weight(g) 0.31 0.29 -6.45 0.28 -9.68 0.34 0.31 -8.82 0.29 -14.71 0.31 0.29 -6.45 0.27 -12.90
n yield (kg ha-1) 9999 9733 -2.66 8991 -10.08 10641 10171 -4.42 9098 -14.50 10236 9505 -7.15 8527 -16.69
a Difference from current

CO2 concentration. However increase in CO2 concentration from 360 to 550 ppm at this
temperature scenario had some promotive effect on maize productivity and differences
between current crop yield and yield under future climate change scenarios (550 ppm
CO2 with 0.9 °C increase in temperature) reduced up to 2.7 % (9999 vs 9733), 4.4 %
(10641 vs 10171) and 7.2 % (10236 vs 9505) at Faisalabad, Sargodha and Sahiwal,
respectively.
Increase in temperature 1.8 °C as predicted for 2050 will be highly hazardous for
maize productivity in Pakistan. Table 4.47 showed that increase in temperature will
reduce grain yield 13.3, 18.8 and 20.7 % at Faisalabad, Sargodha and Sahiwal sites,
respectively with out changing CO2 concentration (360 ppm). The reduction in simulated
grain yield was ranged from 10.1 to 16.7 % under 550 ppm CO2 concentration and 1.8 °C
increase in present temperature at different locations. The reduction in grain yield under
future climate change scenarios might be attributed to negative effects of climate
extremes on number of grains m-2 and mean grain weight.
In general grain yield was reduced more at Sahiwal as compared to other
locations under future scenarios and hybrid Monsanto-919 was more vulnerable as
compared to others. The deleterious effect of higher temperature on crop productivity had
already been reported by various scientists. Baker and Allen (1993) reported that a small
increase in temperature can dramatically reduce yield. Hoogenboom et al., (1995), using
the CERES-maize model, found that no maize growth occurred at air temperatures below
8 °C; maximum crop growth and grain fill occurred at daily temperatures of 34°C; and
growth was reduced at higher temperatures until 44°C, above which no growth occurred.
However crop responses to expected increases in temperature also depend on interactions
with CO2 enrichment (Polley, 2002).
4.8.4. ADAPTATION STRATEGIES
To avoid or at least reduce negative effects and exploit possible positive effects of
climate change, several agronomic adaptations strategies are needed for crop production.
The yields may apparently be modified by various management responses, such as
adjustments in fertilization and irrigation regimes, applying soil water conserving
management practices (such as mulching, appropriate crop rotation or minimum tillage
eventually no-tillage methods), shifting the planting date and sowing density, or using
142

other cultivars (IPCC, 2001; Bindi and Olesen, 2000; Harrison et al., 1995). The previous
studies exposed that the CSM-CERES-Maize model simulated well variations in the
sowing date, cultivar adjustments, influence of the different sowing densities or different
doses of nitrogen. The following adaptation strategies were selected for mitigation of
climate change impact: change in the sowing date, use of different cultivar and nitrogen
rates.
It is evident from results discussed above (section 4.7) that maize productivity
was more sensitive to change in temperature rather as compared to CO2 and rain fall in
semiarid regions of Punjab, Pakistan. Our concerned regions had extremes of temperature
in cropping season of maize (Fig 4.1, Appendix 4.1 & 4.2). So management strategies
were evaluated with expected increase 0.9 °C (in 2020) and 1.8 °C (in 2050) in present
mean temperature.
4.8.4.1. Evaluation of hybrids and planting dates for 2020
a) Yield analysis
Maize crop has to face high temperatures at the time of sowing and low
temperatures at the time of maturity in autumn season, under the climatic conditions of
Punjab, Pakistan. High temperatures generally speed up the phenlogical development of
the crop and therefore shorten growth duration for yield formation. So planting date is
critical in semiarid areas of Pakistan. There is always yield losses associated with
inappropriate planting date.
The 30-years crop model simulations were run to determine the best planting date
and suitable hybrid for semiarid irrigated regions of Punjab, Pakistan for future
temperature change scenarios i.e. 0.9 °C increase in present temperature for 2020 and1.8
°C increase in present temperature for 2050. The value of the planting date (PD) varied
within the interval (D0 – 20 days and D0 + 40 days), where D0 is the planting date of 2005
for each location. It was assumed that soil and weather conditions would allow for the
field operations to be done on the selected date.
The analysis established that 10 and 20 days early planting of maize crop reduced
crop yield considerably at all three locations (Fig 4.19). This decrease varied from 11 to
17 for different hybrids and locations with 10 days early planting as compared to current
143

Bemasal-202
Gra
in y
ield
(kg
ha-1
)
0
2000
4000
6000
8000
10000
12000
14000
16000Pioneer-31-R-88
Fais
alab
ad
Monsanto-919
Bemasal-202
Gra
in y
ield
(kg
ha-1
)
0
2000
4000
6000
8000
10000
12000
14000Pioneer-31-R-88
Sar
godh
a
Monsanto-919
Bemasal-202
Planting date
-20 -10 0 10 20 30 40
Gra
in y
ield
(kg
ha-1
)
0
2000
4000
6000
8000
10000
12000
14000Pioneer-31-R-88
Planting date
-20 -10 0 10 20 30 40S
ahiw
al
Monsanto-919
Planting date
-20 -10 0 10 20 30 40
Fig 4.19: Percentile distribution of yield as affected by deviation in planting date (days)
from the planting date in 2005. The bars represent (0th, 25th, median, 75th and 100th)
percentile of the model yields obtained in 30 years simulations for changed climate in
2020.
144

planting date. However it was noted that decrease in mean simulated grain yield ranged
from 25 to 31% at 20 days early planting as compared to current date of sowing (Table
4.48) under 0.9 °C increase in current temperature. The reason of reduction in grain yield
might be the shift of the vegetative period into weeks of higher temperature that cause
shortening of crop duration.
Delay in planting up to 30 days increased grain yield at all locations. However
responses of hybrids were different at different location. Maximum average increase 23,
33 and 21 % were noted in hybrid Bemasal-202, Monsanto-919 and Pioneer-31-R-88,
respectively at 20 days delay in current planting date, after that rate of increase in grain
yield reduced (Table 4.48). Last planting date (40 days delay in current planting date) had
adverse effects on maize yield. All three hybrids decrease their grain yield at last planting
date at Faisalabad and Sahiwal sites. The reduction in grain yield varied from 3 to 22 %
at 40 days delay in current planting date. However an increase in grain yield13 % was
noted in hybrid Monsanto-919 on last planting date at Sahiwal site.
For all hybrids and locations, the simulated yield between 0th and 25th percentiles
at 30 and 40 days delay in current planting date showed an increase in the risk of
obtaining very low yields for the late planting dates.
b) Economic Strategic Analysis
Economic analysis option of the seasonal analysis tool calculated net monetary
return for different planting dates and hybrids at each location under 0.9 °C increase in
current mean temperature. Table 4.49 showed that there was a continuous increase in
monetary return ha-1 up to 20 days delay in current planting date at all the locations under
0.9 °C increase in temperature.
Finally to evaluate economic dominance of the planting date and hybrid for each
location Mean-Gini Dominance (MGD) analysis was performed. This analysis (Table
4.49) showed that 20 days delay in current planting date will be the best planting date for
semi arid areas of Punjab, to sustain the maize productivity under 0.9°C increase in
temperature in 2020.
This analysis further showed that Pioneer-31-R-88 hybrid was the most efficient
hybrid at Faisalabad site, while at Sargodha and Sahiwal locations hybrid Bemasal-202
145

Table 4.48: Simulated grain yield for different hybrids at varying planting dates and sites for under changed temperature scenario in 2020
Hybrid Faisalabad Sargodha Sahiwal Average
Grain yield Diff Grain yield Diff* Grain yield Diff Diff Planting date (kg ha-1) (%) (kg ha-1) (%) (kg ha-1) (%) (%)
Bemasal-202
-20 days 6992 -28 7195 -27 6449 -29 -28
-10 days 8430 -14 8526 -13 8034 -11 -13
current 9756 0 9810 0 9040 0 0
+10 days 10771 10 11206 14 10236 13 13
+20 days 11118 14 12521 28 11436 26 23
+30 days 10282 5 11502 17 10971 21 15
+40 days 7615 -22 8923 -9 9079 0 -10
Monsanto-919
-20 days 5124 -28 5163 -27 4845 -25 -27
-10 days 5894 -17 5951 -16 5561 -14 -15
current 7106 0 7063 0 6436 0 0
+10 days 8141 15 8568 21 7571 18 18
+20 days 8882 25 9260 31 9108 42 33
+30 days 7834 10 7754 10 8900 38 19
+40 days 5653 -20 5563 -21 7303 13 -9
Pioneer-31-R-88
-20 days 6865 -30 6912 -29 6244 -31 -30
-10 days 8222 -16 8341 -15 7858 -14 -15
current 9801 0 9795 0 9101 0 0
+10 days 10547 8 10885 11 10069 11 10
+20 days 11128 14 12447 27 11149 22 21
+30 days 10572 8 11952 22 10960 20 17
+40 days 8153 -17 9458 -3 9242 2 -6 * Difference from current planting date
146

147
Table 4.49: Dominance analysis of different planting dates and hybrids for 2020 at various regions of Punjab, Pakistan. Hybrid Faisalabad Sargodha Sahiwal
Mean return Ex- Fx* Efficiency Mean return Ex- Fx* Efficiency Mean return Ex- Fx* Efficiency Planting date
($ ha-1) Ex ($ ha-1) Yes / No ($ ha-1) Ex ($ ha-1) Yes / No ($ ha-1) Ex ($ ha-1) Yes / No Bemasal-202
-20 days 828 573 No 845 570 No 751.9 486 No -10 days 985 675 No 986 670 No 919.5 624 No current 1132 782 No 1131 779 No 1025.6 692 No
+10 days 1251 865 No 1285 884 No 1159.4 791 No +20 days 1284 890 No 1430 983 Yes 1291.4 888 Yes +30 days 1196 795 No 1319 862 No 1240.7 834 No +40 days 903 492 No 1042 590 No 1028.1 629 No
Monsanto-919 -20 days 615 430 No 609 417 No 563.7 380 No -10 days 700 482 No 695 475 No 640.9 434 No current 833 575 No 822 568 No 732.6 495 No
+10 days 954 655 No 988 682 No 859.1 584 No +20 days 1033 705 No 1063 723 No 1033 704 No +30 days 915 573 No 904 567 No 1010.3 653 No +40 days 682 340 No 662 351 No 831.9 485 No
Pioneer-31-R-88 -20 days 814 562 No 807 551 No 735.6 476 No -10 days 964 657 No 963 657 No 904.2 608 No current 1138 787 No 1130 779 No 1031.4 697 No
+10 days 1223 848 No 1250 862 No 1139.8 778 No +20 days 1285 893 Yes 1421 981 No 1259.7 864 No +30 days 1225 827 No 1371 913 No 1240.5 837 No +40 days 960 551 No 1103 648 No 1045.1 653 No
* Fx = Gini coefficient

was efficient that gave maximum monetary return at same planting date (20 days delay in
current planting date) in 2020. It was also clear from grain yield analysis (Fig 4.19) that
there was significant increase in grain yield up to this planting date.
4.8.4.2. Evaluation of hybrids and planting dates for 2050
a) Yield analysis
The impact of changing climate on planting dates in terms of percentile
distribution of grain yield (Fig 4.20) illustrated that 10 and 20 days early planting of
maize crop will reduce average crop yield considerably at all three locations under
climate scenarios of 2050. This reduction in grain yield varied from 13 to 16 % for
different hybrids with 10 days early plantation as compared to current planting date.
However, it was observed that decrease in mean simulated grain yield ranged from 28 to
33 % at 20 days early plantation as compared to current date of sowing (Table 4.50) with
1.8 °C increase in current temperature that is expected in 2050. The reason of reduction
in grain yield might be the shift of the vegetation period into weeks of higher temperature
that cause shortening of crop duration.
Delay in planting up to 40 days increased grain yield at all locations. Maximum
average increase 42, 50 and 39 % were noted in hybrid Bemasal-202, Monsanto-919 and
Pioneer-31-R-88, respectively at 30 days delay in current planting date, after that rate of
increase in grain yield reduced (Table 4.50).
For all hybrids and locations, the simulated grain yield between the 0th and 25th
percentiles at 40 days delay in current planting date showed an increase in the risk of
obtaining very low yields for the late planting dates. The results suggested that there was
a large impact of the weather conditions, such as a very high temperature at time of
planting in two early planting dates and low amount of precipitation, low temperatures,
and low levels of solar radiation (Fig. 4.1) at time of grain development and maturity,
when planting was delayed after 30 days delay in current date of sowing. Such delay in
sowing date also has been found by other researchers under future climate change
scenarios (Southworth, 2000).
148

149
Bemasal-202G
rain
yie
ld (k
g ha
-1)
0
2000
4000
6000
8000
10000
12000
14000
16000Pioneer-31-R-88
Fais
alab
ad
Monsanto-919
Bemasal-202
Gra
in y
ield
(kg
ha-1
)
0
2000
4000
6000
8000
10000
12000
14000Pioneer-31-R-88
Sar
godh
a
Monsanto-919
Bemasal-202
Planting date
-20 -10 0 10 20 30 40
Gra
in y
ield
(kg
ha-1
)
0
2000
4000
6000
8000
10000
12000
14000Pioneer-31-R-88
Planting date
-20 -10 0 10 20 30 40
Sah
iwal
Monsanto-919
Planting date
-20 -10 0 10 20 30 40
Fig 4.20: Percentile distribution of yield as affected by deviation in planting date (days)
from the planting date in 2005. The bars represent (0th, 25th, median, 75th and 100th)
percentile of the model yields obtained in 30 years simulations for changed climate
in 2050.

b) Economic Strategic Analysis
Economic analysis option of the seasonal analysis tool calculated net monetary
return for different planting dates and hybrids at each location under 0.9 °C increase in
current mean temperature. Table 4.53 showed that there was a continuous increase in
monetary return ha-1 up to 30 days delay in current planting date at all the locations under
1.8 °C increase in temperature.
Finally to evaluate economic dominance of the planting date and hybrid for each
location Mean-Gini Dominance (MGD) analysis was performed. The analysis (Table
4.51) showed that 30 days delay in current planting date will be the best planting date for
semi arid areas of Punjab, to sustain the maize productivity under 1.8°C increase in
current mean temperature in 2020.
This analysis further showed that Pioneer-31-R-88 hybrid will be the most
efficient hybrid at Faisalabad and Sargodha sites when planted at 30 days delay in current
planting date, while at Sahiwal location hybrid Bemasal-202 was efficient that gave
maximum monetary return at same planting date (30 days delay in current planting date).
However, Pioneer-31-R-88 can also perform the best when sown at 40 days delay in
current planting date. It was also clear from grain yield analysis (Fig 4.20) that there was
significant increase in grain yield up to this planting date.
Results of DSSAT economic and strategic analysis showed that selection of site
specific transplanting dates could be better strategy to increase the efficiency of maize
cropping system under variable environment. As model used 30 years climatic data for
selection of economically dominant strategy and results are quite sensible. Thus, CSM-
CERES-Maize can be helpful tool for decision making in irrigated semi arid climatic
conditions of Pakistan. Dzotsi et al. (2003) and Soler et al. (2006) also concluded that
CERES-Maize in DSSAT could successfully used to predict the future crop yields under
different management practices, and select the best one for sustainable production of
maize and other crops.
In conclusion, following steps must be taken to meet the challenges of climate
change on maize production.
1. Breeding of new cultivars that are tolerant to higher temperatures.
150

Table 4.50: Simulated grain yield for different hybrids at varying planting dates and sites for under changed temperature scenario in 2050
Hybrid Faisalabad Sargodha Sahiwal Average Grain yield Diff* Grain yield Diff* Grain yield Diff* Diff Planting date
(kg ha-1) (%) (kg ha-1) (%) (kg ha-1) (%) (%) Bemasal-202
-20 days 6027 -31 6211 -28 5615 -30 -30 -10 days 7472 -14 7462 -13 7100 -12 -13 current 8729 0 8617 0 8042 0 0
+10 days 10000 15 10006 16 9375 17 16 +20 days 10856 24 11762 36 11364 41 34 +30 days 11007 26 12537 45 12328 53 42 +40 days 10135 16 11396 32 12310 53 34
Monsanto-919 -20 days 4385 -30 4475 -27 4118 -28 -28 -10 days 5253 -16 5182 -16 4851 -15 -15 current 6229 0 6145 0 5687 0 0
+10 days 7291 17 7430 21 6750 19 19 +20 days 8597 38 8864 44 8431 48 43 +30 days 8763 41 8976 46 9308 64 50 +40 days 7415 19 7731 26 8801 55 33
Pioneer-31-R-88 -20 days 5796 -35 5901 -32 5423 -34 -33 -10 days 7329 -17 7361 -15 6990 -15 -16 current 8860 0 8650 0 8185 0 0
+10 days 9816 11 9617 11 9195 12 11 +20 days 10562 19 11448 32 10986 34 29 +30 days 10938 23 12531 45 12052 47 39 +40 days 10426 18 11729 36 12404 52 35
* Difference from current planting date
151

152
Table 4.51: Dominance analysis of different planting dates and hybrids for 2050 at various regions of Punjab, Pakisatn.
Hybrid Faisalabad Sargodha Sahiwal Mean return Ex- Fx* Efficiency
Mean return Ex- Fx* Efficiency
Mean return Ex- Fx* Efficiency Planting date ($ ha-1)
Ex ($ ha-1) Yes / No ($ ha-1) Ex ($ ha-1) Yes / No ($ ha-1) Ex ($ ha-1) Yes / No Bemasal-202
-20 days 719 495 No 730 492 No 670 454 No -10 days 880 599 No 865 585 No 836 568 No current 1017 697 No 995 684 No 935 637 No
+10 days 1159 803 No 1154 793 No 1082 740 No +20 days 1254 870 No 1346 925 No 1306 900 No +30 days 1275 868 Yes 1428 967 No 1414 973 Yes +40 days 1178 738 No 1311 832 No 1409 926 No
Monsanto-919 -20 days 532 370 No 532 360 No 501 339 No -10 days 629 432 No 609 414 No 580 397 No current 737 507 No 717 494 No 670 459 No
+10 days 857 589 No 864 594 No 788 541 No +20 days 1000 688 No 1025 696 No 975 673 No +30 days 1019 680 No 1032 682 No 1072 731 No +40 days 869 520 No 899 557 No 1017 661 No
Pioneer-31-R-88 -20 days 695 477 No 693 472 No 648 441 No -10 days 866 588 No 854 578 No 825 558 No current 1032 709 No 1002 687 No 951 649 No
+10 days 1141 790 No 1112 762 No 1067 730 No +20 days 1224 849 No 1314 903 No 1269 872 No +30 days 1269 870 Yes 1431 976 Yes 1385 951 No +40 days 1214 778 No 1347 871 No 1421 942 Yes * Fx = Gini coefficient

2. Water storage facilities should be enlarged and efficiently managed under
changed climatic conditions.
3. Agronomic practices such as land leveling, cultivar selection, fertilizer
application, pest and disease management, may need to be adjusted under the
changed climate.
4. Adjustments in the dates of planting may be necessary for efficient utilization
of inputs under the changed climate scenario.
153

CHAPTER-5
SUMMARY The study was undertaken to model the impact of climate change on maize
production under semi arid conditions of Punjab, Pakistan. The data required to run the
model was collected from field experiments conducted at three sites viz: Agronomic
Research Area, University of Agriculture Faisalabad, Adaptive Research Farm, Sargodha,
Maize and Millet Research Institute, Sahiwal. Measurements of crop growth and
environmental variables were made to establish the causes underlying the variations in
grain yield associated with cultivar and nitrogen application rate. Results obtained are
summarized as under:
• Increasing nitrogen rate significantly enhanced TDM as compared to standard rate
(200 kg N ha-1) at all the locations. On average, it varied from 18.91 t ha-1 at 300 kg N
ha-1 to 15.24 t ha-1 at 150 kg N ha-1. The hybrid Bemasal-202 significantly increased
TDM over hybrid Monsanto-919, while it was statistically at par with hybrid Pioneer-
31-R-88. Average final TDM yields were 17.61 t ha-1 in Faisalabad 17.97 t ha-1 in
Sargodha and 16.81 t ha-1 in Sahiwal.
• Nitrogen application enhanced grain yield in quadratic manner at all sites. On an
average grain yield were 7.27, 8.23, 8.49 t ha-1 at Faisalabad, Sargodha and Sahiwal,
respectively. Cultivar differences in grain yield were significant at all experimental
sites
• Different treatments differed significantly in harvest index (HI). Averaged over the
three locations values of HI were 41.19 %, 41.89 % and 41.36 % at Faisalabad,
Sargodha and Sahiwal, respectively.
• Hybrids did not affect significantly, number of grains m-2 at Sargodha. However, their
effect was significant at Faisalabad and Sahiwal where maximum average 3050.76
grain m-2 was recorded in case of Pioneer-31-R-88 followed by Bemasal-202 which
produced 3036.48. Monsanto-919 produced 2919.84 grains m-2. Similarly hybrids
significantly affected 1000-grain weight at all locations.
154

• Nitrogen rate affected significantly, number of grains m-2 and 1000-grain weight at all
the three sites. Maximum 1000-grain weight (319.25 g) was recorded in treatment
300 kg N ha-1, while 150 kg N ha-1gave minimum 1000-grain weight (263.21 g). On
an average 1000-grain weight 285.72, 308.37, and 291.28 g were recorded at
Faisalabad, Sargodha and Sahiwal, respectively.
• Hybrid differences in LAI development were non-significant at Sargodha and were
significant at Faisalabad and Sahiwal. Peak LAI values were reached at 55 DAS in all
the treatments. The development of LAI up to maximum value was linearly related to
accumulate thermal time above a base temperature of 8 °C in all the treatments.
Increasing nitrogen rate enhanced TDM over lower rate mainly due to enhanced leaf
area duration (LAD) over lower rate. Both TDM and grain yield were linearly
correlated with cumulative LAD at all locations.
• Higher nitrogen treatments significantly enhanced fraction of intercepted radiation
(Fi) over lower, and it reached at more as compared to 90 % by 55 DAS in all the
treatments. TDM production was strongly and linearly related to cumulative
intercepted PAR (R2 = 68 – 94 %). Seasonal differences in TDM production or grain
yield between the treatments were mainly associated with the amount of PAR
absorbed, and to a lesser degree on its efficiency of utilization. Radiation utilization
efficiency (RUE) for TDM varied from 2.45 g MJ-1 to 2.73 g MJ-1 intercepted PAR at
different locations.
• CSM-CERES-Maize (V 4.0) model was used to simulate the growth, development
and yield of maize crop sown at different locations under adequate water and nutrient
supplies. The model predicted phenological development of all hybrids reasonably
good and the RMSE between observed and simulated days to maturity was 0.82, 1.0,
and 0.82 days, in grain yield 649, 201, 763 kg ha-1 and in TDM values 238, 390, and
627 kg ha-1 during calibration of model for hybrid Bemasal-202, Monsanto-919, and
Pioneer-31-R-88, respectively.
• The CSM-CERES-Maize model was validated for grain yield using data from other
experiments conducted in 2004 with different treatments. The model simulated the
yield very closely to the observed data. The average error between simulated and
155

observed values 9.3 % and values for RMSE were ranged from 185 to 1226 kg ha-1
among all sites while MPD was ranged from 2.7 to 13.6.
• The CERES-Maize model, calibrated for all the hybrids, was used to simulate
potential maize yields under various scenarios of changed climate at all three
locations.
• Time course simulations of CSM-CERES-Maize were also satisfactory and d-index
values were ranged from 0.97 to 0.99 for crop biomass and 0.70 to 0.99 for LAI.
• Crop duration had no effect at all locations with increase in CO2 concentration from
360 ppm to 550 ppm. However TDM will increase with more CO2 concentration.
The average over hybrids, differences were 2.08 % (20683 vs 21113), 3.79 % (21127
vs 21928) and 3.35% (21052 vs 21758) at Faisalabad, Sargodha and Sahiwal,
respectively.
• Increase in CO2 concentration from 360 ppm to 550 ppm had significant effects on
grain yield at all locations. These effects were considerably higher (11.28 %) more
yield at Sahiwal as compared to 2.12 and 3.72 % at Faisalabad and Sargodha
locations with 550 ppm CO2.
• The results of this study (Table 4.45, 4.46 and 4.47) showed that increase in
temperature shortened the crop duration from planting to physiological maturity,
retarded growth and decreased yield as compared to current at all locations.
• Change in rainfall had no effect on crop phenology, while minor differences were
observed in grain yield and TDM production with change in rainfall.
• Optimization of transplanting date and hybrid selection with seasonal analysis tool
showed that Pioneer-31-R-88 hybrid was the most efficient hybrid at Faisalabad site.
While at Sargodha and Sahiwal locations hybrid Bemasal-202 was efficient that will
give maximum monetary return with 20 days delay in current planting date in 2020.
• Results of Seasonal analysis further showed that Pioneer-31-R-88 hybrid will be the
most efficient hybrid at Faisalabad and Sargodha sites when planted at 30 days delay
in current planting date. While at Sahiwal location hybrid Bemasal-202 was the
efficient hybrid that gave maximum monetary return at same planting date (30 days
delay in current planting date). However Pioneer-31-R-88 can also perform the best
156

when sown at 40 days delay in current planting date under predicted climate scenarios
for 2050
•
CONCLUSIONS
Based on the results, the following conclusions can be made.
1. The grain yield among various treatments was related to their photosynthetic activity. At
all the locations, treatments like 300 kg N ha-1 and hybrid Bemasal-202 and Pioneer-31-
R-88 increased yield due to greater LAD and light interception. Thus crop growth and
yield can be analysed satisfactorily from measurements of intercepted PAR and RUE.
2. Testing of CSM-CERES-Maize model and application in this study confirmed that this
model could be acceptable for use as a research tool in the variable agro-environment of
Punjab (Pakistan). The results suggest that the model can be used to guide alternate
ways of improving maize production in Pakistan. However, some model inputs for
Punjab need to be determined including the genetic coefficients of various maize
varieties and the minimum data set for soils and weather data as a whole country.
3. Climate change analysis indicated strong influence of temperature increases on maize
production in the Punjab. The yield will be substantially decreased with increasing
temperatures up to 1.8 oC in the region. Under the present scenarios, it would seem that
average maize yield will decrease by 20 % beyond 2050. However, the variability of
yield at various locations is likely to increase significantly.
FUTURE RESEARCH
1. Future studies on modeling the growth and yield of maize and other field crops both
under dry and moist conditions of Pakistan should be initiated.
2. Future studies of the possible effects of climate change on maize production in Pakistan
should, therefore, include a larger number of weather stations to better reflect the
heterogeneity in maize growing areas.
157

LITERATURE CITED
Abbas, G. 2005. Effect of irrigation scheduling and N management on growth,
yield and water use efficiency of maize crop. Ph.D dissertation, dept.
of Agron., Univ. of Agric., Faisalabad, Pakistan.
Abraha, M. G., and M. J. Savage. 2006. Potential impacts of climate change on the grain
yield of maize for the midlands of KwaZulu-Natal, South Africa.
Agriculture, Ecosystems and Environment, 115: 150–160.
Ahmadani, A. A. 2004. Effect of cultivar and plant population on growth, light
interception and yield of hybrid maize. M. Sc. (Hons.) Agri. Thesis, Deptt.
of Agronomy, Univ. Agric. Faisalabad.
Akbar, H., Miftahullah, Jan. M. T., Jan. and Ihsanullah. (2002).Yield potential of sweet
corn as influenced by different level of nitrogen and plant population. Asian
J. Plant Sci., 1(6): 631-633.
Alexandrov. V. A. and G. Hoogenboom. 2000. The impact of climate variability and
change on crop yield in Bulgaria. Agricultural and Forest Meteorology, 104:
315–327.
Ali, A., M. A. Malik, M. A. Choudhry, M. Khalid and M. Rafique.1999. Effect of various
doses of nitrogen on the growth, yield and protein content of two maize
genotypes. Pak. J. Biol. Sci., 2 (3): 889-890.
Amthor, J. S. and R. S. Loomis. 1996. Integrating knowledge of crop responses to
elevated CO2, and temperature with mechanistic simulation models: Model
components and research needs. P. 317-345. in G.W. Koch and H.A.
Mooney (ed.) Carbon Dioxide and terrestrial ecosystems. Academic Press.
San Diego, C. A.
Andrade, F. H., S. A. Uhart and M. I. Frugone. 1993. Intercepted radiation at flowering
and kernel number in maize: shade versus plant density effects. Crop Sci.,
33: 482-485.
Asadi1, M. E. and R. S. Clemente. 2003. Evaluation of CERES-Maize of DSSAT model
to simulate nitrate leaching, yield and soil moisture content under tropical
conditions. Food, Agriculture & Environment Vol.1 (3&4): 270-276.
158

Baker, J. T., and L. H. Allen, Jr. 1993. Contrasting crop species responses to CO2 and
temperature: rice, soybean and citrus. Vegetation, 104/105: 239–260.
Baker, J. T., L. H. Allen and K. J. Boote.1992. Temperature effects on rice at elevated
CO2 concentration. J. Exp. Bot., 43: 959-964.
Banerjee, M., S. N. Singh and M. Debtanu. 2003. Growth and light interception of pop
corn Zea mays Everta) varieties as affected by nitrogen and plant
population. Ind. J. Environment and Ecology, 21 (4): 827- 831.
Bangarwa, A.S., M. S. Kairon and K. P. Singh. 1988. Effect of plant density and level
and proportion of nitrogen fertilization on growth, yield and yield
component of winter maize. Haryana Agric. Univ. Ind. Ind. J. Agric. Sci., 58
(11): 854-856.
Bannayan, M., G. Hoogenboom, and N. M. J. Crout. 2004. Photothermal impact on
maize performance: a simulation approach. Ecological Modelling, 180:
277–290.
Bannayan, M., N. M. J. Croat, and G. Hoogenboom. 2003. Application of the CERES-
Wheat model for within-season prediction of winter wheat yield in the
United Kingdom. Agron. J.95: 114-125.
Barrow, E., M. Hulme, and M. Semenov. 1996. Effect of using different methods in the
construction of climate change scenarios: examples from Europe. Clim. Res.
7: 195–211.
Ben Nouna, B. B., N. Katerji , and M. Mastrorilli. 2000. Using the CERES-Maize model
in a semi-arid Mediterranean environment. Evaluation of model
performance. Europ. J. Agronomy, 13: 309–322.
Bert, F. E., C. E. Laciana, G. P. Podesta, E. H. Satorre, and A. N. Mene´ndez. 2007.
Sensitivity of CERES-Maize simulated yields to uncertainty in soil
properties and daily solar radiation. Agricultural Systems 94: 141–150.
Bindi, M. and J. Olesen. 2000. Agriculture. In Parry, M. L. (ed.), Assessment of
Potential Effect and Adaptations for Climate Change in Europe: The Europe
ACACIA Project, Jackson Environment Institute, University of East Anglia,
Norwich, U.K., 324 pp.
159

Biscoe, P. U. and J. N. Gallagher. 1978. Physiological analysis of cereals yield. I.
Production of dry matter, Agric. Progress, 53: 34-50.
Borhan, P., J. J. Kennedy, I. Haris, S. F. B. Tett, and P. D. Jones. 2006. Uncertainty
estimates in regional and global observed temperature changes: a new data
set from 1850 J. Geophys. Res. 111, D12106.doi: 10.1029/2005JD00654.
Brisson, N., C. Gary, E. Justes, R. Roche, B. Mary, D. Ripoche, D. Zimmer, J. Sierra, P.
Bertuzzi, P. Burger, F. Bussiere, Y. M. Cabidoche, P. Cellier, P. Debaeke, J.
P. Gaudillere, C. Henault, F. Maraux, B. Seguin, and H. Sinoquet. 2003. An
overview of the crop model STICS. Eur. J. Agron., 18: 309–332.
Bunce, J. A. 2000. Responses of stomatal conductance to light, humidity and temperature
in winter wheat and barley grown at three concentrations of carbon dioxide
in the field. Global Change Biology, 6: 371–382.
Carnell, R. E., C. A. Senior. 1998. Changes in mid-latitude variability due to increasing
greenhouse gases and sulphate aerosols. Clim. Dyn., 14: 369–383.
Cedron, F. X. L., K. J. Boote, B. R. Nogueira, F. Sau. 2005. Testing CERES-Maize
versions to estimate maize production in a cool environment. Europ. J.
Agronomy, 23: 89-102.
Charles-Edwards, D.A. 1982. Physiological determinants of crop growth. Academic
Press, Syndey, NSW, Australia. Crop Performance in the Tropics.
www.cimmyt.cgiar.org/.../NRG/map/research_results/
Chiotti, Q. P., T. Johnston. 1995. Extending the boundaries of climate change research: a
discussion on agriculture. J. Rural Stud. 11, 335–350.
Conroy, J. P., S. Seneweera, A. S. Basra, G. Rogers, and B. N. Wooller. 1994. Influence
of rising atmospheric CO2 concentrations and temperature on growth, yield
and grain quality of cereal crops. Aust. J. Plant Physiol. 21:741–758.
Costa, C., L. M. Dwyer, D. W. Stewart, and D. L. Smith. Nitrogen effects on grain yield
and yield components of leafy and non leafy maize genotypes. Crop Sci.
42:1556–1563.
D’ Andrea, K. E., M. E. Otegui and A. G. Cirilo. 2008. Kernel number determination
differs among maize hybrids in response to nitrogen. Field Crops Research
(105): 228–239.
160

D’ Andrea, K. E., M. E. Otegui, A. G. Cirilo and G. H. Eyherabide. 2006. Genotypic
variability in morphological physiological traits among maize inbred lines. I.
Response to nitrogen availability. Crop Sci. 46: 1266-1276.
DeJonge, K. C., A. L. Kaleita, and K. R. Thorp. 2007. Simulating the effects of spatially
variable irrigation on corn yields, costs, and revenue in Iowa. Agric. Water
Manage. doi:10.1016/j.agwat.2007.05.008.
Ding, L., K. J. Wang, G. M. Jiang, D. K. Biswas, H. Xu, L. F. Li and Y. H. Li. 2005.
Effects of Nitrogen Deficiency on Photosynthetic Traits of Maize Hybrids
Released in Different Years. Annals of Botany 96: 925–930.
Duncan, W. G. 1971. Leaf angles, leaf area and canopy photosynthesis. Crop Sci., 11:
482-485.
Duncan, W. G. 1975. Maize. In: Crop Physiology: Some Case Histories (Ed. L.T. Evans),
Camb. Univ. Press, Camb., pp. 23-50.
Dzotsi, K., A. Agboh-Noameshie, T. E. Struif Bontkes. U. Singh and P. Dejean. 2003.
Using DSSAT to derive optimum combinations of cultivar and sowing date
of maize in southern Togo. In T. E. Struif Bontkes and M. C. S. Wopereis
(eds). Decision support system tools for small holders agriculture in Sub-
Saharan, Africa. A practical guide. IFDC & CTA. 100-113pp.
Edwards, J. T., L. C. Purcell, and E. D. Vories. 2005. Light interception and yield
potential of short-season maize (zea mays L.) hybrids in the mid south.
Agron. J. 97:225–234.
Erda, L., X. Wei, J. Hui, X. Yinlong, L. Yue, B. Liping and X. Liyong. 2005. Climate
change impacts on crop yield and quality with CO2 fertilization in China.
Phil. Trans. R. Soc. B .360: 2149–2154.
Fan, X., M. S. Kang, H. Chen, Y. Zhang, J. Tan, and C. Xu. 2007. Yield stability of
maize hybrids evaluated in multi-environment trials in yunnan, China.
Agron. J. 99:220–228.
FAO. 1978. Agro-ecological zones. Report on the project, Vol. 1. Methodology and
results for Africa, Rome.
161

Flanet, F., J. R. Kiniry, J. E. Board, M. E. Westgate and D. R. Reicosky. 1996. Row
spacing effects on light interception extinction coefficient of corn, sorghum,
soybean and sunflower. Agron J. 88: 185-190.
Ford, M. A. and G. N. Thorne. 1975. Effect of variation in temperature and light intensity
at different times on growth and yield of spring wheat. Annal of Applied
Biol. 80: 282-299.
Gallagher, J. N. and P. V. Biscoe. 1978. Radiation absorption, growth and yield of
cereals. J. Agric. Sci. Camb., 19: 47-60
Gallagher, J. N., P. V. Biscoe and R. D. Jones. 1983. Environmental influence on the
development, growth and yield of barley. In: Barley Production and
Marketing. Agron. Soc. New Zealand. Special Publication No. 200 PP. 21-
50.
Gent, P. N. M. 1995. Canopy light interception, gas exchange and biomass in reduced
light isolines of winter wheat: Crop Sci.35: 1636-1642.
Girardin, P., M. Tollenaar, A. Deltour and J. Muldoon. 1987. Temporary N starvation in
maize (Zea mayse L.): Effects on development, dry matter accumulation and
grain yield. Agronomie(Paris), 7: 289-296.
GOP. / UNEP. 1998. Study on climate change impact assessment and adaptation
strategies for Pakistan. Government of Pakistan (GOP) and United Nations
environment program (UNEP), Pakistan
GOP. 2007. Economic Survey of Pakistan 2006-2007, Finance Division, Economic
Advisory Wing, Islamabad, Pakistan, PP.8.
Gungula, D. T., J. G. Kling, and A. O. Togun. 2003. CERES-Maize predictions of maize
phenology under nitrogen-stressed conditions in Nigeria. Agron. J. 95: 892–
899.
Hansen, J. G. Russell, D. Rind, P. Stone, A. Lacis, S. Lebedeff, R. Ruedy, L. Travis.
1983. Efficient three-dimensional global models for climate studies: Models
I and II, Mon Weather Rev. III (4): 609-662.
Haque, M. M. and A. Hamid. 1998. Effect of nitrogen on growth of intercropped maize
and sweet potato. Indian J. Plant Physiology. 3(4): 260-264. (Cab Absts.)
162
Harrison, P. A., R. E. Butterfield and T. E. Downing. 1995. Modelling Climate Change
Impacts on Wheat, Potato and Grapevine in Europe. In Climate Change and
Agriculture in Europe: Assessment of Impacts and Adaptations, Research
Report No. 9, Environmental Change Unit, University of Oxford, Oxford,
U.K., 411 pp.
Hassan. Ul. M. 2005. Growth and yield of two maize (Zea mays L.) cultivars as affected
by different level of NPK. M. Sc. (Hons.) Agri. Thesis, Dept. Agron.,
University of .Agriculture, Faisalabad.
Hipps, L. E. Asrar G, E. T. Kanemasu. 1983. Assesing the interception of
photosynthetically-active radiation in winter wheat. Agriculture
Meteorology, 28: 253-259.
Homer, D. C. and P. F. Partt. 1961. Methods of analysis of soils, plants and waters.
Univ. of California, Div. Agri. Sci., USA, pp. 150-196.
Hoogenboom G., Tsuji, G.Y., N. B. Pickering, R. B. Curry, J. J. Jones, U. Singh, D. C.
Godwin. 1995. Decision support system to study climate change impacts on
crop production. In: Climate change and agriculture: analysis of potential
international impacts. ASA Special Publication No. 59, Madison, WI, USA,
pp. 51–75.
Hoogenboom, G. 2000. Contribution of agro-meteorology to simulation of crop
production and its application. Agric. For. Meteorol., 103 (1-2): 137-157.
Hoogenboom, G., J. W. Jones, P. W. Wilkens, C. H. Porter, W. D. Batchelor, L. A. Hunt,
K. J. Boote, U. Singh, O. Uryasev, W. T. Bowen, A. J. Gijsman, A. du Toit,
J. W. White, G. Y. Tsuji. 2004. Decision Support System for
Agrotechnology Transfer Version 4.0 [CD-ROM]. University of Hawaii,
Honolulu, HI.
Hoogenboom, G., J. W. Jones, P. W. Wilkens, W. D. Batchelor, W. T. Bowen, L. A.
Hunt, N. B. Pickerong, U. Singh, D. C. Godwin, B. Baer, K. J. Boote, J. T.
Ritchie and J. W. White. 1994. Crop model sp. 95-244. In: Tsuji, G.Y., G.
Hoogenboom, P. K. Thornton, (Eds.), Understanding Options for
Agricultural Production. Kluwer Academic Publishers, Dordrecht, The
Netherlands, PP. 9–39.
163

Horie, T. and Sakuratani, T. 1985. Studies on crop-weather relationship model of rice. I.
Relation between absorbed solar radiation by the crop and dry matter
production. J. Agric. Met., 40: 31-242.
Horie, T., Lubis, I. Takai, T. Ohsumi, A. Kuwasaki, K. Katsura, K. Nii, A. 2003.
Physiological traits associated with high yield potential in rice. In: Mew,
T.W., Brar, D.S., Peng, S., Dawe, D., Hardy, B. (eds), Rice Science:
Innovations and Impact for Livelihood. IRRI, Los Banos, Philippines, pp.
117-145.
Hughes, G., Keatinge, J.D.H.Cooper, P.J.M. and Dee, N.F. 1987. Solar radiation
interception and utilization by chickpea (Cicer arietinum L.) crops in
northern Syria. Journal of Agricultural Science, Camberage 108: 419-424.
Hulme, M., E. M. Barrow, N. W. Arnell, P. A. Harrison, T. C. Johns, T. E. Downing.
1999. Relative impacts of human-induced climate change and natural
climate variability. Nature 397, 688–691.
Hunt, L. A., S. Parajasingham, J. W. Jones, G. Hoogenboom, D. T. Imamura, and R. M.
Ogoshi. 1993. Gencalc—Software to facilitate the use of crop models for
analyzing field experiments. Agron. J. 85, 1090–1094.
Hunt, L.A., Boote, K.J., 1998. Data for model operation, calibration and evaluation. In:
Tsuji, G.Y., Hoogenboom, G., Thornton, P.K. (Eds.), Understanding
Options for Agricultural Production. Kluwer Academic Publishers,
Dordrecht, The Netherlands, PP. 9–39.
Hunt, R. 1978. Plant growth analysis. Edward Arnold, U.K.: 26-38.
Inman, D., R. Khosla, D. G. Westfall and R. Reich. 2005. Nitrogen uptake across site-
specific management zones in irrigated corn production systems. Agron. J.
97:169-176.
IPCC , 1990. First assessment report. In: Houghton, J.T., G. J. Jenkins, J. J. Ephraums,
(Eds.), Scientific Assessment of Climate Change — Report of Working
Group I. Cambridge University Press, UK.
IPCC, 1995. Second assessment report — climate change. In: Houghton, J.T., L. G.
Meira Filho, B. A. Callender, N. Harris, A. Kattenburg, K. Maskell, (Eds.),
The Science of Climate Change. Cambridge University Press, UK.
164

IPCC. 2001. Climate Change 2001: Impacts, Adaptation, and Vulnerability. Contribution
of Working Group II to the Third Assessment Report of the
Intergovernmental Panel on Climate Change, Cambridge University Press,
1032 pp.
Jagtap, S. S., F. J. Abamu and J. G. Kling. 1999. Long-term assessment of nitrogen
and variety technologies on attainable maize yields in Nigeria using
CERES-maize. Agricultural Systems 60: 77-86.
Jara, J., and C. O. Stockle. 1999. Simulation of water uptake in maize, using different
levels of process detail. Agron. J., 91:256-265.
Johanna, L., S. Graeff, W. D. Batchelor and W. Claupein. 2006. Evaluating the economic
and environmental impact of compensation payment policy under uniform
and variable-rate nitrogen management. Agriculture System 91: 135-153.
Jones, C. A. and J. Kiniry. 1986. CERES-Maize: a simulation model of maize growth and
development. Texas A & M University Press, College station, TX.
Jones, J. W. N. B. Pickering, C. Rosenzweig, and K. J. Boote. 1995. Simulated impacts
of global climate change on crops. Climate change and rice. Peng, S., K. T.
Ingram, H. U. Neue and L. H. Ziska (Eds.), International Rice Research
Institute, Manila, Philippines 218-231.
Jones, J. W., G. Hoogenboom, C. H. Porter, K. J. Boote, W. D. Batchelor, L. A., Hunt, P.
W. Wilkens, U. Singh, A. J. Gijsman, J. T. Ritchie, 2003. DSSAT Cropping
System Model. Eur. J. Agron. 18, 235–265.
Kane, S., J. Reilly, and J. Tobey. 1992. An empirical study of the economic effects of
climate change on world agriculture. Clim. Change 21: 17–35.
Keating, B. A., D. C., Godwin, and J. M. Watiki. 1991. Optimizing nitrogen inputs in
response to climatic risk. In: Muchow, R. C., and J. A. Bellamy (Eds),
Climatic Risk in Crop Production: Models and Management for the
Semiarid Tropics and Subtropics. CAB International, Wallingford, UK, PP.
329-358.
Khan, M., S. Akbar, K. Ahmad and M. S. Baloch, 1999. Evaluation of corn hybrids for
grain yield in D. I. Khan. Pakistan Journal of Biological sciences, 2 (2): 413-
414.
165

Kimbal, B. A. 1983. Carbon Dioxide and Agricultural Yield. An Assemblage of Analysis
of 430 Prior Observations. Agron. J. 75, 779–788.
Kiniry, J. R. 1991. Maize phasic development. p. 55–70. In J. Hanks and J. T. Ritchie
(ed.) Modeling plant and soil systems. Agron. Monogr. 31. ASA, CSSA,
and SSSA, Madison, WI.
Kiniry, J. R. and D. P. Knievel, 1995. Response of maize seed number to solar radiation
intercepted soon after anthesis. Agron. J. 87; 228-231.
Kiniry, J. R., C. A. Jones, J. C. O. Toole, R. Blanchet, M. Cabelguenne, and D. A.
Spanel. 1989. Radiation use efficiency in biomass accumulation prior to
grain filling for five grain crop species. Field Crops Res., 20: 51-64.
Kiniry, J. R., G. Mc-Cauley, Y. Xie and J. G. Arnold. 2001. Rice parameters describing
crop performance of four rice Cultivars. Agron. J., 93: 6, 1354-1361.
Kogbe, J. O. S and J. A. Adediran. 2003. Influence of N and P application on yield of
maize in Savanna zone of Nigeria. Afri.J. of Biotec. 2(10): 345-349.
Lal, M., Singh, K. K., Rathore, L.S. Srinivasan, G. and Saseendran, S.A. 1998.
Vulnerability of rice and wheat yields in north-west India to future changes
in climate. Agricultural and Forest Meterorology 89: 101-114.
Legg, B. L., Day. W., Lowlor, D. W. and J. J. Parkinson. 1979. The effect of drought on
barley growth: Model and measurements showing the relative importance of
leaf area and photosynthetic rate. Journal of Agricultural Science,
Cambridge 92: 703-716.
Liang, X., W. Wang, and M. P. Dudek. 1995. Interannual variability of regional climate
and its change due to the greenhouse effect. Glob. Plan. Change 10, 217–
238.
Lindquist, J. L., T. J. Arkebauer, D. T. Walters, K. G. Gassman and A .Dobermann 2005.
Maize Radiation Use Efficiency under optimal growth conditions- Agron. J.
97:72-78.
Lizaso, J. I., W. D. Batchelor and S. S. Adams. 2001. Alternate approach to improve
kernel number calculation in CERES-Maize. Trans. ASAE 44: 1–9.
Lizaso, J. I., W. D. Batchelor, M. E. Westgate, and L. Echarte. 2003. Enhancing the
ability of CERES-Maize to compute light capture. Agric. Syst. 76: 293–311.
166

Loomis, R. S., W. A. Williams, W. G. Duncan, A. Dovrat and A. F. Nunez. 1968.
Quantitative description of foliage display and light absorption in field
communities of corn plants. Crop Sci. 8: 352-356.
Lou, Q. and Lin, E. 1999. Agricultural vulnerability and adaptation in developing
countries: The Asia Pacific region. Climatic Change, 43: 729-743.
Mahmood, T. 1997.Effect of nitrogen and plant spacing on productivity of maize. M. Sc.
(Hons.) Agri. Thesis, Dept. of Agronomy, Univ. Agric., Faisalabad.
Makadho, J. M. 1996. Potential effects of climate change on corn production in
Zimbabwe. Climate Research, 6 (2): 147-151.
Manabe, S. and R. T. Wetherald. 1987. Large scale changes of soil wetness induced by
an increase in atmospheric carbon dioxide. J. Atmos. Sci., 44: 1211-1235.
Masood, M. I. H. Shamsi, N. Hussain and W. A. Shah. 2003. Performance of various
maize varieties as affected by different NP levels. Asian J. of plant Sci.,
2(7): 535-538.
Mathews, R. B., M. J. Kropff, T. Horie, M. J. Kropff, D. Bachelet, H. G. Centeno, J. C.
Shin, S. Mohandass, S. Singh, Zhu Defeng and H. L.Moon.1995. A regional
evaluation of the effect of future climate change on rice production in asia.
In modeling the impacts of climate change on rice production in asia. CAB
International/IRRI, Wallingford/Los Banos. pp 3-7.
Mearns, L. O. 1995. Research issues in determining the effects of changing climate
variability on crop yields. In: Climate Change and Agriculture: Analysis of
Potential International Impacts. ASA Special Publication No. 59, Madison,
WI, USA, pp. 123–143.
Mearns, L. O., C. Rosenzweig, and R. Goldberg. 1996. The effect of changes in daily and
inter-annual climatic variability on Ceres-wheat: a sensitivity study. Clim.
Change 32: 257–292.
Mearns, L. O., C. Rosenzweig, R. Goldberg.1997. Mean and variance change in climate
scenarios: methods, agricultural applications, and measures of uncertainty.
Clim. Change 35:367–396.
Mera , R. J., D. Niyogi, G. S. Buol, G. G. Wilkerson, and F. H. M. Semazzi. 2006.
Potential individual versus simultaneous climate change effects on soybean
167

(C3) and maize (C4) crops: An agrotechnology model based study. Global
and Planetary Change 54: 163–182.
Miao, Y., D. J. Mulla, W. D. Batchelor, J. O. Paz, P. C. Robert and M. Wiebers. (2006).
Evaluating management zone optimal nitrogen rates with a crop growth
model. Agron. J. 98:545–553.
Mohsan, S. 1999. Population dynamics and nitrogen management effects on maize (Zea
mays L.) productivity. Ph.D. Thesis, Deptt. Agron. Univ. Agri., Faisalabad.
Monteith, J. L. 1977. Climate and efficiency of crop production in Britain. Philosophical
transaction of Royal Society London. B. 281: 277-294.
Monteith, J. L. 1981. Climate variation and growth of crop. Q. J. R. Meteorol.
Soc.107:749-774.
Monteith, J. L. 1996. The quest for balance in crop modeling. Agron. J. 88: 695-697.
Montieth, J. L. and J. F. Elston. 1983. Performance and productivity of foliage in the
field. In: The growth and functioning of leaves. (Eds. J.E. and Milthorpe)
Camb. Uni. Press, Butterworths London, pp, 499-518.
Moodie, C. D., N. W. Smith and R. A. McGreery. 1959. Laboratory Manual for Soil
Fertility Development in Cron (Zea mays L.) and Subsequent grain yield.
Crop Sci., 11: 368-372.
Muchow, R. C. 1988. Effect of nitrogen supply on the comparative productivity of maize
and sorghum in semiarid tropical environment: I. Leaf growth and leaf
nitrogen. Field crops Res. 18:1-16.
Muchow, R. C. 1989. Comparative productivity of maize, sorghum and pearl millet in
semi arid tropical environment. I. Yield potential. Field Crops Research 20:
191-205.
Muchow, R. C. and R. Davis.1988. Effect of nitrogen supply on the comparative
productivity of maize and sorghum in semiarid tropical environment: II.
Radiation interception and biomass accumulation. Field crops Res. 18:17-
30.
Nunez, R. and E. Kamprath. 1969. Relationship between N response, plant population
and row width on growth and yield of corn. Agron. J. 61: 279-282.
168

O’Neill, P. M., J. F. Shanahan, J. S. Schepers, and B. Caldwell, 2004. Agronomic
responses of corn hybrids from different areas to deficit and adequate level
of water and nitrogen. Agron. J. 96:1660–1667.
Ogunlela. V. B, G. M. Amoruwa and O. O. Ologunda. 1998. Growth, yield components
and micro nutrition of field grown maize (Zea mays L.) as affected by
nitrogen fertilization plant density. Nutrient Cycling in Agro ecosystems, 17
(2): 189-196.
Oikeh, S. O., R. J. Carsky , J. G. Kling , V. O. Chude, and W. J. Horst. 2003. Differential
N uptake by maize cultivars and soil nitrate dynamics under N fertilization
in West Africa. Agriculture, Ecosystems and Environment 100: 181–191.
Okeleye, K. A and A. A. Oyekanmi. 2003. Influence of nitrogen fertilizer levels on
growth and yield of maize (Zea mays L.) hybrids. Moor J. of Agric. Res. 4
(1): 26-36.
Oktem, G. and A. Oktem, 2005. Effect of nitrogen and intra row spaces on sweet corn
(Zea mays saccharata strut) ear characteristics. Asian Journal of Plant
Sciences, 4 (4): 361-364.
Ong, C. K., and J. L. Monteith. 1985. Response of pearl millet to light and temperature.
Field Crops Res. 11: 141–160.
Pang, X. P., J. Letey, and L. Wu. 1997. Yield and nitrogen uptake prediction by CERES-
Maize model under semiarid conditions. Soil Sci. Soc. Am. J. 61: 254-
256.
Parry, M. I. 2000. Assessment of potential effects and adaptations for climate change in
Europe. The Europe ACACIA Project Jackson Environment Institute,
University of East Anglia, Norwich, U. K.
Parry, M. I., C Rosenzweig, A. Iglesias, G. Fischer, and M. Livermore. 1999. Climate
change and world food security: a new assessment Global Environ. Change
9: 51-67.
Paz, J. O., W. D. Batchelor, B. A. Babcock, T. S. Colvin, S. D. Logsdon, T. C. Kaspar,
and D. L. Karlen. 1999. Model-based technique to determine variable rate
nitrogen for corn. Agric. Syst. 61: 69-75.
169

Peart, R. M., R. B. Jones, K. Curry, K. J. Boote, and L. H. Allen. 1989. Impact of Change
on Crop Yield in the Southeastern U.S.A., in: Smith, J.B. and D. A. Tirpak.
(Eds.), The potential Effects of Global Climate Change on the United States,
Report to Congress, U.S. Environmental Protection Agency, EPA-230-05-
89-050, Washington D.C. Appendix C.
Piper, E. L. and A. Weiss. 1990. Evaluating CERES-Maize for reduction in plant
population or leaf area during the growing season. Agric. Syst. 33, 199–213.
Polley, H. W. 2002. Implications of atmospheric and climatic change for crop yield and
water use efficiency. Crop Sci. 42:131–140.
Probert, M. E., B. A. Q. Keating, A. G. Larkens and M. M. Siambi. 2001. Regional
assessment of strategies of maize production in semi-arid eastern Kenya.
Trop. Agri. Tech. Memorandum No.8, pp. 34; 12 ref
Rasheed, M., W. M. Bhutta, M. Anwar-ul-Haq and A. Ghaffar. 2004. Genotypic response
of maize hybrids to NP applications. International Journal of Agriculture
and Biology, 4: 721-722.
Rasheed. M. 2002. Biological response of Hybrid Maize to plantation methods and
nutrient management. Ph.D. Thesis, Deptt. of Agronomy, Univ. Agric.,
Faisalabad.
Reckman, R.W., S. E. Waldman and B. Klepper. 1996. MOD Wht 3: A development-
driven wheat growth simulation. Agron. J., 88: 176-185.
Ritchie, J. T. 1985. A user-oriented model of the soil water blance in wheat. In: Fry E.
Atkin TK (eds.) Wheat growth and modeling Plenum Press, NY.
Ritchie, J. T. and G. Alagarswamy. 2003. Model concepts to express genetic differences
in maize yield components. Agron. J., 95: 4–9.
Ritchie, J. T., U. Singh, D. C. Godwin and L. A. Hunt. (1989). A user's guide to CERES-
maize V 2.1. International Fertilizer Development Center, Muscle Shoals,
AL.
Ritchie, J. T., U. Singh, D. C. Godwin and W. T. Bowen. 1998 b. The use of crop models
for international climate change impact assessment. In: Tsuji, G. Y., G.
Hoogenboom, and P. K. Thornton (Eds.) Understanding option for
agriculture production. Academic publ. London. pp: 79-98.
170

Ritchie, J. T., U. Singh, D. C. Godwin, and L. A. Hunt. 1989. A user's guide to CERES-
maize V2.1. International Fertilizer Development Center, Muscle Shoals,
AL.
Ritchie, J. T., U. Singh, D. C. Godwin, and W. T. Bowen. 1998a. Cereal growth,
development, and yield. In: Tsuji, G. Y., G. Hoogenboom, and P. K.
Thornton (Eds.) Understanding Options for Agricultural Production, 79-98.
Dordrecht: Kluwer Academic Publishers.
Rogers, H. H., G. E. Bingham, J. D. Cure, J. M. Smith and K. A. Surano. 1983.
Responses of selected plant species to elevated carbon dioxide in the field. J.
Eniron Qual, 12: 569-574.
Rosenzweig, C. 1990.Crop response to climate change in the Southern Great Plains:a
simulation study. Prof Geog 42 (1): 20-37.
Rosenzweig, C. and A. Iglesias. 1998. The use of crop models for international climate
change impact assessment: study design, methodology and conclusions, in
Rosenzweig C. and A. Iglesias (Eds.), Implications of climate change for
international Agriculture: Crop modeling study. US Environmental
protection agency, EPA 230-B-94-003. Washington, DC.
Rosenzweig, C., and D. Hillel. 1993. Agriculture in a greenhouse world. Natl. Geograph.
Res. Explor. 9, 201–221.
Rosenzweig, C., and D. Hillel. 1998. Climate Change and the Global Harvest: Potential
Impacts of the Greenhouse Effect on Agriculture. Oxford University Press,
New York.
Saarikko, R. A., and T. R. Carter. 1996. Estimating the development and regional thermal
suitability of spring wheat in Finland under climatic warming. Clim. Res.7:
243–252.
Sabir, M. R., I. Ahmad and M. A. Shahzad.2000. Effect of nitrogen and phosphorus on
yield and quality of two hybrids of maize (Zea mays L.). J. Agric. Res.,
38(4): 339-346.
Sadler, E. J., P. J. Bauer, and W. J. Busscher. 2000. Site-specific analysis of a droughted
corn crop: I. Growth and grain yield. Agron. J. 92, 395–402.
171

Saleem, M., K. Shahzad, M. Javid and A. Ahmad, (2002). Genetic analysis for various
quantitative traits in Maize (Zea mays L.) Inbred Lines. International
Journal of Agriculture and Biology, 4 (3): 379-382.
Sangoi, L., M. Ender, A. F. Guidolin. M. L. Almeida and V. A. Konflanz. 2001. Nitrogen
fertilization impact on agronomic traits of maize hybrids released at
different decades. Pesq. Agropec. Bars., Brasilia 36(5): 757-764.
Semenov, M. A., and E. M. Barrow. 1997. Use of a stochastic weather generator in the
development of climate change scenarios. Clim. Change 35, 397–414.
Semenov, M. A., J. Wolf, L. G. Evans, H. Eckersten, and A. Iglesias. 1996. Comparison
of wheat simulation models under climate change. II. Application of climate
change scenarios. Clim. Res. 7, 271–281.
Shapiro, C. A. and C. S. Wortmann. 2006. Corn response to nitrogen rate, row spacing,
and plant density in eastern Nebraska. Agron. J. 98: 529–535.
Sharar, M. S. M. Ayub, M. Nadeem and N. Ahmad. 2003. Effect of different rates of
nitrogen and phosphorus on growth and grain yield of Maize (Zea mays L.).
Asian Journal of Plant Science, 2(3): 347-349.
Shearman, V.J., Sylvester-Bradley, R. Scott, R.K. Foulkes, M.J. 2005. Physiological
processes associated with wheat yield progress in the UK. Crop Sci., 45:
175-185.
Sinclair, P. R. and N. G. Saligman. 1996. Crop modeling: From infancy to maturity.
Agron. J. 88: 698-704.
Sinclair, T. R. and R. C. Muchow. 1995. Effect of nitrogen supply on maize yield. 1.
Modeling physiological responses. Agron. J. 87(4): 632-641.
Sinclare, T. R. and T. Horie. 1989. Leaf nitrogen, photosynthesis, and crop radiation use
efficiency: A review. Crop Sci. 29: 90-98.
Singh, U. and P. W. Wilkens. 2001. Simulating water and nutrient stress effects on
phenological developments in maize. In Modeling Extremes of Wheat and
Maize.
Soler, C. M. T., P. C. Sentelhas, and G. Hoogenboom. 2007. Application of the CSM-
CERES-Maize model for planting date evaluation and yield forecasting for
172

maize grown off-season in a subtropical environment, Eur. J. of Agron.
doi:10.1016/j.eja.2007.03.002.
Southworth , J., J. C. Randolph , M. Habeck , O. C. Doering , R. A. Pfeifer , D. G. Rao,
and J. J. Johnston. 2000. Consequences of future climate change and
changing climate variability on maize yields in the midwestern United
States. Agriculture, Ecosystems and Environment 82: 139–158.
Spietz, J.H.J., Ten Hag, B.A. and Kupers, L.J.P. 1971. Relation between green area
duration and grain yield in some varieties of spring wheat. Netherlands
Journal of Agricultural Science, 19: 211-222.
Steel, R. G. D. and J. H. Torrie. 1984. Principles and Procedures of Statistics. 2nd ed.
McGraw Hill, Int. Book Co. Inc. Singapore.
Stockle, C. O, M. Donatelli and R. Nelson. 2003. CropSyst, a cropping systems
simulation model. Eur. J. Agron., 18: 289–307.
Stockle, C. O. and J. R. Kiniry. 1990. Variability in crop radiation use efficiency
associated with va-por-pressure deficit, Field Crops Res., 25: 171-181.
Szeicz, G. 1974. Solar radiation for plant growth. J. Appl. Ecol. 11: 617-636.
Takai, T. M. Shoji, N. Takahiro, O. Akikiro, S. Tatsuhiko and Takeshi Horie. 2005. Rice
yield potential is closely related to crop growth rate during late reproductive
period. Field Crops Research, 96: 328-335.
Tao, F., M. Yokozawa , Y. Xu , Y. Hayashi, Z. Zhang. 2006. Climate changes and trends
in phenology and yields of field crops in China, 1981–2000. Agricultural
and Forest Meteorology. http://dx.doi.org/10.1016/j.agrformet.2006.03.014.
Tetio-Kagho, F. and F. P. Gardner. 1988. Response of maize to plant population density.
I. Canopy development, light relationships and vegetative growth. Agron. J.,
80(6): 930-935.
Thornley, J. H. M., and I. R. Johnson. 1990. Plant and Crop Modelling: A Mathematical
Approach to Plant and Crop Physiology. Oxford: Oxford Science
Publications.
173

Thorp, K. R., W
Trnka, M., M. Dubrovsky and Z. Z
Tsuji, G.Y., Jones, J.W., Hooge
Uhart, S. A.
Van Diepen, C. A., J.
Van Ittersum, M. K., P. A. Leffelaar, H.
Wallach, D. and B. Goffinet. 1989. Mean squa
Watiki, J., M. S. Fukai, J. A. Banda and B.
Watson, D. J. 1952. The physiological basis of
W
174
. D. Batchelor, J. O. Paz, B. L. Steward and P. C. Caragea. 2006.
Methodology to link production and environmental risks of precision
nitrogen management strategies in corn. Agriculture systems 89:272-298.
alud. 2004. Climate change impacts and adaptation
strategies in spring barley production in the Czech Republic Climatic
Change 64: 227–255.
nboom, G., Hunt, L.A., Thornton, P.K., 1994.
Introduction. In: Tsuji, G., Uehara, Y., Balas, G.S. (Eds.), DSSAT v3,
Decision Support System for Agrotechnology Transfer, vol. 1. University of
Hawaii, Honolulu, Hawaii.
and F. H. Andrade. Nitrogen deficiency in maize. I. Effect on crop growth,
development, dry matter partitioning, and kernel set. Crop Sci. 35: 1376-
1383.
Wolf, H. Van Keulen and C. Rappoldt.1989. WOFOST: a
simulation model of crop production. Soil Use Manage 5: 16-24.
Van Evert, F. K., and G. S. Campbell. 1994. Crop Syst: A collection of object-oriented
simulation of agriculture systems. Agron. J. 86: 325-331.
Van Keulen, M. J. Kropff, L. Bastiaans
and J. Goudriaan. 2003. On approaches an application of the
Wageningen crop models. Eur. J. Agron., 18, 201–234. Weed Sci., 49,
195–201.
red error of prediction as a criterion for
evaluating and comparing system models. Ecol. Model., 44: 200-306.
A. Keating. 1993. Radiation interception and
growth of maize / cowpea intercrop as affected by maize plant density and
cowpea cultivars. Field Crop Res.35:123-133.
variation in yield. Adv. Agron., 4: 101-
145.
histler, F. D., Acock, B. Baker, D. N. Fye, R. F. Hodges, H. F. Lambert, J. R.
Lemmain, H. E. Mckinion, and V.R. Reddy.1986. Crop simulation models
in agronomic systems. Advances in Agronomy, 40: 141-208.

W
Wolf. J. 1993. Effects of clim
Worku, M., M. Banziger, and G. S. Erley, D.
175
illmott, C. J. 1982. Some comments on the evaluation of model performance. Bull.
Am. Meteorol. Soc. 63:1309–1313.
ate change on wheat and maize production potential in the
EC. In: Kenny, G.J. P.A. Harrison and M.L. Parry (eds.). The effects of
climate change on agricultural and horticultural potential in Eurpoe. Res.
Rep. No. 2, Environmental Change Unit, University of Oxford, Oxford, U.
K.
Friesen, A. O. Diallo, and W. J. Horst.
2007. Nitrogen uptake and utilization in contrasting nitrogen efficient
tropical maize hybrids. Crop Sci. 47: 519–528.
Wright, D. 1982. Crop Physiology. In: Agricultural Note Book; R. J. Halley (Ed). Butter
Worth Scientific, London.
Yang, H. S. A. Dobberman, J. L. Lindquist, D. T. Walters, T. J. Arkebaur, and K. G.
Gassman. 2004. Hybrid-Maize-a maize simulation model that combines two
crop modeling approaches. Field Crops Res., 87: 131-154.
Yang, J. and M. Alley. 2005. A mechanistic model for describing corn plant leaf area
distribution. Agron.J.97: 41-48.
Younas, M., H. Rehman and G. Hayder. 2002. Magnitude of variability for yield and
yield associated traits in maize hybrids. Asian J. Plant Sci. 1 (6): 694-696.
Zalud, Z. and M. Dubrovsky. 2002. Modeling climate change impacts on maize growth
and development in the Czech Republic. Theo. Appl. Climatol. 72, 85-102.

176
Appendix 3.1: Physical and chemical analysis of experimental soil
Determination Unit Faisalabad Sargodha
Sahiwal
a) Physical
Sand % 62 26 31
Silt % 15 59 56
Clay % 23 15 15
Textural class Sandy clay loam Silty Loam Silty Loam
b) Chemical analysis
pH - 7.68 7.84 8.09
Total soluble salts % 13.45 14.85 10.25
Organic matter % 1.355 1.16 0.98
Total nitrogen % 0.068 0.06 0.052
Available phosphorus ppm 7.02 5.45 8.1
Potassium ppm 194 220 88

Appendix 3.2 : Soil characteristics of Faisalabad location
Site Name: Faisalabad Soil Series Name: Lyallpur
Latitude: 31°.25΄ Soil colour: Brown
Longitude: 73°.06΄ Soil classification: Fine, loamy, silk, therm
Depth Master Clay Silt Sand Stones Organic pH CEC Total N Bulk density
(cm) Horizon (%) (%) (%) (%) Carbon (c mol/ kg) (%) (g/cm3)
15 AP 26 56 18 0 0.89 7.8 9.6 0.07 1.50
92 B2 28 53 19 0 0.69 7.9 10.4 0.03 1.51
127 B3Ca 30 50 20 0 0.46 8.8 14.4 0.04 1.51
152 C 32 54 14 0 0.42 8.2 15.2 0.04 1.53
177

Appendix 3.3: Soil characteristics of Sargodha location
Site Name: Sargodha Soil Series Name: Bhalwal
Latitude: 32°.03΄ Soil colour: Brown
Longitude: 72°.40΄ Soil classification: Fine-silty, mixed, hyperthermic, typic
Depth Master Clay Silt Sand Stones Organic pH CEC Total N Bulk density
(cm) Horizon (%) (%) (%) (%) Carbon (c mol/ kg) (%) (g/cm3)
12 Ap 15 59 26 0 0.7 8.2 15.3 0.06 1.57
23 Bat 14 60 26 0 0.47 8.2 12.1 0.04 1.57
68 Bt1 19 59 22 0 0.12 8.3 9.7 0.01 1.47
92 Bt2 20 60 20 0 0.08 8.4 9.6 0.01 1.53
110 BtK 18 61 21 0 0.06 8.4 9.7 0 1.24
146 CBK1 16 63 21 0 0.06 8.4 9.5 0 1.22
176 CBK2 16 65 19 0 0.02 8.5 9.3 0 1.24
190 CK1 16 63 21 0 0.02 8.5 9.3 0 1.23
178

179
Appendix 3.4: Soil characteristics of Sahiwal location
Site Name: Sahiwal Soil Series Name: Jaranwala
Latitude: 30°.40΄ Soil colour: Brown
Longitude: 73°.06΄ Soil classification: Coarse-silty,Mixed, hyperthermic Typic
Depth Master Clay Silt Sand Stones Organic pH CEC Total N Bulk density
(cm) Horizon (%) (%) (%) (%) Carbon (c mol/ kg) (%) (g/cm3)
11 Ap 10 56 0 0.53 8.3 9.7 0.04 1.65
25 Bat 13 53 0 0.02 8.4 8.9 0.02 1.65
65 Bt1 17 53 0 0.13 8.2 -99 0.02 1.33
90 Bt2 16 54 0 0.12 8.3 -99 0.01 1.36
115 BtK1 12 58 0 0.12 8.4 -99 0.01 1.42
128 BtK2 8 58 0 0.12 8.4 15.3 0.01 1.42
167 BCK 5 59 0 0.06 8.5 9.7 0.0 1.44
190 CK 8 58 0 0.03 8.8 -99 0.0 1.44

Appendix 4.1: Monthly mean weather conditions during crop growth season (Aug 2004 – Dec. 2004)
Mean temperature
(°C) Rainfall
(mm) Solar radiation (MJ m-2 day-1)
Relative humidity (%)
Month
Fsd Sgd Swl Fsd Sgd Swl Fsd Sgd Swl Fsd Sgd Swl Aug 31.1
(31.7) 31.5
(31.8) 32.1
(32.7) 81.6
(84.7) 96.0
(119.6) 57.0
(134.5) 20.6
(21.1) 19.2
(20.6) 17.0
(21.2) 68.4
(56.1) 68.4
(66.3) 64.3
(69.6) Sep 30.4
(29.9) 31.1
(30.4) 30.9
(30.7) 25.7
(40.0) 29.0
(35.8) 80.0
(55.4) 20.4
(20.4) 20.1
(19.9) 19.9
(20.6) 57.4
(60.8) 57.6
(58.7) 58.4
(51.4) Oct 23.9
(25.3) 24.5
(25.6) 24.9
(26.2) 18.0 (4.6)
10.0 (11.3)
36.0 (14.6)
15.9 (17.4)
14.8 (16.9)
13.5 (17.6)
56.8 (55.0)
60.0 (55.1)
54.5 (59.0)
Nov 19.9 (19.1)
19.7 (19.4)
20.5 (20.1)
6.6 (3.9)
0.0 (7.5)
9.0 (5.9)
12.3 (13.8)
9.9 (13.2)
12.9 (14.0)
66.2 (62.8)
71.0 (63.6)
65.1 (61.6)
Dec 15.0 (13.9)
15.1 (14.1)
15.6 (14.8)
1.6 (6.2)
13.0 (11.7)
0.0 (8.9)
11.5 (11.3)
10.2 (10.9)
9.5 (11.4)
69.7 (67.1)
72.3 (71.5)
69.6 (67.7)
Total 133.5 (139.4)
148.0 (185.9)
182.0 (219.3)
(Figures in brackets show long term means of weather conditions during 1976-2005) Source:
Crop Physiology Department University of Agriculture, Faisalabad Adaptive Research Farm, Sargodha Maize and Millet Research Institute, Sahiwal Pakistan Meteorological Department, Islamabad Fsd = Faisalabad Sgd = Sargodha Swl = Sahiwal
180

Appendix 4.2: Monthly mean weather conditions during crop growth season (Aug 2005 – Dec. 2005)
Mean temperature
(°C) Rainfall
(mm) Solar radiation (MJ m-2 day-1)
Relative humidity (%)
Month
Fsd Sgd Swl Fsd Sgd Swl Fsd Sgd Swl Fsd Sgd Swl Aug 32.4
(31.7) 33.0
(31.8) 33.1
(32.7) 30.0
(84.7) 74.0
(119.6) 69.0
(134.5) 23.3
(21.1) 20.9
(20.6) 24.4
(21.2) 56.1
(56.1) 50.3
(66.3) 59.2
(69.6) Sep 29.9
(29.9) 30.6
(30.4) 30.7
(30.7) 129.5 (40.0)
69.0 (35.8)
104.0 (55.4)
20.8 (20.4)
18.9 (19.9)
21.0 (20.6)
48.8 (60.8)
55.7 (58.7)
62.5 (51.4)
Oct 25.6 (25.3)
26.1 (25.6)
26.6 (26.2)
0.0 (4.6)
61.0 (11.3)
51.0 (14.6)
17.9 (17.4)
17.4 (16.9)
19.0 (17.6)
41 (55.0)
47.1 (55.1)
52.3 (59.0)
Nov 19.3 (19.1)
19.8 (19.4)
19.9 (20.1)
0.0 (3.9)
15.0 (7.5)
18.0 (5.9)
13.4 (13.8)
11.6 (13.2)
14.4 (14.0)
62.8 (62.8)
50.6 (63.6)
61.0 (61.6)
Dec 12.8 (13.9)
12.9 (14.1)
13.6 (14.8)
0.0 (6.2)
0.0 (11.7)
0.0 (8.9)
12.3 (11.3)
11.2 (10.9)
11.6 (11.4)
69.1 (67.1)
56.5 (71.5)
62.0 (67.7)
Total 159.5 (139.4)
219.0 (185.9)
242.0 (219.3)
(Figures in brackets show long term means of weather conditions during 1976-2005) Source:
Crop Physiology Department University of Agriculture, Faisalabad Adaptive Research Farm, Sargodha Maize and Millet Research Institute, Sahiwal Pakistan Meteorological Department, Islamabad Fsd = Faisalabad Sgd = Sargodha Swl = Sahiwal
181

182
Appendix 4.3: Average of weather conditions during crop growth seasons (2004 & 2005)
Mean temperature Rainfall Solar radiation Relative humidity
(°C) (mm) (MJ m-2 day-1) (%) Month
Fsd Sgd Swl Fsd Sgd Swl Fsd Sgd Swl Fsd Sgd Swl Aug 31.8
(31.7) 32.3
(31.8) 32.6
(32.7) 55.8
(84.7) 85.0
(119.6) 63.0
(134.5) 22.0
(21.1) 20.1
(20.6) 20.7
(21.2) 62.3
(56.1) 59.4
(66.3) 61.8
(69.6) Sep 30.2
(29.9) 30.9
(30.4) 30.8
(30.7) 77.6
(40.0) 49.0
(35.8) 92.0
(55.4) 20.6
(20.4) 19.5
(19.9) 20.5
(20.6) 53.1
(60.8) 56.7
(58.7) 60.5
(51.4) Oct 24.8
(25.3) 25.3
(25.6) 25.8
(26.2) 9.0
(4.6) 35.5
(11.3) 43.5
(14.6) 16.9
(17.4) 16.1
(16.9) 16.3
(17.6) 48.9
(55.0) 53.6
(55.1) 53.4
(59.0)
Nov 19.6 (19.1)
19.8 (19.4)
20.2 (20.1)
3.3 (3.9)
7.5 (7.5)
13.5 (5.9)
12.9 (13.8)
10.8 (13.2)
13.7 (14.0)
64.5 (62.8)
60.8 (63.6)
63.1 (61.6)
Dec 13.9 (13.9)
14.0 (14.1)
14.6 (14.8)
0.8 (6.2)
6.5 (11.7)
0.0 (8.9)
11.9 (11.3)
10.7 (10.9)
10.6 (11.4)
69.4 (67.1)
64.4 (71.5)
65.8 (67.7)
Total
146.5 (139.4)
183.5 (185.9)
212.0 (219.3)
(Figures in brackets show long term means of weather conditions during 1976-2005) Source:
Crop Physiology Department University of Agriculture, Faisalabad Adaptive Research Farm, Sargodha Maize and Millet Research Institute, Sahiwal Pakistan Meteorological Department, Islamabad Fsd = Faisalabad Sgd = Sargodha Swl = Sahiwal

183
Appendix 4.4: Comparison of simulated and observed final grain yield (kg ha-1) at varying nitrogen levels and locations during year 2004
N Levels Bemasal-202 Monsanto-919 Pioneer-31-R-88 Av kg ha-1 Sim Obs Error (%) Sim Obs Error (%) Sim Obs Error (%) Sim Obs Error (%)
Faisalabad 150 6968 6838 1.9 5180 4911 8.6 6976 6476 7.7 6375 6075 6.1 200 8542 7713 10.8 6230 5465 14.0 8484 7579 11.9 7752 6919 12.2 250 9694 8354 16.0 6578 5973 10.1 9506 8107 17.3 8593 7478 14.5 300 9910 9179 8.0 6700 6349 5.5 9843 8672 13.5 8818 8067 9.0 350 9958 8904 11.8 6725 6397 5.1 9917 8435 17.6 8867 7912 11.5
RMSE (kg ha-1) 910.5 500.9 1148.4 MPD 9.7 8.1 13.6 Sargodha
150 7259 6551 10.8 5582 5360 4.1 7267 6580 10.4 6703 6164 8.5 200 8678 7219 20.2 6038 5751 5.0 8666 7351 17.9 7794 6774 14.4 250 9604 7998 20.1 6257 6070 3.1 9553 7980 19.7 8471 7349 14.3 300 9703 8858 9.5 6315 6366 -0.8 9646 8614 12.0 8555 7946 6.9 350 9736 8710 11.8 6331 6291 0.6 9682 8350 16.0 8583 7784 9.5
RMSE (kg ha-1) 1181 185 1226 MPD 14.5 2.7 15.2 Sahiwal
150 5808 5315 9.3 4513 4343 3.9 5738 5245 9.4 5353 4968 7.5 200 7254 6440 12.6 5598 5100 9.8 7066 6260 12.9 6639 5933 11.7 250 8276 7534 9.8 5982 5575 7.3 7681 7398 3.8 7313 6836 7.0 300 8665 8390 3.3 6239 6145 1.5 8006 7920 1.1 7637 7485 2.0 350 8843 8118 8.9 6345 6210 2.2 8161 7809 4.5 7783 7379 5.2
RMSE (kg ha-1) 641.48 306.47 469.91 MPD 8.8 4.9 6.3
Av 8593 7741 10.99 6041 5754 5.34 8413 7518 11.7 7682 7005 9.3
Copyright © 2022 FDOKUMEN