Gene Action for Various Grain and Fodder Quality Traits in Zea Mays
14
Journal of Food and Nutrition Research, 2014, Vol. 2, No. 10, 704-717 Available online at http://pubs.sciepub.com/jfnr/2/10/9 © Science and Education Publishing DOI:10.12691/jfnr-2-10-9 Gene Action for Various Grain and Fodder Quality Traits in Zea Mays Qurban Ali 1,2 , Arfan Ali 2,* , Muhammad Tariq 2 , Malik Adil abbas 2 , Bilal Sarwar 2 , Mukhtar Ahmad 2 , Mudassar Fareed Awaan 2 , Shafique Ahmad 2 , Zaheer Ahmad Nazar 2 , Faheem Akram 2 , Atif Shahzad 2 , Tahir Rehman Samiullah 2 , Idrees Ahmad Nasir 2 , Tayyab Husnain 2 1 Department of Plant Breeding and Genetics, University of Agriculture Faisalabad, Pakistan 2 Centre of Excellence in Molecular Biology, University of the Punjab, Lahore Pakistan *Corresponding author: [email protected] Received September 09, 2014; Revised September 24, 2014; Accepted September 29, 2014 Abstract A Zea may is an important cereal crop. To nourish human and livestock, it is very important that the quality of maize grain and fodder must be higher. A study was conducted to evaluate maize accessions for grain and fodder quality traits. Results indicated that higher heritability was found for nutrient detergent fiber, fodder cellulose, fodder crude fiber, fodder crude and fodder moisture percentage while genetic advance was higher for fodder cellulose, fodder crude protein and fodder ash percentage. High significant genotypic and phenotypic correlation was found among grain protein, oil and starch percentage, nutrient detergent fiber, fodder cellulose, fodder crude fiber & protein and fodder moisture percentage. The higher cumulative additive effect was recorded for acid detergent fiber, fodder crude fiber; nutrient detergent fiber and fodder cellulose suggested that selections may be made to develop synthetic varieties for better quality. Higher dominance effect and degree of dominance indicated that selection may be useful for the development of good quality maize hybrids through heterosis breeding programme. Principle component bi-plot analysis indicated that B-11×EV-347, B-11, Sh-139, EV-1097×E-322, Sh-139×B-316, B-327×E- 322, B-316, Raka-poshi, B-11×Pop/209, B-336×EV-340, B-327×E-322, B-327×F-96, EV-1097×E-322, Raka- poshi×EV-347, EV-1097×Pop/209 and EV-1097×EV-340 performed better for grain and fodder quality and may be used for improvement of grain and fodder quality of maize. Keywords: zea mays, additive, dominance, degree of dominance, genetic advance, quality Cite This Article: Qurban Ali, Arfan Ali, Muhammad Tariq, Malik Adil abbas, Bilal Sarwar, Mukhtar Ahmad, Mudassar Fareed Awaan, Shafique Ahmad, Zaheer Ahmad Nazar, Faheem Akram, Atif Shahzad, Tahir Rehman Samiullah, Idrees Ahmad Nasir, and Tayyab Husnain, “Gene Action for Various Grain and Fodder Quality Traits in Zea Mays.” Journal of Food and Nutrition Research, vol. 2, no. 10 (2014): 704-717. doi: 10.12691/jfnr-2-10-9. 1. Introduction Maize (Zea mays L.) plant has a remarkable productive potential and world’s leading cereal food crop with added importance for countries like Pakistan where quickly increasing population has already facing less availability of food supplies. Maize is the third important cereal crop in Pakistan than wheat and rice. Maize accounts for 5.67% of the value of agriculture output. It accounts for 1083 thousands hectares of total cropped area in Pakistan with annual production of 4271 thousand tons. Maize is the dual purpose cereal crop as used in human food, livestock feed and industrial raw material for the manufacturing of various by-products. It has highest crude protein 9.9% at early and at full bloom stages which decreases to 7% at milk stage and to 6% at maturity. Maize has highly nutritive value as it contains 72% starch, 10% protein, 4.80% oil, 9.50% fiber, 3.0% sugar, 1.70% ash, 82% endosperm, 12% embryo, 5% bran testa and 1% tip cap [1]. Pakistan have livestock population of 154.7 million heads which produce about 43.562 million tons of milk, 1.601 million tons of beef and 0.590 million tons of mutton. The livestock sector of Pakistan contributes about 53.2% of the agriculture outputs and 11.4% to national GDP of Pakistan. Green fodder is the most cheapest and precious source for livestock food. It is rich an important source of 35-40% cellulose, 25.28% hemicelluloses, 0.30% fat, 28.70% crude fiber, 37.22% acid detergent fiber, 70.85% neutral detergent fiber, 40.6% dry matter, 4% ash, 48.86% carbohydrates, 9.22% moisture, 2.84% ether extract and 11% crude proteins [1]. The milk production of livestock animals may be increased up to 100% by using good quality and highly nutritive fodder [1,2]. Around 80-90 % of nutrient requirements of livestock are met from the fodder crops but the present fodder supply is 1/3 times less than the actual needs and the majority of the animals remain under fed especially during June-July (extremely hot season) and December- January (extremely cold season). In Pakistan out of total cropped area of 23.51 million ha only 2.46 million ha was under fodder crops with total
Transcript of Gene Action for Various Grain and Fodder Quality Traits in Zea Mays

Journal of Food and Nutrition Research, 2014, Vol. 2, No. 10, 704-717 Available online at http://pubs.sciepub.com/jfnr/2/10/9 © Science and Education Publishing DOI:10.12691/jfnr-2-10-9
Gene Action for Various Grain and Fodder Quality Traits in Zea Mays
Qurban Ali1,2, Arfan Ali2,*, Muhammad Tariq2, Malik Adil abbas2, Bilal Sarwar2, Mukhtar Ahmad2, Mudassar Fareed Awaan2, Shafique Ahmad2, Zaheer Ahmad Nazar2, Faheem Akram2, Atif Shahzad2,
Tahir Rehman Samiullah2, Idrees Ahmad Nasir2, Tayyab Husnain2
1Department of Plant Breeding and Genetics, University of Agriculture Faisalabad, Pakistan 2Centre of Excellence in Molecular Biology, University of the Punjab, Lahore Pakistan
*Corresponding author: [email protected]
Received September 09, 2014; Revised September 24, 2014; Accepted September 29, 2014
Abstract A Zea may is an important cereal crop. To nourish human and livestock, it is very important that the quality of maize grain and fodder must be higher. A study was conducted to evaluate maize accessions for grain and fodder quality traits. Results indicated that higher heritability was found for nutrient detergent fiber, fodder cellulose, fodder crude fiber, fodder crude and fodder moisture percentage while genetic advance was higher for fodder cellulose, fodder crude protein and fodder ash percentage. High significant genotypic and phenotypic correlation was found among grain protein, oil and starch percentage, nutrient detergent fiber, fodder cellulose, fodder crude fiber & protein and fodder moisture percentage. The higher cumulative additive effect was recorded for acid detergent fiber, fodder crude fiber; nutrient detergent fiber and fodder cellulose suggested that selections may be made to develop synthetic varieties for better quality. Higher dominance effect and degree of dominance indicated that selection may be useful for the development of good quality maize hybrids through heterosis breeding programme. Principle component bi-plot analysis indicated that B-11×EV-347, B-11, Sh-139, EV-1097×E-322, Sh-139×B-316, B-327×E-322, B-316, Raka-poshi, B-11×Pop/209, B-336×EV-340, B-327×E-322, B-327×F-96, EV-1097×E-322, Raka-poshi×EV-347, EV-1097×Pop/209 and EV-1097×EV-340 performed better for grain and fodder quality and may be used for improvement of grain and fodder quality of maize.
Keywords: zea mays, additive, dominance, degree of dominance, genetic advance, quality
Cite This Article: Qurban Ali, Arfan Ali, Muhammad Tariq, Malik Adil abbas, Bilal Sarwar, Mukhtar Ahmad, Mudassar Fareed Awaan, Shafique Ahmad, Zaheer Ahmad Nazar, Faheem Akram, Atif Shahzad, Tahir Rehman Samiullah, Idrees Ahmad Nasir, and Tayyab Husnain, “Gene Action for Various Grain and Fodder Quality Traits in Zea Mays.” Journal of Food and Nutrition Research, vol. 2, no. 10 (2014): 704-717. doi: 10.12691/jfnr-2-10-9.
1. Introduction Maize (Zea mays L.) plant has a remarkable productive
potential and world’s leading cereal food crop with added importance for countries like Pakistan where quickly increasing population has already facing less availability of food supplies. Maize is the third important cereal crop in Pakistan than wheat and rice. Maize accounts for 5.67% of the value of agriculture output. It accounts for 1083 thousands hectares of total cropped area in Pakistan with annual production of 4271 thousand tons. Maize is the dual purpose cereal crop as used in human food, livestock feed and industrial raw material for the manufacturing of various by-products. It has highest crude protein 9.9% at early and at full bloom stages which decreases to 7% at milk stage and to 6% at maturity. Maize has highly nutritive value as it contains 72% starch, 10% protein, 4.80% oil, 9.50% fiber, 3.0% sugar, 1.70% ash, 82% endosperm, 12% embryo, 5% bran testa and 1% tip cap [1].
Pakistan have livestock population of 154.7 million heads which produce about 43.562 million tons of milk, 1.601 million tons of beef and 0.590 million tons of mutton. The livestock sector of Pakistan contributes about 53.2% of the agriculture outputs and 11.4% to national GDP of Pakistan. Green fodder is the most cheapest and precious source for livestock food. It is rich an important source of 35-40% cellulose, 25.28% hemicelluloses, 0.30% fat, 28.70% crude fiber, 37.22% acid detergent fiber, 70.85% neutral detergent fiber, 40.6% dry matter, 4% ash, 48.86% carbohydrates, 9.22% moisture, 2.84% ether extract and 11% crude proteins [1]. The milk production of livestock animals may be increased up to 100% by using good quality and highly nutritive fodder [1,2]. Around 80-90 % of nutrient requirements of livestock are met from the fodder crops but the present fodder supply is 1/3 times less than the actual needs and the majority of the animals remain under fed especially during June-July (extremely hot season) and December-January (extremely cold season).
In Pakistan out of total cropped area of 23.51 million ha only 2.46 million ha was under fodder crops with total

Journal of Food and Nutrition Research 705
fodder production of 55.06 million tons [3] that is not sufficient enough to fulfill the requirements of nutrition for the existing livestock. The livestock feed pool in Pakistan is deficient by 21 % of total dry matter (DM), and by 33 % of crude protein requirements [2]. The poor yield is due to growing pressure of human population, less and irregular rainfalls, scarcity of irrigation water, less priorities for fodder crop production and imbalance use of fertilizers [4,5,6]. Present study was conducted to evaluate maize inbred lines and F1 hybrids for various grain and fodder quality traits. Gene action provides plant breeder a plate form to select genotypes with better grain yield and quality [1,7-15].
2. Materials and methods The present study was carried out in the research area
of the Department of Plant Breeding and Genetics, University of Agriculture, Faisalabad Pakistan to evaluate the selected maize parents and F1 hybrids for grain and fodder quality traits at maturity during crop growing season 2012. The samples were collected from the field at anthesis stage and various quality traits were recorded (AOAC, 1996) in the Animal Nutrition Laboratory, Institute of Animal Nutrition University of Agriculture Faisalabad.
Parents and F1 crosses used in evaluation experiment Sr. No. Genotypes Sr. No. Genotypes Sr. No. Genotypes
1 Pop/209 17 B-11×F-96 33 B-327×EV-340 2 B-316 18 B-11×EV-347 34 B-327×E-322 3 EV-340 19 B-336×Pop/209 35 B-327×F-96 4 E-322 20 B-336×B-316 36 B-327×EV-347 5 F-96 21 B-336×EV-340 37 Raka-poshi×Pop/209 6 EV-347 22 B-336×E-322 38 Raka-poshi×B-316 7 B-11 23 B-336×F-96 39 Raka-poshi×EV-340 8 B-336 24 B-336×EV-347 40 Raka-poshi×E-322 9 EV-1097 25 EV-1097×Pop/209 41 Raka-poshi×F-96
10 B-327 26 EV-1097×B-316 42 Raka-poshi×EV-347 11 Raka-poshi 27 EV-1097×EV-340 43 Sh-139×Pop/209 12 Sh-139 28 EV-1097×E-322 44 Sh-139×B-316 13 B-11×Pop/209 29 EV-1097×F-96 45 Sh-139×EV-340 14 B-11×B-316 30 EV-1097×EV-347 46 Sh-139×E-322 15 B-11×EV-340 31 B-327×Pop/209 47 Sh-139×F-96 16 B-11×E-322 32 B-327×B-316 48 Sh-139×EV-347
The seed of F1 hybrids along with their parents were sown in field following a triplicated randomized complete block design. The plant to plant and row to row distances were maintained as 25 and 75 cm, respectively.
2.1. Quality Parameters The grain and plant samples containing leaves and stem
will be collected and grounded into fine powder and the following quality traits including grain protein percentage, grain oil percentage, grain starch percentage, grain crude fibre percentage, nutrient detergent fibre, acid detergent fibre, fodder cellulose, carbohydrates, fodder crude fibre, fodder crude protein and fodder moisture percentage were estimated using (Proximate analysis, AOAC (Association of Official Analytical Chemists) 1996).
The percentage of the embryo was recorded by using following formula:
Embryo % = [Embryo weight/Seed weight] × 100 The fresh weight of the sample was recorded with the
help of electronic balance (OHAUS-GT4000, USA). The sample was dried out in oven at 106°C for 24hours. The dried sample was again weighed with the help of electronic balance. The difference in the weight was recorded that was the estimation of dry matter in the sample.
Dry matter % = [Fresh sample weight – dry sample weight] × 100
The moisture percentage was calculated was using following formula.
Moisture % = [Sample amount of water (FW-DW)/Sample weight (FW)] × 100
FW = Fresh sample weight, DW = Dry sample weight
2.2. Statistical Analysis
The data were analyzed statistically using analysis of variance technique (Steel et al. 1997) and Duncan Multiple Range (DMR) test at 5 % significance probability level and it was used to compare the treatments means. Significantly varying genotypes were subjected to North Carolina Design II matting scheme (Comstock and Robinson, 1948, 1952) to estimate their gene action. Phenotypic (rp) and genotypic (rg) correlation coefficient was calculated as outlined by Kwon and Torrie (1964).
3. Results and Discussion It was suggested that significant differences were
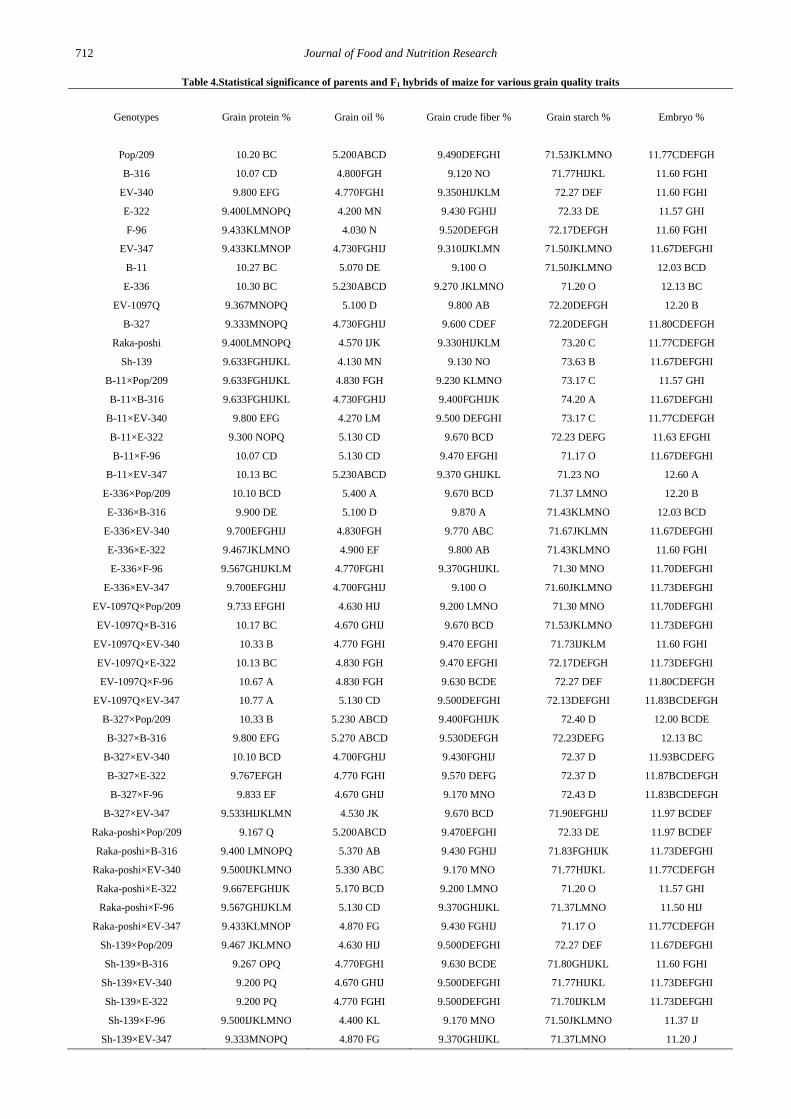
recorded for grain protein percentage. The mean performance of parents and F1 hybrids indicated that average grain protein percentage was recorded as 9.7396±0.0712% (Table 1). It was also persuaded from Table 1 that higher heritability (96.70%) and lower genetic advance (3.619%) was recorded for grain protein percentage. It was suggested from Table 4 that higher grain protein percentage was recorded for EV-1097×EV-347 (10.77%), EV-1097×F-96 (10.67%), B-327×Pop/209 (10.33%) and EV-1097×EV-340 (10.33%) while lower grain protein percentage was recorded for Sh-139×B-316 (9.267%), Sh-139×E-322 (9.200%), Sh-139×EV-340 (9.200%) and Raka-posh×Pop/209 (9.167%). The higher values of grain protein percentage for F1 hybrids EV-1097×EV-347, EV-1097×F-96, B-327×Pop/209 and EV-1097×EV-340 indicated that selection of EV-1097, B-327, EV-347, F-96 and EV-340 may be used for developing higher grain protein percentage hybrids. It was found from Table 1 that significant differences were recorded for grain oil percentage. The mean performance of parents
706 Journal of Food and Nutrition Research
and F1 hybrids indicated that average grain oil percentage was recorded as 4.85±0.0619%.
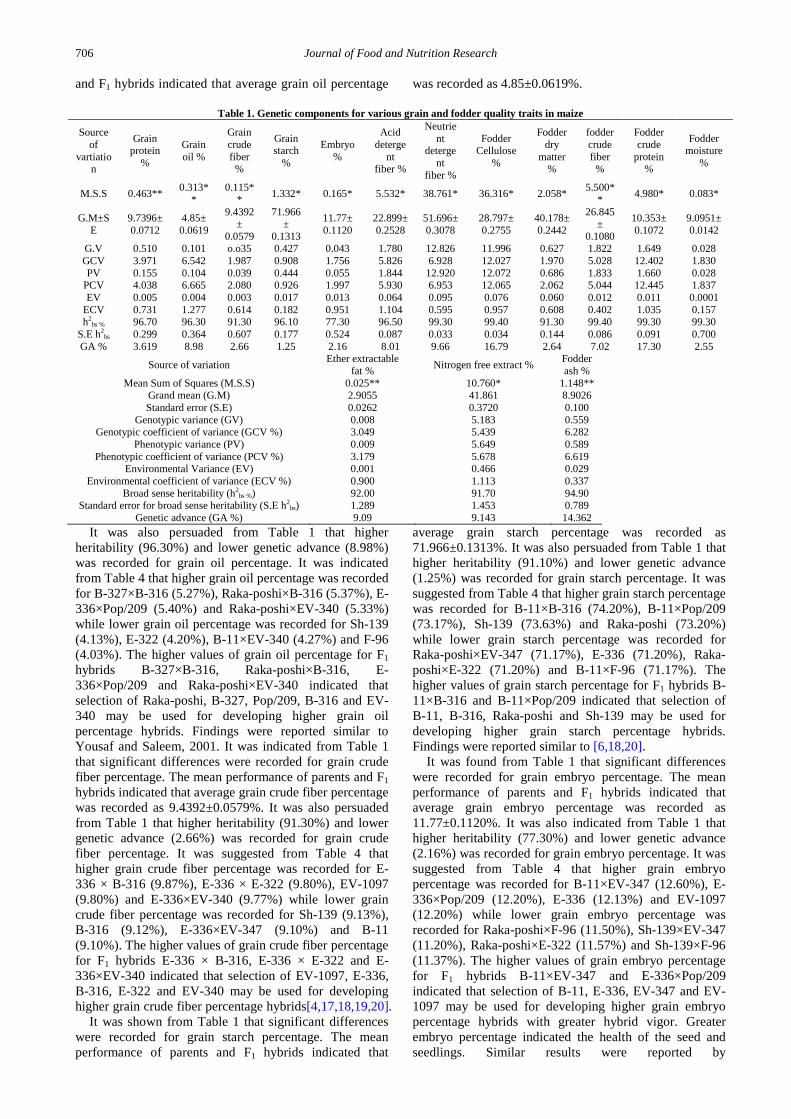
Table 1. Genetic components for various grain and fodder quality traits in maize
Source of
vartiation
Grain protein
%
Grain oil %
Grain crude fiber
%
Grain starch
%
Embryo %
Acid deterge
nt fiber %
Neutrient
detergent
fiber %
Fodder Cellulose
%
Fodder dry
matter %
fodder crude fiber
%
Fodder crude
protein %
Fodder moisture
%
M.S.S 0.463** 0.313**
0.115** 1.332* 0.165* 5.532* 38.761* 36.316* 2.058* 5.500*
* 4.980* 0.083*
G.M±SE
9.7396± 0.0712
4.85± 0.0619
9.4392±
0.0579
71.966±
0.1313
11.77± 0.1120
22.899± 0.2528
51.696± 0.3078
28.797± 0.2755
40.178± 0.2442
26.845±
0.1080
10.353± 0.1072
9.0951± 0.0142
G.V 0.510 0.101 o.o35 0.427 0.043 1.780 12.826 11.996 0.627 1.822 1.649 0.028 GCV 3.971 6.542 1.987 0.908 1.756 5.826 6.928 12.027 1.970 5.028 12.402 1.830 PV 0.155 0.104 0.039 0.444 0.055 1.844 12.920 12.072 0.686 1.833 1.660 0.028
PCV 4.038 6.665 2.080 0.926 1.997 5.930 6.953 12.065 2.062 5.044 12.445 1.837 EV 0.005 0.004 0.003 0.017 0.013 0.064 0.095 0.076 0.060 0.012 0.011 0.0001
ECV 0.731 1.277 0.614 0.182 0.951 1.104 0.595 0.957 0.608 0.402 1.035 0.157 h2
bs % 96.70 96.30 91.30 96.10 77.30 96.50 99.30 99.40 91.30 99.40 99.30 99.30 S.E h2
bs 0.299 0.364 0.607 0.177 0.524 0.087 0.033 0.034 0.144 0.086 0.091 0.700 GA % 3.619 8.98 2.66 1.25 2.16 8.01 9.66 16.79 2.64 7.02 17.30 2.55
Source of variation Ether extractable fat % Nitrogen free extract % Fodder
ash % Mean Sum of Squares (M.S.S) 0.025** 10.760* 1.148**
Grand mean (G.M) 2.9055 41.861 8.9026 Standard error (S.E) 0.0262 0.3720 0.100
Genotypic variance (GV) 0.008 5.183 0.559 Genotypic coefficient of variance (GCV %) 3.049 5.439 6.282
Phenotypic variance (PV) 0.009 5.649 0.589 Phenotypic coefficient of variance (PCV %) 3.179 5.678 6.619
Environmental Variance (EV) 0.001 0.466 0.029 Environmental coefficient of variance (ECV %) 0.900 1.113 0.337
Broad sense heritability (h2bs %) 92.00 91.70 94.90
Standard error for broad sense heritability (S.E h2bs) 1.289 1.453 0.789
Genetic advance (GA %) 9.09 9.143 14.362 It was also persuaded from Table 1 that higher
heritability (96.30%) and lower genetic advance (8.98%) was recorded for grain oil percentage. It was indicated from Table 4 that higher grain oil percentage was recorded for B-327×B-316 (5.27%), Raka-poshi×B-316 (5.37%), E-336×Pop/209 (5.40%) and Raka-poshi×EV-340 (5.33%) while lower grain oil percentage was recorded for Sh-139 (4.13%), E-322 (4.20%), B-11×EV-340 (4.27%) and F-96 (4.03%). The higher values of grain oil percentage for F1 hybrids B-327×B-316, Raka-poshi×B-316, E-336×Pop/209 and Raka-poshi×EV-340 indicated that selection of Raka-poshi, B-327, Pop/209, B-316 and EV-340 may be used for developing higher grain oil percentage hybrids. Findings were reported similar to Yousaf and Saleem, 2001. It was indicated from Table 1 that significant differences were recorded for grain crude fiber percentage. The mean performance of parents and F1 hybrids indicated that average grain crude fiber percentage was recorded as 9.4392±0.0579%. It was also persuaded from Table 1 that higher heritability (91.30%) and lower genetic advance (2.66%) was recorded for grain crude fiber percentage. It was suggested from Table 4 that higher grain crude fiber percentage was recorded for E-336 × B-316 (9.87%), E-336 × E-322 (9.80%), EV-1097 (9.80%) and E-336×EV-340 (9.77%) while lower grain crude fiber percentage was recorded for Sh-139 (9.13%), B-316 (9.12%), E-336×EV-347 (9.10%) and B-11 (9.10%). The higher values of grain crude fiber percentage for F1 hybrids E-336 × B-316, E-336 × E-322 and E-336×EV-340 indicated that selection of EV-1097, E-336, B-316, E-322 and EV-340 may be used for developing higher grain crude fiber percentage hybrids[4,17,18,19,20].
It was shown from Table 1 that significant differences were recorded for grain starch percentage. The mean performance of parents and F1 hybrids indicated that
average grain starch percentage was recorded as 71.966±0.1313%. It was also persuaded from Table 1 that higher heritability (91.10%) and lower genetic advance (1.25%) was recorded for grain starch percentage. It was suggested from Table 4 that higher grain starch percentage was recorded for B-11×B-316 (74.20%), B-11×Pop/209 (73.17%), Sh-139 (73.63%) and Raka-poshi (73.20%) while lower grain starch percentage was recorded for Raka-poshi×EV-347 (71.17%), E-336 (71.20%), Raka-poshi×E-322 (71.20%) and B-11×F-96 (71.17%). The higher values of grain starch percentage for F1 hybrids B-11×B-316 and B-11×Pop/209 indicated that selection of B-11, B-316, Raka-poshi and Sh-139 may be used for developing higher grain starch percentage hybrids. Findings were reported similar to [6,18,20].
It was found from Table 1 that significant differences were recorded for grain embryo percentage. The mean performance of parents and F1 hybrids indicated that average grain embryo percentage was recorded as 11.77±0.1120%. It was also indicated from Table 1 that higher heritability (77.30%) and lower genetic advance (2.16%) was recorded for grain embryo percentage. It was suggested from Table 4 that higher grain embryo percentage was recorded for B-11×EV-347 (12.60%), E-336×Pop/209 (12.20%), E-336 (12.13%) and EV-1097 (12.20%) while lower grain embryo percentage was recorded for Raka-poshi×F-96 (11.50%), Sh-139×EV-347 (11.20%), Raka-poshi×E-322 (11.57%) and Sh-139×F-96 (11.37%). The higher values of grain embryo percentage for F1 hybrids B-11×EV-347 and E-336×Pop/209 indicated that selection of B-11, E-336, EV-347 and EV-1097 may be used for developing higher grain embryo percentage hybrids with greater hybrid vigor. Greater embryo percentage indicated the health of the seed and seedlings. Similar results were reported by
Journal of Food and Nutrition Research 707
[4,11,17,18,19,21]. It was indicated from Table 1 that significant differences were recorded for fodder acid detergent fiber percentage.
The mean performance of parents and F1 hybrids indicated that average fodder acid detergent fiber percentage was recorded as 22.899±0.2528%. It was also persuaded from Table 1 that higher heritability (96.50%) and lower genetic advance (8.01%) was recorded for fodder acid detergent fiber percentage. It was suggested from Table 4a that higher fodder acid detergent fiber percentage was recorded for E-336×EV-347 (26.10%), B-11×EV-340 (25.03%), B-11 (25.03%) and E-336 (24.87%) while lower fodder acid detergent fiber percentage was recorded for Raka-poshi×F-96 (19.97%), E-336 (20.80%), Raka-poshi×Pop/209 (20.37%) and B-327×F-96 (20.63%). The higher values of fodder acid detergent fiber percentage for F1 hybrids E-336×EV-347 and B-11×EV-340 indicated that selection of E-336, B-11, EV-347 and EV-340 may be used for developing good quality fodder acid detergent fiber percentage hybrids. Higher fodder acid detergent fiber indicated better quality of maize fodder [1,4,11,18,21,22].
It was suggested from Table 1 that significant differences were recorded for fodder nutrient detergent fiber percentage. The mean performance of parents and F1 hybrids indicated that average fodder nutrient detergent fiber percentage was recorded as 51.696±0.3078%. It was also persuaded from Table 1 that higher heritability (99.30%) and lower genetic advance (9.66%) was recorded for fodder nutrient detergent fiber percentage. It was indicated from Table 4a that higher fodder nutrient detergent fiber percentage was recorded for EV-1097×EV-340 (56.83%), EV-1097×E-322 (58.87%), EV-1097×F-96 (57.97%), Sh-139×EV-340 (55.76%) and B-327×EV-340 (55.67%) while lower fodder nutrient detergent fiber percentage was recorded for B-327×E-322 (40.10%), B-327×F-96 (43.60%), Raka-poshi×Pop/209 (45.03%) and B-327×EV-347 (45.40%). The lower values of fodder nutrient detergent fiber percentage for F1 hybrids B-327×E-322, B-327×F-96, Raka-poshi×Pop/209 and B-327×EV-347 indicated that selection of B-327, E-322, EV-347, Raka-poshi and F-96 may be used for developing good quality fodder nutrient detergent fiber percentage hybrids. Lower fodder nutrient detergent fiber percentage indicated better quality of maize fodder [23-27].
It was shown from Table 1 that significant differences were recorded for fodder cellulose percentage. The mean performance of parents and F1 hybrids indicated that average fodder cellulose percentage was recorded as 28.797±0.2755%. It was also persuaded from Table 1 that higher heritability (99.40%) and moderate genetic advance (16.79%) was recorded for fodder cellulose percentage. It was suggested from Table 4a that higher fodder cellulose percentage was recorded for EV-1097×EV-340 (33.97%), EV-1097×E-322 (36.43%), EV-1097×F-96 (34.33%) and B-327×EV-340 (33.53%) while lower fodder cellulose percentage was recorded for B-327×E-322 (17.20%), B-327×F-96 (22.97%), EV-1097 (24.47%) and B-327×EV-347 (24.40%). The lower values of fodder cellulose percentage for F1 hybrids B-327×E-322, B-327×F-96 and B-327×EV-347 indicated that selection of B-327, E-322, EV-347, EV-1097 and F-96 may be used for developing good quality fodder cellulose percentage hybrids. Lower
fodder cellulose percentage indicated better quality of maize fodder [26,28,29].
It was indicated from Table 1 that significant differences were recorded for fodder dry matter percentage. The mean performance of parents and F1 hybrids indicated that average fodder dry matter percentage was recorded as 40.178±0.2442%. It was also persuaded from Table 1 that higher heritability (91.30%) and lower genetic advance (2.64%) was recorded for fodder dry matter percentage. It was suggested from Table 4a that higher fodder dry matter percentage was recorded for EV-1097×Pop/209 (41.67%), EV-1097×EV-347 (41.33%), EV-1097×E-322 (41.40%), E-336×F-96 (41.57%) and Sh-139×Pop/209 (41.40%) while lower fodder dry matter percentage was recorded for Raka-poshi×B-316 (39.10%), EV-340 (38.93%), EV-347 (38.13%) and E-322 (38.03%). The higher values of fodder dry matter percentage for F1 hybrids EV-1097×Pop/209, EV-1097×EV-347, EV-1097×E-322, E-336×F-96 and Sh-139×Pop/209 indicated that selection of E-336, E-322, Sh-139, EV-1097 and F-96 may be used for developing good quality fodder dry matter percentage hybrids.
Higher fodder dry matter percentage indicated better quality of maize fodder. Findings were reported similar to [30,31,32] . It was found from Table 1 that significant differences were recorded for fodder crude fiber percentage. The mean performance of parents and F1 hybrids indicated that average fodder crude fiber percentage was recorded as 26.845±0.1080%. It was also persuaded from Table 1 that higher heritability (99.40%) and lower genetic advance (7.02%) was recorded for fodder crude fiber percentage. It was suggested from Table 4a that higher fodder crude fiber percentage was recorded for EV-1097 (28.50%), B-327 (29.31%), Raka-poshi (28.99%), EV-1097×F-96 (28.40%) and Sh-139×EV-347 (28.50%) while lower fodder crude fiber percentage was recorded for E-336 × EV-340 (24.30%), B-11 (24.31%) and E-336 (24.10%). The higher values of fodder crude fiber percentage for F1 hybrids EV-1097 × F-96 and Sh-139 × EV-347 indicated that selection of B-327, EV-347, Raka-poshi, Sh-139, EV-1097 and F-96 may be used for developing good quality fodder crude fiber percentage hybrids. Higher fodder crude fiber percentage indicated better quality of maize fodder [29,33,34].
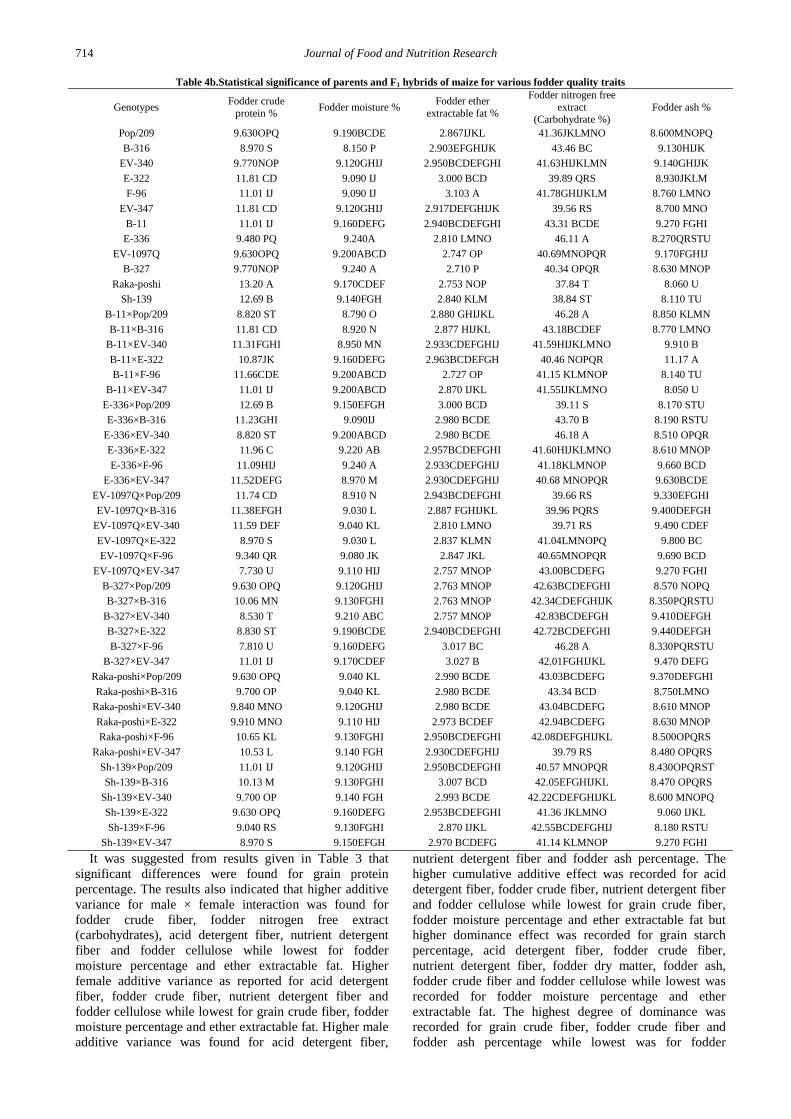
It was suggested from Table 1 that significant differences were recorded for fodder crude protein percentage. The mean performance of parents and F1 hybrids indicated that average fodder crude protein percentage was recorded as 10.353±0.1072%. It was also persuaded from Table 1b that higher heritability (99.30%) and moderate genetic advance (17.30%) was recorded for fodder crude protein percentage. It was suggested from Table 4b that higher fodder crude protein percentage was recorded for Sh-139 (12.69%), Raka-poshi (13.20%), E-336×Pop/209 (12.69%), B-11×B-316 (11.81%) and E-336×E-322 (11.96%) while lower fodder crude protein percentage was recorded for B-11×Pop/209 (8.82%), B-327×EV-340 (8.53%), B-327×F-96 (7.81%) and EV-1097×EV-347 (7.73%). The higher values of fodder crude protein percentage for F1 hybrids E-336×Pop/209, B-11×B-316, and E-336×E-322 indicated that selection of E-336, Raka-poshi, Sh-139, EV-1097 and Pop/209 may be used for developing good quality fodder crude protein

708 Journal of Food and Nutrition Research
percentage hybrids. Higher fodder crude protein percentage indicated better quality of maize fodder [20]. It was found from Table 1 that significant differences were recorded for fodder moisture percentage.
The mean performance of parents and F1 hybrids indicated that average fodder moisture percentage was recorded as 9.0951±0.0142%. It was also persuaded from Table 1 that higher heritability (99.30%) and lower genetic advance (2.55%) was recorded for fodder moisture percentage. It was suggested from Table 4b that higher fodder moisture percentage was recorded for B-327 (9.24%), E-336 (9.24%), E-336 × E-322 (9.22%), E-336×F-96 (9.24%) and B-327×EV-340 (9.21%) while lower fodder moisture percentage was recorded for B-11×Pop/209 (8.79%), B-11×B-316 (8.92%), B-316 (8.15%) and EV-1097×Pop/209 (8.91%). The higher values of fodder moisture percentage for F1 hybrids E-336×E-322, E-336×F-96 and B-327×EV-340 indicated that selection of E-336 and B-327 may be used for developing good quality fodder moisture percentage hybrids. Higher fodder moisture percentage indicated better quality of maize fodder (Khalil et al., 2000; Awan et al. 2001; Yousaf and Saleem. 2001; Mazur et al. 2001; Dubey et al., 2001; Rai et al. 2004 and Xiang et al. 2010).
It was revealed from Table 1 that significant differences were recorded for fodder ether extractable fat percentage. The mean performance of parents and F1 hybrids indicated that average fodder ether extractable fat percentage was recorded as 2.9055±0.0262%. It was also persuaded from Table 1 that higher heritability (92.00%) and lower genetic advance (9.09%) was recorded for fodder ether extractable fat percentage. It was suggested from Table 4b that higher fodder ether extractable fat percentage was recorded for F-96 (3.103%), B-327×EV-347 (3.027%), B-327×F-96 (3.017%) and Sh-139×B-316 (3.007%) while lower fodder ether extractable fat percentage was recorded for B-11×F-96 (2.727%), Raka-poshi (2.753%), B-327 (2.710%) and EV-1097 (2.747%). The higher values of fodder ether extractable fat percentage for F1 hybrids B-327×EV-347, B-327×F-96 and Sh-139×B-316 indicated that selection of E-336, F-96, B-316 and B-327 may be used for developing good quality fodder ether extractable fat percentage hybrids. Higher fodder ether extractable fat percentage indicated better quality of maize fodder. Findings were found similar to [11,25].
It was shown from Table 1 that significant differences were recorded for fodder nitrogen free extract percentage. The mean performance of parents and F1 hybrids indicated that average fodder nitrogen free extract percentage was recorded as 41.861±0.3720%. It was also persuaded from Table 1 that higher heritability (91.75%) and lower genetic advance (9.143%) was recorded for fodder nitrogen free extract percentage. It was suggested from Table 4b that higher fodder ether extractable fat percentage was recorded for E-336 (46.11%), B-11×Pop/209 (46.28%), B-327×F-96 (46.28%) and E-336×E-322 (46.18%) while lower fodder nitrogen free extract percentage was recorded for B-327 × Pop/209 (39.11%), Raka-poshi (37.84%), EV-347 (39.56%) and Sh-139 (38.84%). The higher values of fodder nitrogen free extract percentage for F1 hybrids B-11×Pop/209, B-327×F-96 and E-336×E-322 indicated that selection of E-336, F-96, B-11 and B-327 may be used for developing good quality fodder nitrogen free extract percentage
hybrids. Higher fodder nitrogen free extract percentage indicated better quality of maize fodder [20,24,25].
It was indicated from Table 1 that significant differences were recorded for fodder ash percentage. The mean performance of parents and F1 hybrids indicated that average fodder ash percentage was recorded as 8.9026±0.100%. It was also persuaded from Table 1 that higher heritability (94.91%) and moderate genetic advance (14.362%) was recorded for fodder ash percentage. It was suggested from Table 4b that higher fodder ash percentage was recorded for EV-1097×F-96 (9.69%), EV-1097×E-322 (9.80%), B-11×EV-340 (9.91%) and B-11×E-322 (11.17%) while lower fodder ash percentage was recorded for B-11 × F-96 (8.14%), Raka-poshi (8.06%), B-11×EV-347 (8.05%) and Sh-139 (8.11%). The higher values of fodder ash percentage for F1 hybrids EV-1097×F-96, EV-1097×E-322, B-11×EV-340 and B-11×E-322 indicated that selection of EV-1097, F-96, B-11 and EV-340 may be used for developing good quality fodder ash percentage hybrids. Higher fodder ash percentage indicated better quality of maize fodder [20,35].
3.1. Correlation Analysis It was found that a positive significant genotypic and
phenotypic correlation was found between grain protein percentage and grain oil percentage, embryo percentage, nutrient detergent fiber, cellulose percentage and dry matter percentage while a significant and negative correlation was found for fodder crude protein and ether extractable fat percentage at both genotypic and phenotypic levels (Table 2 and 2a). Significant correlations indicated that selection of good grain and fodder quality may be helpful for improving maize germplasm (Xiang et al. 2010; Ali et al. 2011b and Ali et al. 2012a). It was suggested that a positive significant genotypic and phenotypic correlation was found between grain oil percentage and grain protein percentage, embryo percentage and nitrogen free extract percentage while a significant and negative correlation was found for grain starch percentage, fodder crude protein and ether extractable fat percentage at both genotypic and phenotypic levels. Significant correlations indicated that selection of good grain and fodder quality may be helpful for improving maize breeding material (Table 2 and 2a). Findings were found similar to Ali et al [7].
It was revealed from Table 2 and 2a that a positive significant genotypic and phenotypic correlation was found between grain crude fiber percentage and embryo percentage and fodder moisture percentage. It was suggested that a negative significant genotypic and phenotypic correlation was found between grain starch percentage and grain oil percentage, nutrient detergent fiber, cellulose percentage, fodder moisture percentage and nitrogen free extract percentage (Table 2 and 2a). The quality of fodder may be enhanced by selecting genotypes on the basis of nutrient detergent fiber percentage [15,36]. It was persuaded from Table 2 and 2a that a positive significant genotypic and phenotypic correlation was found between embryo percentage and grain oil and protein percentage, grain crude fiber percentage, acid detergent fiber and fodder moisture percentage while a significant and negative correlation was found for nutrient detergent fiber, cellulose percentage, fodder ash

Journal of Food and Nutrition Research 709
percentage and ether extractable fat percentage at both genotypic and phenotypic levels.
Table 2. Genotypic correlations of various grain and fodder quality traits in maize
Traits Grain oil %
Grain crude fiber
%
Grain starch
%
Embryo %
Acid deterg
ent fiber
%
Neutrient
detergent
fiber %
Fodder cellulos
e %
Fodder dry
matter %
Fodder
crude fiber
%
Fodder
crude protein%
Fodder moistur
e %
Ether free
extractable
fat %
Nitrogen free extract
%
Fodder
ash %
Grain protein
%
0.2720*
-0.0697ns
-0.0935 ns
0.3933*
0.0290 ns
0.2508* 0.2496* 0.227
5* 0.0209 ns
-0.175
8*
-0.1148 ns
-0.4623
*
0.1425 ns
0.0603 ns
Grain oil % 0.129
7ns
-0.420
1*
0.4926*
-0.1297 ns
-0.0526 ns
-0.0039 ns
0.1213 ns
-0.1118 ns
-0.228
9*
0.1293 ns
-0.2092
*
0.2744*
-0.1114 ns
Grain crude
fiber %
-0.0361ns
0.2656*
0.0444 ns
-0.0094 ns
-0.0269 ns
0.1711 ns
0.0265 ns
0.0546 ns 0.3566* 0.0119
ns
-0.1296
ns
0.1279 ns
Grain starch
% -0.0585 0.043
2 ns
-0.229
8*
-0.2574*
-0.1118 ns
-0.0226 ns
0.0546 ns
-0.1845*
-0.2160
*
0.0094 ns
0.1049 ns
Embryo % 0.203
1*
-0.247
9*
-0.3396*
-0.0089 ns
-0.0974 ns
0.0430 ns 0.2589*
-0.2803
*
0.1019 ns
-0.181
4* Acid
detergent
fiber %
0.2812*
-0.1050 ns
-0.0442 ns
-0.0037 ns
0.2892* 0.2204* -0.0784
ns
-0.1912
*
0.0280 ns
Neutrient
detergent
fiber %
0.9316* 0.2118*
0.2973*
-0.0203 ns
-0.1344 ns
-0.1152 ns
-0.2055
*
0.0242 ns
Fodder cellulos
e % 0.237
3* 0.310
0*
-0.1324 ns
-0.2229*
-0.0860 ns
-0.1379
ns
0.0155 ns
fodder dry
matter %
0.1075 ns
0.0594 ns
-0.1092 ns
-0.2512
*
-0.1293
ns
0.2077*
fodder crude
fiber % 0.006
9 ns 0.0743
ns
-0.4358
*
-0.6903
*
-0.1061 ns
Fodder crude
protein%
0.0809 ns
0.0898 ns
-0.6668
*
-0.1366 ns
Fodder moistur
e % -0.0809
ns
-0.1449
ns
-0.182
9* Ether free
extractable
fat %
0.1664 ns
0.1029 ns
Nitrogen free extract
%
-
0.1232 ns
** = Significant at 5% significance level, * = Significant at 1% significance level, ns = Non-significant It was found that a positive significant genotypic and
phenotypic correlation was found between acid detergent fiber and embryo percentage, nutrient detergent fiber, fodder crude protein percentage and fodder moisture percentage while a significant and negative correlation was found for nitrogen free extract percentage at both genotypic and phenotypic levels (Table 2 and 2a). It was revealed that a positive significant genotypic and phenotypic correlation was found between nutrient detergent fiber and grain protein percentage, acid detergent fiber, fodder crude fiber percentage, cellulose percentage and fodder dry matter percentage while a significant and negative correlation was found for embryo percentage, grain starch percentage and nitrogen free extract percentage at both genotypic and phenotypic levels
(Table 2 and 2a). Positive and significant correlations suggested that grain and fodder quality may be improved by selecting genotypes on the basis of grain protein and starch maize germplasm [37,38]. It was suggested that a positive significant genotypic and phenotypic correlation was found between cellulose percentage and nutrient detergent fiber, grain protein percentage, fodder crude fiber percentage and fodder dry matter percentage while a significant and negative correlation was found for embryo percentage, grain starch percentage and fodder moisture percentage at both genotypic and phenotypic levels (Table 2 and 2a). It was revealed that a positive significant genotypic and phenotypic correlation was found between fodder dry matter percentage and cellulose percentage, nutrient detergent fiber, grain protein percentage and

710 Journal of Food and Nutrition Research
fodder ash percentage while a significant and negative correlation was found for nitrogen free extract percentage at both genotypic and phenotypic levels (Table 2 and 2a). Good grain and fodder quality may be improved for maize germplasm [7,15,31,38]. It was suggested from Table 2 and 2a that a positive significant genotypic and phenotypic
correlation was found between fodder crude fiber percentage and cellulose percentage and nutrient detergent fiber while a significant and negative correlation was found for ether extractable fat percentage and nitrogen free extract percentage at both genotypic and phenotypic levels.
Table 2a. Phenotypic correlations among various grain and fodder quality traits in maize
Traits Grain oil %
Grain
crude
fiber %
Grain starch
%
Embryo %
Acid deterg
ent fiber
%
Neutrient
detergent
fiber %
Fodder cellulos
e %
Fodder dry
matter %
Fodder
crude fiber
%
Fodder
crude protein%
Fodder moistur
e %
Ether free
extractable fat %
Nitrogen
free extract
%
Fodder
ash %
Grain protein
%
0.2690**
-0.0603 ns
-0.0918 ns
0.3456**
0.0270 ns
0.2464**
0.2448**
0.2170**
0.0183 ns
-0.174
7*
-0.1137 ns
0.4333**
0.1425 ns
0.0544 ns
Grain oil %
0.1220 ns
-0.4013**
0.4389**
-0.1290 ns
-0.0520 ns
-0.0030 ns
0.1128 ns
-0.1102 ns
-0.2276**
0.1266 ns
-0.1883
*
0.2648**
-0.1036 ns
Grain crude
fiber %
-0.0530 ns
0.2056*
0.0371 ns
-0.0131 ns
-0.0280 ns
0.1548 ns
0.0248 ns
0.0516 ns
0.3327**
0.0226 ns
-0.1190 ns
0.1178 ns
Grain starch
% -0.0584
ns 0.0427 ns
-0.2225**
-0.2469*
*
-0.1035 ns
-0.0218 ns
0.0533 ns
-0.1766*
-0.1985
*
0.0085 ns
0.1012 ns
Embryo % 0.172
2*
-0.2259**
-0.3008*
*
-0.0219 ns
-0.0888 ns
0.0400 ns
0.2235**
-0.2487
**
0.0849 ns
-0.164
2* Acid
detergent
fiber %
-
0.2765**
-0.1050 ns
-0.0421 ns
-0.0032 ns
0.2822**
0.2148**
-0.0701 ns
-0.1792 ns
0.0255 ns
Neutrient
detergent
fiber %
0.9267**
0.2058*
0.2961**
-0.0209 ns
-0.1315 ns
-0.1096 ns
-0.197
1*
0.0241 ns
Fodder cellulos
e % 0.230
1** 0.3077**
-0.1324 ns
-0.2200*
*
-0.0864 ns
0.1338 ns
0.0152 ns
Fodder dry
matter %
0.1023 ns
-0.0579 ns
-0.1092 ns
-0.2257
**
-0.1182 ns
0.1948*
Fodder crude
fiber % 0.007
2 ns 0.0743
ns
-0.4149
**
-0.6648**
-0.1044 ns
Fodder crude
protein%
0.0793 ns
0.0840 ns
-0.6559**
-0.1332 ns
Fodder moistur
e % -0.0783
-0.1409 ns
-0.1798 ns
Ether free
extractable
fat %
0.1599 ns
0.0932 ns
Nitrogen free extract
%
-
0.1284 ns
** = Significant at 5% significance level, * = Significant at 1% significance level, ns = Non-significant It was shown from results that a positive significant
genotypic and phenotypic correlation was found between fodder crude protein percentage and acid detergent fiber while a significant and negative correlation was found for grain protein and oil percentage and nitrogen free extract percentage at both genotypic and phenotypic levels (Table 2 and 2a). It was indicated from results that a positive significant genotypic and phenotypic correlation was found between fodder moisture percentage and grain crude fiber percentage, embryo percentage and acid
detergent fiber while a significant and negative correlation was found for grain starch percentage, cellulose percentage and fodder ash percentage at both genotypic and phenotypic levels (Table 2 and 2a). Significant correlations higher grain and fodder quality maize germplasm may be developed [18,24,28,38,39].
It was persuaded from Table 2 and 2a that a negative significant genotypic and phenotypic correlation was found between fodder ether extractable fat percentage and fodder moisture percentage and grain protein, oil, starch,

Journal of Food and Nutrition Research 711
embryo percentage, fodder dry matter percentage and fodder crude fithat a positive significant genotypic and phenotypic correber percentage. It was suggested from Table 2 and 2a lation was found between fodder nitrogen free extract percentage and grain oil percentage while a significant and negative correlation was found for acid detergent fiber, nutrient detergent fiber, fodder crude fiber percentage and fodder crude protein percentage at both
genotypic and phenotypic levels. It was suggested from Table 2 and 2a that a positive significant genotypic and phenotypic correlation was found between fodder ash percentage and fodder dry matter percentage while a significant and negative correlation was found for embryo percentage and fodder moisture percentage [3,7,15,21,36].
3.2. North Carolina Mating Design-II Table 3(a). Analysis of variance for grain and fodder quality traits in maize (North Carolina matting design-II)
SOV/Traits Grain protein %
Grain oil %
Grain crude fiber %
Grain starch % Embryo % Acid detergent
fiber % Neutrient
detergent fiber % Fodder
cellulose %
Replication 0.0056ns 0.0403ns 0.0192ns 0.0604ns 0.0278ns 0.2973ns 0.111ns 0.022ns
Males 0.1714** 0.1474** 0.1340* 1.1781* 0.1363** 4.1819* 35.281* 18.827*
Females 2.1185* 0.4896* 0.1185* 3.0277* 0.3305* 18.3353* 162.591* 158.548*
M × F 0.2161* 0.2011* 0.0993* 0.9400** 0.1536** 3.2882* 25.672* 22.520**
Error 0.01317 0.0101 0.0095 0.0482 0.0433 0.2369 0.239 0.255
(b). various genetic components for grain and fodder quality traits in maize (North Carolina matting design-II)
SOV/Traits Grain protein %
Grain oil %
Grain crude fiber %
Grain starch % Embryo % Acid detergent
fiber % Neutrient detergent
fiber % Fodder
cellulose %
σ2m -0.002 -0.003 0.002 0.013 -0.001 0.049 0.534 -0.205
σ2f 0.106 0.016 0.001 0.116 0.009 0.836 7.607 7.557
σ2m×f 0.068 0.064 0.029 0.297 0.037 1.017 8.478 7.422
σ2D 0.138 0.017 0.004 0.172 0.012 1.181 10.854 9.803
σ2H 0.271 0.255 0.119 1.189 0.147 4.068 33.911 29.688
[σ2H/σ2
D]1/2 1.403 3.827 5.479 2.627 3.350 1.856 1.768 1.740
* = Significant at 1 % significance level, ** = Significant at 5 % significance level, ns = Non-significant σ2m = male additive variance, σ2
f = Female additive variance, σ2
m×f = m×f interaction additive variance, σ2H = Dominance variance, σ2
D = cumulative additive variance, [σ2H/σ2
D]1/2 = Degree of dominance
Table 3a. (a). Analysis of variance for fodder quality traits of maize (North Carolina matting design-II)
SOV/Traits Fodder dry matter %
Fodder crude fiber %
Fodder crude protein %
Fodder moisture %
Fodder ether extractable fat %
Fodder nitrogen free extract (Carbohydrate %)
Fodder ash (%)
Replication 0.4504ns 0.0306ns 0.0263ns 0.0002ns 0.0016ns 0.5738ns 0.0370ns
Males 0.8319* 1.8399* 2.0761** 0.0501** 0.0041** 4.1020* 1.5453*
Females 4.6045* 16.4070* 9.2478* 0.0572** 0.0521* 12.4019* 1.7604*
M × F 1.0589** 2.4384* 4.2583* 0.0195** 0.0181* 9.4472* 1.2101*
Error 0.0797 0.0403 0.0304 0.0002 0.0020 0.5298 0.0381
(b). various genetic components for fodder quality traits of maize (North Carolina matting design-II)
SOV/Traits Fodder dry matter %
Fodder crude
fiber %
Fodder crude protein %
Fodder moisture %
Fodder ether extractable fat %
Fodder nitrogen free extract (Carbohydrate %)
Fodder ash (%)
σ2m -0.013 -0.033 -0.121 0.002 -0.001 -0.297 0.019
σ2f 0.197 0.776 0.277 0.002 0.002 0.164 0.031
σ2m×f 0.326 0.799 1.409 0.006 0.005 2.973 0.391
σ2D 0.246 0.990 0.208 0.005 0.001 -0.177 0.066
σ2H 1.306 3.197 5.637 0.026 0.021 11.889 1.563
[σ2H/σ2
D]1/2 2.305 1.797 5.206 2.251 3.786 -8.194 4.881
* = Significant at 1 % significance level, ** = Significant at 5 % significance level ns = Non-significant, σ2m = male additive variance, σ2
f = Female additive variance, σ2
m×f = m×f interaction additive variance, σ2H = Dominance variance, σ2
D = cumulative additive variance, [σ2H/σ2
D]1/2 = Degree of dominance
712 Journal of Food and Nutrition Research
Table 4.Statistical significance of parents and F1 hybrids of maize for various grain quality traits
Genotypes Grain protein % Grain oil % Grain crude fiber % Grain starch % Embryo %
Pop/209 10.20 BC 5.200ABCD 9.490DEFGHI 71.53JKLMNO 11.77CDEFGH
B-316 10.07 CD 4.800FGH 9.120 NO 71.77HIJKL 11.60 FGHI
EV-340 9.800 EFG 4.770FGHI 9.350HIJKLM 72.27 DEF 11.60 FGHI
E-322 9.400LMNOPQ 4.200 MN 9.430 FGHIJ 72.33 DE 11.57 GHI
F-96 9.433KLMNOP 4.030 N 9.520DEFGH 72.17DEFGH 11.60 FGHI
EV-347 9.433KLMNOP 4.730FGHIJ 9.310IJKLMN 71.50JKLMNO 11.67DEFGHI
B-11 10.27 BC 5.070 DE 9.100 O 71.50JKLMNO 12.03 BCD
E-336 10.30 BC 5.230ABCD 9.270 JKLMNO 71.20 O 12.13 BC
EV-1097Q 9.367MNOPQ 5.100 D 9.800 AB 72.20DEFGH 12.20 B
B-327 9.333MNOPQ 4.730FGHIJ 9.600 CDEF 72.20DEFGH 11.80CDEFGH
Raka-poshi 9.400LMNOPQ 4.570 IJK 9.330HIJKLM 73.20 C 11.77CDEFGH
Sh-139 9.633FGHIJKL 4.130 MN 9.130 NO 73.63 B 11.67DEFGHI
B-11×Pop/209 9.633FGHIJKL 4.830 FGH 9.230 KLMNO 73.17 C 11.57 GHI
B-11×B-316 9.633FGHIJKL 4.730FGHIJ 9.400FGHIJK 74.20 A 11.67DEFGHI
B-11×EV-340 9.800 EFG 4.270 LM 9.500 DEFGHI 73.17 C 11.77CDEFGH
B-11×E-322 9.300 NOPQ 5.130 CD 9.670 BCD 72.23 DEFG 11.63 EFGHI
B-11×F-96 10.07 CD 5.130 CD 9.470 EFGHI 71.17 O 11.67DEFGHI
B-11×EV-347 10.13 BC 5.230ABCD 9.370 GHIJKL 71.23 NO 12.60 A
E-336×Pop/209 10.10 BCD 5.400 A 9.670 BCD 71.37 LMNO 12.20 B
E-336×B-316 9.900 DE 5.100 D 9.870 A 71.43KLMNO 12.03 BCD
E-336×EV-340 9.700EFGHIJ 4.830FGH 9.770 ABC 71.67JKLMN 11.67DEFGHI
E-336×E-322 9.467JKLMNO 4.900 EF 9.800 AB 71.43KLMNO 11.60 FGHI
E-336×F-96 9.567GHIJKLM 4.770FGHI 9.370GHIJKL 71.30 MNO 11.70DEFGHI
E-336×EV-347 9.700EFGHIJ 4.700FGHIJ 9.100 O 71.60JKLMNO 11.73DEFGHI
EV-1097Q×Pop/209 9.733 EFGHI 4.630 HIJ 9.200 LMNO 71.30 MNO 11.70DEFGHI
EV-1097Q×B-316 10.17 BC 4.670 GHIJ 9.670 BCD 71.53JKLMNO 11.73DEFGHI
EV-1097Q×EV-340 10.33 B 4.770 FGHI 9.470 EFGHI 71.73IJKLM 11.60 FGHI
EV-1097Q×E-322 10.13 BC 4.830 FGH 9.470 EFGHI 72.17DEFGH 11.73DEFGHI
EV-1097Q×F-96 10.67 A 4.830 FGH 9.630 BCDE 72.27 DEF 11.80CDEFGH
EV-1097Q×EV-347 10.77 A 5.130 CD 9.500DEFGHI 72.13DEFGHI 11.83BCDEFGH
B-327×Pop/209 10.33 B 5.230 ABCD 9.400FGHIJK 72.40 D 12.00 BCDE
B-327×B-316 9.800 EFG 5.270 ABCD 9.530DEFGH 72.23DEFG 12.13 BC
B-327×EV-340 10.10 BCD 4.700FGHIJ 9.430FGHIJ 72.37 D 11.93BCDEFG
B-327×E-322 9.767EFGH 4.770 FGHI 9.570 DEFG 72.37 D 11.87BCDEFGH
B-327×F-96 9.833 EF 4.670 GHIJ 9.170 MNO 72.43 D 11.83BCDEFGH
B-327×EV-347 9.533HIJKLMN 4.530 JK 9.670 BCD 71.90EFGHIJ 11.97 BCDEF
Raka-poshi×Pop/209 9.167 Q 5.200ABCD 9.470EFGHI 72.33 DE 11.97 BCDEF
Raka-poshi×B-316 9.400 LMNOPQ 5.370 AB 9.430 FGHIJ 71.83FGHIJK 11.73DEFGHI
Raka-poshi×EV-340 9.500IJKLMNO 5.330 ABC 9.170 MNO 71.77HIJKL 11.77CDEFGH
Raka-poshi×E-322 9.667EFGHIJK 5.170 BCD 9.200 LMNO 71.20 O 11.57 GHI
Raka-poshi×F-96 9.567GHIJKLM 5.130 CD 9.370GHIJKL 71.37LMNO 11.50 HIJ
Raka-poshi×EV-347 9.433KLMNOP 4.870 FG 9.430 FGHIJ 71.17 O 11.77CDEFGH
Sh-139×Pop/209 9.467 JKLMNO 4.630 HIJ 9.500DEFGHI 72.27 DEF 11.67DEFGHI
Sh-139×B-316 9.267 OPQ 4.770FGHI 9.630 BCDE 71.80GHIJKL 11.60 FGHI
Sh-139×EV-340 9.200 PQ 4.670 GHIJ 9.500DEFGHI 71.77HIJKL 11.73DEFGHI
Sh-139×E-322 9.200 PQ 4.770 FGHI 9.500DEFGHI 71.70IJKLM 11.73DEFGHI
Sh-139×F-96 9.500IJKLMNO 4.400 KL 9.170 MNO 71.50JKLMNO 11.37 IJ
Sh-139×EV-347 9.333MNOPQ 4.870 FG 9.370GHIJKL 71.37LMNO 11.20 J

Journal of Food and Nutrition Research 713
Table 4a. Statistical significance of parents and F1 hybrids of maize for various fodder quality traits
Genotypes Acid detergent fiber %
Neutrient detergent fiber % Fodder cellulose % Fodder dry matter % Fodder crude
fiber %
Pop/209 21.50RST 51.57MNOP 30.07 FG 39.33OPQ 28.35 CD
B-316 20.80TUV 53.43GHIJ 32.63 C 40.27GHIJKLM 27.37 F
EV-340 24.00DEFGH 53.77 GHI 29.77 GH 38.93 Q 27.39 F
E-322 24.27BCDE 55.43 D 31.13 DE 38.03 R 27.27 F
F-96 22.60KLMNOPQ 53.27 HIJ 30.67 EF 39.47MNOPQ 26.26 JK
EV-347 23.23GHIJKLM 51.47MNOP 28.23 I 38.13 R 27.89 E
B-11 25.03 B 49.83 RST 24.80 LM 39.40NOPQ 24.31 QR
E-336 24.87 BC 55.50 D 30.63 EF 40.00IJKLMNO 24.10 R
EV-1097Q 24.37 BCDE 48.83 UV 24.47 M 40.87ABCDEFGH 28.58 C
B-327 23.37FGHIJKL 50.77 OPQ 27.40 IJK 40.27GHIJKLM 29.31 A
Raka-poshi 23.20HIJKLMN 49.90 QRS 26.70 K 40.00IJKLMNO 28.99 B
Sh-139 23.40FGHIJKL 48.63 UV 25.23 LM 39.90JKLMNOP 28.38 CD
B-11×Pop/209 22.20 PQR 48.90TUV 26.70 K 40.63DEFGHIJ 24.37 QR
B-11×B-316 23.40FGHIJKL 50.57 PQR 27.17 JK 39.93JKLMNO 24.45 Q
B-11×EV-340 25.03 B 51.83 LMN 26.80 K 40.10HIJKLMNO 25.31 O
B-11×E-322 22.70KLMNOPQ 49.43 STU 26.73 K 39.93 JKLMNO 25.39 NO
B-11×F-96 22.37 NOPQ 49.57 STU 27.20 JK 39.53 LMNOPQ 27.12 FG
B-11×EV-347 24.07 CDEFG 51.37MNOP 27.30 JK 39.33 OPQ 27.31 F
E-336×Pop/209 24.20 CDEF 51.60 MNO 27.40 IJK 40.33 GHIJKL 27.88 E
E-336×B-316 24.60 BCD 54.03 GH 29.43 GH 40.53 EFGHIJK 24.82 P
E-336×EV-340 22.07 PQRS 48.73 UV 26.67 K 40.00 IJKLMNO 24.30 QR
E-336×E-322 22.30 OPQR 49.83 RST 27.53 IJK 41.00 ABCDEFG 25.66 MN
E-336×F-96 24.33 BCDE 49.80 RST 25.47 L 41.57 AB 25.89 LM
E-336×EV-347 26.10 A 51.00 NOP 24.90 LM 41.20 ABCDEF 26.28 J
EV-1097Q×Pop/209 20.83 TUV 52.27KLM 31.43 DE 41.67 A 27.42 F
EV-1097Q×B-316 22.10 PQRS 53.53GHIJ 31.43 DE 40.87ABCDEFGH 27.36 F
EV-1097Q×EV-340 22.87JKLMNOPQ 56.83 C 33.97 B 40.63DEFGHIJ 27.36 F
EV-1097Q×E-322 22.47 MNOPQ 58.87 A 36.43 A 41.40ABCD 28.33 CD
EV-1097Q×F-96 23.63 EFGHIJ 57.97 B 34.33 B 41.33 ABCDE 28.40 CD
EV-1097Q×EV-347 22.37 NOPQ 55.00 DEF 32.63 C 41.33 ABCDE 28.12 DE
B-327×Pop/209 21.50 RST 48.30 V 26.80 K 40.70CDEFGHIJ 27.30 F
B-327×B-316 23.13IJKLMNO 51.03 NOP 27.90 IJ 40.30GHIJKLM 27.35 F
B-327×EV-340 22.13 PQRS 55.67 D 33.53 B 40.00 IJKLMNO 27.27 F
B-327×E-322 22.90 JKLMNOP 40.10 Y 17.20 O 39.97 JKLMNO 26.89 GH
B-327×F-96 20.63 UVW 43.60 X 22.97 N 39.33 OPQ 25.42 NO
B-327×EV-347 21.00 TUV 45.40 W 24.40 M 39.47 MNOPQ 25.31 O
Raka-poshi×Pop/209 20.37 VW 45.03 W 24.67 LM 39.47 MNOPQ 25.95 KLM
Raka-poshi×B-316 22.03 QRS 52.07 KLM 30.03 FG 39.10 PQ 26.19 JKL
Raka-poshi×EV-340 22.57 LMNOPQ 53.63 GHI 31.07 DE 40.00 IJKLMNO 26.41 IJ
Raka-poshi×E-322 22.03 QRS 52.97 IJK 30.93 DE 40.30 GHIJKLM 26.43 IJ
Raka-poshi×F-96 19.97 W 51.43 MNOP 31.47 DE 40.83BCDEFGHI 26.69 HI
Raka-poshi×EV-347 21.33 STU 52.60 JKL 31.27 DE 41.33ABCDE 26.46 IJ
Sh-139×Pop/209 23.43 FGHIJK 54.27 FG 30.83 EF 41.47 ABC 27.91 E
Sh-139×B-316 24.20 CDEF 55.30 DE 31.10 DE 40.47FGHIJK 27.21 F
Sh-139×EV-340 23.87 DEFGHI 55.67 D 31.80 D 39.90JKLMNOP 27.36 F
Sh-139×E-322 22.40 MNOPQ 51.47 MNOP 29.07 H 40.20GHIJKLMN 27.84 E
Sh-139×F-96 23.40 FGHIJKL 54.37 EFG 30.97 DE 39.70KLMNOPQ 28.13 DE
Sh-139×EV-347 24.00 DEFGH 54.97 DEF 30.97 DE 40.10HIJKLMNO 28.50 C
714 Journal of Food and Nutrition Research
Table 4b.Statistical significance of parents and F1 hybrids of maize for various fodder quality traits
Genotypes Fodder crude protein % Fodder moisture % Fodder ether
extractable fat %
Fodder nitrogen free extract
(Carbohydrate %) Fodder ash %
Pop/209 9.630OPQ 9.190BCDE 2.867IJKL 41.36JKLMNO 8.600MNOPQ B-316 8.970 S 8.150 P 2.903EFGHIJK 43.46 BC 9.130HIJK
EV-340 9.770NOP 9.120GHIJ 2.950BCDEFGHI 41.63HIJKLMN 9.140GHIJK E-322 11.81 CD 9.090 IJ 3.000 BCD 39.89 QRS 8.930JKLM F-96 11.01 IJ 9.090 IJ 3.103 A 41.78GHIJKLM 8.760 LMNO
EV-347 11.81 CD 9.120GHIJ 2.917DEFGHIJK 39.56 RS 8.700 MNO B-11 11.01 IJ 9.160DEFG 2.940BCDEFGHI 43.31 BCDE 9.270 FGHI E-336 9.480 PQ 9.240A 2.810 LMNO 46.11 A 8.270QRSTU
EV-1097Q 9.630OPQ 9.200ABCD 2.747 OP 40.69MNOPQR 9.170FGHIJ B-327 9.770NOP 9.240 A 2.710 P 40.34 OPQR 8.630 MNOP
Raka-poshi 13.20 A 9.170CDEF 2.753 NOP 37.84 T 8.060 U Sh-139 12.69 B 9.140FGH 2.840 KLM 38.84 ST 8.110 TU
B-11×Pop/209 8.820 ST 8.790 O 2.880 GHIJKL 46.28 A 8.850 KLMN B-11×B-316 11.81 CD 8.920 N 2.877 HIJKL 43.18BCDEF 8.770 LMNO
B-11×EV-340 11.31FGHI 8.950 MN 2.933CDEFGHIJ 41.59HIJKLMNO 9.910 B B-11×E-322 10.87JK 9.160DEFG 2.963BCDEFGH 40.46 NOPQR 11.17 A B-11×F-96 11.66CDE 9.200ABCD 2.727 OP 41.15 KLMNOP 8.140 TU
B-11×EV-347 11.01 IJ 9.200ABCD 2.870 IJKL 41.55IJKLMNO 8.050 U E-336×Pop/209 12.69 B 9.150EFGH 3.000 BCD 39.11 S 8.170 STU E-336×B-316 11.23GHI 9.090IJ 2.980 BCDE 43.70 B 8.190 RSTU
E-336×EV-340 8.820 ST 9.200ABCD 2.980 BCDE 46.18 A 8.510 OPQR E-336×E-322 11.96 C 9.220 AB 2.957BCDEFGHI 41.60HIJKLMNO 8.610 MNOP E-336×F-96 11.09HIJ 9.240 A 2.933CDEFGHIJ 41.18KLMNOP 9.660 BCD
E-336×EV-347 11.52DEFG 8.970 M 2.930CDEFGHIJ 40.68 MNOPQR 9.630BCDE EV-1097Q×Pop/209 11.74 CD 8.910 N 2.943BCDEFGHI 39.66 RS 9.330EFGHI EV-1097Q×B-316 11.38EFGH 9.030 L 2.887 FGHIJKL 39.96 PQRS 9.400DEFGH
EV-1097Q×EV-340 11.59 DEF 9.040 KL 2.810 LMNO 39.71 RS 9.490 CDEF EV-1097Q×E-322 8.970 S 9.030 L 2.837 KLMN 41.04LMNOPQ 9.800 BC EV-1097Q×F-96 9.340 QR 9.080 JK 2.847 JKL 40.65MNOPQR 9.690 BCD
EV-1097Q×EV-347 7.730 U 9.110 HIJ 2.757 MNOP 43.00BCDEFG 9.270 FGHI B-327×Pop/209 9.630 OPQ 9.120GHIJ 2.763 MNOP 42.63BCDEFGHI 8.570 NOPQ B-327×B-316 10.06 MN 9.130FGHI 2.763 MNOP 42.34CDEFGHIJK 8.350PQRSTU
B-327×EV-340 8.530 T 9.210 ABC 2.757 MNOP 42.83BCDEFGH 9.410DEFGH B-327×E-322 8.830 ST 9.190BCDE 2.940BCDEFGHI 42.72BCDEFGHI 9.440DEFGH B-327×F-96 7.810 U 9.160DEFG 3.017 BC 46.28 A 8.330PQRSTU
B-327×EV-347 11.01 IJ 9.170CDEF 3.027 B 42.01FGHIJKL 9.470 DEFG Raka-poshi×Pop/209 9.630 OPQ 9.040 KL 2.990 BCDE 43.03BCDEFG 9.370DEFGHI Raka-poshi×B-316 9.700 OP 9.040 KL 2.980 BCDE 43.34 BCD 8.750LMNO
Raka-poshi×EV-340 9.840 MNO 9.120GHIJ 2.980 BCDE 43.04BCDEFG 8.610 MNOP Raka-poshi×E-322 9.910 MNO 9.110 HIJ 2.973 BCDEF 42.94BCDEFG 8.630 MNOP Raka-poshi×F-96 10.65 KL 9.130FGHI 2.950BCDEFGHI 42.08DEFGHIJKL 8.500OPQRS
Raka-poshi×EV-347 10.53 L 9.140 FGH 2.930CDEFGHIJ 39.79 RS 8.480 OPQRS Sh-139×Pop/209 11.01 IJ 9.120GHIJ 2.950BCDEFGHI 40.57 MNOPQR 8.430OPQRST Sh-139×B-316 10.13 M 9.130FGHI 3.007 BCD 42.05EFGHIJKL 8.470 OPQRS
Sh-139×EV-340 9.700 OP 9.140 FGH 2.993 BCDE 42.22CDEFGHIJKL 8.600 MNOPQ Sh-139×E-322 9.630 OPQ 9.160DEFG 2.953BCDEFGHI 41.36 JKLMNO 9.060 IJKL Sh-139×F-96 9.040 RS 9.130FGHI 2.870 IJKL 42.55BCDEFGHIJ 8.180 RSTU
Sh-139×EV-347 8.970 S 9.150EFGH 2.970 BCDEFG 41.14 KLMNOP 9.270 FGHI It was suggested from results given in Table 3 that
significant differences were found for grain protein percentage. The results also indicated that higher additive variance for male × female interaction was found for fodder crude fiber, fodder nitrogen free extract (carbohydrates), acid detergent fiber, nutrient detergent fiber and fodder cellulose while lowest for fodder moisture percentage and ether extractable fat. Higher female additive variance as reported for acid detergent fiber, fodder crude fiber, nutrient detergent fiber and fodder cellulose while lowest for grain crude fiber, fodder moisture percentage and ether extractable fat. Higher male additive variance was found for acid detergent fiber,
nutrient detergent fiber and fodder ash percentage. The higher cumulative additive effect was recorded for acid detergent fiber, fodder crude fiber, nutrient detergent fiber and fodder cellulose while lowest for grain crude fiber, fodder moisture percentage and ether extractable fat but higher dominance effect was recorded for grain starch percentage, acid detergent fiber, fodder crude fiber, nutrient detergent fiber, fodder dry matter, fodder ash, fodder crude fiber and fodder cellulose while lowest was recorded for fodder moisture percentage and ether extractable fat. The highest degree of dominance was recorded for grain crude fiber, fodder crude fiber and fodder ash percentage while lowest was for fodder

Journal of Food and Nutrition Research 715
nitrogen free extract. Higher values of dominance effect and degree of dominance indicated that over type of dominance gene action was shown for grain and fodder quality traits. The over dominance and higher degree of dominance indicated that selection on the basis of grain and fodder quality may be helpful for the development of hybrid seed with better grain and fodder quality [39-42].
3.3. Principle Component Bi-plot Analysis It was suggested from principle component bi-plot 1
that the inbred lines B-11, B-336, Sh-139 and EV-1097 and F1 hybrids B-11×EV-347, B-336×Pop/209, B-336×B-316, B-336×E-322 and Sh-139×F-96 performed well for grain oil percentage, grain crude protein percentage, grain starch percentage and embryo percentage. The performance of B-11, B-11×EV-347, EV-1097×E-322, Sh-139×B-316, B-327×E-322 and Sh-139×F-96 was higher for ether extractable fat percentage, ash percentage, fodder cellulose percentage, fodder crude fiber percentage and acid detergent percentage (principle component bi-plot 2) while B-316, Raka-poshi, B-11×Pop/209, B-336×EV-340, B-327×E-322, B-327×F-96, EV-1097×E-322, Raka-poshi×EV-347, EV-1097×Pop/209 and EV-1097×EV-340 performed better for fodder moisture percentage, nitrogen free extract percentage (carbohydrates %), nutrient detergent fiber percentage, fodder crude protein percentage and fodder dry matter percentage (principle component bi-plot 3). It was concluded from principle component bi-plot analysis that
the accessions that performed better for all grain and fodder quality traits may be used for the development of good quality maize hybrids and synthetic varieties to improve maize yield and production. Results were in favor of the finds reported by [11,20,21,43].
4. Conclusions From prescribed study, it was reported from results that
higher heritability, genetic advance, significant genotypic and phenotypic correlation and cumulative additive effect for grain protein percentage, grain oil percentage, grain starch percentage, nutrient detergent fiber, fodder cellulose, fodder crude fiber, fodder crude protein and fodder moisture percentage suggested that selections may be made to develop synthetic varieties for better quality but higher dominance effect and degree of dominance indicated that selection may be useful for the development of good quality maize hybrids through heterosis breeding program. Principle component bi-plot analysis indicated that B-11×EV-347, B-11, Sh-139, EV-1097×E-322, Sh-139×B-316, B-327×E-322, B-316, Raka-poshi, B-11×Pop/209, B-336×EV-340, B-327×E-322, B-327×F-96, EV-1097×E-322, Raka-poshi×EV-347, EV-1097×Pop/209 and EV-1097×EV-340 performed better for grain and fodder quality and may be used for improvement of grain and fodder quality of maize .
35
648
546
4
44
3
42
2
40
1
38
Principal Component Biplot 1
36
Embryo_percentage
1333
12
31
1129
10
27
9
25
8
23
7
21
47
19
45
17
43
15 41
32
3928
37
24
34
2016
Graun_starch_percentage
30
22
18
14
26
Grain_protein_percentage
Grain_oil_percentage
Grain_crude_fibre_percentage
-3
3
1
3
-1
2
-3
0
1
-2
2
0-1-2
35
6
485
46
444
3
42
2
40
1
38
Principal Component Biplot 2
36
Acid_detergent_fibre
13
33
12
31
1129
10279
25
8
23
7
21
4719
45
17
4315
4132
39
2837
24
34
20
16
Fodder_crude_fibre
30
22
18
14
26
Fodder_cellulose
Ether_extractable_fat
Ash_percentage
-3
1
-1
3
-3
2
-5
-2
1
-4
0
0-1-2

716 Journal of Food and Nutrition Research
35 6
48
546
4
44
3
42
2
40
1
38
Principal Component Biplot 3
36
Moisture_percentage
13
33
12
31
11
29
10
27
9
25
823
7
21
47
19
45
17
43
1541
32
39
28
37
24
34
20
16
Fodder_crude_protein
30
22
18
14
26Fodder_dry_matterNutrient_detergent_fibre
Nitrogen_free_extract
-4
2
3
0
2
-2
1
3
-1
0
1
-1-2-3
Acknowledgment
We are thankful to Higher Education Commission of Pakistan supporting us for this research.
Conflict of Interest Authors have shown no conflict of interest.
References [1] Maddon PJ, Littman DR, Godfrey M, Maddon DE, Chess L. “The
isolation and nucleotide sequence of a cDNA encoding the T cell surface protein T4: a new member of the immunoglobulin gene family”. Cell, 42 (1). 93-104, Aug, 1985.
[2] Dost M. “The Introduction and Use of Oat (Avena sativa) Cultivars In Pakistan”. Aga Khan Rural Support Program (AKRSP) Gilgit Pakistan, 1970.
[3] Asghar A, Ali A, Syed W, Asif M, Khaliq T. “Growth and yield of maize (Zea mays L.) cultivars affected by NPK application in different proportion”. Pakistan J Sci, 62 (4). 211-215, Dec, 2010.
[4] Yousuf M, Saleem M. “Correlation analysis of S1 families of maize for grain yield and its components”. Int J Agric Biol, 4 (3). 387-388, Aug, 2001.
[5] Younas M, Yaqoob M. “Feed resources of livestock in the Punjab, Pakistan”. Livestock Research for Rural Development, 17 (2). 2005, Feb, 2005.
[6] Rashid M, Ranjha AM, Rehim A. “Model based P fertilization to improve yield and quality of sorghum (Sorghum bicolor L.) fodder on an ustochrept soil”. Pak J Agri Sci, 44 (2). 221-227, jun, 2007.
[7] Ali Q, Ahsan M, Tahir MHN, Basra SMA. “Genetic evaluation of maize (Zea mays L.) accessions for growth related seedling traits”. International Journal for Agro Veterinary and Medical Sciences, 6 (3). 164-172, Feb, 2012.
[8] Farooq J, Khaliq I, Kashif M, Ali Q, Mahpara S. “Análisis Genético del Porcentaje Relativo de Daño celular y algún Rasgo que Contribuye al Rendimiento en Trigo bajo Condiciones Normales y de Estrés Térmico”. Chilean journal of agricultural research, 71 (4). 511-520, month, 2011.
[9] Hussain B, Khan MA, Ali Q, dab Shaukat S. “Double Haploid Production is the Best Method for Genetic Improvement and Genetic Studies of Wheat”. International Journal for Agro Veterinary and Medical Sciences, 6 (4). 216-228, Sep, 2012.
[10] Hussain B, Khan MA, Ali Q, dab Shaukat S. “Double Haploid Production in Wheat through Microspo re Culture and Wheat X Maize Crossing System: An Over view”. International Journal for Agro Veterinary and Medical Sciences, 6 (5). 332-344, Sep, 2012.
[11] Khalil I, Shah H, Yasmeen F, Mumtaz M. “Seed yield and fatty acid profile of sunflower hybrids”. Sarhad Journal of Agriculture, 16 (6). 601-604, Dec, 2000.
[12] Kwon S, Torrie J. “Heritability and interrelationship among traits of two soybean populations”. Crop Sci, 4 (2). 196-198, Dec, 1964.
[13] Sun W-H, Liu X-Y, Wang Y, Hua Q, Song XM. “Effect of water stress on yield and nutrition quality of tomato plant over expressing StAPX”. Biologia Plantarum, 58 (1). 99-104, jun, 2014.
[14] Naveed MT, Ali Q, Ahsan M, Hussain B. “Correlation and path coefficient analysis for various quantitative traits in chickpea (Cicer arietinum L.)”. International Journal for Agro Veterinary and Medical Sciences, 6 (2). 97-106, Jan, 2012.
[15] Ali Q, Ahsan M, Tahir MHN, Basra SMA. “Genetic studies of morpho-physiological traits of maize (Zea mays L.) seedling”. African Journal of Agricultural Research, 8 (28). 3668-3678, Jul, 2013.
[16] Van Soest Pv, Robertson J, Lewis B. “Methods for dietary fiber, neutral detergent fiber, and nonstarch polysaccharides in relation to animal nutrition”. Journal of dairy science, 74 (10). 3583-3597, Oct, 1991.
[17] Valsta LM, Kilkkinen A, Mazur W, Nurmi T, Lampi AM. “Phyto-oestrogen database of foods and average intake in Finland”. British Journal of Nutrition, 89 (S1). S31-S38, Oct, 2003.
[18] Dubey R, Joshi V, Verma M. “Heterosis for nutritional quality and yield in conventional and nonconventional hybrids of maize (Zea mays L.)”. Indian Journal of Genetics and Plant Breeding, 69 (2). 109-114, Feb, 2009.
[19] Duvick DN. “The Contribution of Breeding to Yield Advances in maize (Zea mays L.)”. Advances in agronomy, 8683-145, May, 2005.
[20] Xiang K, Yang K, Pan G, Reid L, Li W. “Genetic diversity and classification of maize landraces from China's Sichuan Basin based on agronomic traits, quality traits, combining ability and SSR markers”. Maydica, 55 (1). 85, Jul, 2010.
[21] Awan TH, Mahmood MT, Maqsood M, Usman M, Hussain MI. “Studies on hybrid and synthetic cultivars of maize for forage yield and quality”. Pak J Agri SCi Vol, 381-2, Jun, 2001.
[22] Sanderson MA, Adler PR. “Perennial forages as second generation bioenergy crops”. International Journal of Molecular Sciences, 9 (5). 768-788, May, 2008.
[23] Jat R, Ahlawat I. “Effect of vermicompost, biofertilizer and phosphorus on growth, yield and nutrient uptake by gram (Cicer arietinum) and their residual effect on fodder maize (Zea mays)”. Indian journal of agricultural science, 74 (7). 359-361, Sep, 2004.
[24] Suthar M, Singh D, Nepalia V, Singh A. “Performance of sweet corn (Zea mays) varieties under varying fertility levels”. Indian Journal of Agronomy, 59 (1). 168-170, May, 2014.
[25] Bertalot MJ, Guerrini IA, Mendoza E, Pinto MS. “Productivity, Leaf Nutrient Content and Soil Carbon Stocked in Agroforestry and Traditional Management of Maize (Zea mays L.)”. American Journal of Plant Sciences, 5 (06). 884, Mar, 2014.
[26] Kumawat P, Kaushik M, Singh D, Kumawat K. “Yield, nutrient content, uptake and quality of sweet corn varieties as influenced by nitrogen and phosphorus fertilization under Southern Rajasthan condition”. Annals of Agri Bio Research, 19 (1). 67-69, Mar, 2014.
[27] Ali A, Muzaffar A, Awan MF, ud Din S, Nasir IA. “Genetically Modified Foods: Engineered tomato with extra advantages”. Advancements in Life Sciences, 1 (3). 139-152, May, 2014.
[28] Sonawane R, Dandge M, Kamble A, Shingrup P. “Effect of herbicides on nutrient uptake and yield of Kharif maize (Zea mays L.)”. BIOINFOLET-A Quarterly Journal of Life Sciences, 11 (1a). 136-138, Aug, 2014.
Journal of Food and Nutrition Research 717
[29] Chaudhary D, Jat S, Kumar R, Kumar A, Kumar B (2014) Fodder Quality of Maize: Its Preservation. Maize: Nutrition Dynamics and Novel Uses: Springer. pp. 153-160.
[30] Khan S, Anwar K, Kalim K, Saeed A, Shah SZ. “Nutritional Evaluation of Some Top Fodder Tree Leaves and Shrubs of District Dir (Lower), Pakistan as a quality livestock feed”. Int J Curr Microbiol App Sci, 3 (5). 941-947, Mar, 2014.
[31] Nazli RI, Kuşvuran A, Inal I, DemirbaŞ A, Tansi V. “Effects of different organic materials on forage yield and quality of silage maize (Zea mays L.)”. Turkish Journal of Agriculture and Forestry, 38 (1). 23-31, Dec, 2014.
[32] Geta T, Nigatu L, Animut G. “Evaluation of Potential Yield and Chemical Composition of Selected Indigenous Multi-Purpose Fodder Trees in Three Districts of Wolayta Zone, Southern Ethiopia”. World Applied Sciences Journal, 31 (3). 399-405, Mar, 2014.
[33] Cocaliadis MF, Fernández-Muñoz R, Pons C, Orzaez D, Granell A. “Increasing tomato fruit quality by enhancing fruit chloroplast function. A double-edged sword?”. Journal of experimental botany, eru 165, Apr, 2014.
[34] Asaduzzaman M, Biswas M, Islam MN, Rahman MM, Begum R. “Variety and N-Fertilizer Rate Influence the Growth, Yield and Yield Parameters of Baby Corn (Zea mays L.)”. Journal of Agricultural Science, 6 (3). P 118, Sep, 2014.
[35] Amodu J, Akpensuen T, Dung D, Tanko R, Musa A. “Evaluation of Maize Accessions for Nutrients Composition, Forage and Silage Yields”. Journal of Agricultural Science, 6 (4). p178, Mar, 2014.
[36] Bibi A, Sadaqat HA, Ali Q. “Combining ability analysis for green forage associated traits in sorghum-sudangrass hybrids under water stress”. International Journal for Agro Veterinary and Medical Sciences, 6 (2). 115-137, Jan, 2012.
[37] Zhu X, Richael C, Chamberlain P, Busse JS, Bussan AJ. “Vacuolar Invertase Gene Silencing in Potato (Solanum tuberosum L.) Improves Processing Quality by Decreasing the Frequency of Sugar-End Defects”. PloS one, 9 (4). e93381, Apr, 2014.
[38] Mok H-F, Dassanayake KB, Hepworth G, Hamilton AJ. “Field comparison and crop production modeling of sweet corn and silage maize (Zea mays L.) with treated urban wastewater and freshwater”. Irrigation Science, 1-18, Mar, 2014.
[39] Welcker C, Andréau B, De Leon C, Parentoni S, Bernal J. “Heterosis and combining ability for maize adaptation to tropical acid soils”. Crop science, 45 (6). 2405-2413, Oct, 2005.
[40] Akbar M, Saleem M, Ashraf MY, Husain A, Azhar F. “Combining ability studies for physiological and grain yield traits in maize at two temperature regimes”. Pak J Bot, 41 (4). 1817-1829, jul, 2009.
[41] Akbar M, Saleem M, Azhar F, Ashraf MY, Ahmad R. “Combining ability analysis in maize under normal and high temperature conditions”. J Agric Res, 46 (1). 261-277, Aug, 2008.
[42] Wali M, Kachapur R, Chandrashekhar C, Kulkarni V, Devaranavadagi S. “Gene action and combining ability studies in single cross hybrids of maize (Zea mays L.)”. Karnataka Journal of Agricultural Sciences, 23 (4), Feb, 2010.
[43] Saleem M, Ahsan M, Aslam M, Majeed A. “Comparative evaluation and correlation estimates for grain yield and quality attributes in maize”. Pak J Bot, 40 (6). 2361-2367, Feb, 2008.


![Tolerance of Maize (Zea mays L.) and Soybean [Glycine max (L.) Merr.] to Late Applications of Postemergence Herbicides](https://static.fdokumen.com/doc/165x107/63438e5b1a2cfc44fc019bae/tolerance-of-maize-zea-mays-l-and-soybean-glycine-max-l-merr-to-late-applications.jpg)