Canadian Grain Exports 2006-07
39
Crop year 2006–2007 Canadian Grain Exports www.grainscanada.gc.ca
-
Upload
khangminh22 -
Category
Documents
-
view
3 -
download
0
Transcript of Canadian Grain Exports 2006-07

Crop year
2006ndash2007
Canadian Grain Exports
wwwgrainscanadagcca
Canadian Grain Exports Crop year 2006 - 2007
Table of Contents
Tables
1 Total grain and wheat flour exports3 2 Major importers of Canadian wheat 3 3 Major importers of Canadian grains and wheat flour 4 4 Exports by country of destination
- wheat durum wheat and wheat flour 5 - oats barley flaxseed canola soybeans peas and corn8
5 Exports by clearance sector - wheat10 - durum wheat 12 - oats 13 - barley 13 - flaxseed14 - canola14 - soybeans15 - peas 16 - corn 16
6 Exports by class - wheat17
7 Exports by grade - oats 19 - barley 19 - flaxseed20 - canola20 - soybeans21 - peas 22 - corn 23
8 Exports by port of clearance24 9 Exports by month and clearance sector25
10 Exports by class grade and clearance sector 27 11 Exports of wheat (including durum) and wheat flour by month and clearance
sector28 12 Exports of special crops and processed products 29 13 Ocean freight rates38 14 Estimated costs of moving wheat from a mid-prairie point to export position39
For further information please contact Corporate Services of the Canadian Grain Commission at (204) 983 -1570
ISSN 1701-9931
Canadian Grain Commission wwwgrainscanadagcca 2
Canadian Grain Exports Crop year 2006 - 2007
1 Total grain and wheat flour exports
2006 ndash 2007 2005 - 2006
10 year average 1996 ndash 1997 to
2005 - 2006
Wheat Durum Wheat Wheat Flour Oats BarleyFlaxseedCanola Soybeans Peas Corn Other
14 024 4 432
309 1 552 1 176
580 5 466 1 029 1 493
193 0
(000rsquos tonnes)
10 607 4 226
295 1 126 2 228
441 5 309
832 1 999
164 0
11 941 3 636
249 968
1 696 550
3 490 250 785 151 34
Total 30 254 27 226 23 750
2 Major Importers of Canadian Wheat
10 year average 1996 ndash 1997 to
2006 ndash 2007 2005 - 2006 2005 - 2006 (000rsquos tonnes)
Indonesia 1 543 11 978 9 784 7 Mexico 1 222 9 879 6 765 6 United States 1 218 9 447 4 875 7 India 1 051 7 0 0 27 Sri Lanka 924 7 1 005 10 203 2 Others 8 066 57 7 298 69 9 287 78
Total 14 024 100 10 607 100 11 941 100
Canadian Grain Commission wwwgrainscanadagcca 3
Canadian Grain Exports Crop year 2006 - 2007
3 Major Importers of Canadian grains and wheat flour
2006 ndash 2007 2005 - 2006 2004 - 2005 (000rsquos tonnes)
United States 4 576 15 2 964 11 2 390 11 Japan 3 474 11 3 602 13 3 191 14 India 2 190 7 672 2 543 2 Mexico 2 184 7 2 189 8 1 747 8 Indonesia 1 560 5 1 061 4 791 4 Others 16 270 55 16 738 62 13 632 61
Total 30 254 100 27 226 100 22 294 100
Class
Wheat CWRShelliphellip Canada Western Red Spring
Oats Otherhelliphelliphellip Combined and sample grades
CPShelliphelliphellip
CWRWhelliphellip
Canada Prairie Spring ndash Red and White
Canada Western Red Winter
Barley Selecthelliphellip Select Special Bin and Sample
Select
CWEShellip
CWHWShellip
Canada Western Extra Strong
Canada Western Hard White Spring Corn CE Yellowhellip Canada Eastern Yellow Corn
CEhelliphelliphelliphellip Canada Eastern
CWADhelliphellip Canada Western Amber Durum
Otherhelliphelliphellip Shipment by Specification and sample grades
Note All non board exports from Prairie elevators quoted as Ndeg 1
Canadian Grain Commission wwwgrainscanadagcca 4
Canadian Grain Exports Crop year 2006 - 2007
4 Exports by country of destination ndash wheat durum wheat and wheat flour
Country Wheat Durum wheat Wheat flour Total
Western Europe Belgium France GermanyGreece Iceland Ireland Italy Netherlands Norway Portugal Spain Switzerland United Kingdom
352 -
01 -
11 62
3074 150 00sup102
1310 16
4374
(000rsquos tonnes)
2134 -----
6166 2170
-267
-15
-
-01 01 11 02
------
02 02
2486 01 02 11 13 62
9241 2320
00sup1 269
1310 32
4376 Total
Eastern Europe Czech Republic Slovania
9353
00sup1 -
1 0751
00sup1 -
18
-00sup1
2 0122
00sup1 00sup1
Total
Africa AlgeriaBurundi Cameroon Congo Djibouti Egypt Ethiopia French Southern Terr Ghana Libya Mali Mauritania Morocco Mozambique Namibia Nigeria Somalia South Africa Sudan Tanzania Togo Tunisia West Africa
00sup1
-30
136 196 174
5457 178
-1131
01 06
178 -
265 66
1545 22
1059 4867
590 60 07
1890
00sup1
6595 --------
1152 --
5319 ----
155 ---
1334 -
00sup1
-----shy-
00sup1 ---------------
00sup1
6595 30
136 196 174
5457 178 00sup1
1131 1152
06 178
5319 265 66
1545 22
1213 4867
590 60
1341 1890
Total 1 7856 1 4554 00sup1 3 2410
sup1 00 less than 50 tonnes Wheat flour is reported in terms of wheat equivalent ndash 1 tonne wheat = 0750 tonnes wheat flour Wheat flour = wheat and durum combined
Note Includes exports of Eastern wheat via unlicensed facilities
Canadian Grain Commission wwwgrainscanadagcca 5
Canadian Grain Exports Crop year 2006 - 2007
4 Exports by country of destination ndash wheat durum wheat and wheat flour
Country Wheat Durum wheat Wheat flour Total
Asia Bahrain Bangladesh China PR Hong Kong India IndonesiaIraq Israel Japan Jordan Korea North Korea South Lebanon Malaysia Philippines Singapore Sri Lanka Taiwan Thailand United Arab EmiratesVietnam Yemen
-3086 441
-1 0508
1 5428 6211
-9088
--
1104 -
1364 3595 362
9237 63
2455 1517 2583
62
(000rsquos tonnes)
----
1990 168
--
2469 ------
04 883
--
546 --
00sup1-
08 97
-01
-00sup105 04 01
449 02
00sup1 -
00sup1 -
14 08 03
--
00sup1 3086 449
97 1 2498 1 5597
6211 00sup1
1 1562 04 01
1553 02
1364 3595 366
1 0120 77
2463 2065 2583
62 Total
Oceania American Samoa Australia New Zealand Tonga
6 7103
--
163 -
6060
----
592
07 01
-01
7 3755
07 01
163 01
Total 163 - 09 172
sup1 00 less than 50 tonnes Wheat flour is reported in terms of wheat equivalent ndash 1 tonne wheat = 0750 tonnes wheat flour Wheat flour = wheat and durum combined
Note Includes exports of Eastern wheat via unlicensed facilities
Canadian Grain Commission wwwgrainscanadagcca 6
Canadian Grain Exports Crop year 2006 - 2007
4 Exports by country of destination ndash wheat durum wheat and wheat flour
Country Wheat Durum wheat Wheat flour Total
Western Hemisphere Anguilla Argentina Aruba Bahamas Barbados Bermuda Brazil British Virgin Islands Caribbean Cayman Islands Chile Colombia Costa Rica CubaDominican Republic Ecuador Grenada Guatemala Guyana Honduras Mexico Netherlands Antilles Nicaragua Peru Puerto Rico St Kitts-Nevis St Pierre and MiquelonSt Vincent Ste Lucia Trinidad amp Tobago Turks amp Caicos Islands United States Uruguay Venezuela
------
1804 -
1523 -
368 4004
-893 108
2747 -
471 513
-1 2212
--
3575 800
------
1 2180 -
4563
(000rsquos tonnes)
--------
159 -
609 166
-96
-172
-51
--
74 --
583 -------
6358 -
4685
01 00sup101 58
00sup1 19 13 05
-00sup1
--
01 -
01 -
00sup1 --
00sup1 -
13 00sup1
--
00sup1 01 12
00sup1 00sup1 04
2341 00sup1
-
01 00sup1 01 58
00sup1 19
1816 05
1682 00sup1 978
4170 01
989 109
2918 00sup1 521 513 00sup1
1 2286 13
00sup1 4158
800 00sup1 01 12
00sup1 00sup1 04
2 0879 00sup1
9248 Total
Grand Total Exported
4 5761
14 0236
1 2953
4 4318
2471
3090
6 1185
18 7644
sup1 00 less than 50 tonnes Wheat flour is reported in terms of wheat equivalent ndash 1 tonne wheat = 0750 tonnes wheat flour Wheat flour = wheat and durum combined
Note Includes exports of Eastern wheat via unlicensed facilities
Canadian Grain Commission wwwgrainscanadagcca 7
Canadian Grain Exports Crop year 2006 - 2007
4 Exports by country of destination ndash oats barley flaxseed canola soybean peas and corn
Country Oats Barley Flaxseed Canola Soybean Peas Corn Total
Western Europe Belgium Denmark France Iceland Ireland Italy Netherlands Norway Portugal Spain United Kingdom
-------
367 ---
-----------
(000rsquos tonnes)
4661 -- -- -- -- -- -- -- -- -- -- -
1606 302 466
-17 31
2405 268 653 132 216
535 216
----
106 82
-1397
-
---
106 -------
6802 518 466 106 17 31
2511 718 653
1529 216
Total
Eastern Europe Czech Republic
367
-
-
00sup1
4661 -
- -
6098
-
2335
-
106
-
1 3566
00sup1 Total
Africa Algeria Egypt South Africa
-
--
133
00sup1
--
506
- -
- -- -- -
-
-157
-
-
245 --
-
219 --
00sup1
464 157 639
Total
Asia Bangladesh China PR India Iran Israel Japan Korea North Malaysia Nepal Pakistan Syria Turkey United Arab Emirates Vietnam
133
-----
114 --------
506
-3946
---
3127 -------
130
- -
- 944 - 9157 - -- -- 78
157 1 9608 - -- -- 124 - 5488 - -- 289 - 2817 - -
157
---
2252 238 176 239 605
--
43 -
85 -
245
1901 -
9407 -----
25 387
--
110 -
219
---
1561 45
---------
1260
2845 1 3103
9407 3813 361
2 3182 239 605 149
5875 43
289 3012
130 Total 114 7203 157 3 8504 3638 1 1830 1606 6 3052
sup1 00 less than 50 tonnes
Canadian Grain Commission wwwgrainscanadagcca 8
Canadian Grain Exports Crop year 2006 - 2007
4 Exports by country of destination ndash oats barley flaxseed canola soybean peas and corn
Country Oats Barley Flaxseed Canola Soybean Peas Corn Total (000rsquos tonnes)
Oceania Australia - - - 571 - - - 571 Total - - - 571 - - - 571
Western Hemisphere Colombia - 826 - - - 25 - 852 Cuba - - - - 206 490 - 696 Ecuador 139 176 - - - - - 315 Mexico 358 197 - 8997 - - - 9552 Peru - 133 - - - - - 133 Puerto Rico 20 - - - - - - 20 United States 1 4392 2723 980 6591 186 02 04 2 4878 Total 1 4908 4055 980 1 5588 392 518 04 3 6445
Grand Total Exported 1 5522 1 1765 5797 5 4664 1 0285 1 4928 1933 11 4894
Canadian Grain Commission wwwgrainscanadagcca 9
Canadian Grain Exports Crop year 2006 - 2007
5 Exports by clearance sector - wheat
Country Pacific Churchill Thunder Bay Eastern Atlantic Prairie Total
Western Europe Belgium GermanyIceland Ireland Italy Netherlands NorwayPortugal Spain Switzerland United Kingdom
-----------
109 -------
698 --
(000rsquos tonnes)
- 243 - 01 - 11 - 62
462 2613 - 150 - 00sup1 - 02 - 612 - 16
60 4314
-----------
-----------
352 01 11 62
3074 150 00sup1 02
1310 16
4374 Total
Eastern Europe Czech Republic
-
-
807
-
522 8024
- 00sup1
-
-
-
-
9353
00sup1 Total
Africa Burundi Cameroon Congo Djibouti Egypt Ethiopia Ghana Libya Mali Mauritania Mozambique Namibia Nigeria Somalia South Africa Sudan Tanzania Togo Tunisia West Africa
-
30 --------------
2879 320
---
-
------
292 --------
440 270
---
- 00sup1
- -- 136 - 196 - 174 - 5457 - 178 - 840 - 01 - 06 - 178 - 265 - 66 - 1545 - 22 - 1059 - 1547 - -- 60 - 07 - 1890
-
--------------------
-
--------------------
00sup1
30 136 196 174
5457 178
1131 01 06
178 265 66
1545 22
1059 4867
590 60 07
1890 Total 3229 1002 - 1 3625 - - 1 7856
sup1 00 less than 50 tonnes
Canadian Grain Commission wwwgrainscanadagcca 10
Canadian Grain Exports Crop year 2006 - 2007
5 Exports by clearance sector - wheat
Country Pacific Churchill Thunder Bay Eastern Atlantic Prairie Total
Asia Bangladesh China PR India Indonesia Iraq Japan Korea South MalaysiaPhilippines Singapore Sri Lanka Taiwan Thailand United Arab Emirates Vietnam Yemen
3086 441
7884 1 5428
6211 9088 1104 1364 3595 362
9237 63
2455 1517 2583
-
----------------
(000rsquos tonnes)
- -- -- 2624 - -- -- -- -- -- -- -- -- -- -- -- -- 62
----------------
----------------
3086 441
1 0508 1 5428
6211 9088 1104 1364 3595 362
9237 63
2455 1517 2583
62 Total
Oceania New Zealand
6 4417
163
-
-
- 2686
- -
-
-
-
-
6 7103
163 Total
Western Hemisphere Brazil Caribbean Chile ColombiaCuba Dominican Republic Ecuador Guatemala Guyana Mexico Peru Puerto Rico United States Venezuela
163
--
368 3665
--
2747 470
-6983 3575
-159
-
-
275 --------
1292 ----
- -
- 1529 - -- -- 339 - 893 - 108 - -- -- 372 - 1951 - -
180 535 - 1318
275 4200
-
--------
140 -----
-
-1523
-------
1987 -
86 1 0703
89
163
1804 1523 368
4004 893 108
2747 470 513
1 2212 3575 800
1 2180 4563
Total
Grand Total Exported
1 7967
8 5777
1567
3375
455 1 1244
977 3 5580
140
140
1 4387
1 4387
4 5761
14 0236
Canadian Grain Commission wwwgrainscanadagcca 11
Canadian Grain Exports Crop year 2006 - 2007
5 Exports by clearance sector ndash durum wheat
Country Pacific Churchill Thunder Bay Eastern Prairie Total
Western Europe Belgium ItalyNetherlands Portugal Switzerland
-----
219 ----
(000rsquos tonnes)
-268 447
--
1915 5899 1723 267 15
-----
2134 6166 2170 267 15
Total
Eastern Europe Czech Republic
-
-
219
-
715
-
9817
00sup1
-
-
1 0751
00sup1
Total
Africa AlgeriaLibyaMorocco South Africa Tunisia
-
----
270
-
--
275 -
248
-
--
761 --
00sup1
6595 1152 4283 155 816
-
-----
00sup1
6595 1152 5319
155 1334
Total
Asia India Indonesia Japan Singapore Sri Lanka United Arab Emirates
270
1990 168
2469 04
883 546
523
------
761
------
1 3000
------
-
------
1 4554
1990 168
2469 04
883 546
Total
Western Hemisphere Caribbean Chile Colombia Cuba Ecuador Guatemala Mexico Peru United States Venezuela
6060
-609 166
-172 51
-583
--
-
----------
-
---------
239
-
---
96 -----
4357
-
159 -----
74 -
6358 89
6060
159 609 166 96
172 51 74
583 6358 4685
Total
Grand Total Exported
1581
7911
-
742
239
1715
4454
2 7271
6680
6680
1 2953
4 4318
sup1 00 less than 50 tonnes
Canadian Grain Commission wwwgrainscanadagcca 12
Canadian Grain Exports Crop Year 2006 - 2007
5 Exports by clearance sector - oats
Country Pacific Churchill Thunder Bay Eastern Prairies Total
Western Europe Norway - -
(000rsquos tonnes)
367 - - 367 Total
Africa South Africa
-
-
-
-
367
133
-
-
-
-
367
133 Total
Asia Japan
-
114
-
-
133
-
-
-
-
-
133
114 Total
Western Hemisphere Ecuador Mexico Puerto Rico United States
114
139 289
--
-
----
-
---
1721
-
--
20 -
-
-69
-1 2671
114
139 358
20 1 4392
Total
Grand Total Exported
428
542
-
-
1721
2221
20
20
1 2740
1 2740
1 4908
1 5522
5 Exports by clearance sector - barley
Country Pacific Churchill Thunder Bay Eastern Prairies Total
Eastern Europe Czech Republic - -
(000rsquos tonnes)
- 00sup1 - 00sup1
Total
Africa South Africa
-
506
-
-
-
-
00sup1
-
-
-
00sup1
506 Total
Asia China PR Japan Vietnam
506
3946 3127 130
-
---
-
---
-
---
-
---
506
3946 3127 130
Total
Western Hemisphere Colombia Ecuador Mexico Peru United States
7203
728 176
-133
-
-
-----
-
----
506
-
----
12
-
99 -
197 -
2205
7203
826 176 197 133
2723 Total
Grand Total Exported
1037
8746
-
-
506
506
12
12
2501
2501
4055
1 1765
sup1 00 less than 50 tonnes
Canadian Grain Commission wwwgrainscanadagcca 13
Canadian Grain Exports Crop year 2006 - 2007
5 Exports by clearance sector ndash flaxseed
Country Pacific Churchill Thunder Bay Eastern Prairie Total (000rsquos tonnes)
Western Europe Belgium - - 4549 112 - 4661 Total - - 4549 112 - 4661
Asia Japan 157 - - - - 157 Total 157 - - - - 157
Western Hemisphere United States - - - 02 978 980 Total - - - 02 978 980
Grand Total Exported 157 - 4549 114 978 5797
5 Exports by clearance sector ndash canola
Country Pacific Churchill Thunder Bay Eastern Prairie Total
Asia Bangladesh China PR Israel Japan Nepal Pakistan TurkeyUnited Arab Emirates
944 9157
-1 9608
124 5098
-2817
-----
390 --
(000rsquos tonnes)
--
78 ---
234 -
------
55 -
--------
944 9157
78 1 9608
124 5488 289
2817
Total
Oceania Australia
3 7748
571
390
-
312
-
55
-
-
-
3 8504
571 Total
Western Hemisphere Mexico United States
571
5005 -
-
--
-
2941 02
-
667 -
-
384 6589
571
8997 6591
Total
Grand Total Exported
5005
4 3323
-
390
2943
3255
667
723
6973
6973
1 5588
5 4664
Canadian Grain Commission wwwgrainscanadagcca 14
Canadian Grain Exports Crop year 2006 - 2007
5 Exports by clearance sector ndash soybean
Country Pacific Churchill Thunder Bay Eastern Prairie Total
Western Europe Belgium Denmark France Ireland ItalyNetherlands NorwayPortugal Spain United Kingdom
----------
----------
(000rsquos tonnes)
160 ---------
1446 302 466 17 31
2405 268 653 132 216
----------
1606 302 466 17 31
2405 268 653 132 216
Total
Africa Egypt
-
-
-
-
160
-
5938
157
-
-
6098
157 Total
Asia Iran Israel Japan Korea North Malaysia Syria United Arab Emirates
-
-------
-
-------
-
-------
157
2252 238 176 239 605 43 85
-
-------
157
2252 238 176 239 605 43 85
Total
Western Hemisphere Cuba United States
-
--
-
--
-
--
3638
206 -
-
-186
3638
206 186
Total
Grand Total Exported
-
-
-
-
-
160
206
9939
186
186
392
1 0285
Canadian Grain Commission wwwgrainscanadagcca 15
Canadian Grain Exports Crop year 2006 - 2007
5 Exports by clearance sector ndash peas
Country Pacific Churchill Thunder Bay Eastern Prairie Total
Western Europe Belgium Denmark Netherlands NorwaySpain
----
185
----
656
(000rsquos tonnes)
535 135
-82
494
-81
106 -
62
-----
535 216 106 82
1397 Total
Africa Algeria
185
-
656
-
1246
-
248
245
-
-
2335
245 Total
Asia Bangladesh India Nepal Pakistan United Arab Emirates
-
1901 9407
25 387 110
-
-----
-
-----
245
-----
-
-----
245
1901 9407
25 387 110
Total
Western Hemisphere Colombia Cuba United States
1 1830
25 490
-
-
---
-
---
-
---
-
--
02
1 1830
25 490
02 Total
Grand Total Exported
515
1 2530
-
656
-
1246
-
494
02
02
518
1 4928
5 Exports by clearance sector ndash corn
Country Pacific Churchill Thunder Bay Eastern Prairie Total (000rsquos tonnes)
Western Europe Iceland - - - 106 - 106 Total - - - 106 - 106
Africa Algeria - - - 219 - 219 Total - - - 219 - 219
Asia Iran - - - 1561 - 1561 Israel - - - 45 - 45 Total - - - 1606 - 1606
Western Hemisphere United States - - - 00sup1 03 04 Total - - - 00sup1 03 04
Grand Total Exported - - - 1930 03 1933 sup1 00 less than 50 tonnes
Canadian Grain Commission wwwgrainscanadagcca 16
Canadian Grain Exports Crop year 2006 - 2007
6 Exports by class - wheat
Country CWRS CPS CWRW Feed CWES CWHWS CE Other CWAD Total
Western Europe Belgium Germany Iceland Ireland Italy Netherlands Norway Portugal Spain Switzerland United Kingdom
351 01 11 62
2833 141 00sup1
-863 16
4318
----------
40
----
02 -----
11
-------
02 --
04
(000rsquoS tonnes)
- 00sup1 - -- -- -
236 03 - 01 - -- -- -- -- 01
-----
08 --
448 --
-----------
2134 ---
6166 2170
-267
-15
-
2486 01 11 62
9241 2320
00sup1 269
1310 30
4374
Total
Eastern Europe Czech Republic
8596
00sup1
40
-
13
-
06
-
236 06
- -
455
-
-
-
1 0751
00sup1
2 0104
00sup1
Total
Africa Algeria Burundi Cameroon Congo Djibouti Egypt Ethiopia Ghana Libya Mali Mauritania Morocco Mozambique Namibia Nigeria Somalia South Africa Sudan Tanzania Togo Tunisia West Africa
00sup1
-30
136 80
---
999 -
06 05
-265 66
1384 22
809 4428 590 60 07
1820
-
---------------------
40
-
------
22 77
-------------
30
-
----------------------
- -
- -- -- -- 116 - -- -- -- -- 01 - -- -- -- -- -- 95 - -- 249 - 319 - -- -- -- -
-
----
174 5457 156 55
--
173 ------
119 ----
-
--------------
66 -------
00sup1
6595 -------
1152 --
5319 ----
155 ---
1334 -
00sup1
6595 30
136 196 174
5457 178
1131 1152
06 178
5319 265
66 1545
22 1213 4867
590 60
1341 1890
Total 1 0708 40 129 - - 779 6133 66 1 4554 3 2410
sup1 00 less than 50 tonnes
Note Refer to page 4 for class definitions
Canadian Grain Commission wwwgrainscanadagcca 17
Canadian Grain Exports Crop year 2006 - 2007
6 Exports by class - wheat
Country CWRS CPS CWRW Feed CWES CWHWS CE Other CWAD Total
Asia Bangladesh China PR India Indonesia Iraq Japan Korea South Malaysia Philippines Singapore Sri Lanka Taiwan Thailand United Arab Emirates Vietnam Yemen
3086 441
4374 1 3249
6211 867 7 1104 1199 2932 180 852 63
1928 1410 1682
-
--
1514 545
---
30 --
303 -
10 ---
--
1996 392
---
05 --
477 -
80 ---
(000rsquoS tonnes)
- - -- - -- - -- - 1243 - - -
411 - -- - -- - 129 - - 664 - - 182 - - 980 - - -- - 438 - - 107 - - 126 - - -
--
2624 ------------
62
----------
6625 ---
775 -
--
1990 168
-2469
---
04 883
--
546 --
3086 441
1 2498 1 5596
6211 1 1557
1104 1364 3595 366
1 0120 63
2455 2063 2583
62
Total
Oceania New Zealand
4 7387
163
2402
-
2950
-
411 - 3868
- - -
2686
-
7400
-
6060
-
7 3163
163
Total
Western Hemisphere Brazil Caribbean Chile Colombia Cuba Dominican Republic Ecuador Guatemala Guyana Mexico Peru Puerto Rico United States Venezuela
163
1690 1523 368
3866 893 59
2747 470 366
1 0493 3327 271
1 0415 4519
-
---------
255 --
33 44
-
---
138 ------
248 -
70 -
- - -
- - 114 - - -- - -- - -- - -- - -- - -- - -- - 137
16 - 1104 - - -- - 327
68 - 265 - - -
-
-----
49 --
10 344
-202
1186 -
-
------------
143 -
-
-159 609 166
96 -
172 51
-74
583 -
6358 4685
163
1804 1682
978 4170
989 108
2918 521 513
1 2286 4158 800
1 8539 9248
Total
Grand Total Exported
4 1008
10 7862
331
2813
456
3548
83 - 1948
501 236 6600
1792
1 1066
143
7609
1 2953
4 4318
5 8714
18 4554
Note Refer to page 4 for class definitions
Canadian Grain Commission wwwgrainscanadagcca 18
Canadian Grain Exports Crop year 2006 - 2007
7 Exports by grade - oats
Country No 1 CW No 2 CW CE Other Total
Western Europe Norway - 367
(000rsquos tonnes)
- - 367 Total
Africa South Africa
-
-
367
133
-
-
-
-
367
133 Total
Asia Japan
-
38
133
75
-
-
-
-
133
114 Total
Western Hemisphere Ecuador Mexico Puerto Rico United States
38
-69
-1 2671
75
139 289
--
-
--
20 -
-
---
1721
114
139 358 20
1 4392 Total
Grand Total Exported
1 2740
1 2778
428
1004
20
20
1721
1721
1 4908
1 5522
7 Exports by grade - barley
Country Select Feed CE Total
Eastern Europe Czech Republic 00sup1
(000rsquos tonnes)
- - 00sup1
Total
Africa South Africa
00sup1
-
-
506
-
-
00sup1
506 Total
Asia China PR Japan Vietnam
-
3308 2811
-
506
639 316 130
-
---
506
3946 3127
130 Total
Western Hemisphere ColombiaEcuador Mexico Peru United States
6118
654 ---
608
1085
173 176 197 133
2103
-
----
12
7203
826 176 197 133
2723 Total
Grand Total Exported
1262
7380
2782
4372
12
12
4055
1 1765 sup1 00 less than 50 tonnes Note Refer to page 4 for class definitions
Canadian Grain Commission wwwgrainscanadagcca 19
Canadian Grain Exports Crop year 2006 - 2007
7 Exports by grade - flaxseedsup1
Country No 1 CW Total (000rsquos tonnes)
Western Europe Belgium 4661 4661 Total 4661 4661
Asia Japan 157 157 Total 157 157
Western Hemisphere United States 980 980 Total 980 980
Grand Total Exported 5797 5797
sup1 All exports graded as Flaxseed No 1 Canada Western
7 Exports by grade - canola
Country No 1 Canada No 2 Canada Others Total
Asia Bangladesh China PR Israel Japan Nepal Pakistan TurkeyUnited Arab Emirates
944 9157
78 1 9499
124 4983
289 2817
(000rsquos tonnes)
---
109 ----
-----
505 --
944 9157
78 1 9608
124 5488
289 2817
Total
Oceania Australia
3 7891
571
109
-
505
-
3 8504
571 Total
Western Hemisphere Mexico United States
571
8997 6591
-
--
-
--
571
8997 6591
Total
Grand Total Exported
1 5588
5 4050
-
109
-
505
1 5588
5 4664
Canadian Grain Commission wwwgrainscanadagcca 20
Canadian Grain Exports Crop year 2006 - 2007
7 Exports by grade - soybean
Country No 1 Canada No 2 Canada Others Total
Western Europe Belgium Denmark France Ireland ItalyNetherlands NorwayPortugal Spain United Kingdom
----------
(000rsquos tonnes)
1606 302 466 17 31
2405 268 653 132 216
----------
1606 302 466 17 31
2405 268 653 132 216
Total
Africa Egypt
-
-
6098
157
-
-
6098
157 Total
Asia Iran Israel Japan Korea North MalaysiaSyria United Arab Emirates
-
--
68 ----
157
2252 238 108
-605 43 85
-
---
239 ---
157
2252 238 176 239 605 43 85
Total
Western Hemisphere CubaUnited States
68
-186
3331
206 -
239
--
3638
206 186
Total
Grand Total Exported
186
255
206
9792
-
239
392
1 0285
Canadian Grain Commission wwwgrainscanadagcca 21
Canadian Grain Exports Crop year 2006 - 2007
7 Exports by grade - peas
Country All grades combined Total
Western Europe Belgium Denmark Netherlands NorwaySpain
(000rsquos tonnes)
535 216 106
82 1397
535 216 106
82 1397
Total
Africa Algeria
2335
245
2335
245 Total
Asia Bangladesh India Nepal Pakistan United Arab Emirates
245
1901 9407
25 387 110
245
1901 9407
25 387 110
Total
Western Hemisphere Colombia CubaUnited States
1 1830
25 490
02
1 1830
25 490
02 Total
Grand Total Exported
518
1 4928
518
1 4928
Canadian Grain Commission wwwgrainscanadagcca 22
Canadian Grain Exports Crop year 2006 - 2007
7 Exports by grade - corn
Country No2 CE No3 CE Other Total (000rsquos tonnes)
Western Europe Iceland - - 106 106 Total - - 106 106
Africa Algeria - - 219 219 Total - - 219 219
Asia Iran - - 1561 1561 Israel - 45 - 45 Total - 45 1561 1606
Western Hemisphere United States 00sup1 - 03 04 Total 00sup1 - 03 04
Grand Total Exported 00sup1 45 1888 1933
sup1 00 less than 50 tonnes
Note Refer to page 4 for class definitions
Canadian Grain Commission wwwgrainscanadagcca 23
Canadian Grain Exports Crop year 2006 - 2007
8 Exports by port of clearance
Loaded at Wheat Durum Wheat Oats Barley Flaxseed Canola Soybean Peas Corn Total
Prince Rupert
Vancouver
Churchill
Thunder Bay
Queacutebec
Baie-Comeau Ontario elevators
Owen Sound
Prescott
Goderich
Sarnia
Montreal
Port Cartier
Sorel
Trois-Riviegraveres
Halifax
Prairie elevators
4 4285
4 1492
3375
977
1 0333
7501
286
132
20
429
802
3412
9699
2960
05
140
1 4387
1732
6179
742
1715
8374
9920
-
-
-
-
-
3617
3575
872
913
-
6680
-
542
-
2221
-
-
-
-
-
-
-
-
-
20
-
-
1 2740
925
7821
-
506
-
-
-
-
12
-
-
00sup1
-
-
-
-
2501
(000rsquos tonnes)
- 2354
157 4 0969
- 390
4549 3255
- -
- -
- -
- -
02 -
- -
- -
- -
- 243
112 480
- -
- -
978 6973
-
-
-
160
1168
817
1294
-
-
453
-
2158
500
2690
859
-
186
- - 4 9295
1 2530 - 10 9690
656 - 5163
1246 - 1 4628
245 181 2 0300
- 125 1 8363
- - 1580
- - 132
- 00sup1 34
- - 882
- - 802
- 1360 1 0548
- - 1 4017
248 219 7601
- 45 1822
- - 140
02 03 4 4451
16
36
2
5
7
6
1
3
5
2
1
15
Grand total exported 140236 44318 15522 11765 5797 54664 10285 14928 1933 299448 100
sup1 00 less than 50 tonnes
Note Includes exports of Eastern wheat via unlicensed facilities
Canadian Grain Commission wwwgrainscanadagcca 24
Canadian Grain Exports Crop year 2006 - 2007
9 Exports by month and clearance sector
Wheat Durum Wheat Oats Barley Flaxseed Canola Soybean Peas Corn Total
Pacific August2006 September October November December January2007 February March April May June July
8135 5168 6703 6234 7717 5439 5918 8028 7584 9329 8494 7027
376 536
1337 1721 486 498 674 137 594 577 476 499
10 --
05 -
158 308 31
---
30
684 383
1129 1193
820 995
1163 786 650 769 19
155
(000rsquos tonnes)
18 2701 23 4418 08 4767
- 3362 23 2449 16 5131 08 3092 08 4036 14 3657 23 3418 16 2767
- 3525
------------
449 2687 960
1116 1109 964
1229 488
1508 1013
742 265
------------
1 2374 1 3215 1 4904 1 3631 1 2604 1 3200 1 2391 1 3513 1 4009 1 5131 1 2514 1 1500
Total
Churchill August2006 September October November July2007
8 5777
314 997
1350 440 275
7911
-275 467
--
542
-----
8746
-----
157 4 3323
- 390 - -- -- -- -
-
-----
1 2530
-456 200
--
-
-----
15 8985
703 1728 2016
440 275
Total
Thunder Bay August2006 September October November December March2007 April May June July
3375
--
175 193 160
--
365 84
-
742
181 92
216 -
111 -
221 224 95
575
-
158 157 335 594 272 142 113 151
-297
-
-22 29
---
66 44
131 214
- 390
160 258 329 792 597 212 839 191 757 -
- -537 706 593 671 160 211 577 213
-
--
50 -
31 --
79 --
656
156 202 467
53 97
-85 82
105 -
-
----------
5163
913 1595 2080 1870 1428
142 1727 2208
787 1876
Total 977 1715 2221 506 4549 3255 160 1246 - 1 4628
Canadian Grain Commission wwwgrainscanadagcca 25
Canadian Grain Exports Crop year 2006 - 2007
9 Exports by month and clearance sector
Wheat Durum Wheat Oats Barley Flaxseed Canola Soybean Peas Corn Total
Eastern August2006 September October November December January2007 February March April May June July
3987 5979 3375 4196 2839 1444 1619 1304 2771 1786 3404 2875
1697 2337 3610 2548 3235 1512 1430 1153 2607 3053 2669 1419
--
20 ---------
(000rsquos tonnes)
- 00sup1 00sup1 00sup1
- 00sup1 00sup1 09 00sup1 36 04 -
00sup1 00sup1 - -
02 00sup1 05 53 01 00sup1
- 14
69 -
285 ---
243 --
58 68
-
375 599
1120 2793 1830 649 311 239 515 421 642 444
53 115
-326
--------
--
00sup1 -
254 665 278
--
650 82
-
6181 9031 8411 9872 8194 4275 3881 2697 5896 6027 6866 4752
Total
Atlantic January2007 March
3 5580
76 64
2 7271
--
20
--
12 114
- -- -
723
--
9939
--
494
--
1930
--
7 6082
76 64
Total
Prairie August2006 September October November December January2007 February March April May June July
140
496 666
1089 1066 1195 1293 1260 1350 1656 1631 1334 1352
-
504 547 577 533 395 607 462 493 720 379 664 800
-
2209 1765 1481 1375 755
1028 778 960 798 781 407 403
- -
83 25 144 72 261 61 359 103 210 42 389 124 148 53 108 68 178 133 299 45 302 121 22 130
-
886 468 600 579 309 539 523 529 405 756 605 774
-
--
17 10
-11 03 24 15 20 60 27
-
----
01 ----
02 --
-
----------
03 00sup1
140
4203 3662 4085 4024 2905 3991 3226 3532 3904 3912 3497 3508
Total Grand total exported
1 4387
14 0236
6680
4 4318
1 2740
1 5522
2501 978
1 1765 5797
6973
5 4664
186
1 2085
02
1 4928
03
1933
4 4451
29 9448
sup1 00 less than 50 tonnes
Canadian Grain Commission wwwgrainscanadagcca 26
Canadian Grain Exports Crop year 2006 - 2007
10 Exports by class grade and clearance sector
Grade Pacific Churchill Thunder
Bay Eastern Atlantic Prairies Total
Wheat CWRS CPS CWRW Feed CWES CWHWS CE Other CWAD
6 7503 2656 3335 411
-4470
-7400 7911
3094 -
39 16
-227
--
742
(000rsquos tonnes)
774 2 2450 05 119
- 104 - 06
94 142 104 1494
- 1 1066 - 198
1715 2 7271
101 ----
39 ---
1 3941 33 70 68
-265
-11
6680
10 7862 2813 3548
501 236
6600 1 1066
7609 4 4318
Total
Oats No 1 CW No 2 CW CE Other
9 3687
38 503
--
4117
----
2691 6 2851
- -500 -
- 20 1721 -
140
----
2 1067
1 2740 ---
18 4554
1 2778 1004
20 1721
Total
Barley Select Feed CE
542
6673 2072
-
-
---
2221 20
506 -- 00sup1 - 12
-
---
1 2740
201 2300
-
1 5522
7380 4372
12 Total
Flaxseed No 1 CW
8746
157
-
-
506 12
4549 114
-
-
2501
978
1 1765
5797 Total
Canola No 1 Canada No 2 Canada Other
157
4 2710 109 504
-
389 -
01
4549 114
3255 723 - -- -
-
---
978
6973 --
5797
5 4050 109 505
Total
Soybean No 1 Canada No 2 Canada Other
4 3323
---
390
---
3255 723
- 68 160 9632
- 239
-
---
6973
186 --
5 4664
255 9792
239 Total
Peas All grades combined
-
1 2530
-
656
160 9939
1246 494
-
-
186
02
1 0285
1 4928 Total
Corn No 2 CE No 3 CE Other
1 2530
---
656
---
1246 494
- 00sup1 - 45 - 1885
-
---
02
--
03
1 4928
00sup1 45
1888 Total
Grand total exported
-
15 8985
-
5163
- 1930
1 4628 7 6082
-
140
03
4 4451
1933
29 9448 sup1 00 less than 50 tonnes Note Refer to page 4 for class definitions
Canadian Grain Commission wwwgrainscanadagcca 27
Canadian Grain Exports Crop year 2006 - 2007
11 Exports of wheat (including durum) and wheat flour by month and clearance sector
Month Pacific Churchill Thunder
Bay Eastern Atlantic Prairie Total
Wheat Wheat Flour
Total Wheat and
Wheat Flour
August2006
September
October
November
December
January2007
February
March
April
May
June
July
8511
5704
8040
7955
8203
5937
6592
8165
8179
9907
8970
7526
314
1272
1816
440
-
-
-
-
-
-
-
275
(000rsquos tonnes)
181 5684
92 8316
391 6986
193 6744
271 6074
- 2956
- 3048
- 2458
221 5378
588 4839
179 6073
575 4294
-
-
-
-
-
76
-
64
-
-
-
-
1000
1213
1665
1599
1590
1900
1722
1843
2376
2010
1999
2152
1 5690
1 6597
1 8898
1 6931
1 6137
1 0869
1 1362
1 2530
1 6154
1 7343
1 7221
1 4821
254
243
278
291
280
291
226
226
234
250
284
234
1 5944
1 6839
1 9176
1 7222
1 6417
1 1160
1 1588
1 2756
1 6388
1 7594
1 7505
1 5055
Grand total exported 9 3687 4117 2691 6 2851 140 2 1067 18 4554 3090 18 7644
Canadian Grain Commission wwwgrainscanadagcca 28
Canadian Grain Exports Crop year 2006 - 2007
12 Exports of special crops and processed productssup1
Country Beans Buckwheat Canary Seed Chick Peas Lentils Mustard Seed
Western Europe Austria Belgium Denmark Finland France Germany Greece Iceland Ireland Italy Malta Netherlands Norway Portugal Spain Sweden Switzerland United Kingdom
41 1 047
22 -
4 006 2 912 7 651
-1 911
22 539 114
13 999 -
7 978 6 130
206 825
67 966
36 ----
77 ------
155 ----
16
(tonnes)
30 489 5 - 4 751 - -- -
46 1 903 1 141 286
839 471 - -
23 -3 262 7 833
844 -731 895
- -4 615 6 126
13 699 5 629 90 267
- 658 45 4 713
71 9 331
-22
9 301 12 641 11 032
147 22
23 135 -
4 250 -
3 663 30 301
424 671
6 462
25 852 --
492 2 345
15 812 295
--
167 -
5 980 --
79 20
145 1 593
Total Eastern Europe Albania Armenia Azerbaijan Belarus Bosnia-Herzegovina Bulgaria Byelorussia SSR Croatia Czech Republic Estonia Georgia Hungary Latvia Lithuania Macedonia Moldova Montenegro Poland Romania Russia Serbia Slovakia Slovania Ukraine Yugoslavia
137 347
61 --
23 1 624
90 23
2 546 1 584
-98
1 186 -
40 --
468 206
-237
-705 822
-20
284
-------------------------
55 824 33 535
- -- 22 - -- -- 23
21 -- -- 80 - 65 - -- 23 - -- -- -- -- -- -- 25 - -
20 -- -- -- -- 19 - -
111 473
-889
50 --
2 407 -
127 4 413
-956
1 226 --
317 --
519 -
68 23
809 ---
52 780
-------
80 42
--------
571 80 43
-----
Total 9 733 - 41 257 11 804 816
sup1 Source Statistics Canada
Canadian Grain Commission wwwgrainscanadagcca 29
Canadian Grain Exports Crop year 2006 - 2007
12 Exports of special crops and processed productssup1
Processed Productssup3
Country Peas Soybeanssup2 Sunflower Canola Oil Canola Meal (tonnes)
Western Europe Austria 2 3 - - -Belgium 55 353 182 203 45 731 -Denmark 21 601 30 210 - - -Finland - - - - -France 1 057 32 812 24 8 -Germany 878 920 49 63 577 -Greece 220 - - - -Iceland - - - - -Ireland 68 1 749 - - -Italy 7 587 874 23 - -Malta 69 - - - -Netherlands 11 949 316 202 - 85 930 -Norway 8 181 26 840 84 - -Portugal 1 263 65 503 80 67 -Spain 169 357 8 693 68 49 -Sweden - - 141 - -Switzerland 20 - - 20 -United Kingdom 4 881 - - - -Total 282 486 666 009 514 150 382 -
Eastern Europe Albania - - - - -Armenia 68 - - - -Azerbaijan - - - - -Belarus - - - - -Bosnia-Herzegovina - - - - -Bulgaria - - - - -Byelorussia SSR - - - - -Croatia 15 - 21 - -Czech Republic 91 325 - 79 -Estonia 1 268 - - - -Georgia 355 - - - -Hungary 904 20 - - -Latvia - - 68 - -Lithuania - 40 - - -Macedonia - - - - -Moldova - - - 70 -Montenegro - - - - -Poland 216 810 - - -Romania - 678 22 - -Russia 3 999 1 199 - - -Serbia - - - - -Slovakia - 103 - - -Slovania - - 1 - -Ukraine - 157 - - -Yugoslavia - - - - -Total 6 916 3 332 112 149 -sup1 Source Statistics Canada sup2 September-August crop year sup3 Refers to weight of processed product Conversion rates to grain equivalents Barley malt ndash 1339 Canola oil ndash 2387 Canola meal ndash 1607 Exports of barley malt were 621 thousand tonnes (558 thousand in 2005-2006) Country of destination not available due to confidentiality
Canadian Grain Commission wwwgrainscanadagcca 30
Canadian Grain Exports Crop year 2006 - 2007
12 Exports of special crops and processed productssup1
Country Beans Buckwheat Canary Seed Chick Peas Lentils Mustard Seed
Africa Algeria Angola Benin British Indian Ocean Terr Burundi Cameroon Cape Verde Central African Republic Chad Comoros Congo Cocircte-drsquoIvoire Djibouti Egypt Ethiopia Gambia Ghana Guinea Kenya Liberia Madagascar Malawi Mauritania Mauritius Morocco Mozambique Namibia Niger Rwanda Senegal Sierra Leone South Africa St Helena Swaziland Tanzania Togo Tunisia Uganda Zaire Zambia Zimbabwe
672 16 658
-18
-505 50
---
645 88
-2 814
----------
516 -
75 ----
867 ------
521 --
-----------------------------------------
(tonnes)
1 609 4 410 - -- -- -- -- -- -- -- -- -- -- 5 - -
1 021 2 373 - -- -- -- -- -- -- -- -- -1 20
660 -- -- -- -- -- -- -
479 163 - -- -- -- -- 720 - -- -- -- -
69 735 268
-14
--------
200 29 206
----
175 60
--
100 1 264
28 577 ----
850 -
3 350 ----
528 ----
-----------------------
68 326
----
1 466 -
267 ---------
Total 23 409 - 3 770 7 691 134 327 2 127
sup1 Source Statistics Canada
Canadian Grain Commission wwwgrainscanadagcca 31
Canadian Grain Exports Crop year 2006 - 2007
12 Exports of special crops and processed productssup1
Processed Productssup3
Country Peas Soybeanssup2 Sunflower Canola Oil Canola Meal (tonnes)
Africa Algeria 6 484 - 1 210 - -Angola - - - - -Benin 475 - - - -British Indian Ocean Terr 16 - - - -Burundi 1 783 - - - -Cameroon - 204 - - -Cape Verde 125 - - - -Central African Republic 200 - - - -Chad 500 - - - -Comoros - - - 80 -Congo 8 - - - -Cocircte-drsquoIvoire 800 - - - -Djibouti - - - - -Egypt 5 984 42 723 526 - -Ethiopia 3 150 - - - -Gambia 291 - - - -Ghana 100 - - - -Guinea 350 - - - -Kenya 12 025 - - - -Liberia 1 050 - - - -Madagascar 836 - - - -Malawi 50 255 - - -Mauritania 620 - - - -Mauritius 591 187 18 - -Morocco 3 648 137 - - -Mozambique 450 - - - -Namibia - - - - -Niger 175 - - - -Rwanda 625 - - - -Senegal 297 - - - -Sierra Leone 1 125 - - - -South Africa 12 709 68 - - -St Helena - 41 - - -Swaziland 70 156 - - -Tanzania 4 350 - - - -Togo 25 - - - -Tunisia - - - - -Uganda 2 625 - - - -Zaire 4 225 - - - -Zambia 400 - - - -Zimbabwe 450 - - - -
Total 66 612 43 771 1 754 80 -sup1 Source Statistics Canada sup2 September-August crop year sup3 Refers to weight of processed product Conversion rates to grain equivalents Barley malt ndash 1339 Canola oil ndash 2387 Canola meal ndash 1607 Exports of barley malt were 621 thousand tonnes (558 thousand in 2005-2006) Country of destination not available due to confidentiality
Canadian Grain Commission wwwgrainscanadagcca 32
Canadian Grain Exports Crop year 2006 - 2007
12 Exports of special crops and processed productssup1
Country Beans Buckwheat Canary Seed Chick Peas Lentils Mustard Seed
Asia Afghanistan Bahrain Bangladesh Bhutan Brunei Darussalam Cambodia China PR Cyprus East Timor Hong Kong India Indonesia Iran Israel Japan Jordan Korea North Korea South Kuwait Lebanon Macau Malaysia Mongolia Nepal Oman Pakistan Philippines Qatar Saudi Arabia Singapore Somalia Sri Lanka Sudan Syrian Arab Rep Taiwan Thailand Turkey United Arab Emirates Vietnam Yemen
-------
11 599 16 69 23
-1 401
21 977 -
1 860 4 485
59 467
-256
---
40 269 50
2 415 40
----
4 348 -
175 568
--
--------------
2 031 -------3 -----------------
(tonnes)
- -- -- 1 305 - -- -
22 -128 -176 91
- -5 9
22 12 903 1 434 44
- -345 2 056
1 339 336 86 15 467
- -111 -
43 270 279 3 569
- -- -- -- -- -- 17 108
334 23 - 49
83 6 183 - -- -- -- -- -
830 -22 -
235 -151 3 607
- -- -
1 595
40 320 ---
967 1 054
-30
130 075 197
9 604 6 085
318 1 384
--
291 3 599
----
199 61 096
-343
2 962 1 618
-19 022
500 113 22
-31 125 81 544
-99
--
3 899 ---
50 ---
4 172 --
65 6 386
--
2 699 ---
33 ----
56 ----
467 --
41 3 610
125 165
--
Total 39 128 2 034 5 645 63 020 393 163 21 768
sup1 Source Statistics Canada
Canadian Grain Commission wwwgrainscanadagcca 33
Canadian Grain Exports Crop year 2006 - 2007
12 Exports of special crops and processed productssup1
Processed Productssup3
Country Peas Soybeanssup2 Sunflower Canola Oil Canola Meal (tonnes)
Asia Afghanistan - - - - -Bahrain 973 - 96 43 -Bangladesh 110 049 - - - -Bhutan 86 - - - -Brunei Darussalam - 142 - - -Cambodia 249 - - - -China PR 251 442 2 400 - 263 814 407 Cyprus - - - - -East Timor - - - - -Hong Kong 2 30 126 7 25 289 -India 895 514 - 146 31 -Indonesia 12 907 522 - 8 -Iran 5 602 244 428 - - -Israel 4 494 25 152 63 12 -Japan 10 924 276 542 124 19 631 315 Jordan 812 80 136 - -Korea North 64 - 74 - -Korea South 563 60 - 35 567 -Kuwait 413 - 476 761 -Lebanon 528 - 262 70 -Macau - 20 - - -Malaysia 2 880 136 409 23 26 096 -Mongolia - - - - -Nepal 5 455 - - - -Oman 214 - - 14 -Pakistan 45 122 - 45 - -Philippines 13 477 12 975 47 635 10 530 Qatar 311 - 48 14 -Saudi Arabia 8 025 869 325 14 -Singapore 1 749 42 834 - 162 -Somalia 2 950 - - - -Sri Lanka 1 701 - - - -Sudan 3 450 - - - -Syrian Arab Rep - 4 303 2 429 - -Taiwan 11 590 8 168 - 26 952 7 033 Thailand 8 982 20 740 - 3 -Turkey 680 21 020 353 - -United Arab Emirates 38 481 134 12 694 531 -Vietnam 45 241 - 217 -Yemen 6 232 43 - - -
Total 1 445 966 827 208 17 348 399 864 18 285
sup1 Source Statistics Canada sup2 September-August crop year sup3 Refers to weight of processed product Conversion rates to grain equivalents Barley malt ndash 1339 Canola oil ndash 2387 Canola meal ndash 1607 Exports of barley malt were 621 thousand tonnes (558 thousand in 2005-2006) Country of destination not available due to confidentiality
Canadian Grain Commission wwwgrainscanadagcca 34
Canadian Grain Exports Crop year 2006 - 2007
12 Exports of special crops and processed productssup1
Country Beans Buckwheat Canary Seed Chick Peas Lentils Mustard Seed (tonnes)
Oceania Australia 3 807 - 211 - 1 366 1 062 Cocos Islands - - - - - -Fiji - - - - - -New Zealand 1 814 - 391 22 228 3 US Outlying Islands - - - 45 - -
Total 5 621 - 602 67 1 594 1 065
Processed Productssup3
Country Peas Soybeanssup2 Sunflower Canola Oil Canola Meal (tonnes)
Oceania Australia 1 094 42 179 3 -Cocos Islands 119 - - - -Fiji 90 - - 30 -New Zealand 158 571 - 208 -US Outlying Islands - - - - -
Total 1 461 613 179 241 -
sup1 Source Statistics Canada sup2 September-August crop year sup3 Refers to weight of processed product Conversion rates to grain equivalents Barley malt ndash 1339 Canola oil ndash 2387 Canola meal ndash 1607 Exports of barley malt were 621 thousand tonnes (558 thousand in 2005-2006) Country of destination not available due to confidentiality
Canadian Grain Commission wwwgrainscanadagcca 35
Canadian Grain Exports Crop year 2006 - 2007
12 Exports of special crops and processed productssup1
Country Beans Buckwheat Canary Seed Chick Peas Lentils Mustard Seed
Western Hemisphere Antigua-Barbuda Argentina Aruba Barbados Belize Bermuda Bolivia Brazil British Virgin Islands Chile Colombia Costa Rica Cuba Dominica Dominican Republic Ecuador El Salvador Grenada Guatemala Guyana Haiti Honduras Jamaica Mexico Netherlands Antilles Nicaragua Panama Paraguay Peru St Kitts-Nevis St Vincent Gren Ste Lucie Surinam Trinidad-Tobago United States Uruguay Venezuela
7 -4 3
137 ----
256 45
643 510 60
12 714 43 67 29
1 514 1
6 202 -
1 736 4 189
3 -
426 --5 3
18 15
489 102 440
-2 375
---------------------------------1
1 537 --
(tonnes)
- -- 5 - -8 6 - -- -- -
21 558 106 - -
4 871 140 11 276 3 550
581 127 390 106
- -746 149
1 235 203 371 -
- -1 746 33
- 181 - -
22 -- -
42 583 -- -- -
75 14 - -
7 012 163 - -- -- -
32 27 172 659
13 062 5 112 116 -
6 186 45
5 1 822
1 68
--
1 323 10 965
-16 866 54 177
686 -
110 176
18 440 -
79 74
---
23 31 513
--
8 765 58
20 825 5
16 45
-1 325 6 361 2 451
23 015
-103
--1 --
569 -
285 74 16
---
203 200
-150
----
20 ----
296 ----
34 71 359
40 1 025
Total
Grand total exported
133 934
349 172
1 538
3 856
112 042 10 626
177 924 115 196
199 194
851 555
74 375
152 931
sup1 Source Statistics Canada
Canadian Grain Commission wwwgrainscanadagcca 36
Canadian Grain Exports Crop year 2006 - 2007
12 Exports of special crops and processed productssup1
Processed Productssup3
Country Peas Soybeanssup2 Sunflower Canola Oil Canola Meal (tonnes)
Western Hemisphere Antigua-Barbuda 9 - - - -Argentina - - - - -Aruba 3 - - - -Barbados 215 1 14 2 -Belize 71 - - - -Bermuda - - - 219 -Bolivia - - - - -Brazil 10 049 - - - -British Virgin Islands - 4 - - -Chile 5 053 - 84 22 -Colombia 34 159 - 312 3 342 -Costa Rica 604 - 421 24 -Cuba 26 968 39 2 - -Dominica 21 - - 1 -Dominican Republic 398 23 161 - -Ecuador 3 106 - - - -El Salvador - - 69 - -Grenada 150 - - - -Guatemala 45 - 539 9 -Guyana 2 947 - - - -Haiti - - - - -Honduras - - 165 - -Jamaica - 625 - - -Mexico 9 331 69 2 289 31 661 5 798 Netherlands Antilles - - - - -Nicaragua 875 - - - -Panama 1 327 186 229 - -Paraguay 8 - - - -Peru 13 338 - - 33 -St Kitts-Nevis 5 - - - -St Vincent Gren - 1 - - -Ste Lucie 20 1 - - -Surinam 802 125 22 8 -Trinidad-Tobago 5 448 215 89 82 -United States 34 482 198 369 96 576 719 403 1 458 082 Uruguay 15 - - - -Venezuela 16 259 - 108 - -
Total 165 708 199 658 101 080 754 806 1 463 880
Grand total exported 1 969 149 1 740 591 120 987 1 305 522 1 482 165
sup1 Source Statistics Canada sup2 September-August crop year sup3 Refers to weight of processed product Conversion rates to grain equivalents Barley malt ndash 1339 Canola oil ndash 2387 Canola meal ndash 1607 Exports of barley malt were 621 thousand tonnes (558 thousand in 2005-2006) Country of destination not available due to confidentiality
Canadian Grain Commission wwwgrainscanadagcca 37
Canadian Grain Exports Crop year 2006 - 2007
13 Ocean freight rates
From
To Japan
North Pacificsup1
Korea South China PR
St Lawrencesup1
Iran
August 2006
September
October
November
December
January 2007
February
March
April
May
June
July
3220
3650
3780
4100
4100
3960
3675
3975
4100
4520
4150
5200
($ US per short tonne)
3120 na
3550 na
3900 na
4300 na
4200 na
4080 na
3825 na
4075 na
4200 na
4620 na
4250 na
5300 na
4640
4800
4900
4825
5000
5120
4950
5225
5375
5940
6000
6700
Average 4036 4118 na 5290
sup1 Rates are calculated for heavy grains on largest sized vessel (type B-vessel size = over 35 000 tonnes) in most general use appropriate to specified route ready to load in three to four weeks time
Source International Grain Council
Canadian Grain Commission wwwgrainscanadagcca 38
Canadian Grain Exports Crop year 2006 - 2007
14 Estimated costs of moving wheat from a mid-prairie point to export position
Crop Year 200102 200203 200304 200405 200506 200607p
Primary Elevator Costs Elevation (1) Removal of dockage Shrinkage Carrying charges (2)
Railway Freight Via Thunder Bay Via Vancouver
Marketing (3)
Terminal Elevator Costs Storage (4) Fobbing charges - via St Lawrence ports (5) - via Pacific seaboard (5)
Lake Transportation (6)
Transfer Elevator Costs Storage Fobbing charges (7)
1118 368 022 245
3443 3378
-225
094
823 842
1917
192 230
1163 383 025 353
3343 3377
-008
167
873 890
1893
347 231
$tonne
1190 1190 440 440
- -196 186
3326 3402 3445 3471
277 083
102 148
903 926 920 936
1892 1928
173 362 232 232
1220 450
-230
3436 3506
315
130
954 982
1991
341 231
1251 462
-209
3805 3809
494
128
978 1006
2185
345 232
Total - via St Lawrence ports - via Pacific seaboard
8227 5842
8770 6350
8731 8897 6570 6454
9298 6833
10089 7359
P - Preliminary
Mid-Prairie point being Brass Saskatchewan
(1) Filed tariff for receiving elevating and loading
(2) Carrying charges on wheat stored in country elevators
(3) Includes interest bank and other charges and Canadian Wheat Board administrative costs interest and depreciation on CWB hopper cars drying additional freight and demurragedespatch
(4) Storage charges on wheat stored in terminal elevators
(5) Thunder Bay and Pacific fobbing charge which includes elevation outward weighing and inspection terminal elevator receipt cancellation lake shippersrsquo charges superintendence and forwarding brokerage charges
(6) Includes elevation outward weighing and inspection terminal elevator receipt cancellation BC Shippersrsquo charges superintendence wharfage and forwarding brokerage charges
(7) Includes lake freight lake brokerage cargo rates insurance St Lawrence Seaway and Welland Canal tolls and inward elevation into transfer elevator
Canadian Grain Commission wwwgrainscanadagcca 39

Canadian Grain Exports Crop year 2006 - 2007
4 Exports by country of destination ndash wheat durum wheat and wheat flour
Country Wheat Durum wheat Wheat flour Total
Western Hemisphere Anguilla Argentina Aruba Bahamas Barbados Bermuda Brazil British Virgin Islands Caribbean Cayman Islands Chile Colombia Costa Rica CubaDominican Republic Ecuador Grenada Guatemala Guyana Honduras Mexico Netherlands Antilles Nicaragua Peru Puerto Rico St Kitts-Nevis St Pierre and MiquelonSt Vincent Ste Lucia Trinidad amp Tobago Turks amp Caicos Islands United States Uruguay Venezuela
------
1804 -
1523 -
368 4004
-893 108
2747 -
471 513
-1 2212
--
3575 800
------
1 2180 -
4563
(000rsquos tonnes)
--------
159 -
609 166
-96
-172
-51
--
74 --
583 -------
6358 -
4685
01 00sup101 58
00sup1 19 13 05
-00sup1
--
01 -
01 -
00sup1 --
00sup1 -
13 00sup1
--
00sup1 01 12
00sup1 00sup1 04
2341 00sup1
-
01 00sup1 01 58
00sup1 19
1816 05
1682 00sup1 978
4170 01
989 109
2918 00sup1 521 513 00sup1
1 2286 13
00sup1 4158
800 00sup1 01 12
00sup1 00sup1 04
2 0879 00sup1
9248 Total
Grand Total Exported
4 5761
14 0236
1 2953
4 4318
2471
3090
6 1185
18 7644
sup1 00 less than 50 tonnes Wheat flour is reported in terms of wheat equivalent ndash 1 tonne wheat = 0750 tonnes wheat flour Wheat flour = wheat and durum combined
Note Includes exports of Eastern wheat via unlicensed facilities
Canadian Grain Commission wwwgrainscanadagcca 7
Canadian Grain Exports Crop year 2006 - 2007
4 Exports by country of destination ndash oats barley flaxseed canola soybean peas and corn
Country Oats Barley Flaxseed Canola Soybean Peas Corn Total
Western Europe Belgium Denmark France Iceland Ireland Italy Netherlands Norway Portugal Spain United Kingdom
-------
367 ---
-----------
(000rsquos tonnes)
4661 -- -- -- -- -- -- -- -- -- -- -
1606 302 466
-17 31
2405 268 653 132 216
535 216
----
106 82
-1397
-
---
106 -------
6802 518 466 106 17 31
2511 718 653
1529 216
Total
Eastern Europe Czech Republic
367
-
-
00sup1
4661 -
- -
6098
-
2335
-
106
-
1 3566
00sup1 Total
Africa Algeria Egypt South Africa
-
--
133
00sup1
--
506
- -
- -- -- -
-
-157
-
-
245 --
-
219 --
00sup1
464 157 639
Total
Asia Bangladesh China PR India Iran Israel Japan Korea North Malaysia Nepal Pakistan Syria Turkey United Arab Emirates Vietnam
133
-----
114 --------
506
-3946
---
3127 -------
130
- -
- 944 - 9157 - -- -- 78
157 1 9608 - -- -- 124 - 5488 - -- 289 - 2817 - -
157
---
2252 238 176 239 605
--
43 -
85 -
245
1901 -
9407 -----
25 387
--
110 -
219
---
1561 45
---------
1260
2845 1 3103
9407 3813 361
2 3182 239 605 149
5875 43
289 3012
130 Total 114 7203 157 3 8504 3638 1 1830 1606 6 3052
sup1 00 less than 50 tonnes
Canadian Grain Commission wwwgrainscanadagcca 8
Canadian Grain Exports Crop year 2006 - 2007
4 Exports by country of destination ndash oats barley flaxseed canola soybean peas and corn
Country Oats Barley Flaxseed Canola Soybean Peas Corn Total (000rsquos tonnes)
Oceania Australia - - - 571 - - - 571 Total - - - 571 - - - 571
Western Hemisphere Colombia - 826 - - - 25 - 852 Cuba - - - - 206 490 - 696 Ecuador 139 176 - - - - - 315 Mexico 358 197 - 8997 - - - 9552 Peru - 133 - - - - - 133 Puerto Rico 20 - - - - - - 20 United States 1 4392 2723 980 6591 186 02 04 2 4878 Total 1 4908 4055 980 1 5588 392 518 04 3 6445
Grand Total Exported 1 5522 1 1765 5797 5 4664 1 0285 1 4928 1933 11 4894
Canadian Grain Commission wwwgrainscanadagcca 9
Canadian Grain Exports Crop year 2006 - 2007
5 Exports by clearance sector - wheat
Country Pacific Churchill Thunder Bay Eastern Atlantic Prairie Total
Western Europe Belgium GermanyIceland Ireland Italy Netherlands NorwayPortugal Spain Switzerland United Kingdom
-----------
109 -------
698 --
(000rsquos tonnes)
- 243 - 01 - 11 - 62
462 2613 - 150 - 00sup1 - 02 - 612 - 16
60 4314
-----------
-----------
352 01 11 62
3074 150 00sup1 02
1310 16
4374 Total
Eastern Europe Czech Republic
-
-
807
-
522 8024
- 00sup1
-
-
-
-
9353
00sup1 Total
Africa Burundi Cameroon Congo Djibouti Egypt Ethiopia Ghana Libya Mali Mauritania Mozambique Namibia Nigeria Somalia South Africa Sudan Tanzania Togo Tunisia West Africa
-
30 --------------
2879 320
---
-
------
292 --------
440 270
---
- 00sup1
- -- 136 - 196 - 174 - 5457 - 178 - 840 - 01 - 06 - 178 - 265 - 66 - 1545 - 22 - 1059 - 1547 - -- 60 - 07 - 1890
-
--------------------
-
--------------------
00sup1
30 136 196 174
5457 178
1131 01 06
178 265 66
1545 22
1059 4867
590 60 07
1890 Total 3229 1002 - 1 3625 - - 1 7856
sup1 00 less than 50 tonnes
Canadian Grain Commission wwwgrainscanadagcca 10
Canadian Grain Exports Crop year 2006 - 2007
5 Exports by clearance sector - wheat
Country Pacific Churchill Thunder Bay Eastern Atlantic Prairie Total
Asia Bangladesh China PR India Indonesia Iraq Japan Korea South MalaysiaPhilippines Singapore Sri Lanka Taiwan Thailand United Arab Emirates Vietnam Yemen
3086 441
7884 1 5428
6211 9088 1104 1364 3595 362
9237 63
2455 1517 2583
-
----------------
(000rsquos tonnes)
- -- -- 2624 - -- -- -- -- -- -- -- -- -- -- -- -- 62
----------------
----------------
3086 441
1 0508 1 5428
6211 9088 1104 1364 3595 362
9237 63
2455 1517 2583
62 Total
Oceania New Zealand
6 4417
163
-
-
- 2686
- -
-
-
-
-
6 7103
163 Total
Western Hemisphere Brazil Caribbean Chile ColombiaCuba Dominican Republic Ecuador Guatemala Guyana Mexico Peru Puerto Rico United States Venezuela
163
--
368 3665
--
2747 470
-6983 3575
-159
-
-
275 --------
1292 ----
- -
- 1529 - -- -- 339 - 893 - 108 - -- -- 372 - 1951 - -
180 535 - 1318
275 4200
-
--------
140 -----
-
-1523
-------
1987 -
86 1 0703
89
163
1804 1523 368
4004 893 108
2747 470 513
1 2212 3575 800
1 2180 4563
Total
Grand Total Exported
1 7967
8 5777
1567
3375
455 1 1244
977 3 5580
140
140
1 4387
1 4387
4 5761
14 0236
Canadian Grain Commission wwwgrainscanadagcca 11
Canadian Grain Exports Crop year 2006 - 2007
5 Exports by clearance sector ndash durum wheat
Country Pacific Churchill Thunder Bay Eastern Prairie Total
Western Europe Belgium ItalyNetherlands Portugal Switzerland
-----
219 ----
(000rsquos tonnes)
-268 447
--
1915 5899 1723 267 15
-----
2134 6166 2170 267 15
Total
Eastern Europe Czech Republic
-
-
219
-
715
-
9817
00sup1
-
-
1 0751
00sup1
Total
Africa AlgeriaLibyaMorocco South Africa Tunisia
-
----
270
-
--
275 -
248
-
--
761 --
00sup1
6595 1152 4283 155 816
-
-----
00sup1
6595 1152 5319
155 1334
Total
Asia India Indonesia Japan Singapore Sri Lanka United Arab Emirates
270
1990 168
2469 04
883 546
523
------
761
------
1 3000
------
-
------
1 4554
1990 168
2469 04
883 546
Total
Western Hemisphere Caribbean Chile Colombia Cuba Ecuador Guatemala Mexico Peru United States Venezuela
6060
-609 166
-172 51
-583
--
-
----------
-
---------
239
-
---
96 -----
4357
-
159 -----
74 -
6358 89
6060
159 609 166 96
172 51 74
583 6358 4685
Total
Grand Total Exported
1581
7911
-
742
239
1715
4454
2 7271
6680
6680
1 2953
4 4318
sup1 00 less than 50 tonnes
Canadian Grain Commission wwwgrainscanadagcca 12
Canadian Grain Exports Crop Year 2006 - 2007
5 Exports by clearance sector - oats
Country Pacific Churchill Thunder Bay Eastern Prairies Total
Western Europe Norway - -
(000rsquos tonnes)
367 - - 367 Total
Africa South Africa
-
-
-
-
367
133
-
-
-
-
367
133 Total
Asia Japan
-
114
-
-
133
-
-
-
-
-
133
114 Total
Western Hemisphere Ecuador Mexico Puerto Rico United States
114
139 289
--
-
----
-
---
1721
-
--
20 -
-
-69
-1 2671
114
139 358
20 1 4392
Total
Grand Total Exported
428
542
-
-
1721
2221
20
20
1 2740
1 2740
1 4908
1 5522
5 Exports by clearance sector - barley
Country Pacific Churchill Thunder Bay Eastern Prairies Total
Eastern Europe Czech Republic - -
(000rsquos tonnes)
- 00sup1 - 00sup1
Total
Africa South Africa
-
506
-
-
-
-
00sup1
-
-
-
00sup1
506 Total
Asia China PR Japan Vietnam
506
3946 3127 130
-
---
-
---
-
---
-
---
506
3946 3127 130
Total
Western Hemisphere Colombia Ecuador Mexico Peru United States
7203
728 176
-133
-
-
-----
-
----
506
-
----
12
-
99 -
197 -
2205
7203
826 176 197 133
2723 Total
Grand Total Exported
1037
8746
-
-
506
506
12
12
2501
2501
4055
1 1765
sup1 00 less than 50 tonnes
Canadian Grain Commission wwwgrainscanadagcca 13
Canadian Grain Exports Crop year 2006 - 2007
5 Exports by clearance sector ndash flaxseed
Country Pacific Churchill Thunder Bay Eastern Prairie Total (000rsquos tonnes)
Western Europe Belgium - - 4549 112 - 4661 Total - - 4549 112 - 4661
Asia Japan 157 - - - - 157 Total 157 - - - - 157
Western Hemisphere United States - - - 02 978 980 Total - - - 02 978 980
Grand Total Exported 157 - 4549 114 978 5797
5 Exports by clearance sector ndash canola
Country Pacific Churchill Thunder Bay Eastern Prairie Total
Asia Bangladesh China PR Israel Japan Nepal Pakistan TurkeyUnited Arab Emirates
944 9157
-1 9608
124 5098
-2817
-----
390 --
(000rsquos tonnes)
--
78 ---
234 -
------
55 -
--------
944 9157
78 1 9608
124 5488 289
2817
Total
Oceania Australia
3 7748
571
390
-
312
-
55
-
-
-
3 8504
571 Total
Western Hemisphere Mexico United States
571
5005 -
-
--
-
2941 02
-
667 -
-
384 6589
571
8997 6591
Total
Grand Total Exported
5005
4 3323
-
390
2943
3255
667
723
6973
6973
1 5588
5 4664
Canadian Grain Commission wwwgrainscanadagcca 14
Canadian Grain Exports Crop year 2006 - 2007
5 Exports by clearance sector ndash soybean
Country Pacific Churchill Thunder Bay Eastern Prairie Total
Western Europe Belgium Denmark France Ireland ItalyNetherlands NorwayPortugal Spain United Kingdom
----------
----------
(000rsquos tonnes)
160 ---------
1446 302 466 17 31
2405 268 653 132 216
----------
1606 302 466 17 31
2405 268 653 132 216
Total
Africa Egypt
-
-
-
-
160
-
5938
157
-
-
6098
157 Total
Asia Iran Israel Japan Korea North Malaysia Syria United Arab Emirates
-
-------
-
-------
-
-------
157
2252 238 176 239 605 43 85
-
-------
157
2252 238 176 239 605 43 85
Total
Western Hemisphere Cuba United States
-
--
-
--
-
--
3638
206 -
-
-186
3638
206 186
Total
Grand Total Exported
-
-
-
-
-
160
206
9939
186
186
392
1 0285
Canadian Grain Commission wwwgrainscanadagcca 15
Canadian Grain Exports Crop year 2006 - 2007
5 Exports by clearance sector ndash peas
Country Pacific Churchill Thunder Bay Eastern Prairie Total
Western Europe Belgium Denmark Netherlands NorwaySpain
----
185
----
656
(000rsquos tonnes)
535 135
-82
494
-81
106 -
62
-----
535 216 106 82
1397 Total
Africa Algeria
185
-
656
-
1246
-
248
245
-
-
2335
245 Total
Asia Bangladesh India Nepal Pakistan United Arab Emirates
-
1901 9407
25 387 110
-
-----
-
-----
245
-----
-
-----
245
1901 9407
25 387 110
Total
Western Hemisphere Colombia Cuba United States
1 1830
25 490
-
-
---
-
---
-
---
-
--
02
1 1830
25 490
02 Total
Grand Total Exported
515
1 2530
-
656
-
1246
-
494
02
02
518
1 4928
5 Exports by clearance sector ndash corn
Country Pacific Churchill Thunder Bay Eastern Prairie Total (000rsquos tonnes)
Western Europe Iceland - - - 106 - 106 Total - - - 106 - 106
Africa Algeria - - - 219 - 219 Total - - - 219 - 219
Asia Iran - - - 1561 - 1561 Israel - - - 45 - 45 Total - - - 1606 - 1606
Western Hemisphere United States - - - 00sup1 03 04 Total - - - 00sup1 03 04
Grand Total Exported - - - 1930 03 1933 sup1 00 less than 50 tonnes
Canadian Grain Commission wwwgrainscanadagcca 16
Canadian Grain Exports Crop year 2006 - 2007
6 Exports by class - wheat
Country CWRS CPS CWRW Feed CWES CWHWS CE Other CWAD Total
Western Europe Belgium Germany Iceland Ireland Italy Netherlands Norway Portugal Spain Switzerland United Kingdom
351 01 11 62
2833 141 00sup1
-863 16
4318
----------
40
----
02 -----
11
-------
02 --
04
(000rsquoS tonnes)
- 00sup1 - -- -- -
236 03 - 01 - -- -- -- -- 01
-----
08 --
448 --
-----------
2134 ---
6166 2170
-267
-15
-
2486 01 11 62
9241 2320
00sup1 269
1310 30
4374
Total
Eastern Europe Czech Republic
8596
00sup1
40
-
13
-
06
-
236 06
- -
455
-
-
-
1 0751
00sup1
2 0104
00sup1
Total
Africa Algeria Burundi Cameroon Congo Djibouti Egypt Ethiopia Ghana Libya Mali Mauritania Morocco Mozambique Namibia Nigeria Somalia South Africa Sudan Tanzania Togo Tunisia West Africa
00sup1
-30
136 80
---
999 -
06 05
-265 66
1384 22
809 4428 590 60 07
1820
-
---------------------
40
-
------
22 77
-------------
30
-
----------------------
- -
- -- -- -- 116 - -- -- -- -- 01 - -- -- -- -- -- 95 - -- 249 - 319 - -- -- -- -
-
----
174 5457 156 55
--
173 ------
119 ----
-
--------------
66 -------
00sup1
6595 -------
1152 --
5319 ----
155 ---
1334 -
00sup1
6595 30
136 196 174
5457 178
1131 1152
06 178
5319 265
66 1545
22 1213 4867
590 60
1341 1890
Total 1 0708 40 129 - - 779 6133 66 1 4554 3 2410
sup1 00 less than 50 tonnes
Note Refer to page 4 for class definitions
Canadian Grain Commission wwwgrainscanadagcca 17
Canadian Grain Exports Crop year 2006 - 2007
6 Exports by class - wheat
Country CWRS CPS CWRW Feed CWES CWHWS CE Other CWAD Total
Asia Bangladesh China PR India Indonesia Iraq Japan Korea South Malaysia Philippines Singapore Sri Lanka Taiwan Thailand United Arab Emirates Vietnam Yemen
3086 441
4374 1 3249
6211 867 7 1104 1199 2932 180 852 63
1928 1410 1682
-
--
1514 545
---
30 --
303 -
10 ---
--
1996 392
---
05 --
477 -
80 ---
(000rsquoS tonnes)
- - -- - -- - -- - 1243 - - -
411 - -- - -- - 129 - - 664 - - 182 - - 980 - - -- - 438 - - 107 - - 126 - - -
--
2624 ------------
62
----------
6625 ---
775 -
--
1990 168
-2469
---
04 883
--
546 --
3086 441
1 2498 1 5596
6211 1 1557
1104 1364 3595 366
1 0120 63
2455 2063 2583
62
Total
Oceania New Zealand
4 7387
163
2402
-
2950
-
411 - 3868
- - -
2686
-
7400
-
6060
-
7 3163
163
Total
Western Hemisphere Brazil Caribbean Chile Colombia Cuba Dominican Republic Ecuador Guatemala Guyana Mexico Peru Puerto Rico United States Venezuela
163
1690 1523 368
3866 893 59
2747 470 366
1 0493 3327 271
1 0415 4519
-
---------
255 --
33 44
-
---
138 ------
248 -
70 -
- - -
- - 114 - - -- - -- - -- - -- - -- - -- - -- - 137
16 - 1104 - - -- - 327
68 - 265 - - -
-
-----
49 --
10 344
-202
1186 -
-
------------
143 -
-
-159 609 166
96 -
172 51
-74
583 -
6358 4685
163
1804 1682
978 4170
989 108
2918 521 513
1 2286 4158 800
1 8539 9248
Total
Grand Total Exported
4 1008
10 7862
331
2813
456
3548
83 - 1948
501 236 6600
1792
1 1066
143
7609
1 2953
4 4318
5 8714
18 4554
Note Refer to page 4 for class definitions
Canadian Grain Commission wwwgrainscanadagcca 18
Canadian Grain Exports Crop year 2006 - 2007
7 Exports by grade - oats
Country No 1 CW No 2 CW CE Other Total
Western Europe Norway - 367
(000rsquos tonnes)
- - 367 Total
Africa South Africa
-
-
367
133
-
-
-
-
367
133 Total
Asia Japan
-
38
133
75
-
-
-
-
133
114 Total
Western Hemisphere Ecuador Mexico Puerto Rico United States
38
-69
-1 2671
75
139 289
--
-
--
20 -
-
---
1721
114
139 358 20
1 4392 Total
Grand Total Exported
1 2740
1 2778
428
1004
20
20
1721
1721
1 4908
1 5522
7 Exports by grade - barley
Country Select Feed CE Total
Eastern Europe Czech Republic 00sup1
(000rsquos tonnes)
- - 00sup1
Total
Africa South Africa
00sup1
-
-
506
-
-
00sup1
506 Total
Asia China PR Japan Vietnam
-
3308 2811
-
506
639 316 130
-
---
506
3946 3127
130 Total
Western Hemisphere ColombiaEcuador Mexico Peru United States
6118
654 ---
608
1085
173 176 197 133
2103
-
----
12
7203
826 176 197 133
2723 Total
Grand Total Exported
1262
7380
2782
4372
12
12
4055
1 1765 sup1 00 less than 50 tonnes Note Refer to page 4 for class definitions
Canadian Grain Commission wwwgrainscanadagcca 19
Canadian Grain Exports Crop year 2006 - 2007
7 Exports by grade - flaxseedsup1
Country No 1 CW Total (000rsquos tonnes)
Western Europe Belgium 4661 4661 Total 4661 4661
Asia Japan 157 157 Total 157 157
Western Hemisphere United States 980 980 Total 980 980
Grand Total Exported 5797 5797
sup1 All exports graded as Flaxseed No 1 Canada Western
7 Exports by grade - canola
Country No 1 Canada No 2 Canada Others Total
Asia Bangladesh China PR Israel Japan Nepal Pakistan TurkeyUnited Arab Emirates
944 9157
78 1 9499
124 4983
289 2817
(000rsquos tonnes)
---
109 ----
-----
505 --
944 9157
78 1 9608
124 5488
289 2817
Total
Oceania Australia
3 7891
571
109
-
505
-
3 8504
571 Total
Western Hemisphere Mexico United States
571
8997 6591
-
--
-
--
571
8997 6591
Total
Grand Total Exported
1 5588
5 4050
-
109
-
505
1 5588
5 4664
Canadian Grain Commission wwwgrainscanadagcca 20
Canadian Grain Exports Crop year 2006 - 2007
7 Exports by grade - soybean
Country No 1 Canada No 2 Canada Others Total
Western Europe Belgium Denmark France Ireland ItalyNetherlands NorwayPortugal Spain United Kingdom
----------
(000rsquos tonnes)
1606 302 466 17 31
2405 268 653 132 216
----------
1606 302 466 17 31
2405 268 653 132 216
Total
Africa Egypt
-
-
6098
157
-
-
6098
157 Total
Asia Iran Israel Japan Korea North MalaysiaSyria United Arab Emirates
-
--
68 ----
157
2252 238 108
-605 43 85
-
---
239 ---
157
2252 238 176 239 605 43 85
Total
Western Hemisphere CubaUnited States
68
-186
3331
206 -
239
--
3638
206 186
Total
Grand Total Exported
186
255
206
9792
-
239
392
1 0285
Canadian Grain Commission wwwgrainscanadagcca 21
Canadian Grain Exports Crop year 2006 - 2007
7 Exports by grade - peas
Country All grades combined Total
Western Europe Belgium Denmark Netherlands NorwaySpain
(000rsquos tonnes)
535 216 106
82 1397
535 216 106
82 1397
Total
Africa Algeria
2335
245
2335
245 Total
Asia Bangladesh India Nepal Pakistan United Arab Emirates
245
1901 9407
25 387 110
245
1901 9407
25 387 110
Total
Western Hemisphere Colombia CubaUnited States
1 1830
25 490
02
1 1830
25 490
02 Total
Grand Total Exported
518
1 4928
518
1 4928
Canadian Grain Commission wwwgrainscanadagcca 22
Canadian Grain Exports Crop year 2006 - 2007
7 Exports by grade - corn
Country No2 CE No3 CE Other Total (000rsquos tonnes)
Western Europe Iceland - - 106 106 Total - - 106 106
Africa Algeria - - 219 219 Total - - 219 219
Asia Iran - - 1561 1561 Israel - 45 - 45 Total - 45 1561 1606
Western Hemisphere United States 00sup1 - 03 04 Total 00sup1 - 03 04
Grand Total Exported 00sup1 45 1888 1933
sup1 00 less than 50 tonnes
Note Refer to page 4 for class definitions
Canadian Grain Commission wwwgrainscanadagcca 23
Canadian Grain Exports Crop year 2006 - 2007
8 Exports by port of clearance
Loaded at Wheat Durum Wheat Oats Barley Flaxseed Canola Soybean Peas Corn Total
Prince Rupert
Vancouver
Churchill
Thunder Bay
Queacutebec
Baie-Comeau Ontario elevators
Owen Sound
Prescott
Goderich
Sarnia
Montreal
Port Cartier
Sorel
Trois-Riviegraveres
Halifax
Prairie elevators
4 4285
4 1492
3375
977
1 0333
7501
286
132
20
429
802
3412
9699
2960
05
140
1 4387
1732
6179
742
1715
8374
9920
-
-
-
-
-
3617
3575
872
913
-
6680
-
542
-
2221
-
-
-
-
-
-
-
-
-
20
-
-
1 2740
925
7821
-
506
-
-
-
-
12
-
-
00sup1
-
-
-
-
2501
(000rsquos tonnes)
- 2354
157 4 0969
- 390
4549 3255
- -
- -
- -
- -
02 -
- -
- -
- -
- 243
112 480
- -
- -
978 6973
-
-
-
160
1168
817
1294
-
-
453
-
2158
500
2690
859
-
186
- - 4 9295
1 2530 - 10 9690
656 - 5163
1246 - 1 4628
245 181 2 0300
- 125 1 8363
- - 1580
- - 132
- 00sup1 34
- - 882
- - 802
- 1360 1 0548
- - 1 4017
248 219 7601
- 45 1822
- - 140
02 03 4 4451
16
36
2
5
7
6
1
3
5
2
1
15
Grand total exported 140236 44318 15522 11765 5797 54664 10285 14928 1933 299448 100
sup1 00 less than 50 tonnes
Note Includes exports of Eastern wheat via unlicensed facilities
Canadian Grain Commission wwwgrainscanadagcca 24
Canadian Grain Exports Crop year 2006 - 2007
9 Exports by month and clearance sector
Wheat Durum Wheat Oats Barley Flaxseed Canola Soybean Peas Corn Total
Pacific August2006 September October November December January2007 February March April May June July
8135 5168 6703 6234 7717 5439 5918 8028 7584 9329 8494 7027
376 536
1337 1721 486 498 674 137 594 577 476 499
10 --
05 -
158 308 31
---
30
684 383
1129 1193
820 995
1163 786 650 769 19
155
(000rsquos tonnes)
18 2701 23 4418 08 4767
- 3362 23 2449 16 5131 08 3092 08 4036 14 3657 23 3418 16 2767
- 3525
------------
449 2687 960
1116 1109 964
1229 488
1508 1013
742 265
------------
1 2374 1 3215 1 4904 1 3631 1 2604 1 3200 1 2391 1 3513 1 4009 1 5131 1 2514 1 1500
Total
Churchill August2006 September October November July2007
8 5777
314 997
1350 440 275
7911
-275 467
--
542
-----
8746
-----
157 4 3323
- 390 - -- -- -- -
-
-----
1 2530
-456 200
--
-
-----
15 8985
703 1728 2016
440 275
Total
Thunder Bay August2006 September October November December March2007 April May June July
3375
--
175 193 160
--
365 84
-
742
181 92
216 -
111 -
221 224 95
575
-
158 157 335 594 272 142 113 151
-297
-
-22 29
---
66 44
131 214
- 390
160 258 329 792 597 212 839 191 757 -
- -537 706 593 671 160 211 577 213
-
--
50 -
31 --
79 --
656
156 202 467
53 97
-85 82
105 -
-
----------
5163
913 1595 2080 1870 1428
142 1727 2208
787 1876
Total 977 1715 2221 506 4549 3255 160 1246 - 1 4628
Canadian Grain Commission wwwgrainscanadagcca 25
Canadian Grain Exports Crop year 2006 - 2007
9 Exports by month and clearance sector
Wheat Durum Wheat Oats Barley Flaxseed Canola Soybean Peas Corn Total
Eastern August2006 September October November December January2007 February March April May June July
3987 5979 3375 4196 2839 1444 1619 1304 2771 1786 3404 2875
1697 2337 3610 2548 3235 1512 1430 1153 2607 3053 2669 1419
--
20 ---------
(000rsquos tonnes)
- 00sup1 00sup1 00sup1
- 00sup1 00sup1 09 00sup1 36 04 -
00sup1 00sup1 - -
02 00sup1 05 53 01 00sup1
- 14
69 -
285 ---
243 --
58 68
-
375 599
1120 2793 1830 649 311 239 515 421 642 444
53 115
-326
--------
--
00sup1 -
254 665 278
--
650 82
-
6181 9031 8411 9872 8194 4275 3881 2697 5896 6027 6866 4752
Total
Atlantic January2007 March
3 5580
76 64
2 7271
--
20
--
12 114
- -- -
723
--
9939
--
494
--
1930
--
7 6082
76 64
Total
Prairie August2006 September October November December January2007 February March April May June July
140
496 666
1089 1066 1195 1293 1260 1350 1656 1631 1334 1352
-
504 547 577 533 395 607 462 493 720 379 664 800
-
2209 1765 1481 1375 755
1028 778 960 798 781 407 403
- -
83 25 144 72 261 61 359 103 210 42 389 124 148 53 108 68 178 133 299 45 302 121 22 130
-
886 468 600 579 309 539 523 529 405 756 605 774
-
--
17 10
-11 03 24 15 20 60 27
-
----
01 ----
02 --
-
----------
03 00sup1
140
4203 3662 4085 4024 2905 3991 3226 3532 3904 3912 3497 3508
Total Grand total exported
1 4387
14 0236
6680
4 4318
1 2740
1 5522
2501 978
1 1765 5797
6973
5 4664
186
1 2085
02
1 4928
03
1933
4 4451
29 9448
sup1 00 less than 50 tonnes
Canadian Grain Commission wwwgrainscanadagcca 26
Canadian Grain Exports Crop year 2006 - 2007
10 Exports by class grade and clearance sector
Grade Pacific Churchill Thunder
Bay Eastern Atlantic Prairies Total
Wheat CWRS CPS CWRW Feed CWES CWHWS CE Other CWAD
6 7503 2656 3335 411
-4470
-7400 7911
3094 -
39 16
-227
--
742
(000rsquos tonnes)
774 2 2450 05 119
- 104 - 06
94 142 104 1494
- 1 1066 - 198
1715 2 7271
101 ----
39 ---
1 3941 33 70 68
-265
-11
6680
10 7862 2813 3548
501 236
6600 1 1066
7609 4 4318
Total
Oats No 1 CW No 2 CW CE Other
9 3687
38 503
--
4117
----
2691 6 2851
- -500 -
- 20 1721 -
140
----
2 1067
1 2740 ---
18 4554
1 2778 1004
20 1721
Total
Barley Select Feed CE
542
6673 2072
-
-
---
2221 20
506 -- 00sup1 - 12
-
---
1 2740
201 2300
-
1 5522
7380 4372
12 Total
Flaxseed No 1 CW
8746
157
-
-
506 12
4549 114
-
-
2501
978
1 1765
5797 Total
Canola No 1 Canada No 2 Canada Other
157
4 2710 109 504
-
389 -
01
4549 114
3255 723 - -- -
-
---
978
6973 --
5797
5 4050 109 505
Total
Soybean No 1 Canada No 2 Canada Other
4 3323
---
390
---
3255 723
- 68 160 9632
- 239
-
---
6973
186 --
5 4664
255 9792
239 Total
Peas All grades combined
-
1 2530
-
656
160 9939
1246 494
-
-
186
02
1 0285
1 4928 Total
Corn No 2 CE No 3 CE Other
1 2530
---
656
---
1246 494
- 00sup1 - 45 - 1885
-
---
02
--
03
1 4928
00sup1 45
1888 Total
Grand total exported
-
15 8985
-
5163
- 1930
1 4628 7 6082
-
140
03
4 4451
1933
29 9448 sup1 00 less than 50 tonnes Note Refer to page 4 for class definitions
Canadian Grain Commission wwwgrainscanadagcca 27
Canadian Grain Exports Crop year 2006 - 2007
11 Exports of wheat (including durum) and wheat flour by month and clearance sector
Month Pacific Churchill Thunder
Bay Eastern Atlantic Prairie Total
Wheat Wheat Flour
Total Wheat and
Wheat Flour
August2006
September
October
November
December
January2007
February
March
April
May
June
July
8511
5704
8040
7955
8203
5937
6592
8165
8179
9907
8970
7526
314
1272
1816
440
-
-
-
-
-
-
-
275
(000rsquos tonnes)
181 5684
92 8316
391 6986
193 6744
271 6074
- 2956
- 3048
- 2458
221 5378
588 4839
179 6073
575 4294
-
-
-
-
-
76
-
64
-
-
-
-
1000
1213
1665
1599
1590
1900
1722
1843
2376
2010
1999
2152
1 5690
1 6597
1 8898
1 6931
1 6137
1 0869
1 1362
1 2530
1 6154
1 7343
1 7221
1 4821
254
243
278
291
280
291
226
226
234
250
284
234
1 5944
1 6839
1 9176
1 7222
1 6417
1 1160
1 1588
1 2756
1 6388
1 7594
1 7505
1 5055
Grand total exported 9 3687 4117 2691 6 2851 140 2 1067 18 4554 3090 18 7644
Canadian Grain Commission wwwgrainscanadagcca 28
Canadian Grain Exports Crop year 2006 - 2007
12 Exports of special crops and processed productssup1
Country Beans Buckwheat Canary Seed Chick Peas Lentils Mustard Seed
Western Europe Austria Belgium Denmark Finland France Germany Greece Iceland Ireland Italy Malta Netherlands Norway Portugal Spain Sweden Switzerland United Kingdom
41 1 047
22 -
4 006 2 912 7 651
-1 911
22 539 114
13 999 -
7 978 6 130
206 825
67 966
36 ----
77 ------
155 ----
16
(tonnes)
30 489 5 - 4 751 - -- -
46 1 903 1 141 286
839 471 - -
23 -3 262 7 833
844 -731 895
- -4 615 6 126
13 699 5 629 90 267
- 658 45 4 713
71 9 331
-22
9 301 12 641 11 032
147 22
23 135 -
4 250 -
3 663 30 301
424 671
6 462
25 852 --
492 2 345
15 812 295
--
167 -
5 980 --
79 20
145 1 593
Total Eastern Europe Albania Armenia Azerbaijan Belarus Bosnia-Herzegovina Bulgaria Byelorussia SSR Croatia Czech Republic Estonia Georgia Hungary Latvia Lithuania Macedonia Moldova Montenegro Poland Romania Russia Serbia Slovakia Slovania Ukraine Yugoslavia
137 347
61 --
23 1 624
90 23
2 546 1 584
-98
1 186 -
40 --
468 206
-237
-705 822
-20
284
-------------------------
55 824 33 535
- -- 22 - -- -- 23
21 -- -- 80 - 65 - -- 23 - -- -- -- -- -- -- 25 - -
20 -- -- -- -- 19 - -
111 473
-889
50 --
2 407 -
127 4 413
-956
1 226 --
317 --
519 -
68 23
809 ---
52 780
-------
80 42
--------
571 80 43
-----
Total 9 733 - 41 257 11 804 816
sup1 Source Statistics Canada
Canadian Grain Commission wwwgrainscanadagcca 29
Canadian Grain Exports Crop year 2006 - 2007
12 Exports of special crops and processed productssup1
Processed Productssup3
Country Peas Soybeanssup2 Sunflower Canola Oil Canola Meal (tonnes)
Western Europe Austria 2 3 - - -Belgium 55 353 182 203 45 731 -Denmark 21 601 30 210 - - -Finland - - - - -France 1 057 32 812 24 8 -Germany 878 920 49 63 577 -Greece 220 - - - -Iceland - - - - -Ireland 68 1 749 - - -Italy 7 587 874 23 - -Malta 69 - - - -Netherlands 11 949 316 202 - 85 930 -Norway 8 181 26 840 84 - -Portugal 1 263 65 503 80 67 -Spain 169 357 8 693 68 49 -Sweden - - 141 - -Switzerland 20 - - 20 -United Kingdom 4 881 - - - -Total 282 486 666 009 514 150 382 -
Eastern Europe Albania - - - - -Armenia 68 - - - -Azerbaijan - - - - -Belarus - - - - -Bosnia-Herzegovina - - - - -Bulgaria - - - - -Byelorussia SSR - - - - -Croatia 15 - 21 - -Czech Republic 91 325 - 79 -Estonia 1 268 - - - -Georgia 355 - - - -Hungary 904 20 - - -Latvia - - 68 - -Lithuania - 40 - - -Macedonia - - - - -Moldova - - - 70 -Montenegro - - - - -Poland 216 810 - - -Romania - 678 22 - -Russia 3 999 1 199 - - -Serbia - - - - -Slovakia - 103 - - -Slovania - - 1 - -Ukraine - 157 - - -Yugoslavia - - - - -Total 6 916 3 332 112 149 -sup1 Source Statistics Canada sup2 September-August crop year sup3 Refers to weight of processed product Conversion rates to grain equivalents Barley malt ndash 1339 Canola oil ndash 2387 Canola meal ndash 1607 Exports of barley malt were 621 thousand tonnes (558 thousand in 2005-2006) Country of destination not available due to confidentiality
Canadian Grain Commission wwwgrainscanadagcca 30
Canadian Grain Exports Crop year 2006 - 2007
12 Exports of special crops and processed productssup1
Country Beans Buckwheat Canary Seed Chick Peas Lentils Mustard Seed
Africa Algeria Angola Benin British Indian Ocean Terr Burundi Cameroon Cape Verde Central African Republic Chad Comoros Congo Cocircte-drsquoIvoire Djibouti Egypt Ethiopia Gambia Ghana Guinea Kenya Liberia Madagascar Malawi Mauritania Mauritius Morocco Mozambique Namibia Niger Rwanda Senegal Sierra Leone South Africa St Helena Swaziland Tanzania Togo Tunisia Uganda Zaire Zambia Zimbabwe
672 16 658
-18
-505 50
---
645 88
-2 814
----------
516 -
75 ----
867 ------
521 --
-----------------------------------------
(tonnes)
1 609 4 410 - -- -- -- -- -- -- -- -- -- -- 5 - -
1 021 2 373 - -- -- -- -- -- -- -- -- -1 20
660 -- -- -- -- -- -- -
479 163 - -- -- -- -- 720 - -- -- -- -
69 735 268
-14
--------
200 29 206
----
175 60
--
100 1 264
28 577 ----
850 -
3 350 ----
528 ----
-----------------------
68 326
----
1 466 -
267 ---------
Total 23 409 - 3 770 7 691 134 327 2 127
sup1 Source Statistics Canada
Canadian Grain Commission wwwgrainscanadagcca 31
Canadian Grain Exports Crop year 2006 - 2007
12 Exports of special crops and processed productssup1
Processed Productssup3
Country Peas Soybeanssup2 Sunflower Canola Oil Canola Meal (tonnes)
Africa Algeria 6 484 - 1 210 - -Angola - - - - -Benin 475 - - - -British Indian Ocean Terr 16 - - - -Burundi 1 783 - - - -Cameroon - 204 - - -Cape Verde 125 - - - -Central African Republic 200 - - - -Chad 500 - - - -Comoros - - - 80 -Congo 8 - - - -Cocircte-drsquoIvoire 800 - - - -Djibouti - - - - -Egypt 5 984 42 723 526 - -Ethiopia 3 150 - - - -Gambia 291 - - - -Ghana 100 - - - -Guinea 350 - - - -Kenya 12 025 - - - -Liberia 1 050 - - - -Madagascar 836 - - - -Malawi 50 255 - - -Mauritania 620 - - - -Mauritius 591 187 18 - -Morocco 3 648 137 - - -Mozambique 450 - - - -Namibia - - - - -Niger 175 - - - -Rwanda 625 - - - -Senegal 297 - - - -Sierra Leone 1 125 - - - -South Africa 12 709 68 - - -St Helena - 41 - - -Swaziland 70 156 - - -Tanzania 4 350 - - - -Togo 25 - - - -Tunisia - - - - -Uganda 2 625 - - - -Zaire 4 225 - - - -Zambia 400 - - - -Zimbabwe 450 - - - -
Total 66 612 43 771 1 754 80 -sup1 Source Statistics Canada sup2 September-August crop year sup3 Refers to weight of processed product Conversion rates to grain equivalents Barley malt ndash 1339 Canola oil ndash 2387 Canola meal ndash 1607 Exports of barley malt were 621 thousand tonnes (558 thousand in 2005-2006) Country of destination not available due to confidentiality
Canadian Grain Commission wwwgrainscanadagcca 32
Canadian Grain Exports Crop year 2006 - 2007
12 Exports of special crops and processed productssup1
Country Beans Buckwheat Canary Seed Chick Peas Lentils Mustard Seed
Asia Afghanistan Bahrain Bangladesh Bhutan Brunei Darussalam Cambodia China PR Cyprus East Timor Hong Kong India Indonesia Iran Israel Japan Jordan Korea North Korea South Kuwait Lebanon Macau Malaysia Mongolia Nepal Oman Pakistan Philippines Qatar Saudi Arabia Singapore Somalia Sri Lanka Sudan Syrian Arab Rep Taiwan Thailand Turkey United Arab Emirates Vietnam Yemen
-------
11 599 16 69 23
-1 401
21 977 -
1 860 4 485
59 467
-256
---
40 269 50
2 415 40
----
4 348 -
175 568
--
--------------
2 031 -------3 -----------------
(tonnes)
- -- -- 1 305 - -- -
22 -128 -176 91
- -5 9
22 12 903 1 434 44
- -345 2 056
1 339 336 86 15 467
- -111 -
43 270 279 3 569
- -- -- -- -- -- 17 108
334 23 - 49
83 6 183 - -- -- -- -- -
830 -22 -
235 -151 3 607
- -- -
1 595
40 320 ---
967 1 054
-30
130 075 197
9 604 6 085
318 1 384
--
291 3 599
----
199 61 096
-343
2 962 1 618
-19 022
500 113 22
-31 125 81 544
-99
--
3 899 ---
50 ---
4 172 --
65 6 386
--
2 699 ---
33 ----
56 ----
467 --
41 3 610
125 165
--
Total 39 128 2 034 5 645 63 020 393 163 21 768
sup1 Source Statistics Canada
Canadian Grain Commission wwwgrainscanadagcca 33
Canadian Grain Exports Crop year 2006 - 2007
12 Exports of special crops and processed productssup1
Processed Productssup3
Country Peas Soybeanssup2 Sunflower Canola Oil Canola Meal (tonnes)
Asia Afghanistan - - - - -Bahrain 973 - 96 43 -Bangladesh 110 049 - - - -Bhutan 86 - - - -Brunei Darussalam - 142 - - -Cambodia 249 - - - -China PR 251 442 2 400 - 263 814 407 Cyprus - - - - -East Timor - - - - -Hong Kong 2 30 126 7 25 289 -India 895 514 - 146 31 -Indonesia 12 907 522 - 8 -Iran 5 602 244 428 - - -Israel 4 494 25 152 63 12 -Japan 10 924 276 542 124 19 631 315 Jordan 812 80 136 - -Korea North 64 - 74 - -Korea South 563 60 - 35 567 -Kuwait 413 - 476 761 -Lebanon 528 - 262 70 -Macau - 20 - - -Malaysia 2 880 136 409 23 26 096 -Mongolia - - - - -Nepal 5 455 - - - -Oman 214 - - 14 -Pakistan 45 122 - 45 - -Philippines 13 477 12 975 47 635 10 530 Qatar 311 - 48 14 -Saudi Arabia 8 025 869 325 14 -Singapore 1 749 42 834 - 162 -Somalia 2 950 - - - -Sri Lanka 1 701 - - - -Sudan 3 450 - - - -Syrian Arab Rep - 4 303 2 429 - -Taiwan 11 590 8 168 - 26 952 7 033 Thailand 8 982 20 740 - 3 -Turkey 680 21 020 353 - -United Arab Emirates 38 481 134 12 694 531 -Vietnam 45 241 - 217 -Yemen 6 232 43 - - -
Total 1 445 966 827 208 17 348 399 864 18 285
sup1 Source Statistics Canada sup2 September-August crop year sup3 Refers to weight of processed product Conversion rates to grain equivalents Barley malt ndash 1339 Canola oil ndash 2387 Canola meal ndash 1607 Exports of barley malt were 621 thousand tonnes (558 thousand in 2005-2006) Country of destination not available due to confidentiality
Canadian Grain Commission wwwgrainscanadagcca 34
Canadian Grain Exports Crop year 2006 - 2007
12 Exports of special crops and processed productssup1
Country Beans Buckwheat Canary Seed Chick Peas Lentils Mustard Seed (tonnes)
Oceania Australia 3 807 - 211 - 1 366 1 062 Cocos Islands - - - - - -Fiji - - - - - -New Zealand 1 814 - 391 22 228 3 US Outlying Islands - - - 45 - -
Total 5 621 - 602 67 1 594 1 065
Processed Productssup3
Country Peas Soybeanssup2 Sunflower Canola Oil Canola Meal (tonnes)
Oceania Australia 1 094 42 179 3 -Cocos Islands 119 - - - -Fiji 90 - - 30 -New Zealand 158 571 - 208 -US Outlying Islands - - - - -
Total 1 461 613 179 241 -
sup1 Source Statistics Canada sup2 September-August crop year sup3 Refers to weight of processed product Conversion rates to grain equivalents Barley malt ndash 1339 Canola oil ndash 2387 Canola meal ndash 1607 Exports of barley malt were 621 thousand tonnes (558 thousand in 2005-2006) Country of destination not available due to confidentiality
Canadian Grain Commission wwwgrainscanadagcca 35
Canadian Grain Exports Crop year 2006 - 2007
12 Exports of special crops and processed productssup1
Country Beans Buckwheat Canary Seed Chick Peas Lentils Mustard Seed
Western Hemisphere Antigua-Barbuda Argentina Aruba Barbados Belize Bermuda Bolivia Brazil British Virgin Islands Chile Colombia Costa Rica Cuba Dominica Dominican Republic Ecuador El Salvador Grenada Guatemala Guyana Haiti Honduras Jamaica Mexico Netherlands Antilles Nicaragua Panama Paraguay Peru St Kitts-Nevis St Vincent Gren Ste Lucie Surinam Trinidad-Tobago United States Uruguay Venezuela
7 -4 3
137 ----
256 45
643 510 60
12 714 43 67 29
1 514 1
6 202 -
1 736 4 189
3 -
426 --5 3
18 15
489 102 440
-2 375
---------------------------------1
1 537 --
(tonnes)
- -- 5 - -8 6 - -- -- -
21 558 106 - -
4 871 140 11 276 3 550
581 127 390 106
- -746 149
1 235 203 371 -
- -1 746 33
- 181 - -
22 -- -
42 583 -- -- -
75 14 - -
7 012 163 - -- -- -
32 27 172 659
13 062 5 112 116 -
6 186 45
5 1 822
1 68
--
1 323 10 965
-16 866 54 177
686 -
110 176
18 440 -
79 74
---
23 31 513
--
8 765 58
20 825 5
16 45
-1 325 6 361 2 451
23 015
-103
--1 --
569 -
285 74 16
---
203 200
-150
----
20 ----
296 ----
34 71 359
40 1 025
Total
Grand total exported
133 934
349 172
1 538
3 856
112 042 10 626
177 924 115 196
199 194
851 555
74 375
152 931
sup1 Source Statistics Canada
Canadian Grain Commission wwwgrainscanadagcca 36
Canadian Grain Exports Crop year 2006 - 2007
12 Exports of special crops and processed productssup1
Processed Productssup3
Country Peas Soybeanssup2 Sunflower Canola Oil Canola Meal (tonnes)
Western Hemisphere Antigua-Barbuda 9 - - - -Argentina - - - - -Aruba 3 - - - -Barbados 215 1 14 2 -Belize 71 - - - -Bermuda - - - 219 -Bolivia - - - - -Brazil 10 049 - - - -British Virgin Islands - 4 - - -Chile 5 053 - 84 22 -Colombia 34 159 - 312 3 342 -Costa Rica 604 - 421 24 -Cuba 26 968 39 2 - -Dominica 21 - - 1 -Dominican Republic 398 23 161 - -Ecuador 3 106 - - - -El Salvador - - 69 - -Grenada 150 - - - -Guatemala 45 - 539 9 -Guyana 2 947 - - - -Haiti - - - - -Honduras - - 165 - -Jamaica - 625 - - -Mexico 9 331 69 2 289 31 661 5 798 Netherlands Antilles - - - - -Nicaragua 875 - - - -Panama 1 327 186 229 - -Paraguay 8 - - - -Peru 13 338 - - 33 -St Kitts-Nevis 5 - - - -St Vincent Gren - 1 - - -Ste Lucie 20 1 - - -Surinam 802 125 22 8 -Trinidad-Tobago 5 448 215 89 82 -United States 34 482 198 369 96 576 719 403 1 458 082 Uruguay 15 - - - -Venezuela 16 259 - 108 - -
Total 165 708 199 658 101 080 754 806 1 463 880
Grand total exported 1 969 149 1 740 591 120 987 1 305 522 1 482 165
sup1 Source Statistics Canada sup2 September-August crop year sup3 Refers to weight of processed product Conversion rates to grain equivalents Barley malt ndash 1339 Canola oil ndash 2387 Canola meal ndash 1607 Exports of barley malt were 621 thousand tonnes (558 thousand in 2005-2006) Country of destination not available due to confidentiality
Canadian Grain Commission wwwgrainscanadagcca 37
Canadian Grain Exports Crop year 2006 - 2007
13 Ocean freight rates
From
To Japan
North Pacificsup1
Korea South China PR
St Lawrencesup1
Iran
August 2006
September
October
November
December
January 2007
February
March
April
May
June
July
3220
3650
3780
4100
4100
3960
3675
3975
4100
4520
4150
5200
($ US per short tonne)
3120 na
3550 na
3900 na
4300 na
4200 na
4080 na
3825 na
4075 na
4200 na
4620 na
4250 na
5300 na
4640
4800
4900
4825
5000
5120
4950
5225
5375
5940
6000
6700
Average 4036 4118 na 5290
sup1 Rates are calculated for heavy grains on largest sized vessel (type B-vessel size = over 35 000 tonnes) in most general use appropriate to specified route ready to load in three to four weeks time
Source International Grain Council
Canadian Grain Commission wwwgrainscanadagcca 38
Canadian Grain Exports Crop year 2006 - 2007
14 Estimated costs of moving wheat from a mid-prairie point to export position
Crop Year 200102 200203 200304 200405 200506 200607p
Primary Elevator Costs Elevation (1) Removal of dockage Shrinkage Carrying charges (2)
Railway Freight Via Thunder Bay Via Vancouver
Marketing (3)
Terminal Elevator Costs Storage (4) Fobbing charges - via St Lawrence ports (5) - via Pacific seaboard (5)
Lake Transportation (6)
Transfer Elevator Costs Storage Fobbing charges (7)
1118 368 022 245
3443 3378
-225
094
823 842
1917
192 230
1163 383 025 353
3343 3377
-008
167
873 890
1893
347 231
$tonne
1190 1190 440 440
- -196 186
3326 3402 3445 3471
277 083
102 148
903 926 920 936
1892 1928
173 362 232 232
1220 450
-230
3436 3506
315
130
954 982
1991
341 231
1251 462
-209
3805 3809
494
128
978 1006
2185
345 232
Total - via St Lawrence ports - via Pacific seaboard
8227 5842
8770 6350
8731 8897 6570 6454
9298 6833
10089 7359
P - Preliminary
Mid-Prairie point being Brass Saskatchewan
(1) Filed tariff for receiving elevating and loading
(2) Carrying charges on wheat stored in country elevators
(3) Includes interest bank and other charges and Canadian Wheat Board administrative costs interest and depreciation on CWB hopper cars drying additional freight and demurragedespatch
(4) Storage charges on wheat stored in terminal elevators
(5) Thunder Bay and Pacific fobbing charge which includes elevation outward weighing and inspection terminal elevator receipt cancellation lake shippersrsquo charges superintendence and forwarding brokerage charges
(6) Includes elevation outward weighing and inspection terminal elevator receipt cancellation BC Shippersrsquo charges superintendence wharfage and forwarding brokerage charges
(7) Includes lake freight lake brokerage cargo rates insurance St Lawrence Seaway and Welland Canal tolls and inward elevation into transfer elevator
Canadian Grain Commission wwwgrainscanadagcca 39

Canadian Grain Exports Crop year 2006 - 2007
4 Exports by country of destination ndash oats barley flaxseed canola soybean peas and corn
Country Oats Barley Flaxseed Canola Soybean Peas Corn Total (000rsquos tonnes)
Oceania Australia - - - 571 - - - 571 Total - - - 571 - - - 571
Western Hemisphere Colombia - 826 - - - 25 - 852 Cuba - - - - 206 490 - 696 Ecuador 139 176 - - - - - 315 Mexico 358 197 - 8997 - - - 9552 Peru - 133 - - - - - 133 Puerto Rico 20 - - - - - - 20 United States 1 4392 2723 980 6591 186 02 04 2 4878 Total 1 4908 4055 980 1 5588 392 518 04 3 6445
Grand Total Exported 1 5522 1 1765 5797 5 4664 1 0285 1 4928 1933 11 4894
Canadian Grain Commission wwwgrainscanadagcca 9
Canadian Grain Exports Crop year 2006 - 2007
5 Exports by clearance sector - wheat
Country Pacific Churchill Thunder Bay Eastern Atlantic Prairie Total
Western Europe Belgium GermanyIceland Ireland Italy Netherlands NorwayPortugal Spain Switzerland United Kingdom
-----------
109 -------
698 --
(000rsquos tonnes)
- 243 - 01 - 11 - 62
462 2613 - 150 - 00sup1 - 02 - 612 - 16
60 4314
-----------
-----------
352 01 11 62
3074 150 00sup1 02
1310 16
4374 Total
Eastern Europe Czech Republic
-
-
807
-
522 8024
- 00sup1
-
-
-
-
9353
00sup1 Total
Africa Burundi Cameroon Congo Djibouti Egypt Ethiopia Ghana Libya Mali Mauritania Mozambique Namibia Nigeria Somalia South Africa Sudan Tanzania Togo Tunisia West Africa
-
30 --------------
2879 320
---
-
------
292 --------
440 270
---
- 00sup1
- -- 136 - 196 - 174 - 5457 - 178 - 840 - 01 - 06 - 178 - 265 - 66 - 1545 - 22 - 1059 - 1547 - -- 60 - 07 - 1890
-
--------------------
-
--------------------
00sup1
30 136 196 174
5457 178
1131 01 06
178 265 66
1545 22
1059 4867
590 60 07
1890 Total 3229 1002 - 1 3625 - - 1 7856
sup1 00 less than 50 tonnes
Canadian Grain Commission wwwgrainscanadagcca 10
Canadian Grain Exports Crop year 2006 - 2007
5 Exports by clearance sector - wheat
Country Pacific Churchill Thunder Bay Eastern Atlantic Prairie Total
Asia Bangladesh China PR India Indonesia Iraq Japan Korea South MalaysiaPhilippines Singapore Sri Lanka Taiwan Thailand United Arab Emirates Vietnam Yemen
3086 441
7884 1 5428
6211 9088 1104 1364 3595 362
9237 63
2455 1517 2583
-
----------------
(000rsquos tonnes)
- -- -- 2624 - -- -- -- -- -- -- -- -- -- -- -- -- 62
----------------
----------------
3086 441
1 0508 1 5428
6211 9088 1104 1364 3595 362
9237 63
2455 1517 2583
62 Total
Oceania New Zealand
6 4417
163
-
-
- 2686
- -
-
-
-
-
6 7103
163 Total
Western Hemisphere Brazil Caribbean Chile ColombiaCuba Dominican Republic Ecuador Guatemala Guyana Mexico Peru Puerto Rico United States Venezuela
163
--
368 3665
--
2747 470
-6983 3575
-159
-
-
275 --------
1292 ----
- -
- 1529 - -- -- 339 - 893 - 108 - -- -- 372 - 1951 - -
180 535 - 1318
275 4200
-
--------
140 -----
-
-1523
-------
1987 -
86 1 0703
89
163
1804 1523 368
4004 893 108
2747 470 513
1 2212 3575 800
1 2180 4563
Total
Grand Total Exported
1 7967
8 5777
1567
3375
455 1 1244
977 3 5580
140
140
1 4387
1 4387
4 5761
14 0236
Canadian Grain Commission wwwgrainscanadagcca 11
Canadian Grain Exports Crop year 2006 - 2007
5 Exports by clearance sector ndash durum wheat
Country Pacific Churchill Thunder Bay Eastern Prairie Total
Western Europe Belgium ItalyNetherlands Portugal Switzerland
-----
219 ----
(000rsquos tonnes)
-268 447
--
1915 5899 1723 267 15
-----
2134 6166 2170 267 15
Total
Eastern Europe Czech Republic
-
-
219
-
715
-
9817
00sup1
-
-
1 0751
00sup1
Total
Africa AlgeriaLibyaMorocco South Africa Tunisia
-
----
270
-
--
275 -
248
-
--
761 --
00sup1
6595 1152 4283 155 816
-
-----
00sup1
6595 1152 5319
155 1334
Total
Asia India Indonesia Japan Singapore Sri Lanka United Arab Emirates
270
1990 168
2469 04
883 546
523
------
761
------
1 3000
------
-
------
1 4554
1990 168
2469 04
883 546
Total
Western Hemisphere Caribbean Chile Colombia Cuba Ecuador Guatemala Mexico Peru United States Venezuela
6060
-609 166
-172 51
-583
--
-
----------
-
---------
239
-
---
96 -----
4357
-
159 -----
74 -
6358 89
6060
159 609 166 96
172 51 74
583 6358 4685
Total
Grand Total Exported
1581
7911
-
742
239
1715
4454
2 7271
6680
6680
1 2953
4 4318
sup1 00 less than 50 tonnes
Canadian Grain Commission wwwgrainscanadagcca 12
Canadian Grain Exports Crop Year 2006 - 2007
5 Exports by clearance sector - oats
Country Pacific Churchill Thunder Bay Eastern Prairies Total
Western Europe Norway - -
(000rsquos tonnes)
367 - - 367 Total
Africa South Africa
-
-
-
-
367
133
-
-
-
-
367
133 Total
Asia Japan
-
114
-
-
133
-
-
-
-
-
133
114 Total
Western Hemisphere Ecuador Mexico Puerto Rico United States
114
139 289
--
-
----
-
---
1721
-
--
20 -
-
-69
-1 2671
114
139 358
20 1 4392
Total
Grand Total Exported
428
542
-
-
1721
2221
20
20
1 2740
1 2740
1 4908
1 5522
5 Exports by clearance sector - barley
Country Pacific Churchill Thunder Bay Eastern Prairies Total
Eastern Europe Czech Republic - -
(000rsquos tonnes)
- 00sup1 - 00sup1
Total
Africa South Africa
-
506
-
-
-
-
00sup1
-
-
-
00sup1
506 Total
Asia China PR Japan Vietnam
506
3946 3127 130
-
---
-
---
-
---
-
---
506
3946 3127 130
Total
Western Hemisphere Colombia Ecuador Mexico Peru United States
7203
728 176
-133
-
-
-----
-
----
506
-
----
12
-
99 -
197 -
2205
7203
826 176 197 133
2723 Total
Grand Total Exported
1037
8746
-
-
506
506
12
12
2501
2501
4055
1 1765
sup1 00 less than 50 tonnes
Canadian Grain Commission wwwgrainscanadagcca 13
Canadian Grain Exports Crop year 2006 - 2007
5 Exports by clearance sector ndash flaxseed
Country Pacific Churchill Thunder Bay Eastern Prairie Total (000rsquos tonnes)
Western Europe Belgium - - 4549 112 - 4661 Total - - 4549 112 - 4661
Asia Japan 157 - - - - 157 Total 157 - - - - 157
Western Hemisphere United States - - - 02 978 980 Total - - - 02 978 980
Grand Total Exported 157 - 4549 114 978 5797
5 Exports by clearance sector ndash canola
Country Pacific Churchill Thunder Bay Eastern Prairie Total
Asia Bangladesh China PR Israel Japan Nepal Pakistan TurkeyUnited Arab Emirates
944 9157
-1 9608
124 5098
-2817
-----
390 --
(000rsquos tonnes)
--
78 ---
234 -
------
55 -
--------
944 9157
78 1 9608
124 5488 289
2817
Total
Oceania Australia
3 7748
571
390
-
312
-
55
-
-
-
3 8504
571 Total
Western Hemisphere Mexico United States
571
5005 -
-
--
-
2941 02
-
667 -
-
384 6589
571
8997 6591
Total
Grand Total Exported
5005
4 3323
-
390
2943
3255
667
723
6973
6973
1 5588
5 4664
Canadian Grain Commission wwwgrainscanadagcca 14
Canadian Grain Exports Crop year 2006 - 2007
5 Exports by clearance sector ndash soybean
Country Pacific Churchill Thunder Bay Eastern Prairie Total
Western Europe Belgium Denmark France Ireland ItalyNetherlands NorwayPortugal Spain United Kingdom
----------
----------
(000rsquos tonnes)
160 ---------
1446 302 466 17 31
2405 268 653 132 216
----------
1606 302 466 17 31
2405 268 653 132 216
Total
Africa Egypt
-
-
-
-
160
-
5938
157
-
-
6098
157 Total
Asia Iran Israel Japan Korea North Malaysia Syria United Arab Emirates
-
-------
-
-------
-
-------
157
2252 238 176 239 605 43 85
-
-------
157
2252 238 176 239 605 43 85
Total
Western Hemisphere Cuba United States
-
--
-
--
-
--
3638
206 -
-
-186
3638
206 186
Total
Grand Total Exported
-
-
-
-
-
160
206
9939
186
186
392
1 0285
Canadian Grain Commission wwwgrainscanadagcca 15
Canadian Grain Exports Crop year 2006 - 2007
5 Exports by clearance sector ndash peas
Country Pacific Churchill Thunder Bay Eastern Prairie Total
Western Europe Belgium Denmark Netherlands NorwaySpain
----
185
----
656
(000rsquos tonnes)
535 135
-82
494
-81
106 -
62
-----
535 216 106 82
1397 Total
Africa Algeria
185
-
656
-
1246
-
248
245
-
-
2335
245 Total
Asia Bangladesh India Nepal Pakistan United Arab Emirates
-
1901 9407
25 387 110
-
-----
-
-----
245
-----
-
-----
245
1901 9407
25 387 110
Total
Western Hemisphere Colombia Cuba United States
1 1830
25 490
-
-
---
-
---
-
---
-
--
02
1 1830
25 490
02 Total
Grand Total Exported
515
1 2530
-
656
-
1246
-
494
02
02
518
1 4928
5 Exports by clearance sector ndash corn
Country Pacific Churchill Thunder Bay Eastern Prairie Total (000rsquos tonnes)
Western Europe Iceland - - - 106 - 106 Total - - - 106 - 106
Africa Algeria - - - 219 - 219 Total - - - 219 - 219
Asia Iran - - - 1561 - 1561 Israel - - - 45 - 45 Total - - - 1606 - 1606
Western Hemisphere United States - - - 00sup1 03 04 Total - - - 00sup1 03 04
Grand Total Exported - - - 1930 03 1933 sup1 00 less than 50 tonnes
Canadian Grain Commission wwwgrainscanadagcca 16
Canadian Grain Exports Crop year 2006 - 2007
6 Exports by class - wheat
Country CWRS CPS CWRW Feed CWES CWHWS CE Other CWAD Total
Western Europe Belgium Germany Iceland Ireland Italy Netherlands Norway Portugal Spain Switzerland United Kingdom
351 01 11 62
2833 141 00sup1
-863 16
4318
----------
40
----
02 -----
11
-------
02 --
04
(000rsquoS tonnes)
- 00sup1 - -- -- -
236 03 - 01 - -- -- -- -- 01
-----
08 --
448 --
-----------
2134 ---
6166 2170
-267
-15
-
2486 01 11 62
9241 2320
00sup1 269
1310 30
4374
Total
Eastern Europe Czech Republic
8596
00sup1
40
-
13
-
06
-
236 06
- -
455
-
-
-
1 0751
00sup1
2 0104
00sup1
Total
Africa Algeria Burundi Cameroon Congo Djibouti Egypt Ethiopia Ghana Libya Mali Mauritania Morocco Mozambique Namibia Nigeria Somalia South Africa Sudan Tanzania Togo Tunisia West Africa
00sup1
-30
136 80
---
999 -
06 05
-265 66
1384 22
809 4428 590 60 07
1820
-
---------------------
40
-
------
22 77
-------------
30
-
----------------------
- -
- -- -- -- 116 - -- -- -- -- 01 - -- -- -- -- -- 95 - -- 249 - 319 - -- -- -- -
-
----
174 5457 156 55
--
173 ------
119 ----
-
--------------
66 -------
00sup1
6595 -------
1152 --
5319 ----
155 ---
1334 -
00sup1
6595 30
136 196 174
5457 178
1131 1152
06 178
5319 265
66 1545
22 1213 4867
590 60
1341 1890
Total 1 0708 40 129 - - 779 6133 66 1 4554 3 2410
sup1 00 less than 50 tonnes
Note Refer to page 4 for class definitions
Canadian Grain Commission wwwgrainscanadagcca 17
Canadian Grain Exports Crop year 2006 - 2007
6 Exports by class - wheat
Country CWRS CPS CWRW Feed CWES CWHWS CE Other CWAD Total
Asia Bangladesh China PR India Indonesia Iraq Japan Korea South Malaysia Philippines Singapore Sri Lanka Taiwan Thailand United Arab Emirates Vietnam Yemen
3086 441
4374 1 3249
6211 867 7 1104 1199 2932 180 852 63
1928 1410 1682
-
--
1514 545
---
30 --
303 -
10 ---
--
1996 392
---
05 --
477 -
80 ---
(000rsquoS tonnes)
- - -- - -- - -- - 1243 - - -
411 - -- - -- - 129 - - 664 - - 182 - - 980 - - -- - 438 - - 107 - - 126 - - -
--
2624 ------------
62
----------
6625 ---
775 -
--
1990 168
-2469
---
04 883
--
546 --
3086 441
1 2498 1 5596
6211 1 1557
1104 1364 3595 366
1 0120 63
2455 2063 2583
62
Total
Oceania New Zealand
4 7387
163
2402
-
2950
-
411 - 3868
- - -
2686
-
7400
-
6060
-
7 3163
163
Total
Western Hemisphere Brazil Caribbean Chile Colombia Cuba Dominican Republic Ecuador Guatemala Guyana Mexico Peru Puerto Rico United States Venezuela
163
1690 1523 368
3866 893 59
2747 470 366
1 0493 3327 271
1 0415 4519
-
---------
255 --
33 44
-
---
138 ------
248 -
70 -
- - -
- - 114 - - -- - -- - -- - -- - -- - -- - -- - 137
16 - 1104 - - -- - 327
68 - 265 - - -
-
-----
49 --
10 344
-202
1186 -
-
------------
143 -
-
-159 609 166
96 -
172 51
-74
583 -
6358 4685
163
1804 1682
978 4170
989 108
2918 521 513
1 2286 4158 800
1 8539 9248
Total
Grand Total Exported
4 1008
10 7862
331
2813
456
3548
83 - 1948
501 236 6600
1792
1 1066
143
7609
1 2953
4 4318
5 8714
18 4554
Note Refer to page 4 for class definitions
Canadian Grain Commission wwwgrainscanadagcca 18
Canadian Grain Exports Crop year 2006 - 2007
7 Exports by grade - oats
Country No 1 CW No 2 CW CE Other Total
Western Europe Norway - 367
(000rsquos tonnes)
- - 367 Total
Africa South Africa
-
-
367
133
-
-
-
-
367
133 Total
Asia Japan
-
38
133
75
-
-
-
-
133
114 Total
Western Hemisphere Ecuador Mexico Puerto Rico United States
38
-69
-1 2671
75
139 289
--
-
--
20 -
-
---
1721
114
139 358 20
1 4392 Total
Grand Total Exported
1 2740
1 2778
428
1004
20
20
1721
1721
1 4908
1 5522
7 Exports by grade - barley
Country Select Feed CE Total
Eastern Europe Czech Republic 00sup1
(000rsquos tonnes)
- - 00sup1
Total
Africa South Africa
00sup1
-
-
506
-
-
00sup1
506 Total
Asia China PR Japan Vietnam
-
3308 2811
-
506
639 316 130
-
---
506
3946 3127
130 Total
Western Hemisphere ColombiaEcuador Mexico Peru United States
6118
654 ---
608
1085
173 176 197 133
2103
-
----
12
7203
826 176 197 133
2723 Total
Grand Total Exported
1262
7380
2782
4372
12
12
4055
1 1765 sup1 00 less than 50 tonnes Note Refer to page 4 for class definitions
Canadian Grain Commission wwwgrainscanadagcca 19
Canadian Grain Exports Crop year 2006 - 2007
7 Exports by grade - flaxseedsup1
Country No 1 CW Total (000rsquos tonnes)
Western Europe Belgium 4661 4661 Total 4661 4661
Asia Japan 157 157 Total 157 157
Western Hemisphere United States 980 980 Total 980 980
Grand Total Exported 5797 5797
sup1 All exports graded as Flaxseed No 1 Canada Western
7 Exports by grade - canola
Country No 1 Canada No 2 Canada Others Total
Asia Bangladesh China PR Israel Japan Nepal Pakistan TurkeyUnited Arab Emirates
944 9157
78 1 9499
124 4983
289 2817
(000rsquos tonnes)
---
109 ----
-----
505 --
944 9157
78 1 9608
124 5488
289 2817
Total
Oceania Australia
3 7891
571
109
-
505
-
3 8504
571 Total
Western Hemisphere Mexico United States
571
8997 6591
-
--
-
--
571
8997 6591
Total
Grand Total Exported
1 5588
5 4050
-
109
-
505
1 5588
5 4664
Canadian Grain Commission wwwgrainscanadagcca 20
Canadian Grain Exports Crop year 2006 - 2007
7 Exports by grade - soybean
Country No 1 Canada No 2 Canada Others Total
Western Europe Belgium Denmark France Ireland ItalyNetherlands NorwayPortugal Spain United Kingdom
----------
(000rsquos tonnes)
1606 302 466 17 31
2405 268 653 132 216
----------
1606 302 466 17 31
2405 268 653 132 216
Total
Africa Egypt
-
-
6098
157
-
-
6098
157 Total
Asia Iran Israel Japan Korea North MalaysiaSyria United Arab Emirates
-
--
68 ----
157
2252 238 108
-605 43 85
-
---
239 ---
157
2252 238 176 239 605 43 85
Total
Western Hemisphere CubaUnited States
68
-186
3331
206 -
239
--
3638
206 186
Total
Grand Total Exported
186
255
206
9792
-
239
392
1 0285
Canadian Grain Commission wwwgrainscanadagcca 21
Canadian Grain Exports Crop year 2006 - 2007
7 Exports by grade - peas
Country All grades combined Total
Western Europe Belgium Denmark Netherlands NorwaySpain
(000rsquos tonnes)
535 216 106
82 1397
535 216 106
82 1397
Total
Africa Algeria
2335
245
2335
245 Total
Asia Bangladesh India Nepal Pakistan United Arab Emirates
245
1901 9407
25 387 110
245
1901 9407
25 387 110
Total
Western Hemisphere Colombia CubaUnited States
1 1830
25 490
02
1 1830
25 490
02 Total
Grand Total Exported
518
1 4928
518
1 4928
Canadian Grain Commission wwwgrainscanadagcca 22
Canadian Grain Exports Crop year 2006 - 2007
7 Exports by grade - corn
Country No2 CE No3 CE Other Total (000rsquos tonnes)
Western Europe Iceland - - 106 106 Total - - 106 106
Africa Algeria - - 219 219 Total - - 219 219
Asia Iran - - 1561 1561 Israel - 45 - 45 Total - 45 1561 1606
Western Hemisphere United States 00sup1 - 03 04 Total 00sup1 - 03 04
Grand Total Exported 00sup1 45 1888 1933
sup1 00 less than 50 tonnes
Note Refer to page 4 for class definitions
Canadian Grain Commission wwwgrainscanadagcca 23
Canadian Grain Exports Crop year 2006 - 2007
8 Exports by port of clearance
Loaded at Wheat Durum Wheat Oats Barley Flaxseed Canola Soybean Peas Corn Total
Prince Rupert
Vancouver
Churchill
Thunder Bay
Queacutebec
Baie-Comeau Ontario elevators
Owen Sound
Prescott
Goderich
Sarnia
Montreal
Port Cartier
Sorel
Trois-Riviegraveres
Halifax
Prairie elevators
4 4285
4 1492
3375
977
1 0333
7501
286
132
20
429
802
3412
9699
2960
05
140
1 4387
1732
6179
742
1715
8374
9920
-
-
-
-
-
3617
3575
872
913
-
6680
-
542
-
2221
-
-
-
-
-
-
-
-
-
20
-
-
1 2740
925
7821
-
506
-
-
-
-
12
-
-
00sup1
-
-
-
-
2501
(000rsquos tonnes)
- 2354
157 4 0969
- 390
4549 3255
- -
- -
- -
- -
02 -
- -
- -
- -
- 243
112 480
- -
- -
978 6973
-
-
-
160
1168
817
1294
-
-
453
-
2158
500
2690
859
-
186
- - 4 9295
1 2530 - 10 9690
656 - 5163
1246 - 1 4628
245 181 2 0300
- 125 1 8363
- - 1580
- - 132
- 00sup1 34
- - 882
- - 802
- 1360 1 0548
- - 1 4017
248 219 7601
- 45 1822
- - 140
02 03 4 4451
16
36
2
5
7
6
1
3
5
2
1
15
Grand total exported 140236 44318 15522 11765 5797 54664 10285 14928 1933 299448 100
sup1 00 less than 50 tonnes
Note Includes exports of Eastern wheat via unlicensed facilities
Canadian Grain Commission wwwgrainscanadagcca 24
Canadian Grain Exports Crop year 2006 - 2007
9 Exports by month and clearance sector
Wheat Durum Wheat Oats Barley Flaxseed Canola Soybean Peas Corn Total
Pacific August2006 September October November December January2007 February March April May June July
8135 5168 6703 6234 7717 5439 5918 8028 7584 9329 8494 7027
376 536
1337 1721 486 498 674 137 594 577 476 499
10 --
05 -
158 308 31
---
30
684 383
1129 1193
820 995
1163 786 650 769 19
155
(000rsquos tonnes)
18 2701 23 4418 08 4767
- 3362 23 2449 16 5131 08 3092 08 4036 14 3657 23 3418 16 2767
- 3525
------------
449 2687 960
1116 1109 964
1229 488
1508 1013
742 265
------------
1 2374 1 3215 1 4904 1 3631 1 2604 1 3200 1 2391 1 3513 1 4009 1 5131 1 2514 1 1500
Total
Churchill August2006 September October November July2007
8 5777
314 997
1350 440 275
7911
-275 467
--
542
-----
8746
-----
157 4 3323
- 390 - -- -- -- -
-
-----
1 2530
-456 200
--
-
-----
15 8985
703 1728 2016
440 275
Total
Thunder Bay August2006 September October November December March2007 April May June July
3375
--
175 193 160
--
365 84
-
742
181 92
216 -
111 -
221 224 95
575
-
158 157 335 594 272 142 113 151
-297
-
-22 29
---
66 44
131 214
- 390
160 258 329 792 597 212 839 191 757 -
- -537 706 593 671 160 211 577 213
-
--
50 -
31 --
79 --
656
156 202 467
53 97
-85 82
105 -
-
----------
5163
913 1595 2080 1870 1428
142 1727 2208
787 1876
Total 977 1715 2221 506 4549 3255 160 1246 - 1 4628
Canadian Grain Commission wwwgrainscanadagcca 25
Canadian Grain Exports Crop year 2006 - 2007
9 Exports by month and clearance sector
Wheat Durum Wheat Oats Barley Flaxseed Canola Soybean Peas Corn Total
Eastern August2006 September October November December January2007 February March April May June July
3987 5979 3375 4196 2839 1444 1619 1304 2771 1786 3404 2875
1697 2337 3610 2548 3235 1512 1430 1153 2607 3053 2669 1419
--
20 ---------
(000rsquos tonnes)
- 00sup1 00sup1 00sup1
- 00sup1 00sup1 09 00sup1 36 04 -
00sup1 00sup1 - -
02 00sup1 05 53 01 00sup1
- 14
69 -
285 ---
243 --
58 68
-
375 599
1120 2793 1830 649 311 239 515 421 642 444
53 115
-326
--------
--
00sup1 -
254 665 278
--
650 82
-
6181 9031 8411 9872 8194 4275 3881 2697 5896 6027 6866 4752
Total
Atlantic January2007 March
3 5580
76 64
2 7271
--
20
--
12 114
- -- -
723
--
9939
--
494
--
1930
--
7 6082
76 64
Total
Prairie August2006 September October November December January2007 February March April May June July
140
496 666
1089 1066 1195 1293 1260 1350 1656 1631 1334 1352
-
504 547 577 533 395 607 462 493 720 379 664 800
-
2209 1765 1481 1375 755
1028 778 960 798 781 407 403
- -
83 25 144 72 261 61 359 103 210 42 389 124 148 53 108 68 178 133 299 45 302 121 22 130
-
886 468 600 579 309 539 523 529 405 756 605 774
-
--
17 10
-11 03 24 15 20 60 27
-
----
01 ----
02 --
-
----------
03 00sup1
140
4203 3662 4085 4024 2905 3991 3226 3532 3904 3912 3497 3508
Total Grand total exported
1 4387
14 0236
6680
4 4318
1 2740
1 5522
2501 978
1 1765 5797
6973
5 4664
186
1 2085
02
1 4928
03
1933
4 4451
29 9448
sup1 00 less than 50 tonnes
Canadian Grain Commission wwwgrainscanadagcca 26
Canadian Grain Exports Crop year 2006 - 2007
10 Exports by class grade and clearance sector
Grade Pacific Churchill Thunder
Bay Eastern Atlantic Prairies Total
Wheat CWRS CPS CWRW Feed CWES CWHWS CE Other CWAD
6 7503 2656 3335 411
-4470
-7400 7911
3094 -
39 16
-227
--
742
(000rsquos tonnes)
774 2 2450 05 119
- 104 - 06
94 142 104 1494
- 1 1066 - 198
1715 2 7271
101 ----
39 ---
1 3941 33 70 68
-265
-11
6680
10 7862 2813 3548
501 236
6600 1 1066
7609 4 4318
Total
Oats No 1 CW No 2 CW CE Other
9 3687
38 503
--
4117
----
2691 6 2851
- -500 -
- 20 1721 -
140
----
2 1067
1 2740 ---
18 4554
1 2778 1004
20 1721
Total
Barley Select Feed CE
542
6673 2072
-
-
---
2221 20
506 -- 00sup1 - 12
-
---
1 2740
201 2300
-
1 5522
7380 4372
12 Total
Flaxseed No 1 CW
8746
157
-
-
506 12
4549 114
-
-
2501
978
1 1765
5797 Total
Canola No 1 Canada No 2 Canada Other
157
4 2710 109 504
-
389 -
01
4549 114
3255 723 - -- -
-
---
978
6973 --
5797
5 4050 109 505
Total
Soybean No 1 Canada No 2 Canada Other
4 3323
---
390
---
3255 723
- 68 160 9632
- 239
-
---
6973
186 --
5 4664
255 9792
239 Total
Peas All grades combined
-
1 2530
-
656
160 9939
1246 494
-
-
186
02
1 0285
1 4928 Total
Corn No 2 CE No 3 CE Other
1 2530
---
656
---
1246 494
- 00sup1 - 45 - 1885
-
---
02
--
03
1 4928
00sup1 45
1888 Total
Grand total exported
-
15 8985
-
5163
- 1930
1 4628 7 6082
-
140
03
4 4451
1933
29 9448 sup1 00 less than 50 tonnes Note Refer to page 4 for class definitions
Canadian Grain Commission wwwgrainscanadagcca 27
Canadian Grain Exports Crop year 2006 - 2007
11 Exports of wheat (including durum) and wheat flour by month and clearance sector
Month Pacific Churchill Thunder
Bay Eastern Atlantic Prairie Total
Wheat Wheat Flour
Total Wheat and
Wheat Flour
August2006
September
October
November
December
January2007
February
March
April
May
June
July
8511
5704
8040
7955
8203
5937
6592
8165
8179
9907
8970
7526
314
1272
1816
440
-
-
-
-
-
-
-
275
(000rsquos tonnes)
181 5684
92 8316
391 6986
193 6744
271 6074
- 2956
- 3048
- 2458
221 5378
588 4839
179 6073
575 4294
-
-
-
-
-
76
-
64
-
-
-
-
1000
1213
1665
1599
1590
1900
1722
1843
2376
2010
1999
2152
1 5690
1 6597
1 8898
1 6931
1 6137
1 0869
1 1362
1 2530
1 6154
1 7343
1 7221
1 4821
254
243
278
291
280
291
226
226
234
250
284
234
1 5944
1 6839
1 9176
1 7222
1 6417
1 1160
1 1588
1 2756
1 6388
1 7594
1 7505
1 5055
Grand total exported 9 3687 4117 2691 6 2851 140 2 1067 18 4554 3090 18 7644
Canadian Grain Commission wwwgrainscanadagcca 28
Canadian Grain Exports Crop year 2006 - 2007
12 Exports of special crops and processed productssup1
Country Beans Buckwheat Canary Seed Chick Peas Lentils Mustard Seed
Western Europe Austria Belgium Denmark Finland France Germany Greece Iceland Ireland Italy Malta Netherlands Norway Portugal Spain Sweden Switzerland United Kingdom
41 1 047
22 -
4 006 2 912 7 651
-1 911
22 539 114
13 999 -
7 978 6 130
206 825
67 966
36 ----
77 ------
155 ----
16
(tonnes)
30 489 5 - 4 751 - -- -
46 1 903 1 141 286
839 471 - -
23 -3 262 7 833
844 -731 895
- -4 615 6 126
13 699 5 629 90 267
- 658 45 4 713
71 9 331
-22
9 301 12 641 11 032
147 22
23 135 -
4 250 -
3 663 30 301
424 671
6 462
25 852 --
492 2 345
15 812 295
--
167 -
5 980 --
79 20
145 1 593
Total Eastern Europe Albania Armenia Azerbaijan Belarus Bosnia-Herzegovina Bulgaria Byelorussia SSR Croatia Czech Republic Estonia Georgia Hungary Latvia Lithuania Macedonia Moldova Montenegro Poland Romania Russia Serbia Slovakia Slovania Ukraine Yugoslavia
137 347
61 --
23 1 624
90 23
2 546 1 584
-98
1 186 -
40 --
468 206
-237
-705 822
-20
284
-------------------------
55 824 33 535
- -- 22 - -- -- 23
21 -- -- 80 - 65 - -- 23 - -- -- -- -- -- -- 25 - -
20 -- -- -- -- 19 - -
111 473
-889
50 --
2 407 -
127 4 413
-956
1 226 --
317 --
519 -
68 23
809 ---
52 780
-------
80 42
--------
571 80 43
-----
Total 9 733 - 41 257 11 804 816
sup1 Source Statistics Canada
Canadian Grain Commission wwwgrainscanadagcca 29
Canadian Grain Exports Crop year 2006 - 2007
12 Exports of special crops and processed productssup1
Processed Productssup3
Country Peas Soybeanssup2 Sunflower Canola Oil Canola Meal (tonnes)
Western Europe Austria 2 3 - - -Belgium 55 353 182 203 45 731 -Denmark 21 601 30 210 - - -Finland - - - - -France 1 057 32 812 24 8 -Germany 878 920 49 63 577 -Greece 220 - - - -Iceland - - - - -Ireland 68 1 749 - - -Italy 7 587 874 23 - -Malta 69 - - - -Netherlands 11 949 316 202 - 85 930 -Norway 8 181 26 840 84 - -Portugal 1 263 65 503 80 67 -Spain 169 357 8 693 68 49 -Sweden - - 141 - -Switzerland 20 - - 20 -United Kingdom 4 881 - - - -Total 282 486 666 009 514 150 382 -
Eastern Europe Albania - - - - -Armenia 68 - - - -Azerbaijan - - - - -Belarus - - - - -Bosnia-Herzegovina - - - - -Bulgaria - - - - -Byelorussia SSR - - - - -Croatia 15 - 21 - -Czech Republic 91 325 - 79 -Estonia 1 268 - - - -Georgia 355 - - - -Hungary 904 20 - - -Latvia - - 68 - -Lithuania - 40 - - -Macedonia - - - - -Moldova - - - 70 -Montenegro - - - - -Poland 216 810 - - -Romania - 678 22 - -Russia 3 999 1 199 - - -Serbia - - - - -Slovakia - 103 - - -Slovania - - 1 - -Ukraine - 157 - - -Yugoslavia - - - - -Total 6 916 3 332 112 149 -sup1 Source Statistics Canada sup2 September-August crop year sup3 Refers to weight of processed product Conversion rates to grain equivalents Barley malt ndash 1339 Canola oil ndash 2387 Canola meal ndash 1607 Exports of barley malt were 621 thousand tonnes (558 thousand in 2005-2006) Country of destination not available due to confidentiality
Canadian Grain Commission wwwgrainscanadagcca 30
Canadian Grain Exports Crop year 2006 - 2007
12 Exports of special crops and processed productssup1
Country Beans Buckwheat Canary Seed Chick Peas Lentils Mustard Seed
Africa Algeria Angola Benin British Indian Ocean Terr Burundi Cameroon Cape Verde Central African Republic Chad Comoros Congo Cocircte-drsquoIvoire Djibouti Egypt Ethiopia Gambia Ghana Guinea Kenya Liberia Madagascar Malawi Mauritania Mauritius Morocco Mozambique Namibia Niger Rwanda Senegal Sierra Leone South Africa St Helena Swaziland Tanzania Togo Tunisia Uganda Zaire Zambia Zimbabwe
672 16 658
-18
-505 50
---
645 88
-2 814
----------
516 -
75 ----
867 ------
521 --
-----------------------------------------
(tonnes)
1 609 4 410 - -- -- -- -- -- -- -- -- -- -- 5 - -
1 021 2 373 - -- -- -- -- -- -- -- -- -1 20
660 -- -- -- -- -- -- -
479 163 - -- -- -- -- 720 - -- -- -- -
69 735 268
-14
--------
200 29 206
----
175 60
--
100 1 264
28 577 ----
850 -
3 350 ----
528 ----
-----------------------
68 326
----
1 466 -
267 ---------
Total 23 409 - 3 770 7 691 134 327 2 127
sup1 Source Statistics Canada
Canadian Grain Commission wwwgrainscanadagcca 31
Canadian Grain Exports Crop year 2006 - 2007
12 Exports of special crops and processed productssup1
Processed Productssup3
Country Peas Soybeanssup2 Sunflower Canola Oil Canola Meal (tonnes)
Africa Algeria 6 484 - 1 210 - -Angola - - - - -Benin 475 - - - -British Indian Ocean Terr 16 - - - -Burundi 1 783 - - - -Cameroon - 204 - - -Cape Verde 125 - - - -Central African Republic 200 - - - -Chad 500 - - - -Comoros - - - 80 -Congo 8 - - - -Cocircte-drsquoIvoire 800 - - - -Djibouti - - - - -Egypt 5 984 42 723 526 - -Ethiopia 3 150 - - - -Gambia 291 - - - -Ghana 100 - - - -Guinea 350 - - - -Kenya 12 025 - - - -Liberia 1 050 - - - -Madagascar 836 - - - -Malawi 50 255 - - -Mauritania 620 - - - -Mauritius 591 187 18 - -Morocco 3 648 137 - - -Mozambique 450 - - - -Namibia - - - - -Niger 175 - - - -Rwanda 625 - - - -Senegal 297 - - - -Sierra Leone 1 125 - - - -South Africa 12 709 68 - - -St Helena - 41 - - -Swaziland 70 156 - - -Tanzania 4 350 - - - -Togo 25 - - - -Tunisia - - - - -Uganda 2 625 - - - -Zaire 4 225 - - - -Zambia 400 - - - -Zimbabwe 450 - - - -
Total 66 612 43 771 1 754 80 -sup1 Source Statistics Canada sup2 September-August crop year sup3 Refers to weight of processed product Conversion rates to grain equivalents Barley malt ndash 1339 Canola oil ndash 2387 Canola meal ndash 1607 Exports of barley malt were 621 thousand tonnes (558 thousand in 2005-2006) Country of destination not available due to confidentiality
Canadian Grain Commission wwwgrainscanadagcca 32
Canadian Grain Exports Crop year 2006 - 2007
12 Exports of special crops and processed productssup1
Country Beans Buckwheat Canary Seed Chick Peas Lentils Mustard Seed
Asia Afghanistan Bahrain Bangladesh Bhutan Brunei Darussalam Cambodia China PR Cyprus East Timor Hong Kong India Indonesia Iran Israel Japan Jordan Korea North Korea South Kuwait Lebanon Macau Malaysia Mongolia Nepal Oman Pakistan Philippines Qatar Saudi Arabia Singapore Somalia Sri Lanka Sudan Syrian Arab Rep Taiwan Thailand Turkey United Arab Emirates Vietnam Yemen
-------
11 599 16 69 23
-1 401
21 977 -
1 860 4 485
59 467
-256
---
40 269 50
2 415 40
----
4 348 -
175 568
--
--------------
2 031 -------3 -----------------
(tonnes)
- -- -- 1 305 - -- -
22 -128 -176 91
- -5 9
22 12 903 1 434 44
- -345 2 056
1 339 336 86 15 467
- -111 -
43 270 279 3 569
- -- -- -- -- -- 17 108
334 23 - 49
83 6 183 - -- -- -- -- -
830 -22 -
235 -151 3 607
- -- -
1 595
40 320 ---
967 1 054
-30
130 075 197
9 604 6 085
318 1 384
--
291 3 599
----
199 61 096
-343
2 962 1 618
-19 022
500 113 22
-31 125 81 544
-99
--
3 899 ---
50 ---
4 172 --
65 6 386
--
2 699 ---
33 ----
56 ----
467 --
41 3 610
125 165
--
Total 39 128 2 034 5 645 63 020 393 163 21 768
sup1 Source Statistics Canada
Canadian Grain Commission wwwgrainscanadagcca 33
Canadian Grain Exports Crop year 2006 - 2007
12 Exports of special crops and processed productssup1
Processed Productssup3
Country Peas Soybeanssup2 Sunflower Canola Oil Canola Meal (tonnes)
Asia Afghanistan - - - - -Bahrain 973 - 96 43 -Bangladesh 110 049 - - - -Bhutan 86 - - - -Brunei Darussalam - 142 - - -Cambodia 249 - - - -China PR 251 442 2 400 - 263 814 407 Cyprus - - - - -East Timor - - - - -Hong Kong 2 30 126 7 25 289 -India 895 514 - 146 31 -Indonesia 12 907 522 - 8 -Iran 5 602 244 428 - - -Israel 4 494 25 152 63 12 -Japan 10 924 276 542 124 19 631 315 Jordan 812 80 136 - -Korea North 64 - 74 - -Korea South 563 60 - 35 567 -Kuwait 413 - 476 761 -Lebanon 528 - 262 70 -Macau - 20 - - -Malaysia 2 880 136 409 23 26 096 -Mongolia - - - - -Nepal 5 455 - - - -Oman 214 - - 14 -Pakistan 45 122 - 45 - -Philippines 13 477 12 975 47 635 10 530 Qatar 311 - 48 14 -Saudi Arabia 8 025 869 325 14 -Singapore 1 749 42 834 - 162 -Somalia 2 950 - - - -Sri Lanka 1 701 - - - -Sudan 3 450 - - - -Syrian Arab Rep - 4 303 2 429 - -Taiwan 11 590 8 168 - 26 952 7 033 Thailand 8 982 20 740 - 3 -Turkey 680 21 020 353 - -United Arab Emirates 38 481 134 12 694 531 -Vietnam 45 241 - 217 -Yemen 6 232 43 - - -
Total 1 445 966 827 208 17 348 399 864 18 285
sup1 Source Statistics Canada sup2 September-August crop year sup3 Refers to weight of processed product Conversion rates to grain equivalents Barley malt ndash 1339 Canola oil ndash 2387 Canola meal ndash 1607 Exports of barley malt were 621 thousand tonnes (558 thousand in 2005-2006) Country of destination not available due to confidentiality
Canadian Grain Commission wwwgrainscanadagcca 34
Canadian Grain Exports Crop year 2006 - 2007
12 Exports of special crops and processed productssup1
Country Beans Buckwheat Canary Seed Chick Peas Lentils Mustard Seed (tonnes)
Oceania Australia 3 807 - 211 - 1 366 1 062 Cocos Islands - - - - - -Fiji - - - - - -New Zealand 1 814 - 391 22 228 3 US Outlying Islands - - - 45 - -
Total 5 621 - 602 67 1 594 1 065
Processed Productssup3
Country Peas Soybeanssup2 Sunflower Canola Oil Canola Meal (tonnes)
Oceania Australia 1 094 42 179 3 -Cocos Islands 119 - - - -Fiji 90 - - 30 -New Zealand 158 571 - 208 -US Outlying Islands - - - - -
Total 1 461 613 179 241 -
sup1 Source Statistics Canada sup2 September-August crop year sup3 Refers to weight of processed product Conversion rates to grain equivalents Barley malt ndash 1339 Canola oil ndash 2387 Canola meal ndash 1607 Exports of barley malt were 621 thousand tonnes (558 thousand in 2005-2006) Country of destination not available due to confidentiality
Canadian Grain Commission wwwgrainscanadagcca 35
Canadian Grain Exports Crop year 2006 - 2007
12 Exports of special crops and processed productssup1
Country Beans Buckwheat Canary Seed Chick Peas Lentils Mustard Seed
Western Hemisphere Antigua-Barbuda Argentina Aruba Barbados Belize Bermuda Bolivia Brazil British Virgin Islands Chile Colombia Costa Rica Cuba Dominica Dominican Republic Ecuador El Salvador Grenada Guatemala Guyana Haiti Honduras Jamaica Mexico Netherlands Antilles Nicaragua Panama Paraguay Peru St Kitts-Nevis St Vincent Gren Ste Lucie Surinam Trinidad-Tobago United States Uruguay Venezuela
7 -4 3
137 ----
256 45
643 510 60
12 714 43 67 29
1 514 1
6 202 -
1 736 4 189
3 -
426 --5 3
18 15
489 102 440
-2 375
---------------------------------1
1 537 --
(tonnes)
- -- 5 - -8 6 - -- -- -
21 558 106 - -
4 871 140 11 276 3 550
581 127 390 106
- -746 149
1 235 203 371 -
- -1 746 33
- 181 - -
22 -- -
42 583 -- -- -
75 14 - -
7 012 163 - -- -- -
32 27 172 659
13 062 5 112 116 -
6 186 45
5 1 822
1 68
--
1 323 10 965
-16 866 54 177
686 -
110 176
18 440 -
79 74
---
23 31 513
--
8 765 58
20 825 5
16 45
-1 325 6 361 2 451
23 015
-103
--1 --
569 -
285 74 16
---
203 200
-150
----
20 ----
296 ----
34 71 359
40 1 025
Total
Grand total exported
133 934
349 172
1 538
3 856
112 042 10 626
177 924 115 196
199 194
851 555
74 375
152 931
sup1 Source Statistics Canada
Canadian Grain Commission wwwgrainscanadagcca 36
Canadian Grain Exports Crop year 2006 - 2007
12 Exports of special crops and processed productssup1
Processed Productssup3
Country Peas Soybeanssup2 Sunflower Canola Oil Canola Meal (tonnes)
Western Hemisphere Antigua-Barbuda 9 - - - -Argentina - - - - -Aruba 3 - - - -Barbados 215 1 14 2 -Belize 71 - - - -Bermuda - - - 219 -Bolivia - - - - -Brazil 10 049 - - - -British Virgin Islands - 4 - - -Chile 5 053 - 84 22 -Colombia 34 159 - 312 3 342 -Costa Rica 604 - 421 24 -Cuba 26 968 39 2 - -Dominica 21 - - 1 -Dominican Republic 398 23 161 - -Ecuador 3 106 - - - -El Salvador - - 69 - -Grenada 150 - - - -Guatemala 45 - 539 9 -Guyana 2 947 - - - -Haiti - - - - -Honduras - - 165 - -Jamaica - 625 - - -Mexico 9 331 69 2 289 31 661 5 798 Netherlands Antilles - - - - -Nicaragua 875 - - - -Panama 1 327 186 229 - -Paraguay 8 - - - -Peru 13 338 - - 33 -St Kitts-Nevis 5 - - - -St Vincent Gren - 1 - - -Ste Lucie 20 1 - - -Surinam 802 125 22 8 -Trinidad-Tobago 5 448 215 89 82 -United States 34 482 198 369 96 576 719 403 1 458 082 Uruguay 15 - - - -Venezuela 16 259 - 108 - -
Total 165 708 199 658 101 080 754 806 1 463 880
Grand total exported 1 969 149 1 740 591 120 987 1 305 522 1 482 165
sup1 Source Statistics Canada sup2 September-August crop year sup3 Refers to weight of processed product Conversion rates to grain equivalents Barley malt ndash 1339 Canola oil ndash 2387 Canola meal ndash 1607 Exports of barley malt were 621 thousand tonnes (558 thousand in 2005-2006) Country of destination not available due to confidentiality
Canadian Grain Commission wwwgrainscanadagcca 37
Canadian Grain Exports Crop year 2006 - 2007
13 Ocean freight rates
From
To Japan
North Pacificsup1
Korea South China PR
St Lawrencesup1
Iran
August 2006
September
October
November
December
January 2007
February
March
April
May
June
July
3220
3650
3780
4100
4100
3960
3675
3975
4100
4520
4150
5200
($ US per short tonne)
3120 na
3550 na
3900 na
4300 na
4200 na
4080 na
3825 na
4075 na
4200 na
4620 na
4250 na
5300 na
4640
4800
4900
4825
5000
5120
4950
5225
5375
5940
6000
6700
Average 4036 4118 na 5290
sup1 Rates are calculated for heavy grains on largest sized vessel (type B-vessel size = over 35 000 tonnes) in most general use appropriate to specified route ready to load in three to four weeks time
Source International Grain Council
Canadian Grain Commission wwwgrainscanadagcca 38
Canadian Grain Exports Crop year 2006 - 2007
14 Estimated costs of moving wheat from a mid-prairie point to export position
Crop Year 200102 200203 200304 200405 200506 200607p
Primary Elevator Costs Elevation (1) Removal of dockage Shrinkage Carrying charges (2)
Railway Freight Via Thunder Bay Via Vancouver
Marketing (3)
Terminal Elevator Costs Storage (4) Fobbing charges - via St Lawrence ports (5) - via Pacific seaboard (5)
Lake Transportation (6)
Transfer Elevator Costs Storage Fobbing charges (7)
1118 368 022 245
3443 3378
-225
094
823 842
1917
192 230
1163 383 025 353
3343 3377
-008
167
873 890
1893
347 231
$tonne
1190 1190 440 440
- -196 186
3326 3402 3445 3471
277 083
102 148
903 926 920 936
1892 1928
173 362 232 232
1220 450
-230
3436 3506
315
130
954 982
1991
341 231
1251 462
-209
3805 3809
494
128
978 1006
2185
345 232
Total - via St Lawrence ports - via Pacific seaboard
8227 5842
8770 6350
8731 8897 6570 6454
9298 6833
10089 7359
P - Preliminary
Mid-Prairie point being Brass Saskatchewan
(1) Filed tariff for receiving elevating and loading
(2) Carrying charges on wheat stored in country elevators
(3) Includes interest bank and other charges and Canadian Wheat Board administrative costs interest and depreciation on CWB hopper cars drying additional freight and demurragedespatch
(4) Storage charges on wheat stored in terminal elevators
(5) Thunder Bay and Pacific fobbing charge which includes elevation outward weighing and inspection terminal elevator receipt cancellation lake shippersrsquo charges superintendence and forwarding brokerage charges
(6) Includes elevation outward weighing and inspection terminal elevator receipt cancellation BC Shippersrsquo charges superintendence wharfage and forwarding brokerage charges
(7) Includes lake freight lake brokerage cargo rates insurance St Lawrence Seaway and Welland Canal tolls and inward elevation into transfer elevator
Canadian Grain Commission wwwgrainscanadagcca 39
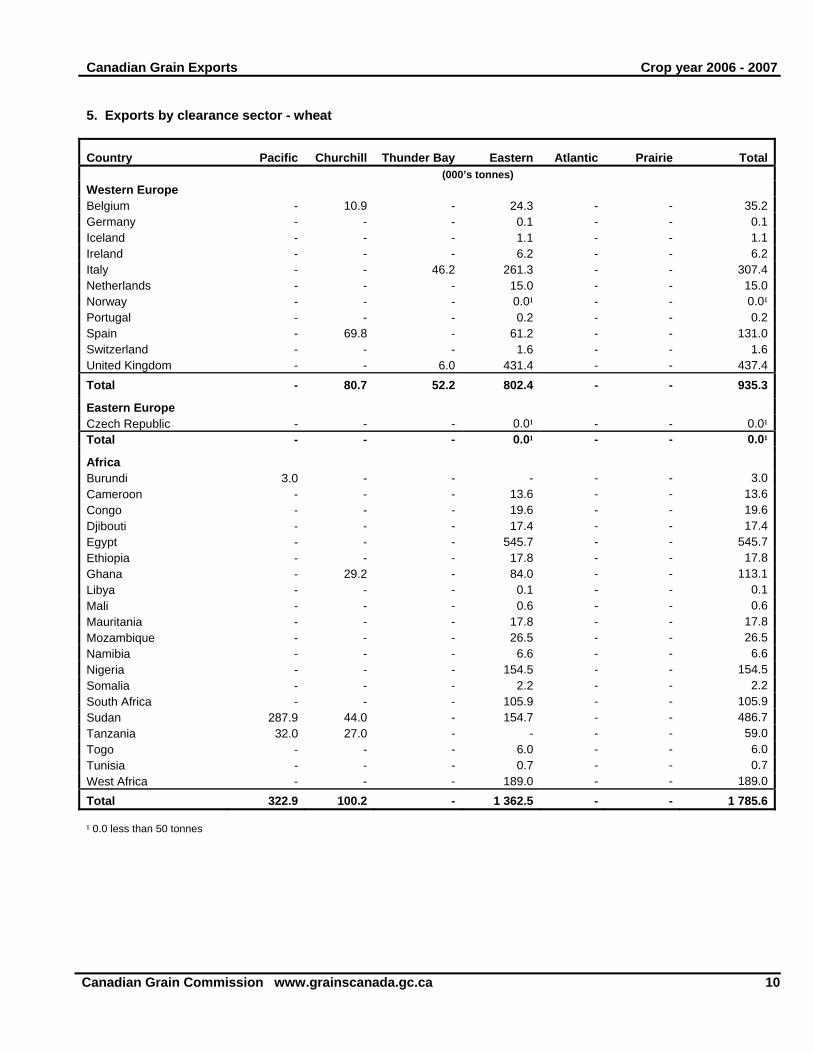
Canadian Grain Exports Crop year 2006 - 2007
5 Exports by clearance sector - wheat
Country Pacific Churchill Thunder Bay Eastern Atlantic Prairie Total
Asia Bangladesh China PR India Indonesia Iraq Japan Korea South MalaysiaPhilippines Singapore Sri Lanka Taiwan Thailand United Arab Emirates Vietnam Yemen
3086 441
7884 1 5428
6211 9088 1104 1364 3595 362
9237 63
2455 1517 2583
-
----------------
(000rsquos tonnes)
- -- -- 2624 - -- -- -- -- -- -- -- -- -- -- -- -- 62
----------------
----------------
3086 441
1 0508 1 5428
6211 9088 1104 1364 3595 362
9237 63
2455 1517 2583
62 Total
Oceania New Zealand
6 4417
163
-
-
- 2686
- -
-
-
-
-
6 7103
163 Total
Western Hemisphere Brazil Caribbean Chile ColombiaCuba Dominican Republic Ecuador Guatemala Guyana Mexico Peru Puerto Rico United States Venezuela
163
--
368 3665
--
2747 470
-6983 3575
-159
-
-
275 --------
1292 ----
- -
- 1529 - -- -- 339 - 893 - 108 - -- -- 372 - 1951 - -
180 535 - 1318
275 4200
-
--------
140 -----
-
-1523
-------
1987 -
86 1 0703
89
163
1804 1523 368
4004 893 108
2747 470 513
1 2212 3575 800
1 2180 4563
Total
Grand Total Exported
1 7967
8 5777
1567
3375
455 1 1244
977 3 5580
140
140
1 4387
1 4387
4 5761
14 0236
Canadian Grain Commission wwwgrainscanadagcca 11
Canadian Grain Exports Crop year 2006 - 2007
5 Exports by clearance sector ndash durum wheat
Country Pacific Churchill Thunder Bay Eastern Prairie Total
Western Europe Belgium ItalyNetherlands Portugal Switzerland
-----
219 ----
(000rsquos tonnes)
-268 447
--
1915 5899 1723 267 15
-----
2134 6166 2170 267 15
Total
Eastern Europe Czech Republic
-
-
219
-
715
-
9817
00sup1
-
-
1 0751
00sup1
Total
Africa AlgeriaLibyaMorocco South Africa Tunisia
-
----
270
-
--
275 -
248
-
--
761 --
00sup1
6595 1152 4283 155 816
-
-----
00sup1
6595 1152 5319
155 1334
Total
Asia India Indonesia Japan Singapore Sri Lanka United Arab Emirates
270
1990 168
2469 04
883 546
523
------
761
------
1 3000
------
-
------
1 4554
1990 168
2469 04
883 546
Total
Western Hemisphere Caribbean Chile Colombia Cuba Ecuador Guatemala Mexico Peru United States Venezuela
6060
-609 166
-172 51
-583
--
-
----------
-
---------
239
-
---
96 -----
4357
-
159 -----
74 -
6358 89
6060
159 609 166 96
172 51 74
583 6358 4685
Total
Grand Total Exported
1581
7911
-
742
239
1715
4454
2 7271
6680
6680
1 2953
4 4318
sup1 00 less than 50 tonnes
Canadian Grain Commission wwwgrainscanadagcca 12
Canadian Grain Exports Crop Year 2006 - 2007
5 Exports by clearance sector - oats
Country Pacific Churchill Thunder Bay Eastern Prairies Total
Western Europe Norway - -
(000rsquos tonnes)
367 - - 367 Total
Africa South Africa
-
-
-
-
367
133
-
-
-
-
367
133 Total
Asia Japan
-
114
-
-
133
-
-
-
-
-
133
114 Total
Western Hemisphere Ecuador Mexico Puerto Rico United States
114
139 289
--
-
----
-
---
1721
-
--
20 -
-
-69
-1 2671
114
139 358
20 1 4392
Total
Grand Total Exported
428
542
-
-
1721
2221
20
20
1 2740
1 2740
1 4908
1 5522
5 Exports by clearance sector - barley
Country Pacific Churchill Thunder Bay Eastern Prairies Total
Eastern Europe Czech Republic - -
(000rsquos tonnes)
- 00sup1 - 00sup1
Total
Africa South Africa
-
506
-
-
-
-
00sup1
-
-
-
00sup1
506 Total
Asia China PR Japan Vietnam
506
3946 3127 130
-
---
-
---
-
---
-
---
506
3946 3127 130
Total
Western Hemisphere Colombia Ecuador Mexico Peru United States
7203
728 176
-133
-
-
-----
-
----
506
-
----
12
-
99 -
197 -
2205
7203
826 176 197 133
2723 Total
Grand Total Exported
1037
8746
-
-
506
506
12
12
2501
2501
4055
1 1765
sup1 00 less than 50 tonnes
Canadian Grain Commission wwwgrainscanadagcca 13
Canadian Grain Exports Crop year 2006 - 2007
5 Exports by clearance sector ndash flaxseed
Country Pacific Churchill Thunder Bay Eastern Prairie Total (000rsquos tonnes)
Western Europe Belgium - - 4549 112 - 4661 Total - - 4549 112 - 4661
Asia Japan 157 - - - - 157 Total 157 - - - - 157
Western Hemisphere United States - - - 02 978 980 Total - - - 02 978 980
Grand Total Exported 157 - 4549 114 978 5797
5 Exports by clearance sector ndash canola
Country Pacific Churchill Thunder Bay Eastern Prairie Total
Asia Bangladesh China PR Israel Japan Nepal Pakistan TurkeyUnited Arab Emirates
944 9157
-1 9608
124 5098
-2817
-----
390 --
(000rsquos tonnes)
--
78 ---
234 -
------
55 -
--------
944 9157
78 1 9608
124 5488 289
2817
Total
Oceania Australia
3 7748
571
390
-
312
-
55
-
-
-
3 8504
571 Total
Western Hemisphere Mexico United States
571
5005 -
-
--
-
2941 02
-
667 -
-
384 6589
571
8997 6591
Total
Grand Total Exported
5005
4 3323
-
390
2943
3255
667
723
6973
6973
1 5588
5 4664
Canadian Grain Commission wwwgrainscanadagcca 14
Canadian Grain Exports Crop year 2006 - 2007
5 Exports by clearance sector ndash soybean
Country Pacific Churchill Thunder Bay Eastern Prairie Total
Western Europe Belgium Denmark France Ireland ItalyNetherlands NorwayPortugal Spain United Kingdom
----------
----------
(000rsquos tonnes)
160 ---------
1446 302 466 17 31
2405 268 653 132 216
----------
1606 302 466 17 31
2405 268 653 132 216
Total
Africa Egypt
-
-
-
-
160
-
5938
157
-
-
6098
157 Total
Asia Iran Israel Japan Korea North Malaysia Syria United Arab Emirates
-
-------
-
-------
-
-------
157
2252 238 176 239 605 43 85
-
-------
157
2252 238 176 239 605 43 85
Total
Western Hemisphere Cuba United States
-
--
-
--
-
--
3638
206 -
-
-186
3638
206 186
Total
Grand Total Exported
-
-
-
-
-
160
206
9939
186
186
392
1 0285
Canadian Grain Commission wwwgrainscanadagcca 15
Canadian Grain Exports Crop year 2006 - 2007
5 Exports by clearance sector ndash peas
Country Pacific Churchill Thunder Bay Eastern Prairie Total
Western Europe Belgium Denmark Netherlands NorwaySpain
----
185
----
656
(000rsquos tonnes)
535 135
-82
494
-81
106 -
62
-----
535 216 106 82
1397 Total
Africa Algeria
185
-
656
-
1246
-
248
245
-
-
2335
245 Total
Asia Bangladesh India Nepal Pakistan United Arab Emirates
-
1901 9407
25 387 110
-
-----
-
-----
245
-----
-
-----
245
1901 9407
25 387 110
Total
Western Hemisphere Colombia Cuba United States
1 1830
25 490
-
-
---
-
---
-
---
-
--
02
1 1830
25 490
02 Total
Grand Total Exported
515
1 2530
-
656
-
1246
-
494
02
02
518
1 4928
5 Exports by clearance sector ndash corn
Country Pacific Churchill Thunder Bay Eastern Prairie Total (000rsquos tonnes)
Western Europe Iceland - - - 106 - 106 Total - - - 106 - 106
Africa Algeria - - - 219 - 219 Total - - - 219 - 219
Asia Iran - - - 1561 - 1561 Israel - - - 45 - 45 Total - - - 1606 - 1606
Western Hemisphere United States - - - 00sup1 03 04 Total - - - 00sup1 03 04
Grand Total Exported - - - 1930 03 1933 sup1 00 less than 50 tonnes
Canadian Grain Commission wwwgrainscanadagcca 16
Canadian Grain Exports Crop year 2006 - 2007
6 Exports by class - wheat
Country CWRS CPS CWRW Feed CWES CWHWS CE Other CWAD Total
Western Europe Belgium Germany Iceland Ireland Italy Netherlands Norway Portugal Spain Switzerland United Kingdom
351 01 11 62
2833 141 00sup1
-863 16
4318
----------
40
----
02 -----
11
-------
02 --
04
(000rsquoS tonnes)
- 00sup1 - -- -- -
236 03 - 01 - -- -- -- -- 01
-----
08 --
448 --
-----------
2134 ---
6166 2170
-267
-15
-
2486 01 11 62
9241 2320
00sup1 269
1310 30
4374
Total
Eastern Europe Czech Republic
8596
00sup1
40
-
13
-
06
-
236 06
- -
455
-
-
-
1 0751
00sup1
2 0104
00sup1
Total
Africa Algeria Burundi Cameroon Congo Djibouti Egypt Ethiopia Ghana Libya Mali Mauritania Morocco Mozambique Namibia Nigeria Somalia South Africa Sudan Tanzania Togo Tunisia West Africa
00sup1
-30
136 80
---
999 -
06 05
-265 66
1384 22
809 4428 590 60 07
1820
-
---------------------
40
-
------
22 77
-------------
30
-
----------------------
- -
- -- -- -- 116 - -- -- -- -- 01 - -- -- -- -- -- 95 - -- 249 - 319 - -- -- -- -
-
----
174 5457 156 55
--
173 ------
119 ----
-
--------------
66 -------
00sup1
6595 -------
1152 --
5319 ----
155 ---
1334 -
00sup1
6595 30
136 196 174
5457 178
1131 1152
06 178
5319 265
66 1545
22 1213 4867
590 60
1341 1890
Total 1 0708 40 129 - - 779 6133 66 1 4554 3 2410
sup1 00 less than 50 tonnes
Note Refer to page 4 for class definitions
Canadian Grain Commission wwwgrainscanadagcca 17
Canadian Grain Exports Crop year 2006 - 2007
6 Exports by class - wheat
Country CWRS CPS CWRW Feed CWES CWHWS CE Other CWAD Total
Asia Bangladesh China PR India Indonesia Iraq Japan Korea South Malaysia Philippines Singapore Sri Lanka Taiwan Thailand United Arab Emirates Vietnam Yemen
3086 441
4374 1 3249
6211 867 7 1104 1199 2932 180 852 63
1928 1410 1682
-
--
1514 545
---
30 --
303 -
10 ---
--
1996 392
---
05 --
477 -
80 ---
(000rsquoS tonnes)
- - -- - -- - -- - 1243 - - -
411 - -- - -- - 129 - - 664 - - 182 - - 980 - - -- - 438 - - 107 - - 126 - - -
--
2624 ------------
62
----------
6625 ---
775 -
--
1990 168
-2469
---
04 883
--
546 --
3086 441
1 2498 1 5596
6211 1 1557
1104 1364 3595 366
1 0120 63
2455 2063 2583
62
Total
Oceania New Zealand
4 7387
163
2402
-
2950
-
411 - 3868
- - -
2686
-
7400
-
6060
-
7 3163
163
Total
Western Hemisphere Brazil Caribbean Chile Colombia Cuba Dominican Republic Ecuador Guatemala Guyana Mexico Peru Puerto Rico United States Venezuela
163
1690 1523 368
3866 893 59
2747 470 366
1 0493 3327 271
1 0415 4519
-
---------
255 --
33 44
-
---
138 ------
248 -
70 -
- - -
- - 114 - - -- - -- - -- - -- - -- - -- - -- - 137
16 - 1104 - - -- - 327
68 - 265 - - -
-
-----
49 --
10 344
-202
1186 -
-
------------
143 -
-
-159 609 166
96 -
172 51
-74
583 -
6358 4685
163
1804 1682
978 4170
989 108
2918 521 513
1 2286 4158 800
1 8539 9248
Total
Grand Total Exported
4 1008
10 7862
331
2813
456
3548
83 - 1948
501 236 6600
1792
1 1066
143
7609
1 2953
4 4318
5 8714
18 4554
Note Refer to page 4 for class definitions
Canadian Grain Commission wwwgrainscanadagcca 18
Canadian Grain Exports Crop year 2006 - 2007
7 Exports by grade - oats
Country No 1 CW No 2 CW CE Other Total
Western Europe Norway - 367
(000rsquos tonnes)
- - 367 Total
Africa South Africa
-
-
367
133
-
-
-
-
367
133 Total
Asia Japan
-
38
133
75
-
-
-
-
133
114 Total
Western Hemisphere Ecuador Mexico Puerto Rico United States
38
-69
-1 2671
75
139 289
--
-
--
20 -
-
---
1721
114
139 358 20
1 4392 Total
Grand Total Exported
1 2740
1 2778
428
1004
20
20
1721
1721
1 4908
1 5522
7 Exports by grade - barley
Country Select Feed CE Total
Eastern Europe Czech Republic 00sup1
(000rsquos tonnes)
- - 00sup1
Total
Africa South Africa
00sup1
-
-
506
-
-
00sup1
506 Total
Asia China PR Japan Vietnam
-
3308 2811
-
506
639 316 130
-
---
506
3946 3127
130 Total
Western Hemisphere ColombiaEcuador Mexico Peru United States
6118
654 ---
608
1085
173 176 197 133
2103
-
----
12
7203
826 176 197 133
2723 Total
Grand Total Exported
1262
7380
2782
4372
12
12
4055
1 1765 sup1 00 less than 50 tonnes Note Refer to page 4 for class definitions
Canadian Grain Commission wwwgrainscanadagcca 19
Canadian Grain Exports Crop year 2006 - 2007
7 Exports by grade - flaxseedsup1
Country No 1 CW Total (000rsquos tonnes)
Western Europe Belgium 4661 4661 Total 4661 4661
Asia Japan 157 157 Total 157 157
Western Hemisphere United States 980 980 Total 980 980
Grand Total Exported 5797 5797
sup1 All exports graded as Flaxseed No 1 Canada Western
7 Exports by grade - canola
Country No 1 Canada No 2 Canada Others Total
Asia Bangladesh China PR Israel Japan Nepal Pakistan TurkeyUnited Arab Emirates
944 9157
78 1 9499
124 4983
289 2817
(000rsquos tonnes)
---
109 ----
-----
505 --
944 9157
78 1 9608
124 5488
289 2817
Total
Oceania Australia
3 7891
571
109
-
505
-
3 8504
571 Total
Western Hemisphere Mexico United States
571
8997 6591
-
--
-
--
571
8997 6591
Total
Grand Total Exported
1 5588
5 4050
-
109
-
505
1 5588
5 4664
Canadian Grain Commission wwwgrainscanadagcca 20
Canadian Grain Exports Crop year 2006 - 2007
7 Exports by grade - soybean
Country No 1 Canada No 2 Canada Others Total
Western Europe Belgium Denmark France Ireland ItalyNetherlands NorwayPortugal Spain United Kingdom
----------
(000rsquos tonnes)
1606 302 466 17 31
2405 268 653 132 216
----------
1606 302 466 17 31
2405 268 653 132 216
Total
Africa Egypt
-
-
6098
157
-
-
6098
157 Total
Asia Iran Israel Japan Korea North MalaysiaSyria United Arab Emirates
-
--
68 ----
157
2252 238 108
-605 43 85
-
---
239 ---
157
2252 238 176 239 605 43 85
Total
Western Hemisphere CubaUnited States
68
-186
3331
206 -
239
--
3638
206 186
Total
Grand Total Exported
186
255
206
9792
-
239
392
1 0285
Canadian Grain Commission wwwgrainscanadagcca 21
Canadian Grain Exports Crop year 2006 - 2007
7 Exports by grade - peas
Country All grades combined Total
Western Europe Belgium Denmark Netherlands NorwaySpain
(000rsquos tonnes)
535 216 106
82 1397
535 216 106
82 1397
Total
Africa Algeria
2335
245
2335
245 Total
Asia Bangladesh India Nepal Pakistan United Arab Emirates
245
1901 9407
25 387 110
245
1901 9407
25 387 110
Total
Western Hemisphere Colombia CubaUnited States
1 1830
25 490
02
1 1830
25 490
02 Total
Grand Total Exported
518
1 4928
518
1 4928
Canadian Grain Commission wwwgrainscanadagcca 22
Canadian Grain Exports Crop year 2006 - 2007
7 Exports by grade - corn
Country No2 CE No3 CE Other Total (000rsquos tonnes)
Western Europe Iceland - - 106 106 Total - - 106 106
Africa Algeria - - 219 219 Total - - 219 219
Asia Iran - - 1561 1561 Israel - 45 - 45 Total - 45 1561 1606
Western Hemisphere United States 00sup1 - 03 04 Total 00sup1 - 03 04
Grand Total Exported 00sup1 45 1888 1933
sup1 00 less than 50 tonnes
Note Refer to page 4 for class definitions
Canadian Grain Commission wwwgrainscanadagcca 23
Canadian Grain Exports Crop year 2006 - 2007
8 Exports by port of clearance
Loaded at Wheat Durum Wheat Oats Barley Flaxseed Canola Soybean Peas Corn Total
Prince Rupert
Vancouver
Churchill
Thunder Bay
Queacutebec
Baie-Comeau Ontario elevators
Owen Sound
Prescott
Goderich
Sarnia
Montreal
Port Cartier
Sorel
Trois-Riviegraveres
Halifax
Prairie elevators
4 4285
4 1492
3375
977
1 0333
7501
286
132
20
429
802
3412
9699
2960
05
140
1 4387
1732
6179
742
1715
8374
9920
-
-
-
-
-
3617
3575
872
913
-
6680
-
542
-
2221
-
-
-
-
-
-
-
-
-
20
-
-
1 2740
925
7821
-
506
-
-
-
-
12
-
-
00sup1
-
-
-
-
2501
(000rsquos tonnes)
- 2354
157 4 0969
- 390
4549 3255
- -
- -
- -
- -
02 -
- -
- -
- -
- 243
112 480
- -
- -
978 6973
-
-
-
160
1168
817
1294
-
-
453
-
2158
500
2690
859
-
186
- - 4 9295
1 2530 - 10 9690
656 - 5163
1246 - 1 4628
245 181 2 0300
- 125 1 8363
- - 1580
- - 132
- 00sup1 34
- - 882
- - 802
- 1360 1 0548
- - 1 4017
248 219 7601
- 45 1822
- - 140
02 03 4 4451
16
36
2
5
7
6
1
3
5
2
1
15
Grand total exported 140236 44318 15522 11765 5797 54664 10285 14928 1933 299448 100
sup1 00 less than 50 tonnes
Note Includes exports of Eastern wheat via unlicensed facilities
Canadian Grain Commission wwwgrainscanadagcca 24
Canadian Grain Exports Crop year 2006 - 2007
9 Exports by month and clearance sector
Wheat Durum Wheat Oats Barley Flaxseed Canola Soybean Peas Corn Total
Pacific August2006 September October November December January2007 February March April May June July
8135 5168 6703 6234 7717 5439 5918 8028 7584 9329 8494 7027
376 536
1337 1721 486 498 674 137 594 577 476 499
10 --
05 -
158 308 31
---
30
684 383
1129 1193
820 995
1163 786 650 769 19
155
(000rsquos tonnes)
18 2701 23 4418 08 4767
- 3362 23 2449 16 5131 08 3092 08 4036 14 3657 23 3418 16 2767
- 3525
------------
449 2687 960
1116 1109 964
1229 488
1508 1013
742 265
------------
1 2374 1 3215 1 4904 1 3631 1 2604 1 3200 1 2391 1 3513 1 4009 1 5131 1 2514 1 1500
Total
Churchill August2006 September October November July2007
8 5777
314 997
1350 440 275
7911
-275 467
--
542
-----
8746
-----
157 4 3323
- 390 - -- -- -- -
-
-----
1 2530
-456 200
--
-
-----
15 8985
703 1728 2016
440 275
Total
Thunder Bay August2006 September October November December March2007 April May June July
3375
--
175 193 160
--
365 84
-
742
181 92
216 -
111 -
221 224 95
575
-
158 157 335 594 272 142 113 151
-297
-
-22 29
---
66 44
131 214
- 390
160 258 329 792 597 212 839 191 757 -
- -537 706 593 671 160 211 577 213
-
--
50 -
31 --
79 --
656
156 202 467
53 97
-85 82
105 -
-
----------
5163
913 1595 2080 1870 1428
142 1727 2208
787 1876
Total 977 1715 2221 506 4549 3255 160 1246 - 1 4628
Canadian Grain Commission wwwgrainscanadagcca 25
Canadian Grain Exports Crop year 2006 - 2007
9 Exports by month and clearance sector
Wheat Durum Wheat Oats Barley Flaxseed Canola Soybean Peas Corn Total
Eastern August2006 September October November December January2007 February March April May June July
3987 5979 3375 4196 2839 1444 1619 1304 2771 1786 3404 2875
1697 2337 3610 2548 3235 1512 1430 1153 2607 3053 2669 1419
--
20 ---------
(000rsquos tonnes)
- 00sup1 00sup1 00sup1
- 00sup1 00sup1 09 00sup1 36 04 -
00sup1 00sup1 - -
02 00sup1 05 53 01 00sup1
- 14
69 -
285 ---
243 --
58 68
-
375 599
1120 2793 1830 649 311 239 515 421 642 444
53 115
-326
--------
--
00sup1 -
254 665 278
--
650 82
-
6181 9031 8411 9872 8194 4275 3881 2697 5896 6027 6866 4752
Total
Atlantic January2007 March
3 5580
76 64
2 7271
--
20
--
12 114
- -- -
723
--
9939
--
494
--
1930
--
7 6082
76 64
Total
Prairie August2006 September October November December January2007 February March April May June July
140
496 666
1089 1066 1195 1293 1260 1350 1656 1631 1334 1352
-
504 547 577 533 395 607 462 493 720 379 664 800
-
2209 1765 1481 1375 755
1028 778 960 798 781 407 403
- -
83 25 144 72 261 61 359 103 210 42 389 124 148 53 108 68 178 133 299 45 302 121 22 130
-
886 468 600 579 309 539 523 529 405 756 605 774
-
--
17 10
-11 03 24 15 20 60 27
-
----
01 ----
02 --
-
----------
03 00sup1
140
4203 3662 4085 4024 2905 3991 3226 3532 3904 3912 3497 3508
Total Grand total exported
1 4387
14 0236
6680
4 4318
1 2740
1 5522
2501 978
1 1765 5797
6973
5 4664
186
1 2085
02
1 4928
03
1933
4 4451
29 9448
sup1 00 less than 50 tonnes
Canadian Grain Commission wwwgrainscanadagcca 26
Canadian Grain Exports Crop year 2006 - 2007
10 Exports by class grade and clearance sector
Grade Pacific Churchill Thunder
Bay Eastern Atlantic Prairies Total
Wheat CWRS CPS CWRW Feed CWES CWHWS CE Other CWAD
6 7503 2656 3335 411
-4470
-7400 7911
3094 -
39 16
-227
--
742
(000rsquos tonnes)
774 2 2450 05 119
- 104 - 06
94 142 104 1494
- 1 1066 - 198
1715 2 7271
101 ----
39 ---
1 3941 33 70 68
-265
-11
6680
10 7862 2813 3548
501 236
6600 1 1066
7609 4 4318
Total
Oats No 1 CW No 2 CW CE Other
9 3687
38 503
--
4117
----
2691 6 2851
- -500 -
- 20 1721 -
140
----
2 1067
1 2740 ---
18 4554
1 2778 1004
20 1721
Total
Barley Select Feed CE
542
6673 2072
-
-
---
2221 20
506 -- 00sup1 - 12
-
---
1 2740
201 2300
-
1 5522
7380 4372
12 Total
Flaxseed No 1 CW
8746
157
-
-
506 12
4549 114
-
-
2501
978
1 1765
5797 Total
Canola No 1 Canada No 2 Canada Other
157
4 2710 109 504
-
389 -
01
4549 114
3255 723 - -- -
-
---
978
6973 --
5797
5 4050 109 505
Total
Soybean No 1 Canada No 2 Canada Other
4 3323
---
390
---
3255 723
- 68 160 9632
- 239
-
---
6973
186 --
5 4664
255 9792
239 Total
Peas All grades combined
-
1 2530
-
656
160 9939
1246 494
-
-
186
02
1 0285
1 4928 Total
Corn No 2 CE No 3 CE Other
1 2530
---
656
---
1246 494
- 00sup1 - 45 - 1885
-
---
02
--
03
1 4928
00sup1 45
1888 Total
Grand total exported
-
15 8985
-
5163
- 1930
1 4628 7 6082
-
140
03
4 4451
1933
29 9448 sup1 00 less than 50 tonnes Note Refer to page 4 for class definitions
Canadian Grain Commission wwwgrainscanadagcca 27
Canadian Grain Exports Crop year 2006 - 2007
11 Exports of wheat (including durum) and wheat flour by month and clearance sector
Month Pacific Churchill Thunder
Bay Eastern Atlantic Prairie Total
Wheat Wheat Flour
Total Wheat and
Wheat Flour
August2006
September
October
November
December
January2007
February
March
April
May
June
July
8511
5704
8040
7955
8203
5937
6592
8165
8179
9907
8970
7526
314
1272
1816
440
-
-
-
-
-
-
-
275
(000rsquos tonnes)
181 5684
92 8316
391 6986
193 6744
271 6074
- 2956
- 3048
- 2458
221 5378
588 4839
179 6073
575 4294
-
-
-
-
-
76
-
64
-
-
-
-
1000
1213
1665
1599
1590
1900
1722
1843
2376
2010
1999
2152
1 5690
1 6597
1 8898
1 6931
1 6137
1 0869
1 1362
1 2530
1 6154
1 7343
1 7221
1 4821
254
243
278
291
280
291
226
226
234
250
284
234
1 5944
1 6839
1 9176
1 7222
1 6417
1 1160
1 1588
1 2756
1 6388
1 7594
1 7505
1 5055
Grand total exported 9 3687 4117 2691 6 2851 140 2 1067 18 4554 3090 18 7644
Canadian Grain Commission wwwgrainscanadagcca 28
Canadian Grain Exports Crop year 2006 - 2007
12 Exports of special crops and processed productssup1
Country Beans Buckwheat Canary Seed Chick Peas Lentils Mustard Seed
Western Europe Austria Belgium Denmark Finland France Germany Greece Iceland Ireland Italy Malta Netherlands Norway Portugal Spain Sweden Switzerland United Kingdom
41 1 047
22 -
4 006 2 912 7 651
-1 911
22 539 114
13 999 -
7 978 6 130
206 825
67 966
36 ----
77 ------
155 ----
16
(tonnes)
30 489 5 - 4 751 - -- -
46 1 903 1 141 286
839 471 - -
23 -3 262 7 833
844 -731 895
- -4 615 6 126
13 699 5 629 90 267
- 658 45 4 713
71 9 331
-22
9 301 12 641 11 032
147 22
23 135 -
4 250 -
3 663 30 301
424 671
6 462
25 852 --
492 2 345
15 812 295
--
167 -
5 980 --
79 20
145 1 593
Total Eastern Europe Albania Armenia Azerbaijan Belarus Bosnia-Herzegovina Bulgaria Byelorussia SSR Croatia Czech Republic Estonia Georgia Hungary Latvia Lithuania Macedonia Moldova Montenegro Poland Romania Russia Serbia Slovakia Slovania Ukraine Yugoslavia
137 347
61 --
23 1 624
90 23
2 546 1 584
-98
1 186 -
40 --
468 206
-237
-705 822
-20
284
-------------------------
55 824 33 535
- -- 22 - -- -- 23
21 -- -- 80 - 65 - -- 23 - -- -- -- -- -- -- 25 - -
20 -- -- -- -- 19 - -
111 473
-889
50 --
2 407 -
127 4 413
-956
1 226 --
317 --
519 -
68 23
809 ---
52 780
-------
80 42
--------
571 80 43
-----
Total 9 733 - 41 257 11 804 816
sup1 Source Statistics Canada
Canadian Grain Commission wwwgrainscanadagcca 29
Canadian Grain Exports Crop year 2006 - 2007
12 Exports of special crops and processed productssup1
Processed Productssup3
Country Peas Soybeanssup2 Sunflower Canola Oil Canola Meal (tonnes)
Western Europe Austria 2 3 - - -Belgium 55 353 182 203 45 731 -Denmark 21 601 30 210 - - -Finland - - - - -France 1 057 32 812 24 8 -Germany 878 920 49 63 577 -Greece 220 - - - -Iceland - - - - -Ireland 68 1 749 - - -Italy 7 587 874 23 - -Malta 69 - - - -Netherlands 11 949 316 202 - 85 930 -Norway 8 181 26 840 84 - -Portugal 1 263 65 503 80 67 -Spain 169 357 8 693 68 49 -Sweden - - 141 - -Switzerland 20 - - 20 -United Kingdom 4 881 - - - -Total 282 486 666 009 514 150 382 -
Eastern Europe Albania - - - - -Armenia 68 - - - -Azerbaijan - - - - -Belarus - - - - -Bosnia-Herzegovina - - - - -Bulgaria - - - - -Byelorussia SSR - - - - -Croatia 15 - 21 - -Czech Republic 91 325 - 79 -Estonia 1 268 - - - -Georgia 355 - - - -Hungary 904 20 - - -Latvia - - 68 - -Lithuania - 40 - - -Macedonia - - - - -Moldova - - - 70 -Montenegro - - - - -Poland 216 810 - - -Romania - 678 22 - -Russia 3 999 1 199 - - -Serbia - - - - -Slovakia - 103 - - -Slovania - - 1 - -Ukraine - 157 - - -Yugoslavia - - - - -Total 6 916 3 332 112 149 -sup1 Source Statistics Canada sup2 September-August crop year sup3 Refers to weight of processed product Conversion rates to grain equivalents Barley malt ndash 1339 Canola oil ndash 2387 Canola meal ndash 1607 Exports of barley malt were 621 thousand tonnes (558 thousand in 2005-2006) Country of destination not available due to confidentiality
Canadian Grain Commission wwwgrainscanadagcca 30
Canadian Grain Exports Crop year 2006 - 2007
12 Exports of special crops and processed productssup1
Country Beans Buckwheat Canary Seed Chick Peas Lentils Mustard Seed
Africa Algeria Angola Benin British Indian Ocean Terr Burundi Cameroon Cape Verde Central African Republic Chad Comoros Congo Cocircte-drsquoIvoire Djibouti Egypt Ethiopia Gambia Ghana Guinea Kenya Liberia Madagascar Malawi Mauritania Mauritius Morocco Mozambique Namibia Niger Rwanda Senegal Sierra Leone South Africa St Helena Swaziland Tanzania Togo Tunisia Uganda Zaire Zambia Zimbabwe
672 16 658
-18
-505 50
---
645 88
-2 814
----------
516 -
75 ----
867 ------
521 --
-----------------------------------------
(tonnes)
1 609 4 410 - -- -- -- -- -- -- -- -- -- -- 5 - -
1 021 2 373 - -- -- -- -- -- -- -- -- -1 20
660 -- -- -- -- -- -- -
479 163 - -- -- -- -- 720 - -- -- -- -
69 735 268
-14
--------
200 29 206
----
175 60
--
100 1 264
28 577 ----
850 -
3 350 ----
528 ----
-----------------------
68 326
----
1 466 -
267 ---------
Total 23 409 - 3 770 7 691 134 327 2 127
sup1 Source Statistics Canada
Canadian Grain Commission wwwgrainscanadagcca 31
Canadian Grain Exports Crop year 2006 - 2007
12 Exports of special crops and processed productssup1
Processed Productssup3
Country Peas Soybeanssup2 Sunflower Canola Oil Canola Meal (tonnes)
Africa Algeria 6 484 - 1 210 - -Angola - - - - -Benin 475 - - - -British Indian Ocean Terr 16 - - - -Burundi 1 783 - - - -Cameroon - 204 - - -Cape Verde 125 - - - -Central African Republic 200 - - - -Chad 500 - - - -Comoros - - - 80 -Congo 8 - - - -Cocircte-drsquoIvoire 800 - - - -Djibouti - - - - -Egypt 5 984 42 723 526 - -Ethiopia 3 150 - - - -Gambia 291 - - - -Ghana 100 - - - -Guinea 350 - - - -Kenya 12 025 - - - -Liberia 1 050 - - - -Madagascar 836 - - - -Malawi 50 255 - - -Mauritania 620 - - - -Mauritius 591 187 18 - -Morocco 3 648 137 - - -Mozambique 450 - - - -Namibia - - - - -Niger 175 - - - -Rwanda 625 - - - -Senegal 297 - - - -Sierra Leone 1 125 - - - -South Africa 12 709 68 - - -St Helena - 41 - - -Swaziland 70 156 - - -Tanzania 4 350 - - - -Togo 25 - - - -Tunisia - - - - -Uganda 2 625 - - - -Zaire 4 225 - - - -Zambia 400 - - - -Zimbabwe 450 - - - -
Total 66 612 43 771 1 754 80 -sup1 Source Statistics Canada sup2 September-August crop year sup3 Refers to weight of processed product Conversion rates to grain equivalents Barley malt ndash 1339 Canola oil ndash 2387 Canola meal ndash 1607 Exports of barley malt were 621 thousand tonnes (558 thousand in 2005-2006) Country of destination not available due to confidentiality
Canadian Grain Commission wwwgrainscanadagcca 32
Canadian Grain Exports Crop year 2006 - 2007
12 Exports of special crops and processed productssup1
Country Beans Buckwheat Canary Seed Chick Peas Lentils Mustard Seed
Asia Afghanistan Bahrain Bangladesh Bhutan Brunei Darussalam Cambodia China PR Cyprus East Timor Hong Kong India Indonesia Iran Israel Japan Jordan Korea North Korea South Kuwait Lebanon Macau Malaysia Mongolia Nepal Oman Pakistan Philippines Qatar Saudi Arabia Singapore Somalia Sri Lanka Sudan Syrian Arab Rep Taiwan Thailand Turkey United Arab Emirates Vietnam Yemen
-------
11 599 16 69 23
-1 401
21 977 -
1 860 4 485
59 467
-256
---
40 269 50
2 415 40
----
4 348 -
175 568
--
--------------
2 031 -------3 -----------------
(tonnes)
- -- -- 1 305 - -- -
22 -128 -176 91
- -5 9
22 12 903 1 434 44
- -345 2 056
1 339 336 86 15 467
- -111 -
43 270 279 3 569
- -- -- -- -- -- 17 108
334 23 - 49
83 6 183 - -- -- -- -- -
830 -22 -
235 -151 3 607
- -- -
1 595
40 320 ---
967 1 054
-30
130 075 197
9 604 6 085
318 1 384
--
291 3 599
----
199 61 096
-343
2 962 1 618
-19 022
500 113 22
-31 125 81 544
-99
--
3 899 ---
50 ---
4 172 --
65 6 386
--
2 699 ---
33 ----
56 ----
467 --
41 3 610
125 165
--
Total 39 128 2 034 5 645 63 020 393 163 21 768
sup1 Source Statistics Canada
Canadian Grain Commission wwwgrainscanadagcca 33
Canadian Grain Exports Crop year 2006 - 2007
12 Exports of special crops and processed productssup1
Processed Productssup3
Country Peas Soybeanssup2 Sunflower Canola Oil Canola Meal (tonnes)
Asia Afghanistan - - - - -Bahrain 973 - 96 43 -Bangladesh 110 049 - - - -Bhutan 86 - - - -Brunei Darussalam - 142 - - -Cambodia 249 - - - -China PR 251 442 2 400 - 263 814 407 Cyprus - - - - -East Timor - - - - -Hong Kong 2 30 126 7 25 289 -India 895 514 - 146 31 -Indonesia 12 907 522 - 8 -Iran 5 602 244 428 - - -Israel 4 494 25 152 63 12 -Japan 10 924 276 542 124 19 631 315 Jordan 812 80 136 - -Korea North 64 - 74 - -Korea South 563 60 - 35 567 -Kuwait 413 - 476 761 -Lebanon 528 - 262 70 -Macau - 20 - - -Malaysia 2 880 136 409 23 26 096 -Mongolia - - - - -Nepal 5 455 - - - -Oman 214 - - 14 -Pakistan 45 122 - 45 - -Philippines 13 477 12 975 47 635 10 530 Qatar 311 - 48 14 -Saudi Arabia 8 025 869 325 14 -Singapore 1 749 42 834 - 162 -Somalia 2 950 - - - -Sri Lanka 1 701 - - - -Sudan 3 450 - - - -Syrian Arab Rep - 4 303 2 429 - -Taiwan 11 590 8 168 - 26 952 7 033 Thailand 8 982 20 740 - 3 -Turkey 680 21 020 353 - -United Arab Emirates 38 481 134 12 694 531 -Vietnam 45 241 - 217 -Yemen 6 232 43 - - -
Total 1 445 966 827 208 17 348 399 864 18 285
sup1 Source Statistics Canada sup2 September-August crop year sup3 Refers to weight of processed product Conversion rates to grain equivalents Barley malt ndash 1339 Canola oil ndash 2387 Canola meal ndash 1607 Exports of barley malt were 621 thousand tonnes (558 thousand in 2005-2006) Country of destination not available due to confidentiality
Canadian Grain Commission wwwgrainscanadagcca 34
Canadian Grain Exports Crop year 2006 - 2007
12 Exports of special crops and processed productssup1
Country Beans Buckwheat Canary Seed Chick Peas Lentils Mustard Seed (tonnes)
Oceania Australia 3 807 - 211 - 1 366 1 062 Cocos Islands - - - - - -Fiji - - - - - -New Zealand 1 814 - 391 22 228 3 US Outlying Islands - - - 45 - -
Total 5 621 - 602 67 1 594 1 065
Processed Productssup3
Country Peas Soybeanssup2 Sunflower Canola Oil Canola Meal (tonnes)
Oceania Australia 1 094 42 179 3 -Cocos Islands 119 - - - -Fiji 90 - - 30 -New Zealand 158 571 - 208 -US Outlying Islands - - - - -
Total 1 461 613 179 241 -
sup1 Source Statistics Canada sup2 September-August crop year sup3 Refers to weight of processed product Conversion rates to grain equivalents Barley malt ndash 1339 Canola oil ndash 2387 Canola meal ndash 1607 Exports of barley malt were 621 thousand tonnes (558 thousand in 2005-2006) Country of destination not available due to confidentiality
Canadian Grain Commission wwwgrainscanadagcca 35
Canadian Grain Exports Crop year 2006 - 2007
12 Exports of special crops and processed productssup1
Country Beans Buckwheat Canary Seed Chick Peas Lentils Mustard Seed
Western Hemisphere Antigua-Barbuda Argentina Aruba Barbados Belize Bermuda Bolivia Brazil British Virgin Islands Chile Colombia Costa Rica Cuba Dominica Dominican Republic Ecuador El Salvador Grenada Guatemala Guyana Haiti Honduras Jamaica Mexico Netherlands Antilles Nicaragua Panama Paraguay Peru St Kitts-Nevis St Vincent Gren Ste Lucie Surinam Trinidad-Tobago United States Uruguay Venezuela
7 -4 3
137 ----
256 45
643 510 60
12 714 43 67 29
1 514 1
6 202 -
1 736 4 189
3 -
426 --5 3
18 15
489 102 440
-2 375
---------------------------------1
1 537 --
(tonnes)
- -- 5 - -8 6 - -- -- -
21 558 106 - -
4 871 140 11 276 3 550
581 127 390 106
- -746 149
1 235 203 371 -
- -1 746 33
- 181 - -
22 -- -
42 583 -- -- -
75 14 - -
7 012 163 - -- -- -
32 27 172 659
13 062 5 112 116 -
6 186 45
5 1 822
1 68
--
1 323 10 965
-16 866 54 177
686 -
110 176
18 440 -
79 74
---
23 31 513
--
8 765 58
20 825 5
16 45
-1 325 6 361 2 451
23 015
-103
--1 --
569 -
285 74 16
---
203 200
-150
----
20 ----
296 ----
34 71 359
40 1 025
Total
Grand total exported
133 934
349 172
1 538
3 856
112 042 10 626
177 924 115 196
199 194
851 555
74 375
152 931
sup1 Source Statistics Canada
Canadian Grain Commission wwwgrainscanadagcca 36
Canadian Grain Exports Crop year 2006 - 2007
12 Exports of special crops and processed productssup1
Processed Productssup3
Country Peas Soybeanssup2 Sunflower Canola Oil Canola Meal (tonnes)
Western Hemisphere Antigua-Barbuda 9 - - - -Argentina - - - - -Aruba 3 - - - -Barbados 215 1 14 2 -Belize 71 - - - -Bermuda - - - 219 -Bolivia - - - - -Brazil 10 049 - - - -British Virgin Islands - 4 - - -Chile 5 053 - 84 22 -Colombia 34 159 - 312 3 342 -Costa Rica 604 - 421 24 -Cuba 26 968 39 2 - -Dominica 21 - - 1 -Dominican Republic 398 23 161 - -Ecuador 3 106 - - - -El Salvador - - 69 - -Grenada 150 - - - -Guatemala 45 - 539 9 -Guyana 2 947 - - - -Haiti - - - - -Honduras - - 165 - -Jamaica - 625 - - -Mexico 9 331 69 2 289 31 661 5 798 Netherlands Antilles - - - - -Nicaragua 875 - - - -Panama 1 327 186 229 - -Paraguay 8 - - - -Peru 13 338 - - 33 -St Kitts-Nevis 5 - - - -St Vincent Gren - 1 - - -Ste Lucie 20 1 - - -Surinam 802 125 22 8 -Trinidad-Tobago 5 448 215 89 82 -United States 34 482 198 369 96 576 719 403 1 458 082 Uruguay 15 - - - -Venezuela 16 259 - 108 - -
Total 165 708 199 658 101 080 754 806 1 463 880
Grand total exported 1 969 149 1 740 591 120 987 1 305 522 1 482 165
sup1 Source Statistics Canada sup2 September-August crop year sup3 Refers to weight of processed product Conversion rates to grain equivalents Barley malt ndash 1339 Canola oil ndash 2387 Canola meal ndash 1607 Exports of barley malt were 621 thousand tonnes (558 thousand in 2005-2006) Country of destination not available due to confidentiality
Canadian Grain Commission wwwgrainscanadagcca 37
Canadian Grain Exports Crop year 2006 - 2007
13 Ocean freight rates
From
To Japan
North Pacificsup1
Korea South China PR
St Lawrencesup1
Iran
August 2006
September
October
November
December
January 2007
February
March
April
May
June
July
3220
3650
3780
4100
4100
3960
3675
3975
4100
4520
4150
5200
($ US per short tonne)
3120 na
3550 na
3900 na
4300 na
4200 na
4080 na
3825 na
4075 na
4200 na
4620 na
4250 na
5300 na
4640
4800
4900
4825
5000
5120
4950
5225
5375
5940
6000
6700
Average 4036 4118 na 5290
sup1 Rates are calculated for heavy grains on largest sized vessel (type B-vessel size = over 35 000 tonnes) in most general use appropriate to specified route ready to load in three to four weeks time
Source International Grain Council
Canadian Grain Commission wwwgrainscanadagcca 38
Canadian Grain Exports Crop year 2006 - 2007
14 Estimated costs of moving wheat from a mid-prairie point to export position
Crop Year 200102 200203 200304 200405 200506 200607p
Primary Elevator Costs Elevation (1) Removal of dockage Shrinkage Carrying charges (2)
Railway Freight Via Thunder Bay Via Vancouver
Marketing (3)
Terminal Elevator Costs Storage (4) Fobbing charges - via St Lawrence ports (5) - via Pacific seaboard (5)
Lake Transportation (6)
Transfer Elevator Costs Storage Fobbing charges (7)
1118 368 022 245
3443 3378
-225
094
823 842
1917
192 230
1163 383 025 353
3343 3377
-008
167
873 890
1893
347 231
$tonne
1190 1190 440 440
- -196 186
3326 3402 3445 3471
277 083
102 148
903 926 920 936
1892 1928
173 362 232 232
1220 450
-230
3436 3506
315
130
954 982
1991
341 231
1251 462
-209
3805 3809
494
128
978 1006
2185
345 232
Total - via St Lawrence ports - via Pacific seaboard
8227 5842
8770 6350
8731 8897 6570 6454
9298 6833
10089 7359
P - Preliminary
Mid-Prairie point being Brass Saskatchewan
(1) Filed tariff for receiving elevating and loading
(2) Carrying charges on wheat stored in country elevators
(3) Includes interest bank and other charges and Canadian Wheat Board administrative costs interest and depreciation on CWB hopper cars drying additional freight and demurragedespatch
(4) Storage charges on wheat stored in terminal elevators
(5) Thunder Bay and Pacific fobbing charge which includes elevation outward weighing and inspection terminal elevator receipt cancellation lake shippersrsquo charges superintendence and forwarding brokerage charges
(6) Includes elevation outward weighing and inspection terminal elevator receipt cancellation BC Shippersrsquo charges superintendence wharfage and forwarding brokerage charges
(7) Includes lake freight lake brokerage cargo rates insurance St Lawrence Seaway and Welland Canal tolls and inward elevation into transfer elevator
Canadian Grain Commission wwwgrainscanadagcca 39

Canadian Grain Exports Crop year 2006 - 2007
5 Exports by clearance sector ndash durum wheat
Country Pacific Churchill Thunder Bay Eastern Prairie Total
Western Europe Belgium ItalyNetherlands Portugal Switzerland
-----
219 ----
(000rsquos tonnes)
-268 447
--
1915 5899 1723 267 15
-----
2134 6166 2170 267 15
Total
Eastern Europe Czech Republic
-
-
219
-
715
-
9817
00sup1
-
-
1 0751
00sup1
Total
Africa AlgeriaLibyaMorocco South Africa Tunisia
-
----
270
-
--
275 -
248
-
--
761 --
00sup1
6595 1152 4283 155 816
-
-----
00sup1
6595 1152 5319
155 1334
Total
Asia India Indonesia Japan Singapore Sri Lanka United Arab Emirates
270
1990 168
2469 04
883 546
523
------
761
------
1 3000
------
-
------
1 4554
1990 168
2469 04
883 546
Total
Western Hemisphere Caribbean Chile Colombia Cuba Ecuador Guatemala Mexico Peru United States Venezuela
6060
-609 166
-172 51
-583
--
-
----------
-
---------
239
-
---
96 -----
4357
-
159 -----
74 -
6358 89
6060
159 609 166 96
172 51 74
583 6358 4685
Total
Grand Total Exported
1581
7911
-
742
239
1715
4454
2 7271
6680
6680
1 2953
4 4318
sup1 00 less than 50 tonnes
Canadian Grain Commission wwwgrainscanadagcca 12
Canadian Grain Exports Crop Year 2006 - 2007
5 Exports by clearance sector - oats
Country Pacific Churchill Thunder Bay Eastern Prairies Total
Western Europe Norway - -
(000rsquos tonnes)
367 - - 367 Total
Africa South Africa
-
-
-
-
367
133
-
-
-
-
367
133 Total
Asia Japan
-
114
-
-
133
-
-
-
-
-
133
114 Total
Western Hemisphere Ecuador Mexico Puerto Rico United States
114
139 289
--
-
----
-
---
1721
-
--
20 -
-
-69
-1 2671
114
139 358
20 1 4392
Total
Grand Total Exported
428
542
-
-
1721
2221
20
20
1 2740
1 2740
1 4908
1 5522
5 Exports by clearance sector - barley
Country Pacific Churchill Thunder Bay Eastern Prairies Total
Eastern Europe Czech Republic - -
(000rsquos tonnes)
- 00sup1 - 00sup1
Total
Africa South Africa
-
506
-
-
-
-
00sup1
-
-
-
00sup1
506 Total
Asia China PR Japan Vietnam
506
3946 3127 130
-
---
-
---
-
---
-
---
506
3946 3127 130
Total
Western Hemisphere Colombia Ecuador Mexico Peru United States
7203
728 176
-133
-
-
-----
-
----
506
-
----
12
-
99 -
197 -
2205
7203
826 176 197 133
2723 Total
Grand Total Exported
1037
8746
-
-
506
506
12
12
2501
2501
4055
1 1765
sup1 00 less than 50 tonnes
Canadian Grain Commission wwwgrainscanadagcca 13
Canadian Grain Exports Crop year 2006 - 2007
5 Exports by clearance sector ndash flaxseed
Country Pacific Churchill Thunder Bay Eastern Prairie Total (000rsquos tonnes)
Western Europe Belgium - - 4549 112 - 4661 Total - - 4549 112 - 4661
Asia Japan 157 - - - - 157 Total 157 - - - - 157
Western Hemisphere United States - - - 02 978 980 Total - - - 02 978 980
Grand Total Exported 157 - 4549 114 978 5797
5 Exports by clearance sector ndash canola
Country Pacific Churchill Thunder Bay Eastern Prairie Total
Asia Bangladesh China PR Israel Japan Nepal Pakistan TurkeyUnited Arab Emirates
944 9157
-1 9608
124 5098
-2817
-----
390 --
(000rsquos tonnes)
--
78 ---
234 -
------
55 -
--------
944 9157
78 1 9608
124 5488 289
2817
Total
Oceania Australia
3 7748
571
390
-
312
-
55
-
-
-
3 8504
571 Total
Western Hemisphere Mexico United States
571
5005 -
-
--
-
2941 02
-
667 -
-
384 6589
571
8997 6591
Total
Grand Total Exported
5005
4 3323
-
390
2943
3255
667
723
6973
6973
1 5588
5 4664
Canadian Grain Commission wwwgrainscanadagcca 14
Canadian Grain Exports Crop year 2006 - 2007
5 Exports by clearance sector ndash soybean
Country Pacific Churchill Thunder Bay Eastern Prairie Total
Western Europe Belgium Denmark France Ireland ItalyNetherlands NorwayPortugal Spain United Kingdom
----------
----------
(000rsquos tonnes)
160 ---------
1446 302 466 17 31
2405 268 653 132 216
----------
1606 302 466 17 31
2405 268 653 132 216
Total
Africa Egypt
-
-
-
-
160
-
5938
157
-
-
6098
157 Total
Asia Iran Israel Japan Korea North Malaysia Syria United Arab Emirates
-
-------
-
-------
-
-------
157
2252 238 176 239 605 43 85
-
-------
157
2252 238 176 239 605 43 85
Total
Western Hemisphere Cuba United States
-
--
-
--
-
--
3638
206 -
-
-186
3638
206 186
Total
Grand Total Exported
-
-
-
-
-
160
206
9939
186
186
392
1 0285
Canadian Grain Commission wwwgrainscanadagcca 15
Canadian Grain Exports Crop year 2006 - 2007
5 Exports by clearance sector ndash peas
Country Pacific Churchill Thunder Bay Eastern Prairie Total
Western Europe Belgium Denmark Netherlands NorwaySpain
----
185
----
656
(000rsquos tonnes)
535 135
-82
494
-81
106 -
62
-----
535 216 106 82
1397 Total
Africa Algeria
185
-
656
-
1246
-
248
245
-
-
2335
245 Total
Asia Bangladesh India Nepal Pakistan United Arab Emirates
-
1901 9407
25 387 110
-
-----
-
-----
245
-----
-
-----
245
1901 9407
25 387 110
Total
Western Hemisphere Colombia Cuba United States
1 1830
25 490
-
-
---
-
---
-
---
-
--
02
1 1830
25 490
02 Total
Grand Total Exported
515
1 2530
-
656
-
1246
-
494
02
02
518
1 4928
5 Exports by clearance sector ndash corn
Country Pacific Churchill Thunder Bay Eastern Prairie Total (000rsquos tonnes)
Western Europe Iceland - - - 106 - 106 Total - - - 106 - 106
Africa Algeria - - - 219 - 219 Total - - - 219 - 219
Asia Iran - - - 1561 - 1561 Israel - - - 45 - 45 Total - - - 1606 - 1606
Western Hemisphere United States - - - 00sup1 03 04 Total - - - 00sup1 03 04
Grand Total Exported - - - 1930 03 1933 sup1 00 less than 50 tonnes
Canadian Grain Commission wwwgrainscanadagcca 16
Canadian Grain Exports Crop year 2006 - 2007
6 Exports by class - wheat
Country CWRS CPS CWRW Feed CWES CWHWS CE Other CWAD Total
Western Europe Belgium Germany Iceland Ireland Italy Netherlands Norway Portugal Spain Switzerland United Kingdom
351 01 11 62
2833 141 00sup1
-863 16
4318
----------
40
----
02 -----
11
-------
02 --
04
(000rsquoS tonnes)
- 00sup1 - -- -- -
236 03 - 01 - -- -- -- -- 01
-----
08 --
448 --
-----------
2134 ---
6166 2170
-267
-15
-
2486 01 11 62
9241 2320
00sup1 269
1310 30
4374
Total
Eastern Europe Czech Republic
8596
00sup1
40
-
13
-
06
-
236 06
- -
455
-
-
-
1 0751
00sup1
2 0104
00sup1
Total
Africa Algeria Burundi Cameroon Congo Djibouti Egypt Ethiopia Ghana Libya Mali Mauritania Morocco Mozambique Namibia Nigeria Somalia South Africa Sudan Tanzania Togo Tunisia West Africa
00sup1
-30
136 80
---
999 -
06 05
-265 66
1384 22
809 4428 590 60 07
1820
-
---------------------
40
-
------
22 77
-------------
30
-
----------------------
- -
- -- -- -- 116 - -- -- -- -- 01 - -- -- -- -- -- 95 - -- 249 - 319 - -- -- -- -
-
----
174 5457 156 55
--
173 ------
119 ----
-
--------------
66 -------
00sup1
6595 -------
1152 --
5319 ----
155 ---
1334 -
00sup1
6595 30
136 196 174
5457 178
1131 1152
06 178
5319 265
66 1545
22 1213 4867
590 60
1341 1890
Total 1 0708 40 129 - - 779 6133 66 1 4554 3 2410
sup1 00 less than 50 tonnes
Note Refer to page 4 for class definitions
Canadian Grain Commission wwwgrainscanadagcca 17
Canadian Grain Exports Crop year 2006 - 2007
6 Exports by class - wheat
Country CWRS CPS CWRW Feed CWES CWHWS CE Other CWAD Total
Asia Bangladesh China PR India Indonesia Iraq Japan Korea South Malaysia Philippines Singapore Sri Lanka Taiwan Thailand United Arab Emirates Vietnam Yemen
3086 441
4374 1 3249
6211 867 7 1104 1199 2932 180 852 63
1928 1410 1682
-
--
1514 545
---
30 --
303 -
10 ---
--
1996 392
---
05 --
477 -
80 ---
(000rsquoS tonnes)
- - -- - -- - -- - 1243 - - -
411 - -- - -- - 129 - - 664 - - 182 - - 980 - - -- - 438 - - 107 - - 126 - - -
--
2624 ------------
62
----------
6625 ---
775 -
--
1990 168
-2469
---
04 883
--
546 --
3086 441
1 2498 1 5596
6211 1 1557
1104 1364 3595 366
1 0120 63
2455 2063 2583
62
Total
Oceania New Zealand
4 7387
163
2402
-
2950
-
411 - 3868
- - -
2686
-
7400
-
6060
-
7 3163
163
Total
Western Hemisphere Brazil Caribbean Chile Colombia Cuba Dominican Republic Ecuador Guatemala Guyana Mexico Peru Puerto Rico United States Venezuela
163
1690 1523 368
3866 893 59
2747 470 366
1 0493 3327 271
1 0415 4519
-
---------
255 --
33 44
-
---
138 ------
248 -
70 -
- - -
- - 114 - - -- - -- - -- - -- - -- - -- - -- - 137
16 - 1104 - - -- - 327
68 - 265 - - -
-
-----
49 --
10 344
-202
1186 -
-
------------
143 -
-
-159 609 166
96 -
172 51
-74
583 -
6358 4685
163
1804 1682
978 4170
989 108
2918 521 513
1 2286 4158 800
1 8539 9248
Total
Grand Total Exported
4 1008
10 7862
331
2813
456
3548
83 - 1948
501 236 6600
1792
1 1066
143
7609
1 2953
4 4318
5 8714
18 4554
Note Refer to page 4 for class definitions
Canadian Grain Commission wwwgrainscanadagcca 18
Canadian Grain Exports Crop year 2006 - 2007
7 Exports by grade - oats
Country No 1 CW No 2 CW CE Other Total
Western Europe Norway - 367
(000rsquos tonnes)
- - 367 Total
Africa South Africa
-
-
367
133
-
-
-
-
367
133 Total
Asia Japan
-
38
133
75
-
-
-
-
133
114 Total
Western Hemisphere Ecuador Mexico Puerto Rico United States
38
-69
-1 2671
75
139 289
--
-
--
20 -
-
---
1721
114
139 358 20
1 4392 Total
Grand Total Exported
1 2740
1 2778
428
1004
20
20
1721
1721
1 4908
1 5522
7 Exports by grade - barley
Country Select Feed CE Total
Eastern Europe Czech Republic 00sup1
(000rsquos tonnes)
- - 00sup1
Total
Africa South Africa
00sup1
-
-
506
-
-
00sup1
506 Total
Asia China PR Japan Vietnam
-
3308 2811
-
506
639 316 130
-
---
506
3946 3127
130 Total
Western Hemisphere ColombiaEcuador Mexico Peru United States
6118
654 ---
608
1085
173 176 197 133
2103
-
----
12
7203
826 176 197 133
2723 Total
Grand Total Exported
1262
7380
2782
4372
12
12
4055
1 1765 sup1 00 less than 50 tonnes Note Refer to page 4 for class definitions
Canadian Grain Commission wwwgrainscanadagcca 19
Canadian Grain Exports Crop year 2006 - 2007
7 Exports by grade - flaxseedsup1
Country No 1 CW Total (000rsquos tonnes)
Western Europe Belgium 4661 4661 Total 4661 4661
Asia Japan 157 157 Total 157 157
Western Hemisphere United States 980 980 Total 980 980
Grand Total Exported 5797 5797
sup1 All exports graded as Flaxseed No 1 Canada Western
7 Exports by grade - canola
Country No 1 Canada No 2 Canada Others Total
Asia Bangladesh China PR Israel Japan Nepal Pakistan TurkeyUnited Arab Emirates
944 9157
78 1 9499
124 4983
289 2817
(000rsquos tonnes)
---
109 ----
-----
505 --
944 9157
78 1 9608
124 5488
289 2817
Total
Oceania Australia
3 7891
571
109
-
505
-
3 8504
571 Total
Western Hemisphere Mexico United States
571
8997 6591
-
--
-
--
571
8997 6591
Total
Grand Total Exported
1 5588
5 4050
-
109
-
505
1 5588
5 4664
Canadian Grain Commission wwwgrainscanadagcca 20
Canadian Grain Exports Crop year 2006 - 2007
7 Exports by grade - soybean
Country No 1 Canada No 2 Canada Others Total
Western Europe Belgium Denmark France Ireland ItalyNetherlands NorwayPortugal Spain United Kingdom
----------
(000rsquos tonnes)
1606 302 466 17 31
2405 268 653 132 216
----------
1606 302 466 17 31
2405 268 653 132 216
Total
Africa Egypt
-
-
6098
157
-
-
6098
157 Total
Asia Iran Israel Japan Korea North MalaysiaSyria United Arab Emirates
-
--
68 ----
157
2252 238 108
-605 43 85
-
---
239 ---
157
2252 238 176 239 605 43 85
Total
Western Hemisphere CubaUnited States
68
-186
3331
206 -
239
--
3638
206 186
Total
Grand Total Exported
186
255
206
9792
-
239
392
1 0285
Canadian Grain Commission wwwgrainscanadagcca 21
Canadian Grain Exports Crop year 2006 - 2007
7 Exports by grade - peas
Country All grades combined Total
Western Europe Belgium Denmark Netherlands NorwaySpain
(000rsquos tonnes)
535 216 106
82 1397
535 216 106
82 1397
Total
Africa Algeria
2335
245
2335
245 Total
Asia Bangladesh India Nepal Pakistan United Arab Emirates
245
1901 9407
25 387 110
245
1901 9407
25 387 110
Total
Western Hemisphere Colombia CubaUnited States
1 1830
25 490
02
1 1830
25 490
02 Total
Grand Total Exported
518
1 4928
518
1 4928
Canadian Grain Commission wwwgrainscanadagcca 22
Canadian Grain Exports Crop year 2006 - 2007
7 Exports by grade - corn
Country No2 CE No3 CE Other Total (000rsquos tonnes)
Western Europe Iceland - - 106 106 Total - - 106 106
Africa Algeria - - 219 219 Total - - 219 219
Asia Iran - - 1561 1561 Israel - 45 - 45 Total - 45 1561 1606
Western Hemisphere United States 00sup1 - 03 04 Total 00sup1 - 03 04
Grand Total Exported 00sup1 45 1888 1933
sup1 00 less than 50 tonnes
Note Refer to page 4 for class definitions
Canadian Grain Commission wwwgrainscanadagcca 23
Canadian Grain Exports Crop year 2006 - 2007
8 Exports by port of clearance
Loaded at Wheat Durum Wheat Oats Barley Flaxseed Canola Soybean Peas Corn Total
Prince Rupert
Vancouver
Churchill
Thunder Bay
Queacutebec
Baie-Comeau Ontario elevators
Owen Sound
Prescott
Goderich
Sarnia
Montreal
Port Cartier
Sorel
Trois-Riviegraveres
Halifax
Prairie elevators
4 4285
4 1492
3375
977
1 0333
7501
286
132
20
429
802
3412
9699
2960
05
140
1 4387
1732
6179
742
1715
8374
9920
-
-
-
-
-
3617
3575
872
913
-
6680
-
542
-
2221
-
-
-
-
-
-
-
-
-
20
-
-
1 2740
925
7821
-
506
-
-
-
-
12
-
-
00sup1
-
-
-
-
2501
(000rsquos tonnes)
- 2354
157 4 0969
- 390
4549 3255
- -
- -
- -
- -
02 -
- -
- -
- -
- 243
112 480
- -
- -
978 6973
-
-
-
160
1168
817
1294
-
-
453
-
2158
500
2690
859
-
186
- - 4 9295
1 2530 - 10 9690
656 - 5163
1246 - 1 4628
245 181 2 0300
- 125 1 8363
- - 1580
- - 132
- 00sup1 34
- - 882
- - 802
- 1360 1 0548
- - 1 4017
248 219 7601
- 45 1822
- - 140
02 03 4 4451
16
36
2
5
7
6
1
3
5
2
1
15
Grand total exported 140236 44318 15522 11765 5797 54664 10285 14928 1933 299448 100
sup1 00 less than 50 tonnes
Note Includes exports of Eastern wheat via unlicensed facilities
Canadian Grain Commission wwwgrainscanadagcca 24
Canadian Grain Exports Crop year 2006 - 2007
9 Exports by month and clearance sector
Wheat Durum Wheat Oats Barley Flaxseed Canola Soybean Peas Corn Total
Pacific August2006 September October November December January2007 February March April May June July
8135 5168 6703 6234 7717 5439 5918 8028 7584 9329 8494 7027
376 536
1337 1721 486 498 674 137 594 577 476 499
10 --
05 -
158 308 31
---
30
684 383
1129 1193
820 995
1163 786 650 769 19
155
(000rsquos tonnes)
18 2701 23 4418 08 4767
- 3362 23 2449 16 5131 08 3092 08 4036 14 3657 23 3418 16 2767
- 3525
------------
449 2687 960
1116 1109 964
1229 488
1508 1013
742 265
------------
1 2374 1 3215 1 4904 1 3631 1 2604 1 3200 1 2391 1 3513 1 4009 1 5131 1 2514 1 1500
Total
Churchill August2006 September October November July2007
8 5777
314 997
1350 440 275
7911
-275 467
--
542
-----
8746
-----
157 4 3323
- 390 - -- -- -- -
-
-----
1 2530
-456 200
--
-
-----
15 8985
703 1728 2016
440 275
Total
Thunder Bay August2006 September October November December March2007 April May June July
3375
--
175 193 160
--
365 84
-
742
181 92
216 -
111 -
221 224 95
575
-
158 157 335 594 272 142 113 151
-297
-
-22 29
---
66 44
131 214
- 390
160 258 329 792 597 212 839 191 757 -
- -537 706 593 671 160 211 577 213
-
--
50 -
31 --
79 --
656
156 202 467
53 97
-85 82
105 -
-
----------
5163
913 1595 2080 1870 1428
142 1727 2208
787 1876
Total 977 1715 2221 506 4549 3255 160 1246 - 1 4628
Canadian Grain Commission wwwgrainscanadagcca 25
Canadian Grain Exports Crop year 2006 - 2007
9 Exports by month and clearance sector
Wheat Durum Wheat Oats Barley Flaxseed Canola Soybean Peas Corn Total
Eastern August2006 September October November December January2007 February March April May June July
3987 5979 3375 4196 2839 1444 1619 1304 2771 1786 3404 2875
1697 2337 3610 2548 3235 1512 1430 1153 2607 3053 2669 1419
--
20 ---------
(000rsquos tonnes)
- 00sup1 00sup1 00sup1
- 00sup1 00sup1 09 00sup1 36 04 -
00sup1 00sup1 - -
02 00sup1 05 53 01 00sup1
- 14
69 -
285 ---
243 --
58 68
-
375 599
1120 2793 1830 649 311 239 515 421 642 444
53 115
-326
--------
--
00sup1 -
254 665 278
--
650 82
-
6181 9031 8411 9872 8194 4275 3881 2697 5896 6027 6866 4752
Total
Atlantic January2007 March
3 5580
76 64
2 7271
--
20
--
12 114
- -- -
723
--
9939
--
494
--
1930
--
7 6082
76 64
Total
Prairie August2006 September October November December January2007 February March April May June July
140
496 666
1089 1066 1195 1293 1260 1350 1656 1631 1334 1352
-
504 547 577 533 395 607 462 493 720 379 664 800
-
2209 1765 1481 1375 755
1028 778 960 798 781 407 403
- -
83 25 144 72 261 61 359 103 210 42 389 124 148 53 108 68 178 133 299 45 302 121 22 130
-
886 468 600 579 309 539 523 529 405 756 605 774
-
--
17 10
-11 03 24 15 20 60 27
-
----
01 ----
02 --
-
----------
03 00sup1
140
4203 3662 4085 4024 2905 3991 3226 3532 3904 3912 3497 3508
Total Grand total exported
1 4387
14 0236
6680
4 4318
1 2740
1 5522
2501 978
1 1765 5797
6973
5 4664
186
1 2085
02
1 4928
03
1933
4 4451
29 9448
sup1 00 less than 50 tonnes
Canadian Grain Commission wwwgrainscanadagcca 26
Canadian Grain Exports Crop year 2006 - 2007
10 Exports by class grade and clearance sector
Grade Pacific Churchill Thunder
Bay Eastern Atlantic Prairies Total
Wheat CWRS CPS CWRW Feed CWES CWHWS CE Other CWAD
6 7503 2656 3335 411
-4470
-7400 7911
3094 -
39 16
-227
--
742
(000rsquos tonnes)
774 2 2450 05 119
- 104 - 06
94 142 104 1494
- 1 1066 - 198
1715 2 7271
101 ----
39 ---
1 3941 33 70 68
-265
-11
6680
10 7862 2813 3548
501 236
6600 1 1066
7609 4 4318
Total
Oats No 1 CW No 2 CW CE Other
9 3687
38 503
--
4117
----
2691 6 2851
- -500 -
- 20 1721 -
140
----
2 1067
1 2740 ---
18 4554
1 2778 1004
20 1721
Total
Barley Select Feed CE
542
6673 2072
-
-
---
2221 20
506 -- 00sup1 - 12
-
---
1 2740
201 2300
-
1 5522
7380 4372
12 Total
Flaxseed No 1 CW
8746
157
-
-
506 12
4549 114
-
-
2501
978
1 1765
5797 Total
Canola No 1 Canada No 2 Canada Other
157
4 2710 109 504
-
389 -
01
4549 114
3255 723 - -- -
-
---
978
6973 --
5797
5 4050 109 505
Total
Soybean No 1 Canada No 2 Canada Other
4 3323
---
390
---
3255 723
- 68 160 9632
- 239
-
---
6973
186 --
5 4664
255 9792
239 Total
Peas All grades combined
-
1 2530
-
656
160 9939
1246 494
-
-
186
02
1 0285
1 4928 Total
Corn No 2 CE No 3 CE Other
1 2530
---
656
---
1246 494
- 00sup1 - 45 - 1885
-
---
02
--
03
1 4928
00sup1 45
1888 Total
Grand total exported
-
15 8985
-
5163
- 1930
1 4628 7 6082
-
140
03
4 4451
1933
29 9448 sup1 00 less than 50 tonnes Note Refer to page 4 for class definitions
Canadian Grain Commission wwwgrainscanadagcca 27
Canadian Grain Exports Crop year 2006 - 2007
11 Exports of wheat (including durum) and wheat flour by month and clearance sector
Month Pacific Churchill Thunder
Bay Eastern Atlantic Prairie Total
Wheat Wheat Flour
Total Wheat and
Wheat Flour
August2006
September
October
November
December
January2007
February
March
April
May
June
July
8511
5704
8040
7955
8203
5937
6592
8165
8179
9907
8970
7526
314
1272
1816
440
-
-
-
-
-
-
-
275
(000rsquos tonnes)
181 5684
92 8316
391 6986
193 6744
271 6074
- 2956
- 3048
- 2458
221 5378
588 4839
179 6073
575 4294
-
-
-
-
-
76
-
64
-
-
-
-
1000
1213
1665
1599
1590
1900
1722
1843
2376
2010
1999
2152
1 5690
1 6597
1 8898
1 6931
1 6137
1 0869
1 1362
1 2530
1 6154
1 7343
1 7221
1 4821
254
243
278
291
280
291
226
226
234
250
284
234
1 5944
1 6839
1 9176
1 7222
1 6417
1 1160
1 1588
1 2756
1 6388
1 7594
1 7505
1 5055
Grand total exported 9 3687 4117 2691 6 2851 140 2 1067 18 4554 3090 18 7644
Canadian Grain Commission wwwgrainscanadagcca 28
Canadian Grain Exports Crop year 2006 - 2007
12 Exports of special crops and processed productssup1
Country Beans Buckwheat Canary Seed Chick Peas Lentils Mustard Seed
Western Europe Austria Belgium Denmark Finland France Germany Greece Iceland Ireland Italy Malta Netherlands Norway Portugal Spain Sweden Switzerland United Kingdom
41 1 047
22 -
4 006 2 912 7 651
-1 911
22 539 114
13 999 -
7 978 6 130
206 825
67 966
36 ----
77 ------
155 ----
16
(tonnes)
30 489 5 - 4 751 - -- -
46 1 903 1 141 286
839 471 - -
23 -3 262 7 833
844 -731 895
- -4 615 6 126
13 699 5 629 90 267
- 658 45 4 713
71 9 331
-22
9 301 12 641 11 032
147 22
23 135 -
4 250 -
3 663 30 301
424 671
6 462
25 852 --
492 2 345
15 812 295
--
167 -
5 980 --
79 20
145 1 593
Total Eastern Europe Albania Armenia Azerbaijan Belarus Bosnia-Herzegovina Bulgaria Byelorussia SSR Croatia Czech Republic Estonia Georgia Hungary Latvia Lithuania Macedonia Moldova Montenegro Poland Romania Russia Serbia Slovakia Slovania Ukraine Yugoslavia
137 347
61 --
23 1 624
90 23
2 546 1 584
-98
1 186 -
40 --
468 206
-237
-705 822
-20
284
-------------------------
55 824 33 535
- -- 22 - -- -- 23
21 -- -- 80 - 65 - -- 23 - -- -- -- -- -- -- 25 - -
20 -- -- -- -- 19 - -
111 473
-889
50 --
2 407 -
127 4 413
-956
1 226 --
317 --
519 -
68 23
809 ---
52 780
-------
80 42
--------
571 80 43
-----
Total 9 733 - 41 257 11 804 816
sup1 Source Statistics Canada
Canadian Grain Commission wwwgrainscanadagcca 29
Canadian Grain Exports Crop year 2006 - 2007
12 Exports of special crops and processed productssup1
Processed Productssup3
Country Peas Soybeanssup2 Sunflower Canola Oil Canola Meal (tonnes)
Western Europe Austria 2 3 - - -Belgium 55 353 182 203 45 731 -Denmark 21 601 30 210 - - -Finland - - - - -France 1 057 32 812 24 8 -Germany 878 920 49 63 577 -Greece 220 - - - -Iceland - - - - -Ireland 68 1 749 - - -Italy 7 587 874 23 - -Malta 69 - - - -Netherlands 11 949 316 202 - 85 930 -Norway 8 181 26 840 84 - -Portugal 1 263 65 503 80 67 -Spain 169 357 8 693 68 49 -Sweden - - 141 - -Switzerland 20 - - 20 -United Kingdom 4 881 - - - -Total 282 486 666 009 514 150 382 -
Eastern Europe Albania - - - - -Armenia 68 - - - -Azerbaijan - - - - -Belarus - - - - -Bosnia-Herzegovina - - - - -Bulgaria - - - - -Byelorussia SSR - - - - -Croatia 15 - 21 - -Czech Republic 91 325 - 79 -Estonia 1 268 - - - -Georgia 355 - - - -Hungary 904 20 - - -Latvia - - 68 - -Lithuania - 40 - - -Macedonia - - - - -Moldova - - - 70 -Montenegro - - - - -Poland 216 810 - - -Romania - 678 22 - -Russia 3 999 1 199 - - -Serbia - - - - -Slovakia - 103 - - -Slovania - - 1 - -Ukraine - 157 - - -Yugoslavia - - - - -Total 6 916 3 332 112 149 -sup1 Source Statistics Canada sup2 September-August crop year sup3 Refers to weight of processed product Conversion rates to grain equivalents Barley malt ndash 1339 Canola oil ndash 2387 Canola meal ndash 1607 Exports of barley malt were 621 thousand tonnes (558 thousand in 2005-2006) Country of destination not available due to confidentiality
Canadian Grain Commission wwwgrainscanadagcca 30
Canadian Grain Exports Crop year 2006 - 2007
12 Exports of special crops and processed productssup1
Country Beans Buckwheat Canary Seed Chick Peas Lentils Mustard Seed
Africa Algeria Angola Benin British Indian Ocean Terr Burundi Cameroon Cape Verde Central African Republic Chad Comoros Congo Cocircte-drsquoIvoire Djibouti Egypt Ethiopia Gambia Ghana Guinea Kenya Liberia Madagascar Malawi Mauritania Mauritius Morocco Mozambique Namibia Niger Rwanda Senegal Sierra Leone South Africa St Helena Swaziland Tanzania Togo Tunisia Uganda Zaire Zambia Zimbabwe
672 16 658
-18
-505 50
---
645 88
-2 814
----------
516 -
75 ----
867 ------
521 --
-----------------------------------------
(tonnes)
1 609 4 410 - -- -- -- -- -- -- -- -- -- -- 5 - -
1 021 2 373 - -- -- -- -- -- -- -- -- -1 20
660 -- -- -- -- -- -- -
479 163 - -- -- -- -- 720 - -- -- -- -
69 735 268
-14
--------
200 29 206
----
175 60
--
100 1 264
28 577 ----
850 -
3 350 ----
528 ----
-----------------------
68 326
----
1 466 -
267 ---------
Total 23 409 - 3 770 7 691 134 327 2 127
sup1 Source Statistics Canada
Canadian Grain Commission wwwgrainscanadagcca 31
Canadian Grain Exports Crop year 2006 - 2007
12 Exports of special crops and processed productssup1
Processed Productssup3
Country Peas Soybeanssup2 Sunflower Canola Oil Canola Meal (tonnes)
Africa Algeria 6 484 - 1 210 - -Angola - - - - -Benin 475 - - - -British Indian Ocean Terr 16 - - - -Burundi 1 783 - - - -Cameroon - 204 - - -Cape Verde 125 - - - -Central African Republic 200 - - - -Chad 500 - - - -Comoros - - - 80 -Congo 8 - - - -Cocircte-drsquoIvoire 800 - - - -Djibouti - - - - -Egypt 5 984 42 723 526 - -Ethiopia 3 150 - - - -Gambia 291 - - - -Ghana 100 - - - -Guinea 350 - - - -Kenya 12 025 - - - -Liberia 1 050 - - - -Madagascar 836 - - - -Malawi 50 255 - - -Mauritania 620 - - - -Mauritius 591 187 18 - -Morocco 3 648 137 - - -Mozambique 450 - - - -Namibia - - - - -Niger 175 - - - -Rwanda 625 - - - -Senegal 297 - - - -Sierra Leone 1 125 - - - -South Africa 12 709 68 - - -St Helena - 41 - - -Swaziland 70 156 - - -Tanzania 4 350 - - - -Togo 25 - - - -Tunisia - - - - -Uganda 2 625 - - - -Zaire 4 225 - - - -Zambia 400 - - - -Zimbabwe 450 - - - -
Total 66 612 43 771 1 754 80 -sup1 Source Statistics Canada sup2 September-August crop year sup3 Refers to weight of processed product Conversion rates to grain equivalents Barley malt ndash 1339 Canola oil ndash 2387 Canola meal ndash 1607 Exports of barley malt were 621 thousand tonnes (558 thousand in 2005-2006) Country of destination not available due to confidentiality
Canadian Grain Commission wwwgrainscanadagcca 32
Canadian Grain Exports Crop year 2006 - 2007
12 Exports of special crops and processed productssup1
Country Beans Buckwheat Canary Seed Chick Peas Lentils Mustard Seed
Asia Afghanistan Bahrain Bangladesh Bhutan Brunei Darussalam Cambodia China PR Cyprus East Timor Hong Kong India Indonesia Iran Israel Japan Jordan Korea North Korea South Kuwait Lebanon Macau Malaysia Mongolia Nepal Oman Pakistan Philippines Qatar Saudi Arabia Singapore Somalia Sri Lanka Sudan Syrian Arab Rep Taiwan Thailand Turkey United Arab Emirates Vietnam Yemen
-------
11 599 16 69 23
-1 401
21 977 -
1 860 4 485
59 467
-256
---
40 269 50
2 415 40
----
4 348 -
175 568
--
--------------
2 031 -------3 -----------------
(tonnes)
- -- -- 1 305 - -- -
22 -128 -176 91
- -5 9
22 12 903 1 434 44
- -345 2 056
1 339 336 86 15 467
- -111 -
43 270 279 3 569
- -- -- -- -- -- 17 108
334 23 - 49
83 6 183 - -- -- -- -- -
830 -22 -
235 -151 3 607
- -- -
1 595
40 320 ---
967 1 054
-30
130 075 197
9 604 6 085
318 1 384
--
291 3 599
----
199 61 096
-343
2 962 1 618
-19 022
500 113 22
-31 125 81 544
-99
--
3 899 ---
50 ---
4 172 --
65 6 386
--
2 699 ---
33 ----
56 ----
467 --
41 3 610
125 165
--
Total 39 128 2 034 5 645 63 020 393 163 21 768
sup1 Source Statistics Canada
Canadian Grain Commission wwwgrainscanadagcca 33
Canadian Grain Exports Crop year 2006 - 2007
12 Exports of special crops and processed productssup1
Processed Productssup3
Country Peas Soybeanssup2 Sunflower Canola Oil Canola Meal (tonnes)
Asia Afghanistan - - - - -Bahrain 973 - 96 43 -Bangladesh 110 049 - - - -Bhutan 86 - - - -Brunei Darussalam - 142 - - -Cambodia 249 - - - -China PR 251 442 2 400 - 263 814 407 Cyprus - - - - -East Timor - - - - -Hong Kong 2 30 126 7 25 289 -India 895 514 - 146 31 -Indonesia 12 907 522 - 8 -Iran 5 602 244 428 - - -Israel 4 494 25 152 63 12 -Japan 10 924 276 542 124 19 631 315 Jordan 812 80 136 - -Korea North 64 - 74 - -Korea South 563 60 - 35 567 -Kuwait 413 - 476 761 -Lebanon 528 - 262 70 -Macau - 20 - - -Malaysia 2 880 136 409 23 26 096 -Mongolia - - - - -Nepal 5 455 - - - -Oman 214 - - 14 -Pakistan 45 122 - 45 - -Philippines 13 477 12 975 47 635 10 530 Qatar 311 - 48 14 -Saudi Arabia 8 025 869 325 14 -Singapore 1 749 42 834 - 162 -Somalia 2 950 - - - -Sri Lanka 1 701 - - - -Sudan 3 450 - - - -Syrian Arab Rep - 4 303 2 429 - -Taiwan 11 590 8 168 - 26 952 7 033 Thailand 8 982 20 740 - 3 -Turkey 680 21 020 353 - -United Arab Emirates 38 481 134 12 694 531 -Vietnam 45 241 - 217 -Yemen 6 232 43 - - -
Total 1 445 966 827 208 17 348 399 864 18 285
sup1 Source Statistics Canada sup2 September-August crop year sup3 Refers to weight of processed product Conversion rates to grain equivalents Barley malt ndash 1339 Canola oil ndash 2387 Canola meal ndash 1607 Exports of barley malt were 621 thousand tonnes (558 thousand in 2005-2006) Country of destination not available due to confidentiality
Canadian Grain Commission wwwgrainscanadagcca 34
Canadian Grain Exports Crop year 2006 - 2007
12 Exports of special crops and processed productssup1
Country Beans Buckwheat Canary Seed Chick Peas Lentils Mustard Seed (tonnes)
Oceania Australia 3 807 - 211 - 1 366 1 062 Cocos Islands - - - - - -Fiji - - - - - -New Zealand 1 814 - 391 22 228 3 US Outlying Islands - - - 45 - -
Total 5 621 - 602 67 1 594 1 065
Processed Productssup3
Country Peas Soybeanssup2 Sunflower Canola Oil Canola Meal (tonnes)
Oceania Australia 1 094 42 179 3 -Cocos Islands 119 - - - -Fiji 90 - - 30 -New Zealand 158 571 - 208 -US Outlying Islands - - - - -
Total 1 461 613 179 241 -
sup1 Source Statistics Canada sup2 September-August crop year sup3 Refers to weight of processed product Conversion rates to grain equivalents Barley malt ndash 1339 Canola oil ndash 2387 Canola meal ndash 1607 Exports of barley malt were 621 thousand tonnes (558 thousand in 2005-2006) Country of destination not available due to confidentiality
Canadian Grain Commission wwwgrainscanadagcca 35
Canadian Grain Exports Crop year 2006 - 2007
12 Exports of special crops and processed productssup1
Country Beans Buckwheat Canary Seed Chick Peas Lentils Mustard Seed
Western Hemisphere Antigua-Barbuda Argentina Aruba Barbados Belize Bermuda Bolivia Brazil British Virgin Islands Chile Colombia Costa Rica Cuba Dominica Dominican Republic Ecuador El Salvador Grenada Guatemala Guyana Haiti Honduras Jamaica Mexico Netherlands Antilles Nicaragua Panama Paraguay Peru St Kitts-Nevis St Vincent Gren Ste Lucie Surinam Trinidad-Tobago United States Uruguay Venezuela
7 -4 3
137 ----
256 45
643 510 60
12 714 43 67 29
1 514 1
6 202 -
1 736 4 189
3 -
426 --5 3
18 15
489 102 440
-2 375
---------------------------------1
1 537 --
(tonnes)
- -- 5 - -8 6 - -- -- -
21 558 106 - -
4 871 140 11 276 3 550
581 127 390 106
- -746 149
1 235 203 371 -
- -1 746 33
- 181 - -
22 -- -
42 583 -- -- -
75 14 - -
7 012 163 - -- -- -
32 27 172 659
13 062 5 112 116 -
6 186 45
5 1 822
1 68
--
1 323 10 965
-16 866 54 177
686 -
110 176
18 440 -
79 74
---
23 31 513
--
8 765 58
20 825 5
16 45
-1 325 6 361 2 451
23 015
-103
--1 --
569 -
285 74 16
---
203 200
-150
----
20 ----
296 ----
34 71 359
40 1 025
Total
Grand total exported
133 934
349 172
1 538
3 856
112 042 10 626
177 924 115 196
199 194
851 555
74 375
152 931
sup1 Source Statistics Canada
Canadian Grain Commission wwwgrainscanadagcca 36
Canadian Grain Exports Crop year 2006 - 2007
12 Exports of special crops and processed productssup1
Processed Productssup3
Country Peas Soybeanssup2 Sunflower Canola Oil Canola Meal (tonnes)
Western Hemisphere Antigua-Barbuda 9 - - - -Argentina - - - - -Aruba 3 - - - -Barbados 215 1 14 2 -Belize 71 - - - -Bermuda - - - 219 -Bolivia - - - - -Brazil 10 049 - - - -British Virgin Islands - 4 - - -Chile 5 053 - 84 22 -Colombia 34 159 - 312 3 342 -Costa Rica 604 - 421 24 -Cuba 26 968 39 2 - -Dominica 21 - - 1 -Dominican Republic 398 23 161 - -Ecuador 3 106 - - - -El Salvador - - 69 - -Grenada 150 - - - -Guatemala 45 - 539 9 -Guyana 2 947 - - - -Haiti - - - - -Honduras - - 165 - -Jamaica - 625 - - -Mexico 9 331 69 2 289 31 661 5 798 Netherlands Antilles - - - - -Nicaragua 875 - - - -Panama 1 327 186 229 - -Paraguay 8 - - - -Peru 13 338 - - 33 -St Kitts-Nevis 5 - - - -St Vincent Gren - 1 - - -Ste Lucie 20 1 - - -Surinam 802 125 22 8 -Trinidad-Tobago 5 448 215 89 82 -United States 34 482 198 369 96 576 719 403 1 458 082 Uruguay 15 - - - -Venezuela 16 259 - 108 - -
Total 165 708 199 658 101 080 754 806 1 463 880
Grand total exported 1 969 149 1 740 591 120 987 1 305 522 1 482 165
sup1 Source Statistics Canada sup2 September-August crop year sup3 Refers to weight of processed product Conversion rates to grain equivalents Barley malt ndash 1339 Canola oil ndash 2387 Canola meal ndash 1607 Exports of barley malt were 621 thousand tonnes (558 thousand in 2005-2006) Country of destination not available due to confidentiality
Canadian Grain Commission wwwgrainscanadagcca 37
Canadian Grain Exports Crop year 2006 - 2007
13 Ocean freight rates
From
To Japan
North Pacificsup1
Korea South China PR
St Lawrencesup1
Iran
August 2006
September
October
November
December
January 2007
February
March
April
May
June
July
3220
3650
3780
4100
4100
3960
3675
3975
4100
4520
4150
5200
($ US per short tonne)
3120 na
3550 na
3900 na
4300 na
4200 na
4080 na
3825 na
4075 na
4200 na
4620 na
4250 na
5300 na
4640
4800
4900
4825
5000
5120
4950
5225
5375
5940
6000
6700
Average 4036 4118 na 5290
sup1 Rates are calculated for heavy grains on largest sized vessel (type B-vessel size = over 35 000 tonnes) in most general use appropriate to specified route ready to load in three to four weeks time
Source International Grain Council
Canadian Grain Commission wwwgrainscanadagcca 38
Canadian Grain Exports Crop year 2006 - 2007
14 Estimated costs of moving wheat from a mid-prairie point to export position
Crop Year 200102 200203 200304 200405 200506 200607p
Primary Elevator Costs Elevation (1) Removal of dockage Shrinkage Carrying charges (2)
Railway Freight Via Thunder Bay Via Vancouver
Marketing (3)
Terminal Elevator Costs Storage (4) Fobbing charges - via St Lawrence ports (5) - via Pacific seaboard (5)
Lake Transportation (6)
Transfer Elevator Costs Storage Fobbing charges (7)
1118 368 022 245
3443 3378
-225
094
823 842
1917
192 230
1163 383 025 353
3343 3377
-008
167
873 890
1893
347 231
$tonne
1190 1190 440 440
- -196 186
3326 3402 3445 3471
277 083
102 148
903 926 920 936
1892 1928
173 362 232 232
1220 450
-230
3436 3506
315
130
954 982
1991
341 231
1251 462
-209
3805 3809
494
128
978 1006
2185
345 232
Total - via St Lawrence ports - via Pacific seaboard
8227 5842
8770 6350
8731 8897 6570 6454
9298 6833
10089 7359
P - Preliminary
Mid-Prairie point being Brass Saskatchewan
(1) Filed tariff for receiving elevating and loading
(2) Carrying charges on wheat stored in country elevators
(3) Includes interest bank and other charges and Canadian Wheat Board administrative costs interest and depreciation on CWB hopper cars drying additional freight and demurragedespatch
(4) Storage charges on wheat stored in terminal elevators
(5) Thunder Bay and Pacific fobbing charge which includes elevation outward weighing and inspection terminal elevator receipt cancellation lake shippersrsquo charges superintendence and forwarding brokerage charges
(6) Includes elevation outward weighing and inspection terminal elevator receipt cancellation BC Shippersrsquo charges superintendence wharfage and forwarding brokerage charges
(7) Includes lake freight lake brokerage cargo rates insurance St Lawrence Seaway and Welland Canal tolls and inward elevation into transfer elevator
Canadian Grain Commission wwwgrainscanadagcca 39

Canadian Grain Exports Crop year 2006 - 2007
6 Exports by class - wheat
Country CWRS CPS CWRW Feed CWES CWHWS CE Other CWAD Total
Asia Bangladesh China PR India Indonesia Iraq Japan Korea South Malaysia Philippines Singapore Sri Lanka Taiwan Thailand United Arab Emirates Vietnam Yemen
3086 441
4374 1 3249
6211 867 7 1104 1199 2932 180 852 63
1928 1410 1682
-
--
1514 545
---
30 --
303 -
10 ---
--
1996 392
---
05 --
477 -
80 ---
(000rsquoS tonnes)
- - -- - -- - -- - 1243 - - -
411 - -- - -- - 129 - - 664 - - 182 - - 980 - - -- - 438 - - 107 - - 126 - - -
--
2624 ------------
62
----------
6625 ---
775 -
--
1990 168
-2469
---
04 883
--
546 --
3086 441
1 2498 1 5596
6211 1 1557
1104 1364 3595 366
1 0120 63
2455 2063 2583
62
Total
Oceania New Zealand
4 7387
163
2402
-
2950
-
411 - 3868
- - -
2686
-
7400
-
6060
-
7 3163
163
Total
Western Hemisphere Brazil Caribbean Chile Colombia Cuba Dominican Republic Ecuador Guatemala Guyana Mexico Peru Puerto Rico United States Venezuela
163
1690 1523 368
3866 893 59
2747 470 366
1 0493 3327 271
1 0415 4519
-
---------
255 --
33 44
-
---
138 ------
248 -
70 -
- - -
- - 114 - - -- - -- - -- - -- - -- - -- - -- - 137
16 - 1104 - - -- - 327
68 - 265 - - -
-
-----
49 --
10 344
-202
1186 -
-
------------
143 -
-
-159 609 166
96 -
172 51
-74
583 -
6358 4685
163
1804 1682
978 4170
989 108
2918 521 513
1 2286 4158 800
1 8539 9248
Total
Grand Total Exported
4 1008
10 7862
331
2813
456
3548
83 - 1948
501 236 6600
1792
1 1066
143
7609
1 2953
4 4318
5 8714
18 4554
Note Refer to page 4 for class definitions
Canadian Grain Commission wwwgrainscanadagcca 18
Canadian Grain Exports Crop year 2006 - 2007
7 Exports by grade - oats
Country No 1 CW No 2 CW CE Other Total
Western Europe Norway - 367
(000rsquos tonnes)
- - 367 Total
Africa South Africa
-
-
367
133
-
-
-
-
367
133 Total
Asia Japan
-
38
133
75
-
-
-
-
133
114 Total
Western Hemisphere Ecuador Mexico Puerto Rico United States
38
-69
-1 2671
75
139 289
--
-
--
20 -
-
---
1721
114
139 358 20
1 4392 Total
Grand Total Exported
1 2740
1 2778
428
1004
20
20
1721
1721
1 4908
1 5522
7 Exports by grade - barley
Country Select Feed CE Total
Eastern Europe Czech Republic 00sup1
(000rsquos tonnes)
- - 00sup1
Total
Africa South Africa
00sup1
-
-
506
-
-
00sup1
506 Total
Asia China PR Japan Vietnam
-
3308 2811
-
506
639 316 130
-
---
506
3946 3127
130 Total
Western Hemisphere ColombiaEcuador Mexico Peru United States
6118
654 ---
608
1085
173 176 197 133
2103
-
----
12
7203
826 176 197 133
2723 Total
Grand Total Exported
1262
7380
2782
4372
12
12
4055
1 1765 sup1 00 less than 50 tonnes Note Refer to page 4 for class definitions
Canadian Grain Commission wwwgrainscanadagcca 19
Canadian Grain Exports Crop year 2006 - 2007
7 Exports by grade - flaxseedsup1
Country No 1 CW Total (000rsquos tonnes)
Western Europe Belgium 4661 4661 Total 4661 4661
Asia Japan 157 157 Total 157 157
Western Hemisphere United States 980 980 Total 980 980
Grand Total Exported 5797 5797
sup1 All exports graded as Flaxseed No 1 Canada Western
7 Exports by grade - canola
Country No 1 Canada No 2 Canada Others Total
Asia Bangladesh China PR Israel Japan Nepal Pakistan TurkeyUnited Arab Emirates
944 9157
78 1 9499
124 4983
289 2817
(000rsquos tonnes)
---
109 ----
-----
505 --
944 9157
78 1 9608
124 5488
289 2817
Total
Oceania Australia
3 7891
571
109
-
505
-
3 8504
571 Total
Western Hemisphere Mexico United States
571
8997 6591
-
--
-
--
571
8997 6591
Total
Grand Total Exported
1 5588
5 4050
-
109
-
505
1 5588
5 4664
Canadian Grain Commission wwwgrainscanadagcca 20
Canadian Grain Exports Crop year 2006 - 2007
7 Exports by grade - soybean
Country No 1 Canada No 2 Canada Others Total
Western Europe Belgium Denmark France Ireland ItalyNetherlands NorwayPortugal Spain United Kingdom
----------
(000rsquos tonnes)
1606 302 466 17 31
2405 268 653 132 216
----------
1606 302 466 17 31
2405 268 653 132 216
Total
Africa Egypt
-
-
6098
157
-
-
6098
157 Total
Asia Iran Israel Japan Korea North MalaysiaSyria United Arab Emirates
-
--
68 ----
157
2252 238 108
-605 43 85
-
---
239 ---
157
2252 238 176 239 605 43 85
Total
Western Hemisphere CubaUnited States
68
-186
3331
206 -
239
--
3638
206 186
Total
Grand Total Exported
186
255
206
9792
-
239
392
1 0285
Canadian Grain Commission wwwgrainscanadagcca 21
Canadian Grain Exports Crop year 2006 - 2007
7 Exports by grade - peas
Country All grades combined Total
Western Europe Belgium Denmark Netherlands NorwaySpain
(000rsquos tonnes)
535 216 106
82 1397
535 216 106
82 1397
Total
Africa Algeria
2335
245
2335
245 Total
Asia Bangladesh India Nepal Pakistan United Arab Emirates
245
1901 9407
25 387 110
245
1901 9407
25 387 110
Total
Western Hemisphere Colombia CubaUnited States
1 1830
25 490
02
1 1830
25 490
02 Total
Grand Total Exported
518
1 4928
518
1 4928
Canadian Grain Commission wwwgrainscanadagcca 22
Canadian Grain Exports Crop year 2006 - 2007
7 Exports by grade - corn
Country No2 CE No3 CE Other Total (000rsquos tonnes)
Western Europe Iceland - - 106 106 Total - - 106 106
Africa Algeria - - 219 219 Total - - 219 219
Asia Iran - - 1561 1561 Israel - 45 - 45 Total - 45 1561 1606
Western Hemisphere United States 00sup1 - 03 04 Total 00sup1 - 03 04
Grand Total Exported 00sup1 45 1888 1933
sup1 00 less than 50 tonnes
Note Refer to page 4 for class definitions
Canadian Grain Commission wwwgrainscanadagcca 23
Canadian Grain Exports Crop year 2006 - 2007
8 Exports by port of clearance
Loaded at Wheat Durum Wheat Oats Barley Flaxseed Canola Soybean Peas Corn Total
Prince Rupert
Vancouver
Churchill
Thunder Bay
Queacutebec
Baie-Comeau Ontario elevators
Owen Sound
Prescott
Goderich
Sarnia
Montreal
Port Cartier
Sorel
Trois-Riviegraveres
Halifax
Prairie elevators
4 4285
4 1492
3375
977
1 0333
7501
286
132
20
429
802
3412
9699
2960
05
140
1 4387
1732
6179
742
1715
8374
9920
-
-
-
-
-
3617
3575
872
913
-
6680
-
542
-
2221
-
-
-
-
-
-
-
-
-
20
-
-
1 2740
925
7821
-
506
-
-
-
-
12
-
-
00sup1
-
-
-
-
2501
(000rsquos tonnes)
- 2354
157 4 0969
- 390
4549 3255
- -
- -
- -
- -
02 -
- -
- -
- -
- 243
112 480
- -
- -
978 6973
-
-
-
160
1168
817
1294
-
-
453
-
2158
500
2690
859
-
186
- - 4 9295
1 2530 - 10 9690
656 - 5163
1246 - 1 4628
245 181 2 0300
- 125 1 8363
- - 1580
- - 132
- 00sup1 34
- - 882
- - 802
- 1360 1 0548
- - 1 4017
248 219 7601
- 45 1822
- - 140
02 03 4 4451
16
36
2
5
7
6
1
3
5
2
1
15
Grand total exported 140236 44318 15522 11765 5797 54664 10285 14928 1933 299448 100
sup1 00 less than 50 tonnes
Note Includes exports of Eastern wheat via unlicensed facilities
Canadian Grain Commission wwwgrainscanadagcca 24
Canadian Grain Exports Crop year 2006 - 2007
9 Exports by month and clearance sector
Wheat Durum Wheat Oats Barley Flaxseed Canola Soybean Peas Corn Total
Pacific August2006 September October November December January2007 February March April May June July
8135 5168 6703 6234 7717 5439 5918 8028 7584 9329 8494 7027
376 536
1337 1721 486 498 674 137 594 577 476 499
10 --
05 -
158 308 31
---
30
684 383
1129 1193
820 995
1163 786 650 769 19
155
(000rsquos tonnes)
18 2701 23 4418 08 4767
- 3362 23 2449 16 5131 08 3092 08 4036 14 3657 23 3418 16 2767
- 3525
------------
449 2687 960
1116 1109 964
1229 488
1508 1013
742 265
------------
1 2374 1 3215 1 4904 1 3631 1 2604 1 3200 1 2391 1 3513 1 4009 1 5131 1 2514 1 1500
Total
Churchill August2006 September October November July2007
8 5777
314 997
1350 440 275
7911
-275 467
--
542
-----
8746
-----
157 4 3323
- 390 - -- -- -- -
-
-----
1 2530
-456 200
--
-
-----
15 8985
703 1728 2016
440 275
Total
Thunder Bay August2006 September October November December March2007 April May June July
3375
--
175 193 160
--
365 84
-
742
181 92
216 -
111 -
221 224 95
575
-
158 157 335 594 272 142 113 151
-297
-
-22 29
---
66 44
131 214
- 390
160 258 329 792 597 212 839 191 757 -
- -537 706 593 671 160 211 577 213
-
--
50 -
31 --
79 --
656
156 202 467
53 97
-85 82
105 -
-
----------
5163
913 1595 2080 1870 1428
142 1727 2208
787 1876
Total 977 1715 2221 506 4549 3255 160 1246 - 1 4628
Canadian Grain Commission wwwgrainscanadagcca 25
Canadian Grain Exports Crop year 2006 - 2007
9 Exports by month and clearance sector
Wheat Durum Wheat Oats Barley Flaxseed Canola Soybean Peas Corn Total
Eastern August2006 September October November December January2007 February March April May June July
3987 5979 3375 4196 2839 1444 1619 1304 2771 1786 3404 2875
1697 2337 3610 2548 3235 1512 1430 1153 2607 3053 2669 1419
--
20 ---------
(000rsquos tonnes)
- 00sup1 00sup1 00sup1
- 00sup1 00sup1 09 00sup1 36 04 -
00sup1 00sup1 - -
02 00sup1 05 53 01 00sup1
- 14
69 -
285 ---
243 --
58 68
-
375 599
1120 2793 1830 649 311 239 515 421 642 444
53 115
-326
--------
--
00sup1 -
254 665 278
--
650 82
-
6181 9031 8411 9872 8194 4275 3881 2697 5896 6027 6866 4752
Total
Atlantic January2007 March
3 5580
76 64
2 7271
--
20
--
12 114
- -- -
723
--
9939
--
494
--
1930
--
7 6082
76 64
Total
Prairie August2006 September October November December January2007 February March April May June July
140
496 666
1089 1066 1195 1293 1260 1350 1656 1631 1334 1352
-
504 547 577 533 395 607 462 493 720 379 664 800
-
2209 1765 1481 1375 755
1028 778 960 798 781 407 403
- -
83 25 144 72 261 61 359 103 210 42 389 124 148 53 108 68 178 133 299 45 302 121 22 130
-
886 468 600 579 309 539 523 529 405 756 605 774
-
--
17 10
-11 03 24 15 20 60 27
-
----
01 ----
02 --
-
----------
03 00sup1
140
4203 3662 4085 4024 2905 3991 3226 3532 3904 3912 3497 3508
Total Grand total exported
1 4387
14 0236
6680
4 4318
1 2740
1 5522
2501 978
1 1765 5797
6973
5 4664
186
1 2085
02
1 4928
03
1933
4 4451
29 9448
sup1 00 less than 50 tonnes
Canadian Grain Commission wwwgrainscanadagcca 26
Canadian Grain Exports Crop year 2006 - 2007
10 Exports by class grade and clearance sector
Grade Pacific Churchill Thunder
Bay Eastern Atlantic Prairies Total
Wheat CWRS CPS CWRW Feed CWES CWHWS CE Other CWAD
6 7503 2656 3335 411
-4470
-7400 7911
3094 -
39 16
-227
--
742
(000rsquos tonnes)
774 2 2450 05 119
- 104 - 06
94 142 104 1494
- 1 1066 - 198
1715 2 7271
101 ----
39 ---
1 3941 33 70 68
-265
-11
6680
10 7862 2813 3548
501 236
6600 1 1066
7609 4 4318
Total
Oats No 1 CW No 2 CW CE Other
9 3687
38 503
--
4117
----
2691 6 2851
- -500 -
- 20 1721 -
140
----
2 1067
1 2740 ---
18 4554
1 2778 1004
20 1721
Total
Barley Select Feed CE
542
6673 2072
-
-
---
2221 20
506 -- 00sup1 - 12
-
---
1 2740
201 2300
-
1 5522
7380 4372
12 Total
Flaxseed No 1 CW
8746
157
-
-
506 12
4549 114
-
-
2501
978
1 1765
5797 Total
Canola No 1 Canada No 2 Canada Other
157
4 2710 109 504
-
389 -
01
4549 114
3255 723 - -- -
-
---
978
6973 --
5797
5 4050 109 505
Total
Soybean No 1 Canada No 2 Canada Other
4 3323
---
390
---
3255 723
- 68 160 9632
- 239
-
---
6973
186 --
5 4664
255 9792
239 Total
Peas All grades combined
-
1 2530
-
656
160 9939
1246 494
-
-
186
02
1 0285
1 4928 Total
Corn No 2 CE No 3 CE Other
1 2530
---
656
---
1246 494
- 00sup1 - 45 - 1885
-
---
02
--
03
1 4928
00sup1 45
1888 Total
Grand total exported
-
15 8985
-
5163
- 1930
1 4628 7 6082
-
140
03
4 4451
1933
29 9448 sup1 00 less than 50 tonnes Note Refer to page 4 for class definitions
Canadian Grain Commission wwwgrainscanadagcca 27
Canadian Grain Exports Crop year 2006 - 2007
11 Exports of wheat (including durum) and wheat flour by month and clearance sector
Month Pacific Churchill Thunder
Bay Eastern Atlantic Prairie Total
Wheat Wheat Flour
Total Wheat and
Wheat Flour
August2006
September
October
November
December
January2007
February
March
April
May
June
July
8511
5704
8040
7955
8203
5937
6592
8165
8179
9907
8970
7526
314
1272
1816
440
-
-
-
-
-
-
-
275
(000rsquos tonnes)
181 5684
92 8316
391 6986
193 6744
271 6074
- 2956
- 3048
- 2458
221 5378
588 4839
179 6073
575 4294
-
-
-
-
-
76
-
64
-
-
-
-
1000
1213
1665
1599
1590
1900
1722
1843
2376
2010
1999
2152
1 5690
1 6597
1 8898
1 6931
1 6137
1 0869
1 1362
1 2530
1 6154
1 7343
1 7221
1 4821
254
243
278
291
280
291
226
226
234
250
284
234
1 5944
1 6839
1 9176
1 7222
1 6417
1 1160
1 1588
1 2756
1 6388
1 7594
1 7505
1 5055
Grand total exported 9 3687 4117 2691 6 2851 140 2 1067 18 4554 3090 18 7644
Canadian Grain Commission wwwgrainscanadagcca 28
Canadian Grain Exports Crop year 2006 - 2007
12 Exports of special crops and processed productssup1
Country Beans Buckwheat Canary Seed Chick Peas Lentils Mustard Seed
Western Europe Austria Belgium Denmark Finland France Germany Greece Iceland Ireland Italy Malta Netherlands Norway Portugal Spain Sweden Switzerland United Kingdom
41 1 047
22 -
4 006 2 912 7 651
-1 911
22 539 114
13 999 -
7 978 6 130
206 825
67 966
36 ----
77 ------
155 ----
16
(tonnes)
30 489 5 - 4 751 - -- -
46 1 903 1 141 286
839 471 - -
23 -3 262 7 833
844 -731 895
- -4 615 6 126
13 699 5 629 90 267
- 658 45 4 713
71 9 331
-22
9 301 12 641 11 032
147 22
23 135 -
4 250 -
3 663 30 301
424 671
6 462
25 852 --
492 2 345
15 812 295
--
167 -
5 980 --
79 20
145 1 593
Total Eastern Europe Albania Armenia Azerbaijan Belarus Bosnia-Herzegovina Bulgaria Byelorussia SSR Croatia Czech Republic Estonia Georgia Hungary Latvia Lithuania Macedonia Moldova Montenegro Poland Romania Russia Serbia Slovakia Slovania Ukraine Yugoslavia
137 347
61 --
23 1 624
90 23
2 546 1 584
-98
1 186 -
40 --
468 206
-237
-705 822
-20
284
-------------------------
55 824 33 535
- -- 22 - -- -- 23
21 -- -- 80 - 65 - -- 23 - -- -- -- -- -- -- 25 - -
20 -- -- -- -- 19 - -
111 473
-889
50 --
2 407 -
127 4 413
-956
1 226 --
317 --
519 -
68 23
809 ---
52 780
-------
80 42
--------
571 80 43
-----
Total 9 733 - 41 257 11 804 816
sup1 Source Statistics Canada
Canadian Grain Commission wwwgrainscanadagcca 29
Canadian Grain Exports Crop year 2006 - 2007
12 Exports of special crops and processed productssup1
Processed Productssup3
Country Peas Soybeanssup2 Sunflower Canola Oil Canola Meal (tonnes)
Western Europe Austria 2 3 - - -Belgium 55 353 182 203 45 731 -Denmark 21 601 30 210 - - -Finland - - - - -France 1 057 32 812 24 8 -Germany 878 920 49 63 577 -Greece 220 - - - -Iceland - - - - -Ireland 68 1 749 - - -Italy 7 587 874 23 - -Malta 69 - - - -Netherlands 11 949 316 202 - 85 930 -Norway 8 181 26 840 84 - -Portugal 1 263 65 503 80 67 -Spain 169 357 8 693 68 49 -Sweden - - 141 - -Switzerland 20 - - 20 -United Kingdom 4 881 - - - -Total 282 486 666 009 514 150 382 -
Eastern Europe Albania - - - - -Armenia 68 - - - -Azerbaijan - - - - -Belarus - - - - -Bosnia-Herzegovina - - - - -Bulgaria - - - - -Byelorussia SSR - - - - -Croatia 15 - 21 - -Czech Republic 91 325 - 79 -Estonia 1 268 - - - -Georgia 355 - - - -Hungary 904 20 - - -Latvia - - 68 - -Lithuania - 40 - - -Macedonia - - - - -Moldova - - - 70 -Montenegro - - - - -Poland 216 810 - - -Romania - 678 22 - -Russia 3 999 1 199 - - -Serbia - - - - -Slovakia - 103 - - -Slovania - - 1 - -Ukraine - 157 - - -Yugoslavia - - - - -Total 6 916 3 332 112 149 -sup1 Source Statistics Canada sup2 September-August crop year sup3 Refers to weight of processed product Conversion rates to grain equivalents Barley malt ndash 1339 Canola oil ndash 2387 Canola meal ndash 1607 Exports of barley malt were 621 thousand tonnes (558 thousand in 2005-2006) Country of destination not available due to confidentiality
Canadian Grain Commission wwwgrainscanadagcca 30
Canadian Grain Exports Crop year 2006 - 2007
12 Exports of special crops and processed productssup1
Country Beans Buckwheat Canary Seed Chick Peas Lentils Mustard Seed
Africa Algeria Angola Benin British Indian Ocean Terr Burundi Cameroon Cape Verde Central African Republic Chad Comoros Congo Cocircte-drsquoIvoire Djibouti Egypt Ethiopia Gambia Ghana Guinea Kenya Liberia Madagascar Malawi Mauritania Mauritius Morocco Mozambique Namibia Niger Rwanda Senegal Sierra Leone South Africa St Helena Swaziland Tanzania Togo Tunisia Uganda Zaire Zambia Zimbabwe
672 16 658
-18
-505 50
---
645 88
-2 814
----------
516 -
75 ----
867 ------
521 --
-----------------------------------------
(tonnes)
1 609 4 410 - -- -- -- -- -- -- -- -- -- -- 5 - -
1 021 2 373 - -- -- -- -- -- -- -- -- -1 20
660 -- -- -- -- -- -- -
479 163 - -- -- -- -- 720 - -- -- -- -
69 735 268
-14
--------
200 29 206
----
175 60
--
100 1 264
28 577 ----
850 -
3 350 ----
528 ----
-----------------------
68 326
----
1 466 -
267 ---------
Total 23 409 - 3 770 7 691 134 327 2 127
sup1 Source Statistics Canada
Canadian Grain Commission wwwgrainscanadagcca 31
Canadian Grain Exports Crop year 2006 - 2007
12 Exports of special crops and processed productssup1
Processed Productssup3
Country Peas Soybeanssup2 Sunflower Canola Oil Canola Meal (tonnes)
Africa Algeria 6 484 - 1 210 - -Angola - - - - -Benin 475 - - - -British Indian Ocean Terr 16 - - - -Burundi 1 783 - - - -Cameroon - 204 - - -Cape Verde 125 - - - -Central African Republic 200 - - - -Chad 500 - - - -Comoros - - - 80 -Congo 8 - - - -Cocircte-drsquoIvoire 800 - - - -Djibouti - - - - -Egypt 5 984 42 723 526 - -Ethiopia 3 150 - - - -Gambia 291 - - - -Ghana 100 - - - -Guinea 350 - - - -Kenya 12 025 - - - -Liberia 1 050 - - - -Madagascar 836 - - - -Malawi 50 255 - - -Mauritania 620 - - - -Mauritius 591 187 18 - -Morocco 3 648 137 - - -Mozambique 450 - - - -Namibia - - - - -Niger 175 - - - -Rwanda 625 - - - -Senegal 297 - - - -Sierra Leone 1 125 - - - -South Africa 12 709 68 - - -St Helena - 41 - - -Swaziland 70 156 - - -Tanzania 4 350 - - - -Togo 25 - - - -Tunisia - - - - -Uganda 2 625 - - - -Zaire 4 225 - - - -Zambia 400 - - - -Zimbabwe 450 - - - -
Total 66 612 43 771 1 754 80 -sup1 Source Statistics Canada sup2 September-August crop year sup3 Refers to weight of processed product Conversion rates to grain equivalents Barley malt ndash 1339 Canola oil ndash 2387 Canola meal ndash 1607 Exports of barley malt were 621 thousand tonnes (558 thousand in 2005-2006) Country of destination not available due to confidentiality
Canadian Grain Commission wwwgrainscanadagcca 32
Canadian Grain Exports Crop year 2006 - 2007
12 Exports of special crops and processed productssup1
Country Beans Buckwheat Canary Seed Chick Peas Lentils Mustard Seed
Asia Afghanistan Bahrain Bangladesh Bhutan Brunei Darussalam Cambodia China PR Cyprus East Timor Hong Kong India Indonesia Iran Israel Japan Jordan Korea North Korea South Kuwait Lebanon Macau Malaysia Mongolia Nepal Oman Pakistan Philippines Qatar Saudi Arabia Singapore Somalia Sri Lanka Sudan Syrian Arab Rep Taiwan Thailand Turkey United Arab Emirates Vietnam Yemen
-------
11 599 16 69 23
-1 401
21 977 -
1 860 4 485
59 467
-256
---
40 269 50
2 415 40
----
4 348 -
175 568
--
--------------
2 031 -------3 -----------------
(tonnes)
- -- -- 1 305 - -- -
22 -128 -176 91
- -5 9
22 12 903 1 434 44
- -345 2 056
1 339 336 86 15 467
- -111 -
43 270 279 3 569
- -- -- -- -- -- 17 108
334 23 - 49
83 6 183 - -- -- -- -- -
830 -22 -
235 -151 3 607
- -- -
1 595
40 320 ---
967 1 054
-30
130 075 197
9 604 6 085
318 1 384
--
291 3 599
----
199 61 096
-343
2 962 1 618
-19 022
500 113 22
-31 125 81 544
-99
--
3 899 ---
50 ---
4 172 --
65 6 386
--
2 699 ---
33 ----
56 ----
467 --
41 3 610
125 165
--
Total 39 128 2 034 5 645 63 020 393 163 21 768
sup1 Source Statistics Canada
Canadian Grain Commission wwwgrainscanadagcca 33
Canadian Grain Exports Crop year 2006 - 2007
12 Exports of special crops and processed productssup1
Processed Productssup3
Country Peas Soybeanssup2 Sunflower Canola Oil Canola Meal (tonnes)
Asia Afghanistan - - - - -Bahrain 973 - 96 43 -Bangladesh 110 049 - - - -Bhutan 86 - - - -Brunei Darussalam - 142 - - -Cambodia 249 - - - -China PR 251 442 2 400 - 263 814 407 Cyprus - - - - -East Timor - - - - -Hong Kong 2 30 126 7 25 289 -India 895 514 - 146 31 -Indonesia 12 907 522 - 8 -Iran 5 602 244 428 - - -Israel 4 494 25 152 63 12 -Japan 10 924 276 542 124 19 631 315 Jordan 812 80 136 - -Korea North 64 - 74 - -Korea South 563 60 - 35 567 -Kuwait 413 - 476 761 -Lebanon 528 - 262 70 -Macau - 20 - - -Malaysia 2 880 136 409 23 26 096 -Mongolia - - - - -Nepal 5 455 - - - -Oman 214 - - 14 -Pakistan 45 122 - 45 - -Philippines 13 477 12 975 47 635 10 530 Qatar 311 - 48 14 -Saudi Arabia 8 025 869 325 14 -Singapore 1 749 42 834 - 162 -Somalia 2 950 - - - -Sri Lanka 1 701 - - - -Sudan 3 450 - - - -Syrian Arab Rep - 4 303 2 429 - -Taiwan 11 590 8 168 - 26 952 7 033 Thailand 8 982 20 740 - 3 -Turkey 680 21 020 353 - -United Arab Emirates 38 481 134 12 694 531 -Vietnam 45 241 - 217 -Yemen 6 232 43 - - -
Total 1 445 966 827 208 17 348 399 864 18 285
sup1 Source Statistics Canada sup2 September-August crop year sup3 Refers to weight of processed product Conversion rates to grain equivalents Barley malt ndash 1339 Canola oil ndash 2387 Canola meal ndash 1607 Exports of barley malt were 621 thousand tonnes (558 thousand in 2005-2006) Country of destination not available due to confidentiality
Canadian Grain Commission wwwgrainscanadagcca 34
Canadian Grain Exports Crop year 2006 - 2007
12 Exports of special crops and processed productssup1
Country Beans Buckwheat Canary Seed Chick Peas Lentils Mustard Seed (tonnes)
Oceania Australia 3 807 - 211 - 1 366 1 062 Cocos Islands - - - - - -Fiji - - - - - -New Zealand 1 814 - 391 22 228 3 US Outlying Islands - - - 45 - -
Total 5 621 - 602 67 1 594 1 065
Processed Productssup3
Country Peas Soybeanssup2 Sunflower Canola Oil Canola Meal (tonnes)
Oceania Australia 1 094 42 179 3 -Cocos Islands 119 - - - -Fiji 90 - - 30 -New Zealand 158 571 - 208 -US Outlying Islands - - - - -
Total 1 461 613 179 241 -
sup1 Source Statistics Canada sup2 September-August crop year sup3 Refers to weight of processed product Conversion rates to grain equivalents Barley malt ndash 1339 Canola oil ndash 2387 Canola meal ndash 1607 Exports of barley malt were 621 thousand tonnes (558 thousand in 2005-2006) Country of destination not available due to confidentiality
Canadian Grain Commission wwwgrainscanadagcca 35
Canadian Grain Exports Crop year 2006 - 2007
12 Exports of special crops and processed productssup1
Country Beans Buckwheat Canary Seed Chick Peas Lentils Mustard Seed
Western Hemisphere Antigua-Barbuda Argentina Aruba Barbados Belize Bermuda Bolivia Brazil British Virgin Islands Chile Colombia Costa Rica Cuba Dominica Dominican Republic Ecuador El Salvador Grenada Guatemala Guyana Haiti Honduras Jamaica Mexico Netherlands Antilles Nicaragua Panama Paraguay Peru St Kitts-Nevis St Vincent Gren Ste Lucie Surinam Trinidad-Tobago United States Uruguay Venezuela
7 -4 3
137 ----
256 45
643 510 60
12 714 43 67 29
1 514 1
6 202 -
1 736 4 189
3 -
426 --5 3
18 15
489 102 440
-2 375
---------------------------------1
1 537 --
(tonnes)
- -- 5 - -8 6 - -- -- -
21 558 106 - -
4 871 140 11 276 3 550
581 127 390 106
- -746 149
1 235 203 371 -
- -1 746 33
- 181 - -
22 -- -
42 583 -- -- -
75 14 - -
7 012 163 - -- -- -
32 27 172 659
13 062 5 112 116 -
6 186 45
5 1 822
1 68
--
1 323 10 965
-16 866 54 177
686 -
110 176
18 440 -
79 74
---
23 31 513
--
8 765 58
20 825 5
16 45
-1 325 6 361 2 451
23 015
-103
--1 --
569 -
285 74 16
---
203 200
-150
----
20 ----
296 ----
34 71 359
40 1 025
Total
Grand total exported
133 934
349 172
1 538
3 856
112 042 10 626
177 924 115 196
199 194
851 555
74 375
152 931
sup1 Source Statistics Canada
Canadian Grain Commission wwwgrainscanadagcca 36
Canadian Grain Exports Crop year 2006 - 2007
12 Exports of special crops and processed productssup1
Processed Productssup3
Country Peas Soybeanssup2 Sunflower Canola Oil Canola Meal (tonnes)
Western Hemisphere Antigua-Barbuda 9 - - - -Argentina - - - - -Aruba 3 - - - -Barbados 215 1 14 2 -Belize 71 - - - -Bermuda - - - 219 -Bolivia - - - - -Brazil 10 049 - - - -British Virgin Islands - 4 - - -Chile 5 053 - 84 22 -Colombia 34 159 - 312 3 342 -Costa Rica 604 - 421 24 -Cuba 26 968 39 2 - -Dominica 21 - - 1 -Dominican Republic 398 23 161 - -Ecuador 3 106 - - - -El Salvador - - 69 - -Grenada 150 - - - -Guatemala 45 - 539 9 -Guyana 2 947 - - - -Haiti - - - - -Honduras - - 165 - -Jamaica - 625 - - -Mexico 9 331 69 2 289 31 661 5 798 Netherlands Antilles - - - - -Nicaragua 875 - - - -Panama 1 327 186 229 - -Paraguay 8 - - - -Peru 13 338 - - 33 -St Kitts-Nevis 5 - - - -St Vincent Gren - 1 - - -Ste Lucie 20 1 - - -Surinam 802 125 22 8 -Trinidad-Tobago 5 448 215 89 82 -United States 34 482 198 369 96 576 719 403 1 458 082 Uruguay 15 - - - -Venezuela 16 259 - 108 - -
Total 165 708 199 658 101 080 754 806 1 463 880
Grand total exported 1 969 149 1 740 591 120 987 1 305 522 1 482 165
sup1 Source Statistics Canada sup2 September-August crop year sup3 Refers to weight of processed product Conversion rates to grain equivalents Barley malt ndash 1339 Canola oil ndash 2387 Canola meal ndash 1607 Exports of barley malt were 621 thousand tonnes (558 thousand in 2005-2006) Country of destination not available due to confidentiality
Canadian Grain Commission wwwgrainscanadagcca 37
Canadian Grain Exports Crop year 2006 - 2007
13 Ocean freight rates
From
To Japan
North Pacificsup1
Korea South China PR
St Lawrencesup1
Iran
August 2006
September
October
November
December
January 2007
February
March
April
May
June
July
3220
3650
3780
4100
4100
3960
3675
3975
4100
4520
4150
5200
($ US per short tonne)
3120 na
3550 na
3900 na
4300 na
4200 na
4080 na
3825 na
4075 na
4200 na
4620 na
4250 na
5300 na
4640
4800
4900
4825
5000
5120
4950
5225
5375
5940
6000
6700
Average 4036 4118 na 5290
sup1 Rates are calculated for heavy grains on largest sized vessel (type B-vessel size = over 35 000 tonnes) in most general use appropriate to specified route ready to load in three to four weeks time
Source International Grain Council
Canadian Grain Commission wwwgrainscanadagcca 38
Canadian Grain Exports Crop year 2006 - 2007
14 Estimated costs of moving wheat from a mid-prairie point to export position
Crop Year 200102 200203 200304 200405 200506 200607p
Primary Elevator Costs Elevation (1) Removal of dockage Shrinkage Carrying charges (2)
Railway Freight Via Thunder Bay Via Vancouver
Marketing (3)
Terminal Elevator Costs Storage (4) Fobbing charges - via St Lawrence ports (5) - via Pacific seaboard (5)
Lake Transportation (6)
Transfer Elevator Costs Storage Fobbing charges (7)
1118 368 022 245
3443 3378
-225
094
823 842
1917
192 230
1163 383 025 353
3343 3377
-008
167
873 890
1893
347 231
$tonne
1190 1190 440 440
- -196 186
3326 3402 3445 3471
277 083
102 148
903 926 920 936
1892 1928
173 362 232 232
1220 450
-230
3436 3506
315
130
954 982
1991
341 231
1251 462
-209
3805 3809
494
128
978 1006
2185
345 232
Total - via St Lawrence ports - via Pacific seaboard
8227 5842
8770 6350
8731 8897 6570 6454
9298 6833
10089 7359
P - Preliminary
Mid-Prairie point being Brass Saskatchewan
(1) Filed tariff for receiving elevating and loading
(2) Carrying charges on wheat stored in country elevators
(3) Includes interest bank and other charges and Canadian Wheat Board administrative costs interest and depreciation on CWB hopper cars drying additional freight and demurragedespatch
(4) Storage charges on wheat stored in terminal elevators
(5) Thunder Bay and Pacific fobbing charge which includes elevation outward weighing and inspection terminal elevator receipt cancellation lake shippersrsquo charges superintendence and forwarding brokerage charges
(6) Includes elevation outward weighing and inspection terminal elevator receipt cancellation BC Shippersrsquo charges superintendence wharfage and forwarding brokerage charges
(7) Includes lake freight lake brokerage cargo rates insurance St Lawrence Seaway and Welland Canal tolls and inward elevation into transfer elevator
Canadian Grain Commission wwwgrainscanadagcca 39

Canadian Grain Exports Crop year 2006 - 2007
9 Exports by month and clearance sector
Wheat Durum Wheat Oats Barley Flaxseed Canola Soybean Peas Corn Total
Eastern August2006 September October November December January2007 February March April May June July
3987 5979 3375 4196 2839 1444 1619 1304 2771 1786 3404 2875
1697 2337 3610 2548 3235 1512 1430 1153 2607 3053 2669 1419
--
20 ---------
(000rsquos tonnes)
- 00sup1 00sup1 00sup1
- 00sup1 00sup1 09 00sup1 36 04 -
00sup1 00sup1 - -
02 00sup1 05 53 01 00sup1
- 14
69 -
285 ---
243 --
58 68
-
375 599
1120 2793 1830 649 311 239 515 421 642 444
53 115
-326
--------
--
00sup1 -
254 665 278
--
650 82
-
6181 9031 8411 9872 8194 4275 3881 2697 5896 6027 6866 4752
Total
Atlantic January2007 March
3 5580
76 64
2 7271
--
20
--
12 114
- -- -
723
--
9939
--
494
--
1930
--
7 6082
76 64
Total
Prairie August2006 September October November December January2007 February March April May June July
140
496 666
1089 1066 1195 1293 1260 1350 1656 1631 1334 1352
-
504 547 577 533 395 607 462 493 720 379 664 800
-
2209 1765 1481 1375 755
1028 778 960 798 781 407 403
- -
83 25 144 72 261 61 359 103 210 42 389 124 148 53 108 68 178 133 299 45 302 121 22 130
-
886 468 600 579 309 539 523 529 405 756 605 774
-
--
17 10
-11 03 24 15 20 60 27
-
----
01 ----
02 --
-
----------
03 00sup1
140
4203 3662 4085 4024 2905 3991 3226 3532 3904 3912 3497 3508
Total Grand total exported
1 4387
14 0236
6680
4 4318
1 2740
1 5522
2501 978
1 1765 5797
6973
5 4664
186
1 2085
02
1 4928
03
1933
4 4451
29 9448
sup1 00 less than 50 tonnes
Canadian Grain Commission wwwgrainscanadagcca 26
Canadian Grain Exports Crop year 2006 - 2007
10 Exports by class grade and clearance sector
Grade Pacific Churchill Thunder
Bay Eastern Atlantic Prairies Total
Wheat CWRS CPS CWRW Feed CWES CWHWS CE Other CWAD
6 7503 2656 3335 411
-4470
-7400 7911
3094 -
39 16
-227
--
742
(000rsquos tonnes)
774 2 2450 05 119
- 104 - 06
94 142 104 1494
- 1 1066 - 198
1715 2 7271
101 ----
39 ---
1 3941 33 70 68
-265
-11
6680
10 7862 2813 3548
501 236
6600 1 1066
7609 4 4318
Total
Oats No 1 CW No 2 CW CE Other
9 3687
38 503
--
4117
----
2691 6 2851
- -500 -
- 20 1721 -
140
----
2 1067
1 2740 ---
18 4554
1 2778 1004
20 1721
Total
Barley Select Feed CE
542
6673 2072
-
-
---
2221 20
506 -- 00sup1 - 12
-
---
1 2740
201 2300
-
1 5522
7380 4372
12 Total
Flaxseed No 1 CW
8746
157
-
-
506 12
4549 114
-
-
2501
978
1 1765
5797 Total
Canola No 1 Canada No 2 Canada Other
157
4 2710 109 504
-
389 -
01
4549 114
3255 723 - -- -
-
---
978
6973 --
5797
5 4050 109 505
Total
Soybean No 1 Canada No 2 Canada Other
4 3323
---
390
---
3255 723
- 68 160 9632
- 239
-
---
6973
186 --
5 4664
255 9792
239 Total
Peas All grades combined
-
1 2530
-
656
160 9939
1246 494
-
-
186
02
1 0285
1 4928 Total
Corn No 2 CE No 3 CE Other
1 2530
---
656
---
1246 494
- 00sup1 - 45 - 1885
-
---
02
--
03
1 4928
00sup1 45
1888 Total
Grand total exported
-
15 8985
-
5163
- 1930
1 4628 7 6082
-
140
03
4 4451
1933
29 9448 sup1 00 less than 50 tonnes Note Refer to page 4 for class definitions
Canadian Grain Commission wwwgrainscanadagcca 27
Canadian Grain Exports Crop year 2006 - 2007
11 Exports of wheat (including durum) and wheat flour by month and clearance sector
Month Pacific Churchill Thunder
Bay Eastern Atlantic Prairie Total
Wheat Wheat Flour
Total Wheat and
Wheat Flour
August2006
September
October
November
December
January2007
February
March
April
May
June
July
8511
5704
8040
7955
8203
5937
6592
8165
8179
9907
8970
7526
314
1272
1816
440
-
-
-
-
-
-
-
275
(000rsquos tonnes)
181 5684
92 8316
391 6986
193 6744
271 6074
- 2956
- 3048
- 2458
221 5378
588 4839
179 6073
575 4294
-
-
-
-
-
76
-
64
-
-
-
-
1000
1213
1665
1599
1590
1900
1722
1843
2376
2010
1999
2152
1 5690
1 6597
1 8898
1 6931
1 6137
1 0869
1 1362
1 2530
1 6154
1 7343
1 7221
1 4821
254
243
278
291
280
291
226
226
234
250
284
234
1 5944
1 6839
1 9176
1 7222
1 6417
1 1160
1 1588
1 2756
1 6388
1 7594
1 7505
1 5055
Grand total exported 9 3687 4117 2691 6 2851 140 2 1067 18 4554 3090 18 7644
Canadian Grain Commission wwwgrainscanadagcca 28
Canadian Grain Exports Crop year 2006 - 2007
12 Exports of special crops and processed productssup1
Country Beans Buckwheat Canary Seed Chick Peas Lentils Mustard Seed
Western Europe Austria Belgium Denmark Finland France Germany Greece Iceland Ireland Italy Malta Netherlands Norway Portugal Spain Sweden Switzerland United Kingdom
41 1 047
22 -
4 006 2 912 7 651
-1 911
22 539 114
13 999 -
7 978 6 130
206 825
67 966
36 ----
77 ------
155 ----
16
(tonnes)
30 489 5 - 4 751 - -- -
46 1 903 1 141 286
839 471 - -
23 -3 262 7 833
844 -731 895
- -4 615 6 126
13 699 5 629 90 267
- 658 45 4 713
71 9 331
-22
9 301 12 641 11 032
147 22
23 135 -
4 250 -
3 663 30 301
424 671
6 462
25 852 --
492 2 345
15 812 295
--
167 -
5 980 --
79 20
145 1 593
Total Eastern Europe Albania Armenia Azerbaijan Belarus Bosnia-Herzegovina Bulgaria Byelorussia SSR Croatia Czech Republic Estonia Georgia Hungary Latvia Lithuania Macedonia Moldova Montenegro Poland Romania Russia Serbia Slovakia Slovania Ukraine Yugoslavia
137 347
61 --
23 1 624
90 23
2 546 1 584
-98
1 186 -
40 --
468 206
-237
-705 822
-20
284
-------------------------
55 824 33 535
- -- 22 - -- -- 23
21 -- -- 80 - 65 - -- 23 - -- -- -- -- -- -- 25 - -
20 -- -- -- -- 19 - -
111 473
-889
50 --
2 407 -
127 4 413
-956
1 226 --
317 --
519 -
68 23
809 ---
52 780
-------
80 42
--------
571 80 43
-----
Total 9 733 - 41 257 11 804 816
sup1 Source Statistics Canada
Canadian Grain Commission wwwgrainscanadagcca 29
Canadian Grain Exports Crop year 2006 - 2007
12 Exports of special crops and processed productssup1
Processed Productssup3
Country Peas Soybeanssup2 Sunflower Canola Oil Canola Meal (tonnes)
Western Europe Austria 2 3 - - -Belgium 55 353 182 203 45 731 -Denmark 21 601 30 210 - - -Finland - - - - -France 1 057 32 812 24 8 -Germany 878 920 49 63 577 -Greece 220 - - - -Iceland - - - - -Ireland 68 1 749 - - -Italy 7 587 874 23 - -Malta 69 - - - -Netherlands 11 949 316 202 - 85 930 -Norway 8 181 26 840 84 - -Portugal 1 263 65 503 80 67 -Spain 169 357 8 693 68 49 -Sweden - - 141 - -Switzerland 20 - - 20 -United Kingdom 4 881 - - - -Total 282 486 666 009 514 150 382 -
Eastern Europe Albania - - - - -Armenia 68 - - - -Azerbaijan - - - - -Belarus - - - - -Bosnia-Herzegovina - - - - -Bulgaria - - - - -Byelorussia SSR - - - - -Croatia 15 - 21 - -Czech Republic 91 325 - 79 -Estonia 1 268 - - - -Georgia 355 - - - -Hungary 904 20 - - -Latvia - - 68 - -Lithuania - 40 - - -Macedonia - - - - -Moldova - - - 70 -Montenegro - - - - -Poland 216 810 - - -Romania - 678 22 - -Russia 3 999 1 199 - - -Serbia - - - - -Slovakia - 103 - - -Slovania - - 1 - -Ukraine - 157 - - -Yugoslavia - - - - -Total 6 916 3 332 112 149 -sup1 Source Statistics Canada sup2 September-August crop year sup3 Refers to weight of processed product Conversion rates to grain equivalents Barley malt ndash 1339 Canola oil ndash 2387 Canola meal ndash 1607 Exports of barley malt were 621 thousand tonnes (558 thousand in 2005-2006) Country of destination not available due to confidentiality
Canadian Grain Commission wwwgrainscanadagcca 30
Canadian Grain Exports Crop year 2006 - 2007
12 Exports of special crops and processed productssup1
Country Beans Buckwheat Canary Seed Chick Peas Lentils Mustard Seed
Africa Algeria Angola Benin British Indian Ocean Terr Burundi Cameroon Cape Verde Central African Republic Chad Comoros Congo Cocircte-drsquoIvoire Djibouti Egypt Ethiopia Gambia Ghana Guinea Kenya Liberia Madagascar Malawi Mauritania Mauritius Morocco Mozambique Namibia Niger Rwanda Senegal Sierra Leone South Africa St Helena Swaziland Tanzania Togo Tunisia Uganda Zaire Zambia Zimbabwe
672 16 658
-18
-505 50
---
645 88
-2 814
----------
516 -
75 ----
867 ------
521 --
-----------------------------------------
(tonnes)
1 609 4 410 - -- -- -- -- -- -- -- -- -- -- 5 - -
1 021 2 373 - -- -- -- -- -- -- -- -- -1 20
660 -- -- -- -- -- -- -
479 163 - -- -- -- -- 720 - -- -- -- -
69 735 268
-14
--------
200 29 206
----
175 60
--
100 1 264
28 577 ----
850 -
3 350 ----
528 ----
-----------------------
68 326
----
1 466 -
267 ---------
Total 23 409 - 3 770 7 691 134 327 2 127
sup1 Source Statistics Canada
Canadian Grain Commission wwwgrainscanadagcca 31
Canadian Grain Exports Crop year 2006 - 2007
12 Exports of special crops and processed productssup1
Processed Productssup3
Country Peas Soybeanssup2 Sunflower Canola Oil Canola Meal (tonnes)
Africa Algeria 6 484 - 1 210 - -Angola - - - - -Benin 475 - - - -British Indian Ocean Terr 16 - - - -Burundi 1 783 - - - -Cameroon - 204 - - -Cape Verde 125 - - - -Central African Republic 200 - - - -Chad 500 - - - -Comoros - - - 80 -Congo 8 - - - -Cocircte-drsquoIvoire 800 - - - -Djibouti - - - - -Egypt 5 984 42 723 526 - -Ethiopia 3 150 - - - -Gambia 291 - - - -Ghana 100 - - - -Guinea 350 - - - -Kenya 12 025 - - - -Liberia 1 050 - - - -Madagascar 836 - - - -Malawi 50 255 - - -Mauritania 620 - - - -Mauritius 591 187 18 - -Morocco 3 648 137 - - -Mozambique 450 - - - -Namibia - - - - -Niger 175 - - - -Rwanda 625 - - - -Senegal 297 - - - -Sierra Leone 1 125 - - - -South Africa 12 709 68 - - -St Helena - 41 - - -Swaziland 70 156 - - -Tanzania 4 350 - - - -Togo 25 - - - -Tunisia - - - - -Uganda 2 625 - - - -Zaire 4 225 - - - -Zambia 400 - - - -Zimbabwe 450 - - - -
Total 66 612 43 771 1 754 80 -sup1 Source Statistics Canada sup2 September-August crop year sup3 Refers to weight of processed product Conversion rates to grain equivalents Barley malt ndash 1339 Canola oil ndash 2387 Canola meal ndash 1607 Exports of barley malt were 621 thousand tonnes (558 thousand in 2005-2006) Country of destination not available due to confidentiality
Canadian Grain Commission wwwgrainscanadagcca 32
Canadian Grain Exports Crop year 2006 - 2007
12 Exports of special crops and processed productssup1
Country Beans Buckwheat Canary Seed Chick Peas Lentils Mustard Seed
Asia Afghanistan Bahrain Bangladesh Bhutan Brunei Darussalam Cambodia China PR Cyprus East Timor Hong Kong India Indonesia Iran Israel Japan Jordan Korea North Korea South Kuwait Lebanon Macau Malaysia Mongolia Nepal Oman Pakistan Philippines Qatar Saudi Arabia Singapore Somalia Sri Lanka Sudan Syrian Arab Rep Taiwan Thailand Turkey United Arab Emirates Vietnam Yemen
-------
11 599 16 69 23
-1 401
21 977 -
1 860 4 485
59 467
-256
---
40 269 50
2 415 40
----
4 348 -
175 568
--
--------------
2 031 -------3 -----------------
(tonnes)
- -- -- 1 305 - -- -
22 -128 -176 91
- -5 9
22 12 903 1 434 44
- -345 2 056
1 339 336 86 15 467
- -111 -
43 270 279 3 569
- -- -- -- -- -- 17 108
334 23 - 49
83 6 183 - -- -- -- -- -
830 -22 -
235 -151 3 607
- -- -
1 595
40 320 ---
967 1 054
-30
130 075 197
9 604 6 085
318 1 384
--
291 3 599
----
199 61 096
-343
2 962 1 618
-19 022
500 113 22
-31 125 81 544
-99
--
3 899 ---
50 ---
4 172 --
65 6 386
--
2 699 ---
33 ----
56 ----
467 --
41 3 610
125 165
--
Total 39 128 2 034 5 645 63 020 393 163 21 768
sup1 Source Statistics Canada
Canadian Grain Commission wwwgrainscanadagcca 33
Canadian Grain Exports Crop year 2006 - 2007
12 Exports of special crops and processed productssup1
Processed Productssup3
Country Peas Soybeanssup2 Sunflower Canola Oil Canola Meal (tonnes)
Asia Afghanistan - - - - -Bahrain 973 - 96 43 -Bangladesh 110 049 - - - -Bhutan 86 - - - -Brunei Darussalam - 142 - - -Cambodia 249 - - - -China PR 251 442 2 400 - 263 814 407 Cyprus - - - - -East Timor - - - - -Hong Kong 2 30 126 7 25 289 -India 895 514 - 146 31 -Indonesia 12 907 522 - 8 -Iran 5 602 244 428 - - -Israel 4 494 25 152 63 12 -Japan 10 924 276 542 124 19 631 315 Jordan 812 80 136 - -Korea North 64 - 74 - -Korea South 563 60 - 35 567 -Kuwait 413 - 476 761 -Lebanon 528 - 262 70 -Macau - 20 - - -Malaysia 2 880 136 409 23 26 096 -Mongolia - - - - -Nepal 5 455 - - - -Oman 214 - - 14 -Pakistan 45 122 - 45 - -Philippines 13 477 12 975 47 635 10 530 Qatar 311 - 48 14 -Saudi Arabia 8 025 869 325 14 -Singapore 1 749 42 834 - 162 -Somalia 2 950 - - - -Sri Lanka 1 701 - - - -Sudan 3 450 - - - -Syrian Arab Rep - 4 303 2 429 - -Taiwan 11 590 8 168 - 26 952 7 033 Thailand 8 982 20 740 - 3 -Turkey 680 21 020 353 - -United Arab Emirates 38 481 134 12 694 531 -Vietnam 45 241 - 217 -Yemen 6 232 43 - - -
Total 1 445 966 827 208 17 348 399 864 18 285
sup1 Source Statistics Canada sup2 September-August crop year sup3 Refers to weight of processed product Conversion rates to grain equivalents Barley malt ndash 1339 Canola oil ndash 2387 Canola meal ndash 1607 Exports of barley malt were 621 thousand tonnes (558 thousand in 2005-2006) Country of destination not available due to confidentiality
Canadian Grain Commission wwwgrainscanadagcca 34
Canadian Grain Exports Crop year 2006 - 2007
12 Exports of special crops and processed productssup1
Country Beans Buckwheat Canary Seed Chick Peas Lentils Mustard Seed (tonnes)
Oceania Australia 3 807 - 211 - 1 366 1 062 Cocos Islands - - - - - -Fiji - - - - - -New Zealand 1 814 - 391 22 228 3 US Outlying Islands - - - 45 - -
Total 5 621 - 602 67 1 594 1 065
Processed Productssup3
Country Peas Soybeanssup2 Sunflower Canola Oil Canola Meal (tonnes)
Oceania Australia 1 094 42 179 3 -Cocos Islands 119 - - - -Fiji 90 - - 30 -New Zealand 158 571 - 208 -US Outlying Islands - - - - -
Total 1 461 613 179 241 -
sup1 Source Statistics Canada sup2 September-August crop year sup3 Refers to weight of processed product Conversion rates to grain equivalents Barley malt ndash 1339 Canola oil ndash 2387 Canola meal ndash 1607 Exports of barley malt were 621 thousand tonnes (558 thousand in 2005-2006) Country of destination not available due to confidentiality
Canadian Grain Commission wwwgrainscanadagcca 35
Canadian Grain Exports Crop year 2006 - 2007
12 Exports of special crops and processed productssup1
Country Beans Buckwheat Canary Seed Chick Peas Lentils Mustard Seed
Western Hemisphere Antigua-Barbuda Argentina Aruba Barbados Belize Bermuda Bolivia Brazil British Virgin Islands Chile Colombia Costa Rica Cuba Dominica Dominican Republic Ecuador El Salvador Grenada Guatemala Guyana Haiti Honduras Jamaica Mexico Netherlands Antilles Nicaragua Panama Paraguay Peru St Kitts-Nevis St Vincent Gren Ste Lucie Surinam Trinidad-Tobago United States Uruguay Venezuela
7 -4 3
137 ----
256 45
643 510 60
12 714 43 67 29
1 514 1
6 202 -
1 736 4 189
3 -
426 --5 3
18 15
489 102 440
-2 375
---------------------------------1
1 537 --
(tonnes)
- -- 5 - -8 6 - -- -- -
21 558 106 - -
4 871 140 11 276 3 550
581 127 390 106
- -746 149
1 235 203 371 -
- -1 746 33
- 181 - -
22 -- -
42 583 -- -- -
75 14 - -
7 012 163 - -- -- -
32 27 172 659
13 062 5 112 116 -
6 186 45
5 1 822
1 68
--
1 323 10 965
-16 866 54 177
686 -
110 176
18 440 -
79 74
---
23 31 513
--
8 765 58
20 825 5
16 45
-1 325 6 361 2 451
23 015
-103
--1 --
569 -
285 74 16
---
203 200
-150
----
20 ----
296 ----
34 71 359
40 1 025
Total
Grand total exported
133 934
349 172
1 538
3 856
112 042 10 626
177 924 115 196
199 194
851 555
74 375
152 931
sup1 Source Statistics Canada
Canadian Grain Commission wwwgrainscanadagcca 36
Canadian Grain Exports Crop year 2006 - 2007
12 Exports of special crops and processed productssup1
Processed Productssup3
Country Peas Soybeanssup2 Sunflower Canola Oil Canola Meal (tonnes)
Western Hemisphere Antigua-Barbuda 9 - - - -Argentina - - - - -Aruba 3 - - - -Barbados 215 1 14 2 -Belize 71 - - - -Bermuda - - - 219 -Bolivia - - - - -Brazil 10 049 - - - -British Virgin Islands - 4 - - -Chile 5 053 - 84 22 -Colombia 34 159 - 312 3 342 -Costa Rica 604 - 421 24 -Cuba 26 968 39 2 - -Dominica 21 - - 1 -Dominican Republic 398 23 161 - -Ecuador 3 106 - - - -El Salvador - - 69 - -Grenada 150 - - - -Guatemala 45 - 539 9 -Guyana 2 947 - - - -Haiti - - - - -Honduras - - 165 - -Jamaica - 625 - - -Mexico 9 331 69 2 289 31 661 5 798 Netherlands Antilles - - - - -Nicaragua 875 - - - -Panama 1 327 186 229 - -Paraguay 8 - - - -Peru 13 338 - - 33 -St Kitts-Nevis 5 - - - -St Vincent Gren - 1 - - -Ste Lucie 20 1 - - -Surinam 802 125 22 8 -Trinidad-Tobago 5 448 215 89 82 -United States 34 482 198 369 96 576 719 403 1 458 082 Uruguay 15 - - - -Venezuela 16 259 - 108 - -
Total 165 708 199 658 101 080 754 806 1 463 880
Grand total exported 1 969 149 1 740 591 120 987 1 305 522 1 482 165
sup1 Source Statistics Canada sup2 September-August crop year sup3 Refers to weight of processed product Conversion rates to grain equivalents Barley malt ndash 1339 Canola oil ndash 2387 Canola meal ndash 1607 Exports of barley malt were 621 thousand tonnes (558 thousand in 2005-2006) Country of destination not available due to confidentiality
Canadian Grain Commission wwwgrainscanadagcca 37
Canadian Grain Exports Crop year 2006 - 2007
13 Ocean freight rates
From
To Japan
North Pacificsup1
Korea South China PR
St Lawrencesup1
Iran
August 2006
September
October
November
December
January 2007
February
March
April
May
June
July
3220
3650
3780
4100
4100
3960
3675
3975
4100
4520
4150
5200
($ US per short tonne)
3120 na
3550 na
3900 na
4300 na
4200 na
4080 na
3825 na
4075 na
4200 na
4620 na
4250 na
5300 na
4640
4800
4900
4825
5000
5120
4950
5225
5375
5940
6000
6700
Average 4036 4118 na 5290
sup1 Rates are calculated for heavy grains on largest sized vessel (type B-vessel size = over 35 000 tonnes) in most general use appropriate to specified route ready to load in three to four weeks time
Source International Grain Council
Canadian Grain Commission wwwgrainscanadagcca 38
Canadian Grain Exports Crop year 2006 - 2007
14 Estimated costs of moving wheat from a mid-prairie point to export position
Crop Year 200102 200203 200304 200405 200506 200607p
Primary Elevator Costs Elevation (1) Removal of dockage Shrinkage Carrying charges (2)
Railway Freight Via Thunder Bay Via Vancouver
Marketing (3)
Terminal Elevator Costs Storage (4) Fobbing charges - via St Lawrence ports (5) - via Pacific seaboard (5)
Lake Transportation (6)
Transfer Elevator Costs Storage Fobbing charges (7)
1118 368 022 245
3443 3378
-225
094
823 842
1917
192 230
1163 383 025 353
3343 3377
-008
167
873 890
1893
347 231
$tonne
1190 1190 440 440
- -196 186
3326 3402 3445 3471
277 083
102 148
903 926 920 936
1892 1928
173 362 232 232
1220 450
-230
3436 3506
315
130
954 982
1991
341 231
1251 462
-209
3805 3809
494
128
978 1006
2185
345 232
Total - via St Lawrence ports - via Pacific seaboard
8227 5842
8770 6350
8731 8897 6570 6454
9298 6833
10089 7359
P - Preliminary
Mid-Prairie point being Brass Saskatchewan
(1) Filed tariff for receiving elevating and loading
(2) Carrying charges on wheat stored in country elevators
(3) Includes interest bank and other charges and Canadian Wheat Board administrative costs interest and depreciation on CWB hopper cars drying additional freight and demurragedespatch
(4) Storage charges on wheat stored in terminal elevators
(5) Thunder Bay and Pacific fobbing charge which includes elevation outward weighing and inspection terminal elevator receipt cancellation lake shippersrsquo charges superintendence and forwarding brokerage charges
(6) Includes elevation outward weighing and inspection terminal elevator receipt cancellation BC Shippersrsquo charges superintendence wharfage and forwarding brokerage charges
(7) Includes lake freight lake brokerage cargo rates insurance St Lawrence Seaway and Welland Canal tolls and inward elevation into transfer elevator
Canadian Grain Commission wwwgrainscanadagcca 39

Canadian Grain Exports Crop year 2006 - 2007
12 Exports of special crops and processed productssup1
Country Beans Buckwheat Canary Seed Chick Peas Lentils Mustard Seed
Western Europe Austria Belgium Denmark Finland France Germany Greece Iceland Ireland Italy Malta Netherlands Norway Portugal Spain Sweden Switzerland United Kingdom
41 1 047
22 -
4 006 2 912 7 651
-1 911
22 539 114
13 999 -
7 978 6 130
206 825
67 966
36 ----
77 ------
155 ----
16
(tonnes)
30 489 5 - 4 751 - -- -
46 1 903 1 141 286
839 471 - -
23 -3 262 7 833
844 -731 895
- -4 615 6 126
13 699 5 629 90 267
- 658 45 4 713
71 9 331
-22
9 301 12 641 11 032
147 22
23 135 -
4 250 -
3 663 30 301
424 671
6 462
25 852 --
492 2 345
15 812 295
--
167 -
5 980 --
79 20
145 1 593
Total Eastern Europe Albania Armenia Azerbaijan Belarus Bosnia-Herzegovina Bulgaria Byelorussia SSR Croatia Czech Republic Estonia Georgia Hungary Latvia Lithuania Macedonia Moldova Montenegro Poland Romania Russia Serbia Slovakia Slovania Ukraine Yugoslavia
137 347
61 --
23 1 624
90 23
2 546 1 584
-98
1 186 -
40 --
468 206
-237
-705 822
-20
284
-------------------------
55 824 33 535
- -- 22 - -- -- 23
21 -- -- 80 - 65 - -- 23 - -- -- -- -- -- -- 25 - -
20 -- -- -- -- 19 - -
111 473
-889
50 --
2 407 -
127 4 413
-956
1 226 --
317 --
519 -
68 23
809 ---
52 780
-------
80 42
--------
571 80 43
-----
Total 9 733 - 41 257 11 804 816
sup1 Source Statistics Canada
Canadian Grain Commission wwwgrainscanadagcca 29
Canadian Grain Exports Crop year 2006 - 2007
12 Exports of special crops and processed productssup1
Processed Productssup3
Country Peas Soybeanssup2 Sunflower Canola Oil Canola Meal (tonnes)
Western Europe Austria 2 3 - - -Belgium 55 353 182 203 45 731 -Denmark 21 601 30 210 - - -Finland - - - - -France 1 057 32 812 24 8 -Germany 878 920 49 63 577 -Greece 220 - - - -Iceland - - - - -Ireland 68 1 749 - - -Italy 7 587 874 23 - -Malta 69 - - - -Netherlands 11 949 316 202 - 85 930 -Norway 8 181 26 840 84 - -Portugal 1 263 65 503 80 67 -Spain 169 357 8 693 68 49 -Sweden - - 141 - -Switzerland 20 - - 20 -United Kingdom 4 881 - - - -Total 282 486 666 009 514 150 382 -
Eastern Europe Albania - - - - -Armenia 68 - - - -Azerbaijan - - - - -Belarus - - - - -Bosnia-Herzegovina - - - - -Bulgaria - - - - -Byelorussia SSR - - - - -Croatia 15 - 21 - -Czech Republic 91 325 - 79 -Estonia 1 268 - - - -Georgia 355 - - - -Hungary 904 20 - - -Latvia - - 68 - -Lithuania - 40 - - -Macedonia - - - - -Moldova - - - 70 -Montenegro - - - - -Poland 216 810 - - -Romania - 678 22 - -Russia 3 999 1 199 - - -Serbia - - - - -Slovakia - 103 - - -Slovania - - 1 - -Ukraine - 157 - - -Yugoslavia - - - - -Total 6 916 3 332 112 149 -sup1 Source Statistics Canada sup2 September-August crop year sup3 Refers to weight of processed product Conversion rates to grain equivalents Barley malt ndash 1339 Canola oil ndash 2387 Canola meal ndash 1607 Exports of barley malt were 621 thousand tonnes (558 thousand in 2005-2006) Country of destination not available due to confidentiality
Canadian Grain Commission wwwgrainscanadagcca 30
Canadian Grain Exports Crop year 2006 - 2007
12 Exports of special crops and processed productssup1
Country Beans Buckwheat Canary Seed Chick Peas Lentils Mustard Seed
Africa Algeria Angola Benin British Indian Ocean Terr Burundi Cameroon Cape Verde Central African Republic Chad Comoros Congo Cocircte-drsquoIvoire Djibouti Egypt Ethiopia Gambia Ghana Guinea Kenya Liberia Madagascar Malawi Mauritania Mauritius Morocco Mozambique Namibia Niger Rwanda Senegal Sierra Leone South Africa St Helena Swaziland Tanzania Togo Tunisia Uganda Zaire Zambia Zimbabwe
672 16 658
-18
-505 50
---
645 88
-2 814
----------
516 -
75 ----
867 ------
521 --
-----------------------------------------
(tonnes)
1 609 4 410 - -- -- -- -- -- -- -- -- -- -- 5 - -
1 021 2 373 - -- -- -- -- -- -- -- -- -1 20
660 -- -- -- -- -- -- -
479 163 - -- -- -- -- 720 - -- -- -- -
69 735 268
-14
--------
200 29 206
----
175 60
--
100 1 264
28 577 ----
850 -
3 350 ----
528 ----
-----------------------
68 326
----
1 466 -
267 ---------
Total 23 409 - 3 770 7 691 134 327 2 127
sup1 Source Statistics Canada
Canadian Grain Commission wwwgrainscanadagcca 31
Canadian Grain Exports Crop year 2006 - 2007
12 Exports of special crops and processed productssup1
Processed Productssup3
Country Peas Soybeanssup2 Sunflower Canola Oil Canola Meal (tonnes)
Africa Algeria 6 484 - 1 210 - -Angola - - - - -Benin 475 - - - -British Indian Ocean Terr 16 - - - -Burundi 1 783 - - - -Cameroon - 204 - - -Cape Verde 125 - - - -Central African Republic 200 - - - -Chad 500 - - - -Comoros - - - 80 -Congo 8 - - - -Cocircte-drsquoIvoire 800 - - - -Djibouti - - - - -Egypt 5 984 42 723 526 - -Ethiopia 3 150 - - - -Gambia 291 - - - -Ghana 100 - - - -Guinea 350 - - - -Kenya 12 025 - - - -Liberia 1 050 - - - -Madagascar 836 - - - -Malawi 50 255 - - -Mauritania 620 - - - -Mauritius 591 187 18 - -Morocco 3 648 137 - - -Mozambique 450 - - - -Namibia - - - - -Niger 175 - - - -Rwanda 625 - - - -Senegal 297 - - - -Sierra Leone 1 125 - - - -South Africa 12 709 68 - - -St Helena - 41 - - -Swaziland 70 156 - - -Tanzania 4 350 - - - -Togo 25 - - - -Tunisia - - - - -Uganda 2 625 - - - -Zaire 4 225 - - - -Zambia 400 - - - -Zimbabwe 450 - - - -
Total 66 612 43 771 1 754 80 -sup1 Source Statistics Canada sup2 September-August crop year sup3 Refers to weight of processed product Conversion rates to grain equivalents Barley malt ndash 1339 Canola oil ndash 2387 Canola meal ndash 1607 Exports of barley malt were 621 thousand tonnes (558 thousand in 2005-2006) Country of destination not available due to confidentiality
Canadian Grain Commission wwwgrainscanadagcca 32
Canadian Grain Exports Crop year 2006 - 2007
12 Exports of special crops and processed productssup1
Country Beans Buckwheat Canary Seed Chick Peas Lentils Mustard Seed
Asia Afghanistan Bahrain Bangladesh Bhutan Brunei Darussalam Cambodia China PR Cyprus East Timor Hong Kong India Indonesia Iran Israel Japan Jordan Korea North Korea South Kuwait Lebanon Macau Malaysia Mongolia Nepal Oman Pakistan Philippines Qatar Saudi Arabia Singapore Somalia Sri Lanka Sudan Syrian Arab Rep Taiwan Thailand Turkey United Arab Emirates Vietnam Yemen
-------
11 599 16 69 23
-1 401
21 977 -
1 860 4 485
59 467
-256
---
40 269 50
2 415 40
----
4 348 -
175 568
--
--------------
2 031 -------3 -----------------
(tonnes)
- -- -- 1 305 - -- -
22 -128 -176 91
- -5 9
22 12 903 1 434 44
- -345 2 056
1 339 336 86 15 467
- -111 -
43 270 279 3 569
- -- -- -- -- -- 17 108
334 23 - 49
83 6 183 - -- -- -- -- -
830 -22 -
235 -151 3 607
- -- -
1 595
40 320 ---
967 1 054
-30
130 075 197
9 604 6 085
318 1 384
--
291 3 599
----
199 61 096
-343
2 962 1 618
-19 022
500 113 22
-31 125 81 544
-99
--
3 899 ---
50 ---
4 172 --
65 6 386
--
2 699 ---
33 ----
56 ----
467 --
41 3 610
125 165
--
Total 39 128 2 034 5 645 63 020 393 163 21 768
sup1 Source Statistics Canada
Canadian Grain Commission wwwgrainscanadagcca 33
Canadian Grain Exports Crop year 2006 - 2007
12 Exports of special crops and processed productssup1
Processed Productssup3
Country Peas Soybeanssup2 Sunflower Canola Oil Canola Meal (tonnes)
Asia Afghanistan - - - - -Bahrain 973 - 96 43 -Bangladesh 110 049 - - - -Bhutan 86 - - - -Brunei Darussalam - 142 - - -Cambodia 249 - - - -China PR 251 442 2 400 - 263 814 407 Cyprus - - - - -East Timor - - - - -Hong Kong 2 30 126 7 25 289 -India 895 514 - 146 31 -Indonesia 12 907 522 - 8 -Iran 5 602 244 428 - - -Israel 4 494 25 152 63 12 -Japan 10 924 276 542 124 19 631 315 Jordan 812 80 136 - -Korea North 64 - 74 - -Korea South 563 60 - 35 567 -Kuwait 413 - 476 761 -Lebanon 528 - 262 70 -Macau - 20 - - -Malaysia 2 880 136 409 23 26 096 -Mongolia - - - - -Nepal 5 455 - - - -Oman 214 - - 14 -Pakistan 45 122 - 45 - -Philippines 13 477 12 975 47 635 10 530 Qatar 311 - 48 14 -Saudi Arabia 8 025 869 325 14 -Singapore 1 749 42 834 - 162 -Somalia 2 950 - - - -Sri Lanka 1 701 - - - -Sudan 3 450 - - - -Syrian Arab Rep - 4 303 2 429 - -Taiwan 11 590 8 168 - 26 952 7 033 Thailand 8 982 20 740 - 3 -Turkey 680 21 020 353 - -United Arab Emirates 38 481 134 12 694 531 -Vietnam 45 241 - 217 -Yemen 6 232 43 - - -
Total 1 445 966 827 208 17 348 399 864 18 285
sup1 Source Statistics Canada sup2 September-August crop year sup3 Refers to weight of processed product Conversion rates to grain equivalents Barley malt ndash 1339 Canola oil ndash 2387 Canola meal ndash 1607 Exports of barley malt were 621 thousand tonnes (558 thousand in 2005-2006) Country of destination not available due to confidentiality
Canadian Grain Commission wwwgrainscanadagcca 34
Canadian Grain Exports Crop year 2006 - 2007
12 Exports of special crops and processed productssup1
Country Beans Buckwheat Canary Seed Chick Peas Lentils Mustard Seed (tonnes)
Oceania Australia 3 807 - 211 - 1 366 1 062 Cocos Islands - - - - - -Fiji - - - - - -New Zealand 1 814 - 391 22 228 3 US Outlying Islands - - - 45 - -
Total 5 621 - 602 67 1 594 1 065
Processed Productssup3
Country Peas Soybeanssup2 Sunflower Canola Oil Canola Meal (tonnes)
Oceania Australia 1 094 42 179 3 -Cocos Islands 119 - - - -Fiji 90 - - 30 -New Zealand 158 571 - 208 -US Outlying Islands - - - - -
Total 1 461 613 179 241 -
sup1 Source Statistics Canada sup2 September-August crop year sup3 Refers to weight of processed product Conversion rates to grain equivalents Barley malt ndash 1339 Canola oil ndash 2387 Canola meal ndash 1607 Exports of barley malt were 621 thousand tonnes (558 thousand in 2005-2006) Country of destination not available due to confidentiality
Canadian Grain Commission wwwgrainscanadagcca 35
Canadian Grain Exports Crop year 2006 - 2007
12 Exports of special crops and processed productssup1
Country Beans Buckwheat Canary Seed Chick Peas Lentils Mustard Seed
Western Hemisphere Antigua-Barbuda Argentina Aruba Barbados Belize Bermuda Bolivia Brazil British Virgin Islands Chile Colombia Costa Rica Cuba Dominica Dominican Republic Ecuador El Salvador Grenada Guatemala Guyana Haiti Honduras Jamaica Mexico Netherlands Antilles Nicaragua Panama Paraguay Peru St Kitts-Nevis St Vincent Gren Ste Lucie Surinam Trinidad-Tobago United States Uruguay Venezuela
7 -4 3
137 ----
256 45
643 510 60
12 714 43 67 29
1 514 1
6 202 -
1 736 4 189
3 -
426 --5 3
18 15
489 102 440
-2 375
---------------------------------1
1 537 --
(tonnes)
- -- 5 - -8 6 - -- -- -
21 558 106 - -
4 871 140 11 276 3 550
581 127 390 106
- -746 149
1 235 203 371 -
- -1 746 33
- 181 - -
22 -- -
42 583 -- -- -
75 14 - -
7 012 163 - -- -- -
32 27 172 659
13 062 5 112 116 -
6 186 45
5 1 822
1 68
--
1 323 10 965
-16 866 54 177
686 -
110 176
18 440 -
79 74
---
23 31 513
--
8 765 58
20 825 5
16 45
-1 325 6 361 2 451
23 015
-103
--1 --
569 -
285 74 16
---
203 200
-150
----
20 ----
296 ----
34 71 359
40 1 025
Total
Grand total exported
133 934
349 172
1 538
3 856
112 042 10 626
177 924 115 196
199 194
851 555
74 375
152 931
sup1 Source Statistics Canada
Canadian Grain Commission wwwgrainscanadagcca 36
Canadian Grain Exports Crop year 2006 - 2007
12 Exports of special crops and processed productssup1
Processed Productssup3
Country Peas Soybeanssup2 Sunflower Canola Oil Canola Meal (tonnes)
Western Hemisphere Antigua-Barbuda 9 - - - -Argentina - - - - -Aruba 3 - - - -Barbados 215 1 14 2 -Belize 71 - - - -Bermuda - - - 219 -Bolivia - - - - -Brazil 10 049 - - - -British Virgin Islands - 4 - - -Chile 5 053 - 84 22 -Colombia 34 159 - 312 3 342 -Costa Rica 604 - 421 24 -Cuba 26 968 39 2 - -Dominica 21 - - 1 -Dominican Republic 398 23 161 - -Ecuador 3 106 - - - -El Salvador - - 69 - -Grenada 150 - - - -Guatemala 45 - 539 9 -Guyana 2 947 - - - -Haiti - - - - -Honduras - - 165 - -Jamaica - 625 - - -Mexico 9 331 69 2 289 31 661 5 798 Netherlands Antilles - - - - -Nicaragua 875 - - - -Panama 1 327 186 229 - -Paraguay 8 - - - -Peru 13 338 - - 33 -St Kitts-Nevis 5 - - - -St Vincent Gren - 1 - - -Ste Lucie 20 1 - - -Surinam 802 125 22 8 -Trinidad-Tobago 5 448 215 89 82 -United States 34 482 198 369 96 576 719 403 1 458 082 Uruguay 15 - - - -Venezuela 16 259 - 108 - -
Total 165 708 199 658 101 080 754 806 1 463 880
Grand total exported 1 969 149 1 740 591 120 987 1 305 522 1 482 165
sup1 Source Statistics Canada sup2 September-August crop year sup3 Refers to weight of processed product Conversion rates to grain equivalents Barley malt ndash 1339 Canola oil ndash 2387 Canola meal ndash 1607 Exports of barley malt were 621 thousand tonnes (558 thousand in 2005-2006) Country of destination not available due to confidentiality
Canadian Grain Commission wwwgrainscanadagcca 37
Canadian Grain Exports Crop year 2006 - 2007
13 Ocean freight rates
From
To Japan
North Pacificsup1
Korea South China PR
St Lawrencesup1
Iran
August 2006
September
October
November
December
January 2007
February
March
April
May
June
July
3220
3650
3780
4100
4100
3960
3675
3975
4100
4520
4150
5200
($ US per short tonne)
3120 na
3550 na
3900 na
4300 na
4200 na
4080 na
3825 na
4075 na
4200 na
4620 na
4250 na
5300 na
4640
4800
4900
4825
5000
5120
4950
5225
5375
5940
6000
6700
Average 4036 4118 na 5290
sup1 Rates are calculated for heavy grains on largest sized vessel (type B-vessel size = over 35 000 tonnes) in most general use appropriate to specified route ready to load in three to four weeks time
Source International Grain Council
Canadian Grain Commission wwwgrainscanadagcca 38
Canadian Grain Exports Crop year 2006 - 2007
14 Estimated costs of moving wheat from a mid-prairie point to export position
Crop Year 200102 200203 200304 200405 200506 200607p
Primary Elevator Costs Elevation (1) Removal of dockage Shrinkage Carrying charges (2)
Railway Freight Via Thunder Bay Via Vancouver
Marketing (3)
Terminal Elevator Costs Storage (4) Fobbing charges - via St Lawrence ports (5) - via Pacific seaboard (5)
Lake Transportation (6)
Transfer Elevator Costs Storage Fobbing charges (7)
1118 368 022 245
3443 3378
-225
094
823 842
1917
192 230
1163 383 025 353
3343 3377
-008
167
873 890
1893
347 231
$tonne
1190 1190 440 440
- -196 186
3326 3402 3445 3471
277 083
102 148
903 926 920 936
1892 1928
173 362 232 232
1220 450
-230
3436 3506
315
130
954 982
1991
341 231
1251 462
-209
3805 3809
494
128
978 1006
2185
345 232
Total - via St Lawrence ports - via Pacific seaboard
8227 5842
8770 6350
8731 8897 6570 6454
9298 6833
10089 7359
P - Preliminary
Mid-Prairie point being Brass Saskatchewan
(1) Filed tariff for receiving elevating and loading
(2) Carrying charges on wheat stored in country elevators
(3) Includes interest bank and other charges and Canadian Wheat Board administrative costs interest and depreciation on CWB hopper cars drying additional freight and demurragedespatch
(4) Storage charges on wheat stored in terminal elevators
(5) Thunder Bay and Pacific fobbing charge which includes elevation outward weighing and inspection terminal elevator receipt cancellation lake shippersrsquo charges superintendence and forwarding brokerage charges
(6) Includes elevation outward weighing and inspection terminal elevator receipt cancellation BC Shippersrsquo charges superintendence wharfage and forwarding brokerage charges
(7) Includes lake freight lake brokerage cargo rates insurance St Lawrence Seaway and Welland Canal tolls and inward elevation into transfer elevator
Canadian Grain Commission wwwgrainscanadagcca 39

Canadian Grain Exports Crop year 2006 - 2007
12 Exports of special crops and processed productssup1
Processed Productssup3
Country Peas Soybeanssup2 Sunflower Canola Oil Canola Meal (tonnes)
Western Europe Austria 2 3 - - -Belgium 55 353 182 203 45 731 -Denmark 21 601 30 210 - - -Finland - - - - -France 1 057 32 812 24 8 -Germany 878 920 49 63 577 -Greece 220 - - - -Iceland - - - - -Ireland 68 1 749 - - -Italy 7 587 874 23 - -Malta 69 - - - -Netherlands 11 949 316 202 - 85 930 -Norway 8 181 26 840 84 - -Portugal 1 263 65 503 80 67 -Spain 169 357 8 693 68 49 -Sweden - - 141 - -Switzerland 20 - - 20 -United Kingdom 4 881 - - - -Total 282 486 666 009 514 150 382 -
Eastern Europe Albania - - - - -Armenia 68 - - - -Azerbaijan - - - - -Belarus - - - - -Bosnia-Herzegovina - - - - -Bulgaria - - - - -Byelorussia SSR - - - - -Croatia 15 - 21 - -Czech Republic 91 325 - 79 -Estonia 1 268 - - - -Georgia 355 - - - -Hungary 904 20 - - -Latvia - - 68 - -Lithuania - 40 - - -Macedonia - - - - -Moldova - - - 70 -Montenegro - - - - -Poland 216 810 - - -Romania - 678 22 - -Russia 3 999 1 199 - - -Serbia - - - - -Slovakia - 103 - - -Slovania - - 1 - -Ukraine - 157 - - -Yugoslavia - - - - -Total 6 916 3 332 112 149 -sup1 Source Statistics Canada sup2 September-August crop year sup3 Refers to weight of processed product Conversion rates to grain equivalents Barley malt ndash 1339 Canola oil ndash 2387 Canola meal ndash 1607 Exports of barley malt were 621 thousand tonnes (558 thousand in 2005-2006) Country of destination not available due to confidentiality
Canadian Grain Commission wwwgrainscanadagcca 30
Canadian Grain Exports Crop year 2006 - 2007
12 Exports of special crops and processed productssup1
Country Beans Buckwheat Canary Seed Chick Peas Lentils Mustard Seed
Africa Algeria Angola Benin British Indian Ocean Terr Burundi Cameroon Cape Verde Central African Republic Chad Comoros Congo Cocircte-drsquoIvoire Djibouti Egypt Ethiopia Gambia Ghana Guinea Kenya Liberia Madagascar Malawi Mauritania Mauritius Morocco Mozambique Namibia Niger Rwanda Senegal Sierra Leone South Africa St Helena Swaziland Tanzania Togo Tunisia Uganda Zaire Zambia Zimbabwe
672 16 658
-18
-505 50
---
645 88
-2 814
----------
516 -
75 ----
867 ------
521 --
-----------------------------------------
(tonnes)
1 609 4 410 - -- -- -- -- -- -- -- -- -- -- 5 - -
1 021 2 373 - -- -- -- -- -- -- -- -- -1 20
660 -- -- -- -- -- -- -
479 163 - -- -- -- -- 720 - -- -- -- -
69 735 268
-14
--------
200 29 206
----
175 60
--
100 1 264
28 577 ----
850 -
3 350 ----
528 ----
-----------------------
68 326
----
1 466 -
267 ---------
Total 23 409 - 3 770 7 691 134 327 2 127
sup1 Source Statistics Canada
Canadian Grain Commission wwwgrainscanadagcca 31
Canadian Grain Exports Crop year 2006 - 2007
12 Exports of special crops and processed productssup1
Processed Productssup3
Country Peas Soybeanssup2 Sunflower Canola Oil Canola Meal (tonnes)
Africa Algeria 6 484 - 1 210 - -Angola - - - - -Benin 475 - - - -British Indian Ocean Terr 16 - - - -Burundi 1 783 - - - -Cameroon - 204 - - -Cape Verde 125 - - - -Central African Republic 200 - - - -Chad 500 - - - -Comoros - - - 80 -Congo 8 - - - -Cocircte-drsquoIvoire 800 - - - -Djibouti - - - - -Egypt 5 984 42 723 526 - -Ethiopia 3 150 - - - -Gambia 291 - - - -Ghana 100 - - - -Guinea 350 - - - -Kenya 12 025 - - - -Liberia 1 050 - - - -Madagascar 836 - - - -Malawi 50 255 - - -Mauritania 620 - - - -Mauritius 591 187 18 - -Morocco 3 648 137 - - -Mozambique 450 - - - -Namibia - - - - -Niger 175 - - - -Rwanda 625 - - - -Senegal 297 - - - -Sierra Leone 1 125 - - - -South Africa 12 709 68 - - -St Helena - 41 - - -Swaziland 70 156 - - -Tanzania 4 350 - - - -Togo 25 - - - -Tunisia - - - - -Uganda 2 625 - - - -Zaire 4 225 - - - -Zambia 400 - - - -Zimbabwe 450 - - - -
Total 66 612 43 771 1 754 80 -sup1 Source Statistics Canada sup2 September-August crop year sup3 Refers to weight of processed product Conversion rates to grain equivalents Barley malt ndash 1339 Canola oil ndash 2387 Canola meal ndash 1607 Exports of barley malt were 621 thousand tonnes (558 thousand in 2005-2006) Country of destination not available due to confidentiality
Canadian Grain Commission wwwgrainscanadagcca 32
Canadian Grain Exports Crop year 2006 - 2007
12 Exports of special crops and processed productssup1
Country Beans Buckwheat Canary Seed Chick Peas Lentils Mustard Seed
Asia Afghanistan Bahrain Bangladesh Bhutan Brunei Darussalam Cambodia China PR Cyprus East Timor Hong Kong India Indonesia Iran Israel Japan Jordan Korea North Korea South Kuwait Lebanon Macau Malaysia Mongolia Nepal Oman Pakistan Philippines Qatar Saudi Arabia Singapore Somalia Sri Lanka Sudan Syrian Arab Rep Taiwan Thailand Turkey United Arab Emirates Vietnam Yemen
-------
11 599 16 69 23
-1 401
21 977 -
1 860 4 485
59 467
-256
---
40 269 50
2 415 40
----
4 348 -
175 568
--
--------------
2 031 -------3 -----------------
(tonnes)
- -- -- 1 305 - -- -
22 -128 -176 91
- -5 9
22 12 903 1 434 44
- -345 2 056
1 339 336 86 15 467
- -111 -
43 270 279 3 569
- -- -- -- -- -- 17 108
334 23 - 49
83 6 183 - -- -- -- -- -
830 -22 -
235 -151 3 607
- -- -
1 595
40 320 ---
967 1 054
-30
130 075 197
9 604 6 085
318 1 384
--
291 3 599
----
199 61 096
-343
2 962 1 618
-19 022
500 113 22
-31 125 81 544
-99
--
3 899 ---
50 ---
4 172 --
65 6 386
--
2 699 ---
33 ----
56 ----
467 --
41 3 610
125 165
--
Total 39 128 2 034 5 645 63 020 393 163 21 768
sup1 Source Statistics Canada
Canadian Grain Commission wwwgrainscanadagcca 33
Canadian Grain Exports Crop year 2006 - 2007
12 Exports of special crops and processed productssup1
Processed Productssup3
Country Peas Soybeanssup2 Sunflower Canola Oil Canola Meal (tonnes)
Asia Afghanistan - - - - -Bahrain 973 - 96 43 -Bangladesh 110 049 - - - -Bhutan 86 - - - -Brunei Darussalam - 142 - - -Cambodia 249 - - - -China PR 251 442 2 400 - 263 814 407 Cyprus - - - - -East Timor - - - - -Hong Kong 2 30 126 7 25 289 -India 895 514 - 146 31 -Indonesia 12 907 522 - 8 -Iran 5 602 244 428 - - -Israel 4 494 25 152 63 12 -Japan 10 924 276 542 124 19 631 315 Jordan 812 80 136 - -Korea North 64 - 74 - -Korea South 563 60 - 35 567 -Kuwait 413 - 476 761 -Lebanon 528 - 262 70 -Macau - 20 - - -Malaysia 2 880 136 409 23 26 096 -Mongolia - - - - -Nepal 5 455 - - - -Oman 214 - - 14 -Pakistan 45 122 - 45 - -Philippines 13 477 12 975 47 635 10 530 Qatar 311 - 48 14 -Saudi Arabia 8 025 869 325 14 -Singapore 1 749 42 834 - 162 -Somalia 2 950 - - - -Sri Lanka 1 701 - - - -Sudan 3 450 - - - -Syrian Arab Rep - 4 303 2 429 - -Taiwan 11 590 8 168 - 26 952 7 033 Thailand 8 982 20 740 - 3 -Turkey 680 21 020 353 - -United Arab Emirates 38 481 134 12 694 531 -Vietnam 45 241 - 217 -Yemen 6 232 43 - - -
Total 1 445 966 827 208 17 348 399 864 18 285
sup1 Source Statistics Canada sup2 September-August crop year sup3 Refers to weight of processed product Conversion rates to grain equivalents Barley malt ndash 1339 Canola oil ndash 2387 Canola meal ndash 1607 Exports of barley malt were 621 thousand tonnes (558 thousand in 2005-2006) Country of destination not available due to confidentiality
Canadian Grain Commission wwwgrainscanadagcca 34
Canadian Grain Exports Crop year 2006 - 2007
12 Exports of special crops and processed productssup1
Country Beans Buckwheat Canary Seed Chick Peas Lentils Mustard Seed (tonnes)
Oceania Australia 3 807 - 211 - 1 366 1 062 Cocos Islands - - - - - -Fiji - - - - - -New Zealand 1 814 - 391 22 228 3 US Outlying Islands - - - 45 - -
Total 5 621 - 602 67 1 594 1 065
Processed Productssup3
Country Peas Soybeanssup2 Sunflower Canola Oil Canola Meal (tonnes)
Oceania Australia 1 094 42 179 3 -Cocos Islands 119 - - - -Fiji 90 - - 30 -New Zealand 158 571 - 208 -US Outlying Islands - - - - -
Total 1 461 613 179 241 -
sup1 Source Statistics Canada sup2 September-August crop year sup3 Refers to weight of processed product Conversion rates to grain equivalents Barley malt ndash 1339 Canola oil ndash 2387 Canola meal ndash 1607 Exports of barley malt were 621 thousand tonnes (558 thousand in 2005-2006) Country of destination not available due to confidentiality
Canadian Grain Commission wwwgrainscanadagcca 35
Canadian Grain Exports Crop year 2006 - 2007
12 Exports of special crops and processed productssup1
Country Beans Buckwheat Canary Seed Chick Peas Lentils Mustard Seed
Western Hemisphere Antigua-Barbuda Argentina Aruba Barbados Belize Bermuda Bolivia Brazil British Virgin Islands Chile Colombia Costa Rica Cuba Dominica Dominican Republic Ecuador El Salvador Grenada Guatemala Guyana Haiti Honduras Jamaica Mexico Netherlands Antilles Nicaragua Panama Paraguay Peru St Kitts-Nevis St Vincent Gren Ste Lucie Surinam Trinidad-Tobago United States Uruguay Venezuela
7 -4 3
137 ----
256 45
643 510 60
12 714 43 67 29
1 514 1
6 202 -
1 736 4 189
3 -
426 --5 3
18 15
489 102 440
-2 375
---------------------------------1
1 537 --
(tonnes)
- -- 5 - -8 6 - -- -- -
21 558 106 - -
4 871 140 11 276 3 550
581 127 390 106
- -746 149
1 235 203 371 -
- -1 746 33
- 181 - -
22 -- -
42 583 -- -- -
75 14 - -
7 012 163 - -- -- -
32 27 172 659
13 062 5 112 116 -
6 186 45
5 1 822
1 68
--
1 323 10 965
-16 866 54 177
686 -
110 176
18 440 -
79 74
---
23 31 513
--
8 765 58
20 825 5
16 45
-1 325 6 361 2 451
23 015
-103
--1 --
569 -
285 74 16
---
203 200
-150
----
20 ----
296 ----
34 71 359
40 1 025
Total
Grand total exported
133 934
349 172
1 538
3 856
112 042 10 626
177 924 115 196
199 194
851 555
74 375
152 931
sup1 Source Statistics Canada
Canadian Grain Commission wwwgrainscanadagcca 36
Canadian Grain Exports Crop year 2006 - 2007
12 Exports of special crops and processed productssup1
Processed Productssup3
Country Peas Soybeanssup2 Sunflower Canola Oil Canola Meal (tonnes)
Western Hemisphere Antigua-Barbuda 9 - - - -Argentina - - - - -Aruba 3 - - - -Barbados 215 1 14 2 -Belize 71 - - - -Bermuda - - - 219 -Bolivia - - - - -Brazil 10 049 - - - -British Virgin Islands - 4 - - -Chile 5 053 - 84 22 -Colombia 34 159 - 312 3 342 -Costa Rica 604 - 421 24 -Cuba 26 968 39 2 - -Dominica 21 - - 1 -Dominican Republic 398 23 161 - -Ecuador 3 106 - - - -El Salvador - - 69 - -Grenada 150 - - - -Guatemala 45 - 539 9 -Guyana 2 947 - - - -Haiti - - - - -Honduras - - 165 - -Jamaica - 625 - - -Mexico 9 331 69 2 289 31 661 5 798 Netherlands Antilles - - - - -Nicaragua 875 - - - -Panama 1 327 186 229 - -Paraguay 8 - - - -Peru 13 338 - - 33 -St Kitts-Nevis 5 - - - -St Vincent Gren - 1 - - -Ste Lucie 20 1 - - -Surinam 802 125 22 8 -Trinidad-Tobago 5 448 215 89 82 -United States 34 482 198 369 96 576 719 403 1 458 082 Uruguay 15 - - - -Venezuela 16 259 - 108 - -
Total 165 708 199 658 101 080 754 806 1 463 880
Grand total exported 1 969 149 1 740 591 120 987 1 305 522 1 482 165
sup1 Source Statistics Canada sup2 September-August crop year sup3 Refers to weight of processed product Conversion rates to grain equivalents Barley malt ndash 1339 Canola oil ndash 2387 Canola meal ndash 1607 Exports of barley malt were 621 thousand tonnes (558 thousand in 2005-2006) Country of destination not available due to confidentiality
Canadian Grain Commission wwwgrainscanadagcca 37
Canadian Grain Exports Crop year 2006 - 2007
13 Ocean freight rates
From
To Japan
North Pacificsup1
Korea South China PR
St Lawrencesup1
Iran
August 2006
September
October
November
December
January 2007
February
March
April
May
June
July
3220
3650
3780
4100
4100
3960
3675
3975
4100
4520
4150
5200
($ US per short tonne)
3120 na
3550 na
3900 na
4300 na
4200 na
4080 na
3825 na
4075 na
4200 na
4620 na
4250 na
5300 na
4640
4800
4900
4825
5000
5120
4950
5225
5375
5940
6000
6700
Average 4036 4118 na 5290
sup1 Rates are calculated for heavy grains on largest sized vessel (type B-vessel size = over 35 000 tonnes) in most general use appropriate to specified route ready to load in three to four weeks time
Source International Grain Council
Canadian Grain Commission wwwgrainscanadagcca 38
Canadian Grain Exports Crop year 2006 - 2007
14 Estimated costs of moving wheat from a mid-prairie point to export position
Crop Year 200102 200203 200304 200405 200506 200607p
Primary Elevator Costs Elevation (1) Removal of dockage Shrinkage Carrying charges (2)
Railway Freight Via Thunder Bay Via Vancouver
Marketing (3)
Terminal Elevator Costs Storage (4) Fobbing charges - via St Lawrence ports (5) - via Pacific seaboard (5)
Lake Transportation (6)
Transfer Elevator Costs Storage Fobbing charges (7)
1118 368 022 245
3443 3378
-225
094
823 842
1917
192 230
1163 383 025 353
3343 3377
-008
167
873 890
1893
347 231
$tonne
1190 1190 440 440
- -196 186
3326 3402 3445 3471
277 083
102 148
903 926 920 936
1892 1928
173 362 232 232
1220 450
-230
3436 3506
315
130
954 982
1991
341 231
1251 462
-209
3805 3809
494
128
978 1006
2185
345 232
Total - via St Lawrence ports - via Pacific seaboard
8227 5842
8770 6350
8731 8897 6570 6454
9298 6833
10089 7359
P - Preliminary
Mid-Prairie point being Brass Saskatchewan
(1) Filed tariff for receiving elevating and loading
(2) Carrying charges on wheat stored in country elevators
(3) Includes interest bank and other charges and Canadian Wheat Board administrative costs interest and depreciation on CWB hopper cars drying additional freight and demurragedespatch
(4) Storage charges on wheat stored in terminal elevators
(5) Thunder Bay and Pacific fobbing charge which includes elevation outward weighing and inspection terminal elevator receipt cancellation lake shippersrsquo charges superintendence and forwarding brokerage charges
(6) Includes elevation outward weighing and inspection terminal elevator receipt cancellation BC Shippersrsquo charges superintendence wharfage and forwarding brokerage charges
(7) Includes lake freight lake brokerage cargo rates insurance St Lawrence Seaway and Welland Canal tolls and inward elevation into transfer elevator
Canadian Grain Commission wwwgrainscanadagcca 39

Canadian Grain Exports Crop year 2006 - 2007
12 Exports of special crops and processed productssup1
Country Beans Buckwheat Canary Seed Chick Peas Lentils Mustard Seed
Africa Algeria Angola Benin British Indian Ocean Terr Burundi Cameroon Cape Verde Central African Republic Chad Comoros Congo Cocircte-drsquoIvoire Djibouti Egypt Ethiopia Gambia Ghana Guinea Kenya Liberia Madagascar Malawi Mauritania Mauritius Morocco Mozambique Namibia Niger Rwanda Senegal Sierra Leone South Africa St Helena Swaziland Tanzania Togo Tunisia Uganda Zaire Zambia Zimbabwe
672 16 658
-18
-505 50
---
645 88
-2 814
----------
516 -
75 ----
867 ------
521 --
-----------------------------------------
(tonnes)
1 609 4 410 - -- -- -- -- -- -- -- -- -- -- 5 - -
1 021 2 373 - -- -- -- -- -- -- -- -- -1 20
660 -- -- -- -- -- -- -
479 163 - -- -- -- -- 720 - -- -- -- -
69 735 268
-14
--------
200 29 206
----
175 60
--
100 1 264
28 577 ----
850 -
3 350 ----
528 ----
-----------------------
68 326
----
1 466 -
267 ---------
Total 23 409 - 3 770 7 691 134 327 2 127
sup1 Source Statistics Canada
Canadian Grain Commission wwwgrainscanadagcca 31
Canadian Grain Exports Crop year 2006 - 2007
12 Exports of special crops and processed productssup1
Processed Productssup3
Country Peas Soybeanssup2 Sunflower Canola Oil Canola Meal (tonnes)
Africa Algeria 6 484 - 1 210 - -Angola - - - - -Benin 475 - - - -British Indian Ocean Terr 16 - - - -Burundi 1 783 - - - -Cameroon - 204 - - -Cape Verde 125 - - - -Central African Republic 200 - - - -Chad 500 - - - -Comoros - - - 80 -Congo 8 - - - -Cocircte-drsquoIvoire 800 - - - -Djibouti - - - - -Egypt 5 984 42 723 526 - -Ethiopia 3 150 - - - -Gambia 291 - - - -Ghana 100 - - - -Guinea 350 - - - -Kenya 12 025 - - - -Liberia 1 050 - - - -Madagascar 836 - - - -Malawi 50 255 - - -Mauritania 620 - - - -Mauritius 591 187 18 - -Morocco 3 648 137 - - -Mozambique 450 - - - -Namibia - - - - -Niger 175 - - - -Rwanda 625 - - - -Senegal 297 - - - -Sierra Leone 1 125 - - - -South Africa 12 709 68 - - -St Helena - 41 - - -Swaziland 70 156 - - -Tanzania 4 350 - - - -Togo 25 - - - -Tunisia - - - - -Uganda 2 625 - - - -Zaire 4 225 - - - -Zambia 400 - - - -Zimbabwe 450 - - - -
Total 66 612 43 771 1 754 80 -sup1 Source Statistics Canada sup2 September-August crop year sup3 Refers to weight of processed product Conversion rates to grain equivalents Barley malt ndash 1339 Canola oil ndash 2387 Canola meal ndash 1607 Exports of barley malt were 621 thousand tonnes (558 thousand in 2005-2006) Country of destination not available due to confidentiality
Canadian Grain Commission wwwgrainscanadagcca 32
Canadian Grain Exports Crop year 2006 - 2007
12 Exports of special crops and processed productssup1
Country Beans Buckwheat Canary Seed Chick Peas Lentils Mustard Seed
Asia Afghanistan Bahrain Bangladesh Bhutan Brunei Darussalam Cambodia China PR Cyprus East Timor Hong Kong India Indonesia Iran Israel Japan Jordan Korea North Korea South Kuwait Lebanon Macau Malaysia Mongolia Nepal Oman Pakistan Philippines Qatar Saudi Arabia Singapore Somalia Sri Lanka Sudan Syrian Arab Rep Taiwan Thailand Turkey United Arab Emirates Vietnam Yemen
-------
11 599 16 69 23
-1 401
21 977 -
1 860 4 485
59 467
-256
---
40 269 50
2 415 40
----
4 348 -
175 568
--
--------------
2 031 -------3 -----------------
(tonnes)
- -- -- 1 305 - -- -
22 -128 -176 91
- -5 9
22 12 903 1 434 44
- -345 2 056
1 339 336 86 15 467
- -111 -
43 270 279 3 569
- -- -- -- -- -- 17 108
334 23 - 49
83 6 183 - -- -- -- -- -
830 -22 -
235 -151 3 607
- -- -
1 595
40 320 ---
967 1 054
-30
130 075 197
9 604 6 085
318 1 384
--
291 3 599
----
199 61 096
-343
2 962 1 618
-19 022
500 113 22
-31 125 81 544
-99
--
3 899 ---
50 ---
4 172 --
65 6 386
--
2 699 ---
33 ----
56 ----
467 --
41 3 610
125 165
--
Total 39 128 2 034 5 645 63 020 393 163 21 768
sup1 Source Statistics Canada
Canadian Grain Commission wwwgrainscanadagcca 33
Canadian Grain Exports Crop year 2006 - 2007
12 Exports of special crops and processed productssup1
Processed Productssup3
Country Peas Soybeanssup2 Sunflower Canola Oil Canola Meal (tonnes)
Asia Afghanistan - - - - -Bahrain 973 - 96 43 -Bangladesh 110 049 - - - -Bhutan 86 - - - -Brunei Darussalam - 142 - - -Cambodia 249 - - - -China PR 251 442 2 400 - 263 814 407 Cyprus - - - - -East Timor - - - - -Hong Kong 2 30 126 7 25 289 -India 895 514 - 146 31 -Indonesia 12 907 522 - 8 -Iran 5 602 244 428 - - -Israel 4 494 25 152 63 12 -Japan 10 924 276 542 124 19 631 315 Jordan 812 80 136 - -Korea North 64 - 74 - -Korea South 563 60 - 35 567 -Kuwait 413 - 476 761 -Lebanon 528 - 262 70 -Macau - 20 - - -Malaysia 2 880 136 409 23 26 096 -Mongolia - - - - -Nepal 5 455 - - - -Oman 214 - - 14 -Pakistan 45 122 - 45 - -Philippines 13 477 12 975 47 635 10 530 Qatar 311 - 48 14 -Saudi Arabia 8 025 869 325 14 -Singapore 1 749 42 834 - 162 -Somalia 2 950 - - - -Sri Lanka 1 701 - - - -Sudan 3 450 - - - -Syrian Arab Rep - 4 303 2 429 - -Taiwan 11 590 8 168 - 26 952 7 033 Thailand 8 982 20 740 - 3 -Turkey 680 21 020 353 - -United Arab Emirates 38 481 134 12 694 531 -Vietnam 45 241 - 217 -Yemen 6 232 43 - - -
Total 1 445 966 827 208 17 348 399 864 18 285
sup1 Source Statistics Canada sup2 September-August crop year sup3 Refers to weight of processed product Conversion rates to grain equivalents Barley malt ndash 1339 Canola oil ndash 2387 Canola meal ndash 1607 Exports of barley malt were 621 thousand tonnes (558 thousand in 2005-2006) Country of destination not available due to confidentiality
Canadian Grain Commission wwwgrainscanadagcca 34
Canadian Grain Exports Crop year 2006 - 2007
12 Exports of special crops and processed productssup1
Country Beans Buckwheat Canary Seed Chick Peas Lentils Mustard Seed (tonnes)
Oceania Australia 3 807 - 211 - 1 366 1 062 Cocos Islands - - - - - -Fiji - - - - - -New Zealand 1 814 - 391 22 228 3 US Outlying Islands - - - 45 - -
Total 5 621 - 602 67 1 594 1 065
Processed Productssup3
Country Peas Soybeanssup2 Sunflower Canola Oil Canola Meal (tonnes)
Oceania Australia 1 094 42 179 3 -Cocos Islands 119 - - - -Fiji 90 - - 30 -New Zealand 158 571 - 208 -US Outlying Islands - - - - -
Total 1 461 613 179 241 -
sup1 Source Statistics Canada sup2 September-August crop year sup3 Refers to weight of processed product Conversion rates to grain equivalents Barley malt ndash 1339 Canola oil ndash 2387 Canola meal ndash 1607 Exports of barley malt were 621 thousand tonnes (558 thousand in 2005-2006) Country of destination not available due to confidentiality
Canadian Grain Commission wwwgrainscanadagcca 35
Canadian Grain Exports Crop year 2006 - 2007
12 Exports of special crops and processed productssup1
Country Beans Buckwheat Canary Seed Chick Peas Lentils Mustard Seed
Western Hemisphere Antigua-Barbuda Argentina Aruba Barbados Belize Bermuda Bolivia Brazil British Virgin Islands Chile Colombia Costa Rica Cuba Dominica Dominican Republic Ecuador El Salvador Grenada Guatemala Guyana Haiti Honduras Jamaica Mexico Netherlands Antilles Nicaragua Panama Paraguay Peru St Kitts-Nevis St Vincent Gren Ste Lucie Surinam Trinidad-Tobago United States Uruguay Venezuela
7 -4 3
137 ----
256 45
643 510 60
12 714 43 67 29
1 514 1
6 202 -
1 736 4 189
3 -
426 --5 3
18 15
489 102 440
-2 375
---------------------------------1
1 537 --
(tonnes)
- -- 5 - -8 6 - -- -- -
21 558 106 - -
4 871 140 11 276 3 550
581 127 390 106
- -746 149
1 235 203 371 -
- -1 746 33
- 181 - -
22 -- -
42 583 -- -- -
75 14 - -
7 012 163 - -- -- -
32 27 172 659
13 062 5 112 116 -
6 186 45
5 1 822
1 68
--
1 323 10 965
-16 866 54 177
686 -
110 176
18 440 -
79 74
---
23 31 513
--
8 765 58
20 825 5
16 45
-1 325 6 361 2 451
23 015
-103
--1 --
569 -
285 74 16
---
203 200
-150
----
20 ----
296 ----
34 71 359
40 1 025
Total
Grand total exported
133 934
349 172
1 538
3 856
112 042 10 626
177 924 115 196
199 194
851 555
74 375
152 931
sup1 Source Statistics Canada
Canadian Grain Commission wwwgrainscanadagcca 36
Canadian Grain Exports Crop year 2006 - 2007
12 Exports of special crops and processed productssup1
Processed Productssup3
Country Peas Soybeanssup2 Sunflower Canola Oil Canola Meal (tonnes)
Western Hemisphere Antigua-Barbuda 9 - - - -Argentina - - - - -Aruba 3 - - - -Barbados 215 1 14 2 -Belize 71 - - - -Bermuda - - - 219 -Bolivia - - - - -Brazil 10 049 - - - -British Virgin Islands - 4 - - -Chile 5 053 - 84 22 -Colombia 34 159 - 312 3 342 -Costa Rica 604 - 421 24 -Cuba 26 968 39 2 - -Dominica 21 - - 1 -Dominican Republic 398 23 161 - -Ecuador 3 106 - - - -El Salvador - - 69 - -Grenada 150 - - - -Guatemala 45 - 539 9 -Guyana 2 947 - - - -Haiti - - - - -Honduras - - 165 - -Jamaica - 625 - - -Mexico 9 331 69 2 289 31 661 5 798 Netherlands Antilles - - - - -Nicaragua 875 - - - -Panama 1 327 186 229 - -Paraguay 8 - - - -Peru 13 338 - - 33 -St Kitts-Nevis 5 - - - -St Vincent Gren - 1 - - -Ste Lucie 20 1 - - -Surinam 802 125 22 8 -Trinidad-Tobago 5 448 215 89 82 -United States 34 482 198 369 96 576 719 403 1 458 082 Uruguay 15 - - - -Venezuela 16 259 - 108 - -
Total 165 708 199 658 101 080 754 806 1 463 880
Grand total exported 1 969 149 1 740 591 120 987 1 305 522 1 482 165
sup1 Source Statistics Canada sup2 September-August crop year sup3 Refers to weight of processed product Conversion rates to grain equivalents Barley malt ndash 1339 Canola oil ndash 2387 Canola meal ndash 1607 Exports of barley malt were 621 thousand tonnes (558 thousand in 2005-2006) Country of destination not available due to confidentiality
Canadian Grain Commission wwwgrainscanadagcca 37
Canadian Grain Exports Crop year 2006 - 2007
13 Ocean freight rates
From
To Japan
North Pacificsup1
Korea South China PR
St Lawrencesup1
Iran
August 2006
September
October
November
December
January 2007
February
March
April
May
June
July
3220
3650
3780
4100
4100
3960
3675
3975
4100
4520
4150
5200
($ US per short tonne)
3120 na
3550 na
3900 na
4300 na
4200 na
4080 na
3825 na
4075 na
4200 na
4620 na
4250 na
5300 na
4640
4800
4900
4825
5000
5120
4950
5225
5375
5940
6000
6700
Average 4036 4118 na 5290
sup1 Rates are calculated for heavy grains on largest sized vessel (type B-vessel size = over 35 000 tonnes) in most general use appropriate to specified route ready to load in three to four weeks time
Source International Grain Council
Canadian Grain Commission wwwgrainscanadagcca 38
Canadian Grain Exports Crop year 2006 - 2007
14 Estimated costs of moving wheat from a mid-prairie point to export position
Crop Year 200102 200203 200304 200405 200506 200607p
Primary Elevator Costs Elevation (1) Removal of dockage Shrinkage Carrying charges (2)
Railway Freight Via Thunder Bay Via Vancouver
Marketing (3)
Terminal Elevator Costs Storage (4) Fobbing charges - via St Lawrence ports (5) - via Pacific seaboard (5)
Lake Transportation (6)
Transfer Elevator Costs Storage Fobbing charges (7)
1118 368 022 245
3443 3378
-225
094
823 842
1917
192 230
1163 383 025 353
3343 3377
-008
167
873 890
1893
347 231
$tonne
1190 1190 440 440
- -196 186
3326 3402 3445 3471
277 083
102 148
903 926 920 936
1892 1928
173 362 232 232
1220 450
-230
3436 3506
315
130
954 982
1991
341 231
1251 462
-209
3805 3809
494
128
978 1006
2185
345 232
Total - via St Lawrence ports - via Pacific seaboard
8227 5842
8770 6350
8731 8897 6570 6454
9298 6833
10089 7359
P - Preliminary
Mid-Prairie point being Brass Saskatchewan
(1) Filed tariff for receiving elevating and loading
(2) Carrying charges on wheat stored in country elevators
(3) Includes interest bank and other charges and Canadian Wheat Board administrative costs interest and depreciation on CWB hopper cars drying additional freight and demurragedespatch
(4) Storage charges on wheat stored in terminal elevators
(5) Thunder Bay and Pacific fobbing charge which includes elevation outward weighing and inspection terminal elevator receipt cancellation lake shippersrsquo charges superintendence and forwarding brokerage charges
(6) Includes elevation outward weighing and inspection terminal elevator receipt cancellation BC Shippersrsquo charges superintendence wharfage and forwarding brokerage charges
(7) Includes lake freight lake brokerage cargo rates insurance St Lawrence Seaway and Welland Canal tolls and inward elevation into transfer elevator
Canadian Grain Commission wwwgrainscanadagcca 39

Canadian Grain Exports Crop year 2006 - 2007
12 Exports of special crops and processed productssup1
Processed Productssup3
Country Peas Soybeanssup2 Sunflower Canola Oil Canola Meal (tonnes)
Africa Algeria 6 484 - 1 210 - -Angola - - - - -Benin 475 - - - -British Indian Ocean Terr 16 - - - -Burundi 1 783 - - - -Cameroon - 204 - - -Cape Verde 125 - - - -Central African Republic 200 - - - -Chad 500 - - - -Comoros - - - 80 -Congo 8 - - - -Cocircte-drsquoIvoire 800 - - - -Djibouti - - - - -Egypt 5 984 42 723 526 - -Ethiopia 3 150 - - - -Gambia 291 - - - -Ghana 100 - - - -Guinea 350 - - - -Kenya 12 025 - - - -Liberia 1 050 - - - -Madagascar 836 - - - -Malawi 50 255 - - -Mauritania 620 - - - -Mauritius 591 187 18 - -Morocco 3 648 137 - - -Mozambique 450 - - - -Namibia - - - - -Niger 175 - - - -Rwanda 625 - - - -Senegal 297 - - - -Sierra Leone 1 125 - - - -South Africa 12 709 68 - - -St Helena - 41 - - -Swaziland 70 156 - - -Tanzania 4 350 - - - -Togo 25 - - - -Tunisia - - - - -Uganda 2 625 - - - -Zaire 4 225 - - - -Zambia 400 - - - -Zimbabwe 450 - - - -
Total 66 612 43 771 1 754 80 -sup1 Source Statistics Canada sup2 September-August crop year sup3 Refers to weight of processed product Conversion rates to grain equivalents Barley malt ndash 1339 Canola oil ndash 2387 Canola meal ndash 1607 Exports of barley malt were 621 thousand tonnes (558 thousand in 2005-2006) Country of destination not available due to confidentiality
Canadian Grain Commission wwwgrainscanadagcca 32
Canadian Grain Exports Crop year 2006 - 2007
12 Exports of special crops and processed productssup1
Country Beans Buckwheat Canary Seed Chick Peas Lentils Mustard Seed
Asia Afghanistan Bahrain Bangladesh Bhutan Brunei Darussalam Cambodia China PR Cyprus East Timor Hong Kong India Indonesia Iran Israel Japan Jordan Korea North Korea South Kuwait Lebanon Macau Malaysia Mongolia Nepal Oman Pakistan Philippines Qatar Saudi Arabia Singapore Somalia Sri Lanka Sudan Syrian Arab Rep Taiwan Thailand Turkey United Arab Emirates Vietnam Yemen
-------
11 599 16 69 23
-1 401
21 977 -
1 860 4 485
59 467
-256
---
40 269 50
2 415 40
----
4 348 -
175 568
--
--------------
2 031 -------3 -----------------
(tonnes)
- -- -- 1 305 - -- -
22 -128 -176 91
- -5 9
22 12 903 1 434 44
- -345 2 056
1 339 336 86 15 467
- -111 -
43 270 279 3 569
- -- -- -- -- -- 17 108
334 23 - 49
83 6 183 - -- -- -- -- -
830 -22 -
235 -151 3 607
- -- -
1 595
40 320 ---
967 1 054
-30
130 075 197
9 604 6 085
318 1 384
--
291 3 599
----
199 61 096
-343
2 962 1 618
-19 022
500 113 22
-31 125 81 544
-99
--
3 899 ---
50 ---
4 172 --
65 6 386
--
2 699 ---
33 ----
56 ----
467 --
41 3 610
125 165
--
Total 39 128 2 034 5 645 63 020 393 163 21 768
sup1 Source Statistics Canada
Canadian Grain Commission wwwgrainscanadagcca 33
Canadian Grain Exports Crop year 2006 - 2007
12 Exports of special crops and processed productssup1
Processed Productssup3
Country Peas Soybeanssup2 Sunflower Canola Oil Canola Meal (tonnes)
Asia Afghanistan - - - - -Bahrain 973 - 96 43 -Bangladesh 110 049 - - - -Bhutan 86 - - - -Brunei Darussalam - 142 - - -Cambodia 249 - - - -China PR 251 442 2 400 - 263 814 407 Cyprus - - - - -East Timor - - - - -Hong Kong 2 30 126 7 25 289 -India 895 514 - 146 31 -Indonesia 12 907 522 - 8 -Iran 5 602 244 428 - - -Israel 4 494 25 152 63 12 -Japan 10 924 276 542 124 19 631 315 Jordan 812 80 136 - -Korea North 64 - 74 - -Korea South 563 60 - 35 567 -Kuwait 413 - 476 761 -Lebanon 528 - 262 70 -Macau - 20 - - -Malaysia 2 880 136 409 23 26 096 -Mongolia - - - - -Nepal 5 455 - - - -Oman 214 - - 14 -Pakistan 45 122 - 45 - -Philippines 13 477 12 975 47 635 10 530 Qatar 311 - 48 14 -Saudi Arabia 8 025 869 325 14 -Singapore 1 749 42 834 - 162 -Somalia 2 950 - - - -Sri Lanka 1 701 - - - -Sudan 3 450 - - - -Syrian Arab Rep - 4 303 2 429 - -Taiwan 11 590 8 168 - 26 952 7 033 Thailand 8 982 20 740 - 3 -Turkey 680 21 020 353 - -United Arab Emirates 38 481 134 12 694 531 -Vietnam 45 241 - 217 -Yemen 6 232 43 - - -
Total 1 445 966 827 208 17 348 399 864 18 285
sup1 Source Statistics Canada sup2 September-August crop year sup3 Refers to weight of processed product Conversion rates to grain equivalents Barley malt ndash 1339 Canola oil ndash 2387 Canola meal ndash 1607 Exports of barley malt were 621 thousand tonnes (558 thousand in 2005-2006) Country of destination not available due to confidentiality
Canadian Grain Commission wwwgrainscanadagcca 34
Canadian Grain Exports Crop year 2006 - 2007
12 Exports of special crops and processed productssup1
Country Beans Buckwheat Canary Seed Chick Peas Lentils Mustard Seed (tonnes)
Oceania Australia 3 807 - 211 - 1 366 1 062 Cocos Islands - - - - - -Fiji - - - - - -New Zealand 1 814 - 391 22 228 3 US Outlying Islands - - - 45 - -
Total 5 621 - 602 67 1 594 1 065
Processed Productssup3
Country Peas Soybeanssup2 Sunflower Canola Oil Canola Meal (tonnes)
Oceania Australia 1 094 42 179 3 -Cocos Islands 119 - - - -Fiji 90 - - 30 -New Zealand 158 571 - 208 -US Outlying Islands - - - - -
Total 1 461 613 179 241 -
sup1 Source Statistics Canada sup2 September-August crop year sup3 Refers to weight of processed product Conversion rates to grain equivalents Barley malt ndash 1339 Canola oil ndash 2387 Canola meal ndash 1607 Exports of barley malt were 621 thousand tonnes (558 thousand in 2005-2006) Country of destination not available due to confidentiality
Canadian Grain Commission wwwgrainscanadagcca 35
Canadian Grain Exports Crop year 2006 - 2007
12 Exports of special crops and processed productssup1
Country Beans Buckwheat Canary Seed Chick Peas Lentils Mustard Seed
Western Hemisphere Antigua-Barbuda Argentina Aruba Barbados Belize Bermuda Bolivia Brazil British Virgin Islands Chile Colombia Costa Rica Cuba Dominica Dominican Republic Ecuador El Salvador Grenada Guatemala Guyana Haiti Honduras Jamaica Mexico Netherlands Antilles Nicaragua Panama Paraguay Peru St Kitts-Nevis St Vincent Gren Ste Lucie Surinam Trinidad-Tobago United States Uruguay Venezuela
7 -4 3
137 ----
256 45
643 510 60
12 714 43 67 29
1 514 1
6 202 -
1 736 4 189
3 -
426 --5 3
18 15
489 102 440
-2 375
---------------------------------1
1 537 --
(tonnes)
- -- 5 - -8 6 - -- -- -
21 558 106 - -
4 871 140 11 276 3 550
581 127 390 106
- -746 149
1 235 203 371 -
- -1 746 33
- 181 - -
22 -- -
42 583 -- -- -
75 14 - -
7 012 163 - -- -- -
32 27 172 659
13 062 5 112 116 -
6 186 45
5 1 822
1 68
--
1 323 10 965
-16 866 54 177
686 -
110 176
18 440 -
79 74
---
23 31 513
--
8 765 58
20 825 5
16 45
-1 325 6 361 2 451
23 015
-103
--1 --
569 -
285 74 16
---
203 200
-150
----
20 ----
296 ----
34 71 359
40 1 025
Total
Grand total exported
133 934
349 172
1 538
3 856
112 042 10 626
177 924 115 196
199 194
851 555
74 375
152 931
sup1 Source Statistics Canada
Canadian Grain Commission wwwgrainscanadagcca 36
Canadian Grain Exports Crop year 2006 - 2007
12 Exports of special crops and processed productssup1
Processed Productssup3
Country Peas Soybeanssup2 Sunflower Canola Oil Canola Meal (tonnes)
Western Hemisphere Antigua-Barbuda 9 - - - -Argentina - - - - -Aruba 3 - - - -Barbados 215 1 14 2 -Belize 71 - - - -Bermuda - - - 219 -Bolivia - - - - -Brazil 10 049 - - - -British Virgin Islands - 4 - - -Chile 5 053 - 84 22 -Colombia 34 159 - 312 3 342 -Costa Rica 604 - 421 24 -Cuba 26 968 39 2 - -Dominica 21 - - 1 -Dominican Republic 398 23 161 - -Ecuador 3 106 - - - -El Salvador - - 69 - -Grenada 150 - - - -Guatemala 45 - 539 9 -Guyana 2 947 - - - -Haiti - - - - -Honduras - - 165 - -Jamaica - 625 - - -Mexico 9 331 69 2 289 31 661 5 798 Netherlands Antilles - - - - -Nicaragua 875 - - - -Panama 1 327 186 229 - -Paraguay 8 - - - -Peru 13 338 - - 33 -St Kitts-Nevis 5 - - - -St Vincent Gren - 1 - - -Ste Lucie 20 1 - - -Surinam 802 125 22 8 -Trinidad-Tobago 5 448 215 89 82 -United States 34 482 198 369 96 576 719 403 1 458 082 Uruguay 15 - - - -Venezuela 16 259 - 108 - -
Total 165 708 199 658 101 080 754 806 1 463 880
Grand total exported 1 969 149 1 740 591 120 987 1 305 522 1 482 165
sup1 Source Statistics Canada sup2 September-August crop year sup3 Refers to weight of processed product Conversion rates to grain equivalents Barley malt ndash 1339 Canola oil ndash 2387 Canola meal ndash 1607 Exports of barley malt were 621 thousand tonnes (558 thousand in 2005-2006) Country of destination not available due to confidentiality
Canadian Grain Commission wwwgrainscanadagcca 37
Canadian Grain Exports Crop year 2006 - 2007
13 Ocean freight rates
From
To Japan
North Pacificsup1
Korea South China PR
St Lawrencesup1
Iran
August 2006
September
October
November
December
January 2007
February
March
April
May
June
July
3220
3650
3780
4100
4100
3960
3675
3975
4100
4520
4150
5200
($ US per short tonne)
3120 na
3550 na
3900 na
4300 na
4200 na
4080 na
3825 na
4075 na
4200 na
4620 na
4250 na
5300 na
4640
4800
4900
4825
5000
5120
4950
5225
5375
5940
6000
6700
Average 4036 4118 na 5290
sup1 Rates are calculated for heavy grains on largest sized vessel (type B-vessel size = over 35 000 tonnes) in most general use appropriate to specified route ready to load in three to four weeks time
Source International Grain Council
Canadian Grain Commission wwwgrainscanadagcca 38
Canadian Grain Exports Crop year 2006 - 2007
14 Estimated costs of moving wheat from a mid-prairie point to export position
Crop Year 200102 200203 200304 200405 200506 200607p
Primary Elevator Costs Elevation (1) Removal of dockage Shrinkage Carrying charges (2)
Railway Freight Via Thunder Bay Via Vancouver
Marketing (3)
Terminal Elevator Costs Storage (4) Fobbing charges - via St Lawrence ports (5) - via Pacific seaboard (5)
Lake Transportation (6)
Transfer Elevator Costs Storage Fobbing charges (7)
1118 368 022 245
3443 3378
-225
094
823 842
1917
192 230
1163 383 025 353
3343 3377
-008
167
873 890
1893
347 231
$tonne
1190 1190 440 440
- -196 186
3326 3402 3445 3471
277 083
102 148
903 926 920 936
1892 1928
173 362 232 232
1220 450
-230
3436 3506
315
130
954 982
1991
341 231
1251 462
-209
3805 3809
494
128
978 1006
2185
345 232
Total - via St Lawrence ports - via Pacific seaboard
8227 5842
8770 6350
8731 8897 6570 6454
9298 6833
10089 7359
P - Preliminary
Mid-Prairie point being Brass Saskatchewan
(1) Filed tariff for receiving elevating and loading
(2) Carrying charges on wheat stored in country elevators
(3) Includes interest bank and other charges and Canadian Wheat Board administrative costs interest and depreciation on CWB hopper cars drying additional freight and demurragedespatch
(4) Storage charges on wheat stored in terminal elevators
(5) Thunder Bay and Pacific fobbing charge which includes elevation outward weighing and inspection terminal elevator receipt cancellation lake shippersrsquo charges superintendence and forwarding brokerage charges
(6) Includes elevation outward weighing and inspection terminal elevator receipt cancellation BC Shippersrsquo charges superintendence wharfage and forwarding brokerage charges
(7) Includes lake freight lake brokerage cargo rates insurance St Lawrence Seaway and Welland Canal tolls and inward elevation into transfer elevator
Canadian Grain Commission wwwgrainscanadagcca 39

Canadian Grain Exports Crop year 2006 - 2007
12 Exports of special crops and processed productssup1
Country Beans Buckwheat Canary Seed Chick Peas Lentils Mustard Seed
Asia Afghanistan Bahrain Bangladesh Bhutan Brunei Darussalam Cambodia China PR Cyprus East Timor Hong Kong India Indonesia Iran Israel Japan Jordan Korea North Korea South Kuwait Lebanon Macau Malaysia Mongolia Nepal Oman Pakistan Philippines Qatar Saudi Arabia Singapore Somalia Sri Lanka Sudan Syrian Arab Rep Taiwan Thailand Turkey United Arab Emirates Vietnam Yemen
-------
11 599 16 69 23
-1 401
21 977 -
1 860 4 485
59 467
-256
---
40 269 50
2 415 40
----
4 348 -
175 568
--
--------------
2 031 -------3 -----------------
(tonnes)
- -- -- 1 305 - -- -
22 -128 -176 91
- -5 9
22 12 903 1 434 44
- -345 2 056
1 339 336 86 15 467
- -111 -
43 270 279 3 569
- -- -- -- -- -- 17 108
334 23 - 49
83 6 183 - -- -- -- -- -
830 -22 -
235 -151 3 607
- -- -
1 595
40 320 ---
967 1 054
-30
130 075 197
9 604 6 085
318 1 384
--
291 3 599
----
199 61 096
-343
2 962 1 618
-19 022
500 113 22
-31 125 81 544
-99
--
3 899 ---
50 ---
4 172 --
65 6 386
--
2 699 ---
33 ----
56 ----
467 --
41 3 610
125 165
--
Total 39 128 2 034 5 645 63 020 393 163 21 768
sup1 Source Statistics Canada
Canadian Grain Commission wwwgrainscanadagcca 33
Canadian Grain Exports Crop year 2006 - 2007
12 Exports of special crops and processed productssup1
Processed Productssup3
Country Peas Soybeanssup2 Sunflower Canola Oil Canola Meal (tonnes)
Asia Afghanistan - - - - -Bahrain 973 - 96 43 -Bangladesh 110 049 - - - -Bhutan 86 - - - -Brunei Darussalam - 142 - - -Cambodia 249 - - - -China PR 251 442 2 400 - 263 814 407 Cyprus - - - - -East Timor - - - - -Hong Kong 2 30 126 7 25 289 -India 895 514 - 146 31 -Indonesia 12 907 522 - 8 -Iran 5 602 244 428 - - -Israel 4 494 25 152 63 12 -Japan 10 924 276 542 124 19 631 315 Jordan 812 80 136 - -Korea North 64 - 74 - -Korea South 563 60 - 35 567 -Kuwait 413 - 476 761 -Lebanon 528 - 262 70 -Macau - 20 - - -Malaysia 2 880 136 409 23 26 096 -Mongolia - - - - -Nepal 5 455 - - - -Oman 214 - - 14 -Pakistan 45 122 - 45 - -Philippines 13 477 12 975 47 635 10 530 Qatar 311 - 48 14 -Saudi Arabia 8 025 869 325 14 -Singapore 1 749 42 834 - 162 -Somalia 2 950 - - - -Sri Lanka 1 701 - - - -Sudan 3 450 - - - -Syrian Arab Rep - 4 303 2 429 - -Taiwan 11 590 8 168 - 26 952 7 033 Thailand 8 982 20 740 - 3 -Turkey 680 21 020 353 - -United Arab Emirates 38 481 134 12 694 531 -Vietnam 45 241 - 217 -Yemen 6 232 43 - - -
Total 1 445 966 827 208 17 348 399 864 18 285
sup1 Source Statistics Canada sup2 September-August crop year sup3 Refers to weight of processed product Conversion rates to grain equivalents Barley malt ndash 1339 Canola oil ndash 2387 Canola meal ndash 1607 Exports of barley malt were 621 thousand tonnes (558 thousand in 2005-2006) Country of destination not available due to confidentiality
Canadian Grain Commission wwwgrainscanadagcca 34
Canadian Grain Exports Crop year 2006 - 2007
12 Exports of special crops and processed productssup1
Country Beans Buckwheat Canary Seed Chick Peas Lentils Mustard Seed (tonnes)
Oceania Australia 3 807 - 211 - 1 366 1 062 Cocos Islands - - - - - -Fiji - - - - - -New Zealand 1 814 - 391 22 228 3 US Outlying Islands - - - 45 - -
Total 5 621 - 602 67 1 594 1 065
Processed Productssup3
Country Peas Soybeanssup2 Sunflower Canola Oil Canola Meal (tonnes)
Oceania Australia 1 094 42 179 3 -Cocos Islands 119 - - - -Fiji 90 - - 30 -New Zealand 158 571 - 208 -US Outlying Islands - - - - -
Total 1 461 613 179 241 -
sup1 Source Statistics Canada sup2 September-August crop year sup3 Refers to weight of processed product Conversion rates to grain equivalents Barley malt ndash 1339 Canola oil ndash 2387 Canola meal ndash 1607 Exports of barley malt were 621 thousand tonnes (558 thousand in 2005-2006) Country of destination not available due to confidentiality
Canadian Grain Commission wwwgrainscanadagcca 35
Canadian Grain Exports Crop year 2006 - 2007
12 Exports of special crops and processed productssup1
Country Beans Buckwheat Canary Seed Chick Peas Lentils Mustard Seed
Western Hemisphere Antigua-Barbuda Argentina Aruba Barbados Belize Bermuda Bolivia Brazil British Virgin Islands Chile Colombia Costa Rica Cuba Dominica Dominican Republic Ecuador El Salvador Grenada Guatemala Guyana Haiti Honduras Jamaica Mexico Netherlands Antilles Nicaragua Panama Paraguay Peru St Kitts-Nevis St Vincent Gren Ste Lucie Surinam Trinidad-Tobago United States Uruguay Venezuela
7 -4 3
137 ----
256 45
643 510 60
12 714 43 67 29
1 514 1
6 202 -
1 736 4 189
3 -
426 --5 3
18 15
489 102 440
-2 375
---------------------------------1
1 537 --
(tonnes)
- -- 5 - -8 6 - -- -- -
21 558 106 - -
4 871 140 11 276 3 550
581 127 390 106
- -746 149
1 235 203 371 -
- -1 746 33
- 181 - -
22 -- -
42 583 -- -- -
75 14 - -
7 012 163 - -- -- -
32 27 172 659
13 062 5 112 116 -
6 186 45
5 1 822
1 68
--
1 323 10 965
-16 866 54 177
686 -
110 176
18 440 -
79 74
---
23 31 513
--
8 765 58
20 825 5
16 45
-1 325 6 361 2 451
23 015
-103
--1 --
569 -
285 74 16
---
203 200
-150
----
20 ----
296 ----
34 71 359
40 1 025
Total
Grand total exported
133 934
349 172
1 538
3 856
112 042 10 626
177 924 115 196
199 194
851 555
74 375
152 931
sup1 Source Statistics Canada
Canadian Grain Commission wwwgrainscanadagcca 36
Canadian Grain Exports Crop year 2006 - 2007
12 Exports of special crops and processed productssup1
Processed Productssup3
Country Peas Soybeanssup2 Sunflower Canola Oil Canola Meal (tonnes)
Western Hemisphere Antigua-Barbuda 9 - - - -Argentina - - - - -Aruba 3 - - - -Barbados 215 1 14 2 -Belize 71 - - - -Bermuda - - - 219 -Bolivia - - - - -Brazil 10 049 - - - -British Virgin Islands - 4 - - -Chile 5 053 - 84 22 -Colombia 34 159 - 312 3 342 -Costa Rica 604 - 421 24 -Cuba 26 968 39 2 - -Dominica 21 - - 1 -Dominican Republic 398 23 161 - -Ecuador 3 106 - - - -El Salvador - - 69 - -Grenada 150 - - - -Guatemala 45 - 539 9 -Guyana 2 947 - - - -Haiti - - - - -Honduras - - 165 - -Jamaica - 625 - - -Mexico 9 331 69 2 289 31 661 5 798 Netherlands Antilles - - - - -Nicaragua 875 - - - -Panama 1 327 186 229 - -Paraguay 8 - - - -Peru 13 338 - - 33 -St Kitts-Nevis 5 - - - -St Vincent Gren - 1 - - -Ste Lucie 20 1 - - -Surinam 802 125 22 8 -Trinidad-Tobago 5 448 215 89 82 -United States 34 482 198 369 96 576 719 403 1 458 082 Uruguay 15 - - - -Venezuela 16 259 - 108 - -
Total 165 708 199 658 101 080 754 806 1 463 880
Grand total exported 1 969 149 1 740 591 120 987 1 305 522 1 482 165
sup1 Source Statistics Canada sup2 September-August crop year sup3 Refers to weight of processed product Conversion rates to grain equivalents Barley malt ndash 1339 Canola oil ndash 2387 Canola meal ndash 1607 Exports of barley malt were 621 thousand tonnes (558 thousand in 2005-2006) Country of destination not available due to confidentiality
Canadian Grain Commission wwwgrainscanadagcca 37
Canadian Grain Exports Crop year 2006 - 2007
13 Ocean freight rates
From
To Japan
North Pacificsup1
Korea South China PR
St Lawrencesup1
Iran
August 2006
September
October
November
December
January 2007
February
March
April
May
June
July
3220
3650
3780
4100
4100
3960
3675
3975
4100
4520
4150
5200
($ US per short tonne)
3120 na
3550 na
3900 na
4300 na
4200 na
4080 na
3825 na
4075 na
4200 na
4620 na
4250 na
5300 na
4640
4800
4900
4825
5000
5120
4950
5225
5375
5940
6000
6700
Average 4036 4118 na 5290
sup1 Rates are calculated for heavy grains on largest sized vessel (type B-vessel size = over 35 000 tonnes) in most general use appropriate to specified route ready to load in three to four weeks time
Source International Grain Council
Canadian Grain Commission wwwgrainscanadagcca 38
Canadian Grain Exports Crop year 2006 - 2007
14 Estimated costs of moving wheat from a mid-prairie point to export position
Crop Year 200102 200203 200304 200405 200506 200607p
Primary Elevator Costs Elevation (1) Removal of dockage Shrinkage Carrying charges (2)
Railway Freight Via Thunder Bay Via Vancouver
Marketing (3)
Terminal Elevator Costs Storage (4) Fobbing charges - via St Lawrence ports (5) - via Pacific seaboard (5)
Lake Transportation (6)
Transfer Elevator Costs Storage Fobbing charges (7)
1118 368 022 245
3443 3378
-225
094
823 842
1917
192 230
1163 383 025 353
3343 3377
-008
167
873 890
1893
347 231
$tonne
1190 1190 440 440
- -196 186
3326 3402 3445 3471
277 083
102 148
903 926 920 936
1892 1928
173 362 232 232
1220 450
-230
3436 3506
315
130
954 982
1991
341 231
1251 462
-209
3805 3809
494
128
978 1006
2185
345 232
Total - via St Lawrence ports - via Pacific seaboard
8227 5842
8770 6350
8731 8897 6570 6454
9298 6833
10089 7359
P - Preliminary
Mid-Prairie point being Brass Saskatchewan
(1) Filed tariff for receiving elevating and loading
(2) Carrying charges on wheat stored in country elevators
(3) Includes interest bank and other charges and Canadian Wheat Board administrative costs interest and depreciation on CWB hopper cars drying additional freight and demurragedespatch
(4) Storage charges on wheat stored in terminal elevators
(5) Thunder Bay and Pacific fobbing charge which includes elevation outward weighing and inspection terminal elevator receipt cancellation lake shippersrsquo charges superintendence and forwarding brokerage charges
(6) Includes elevation outward weighing and inspection terminal elevator receipt cancellation BC Shippersrsquo charges superintendence wharfage and forwarding brokerage charges
(7) Includes lake freight lake brokerage cargo rates insurance St Lawrence Seaway and Welland Canal tolls and inward elevation into transfer elevator
Canadian Grain Commission wwwgrainscanadagcca 39

Canadian Grain Exports Crop year 2006 - 2007
12 Exports of special crops and processed productssup1
Processed Productssup3
Country Peas Soybeanssup2 Sunflower Canola Oil Canola Meal (tonnes)
Asia Afghanistan - - - - -Bahrain 973 - 96 43 -Bangladesh 110 049 - - - -Bhutan 86 - - - -Brunei Darussalam - 142 - - -Cambodia 249 - - - -China PR 251 442 2 400 - 263 814 407 Cyprus - - - - -East Timor - - - - -Hong Kong 2 30 126 7 25 289 -India 895 514 - 146 31 -Indonesia 12 907 522 - 8 -Iran 5 602 244 428 - - -Israel 4 494 25 152 63 12 -Japan 10 924 276 542 124 19 631 315 Jordan 812 80 136 - -Korea North 64 - 74 - -Korea South 563 60 - 35 567 -Kuwait 413 - 476 761 -Lebanon 528 - 262 70 -Macau - 20 - - -Malaysia 2 880 136 409 23 26 096 -Mongolia - - - - -Nepal 5 455 - - - -Oman 214 - - 14 -Pakistan 45 122 - 45 - -Philippines 13 477 12 975 47 635 10 530 Qatar 311 - 48 14 -Saudi Arabia 8 025 869 325 14 -Singapore 1 749 42 834 - 162 -Somalia 2 950 - - - -Sri Lanka 1 701 - - - -Sudan 3 450 - - - -Syrian Arab Rep - 4 303 2 429 - -Taiwan 11 590 8 168 - 26 952 7 033 Thailand 8 982 20 740 - 3 -Turkey 680 21 020 353 - -United Arab Emirates 38 481 134 12 694 531 -Vietnam 45 241 - 217 -Yemen 6 232 43 - - -
Total 1 445 966 827 208 17 348 399 864 18 285
sup1 Source Statistics Canada sup2 September-August crop year sup3 Refers to weight of processed product Conversion rates to grain equivalents Barley malt ndash 1339 Canola oil ndash 2387 Canola meal ndash 1607 Exports of barley malt were 621 thousand tonnes (558 thousand in 2005-2006) Country of destination not available due to confidentiality
Canadian Grain Commission wwwgrainscanadagcca 34
Canadian Grain Exports Crop year 2006 - 2007
12 Exports of special crops and processed productssup1
Country Beans Buckwheat Canary Seed Chick Peas Lentils Mustard Seed (tonnes)
Oceania Australia 3 807 - 211 - 1 366 1 062 Cocos Islands - - - - - -Fiji - - - - - -New Zealand 1 814 - 391 22 228 3 US Outlying Islands - - - 45 - -
Total 5 621 - 602 67 1 594 1 065
Processed Productssup3
Country Peas Soybeanssup2 Sunflower Canola Oil Canola Meal (tonnes)
Oceania Australia 1 094 42 179 3 -Cocos Islands 119 - - - -Fiji 90 - - 30 -New Zealand 158 571 - 208 -US Outlying Islands - - - - -
Total 1 461 613 179 241 -
sup1 Source Statistics Canada sup2 September-August crop year sup3 Refers to weight of processed product Conversion rates to grain equivalents Barley malt ndash 1339 Canola oil ndash 2387 Canola meal ndash 1607 Exports of barley malt were 621 thousand tonnes (558 thousand in 2005-2006) Country of destination not available due to confidentiality
Canadian Grain Commission wwwgrainscanadagcca 35
Canadian Grain Exports Crop year 2006 - 2007
12 Exports of special crops and processed productssup1
Country Beans Buckwheat Canary Seed Chick Peas Lentils Mustard Seed
Western Hemisphere Antigua-Barbuda Argentina Aruba Barbados Belize Bermuda Bolivia Brazil British Virgin Islands Chile Colombia Costa Rica Cuba Dominica Dominican Republic Ecuador El Salvador Grenada Guatemala Guyana Haiti Honduras Jamaica Mexico Netherlands Antilles Nicaragua Panama Paraguay Peru St Kitts-Nevis St Vincent Gren Ste Lucie Surinam Trinidad-Tobago United States Uruguay Venezuela
7 -4 3
137 ----
256 45
643 510 60
12 714 43 67 29
1 514 1
6 202 -
1 736 4 189
3 -
426 --5 3
18 15
489 102 440
-2 375
---------------------------------1
1 537 --
(tonnes)
- -- 5 - -8 6 - -- -- -
21 558 106 - -
4 871 140 11 276 3 550
581 127 390 106
- -746 149
1 235 203 371 -
- -1 746 33
- 181 - -
22 -- -
42 583 -- -- -
75 14 - -
7 012 163 - -- -- -
32 27 172 659
13 062 5 112 116 -
6 186 45
5 1 822
1 68
--
1 323 10 965
-16 866 54 177
686 -
110 176
18 440 -
79 74
---
23 31 513
--
8 765 58
20 825 5
16 45
-1 325 6 361 2 451
23 015
-103
--1 --
569 -
285 74 16
---
203 200
-150
----
20 ----
296 ----
34 71 359
40 1 025
Total
Grand total exported
133 934
349 172
1 538
3 856
112 042 10 626
177 924 115 196
199 194
851 555
74 375
152 931
sup1 Source Statistics Canada
Canadian Grain Commission wwwgrainscanadagcca 36
Canadian Grain Exports Crop year 2006 - 2007
12 Exports of special crops and processed productssup1
Processed Productssup3
Country Peas Soybeanssup2 Sunflower Canola Oil Canola Meal (tonnes)
Western Hemisphere Antigua-Barbuda 9 - - - -Argentina - - - - -Aruba 3 - - - -Barbados 215 1 14 2 -Belize 71 - - - -Bermuda - - - 219 -Bolivia - - - - -Brazil 10 049 - - - -British Virgin Islands - 4 - - -Chile 5 053 - 84 22 -Colombia 34 159 - 312 3 342 -Costa Rica 604 - 421 24 -Cuba 26 968 39 2 - -Dominica 21 - - 1 -Dominican Republic 398 23 161 - -Ecuador 3 106 - - - -El Salvador - - 69 - -Grenada 150 - - - -Guatemala 45 - 539 9 -Guyana 2 947 - - - -Haiti - - - - -Honduras - - 165 - -Jamaica - 625 - - -Mexico 9 331 69 2 289 31 661 5 798 Netherlands Antilles - - - - -Nicaragua 875 - - - -Panama 1 327 186 229 - -Paraguay 8 - - - -Peru 13 338 - - 33 -St Kitts-Nevis 5 - - - -St Vincent Gren - 1 - - -Ste Lucie 20 1 - - -Surinam 802 125 22 8 -Trinidad-Tobago 5 448 215 89 82 -United States 34 482 198 369 96 576 719 403 1 458 082 Uruguay 15 - - - -Venezuela 16 259 - 108 - -
Total 165 708 199 658 101 080 754 806 1 463 880
Grand total exported 1 969 149 1 740 591 120 987 1 305 522 1 482 165
sup1 Source Statistics Canada sup2 September-August crop year sup3 Refers to weight of processed product Conversion rates to grain equivalents Barley malt ndash 1339 Canola oil ndash 2387 Canola meal ndash 1607 Exports of barley malt were 621 thousand tonnes (558 thousand in 2005-2006) Country of destination not available due to confidentiality
Canadian Grain Commission wwwgrainscanadagcca 37
Canadian Grain Exports Crop year 2006 - 2007
13 Ocean freight rates
From
To Japan
North Pacificsup1
Korea South China PR
St Lawrencesup1
Iran
August 2006
September
October
November
December
January 2007
February
March
April
May
June
July
3220
3650
3780
4100
4100
3960
3675
3975
4100
4520
4150
5200
($ US per short tonne)
3120 na
3550 na
3900 na
4300 na
4200 na
4080 na
3825 na
4075 na
4200 na
4620 na
4250 na
5300 na
4640
4800
4900
4825
5000
5120
4950
5225
5375
5940
6000
6700
Average 4036 4118 na 5290
sup1 Rates are calculated for heavy grains on largest sized vessel (type B-vessel size = over 35 000 tonnes) in most general use appropriate to specified route ready to load in three to four weeks time
Source International Grain Council
Canadian Grain Commission wwwgrainscanadagcca 38
Canadian Grain Exports Crop year 2006 - 2007
14 Estimated costs of moving wheat from a mid-prairie point to export position
Crop Year 200102 200203 200304 200405 200506 200607p
Primary Elevator Costs Elevation (1) Removal of dockage Shrinkage Carrying charges (2)
Railway Freight Via Thunder Bay Via Vancouver
Marketing (3)
Terminal Elevator Costs Storage (4) Fobbing charges - via St Lawrence ports (5) - via Pacific seaboard (5)
Lake Transportation (6)
Transfer Elevator Costs Storage Fobbing charges (7)
1118 368 022 245
3443 3378
-225
094
823 842
1917
192 230
1163 383 025 353
3343 3377
-008
167
873 890
1893
347 231
$tonne
1190 1190 440 440
- -196 186
3326 3402 3445 3471
277 083
102 148
903 926 920 936
1892 1928
173 362 232 232
1220 450
-230
3436 3506
315
130
954 982
1991
341 231
1251 462
-209
3805 3809
494
128
978 1006
2185
345 232
Total - via St Lawrence ports - via Pacific seaboard
8227 5842
8770 6350
8731 8897 6570 6454
9298 6833
10089 7359
P - Preliminary
Mid-Prairie point being Brass Saskatchewan
(1) Filed tariff for receiving elevating and loading
(2) Carrying charges on wheat stored in country elevators
(3) Includes interest bank and other charges and Canadian Wheat Board administrative costs interest and depreciation on CWB hopper cars drying additional freight and demurragedespatch
(4) Storage charges on wheat stored in terminal elevators
(5) Thunder Bay and Pacific fobbing charge which includes elevation outward weighing and inspection terminal elevator receipt cancellation lake shippersrsquo charges superintendence and forwarding brokerage charges
(6) Includes elevation outward weighing and inspection terminal elevator receipt cancellation BC Shippersrsquo charges superintendence wharfage and forwarding brokerage charges
(7) Includes lake freight lake brokerage cargo rates insurance St Lawrence Seaway and Welland Canal tolls and inward elevation into transfer elevator
Canadian Grain Commission wwwgrainscanadagcca 39

Canadian Grain Exports Crop year 2006 - 2007
12 Exports of special crops and processed productssup1
Processed Productssup3
Country Peas Soybeanssup2 Sunflower Canola Oil Canola Meal (tonnes)
Western Hemisphere Antigua-Barbuda 9 - - - -Argentina - - - - -Aruba 3 - - - -Barbados 215 1 14 2 -Belize 71 - - - -Bermuda - - - 219 -Bolivia - - - - -Brazil 10 049 - - - -British Virgin Islands - 4 - - -Chile 5 053 - 84 22 -Colombia 34 159 - 312 3 342 -Costa Rica 604 - 421 24 -Cuba 26 968 39 2 - -Dominica 21 - - 1 -Dominican Republic 398 23 161 - -Ecuador 3 106 - - - -El Salvador - - 69 - -Grenada 150 - - - -Guatemala 45 - 539 9 -Guyana 2 947 - - - -Haiti - - - - -Honduras - - 165 - -Jamaica - 625 - - -Mexico 9 331 69 2 289 31 661 5 798 Netherlands Antilles - - - - -Nicaragua 875 - - - -Panama 1 327 186 229 - -Paraguay 8 - - - -Peru 13 338 - - 33 -St Kitts-Nevis 5 - - - -St Vincent Gren - 1 - - -Ste Lucie 20 1 - - -Surinam 802 125 22 8 -Trinidad-Tobago 5 448 215 89 82 -United States 34 482 198 369 96 576 719 403 1 458 082 Uruguay 15 - - - -Venezuela 16 259 - 108 - -
Total 165 708 199 658 101 080 754 806 1 463 880
Grand total exported 1 969 149 1 740 591 120 987 1 305 522 1 482 165
sup1 Source Statistics Canada sup2 September-August crop year sup3 Refers to weight of processed product Conversion rates to grain equivalents Barley malt ndash 1339 Canola oil ndash 2387 Canola meal ndash 1607 Exports of barley malt were 621 thousand tonnes (558 thousand in 2005-2006) Country of destination not available due to confidentiality
Canadian Grain Commission wwwgrainscanadagcca 37
Canadian Grain Exports Crop year 2006 - 2007
13 Ocean freight rates
From
To Japan
North Pacificsup1
Korea South China PR
St Lawrencesup1
Iran
August 2006
September
October
November
December
January 2007
February
March
April
May
June
July
3220
3650
3780
4100
4100
3960
3675
3975
4100
4520
4150
5200
($ US per short tonne)
3120 na
3550 na
3900 na
4300 na
4200 na
4080 na
3825 na
4075 na
4200 na
4620 na
4250 na
5300 na
4640
4800
4900
4825
5000
5120
4950
5225
5375
5940
6000
6700
Average 4036 4118 na 5290
sup1 Rates are calculated for heavy grains on largest sized vessel (type B-vessel size = over 35 000 tonnes) in most general use appropriate to specified route ready to load in three to four weeks time
Source International Grain Council
Canadian Grain Commission wwwgrainscanadagcca 38
Canadian Grain Exports Crop year 2006 - 2007
14 Estimated costs of moving wheat from a mid-prairie point to export position
Crop Year 200102 200203 200304 200405 200506 200607p
Primary Elevator Costs Elevation (1) Removal of dockage Shrinkage Carrying charges (2)
Railway Freight Via Thunder Bay Via Vancouver
Marketing (3)
Terminal Elevator Costs Storage (4) Fobbing charges - via St Lawrence ports (5) - via Pacific seaboard (5)
Lake Transportation (6)
Transfer Elevator Costs Storage Fobbing charges (7)
1118 368 022 245
3443 3378
-225
094
823 842
1917
192 230
1163 383 025 353
3343 3377
-008
167
873 890
1893
347 231
$tonne
1190 1190 440 440
- -196 186
3326 3402 3445 3471
277 083
102 148
903 926 920 936
1892 1928
173 362 232 232
1220 450
-230
3436 3506
315
130
954 982
1991
341 231
1251 462
-209
3805 3809
494
128
978 1006
2185
345 232
Total - via St Lawrence ports - via Pacific seaboard
8227 5842
8770 6350
8731 8897 6570 6454
9298 6833
10089 7359
P - Preliminary
Mid-Prairie point being Brass Saskatchewan
(1) Filed tariff for receiving elevating and loading
(2) Carrying charges on wheat stored in country elevators
(3) Includes interest bank and other charges and Canadian Wheat Board administrative costs interest and depreciation on CWB hopper cars drying additional freight and demurragedespatch
(4) Storage charges on wheat stored in terminal elevators
(5) Thunder Bay and Pacific fobbing charge which includes elevation outward weighing and inspection terminal elevator receipt cancellation lake shippersrsquo charges superintendence and forwarding brokerage charges
(6) Includes elevation outward weighing and inspection terminal elevator receipt cancellation BC Shippersrsquo charges superintendence wharfage and forwarding brokerage charges
(7) Includes lake freight lake brokerage cargo rates insurance St Lawrence Seaway and Welland Canal tolls and inward elevation into transfer elevator
Canadian Grain Commission wwwgrainscanadagcca 39

Canadian Grain Exports Crop year 2006 - 2007
14 Estimated costs of moving wheat from a mid-prairie point to export position
Crop Year 200102 200203 200304 200405 200506 200607p
Primary Elevator Costs Elevation (1) Removal of dockage Shrinkage Carrying charges (2)
Railway Freight Via Thunder Bay Via Vancouver
Marketing (3)
Terminal Elevator Costs Storage (4) Fobbing charges - via St Lawrence ports (5) - via Pacific seaboard (5)
Lake Transportation (6)
Transfer Elevator Costs Storage Fobbing charges (7)
1118 368 022 245
3443 3378
-225
094
823 842
1917
192 230
1163 383 025 353
3343 3377
-008
167
873 890
1893
347 231
$tonne
1190 1190 440 440
- -196 186
3326 3402 3445 3471
277 083
102 148
903 926 920 936
1892 1928
173 362 232 232
1220 450
-230
3436 3506
315
130
954 982
1991
341 231
1251 462
-209
3805 3809
494
128
978 1006
2185
345 232
Total - via St Lawrence ports - via Pacific seaboard
8227 5842
8770 6350
8731 8897 6570 6454
9298 6833
10089 7359
P - Preliminary
Mid-Prairie point being Brass Saskatchewan
(1) Filed tariff for receiving elevating and loading
(2) Carrying charges on wheat stored in country elevators
(3) Includes interest bank and other charges and Canadian Wheat Board administrative costs interest and depreciation on CWB hopper cars drying additional freight and demurragedespatch
(4) Storage charges on wheat stored in terminal elevators
(5) Thunder Bay and Pacific fobbing charge which includes elevation outward weighing and inspection terminal elevator receipt cancellation lake shippersrsquo charges superintendence and forwarding brokerage charges
(6) Includes elevation outward weighing and inspection terminal elevator receipt cancellation BC Shippersrsquo charges superintendence wharfage and forwarding brokerage charges
(7) Includes lake freight lake brokerage cargo rates insurance St Lawrence Seaway and Welland Canal tolls and inward elevation into transfer elevator
Canadian Grain Commission wwwgrainscanadagcca 39