Analysis of SHEFEXIL Product Exports: November, 2018
34
Analysis of SHEFEXIL Product Exports: November, 2018 SHEFEXIL
-
Upload
khangminh22 -
Category
Documents
-
view
4 -
download
0
Transcript of Analysis of SHEFEXIL Product Exports: November, 2018

Analysis of SHEFEXIL Product Exports: November, 2018
SHEFEXIL

TREND IN OVERALL EXPORTS India’s merchandise exports during November 2018 were valued at US $ 26.50 Billion, as compared to US $ 26.29 Billion during November 2017. This registers a positive growth of 0.80% in dollar terms. Exports were valued Rs. 1,90,429.46Crorein November 2018 as compared to Rs. 1,70,541.01 Croreduring November 2017. Hence, in Rupee terms export increased by 11.66%. However, cumulatively, exports grew during April‑November 2018‑19 as compared to April‑ November 2017‑18 by 11.58% in dollar terms and 20.40% in rupee terms. The growth may be mainly because of rupee depreciation during July and November 2018. As compared to total exports made in October 2018 (USD 26.94 billion), exports in November 2018 (USD 26.50 billion) decreased merely by 1.63%.
TREND IN SHEFEXIL PRODUCT EXPORTS India’s export of SHEFEXIL products valued at USD 159.61million during November2018 (FY 2018‑19) as
against USD 153.41million during November2017 (FY 2017‑18), registering positive growth of 4.05%. Cumulative exportof SHEFEXIL products during April‑November2018‑19 also recorded a growth of 13.26% over the same period last year, by securing exports of USD 1357.51million as against USD 1198.58million during April –November2017‑18. As compared to total exports of Shefexil products made in October 2018 (USD 156.48million), exports in November2018 (USD 159.61million) increased by 2%. There was a significant decrease in terms of quantity in November 2018, as it declined by 10.79% when compared to November 2017. However cumulative exports increasedduring April‑November 2018‑19 as compared to April‑ November 2017‑18 by2.27% only. The quantity of exports decreased in all the panels in November 2018 as compared to November 2017 except OVM products. However, cumulative exports saw a decline in quantity exported for FVOC and VSE products.
KEY FACTS ▪ SHEFEXIL's exports valued at USD 159.61millionin November2018, registering negative
growth of 4.05% as compared to exports made in November2017. ▪ As compared to exports made in Oct.2018, exports in Nov. 2018 have increasedby 2% in
value terms. ▪ As compared to the quantity of exports made in November 2017, exports made in
November 2018 decreased by 10.79%. ▪ Monthly and Cumulative Exports of all panels grew positivelyin terms of value except PPP,
OVM ▪ Monthly Exports of all the Panels except OVMdecreased in terms of quantity ▪ Cumulative Exports saw a decline in quantity exported for FVOC and VSE products
Abbreviations : FVOC ‑ Fixed Vegetable Oil Cake & Others
1 | Page

GG ‑ Guar Gum OVM ‑ Other Vegetable Materials PPP ‑ Plant & Plant Portion SLBP ‑ Shellac & Lac Based Products VSE ‑ Vegetable Saps & Extracts Monthly Exports – Exports made in Nov. 2018 as compared to exports made in Nov. 2017. Cumulative Exports ‑ Exports made in April‑November. 2018‑19 as compared to exports made in
April‑November. 2017‑18.
Table 1: Trend in SHEFEXIL Product exports
(Values in USD Million)
PANEL Fixed Vegetable Oil Cake & Others (FVOC)
Guar Gum(GG)
Other Vegetable Materials (OVM)
Plant & Plant Portion (PPP)
Shellac & Lac Based Products (SLBP)
Vegetable Saps & Extracts (VSE)
Total
Monthly Exports
November, 2017 5.69 49.14 4.63 27.84 2.72 63.39 153.41
November, 2018 5.64 40.92 4.19 19.41 2.22 87.23 159.61
% Growth in November2018 as compared to November2017
‑0.88 ‑16.73 ‑9.50 ‑30.28 ‑18.16 37.61 4.05
Cumulative Exports
April‑November2017 – 2018
42.03 401.39 37.63 209.86 20.89 486.78 1198.58
April‑November2018 – 2019
50.99 440.35 34.02 208.78 26.42 596.95 1357.51
% Growth in Apr‑Nov. 2018‑19 (as compared to Apr‑Nov. 2017‑18)
21.32 9.71 ‑9.59 ‑0.51 26.47 22.63 13.26
(Source: DGCI&S)
‑ Overall monthly export of SHEFEXIL products in November2018 increased by 4.05% in value
terms, as compared to November2017.
‑ Month‑on‑month exports – Export in November2018 increased by 2% as compared to export
made in October2018 in value terms.
‑ Overall cumulative export of all SHEFEXIL products increased by 13.26% in Apr‑Nov2018‑19, in
value terms, as compared to Apr‑Nov 2017‑18.
2 | Page

Table 1.1: Trend in SHEFEXIL Product exports
(Quantity in MT)
PANEL Fixed Vegetable Oil Cake & Others (FVOC)
Guar Gum(GG)
Other Vegetable Materials (OVM)
Plant & Plant Portion (PPP)
Shellac & Lac Based Products (SLBP)
Vegetable Saps & Extracts (VSE)
Total
Monthly Exports
November, 2017 6036.13 39801.02 6338.56 7814.80 577.95 8792.55 69361.01
November, 2018 5482.43 32754.85 6933.48 7763.08 556.50 8389.54 61879.88
% Growth in November2018 (as compared to November2017)
‑9.17 ‑17.70 9.39 ‑0.66 ‑3.71 ‑4.58 ‑10.79
Cumulative Exports
APRIL,2017 ‑ NOVEMBER,2018
51617.37 322036.60 50879.17 69117.96 4551.65 94226.66 592429.41
APRIL,2018 ‑ NOVEMBER,2019
46649.71 330974.88 59297.33 73223.04 5529.67 90228.80 605903.43
% Growth in Apr‑Nov2018‑19 (as compared to Apr‑Nov2017‑18)
‑9.62 2.78 16.55
5.94 21.49 ‑4.24 2.27
(Source: DGCI&S)
‑ Overall monthly export of SHEFEXIL products in November 2018 decreased by 10.79% in terms
of quantity, as compared to November 2017.
‑ Month‑on‑month exports – Export in November 2018 decreased by 18.22% as compared to
export made in October 2018.
‑ Overall cumulative export of SHEFEXIL products increased by 2.27% in Apr‑Nov 2018‑19, as
compared to Apr‑Nov 2017‑18 in terms of quantity.
Export Performance
April‑Nov 2017 (USD Billion) April‑ Nov 2018 (USD Billion) Growth (%) 1.198 1.357 13.27
3 | Page

Nov – 2017 (USD Billion) Nov – 2018 (USD Billion) Growth (%) 0.153 0.159 3.92 Oct – 2018 (USD Billion) Nov – 2018 (USD Billion) Growth (%) 0.156 0.159 1.92%
Table 2: Panels which recorded positive growth of 10% or more(During November 2018 over November2017)
(Values in USD Million)
PANEL Nov‑17 Nov‑18 Growth% Vegetable Saps & Extracts (VSE) 63.39 87.23 37.61
(Source: DGCI&S)
Segments that performed well in November 2018 vis‑‑a‑‑visNovember2017 (in Value Terms) Out of 6, 1panel recorded positive growth, in value terms. Panel, which recorded notable growth, and the
growth rate, is shown below:
Reasons for increase in the exports under panel Vegetable Saps & Extracts: Under panel “Vegetable Saps and Extracts”export of product Menthol crystal has increased significantly i.e. by
46.11%,achieving export of USD 76.24 Million during Apr‑Nov 2018 as compared to total export of USD 52.18 Million during Apr‑Nov 2017. The export has increased in case of countries like USA, Netherland, Germany, UK, Singapore, Nigeria, Russia, Thailand, Hong Kong, Philippines, Japan, Taiwan, France etc.
‑ The main reason for increase in the export of Menthol crystal is high selling price and low cost of
production. Menthol crystal is high priced product derived from mentha leaves. ‑ Menthol crystals have wide applications across food, chemical, cosmetics and Pharma applications. ‑ It has high demand in countries such as USA, Germany, UK, Netherland etc. ‑ Also, decrease in rupee value against US $ boosted exports of this commodity. The average rate of
rupee against US $ during Apr‑Nov 2017 was 64.52 and during Apr‑Nov 2018 the rate was 67.21.
4 | Page
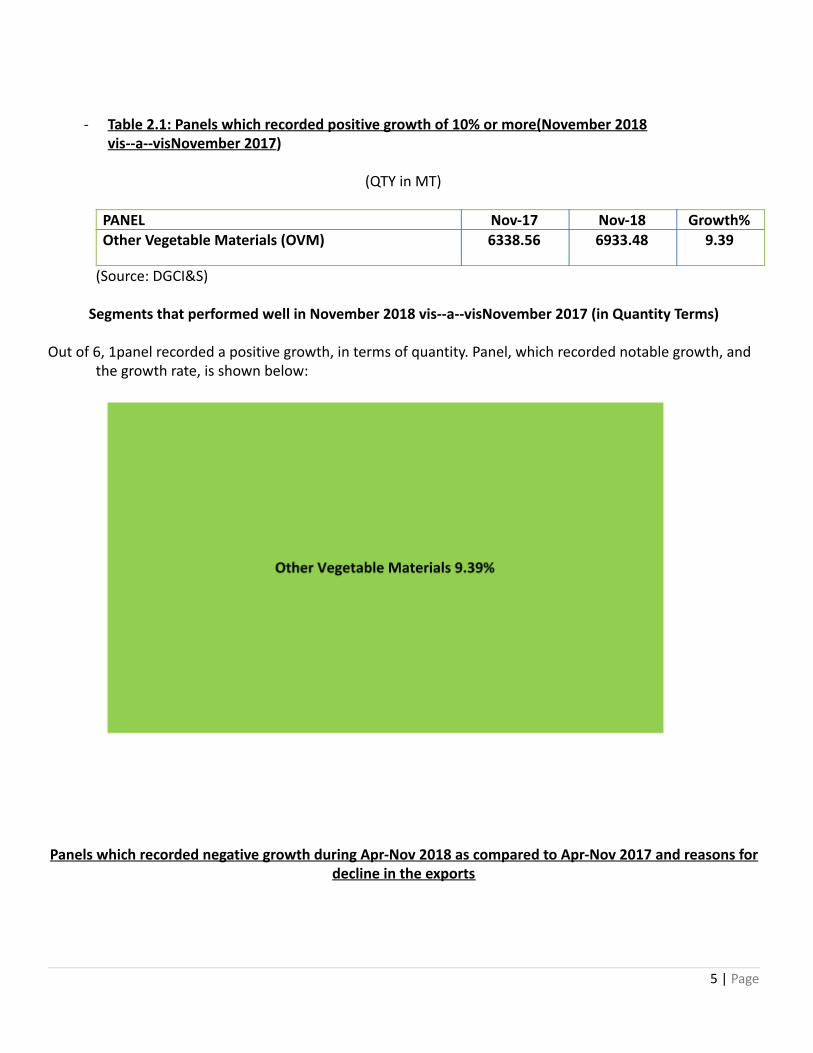
‑ Table 2.1: Panels which recorded positive growth of 10% or more(November 2018
vis‑‑a‑‑visNovember 2017 )
(QTY in MT)
PANEL Nov‑17 Nov‑18 Growth% Other Vegetable Materials (OVM) 6338.56 6933.48 9.39
(Source: DGCI&S)
Segments that performed well in November 2018 vis‑‑a‑‑visNovember 2017 (in Quantity Terms) Out of 6, 1panel recorded a positive growth, in terms of quantity. Panel, which recorded notable growth, and
the growth rate, is shown below:
Panels which recorded negative growth during Apr‑Nov 2018 as compared to Apr‑Nov 2017 and reasons for decline in the exports
5 | Page

PANEL Apr‑Nov‑17 – Value in USD Million
Apr‑Nov ‑18 – Value in USD Million
Growth%
Other Vegetable Materials 37.63 34.02 ‑9.59
Plant & Plant Portion 209.86 208.78 ‑0.51
Reasons for decline in exports in Apr‑Nov 2018 SHEFEXIL’s exports have decreased in Apr‑Nov 2018 as compared Apr‑Nov 2017 in panels viz. Plant and Plant
portion” and“Other Vegetable Materials”.
Export of “Psyllium husk (isobgul husk)” has decreased under panel “Plant & Plant Portion” which is majorly exported product under the said panel. Export of “Psyllium husk” has decreased in the countries such as; USA, Germany, Italy, France, Netherland, Poland, Sweden, Malaysia, Thailand, Philippines, Canada, Brazil, Colombia, Korea Republic etc,
Under panel, “Other Vegetable Materials” export of product “Cotton Linters” have decreased. Cotton linter is
majorly exported commodity under the said panel. Apart from Cotton Linter export of “Bidi Wrapper
Leaves” has also decreased. Export of Cotton linters have decreased in countries such as; China and Sri
Lanka. Whereas, export of Bidi Wrapper Leaves hasdecreased in Sri Lanka.
Reasons for decline in the exports are as under:
Decline in the production of Isabgol (psyllium husk) in the year 2018‑19:
Isabgol is majorly produced in states like Gujarat, Rajasthan and Madhya Pradesh. As per the recent article in
Times of India, Isabgol production has decreased in Gujarat.
( https://timesofindia.indiatimes.com/city/ahmedabad/isabgol‑sowing‑at‑snails‑pace/articleshow/671
86048.cms )
The production of the commodity is likely to decline by 30% in 2018‑19. As per Unjha APMC, Chairman,
Gaurang Patel, “isabgol sowing is expected to fall by 20% this season”.
As per the said article, Isabgol is majorly grown in Kutch and North Gujarat. Farmers’ aversion to Isabgol crop
in 2018‑19 is due to less rain fall and lower prices of the commodity in 2017‑18. It is also a risky crop
and a little change in weather conditions can ruin the crop. Prices of Isabgol were lower in 2017‑18 as
compared to 2016‑17, since, farmers did not get good price, they have moved away from Isabgol to
other crops.
Due to the above reasons production of Isabgol has decreased in 2018‑19 and hence, export of the said
commodity has also decreased.
Decline in the production of Cotton crop:
6 | Page

As per Cotton Association of India (CAI), Arrivals/production of Cotton crop up to 31.12.2018 is 115.97 lakh
bales of 170 kgs each (1971.49 Tons), whereas production of Cotton crop as on 31.12.2017 was 147.75
lakh bales of 170 kgs each (2511.75 Tons). This shows that production of Cotton crop has decreased by
31.78 lakh bales of 170 kgs each in the current period. The reason quoted by CAI for decrease in the
production of Cotton crop is as under:
Quote:
“The main reason for reduction in cotton crop is that farmers have uprooted their cotton plants in about
70‑80% cotton area due to moisture deficiency, due to less rain and as a result of which there is no
scope for 3rd and 4th pickings.”
Unquote
Due to lower production of Cotton crop our export of Cotton Linters has decreased in Apr‑Nov 2018 as
compared to Apr‑Nov 2017. For more details refer this link ( http://www.caionline.in )
Reasons for decline in the exports of Bidi wrapper leaves to Sri Lanka:
1. Bidi wrapper leaves are widely used to prepare Bidi for smoking. The main ingredient in Bidi is Tobacco. Tobacco is wrapped in tendu leaves (bidi wrapper leaves). As per Index of Industrial Production (IIP) of Sri Lanka for the month of November 2018, production of tobacco products has decreased by 20.9% in Sri Lanka in November 2018 as compared to same period of previous year.
2. Sri Lanka has signed the Framework Convention on Tobacco Control (FCTC) in 2003 in order to give priority towards protecting public health and address the demand and supply of tobacco through the international best practice WHO strategies. These strategies include monitoring tobacco use and prevention policies, protecting people from tobacco smoke, offering help to quit tobacco use, warning about the dangers of tobacco use, enforcing bans on tobacco advertising, promotion and sponsorship, and raising taxes on tobacco. Due to this production of tobacco related products are lowered in Sri Lanka.
3. Also, majority of population is smoking cigarates in srilanka as compared to bidi. And bidi smokers are shifting towards cigarates. Majority of the beedi consumers are consuming cigarettes but most cigarettes users are not consuming bidi. Hence, bidi smokers are declining in Sri Lanka
Due to the above reasons our export of bidi wrapper leaves to Sri Lanka has decreased
Top 25 Countries of SHEFEXILProducts
● USA continues to be the top export destination for SHEFEXIL products. USA’s percentage share
in India’s total export of SHEFEXIL products is 34.76% in Apr‑Nov 2018‑19. ● Other top export markets in Apr‑Nov 2018‑19 with their percentage share in total exports of
SHEFEXIL products are (belonging to top 10 export markets)China (7.11%), Germany (5.90%),
7 | Page

Hong Kong (5.03%), Singapore (3.72%), Japan (2.74%), UK (2.72%), Netherlands(2.69%), Russia (2.55%) and Iran (2.29%). In other words, exports are largely concentrated in USA.
● Panel‑wise Top Export Markets are listed in Table 3 as under:
Table 3 ‑ Panel‑wise Top 25 export markets(sorted based on exports made in April –November2018‑19 – in value terms)(Values in USD Million) (QTY in MT)
1. Fixed Vegetable Oil Cake & Others (FVOC)
Rank Export market Nov 2017 Nov2018 APR‑NOV2017‑18 APR‑NOV2018‑19
QTY. VAL. QTY. VAL. QTY. VAL. QTY. VAL.
1 U S A 475.78 0.89 693.65 1.25 4104.75 7.55 5813.71 10.58
2 MEXICO 0.00 0.00 17.56 0.08 539.60 0.84 1971.89 4.07
3 ITALY 180.83 0.23 225.76 0.60 1051.24 1.85 1671.00 3.35
4 IRAN 18.98 0.04 0.00 0.00 602.40 1.30 1412.49 2.99
5 MALAYSIA 107.76 0.15 336.07 0.49 1066.62 1.53 1405.12 2.25
6 KOREA RP 670.31 0.33 1210.16 0.26 11260.57 3.17 9100.44 2.16
7 JAPAN 605.14 0.43 403.58 0.40 2673.20 1.88 2237.77 2.14
8 U ARAB EMTS 108.82 0.18 138.99 0.31 786.15 1.37 970.96 1.97
9 AUSTRALIA 86.99 0.17 101.96 0.21 567.56 1.25 855.37 1.90
10 NETHERLAND 77.69 0.20 122.65 0.29 1139.52 1.71 1148.80 1.85
11 CHINA P RP 527.93 0.11 21.00 0.03 2271.04 0.92 962.96 1.61
12 U K 304.66 0.62 38.49 0.13 1143.74 2.55 536.19 1.40
8 | Page

13 SINGAPORE 21.43 0.11 24.58 0.07 230.74 0.77 368.76 1.20
14 FRANCE 87.81 0.13 43.04 0.18 302.37 0.75 326.55 1.15
15 BANGLADESH PR 559.09 0.17 136.37 0.07 14518.02 4.14 3998.80 1.12
16 CANADA 52.49 0.15 43.01 0.12 196.08 0.74 376.20 0.98
17 SRI LANKA DSR 93.92 0.15 76.01 0.04 406.78 0.74 707.19 0.92
18 NEPAL 174.85 0.05 552.99 0.08 1367.63 0.45 4284.99 0.85
19 TAIWAN 0.53 0.00 184.70 0.21 1030.82 1.11 955.29 0.80
20 NEW ZEALAND 40.69 0.08 130.81 0.21 197.14 0.33 451.41 0.77
21 SPAIN 15.78 0.04 13.33 0.03 216.33 0.46 281.27 0.67
22 THAILAND 108.10 0.14 0.39 0.00 234.10 0.32 478.00 0.60
23 GERMANY 72.72 0.08 19.09 0.02 573.72 0.77 209.76 0.49
24 BHUTAN 358.00 0.04 381.30 0.13 407.65 0.09 1456.99 0.49
25 KUWAIT 21.98 0.01 24.24 0.08 219.95 0.27 226.27 0.44
TOTAL EXPORT OF FVOC TO TOP 25 EXPORT MARKETS
4772.28 4.50 4939.73 5.29 47107.72 36.86 42208.18 46.75
TOTAL EXPORTS OF FVOC PANEL TO ALL EXPORT MARKETS
6036.13 5.69 5482.43 5.64 51617.37 42.03 46649.71 50.99
2. Guar Gum (GG)
Ran
k
Export market Nov ‑17 Nov ‑18 APR‑ NOV 2017‑18 APR‑ NOV 2018‑19
QTY. VAL. QTY. VAL. QTY. VAL. QTY. VAL.
1 U S A 16338.59 26.36 8375.62 14.91 144154.99 221.98 113191.81 195.66
9 | Page

2 CHINA P RP 1296.20 1.88 4703.18 7.02 14305.23 18.80 30123.18 42.84
3 RUSSIA 1131.00 1.84 1493.03 2.66 15888.45 24.57 17253.78 30.32
4 NORWAY 6496.00 3.65 4635.00 2.85 51093.00 28.20 45284.88 27.76
5 GERMANY 2234.00 2.96 705.00 1.14 14151.85 19.11 13919.18 23.18
6 NETHERLAND 3358.00 2.06 4672.00 2.61 16222.20 10.71 27821.53 17.38
7 ARGENTINA 698.00 1.08 195.00 0.35 6488.05 9.26 8834.00 15.57
8 U K 2167.00 1.60 336.00 0.48 9967.17 7.54 14639.60 11.47
9 ITALY 540.00 0.43 1860.00 1.78 6611.70 5.65 9864.66 9.27
10 CANADA 750.00 1.15 365.00 0.60 7033.04 10.61 3665.99 6.36
11 CHILE 180.00 0.29 1640.00 1.11 976.40 1.47 8786.00 5.99
12 BRAZIL 68.00 0.15 152.00 0.30 1760.93 3.09 2480.75 4.87
13 AUSTRALIA 398.00 0.56 382.00 0.60 2124.76 3.20 2555.45 4.12
14 JAPAN 183.27 0.55 87.20 0.32 2213.89 4.19 1421.56 4.00
15 FRANCE 192.00 0.31 214.00 0.37 1343.01 1.92 2850.63 3.28
16 IRAN 0.00 0.00 114.00 0.19 590.00 0.82 1518.70 2.88
17 INDONESIA 260.00 0.37 80.18 0.13 2342.15 2.53 1729.11 2.86
18 MEXICO 142.10 0.22 164.00 0.29 1368.60 2.20 1364.80 2.25
19 POLAND 106.00 0.15 374.00 0.32 1126.00 1.19 2422.90 2.10
20 SWITZERLAND 20.00 0.03 120.05 0.17 1163.00 1.50 1280.05 2.00
21 SOUTH AFRICA 140.00 0.17 82.90 0.13 1108.79 1.35 1324.90 1.94
22 DENMARK 0.00 0.00 40.00 0.07 4112.00 2.71 1812.00 1.89
23 THAILAND 177.00 0.28 267.00 0.26 1528.05 1.71 1519.86 1.88
24 MALAYSIA 165.75 0.27 47.99 0.09 796.61 1.24 1015.29 1.82
25 BELGIUM 675.00 0.43 142.00 0.22 1719.00 1.72 1246.50 1.71
10 | Page

TOTAL EXPORT OF GUAR
GUM TO TOP 25
EXPORT MARKETS 37715.91 46.79 31247.15 38.97 310188.87 387.27 317927.11 423.40
TOTAL EXPORTS OF
GUAR GUM TO ALL
EXPORT MARKETS 39801.02 49.14 32754.85 40.92 322036.60 401.39 330974.88 440.35
3. Other Vegetable Materials (OVMs)
Ran
kkk
kkk
kkk
Export market Nov‑17 Nov ‑18 APR‑ NOV 2017‑18 APR‑ NOV 2018‑19
QTY. VAL. QTY. VAL. QTY. VAL. QTY. VAL.
1 CHINA P RP 1262.09 0.63 2614.77 0.94 23016.61 11.40 17399.85 6.50
2 JAPAN 924.60 0.72 908.00 0.60 6332.78 5.26 7944.82 5.49
3 SRI LANKA DSR 313.70 1.18 263.19 0.84 1926.52 6.61 1720.22 5.07
4 BANGLADESH PR 909.06 0.23 490.06 0.26 5217.12 1.54 11321.81 3.35
5 U S A 41.67 0.17 108.57 0.13 693.00 0.71 1618.39 1.69
6 SAUDI ARAB 466.19 0.22 486.50 0.25 3599.75 1.68 3097.52 1.52
7 U K 47.83 0.06 32.97 0.07 562.10 1.05 665.54 1.01
8 PAKISTAN IR 101.41 0.22 32.89 0.08 663.89 1.97 600.43 0.99
9 NEPAL 89.71 0.12 35.79 0.03 458.74 0.55 672.18 0.80
10 KOREA RP 18.08 0.07 486.02 0.14 134.62 0.53 1657.53 0.62
11 MALAYSIA 64.70 0.07 62.07 0.08 197.31 0.31 314.11 0.61
12 U ARAB EMTS 106.05 0.07 142.40 0.09 776.92 0.58 901.35 0.61
13 GERMANY 24.87 0.08 15.06 0.03 188.86 0.41 313.14 0.55
14 SPAIN 15.83 0.03 39.46 0.07 139.70 0.31 194.35 0.43
15 MYANMAR 0.00 0.00 0.00 0.00 0.25 0.00 50.10 0.39
11 | Page

16 BHUTAN 1164.20 0.06 778.28 0.04 1804.90 0.11 7466.98 0.38
17 QATAR 78.72 0.03 36.29 0.02 186.17 0.09 590.17 0.33
18
VIETNAM SOC
REP 0.00 0.00 13.48 0.02 102.84 0.13 186.50 0.29
19 AUSTRALIA 8.09 0.02 75.53 0.05 127.87 0.18 182.24 0.24
20 KUWAIT 334.52 0.13 70.47 0.03 1339.90 0.49 514.03 0.22
21 TURKEY 20.00 0.03 34.00 0.06 322.10 0.30 130.60 0.18
22 SOUTH AFRICA 15.80 0.04 8.45 0.02 44.34 0.09 100.63 0.17
23 NETHERLAND 122.23 0.07 17.19 0.02 465.64 0.29 118.71 0.14
24 RUSSIA 0.00 0.00 4.17 0.01 63.19 0.09 76.05 0.14
25 AUSTRIA 7.66 0.02 0.00 0.00 17.34 0.06 52.41 0.12
TOTAL EXPORT OF OVMs
TO TOP 25 EXPORT
MARKETS 6137.01 4.27 6755.61 3.88 48382.46 34.74 57889.66 31.84
TOTAL EXPORTS OF
OVMs TO ALL EXPORT
MARKETS 6338.56 4.63 6933.48 4.19 50879.17 37.63 59297.33 34.02
4. Plant & Plant Portion (PPP)
Rank Export market Nov‑17 Nov‑18 APR‑ NOV2017‑18 APR‑ NOV2018‑19
QTY. VAL. QTY. VAL. QTY. VAL. QTY. VAL.
1 U S A 2258.69 11.18 1507.38 6.11 13616.45 63.82 17476.85 63.76
2 GERMANY 679.82 2.71 922.04 2.50 6823.13 29.55 7818.37 24.78
3 VIETNAM SOC
REP 691.60 1.19 622.76 1.04 6408.92 9.44 7910.41 19.60
4 CHINA P RP 212.30 1.07 623.60 1.18 1769.38 5.44 3192.22 9.63
12 | Page

5 PAKISTAN IR 182.09 0.97 114.08 0.33 1712.29 5.33 2911.01 9.14
6 ITALY 159.35 1.16 159.00 0.73 1486.97 9.76 1573.85 8.12
7 U K 161.52 0.63 134.76 0.67 1358.06 6.11 1313.04 6.67
8 AUSTRALIA 92.16 0.53 103.82 0.50 952.73 4.59 955.56 4.81
9 BELGIUM 37.21 0.16 93.60 0.31 922.66 3.81 1169.19 3.88
10 FRANCE 75.14 0.45 97.76 0.30 968.49 4.56 869.18 3.64
11 JAPAN 82.03 0.43 97.66 0.38 930.32 3.68 836.41 3.62
12 KOREA RP 78.16 0.49 89.61 0.33 711.63 3.62 825.68 2.96
13 U ARAB EMTS 320.49 0.38 196.19 0.26 3664.67 4.65 2540.64 2.92
14 BANGLADESH
PR 123.13 0.17 188.94 0.30 1632.49 3.17 1425.15 2.83
15 CANADA 162.15 0.43 130.94 0.32 748.16 2.62 936.81 2.70
16 MALAYSIA 106.66 0.32 73.31 0.19 804.65 3.17 756.46 2.51
17 IRAN 89.00 0.08 98.00 0.17 1543.32 3.02 1295.26 2.44
18 MEXICO 20.97 0.08 89.30 0.24 896.71 2.54 923.00 2.09
19 NETHERLAND 303.06 0.43 168.11 0.23 3137.95 3.71 1546.43 1.82
20 SAUDI ARAB 327.44 0.50 225.11 0.25 1643.41 2.13 1511.13 1.81
21 PHILIPPINES 341.30 0.20 405.95 0.31 1932.03 1.79 1527.47 1.72
22 IRELAND 20.00 0.17 36.05 0.22 156.25 1.30 224.36 1.63
23 AFGHANISTAN
TIS 20.00 0.15 20.00 0.11 318.10 2.49 289.36 1.62
24 SPAIN 23.30 0.19 3.69 0.01 509.74 2.04 459.79 1.46
25 SRI LANKA DSR 95.79 0.21 83.37 0.20 694.68 1.37 671.42 1.46
TOTAL EXPORT OF ‘PPP’
TO TOP 25 EXPORT 6663.36 24.28 6285.03 17.19 55343.19 183.71 60959.05 187.62
13 | Page

TOTAL EXPORTS OF
‘PPP’ TO ALL EXPORT
MARKETS
7814.80 27.84 7763.08 19.41 69117.96 209.86 73223.04 208.78
5. Shellac & Lac Based Products (SLBP)
Rank Export market Nov‑17 Nov‑18 APR‑ NOV2017‑18 APR‑ NOV2018‑19
QTY. VAL. QTY. VAL. QTY. VAL. QTY. VAL.
1 BANGLADESH 140.60 0.58 157.20 0.64 1001.60 4.25 1270.85 5.14
2 U S A 94.90 0.39 56.35 0.31 569.45 2.14 1045.55 4.14
3 PAKISTAN 154.40 0.58 123.45 0.40 967.41 3.60 950.20 3.44
4 CHINA 3.98 0.21 15.00 0.07 211.20 1.81 177.60 3.17
5 GERMANY 0.20 0.00 77.50 0.26 506.30 2.10 533.36 2.22
6 SWITZERLAND 8.00 0.17 5.40 0.06 54.00 1.28 51.40 1.64
7 IRAQ 66.00 0.27 62.50 0.21 278.00 1.08 399.50 1.51
8 INDONESIA 25.15 0.11 0.00 0.00 206.35 0.88 166.20 0.68
9 U K 0.00 0.00 0.00 0.00 49.25 0.38 85.69 0.66
10 EGYPT 12.00 0.05 0.00 0.00 179.75 0.67 166.08 0.59
11 SPAIN 29.63 0.15 18.00 0.09 99.63 0.55 131.43 0.58
12 HAITI 0.00 0.00 24.00 0.09 34.25 0.15 88.00 0.40
13 CANADA 0.80 0.00 0.00 0.00 96.43 0.34 96.45 0.39
14 ITALY 13.00 0.05 0.00 0.00 95.00 0.40 90.70 0.37
15 FRANCE 1.00 0.01 0.00 0.00 15.20 0.12 30.45 0.34
16 JAPAN 0.00 0.00 12.00 0.04 24.70 0.10 52.28 0.22
17 MEXICO 0.00 0.00 0.00 0.00 0.00 0.00 12.00 0.14
18 SAUDI ARAB 0.00 0.00 1.00 0.02 2.05 0.01 70.50 0.10
14 | Page

19 KENYA 11.50 0.05 0.00 0.00 23.50 0.11 18.00 0.09
20 TURKEY 3.10 0.02 0.00 0.00 18.45 0.09 13.45 0.08
21 TANZANIA 0.00 0.00 0.00 0.00 0.00 0.00 20.00 0.07
22 SOUTH AFRICA 5.00 0.02 0.00 0.00 11.00 0.07 7.50 0.06
23 KOREA 0.00 0.00 0.00 0.00 4.15 0.05 5.40 0.06
24 BRAZIL 0.00 0.00 0.00 0.00 11.08 0.07 4.08 0.04
25 URUGUAY 0.00 0.00 0.00 0.00 0.00 0.00 6.00 0.04
TOTAL EXPORT OF ‘SLBP’ TO TOP 25 EXPORT
569.25 2.67 552.40 2.20 4458.73 20.24 5492.66 26.17
TOTAL EXPORTS OF ‘SLBP’ TO ALL EXPORT MARKETS
577.95 2.72 556.50 2.22 4551.69 20.89 5529.67 26.42
6. Vegetable Saps & Extracts (VSE)
Rank Export market Nov‑17 Nov‑18 APR‑ NOV2017‑18 APR‑ NOV2018‑19
QTY. VAL. QTY. VAL. QTY. VAL. QTY. VAL.
1 U S A 777.37 24.60 804.58 23.78 6916.80 172.37 7044.97 196.07
2 HONG KONG 1.14 0.02 10.61 0.06 101.66 1.62 15722.10 67.93
3 SINGAPORE 111.97 2.01 220.22 29.34 908.22 11.20 1360.29 48.77
4 CHINA P RP 873.05 5.77 1148.91 3.98 8193.56 33.80 9197.22 32.83
5 GERMANY 245.17 3.74 340.60 3.58 2645.33 25.42 2429.01 28.89
6 IRAN 321.80 4.23 23.41 4.07 789.54 69.27 342.59 22.73
7 JAPAN 296.27 2.42 185.13 2.68 2622.79 18.89 2344.97 21.73
8 FRANCE 36.12 1.13 55.04 1.60 1097.65 11.67 733.82 18.03
9 U K 291.21 1.56 158.99 1.48 3387.00 13.52 2361.77 15.74
10 NETHERLAND 138.04 1.96 135.40 1.48 1592.78 12.85 1089.36 15.26
11 KOREA RP 714.67 1.82 682.06 1.73 4348.51 10.47 3217.63 12.22
15 | Page

12 U ARAB EMTS 161.35 0.75 290.18 0.67 3005.91 7.21 1841.93 7.75
13 AUSTRALIA 43.85 0.65 58.38 0.61 1121.25 7.52 513.87 7.64
14 MAURITIUS 4.82 0.00 5.93 0.00 165.88 0.15 76.10 6.75
15 INDONESIA 262.13 0.33 350.20 0.69 2270.35 2.72 2487.63 6.68
16 ITALY 9.51 0.76 50.64 1.35 1176.75 5.67 587.73 6.42
17 BRAZIL 103.05 0.73 90.74 0.81 1034.68 4.87 745.04 6.12
18 SPAIN 116.88 1.10 46.51 0.68 842.51 6.33 616.03 5.33
19 THAILAND 41.84 0.53 19.19 0.20 522.26 3.71 930.72 3.87
20 TAIWAN 78.43 0.37 483.89 0.38 3362.07 3.30 2981.51 3.76
21 VIETNAM SOC REP 318.90 0.18 167.20 0.18 14341.19 7.14 7208.01 3.65
22 SOUTH AFRICA 123.83 0.25 88.84 0.47 2040.88 2.68 2096.36 3.50
23 RUSSIA 206.20 0.66 50.87 0.80 876.80 2.98 483.25 3.26
24 MEXICO 65.86 0.19 77.90 0.41 457.13 1.71 676.01 3.19
25 CANADA 53.57 0.31 46.16 0.28 638.89 2.92 506.21 3.18
TOTAL EXPORT OF ‘VSE’ TO
TOP 25 EXPORT MARKETS 5397.03 56.07 5591.58 81.31 64460.39 439.99 67594.13 551.30
TOTAL EXPORTS OF ‘VSE’
TO ALL EXPORT MARKETS 8792.55 63.39 8389.54 87.23 94226.66 486.78 90228.80 596.95
(Source: DGCI&S)
Top 10 Destinations – Shefexil
Rank Export Markets Apr‑ Nov. 17 (Value in USD
Million)
Apr‑ Nov. 18 (Value in
USD Million)
% Growth in
1 U S A 468.57 471.90 0.71
2 CHINA P RP 72.17 96.58 33.83
16 | Page

3 GERMANY 77.36 80.11 3.55
4 HONG KONG 2.05 68.24 3233.79
5 SINGAPORE 12.44 50.50 305.94
6 JAPAN 34.00 37.20 9.40
7 U K 31.15 36.95 18.59
8 NETHERLAND 29.27 36.45 24.53
9 RUSSIA 28.32 34.58 22.11
10 IRAN 74.48 31.06 ‑58.30
Region Wise Exports Trend recorded in April –November2018‑19vis‑‑‑a‑‑‑visApril – November2017‑18
[Refer Annex‑IV and Table 4]
● NORTH AMERICA– Positive growth is registered in 4 out of 6 Panels during April‑November 2018‑19 in terms of value, except for export of GG& PPP whose exports slumped by 13%& 0.62%respectively in April‑November2018‑19 as compared to April‑November2017‑18.
There is alsoPositive growth is registered in 5 out of 6 Panels during April‑November 2018‑19 in terms of quantity, except for export of GG whose exports slumped by 22.51% in April‑ November 2018‑19 as compared to April‑ November 2017‑18.
● EU – Except for PPP& OVM, all the other Panels registered a positive growth in valueterms during
April‑November2018‑19 as compared to Apr‑November2017‑18. However, export ofPPP& OVM slumped by 19.29%& 1.32% respectively.
Export of products under the Panels VSE, PPP, FVOC and OVM declined in terms of quantity by 23.56%, 4.77%,5.35% and 11.29% respectively.
PPP and OVM were the only Panels which registered a negative growth in terms of both value as well as quantity.
● NE ASIA– All the Panels registered a positive growth in terms of value during April‑November2018‑19 as compared to April‑November2017‑18, except for FVOC and OVM which registered a negative growth of 5.87%and 26.60% respectively.Export ofVSE grew significantly during April‑November2018‑19 as compared to Apr‑November2017‑18 by 103.27% in terms of value.
Exports of FVOC, SLBP and OVM declined in terms of quantity during April‑ November 2018‑19 as compared to Apr‑ November 2017‑18.
● WEST AND EAST ASIA– Export of GG, FVOC, and SLBP products increased in value terms during
April‑November2018‑19 as compared to April‑November2017‑18. Export of VSE, OVM and PPPdeclined in value terms during April‑November2018‑19 as compared to April‑November2017‑18.
Except for GG, SLBP and FVOC, all the other 3 Panels registered a negative growth in terms of quantity exported.
17 | Page

● ASEAN – Export of products covered by all panels except SLBP, registered positive growth in terms of value,
during April‑November2018‑19 as compared to April‑November2017‑18, with highest growth in export of VSEproduct. Positive growth was registered in Panels PPP, FVOC and OVM in terms of quantity from April‑ November 2018‑19 as compared to April‑ November 2017‑18.
● LATIN AMERICA – Export of products covered by all panels except VSE &PPP registered positive growth in
value terms,during April‑November2018‑19 as compared to April‑November2017‑18. Export of VSEproducts declined by 32.72%in terms of quantity during April‑ November 2018‑19 as compared to April‑ November 2017‑18.
● CIS – Export of products covered by all panelsregistered positive growth in value terms during April‑November 2018‑19as compared to April‑ November2017‑18.However, negligible export is registeredin SLBP products in both the periods –i.e. April‑November2018‑19 and April‑November2017‑18. Quantity of exports of VSE and PPP products decreased by 32.93% and 22.42% respectively between April‑ November 2018‑19 as compared to April‑ November 2017‑18.
● SOUTH ASIA – Export of products covered by PPP and SLBP increased during April‑November2018‑19 as
compared to April‑November2017‑18. However, export of VSE, GG, FVOC and OVM products slumped in April‑November2018‑19 as compare to April‑November2017‑18.Low export of GG products (less than USD 1 Million in value terms) were observed in terms of value as well as quantity in both the periods.
Quantity of exports declined for all the Panels, except for SLBP and OVM, as there is increase of exports in terms quantity by 12.81% and 116.19% respectively in SLBP and OVM panels.
● AFRICA– Positive growth is registered for export of products in all the Panelsin value terms during April‑November2018‑19 as compared to April‑November2017‑18 except for export of SLBP and OVM.
Export of all the products except for GG and PPP showed a negative growth in terms of quantity exported during April‑ November 2018‑19 as compared to April‑ November 2017‑18.
Even though export of VSE products decreased by 13.01% in terms of quantity, it increased significantly by 100.71% in terms of value during April‑ November 2018‑19 as compared to April‑ November 2017‑18.
Table 4:Region‑wise export of SHEFEXIL Products in April – November 2017‑18, April – November2018‑19 and % Growth April‑November 2018‑19 over April – November2017‑18.
(Values in USD Million and Growth in %) (QTY in MT)
SR. NO.
PANEL REGION APR.‑NOV. 2017‑18 APR.‑NOV. 2018‑19 % Growth in APR.‑NOV. 2018‑19 over APR‑NOV.
2017‑18
Qty. in Thousand
Values in USD
Million
Qty. in Thousand
Values in USD
Million
Qty. in Thousand
Values in USD
Million
18 | Page

1 VEGETABLE SAPS & EXTRACTS
NORTH AMERICA 8,012.82 177.00 8,227.19 202.44 2.68 14.37
EU 12655.87 82.33 9673.56 96.75 ‑23.56 17.51
NE ASIA 18695.98 68.43 33531.56 139.1 79.35 103.27
WEST AND EAST ASIA 10905.09 90.76 8176.02 44.55 ‑25.03 ‑50.91
ASEAN 19318.01 28.97 13138.72 68.09 ‑31.99 135.04
LATIN AMERICA 1950.71 10.32 1312.47 9.59 ‑32.72 ‑7.07
CIS 1062.1 3.95 712.33 4.38 ‑32.93 10.89
SOUTH ASIA 8004.31 7 6715.36 6.57 ‑16.10 ‑6.14
AFRICA 6741.53 9.83 5864.45 19.73 ‑13.01 100.71
OTHERS 6881.21 7.66 2878.08 5.21 ‑58.17 ‑31.98
TOTAL VEGETABLE SAPS & EXTRACTS
94,227.63
486.25
90,229.74
596.41 ‑4.24 22.66
2 GUAR GUM & EXTRACTS
NORTH AMERICA 152556.63 234.79 118222.6 204.27 ‑22.51 ‑13.00
EU 59122.48 53.28 80086.48 74.56 35.46 39.94
NE ASIA 17616.22 24.82 32528.05 48.65 84.65 96.01
WEST AND EAST ASIA 5392.93 8.05 6448.04 11.24 19.56 39.63
ASEAN 5229.82 6.25 4887.1 7.61 ‑6.55 21.76
LATIN AMERICA 9648.81 14.54 20576.28 27.26 113.25 87.48
CIS 16328.54 25.28 17680.58 31.07 8.28 22.90
SOUTH ASIA 405.81 0.64 132.42 0.29 ‑67.37 ‑54.69
AFRICA 2036.89 2.74 2676.03 4.22 31.38 54.01
OTHERS 53698.5 30.98 47737.38 31.17 ‑11.10 0.61
19 | Page

TOTAL GUAR GUM & EXTRACTS
322,036.63
401.37
330,974.96
440.34 2.78 9.71
3 PLANT & PLANT PORTION
NORTH AMERICA 15261.32 68.98 19336.66 68.55 26.70 ‑0.62
EU 17592.14 70.81 16752.12 57.15 ‑4.77 ‑19.29
NE ASIA 4164.11 13.79 5594.41 17.7 34.35 28.35
WEST AND EAST ASIA 10258.86 17.62 8765.85 14.64 ‑14.55 ‑16.91
ASEAN 10458.79 17.42 11817.51 27.06 12.99 55.34
LATIN AMERICA 1007.09 2.99 1019.25 2.84 1.21 ‑5.02
CIS 420.63 0.71 326.33 0.82 ‑22.42 15.49
SOUTH ASIA 8173.49 14.05 7410.2 16.15 ‑9.34 14.95
AFRICA 1100.91 2.25 1741.78 2.76 58.21 22.67
OTHERS 681.09 1.1 459.58 0.85 ‑32.52 ‑22.73
TOTAL PLANT & PLANT PORTION
69,118.43
209.72
73,223.69
208.52 5.94 ‑0.57
4 FIXED VEGETABLE OIL,CAKE & OTHERS
NORTH AMERICA 4840.43 9.13 8161.8 15.63 68.62 71.19
EU 4675.78 8.59 4425.72 9.4 ‑5.35 9.43
NE ASIA 17258.96 7.16 13268.26 6.74 ‑23.12 ‑5.87
WEST AND EAST ASIA 3912.3 5.91 4899.78 9.33 25.24 57.87
ASEAN 2003.4 3.47 2643.66 4.31 31.96 24.21
LATIN AMERICA 132.66 0.4 173.41 0.57 30.72 42.50
CIS 33.12 0.18 72.74 0.25 119.63 38.89
SOUTH ASIA 16902.14 5.5 11774.32 3.48 ‑30.34 ‑36.73
AFRICA 1658.62 0.88 1216.71 1.04 ‑26.64 18.18
20 | Page

OTHERS 200.18 0.43 13.61 0.04 ‑93.20 ‑90.70
TOTAL FIXED VEGETABLE OIL,CAKE & OTHERS
51,617.59
41.65
46,650.01
50.79 ‑9.62 21.94
5 SHELLAC & LAC BASED PRODUCTS
NORTH AMERICA 665.88 2.48 1154.00 4.67 73.31 88.43
EU 766.87 3.57 873.15 4.17 13.86 16.72
NE ASIA 247.48 2.01 243.19 3.48 ‑1.73 73.63
WEST AND EAST ASIA 305.39 1.27 476.47 1.66 56.02 29.96
ASEAN 215.85 0.97 169.63 0.71 ‑21.41 ‑27.10
LATIN AMERICA 82.13 0.45 109.08 0.58 32.81 29.07
CIS 0.00 0.00 0.10 0.00 100.00 100.00
SOUTH ASIA 1969.01 7.85 2221.15 8.58 12.81 9.38
AFRICA 223.59 0.91 218.05 0.86 ‑2.48 ‑5.80
OTHERS 74.45 1.39 64.85 1.72 ‑12.89 23.91
TOTAL SHELLAC & LAC BASED PRODUCTS
4,550.65
20.89
5,529.67
26.42 21.51 26.47
6 OTHER VEGETABLE MATERIALS
NORTH AMERICA 776.58 0.88 1706.29 1.83 119.72 107.95
EU 1938.05 3.03 1719.3 2.99 ‑11.29 ‑1.32
NE ASIA 29555.64 17.33 27050.66 12.72 ‑8.48 ‑26.60
WEST AND EAST ASIA 6619.72 3.49 5487.31 3.13 ‑17.11 ‑10.32
ASEAN 486.81 0.65 732.87 1.51 50.55 132.31
LATIN AMERICA 16.64 0.1 25.9 0.11 55.65 10.00
CIS 105.04 0.16 111.36 0.21 6.02 31.25
SOUTH ASIA 10079.55 10.87 21790.69 10.6 116.19 ‑2.48
21 | Page

AFRICA 978.05 0.64 529.3 0.52 ‑45.88 ‑18.75
OTHERS 323.26 0.31 143.8 0.21 ‑55.52 ‑32.26
TOTAL OTHER VEGETABLE MATERIALS
50,879.34
37.46
59,297.48
33.83 16.55 ‑9.69
GRAND TOTAL GRAND TOTAL 592,430.27 1,197.3
4
605,905.55 1,356.31 2.27 13.28
(Source: DGCI&S)
ANNEXES:
● Annex –I : Graphical presentation indicating the trend of Shefexilproduct exports based on the
absolute value of exports registered in April–November2018‑19vis –a –
visApril–November2017‑18.
● Annex – II: Table indicating the trend of Shefexil product exports during November2018 vis‑a‑
visNovember2017 and trend Y‑O‑Y basis.
● Annex – III: Top 25 countries of Shefexil’s top export productsduring the period
April–November2018‑19.
● Annex ‑ IV: Regional distribution of Shefexil products during April–November2018‑19.
● Annex – V: Report on Exchange Rate Volatility during the period April–November2018‑19.
22 | Page

Annex‑ ‑I
Trend of Shefexil Exports Trend in Monthly Export of SHEFEXIL products betweenApril‑November 2017‑18 and April‑November
2018‑19
Export made during Apr‑Nov in FY 2017‑18 and 2018‑19 in USD Million
23 | Page

(Source: DGCI&S) Report of Export Growth in SHEFEXIL’s Product Panels:
[Values in USD Million]
PANEL Fixed Vegetable Oil Cake & Others
Guar Gum Other Vegetable Materials
Plant & Plant
Portion
Shellac & Lac Based Products
Vegetable Saps & Extracts
Total
APRIL 2017 5.44 63.7 5.98 22.87 0.02 53.22 151.23 APRIL 2018 5.52 57.88 3.87 25.61 0.38 71.47 164.92 MAY 2017 5.15 66.74 4.51 28.16 0.3 55.46 160.32 MAY 2018 5.62 72.7 4.66 32.9 0.41 63.1 179.39 JUNE 2017 4.56 50.57 3.74 27.81 0.22 63 149.90 JUNE 2018 5.88 54.26 4.15 30.16 0.11 71.55 166.31 JULY 2017 4.49 40.61 4.29 26.03 0.01 70.53 145.96 JULY 2018 6.62 54.52 5.03 25.18 1.04 81.44 173.83
AUGUST 2017 4.46 49.32 4.93 25.08 3.39 65.76 148.73 AUGUST 2018 6.93 61.28 4.28 27.30 3.39 75.54 175.39
SEPTEMBER 2017 5.81 46.15 4.58 25.40 2.68 59.29 141.25 SEPTEMBER 2018 6.85 54.72 3.33 24.49 2.69 71.11 159.86 OCTOBER 2017 4.46 35.14 4.94 24.10 3.18 56.12 127.94 OCTOBER 2018 5.90 44.06 4.13 21.92 4.99 75.48 156.48
NOVEMBER 2017 5.69 49.14 4.63 27.84 2.72 63.39 153.41 NOVEMBER 2018 5.64 40.92 4.19 19.41 2.22 87.23 159.61 APRIL‑ NOVEMBER
2017‑18 42.03 401.39 37.63 209.86 20.89 486.78 1198.58
APRIL‑ NOVEMBER 2018‑19
50.99 440.35 34.02 208.78 26.42 596.95 1357.51
(Source: DGCI&S)
Annex‑ ‑II
Trend in Shefexil Product Panel Exports in November2018& for April‑November2018‑19 (Values in USD Million)
SL. NO.
PANNEL NOVEMBER, 2017
NOVEMBER, 2018
% GROWTH IN NOVEMBER. 2018 OVERNOVEMBER.
2017
APRIL‑NOVEMBER2017‑18
APRIL‑NOVEMBER2018‑19
% GROWTH IN APR‑ NOV
2018‑19 OVER
APR‑NOV 2017‑18
24 | Page

1 Vegetable Saps &
Extracts 63.39 87.23 37.61 486.78 596.95 22.63
2 Guar Gum 49.14 40.92 ‑16.73 401.39 440.35 9.71
3 Plant and Plant
Portion (HERBS) 27.84 19.41 ‑30.28 209.86 208.78 ‑0.51
4 Fixed Vegetable
Oil, Cake & Others 5.69 5.64 ‑0.88 42.03 50.99 21.32
5 Shellac & Lac
Based Products 2.72 2.22 ‑18.16 20.89 26.42 26.47
6 Other Vegetable
Materials 4.63 4.19 ‑9.50 37.63 34.02 ‑9.59
Total Exports of SHEFEXIL Products
153.41 159.61 4.05 1198.58 1357.51 13.26
(Source: DGCI&S)
Annex ‑‑‑ III Top 25export markets of SHEFEXIL products
Rank Export Markets Apr‑Nov.
2017‑18 Qty. in MT
Apr‑ Nov. 17‑18 Value USD Mn
Apr‑ Nov. 2018‑19 Qty.
in MT
Apr‑ Nov.18‑19 Value USD Mn
% Growth in Apr‑ Nov.
2018‑19 Qty. in MT
% Growth in Apr‑ Nov.18‑19 Value USD Mn
1 U S A 170055.44 468.57 146191.28 471.90 ‑14.03 0.71
2 CHINA P RP 49767.02 72.17 61053.03 96.58 22.68 33.83
3 GERMANY 24889.19 77.36 25222.82 80.11 1.34 3.55
4 HONG KONG 303.55 2.05 15865.76 68.24 5126.74 3233.79
5 SINGAPORE 1278.25 12.44 1876.52 50.50 46.80 305.94
25 | Page

6 JAPAN 14797.68 34.00 14837.81 37.20 0.27 9.40
7 U K 16467.32 31.15 19601.83 36.95 19.03 18.59
8 NETHERLAND 22558.09 29.27 31724.86 36.45 40.64 24.53
9 RUSSIA 17206.33 28.32 18091.33 34.58 5.14 22.11
10 IRAN 3590.87 74.48 4569.84 31.06 27.26 ‑58.30
11 NORWAY 55996.07 31.04 46327.70 28.49 ‑17.27 ‑8.22
12 ITALY 10436.05 23.36 13836.63 27.62 32.58 18.26
13 FRANCE 3772.40 19.18 4832.05 26.52 28.09 38.23
14 VIETNAM SOC REP 21347.06 17.47 15870.85 24.12 ‑25.65 38.12
15 KOREA RP 17152.03 18.98 15397.06 19.12 ‑10.23 0.71
16 AUSTRALIA 4912.17 16.88 5062.99 18.71 3.07 10.86
17 ARGENTINA 6783.94 10.45 9014.38 17.07 32.88 63.27
18 PAKISTAN IR 5200.25 12.52 7855.39 15.64 51.06 24.95
19 U ARAB EMTS 8616.61 14.59 6895.70 14.39 ‑19.97 ‑1.33
20 BANGLADESH PR 23462.98 14.64 19476.64 14.03 ‑16.99 ‑4.17
21 CANADA 8789.18 17.37 5652.42 13.72 ‑35.69 ‑21.04
22 BRAZIL 3277.53 9.27 3854.27 12.58 17.60 35.77
23 MEXICO 3269.04 7.32 4964.84 11.77 51.87 60.76
24 INDONESIA 5452.87 7.02 5130.26 11.51 ‑5.92 63.89
25 SPAIN 2508.06 10.50 3738.00 10.17 49.04 ‑3.15
Total exports to Top 25 export markets 501889.95 1060.39 506944.24 1209.02 1.01 14.02
Total Export to all export markets
592429.41 1198.58 605903.43 1357.51 2.27 13.26
26 | Page

% Share of export to top 25 export market in Total exports to all export
markets
84.72 88.47 83.67 89.06
(Source: DGCI&S)
Annex‑ ‑IV
Region‑ Wise Export Trend (% Growth)
SR. NO.
PANEL REGION
% Growth in APR.‑NOV. 2018‑19 over APR.‑NOV. 2017‑18
Qty. in Thousand Values in USD Million
1 VEGETABLE SAPS &
EXTRACTS
NORTH AMERICA 2.68 14.37
EU ‑23.56 17.51
NE ASIA 79.35 103.27
WEST AND EAST ASIA ‑25.03 ‑50.91
ASEAN ‑31.99 135.04
LATIN AMERICA ‑32.72 ‑7.07
CIS ‑32.93 10.89
SOUTH ASIA ‑16.10 ‑6.14
AFRICA ‑13.01 100.71
OTHERS ‑58.17 ‑31.98
TOTAL VEGETABLE SAPS & EXTRACTS
‑4.24 22.66
2 GUAR GUM & EXTRACTS
NORTH AMERICA ‑22.51 ‑13.00
EU 35.46 39.94
NE ASIA 84.65 96.01
WEST AND EAST ASIA 19.56 39.63
27 | Page

ASEAN ‑6.55 21.76
LATIN AMERICA 113.25 87.48
CIS 8.28 22.90
SOUTH ASIA ‑67.37 ‑54.69
AFRICA 31.38 54.01
OTHERS ‑11.10 0.61
TOTAL GUAR GUM & EXTRACTS 2.78 9.71
3 PLANT & PLANT PORTION
NORTH AMERICA 26.70 ‑0.62
EU ‑4.77 ‑19.29
NE ASIA 34.35 28.35
WEST AND EAST ASIA ‑14.55 ‑16.91
ASEAN 12.99 55.34
LATIN AMERICA 1.21 ‑5.02
CIS ‑22.42 15.49
SOUTH ASIA ‑9.34 14.95
AFRICA 58.21 22.67
OTHERS ‑32.52 ‑22.73
TOTAL PLANT & PLANT PORTION 5.94 ‑0.57
4 FIXED VEGETABLE
OIL,CAKE & OTHERS
NORTH AMERICA 68.62 71.19
EU ‑5.35 9.43
NE ASIA ‑23.12 ‑5.87
WEST AND EAST ASIA 25.24 57.87
ASEAN 31.96 24.21
28 | Page

LATIN AMERICA 30.72 42.50
CIS 119.63 38.89
SOUTH ASIA ‑30.34 ‑36.73
AFRICA ‑26.64 18.18
OTHERS ‑93.20 ‑90.70
TOTAL FIXED VEGETABLE OIL,CAKE & OTHERS
‑9.62 21.94
5 SHELLAC & LAC BASED
PRODUCTS
NORTH AMERICA 73.31 88.43
EU 13.86 16.72
NE ASIA ‑1.73 73.63
WEST AND EAST ASIA 56.02 29.96
ASEAN ‑21.41 ‑27.10
LATIN AMERICA 32.81 29.07
CIS 100.00 100.00
SOUTH ASIA 12.81 9.38
AFRICA ‑2.48 ‑5.80
OTHERS ‑12.89 23.91
TOTAL SHELLAC & LAC BASED PRODUCTS
21.51 26.47
6 OTHER VEGETABLE
MATERIALS
NORTH AMERICA 119.72 107.95
EU ‑11.29 ‑1.32
NE ASIA ‑8.48 ‑26.60
WEST AND EAST ASIA ‑17.11 ‑10.32
ASEAN 50.55 132.31
LATIN AMERICA 55.65 10.00
29 | Page

CIS 6.02 31.25
SOUTH ASIA 116.19 ‑2.48
AFRICA ‑45.88 ‑18.75
OTHERS ‑55.52 ‑32.26
TOTAL OTHER VEGETABLE MATERIALS
16.55 ‑9.69
GRAND TOTAL 2.27 13.28
(Source: DGCI&S)
Annex‑ ‑V
Report on Exchange Rate Volatility during April –November2018‑19
Following table shows Appreciation and Depreciation of Currencies of India’s major Export Markets, in percentage terms and India’s FTA status with the same. This is calculated based on the exchange rate of currencies on the first and last trading day of the period April – November2018‑19.
Sl. No.
Country Currency Name
1 st Apr., 2018
30 th Nov. , 2018
AP/DP (%) Net Result – AP/DP
India's FTA with these Countries
1 Afghanistan Afghan Afghani
70.05 76.57 ‑8.51 DP
SAFTA
2 Bangladesh Bangladeshi Taka
84.10 85.69 ‑1.86 DP
SAFTA
3 Chile Chilean Peso 604.92 672.10 ‑10.00 DP
India –Chile PTA
4 China Chinese Yuan
6.29 6.96 ‑9.63 DP
India and China are member countries of APTA. China is one of the
30 | Page

member countries of RCEP, which is under negotiation.
5 EU Euro 0.81 0.88 ‑8.28
DP No FTA at present. India‑EU BTIA is under negotiation
6 UK British Pound
0.71 0.78 ‑9.33 DP
No FTA at present. India‑EU BTIA is under negotiation. Once BREXIT is implemented, there is possibility of separate FTA with UK.
7 Switzerland Swiss Franc 0.96 1.00 ‑4.08 DP
No FTA at present
8 Taiwan Taiwan New Dollar
29.14 30.83 ‑5.47 DP
No FTA at present
9 Turkey Turkish Lira 3.94 5.24 ‑24.79 DP
Turkey gives GSP benefits
10 Mauritius Mauritian Rupee
33.95 35.10 ‑3.27 DP
No FTA at present
11 UAE Emirati Dirham
3.67 3.67 ‑0.08 DP
No FTA at present. India‑GCC FTA is under negotiation
12 Nepal Nepalese Rupee
104.60 111.99 ‑6.60 DP
SAFTA since 01.07.2006
13 Kenya Kenyan Shilling
101.00 102.60 ‑1.56 DP
No FTA at present
14 Viet Nam Vietnamese Dong 22820.00 23324.00 ‑2.16
DP
Viet Nam is one of the member countries of RCEP, which is under negotiation
15 Jordan Jordanian Dinar
0.71 0.71 ‑0.34 DP
No FTA at present
16 Pakistan Pakistani Rupee
115.65 141.00 ‑17.98 DP
SAFTA
17 Qatar Qatari Riyal 3.64 3.65 ‑0.40
DP No FTA at present. India‑GCC FTA is under negotiation.
18 Uruguay Uruguayan Peso
28.39 32.24 ‑11.94 DP
India‑MERCOSUR PTA
19 Iraq Iraqi Dinar 1184.00 1200.12 ‑1.34 DP
No FTA at present
20 South Korea South Korean Won
1070.50 1121.05 ‑4.51 DP
APTA since 22.07.2005 and
31 | Page

India‑S.Korea CEPA since 01.01.2010. S. Korea is one of the member countries of RCEP, which is under negotiation
21 Mexico Mexican Peso 18.20 20.47 ‑11.09 DP
No FTA at present
22 Japan Japanese Yen
106.43 113.74 ‑6.43 DP
India‑Japan CEPA since 01.08.2011. Japan is one of the member countries of RCEP, which is under negotiation.
23 Saudi Arabia Saudi Arabian Riyal
3.75 3.75 ‑0.11
DP
No FTA at present. India‑GCC FTA is under negotiation.
24 Australia Australian Dollar
1.30 1.37 ‑4.81 DP
No FTA at present. Australia is one of the member countries of RCEP, which is under negotiation
25 New Zealand New Zealand Dollar
1.38 1.45 ‑4.92 DP
No FTA at present. New Zealand is one of the member countries of RCEP, which is under negotiation
S26 South Africa South African Rand 11.86 13.91 ‑14.72
DP
No FTA at present. India‑SACU PTA is under negotiation
27 Brazil Brazilian Real 3.31 3.87 ‑14.43 DP
India‑MERCOSUR PTA
28 India Indian Rupee 65.18 69.59 ‑6.34 DP
NA
[Source:Appreciation and depreciation of currencies are calculated based on Exchange Rates of 01.04.2018 and 30.11.2018. Exchange rates are taken from https://economictimes.indiatimes.com/markets/forex Note: AP – Appreciation | DP – Depreciation]
Abbreviations referred in table:
● APTA ‑ Asia Pacific Trade Agreement
32 | Page

● ASEAN ‑ Association of Southeast Asian Nations ● BTIA ‑ Broad Based Trade and Investment Agreement (BTIA) ● CECA ‑ Comprehensive Economic Cooperation Agreement ● CEPA ‑ Comprehensive Economic Partnership Agreement (CEPA) ● FTA ‑ Free Trade Agreement (FTA) ● GCC ‑ Gulf Cooperation Council (GCC) ● RCEP ‑ Regional Comprehensive Economic Partnership (RCEP) ● SACU ‑ Southern African Customs Union (SACU)]
If currency of a country depreciates, import becomes costlier against USD.
If currency of country appreciates, import becomes cheaper against USD. If Indian currency is depreciating, gains of currency depreciation can be passed on to the buyer
(importer). But if the importing country’s currency depreciates more than Indian currency (in case of export from India) then even after passing gains due to depreciation by Indian exporter to the importer, landed cost of import still remain higher. Here, FTA helps. FTAs/PTAs/CECAs/CEPAs provide preferential treatment to Indian Origin Goods in Export market, which makes landed cost of import cheaper.
Exporters of the SHEFEXIL’s products therefore have to study their export markets in terms of currency appreciation and depreciation along with tariff preferences available under FTAs/PTAs/CECAs/CEPAs.
*****
33 | Page