EXPORTS OF SERVICES AND OFFSHORE OUTSOURCING
132
EXPORT-IMPORT BANK OF INDIA OCCASIONAL PAPER NO. 156 EXPORTS OF SERVICES AND OFFSHORE OUTSOURCING: AN EMPIRICAL INVESTIGATION IN THE INDIAN CONTEXT © Export-Import Bank of India July 2012 EXIM Bank’s Occasional Paper Series is an attempt to disseminate the findings of research studies carried out in the Bank. The results of research studies can interest exporters, policy makers, industrialists, export promotion agencies as well as researchers. However, views expressed do not necessarily reflect those of the Bank. While reasonable care has been taken to ensure authenticity of information and data, EXIM Bank accepts no responsibility for authenticity, accuracy or completeness of such items. This study is based on the award winning entry for EXIM Bank International Economic Development Research Annual (IEDRA) Award 2011 for the doctoral dissertation titled “Exports of Services and Offshore Outsourcing: An Empirical Investigation in the Indian Context”, submitted to the Indian Institute of Technology Bombay, Mumbai by Dr. Brijesh Pazhayathodi, Assistant Advisor in Department of Economic and Policy Research, Reserve Bank of India (RBI), Bangalore. The dissertation was written under the supervision of Prof. Pushpa Trivedi, IIT Bombay. Dr. Rajeev Jain, RBI was the external supervisor. The views expressed here are those of the author and do not necessarily reflect those of the Export-Import Bank of India or RBI.
-
Upload
khangminh22 -
Category
Documents
-
view
0 -
download
0
Transcript of EXPORTS OF SERVICES AND OFFSHORE OUTSOURCING

1
EXPORT-IMPORT BANK OF INDIA
OCCASIONAL PAPER NO. 156
EXPORTS OF SERVICES AND OFFSHORE OUTSOURCING: AN EMPIRICAL
INVESTIGATION IN THE INDIAN CONTEXT
© Export-Import Bank of IndiaJuly 2012
EXIM Bank’s Occasional Paper Series is an attempt to disseminate the findings of research studies carried out in the Bank. The results of research studies can interest exporters, policy makers, industrialists, export promotion agencies as well as researchers. However, views expressed do not necessarily reflect those of the Bank. While reasonable care has been taken to ensure authenticity of information and data, EXIM Bank accepts no responsibility for authenticity, accuracy or completeness of such items.
This study is based on the award winning entry for EXIM Bank International Economic Development Research Annual (IEDRA) Award 2011 for the doctoral dissertation titled “Exports of Services and Offshore Outsourcing: An Empirical Investigation in the Indian Context”, submitted to the Indian Institute of Technology Bombay, Mumbai by Dr. Brijesh Pazhayathodi, Assistant Advisor in Department of Economic and Policy Research, Reserve Bank of India (RBI), Bangalore. The dissertation was written under the supervision of Prof. Pushpa Trivedi, IIT Bombay. Dr. Rajeev Jain, RBI was the external supervisor. The views expressed here are those of the author and do not necessarily reflect those of the Export-Import Bank of India or RBI.

2

3
CONTENTS
Page No.
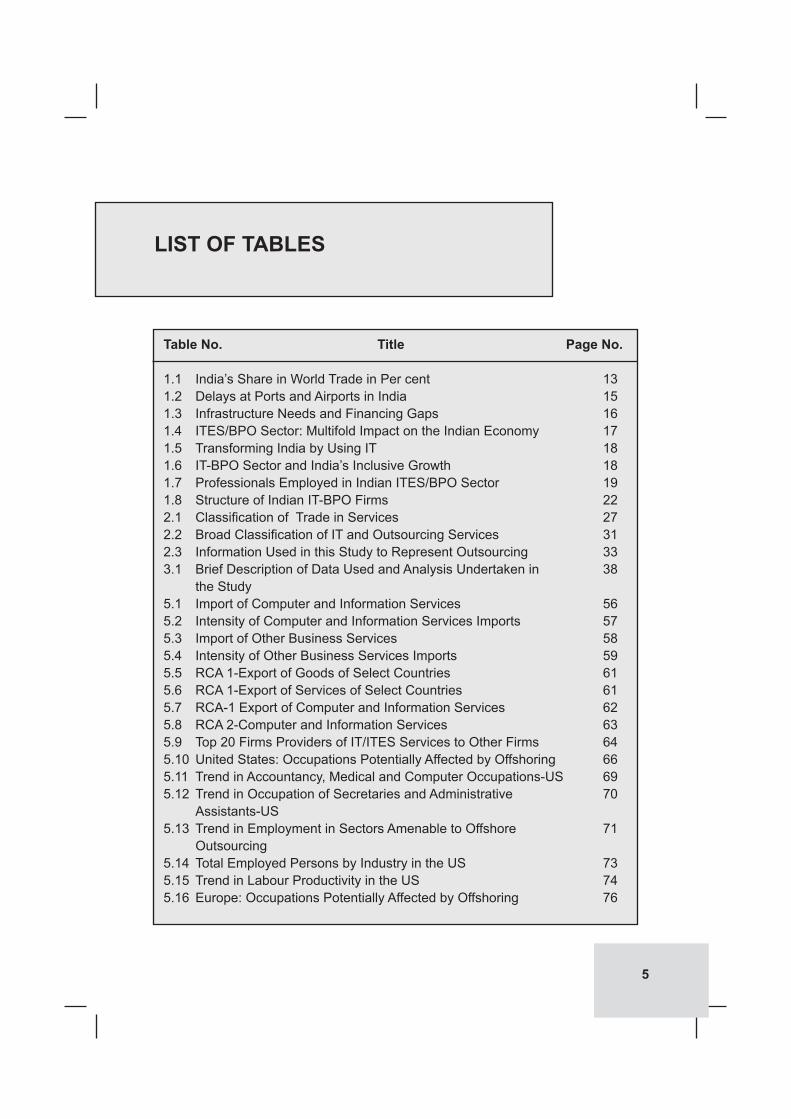
List of Tables 5
List of Figures 7
Executive Summary 9
1. Introduction 11
2. Offshore Outsourcing of Services: The Conceptual Framework 25
3. Research Methodology 37
4. Trade in Services: Theoretical and Empirical Literature 42
5. Outsourcing from India: An Empirical Analysis 54
6. Conclusions and Policy Suggestions 101
Appendix 105
References 108

4
5
Table No. Title Page No.
1.1 India’s Share in World Trade in Per cent 131.2 Delays at Ports and Airports in India 151.3 Infrastructure Needs and Financing Gaps 161.4 ITES/BPO Sector: Multifold Impact on the Indian Economy 171.5 Transforming India by Using IT 181.6 IT-BPO Sector and India’s Inclusive Growth 181.7 Professionals Employed in Indian ITES/BPO Sector 191.8 Structure of Indian IT-BPO Firms 222.1 Classification of Trade in Services 272.2 Broad Classification of IT and Outsourcing Services 312.3 Information Used in this Study to Represent Outsourcing 333.1 Brief Description of Data Used and Analysis Undertaken in 38 the Study5.1 Import of Computer and Information Services 565.2 Intensity of Computer and Information Services Imports 575.3 Import of Other Business Services 585.4 Intensity of Other Business Services Imports 595.5 RCA 1-Export of Goods of Select Countries 615.6 RCA 1-Export of Services of Select Countries 615.7 RCA-1 Export of Computer and Information Services 625.8 RCA 2-Computer and Information Services 635.9 Top 20 Firms Providers of IT/ITES Services to Other Firms 645.10 United States: Occupations Potentially Affected by Offshoring 665.11 Trend in Accountancy, Medical and Computer Occupations-US 695.12 Trend in Occupation of Secretaries and Administrative 70 Assistants-US 5.13 Trend in Employment in Sectors Amenable to Offshore 71 Outsourcing5.14 Total Employed Persons by Industry in the US 735.15 Trend in Labour Productivity in the US 745.16 Europe: Occupations Potentially Affected by Offshoring 76
LIST OF TABLES

6
Table No. Title Page No.
5.17 Growth in Employment in UK (Whole Economy) 775.18 Growth Rate of Employment in Business Activities - UK 785.19: Number of Enterprises in UK in Computer Activities & 79 Other Business Activities5.20 Cross-Border Services Trade of United States-2008 815.21 India’s ITES Exports and Current Account Receipts 825.22 India’s Software and Business Service Exports and 84 Forex Reserves 5.23 Salary as Percentage of Total Expenses ( 106 ITES/BPO firms) 855.24 List of Variables 865.25 Correlation of Major Items under India’s Current Account with 86 US GDP5.26 Amplitude of Cyclical Components of Current Account Receipts 865.27 Coefficient of Variation of Major Indices of BSE 875.28 Data Sources for Cointegration Analysis 895.29 ADF Unit Root Tests for the Data Series Used in the Study (a) 905.30 ADF Unit Root Tests for the Data Series Used in the Study (b) 905.31 Determinants of Software Exports 925.32 Residuals of the Estimated Equation 925.33 Panel Data Analysis-Variables 935.34 Expected Relationship between Explanatory Variables and 94 Foreign Exchange Earnings of the ITES Firms 5.35 Determinants of Export Intensity of ITES/BPO : 95 Fixed Effect Model (a)5.36 Determinants of Export Intensity of ITES/BPO: 95 Fixed Effect Model (b)5.37 Fixed Effect Models 1 and 2 –A Comparison 965.38 Revenue Foregone on Account of Export Concessions under 97 Different Schemes 5.39 Industry wise Effective Tax Rate (in per cent) 98

7
Figure No. Title Page No.
1.1a Miscellaneous Service Exports- India (1990-91) 141.1b Miscellaneous Service Exports- India (2008-09) 141.2 Others Services Export - World (2008) 144.1 Gains from Outsourcing 455.1 Trend in RCA of India (Goods and Services) 625.2 Trend in Import of Computers & Information Services and 72 Other Business Services and Employment in Select Sectors in US 5.3 Productivity Trend in US Non-Farm Business 755.4 Trend in Import of Computers & Information Services and 79 Other Business Services and Number of Enterprises in Select Sectors in UK5.5 Unemployment in US and UK 805.6 Importance to Firms of Factors in Choosing Outsourcing Provider 815.7 Growth in India’s Services Exports 835.8 Movement in BSE-index 88
LIST OF FIGURES

8

9
Increase in international outsourcing or exports of Information Technology Enabled Services/Business Process Outsourcing (ITES/BPO) from India has stimulated services export from India which is now around 2.7 per cent of the global exports. Due to revolution in information technology (IT), it has become possible to deliver services across borders and at rather low costs as compared to past. India’s exports of ITES/BPO services have witnessed expansion in recent years, especially after the Y2K problem (year 2000 software switching over problem). In fact, the challenge was turned into an opportunity by India. The success in tackling the Y2K problem by India’s software professionals led to outsourcing the non-core activities by the developed countries like the US and the EU from India. The availability of cheap supply of skilled labour has significantly contributed to the comparative advantage of India’s ITES/BPO exports. Innovations in IT technology, investment in education by India for sustained period of time such as in Indian Institute of Technology (IITs)/Indian Institute of Management (IIMs), engineering colleges), proficiency in English language,
time zone difference, etc. have been the contributory factors to growth of services from India in general and growth of ITES/BPO services in particular. Besides contributing to foreign exchange earnings of the country, the ITES/BPO firms are now becoming an important platform for job opportunities for Indians, providing both direct and indirect employment. ITES/BPO sector has enhanced India’s credibility as a business destination. Hence, a study on examining the various facets of exports of services from India and particularly by the ITES/BPO should not need any justification.
The broad objectives set for the study are as follows:-
• To examine the general perception that developed countries are the only predominant countries that outsource (or contract out/import) services.
• To study whether India have a comparative advantage in services exports especially in ITES/BPO exports.
• To examine whether outsourcing has led to unemployment in the US and the UK.
EXECUTIVE SUMMARY

10
• To examine the extent to which software and business services exports provide support to India’s balance of payments.
• To measure the impact of economic growth in developed countries, such as, US and UK and exchange rate on India’s ITES/BPO exports.
• To identify the determinants of ITES/BPO exports with the help of firm level data.
To meet these objectives, the study uses panel data model and cointegration test for empirical investigation, besides the use of descriptive analysis and graphical representations. Computation of Revealed Comparative Advantage (RCA) index shows that India has revealed comparative advantage in ITES/BPO exports. Study also finds that ITES/BPO exports provide crucial support to India’s Balance of Payments. Econometric analysis shows economic growth in India’s major markets, viz., in the US and the UK is necessary for the growth of India’s ITES/BPO exports, indicating market concentration risk for India’s ITES/BPO exports. Further, appreciation of exchange rate can also be a matter of concern, as it adversely affects these exports. Another finding is that, intensity of imports of computer and information services and business services is higher for
developing countries compared to developed countries like the US and the UK. This is contrary to the general perception that global ITES/BPO exports are one-way outsourced by developed countries from developing countries. An analysis of sector wise employment data in the US and the UK indicates that outsourcing to India is not causing unemployment in the US and the UK in an absolute sense. Further, this study also demonstrates that many top ITES/BPO firms are actually from developed countries. These findings clearly refute the argument that developing countries are taking away job opportunities from developed countries because developed countries outsource services from developing countries. Further, there is a rise in competition in ITES/BPO sector with the emergence of number of other low cost countries. In this regard, India needs to improve its business environment and infrastructure considerably to face the rising competition. Fiscal concessions to this sector may neither be sustainable nor desirable, as the effective tax rate of ITES/BPO firms in India is already much lower than that imposed on other sectors. Analysis of balance sheets of ITES/BPO firms indicates that this sector is characterized by oligopolistic market form and that the R&D activities in India’s ITES/BPO sector are at best undertaken only by the large firms.

11
In the present world, offshore outsourcing of services is one of the most rapidly growing components of international trade in services. Firms are outsourcing an ever expanding set of activities, ranging from product design, R&D, distribution, after-sales services, etc. Anticipated cost savings is the most important reason for outsourcing particular activities. Reasons for outsourcing can change over time. It is also noted that risks involved in outsourcing have produced failures and caused firms to reverse their outsourcing decisions. Outsourcing can generate a wide range of economic effects, such as, shifts in employment, greater operational efficiency, improved product or service quality, increased income, change in price of outsourced services, impact on wages of affected workers, etc. These trends have attracted keen interest of academicians as regards; (i) the identification of the factors that ‘initially cause’ outsourcing and those that ‘sustain’ outsourcing; and, (ii) the effect/impact of outsourcing on both home and foreign countries, especially in terms of growth, productivity and employment. Vertical disintegration is evident especially
in international trade. World Trade Organization (1998) details the production of a typical American car as follows: “Thirty percent of the car’s value goes to Korea for assembly, 17.5 per cent to Japan for components and advanced technology, 7.5 per cent to Germany for design, 4 per cent to Taiwan and Singapore for minor parts, 2.5 per cent to the United Kingdom for advertising and marketing services, and 1.5 per cent to Ireland and Barbados for data processing. This means that only 37 per cent of the production value is generated in the United States”.
Information Technology (IT) is globalizing the services industries and has substantially increased international trade in services (Hanna, 1994). IT-enabled outsourcing is an integral part of services sector. Therefore, understanding the characteristics of services as a whole would be helpful in understanding the phenomenon of outsourcing in a better manner. In the last two decades, service sector has emerged as the largest and fastest-growing sector in the global economy as well as in the Indian economy. There are
1. INTRODUCTION

12
both demand side and supply side factors which explain the growth in services sector. One explanation suggested (demand side) for fast growth in services is that the income elasticity of demand for services is greater than one (Gordon and Gupta, 2003). Supply side factors include increased trade due to economic reforms, higher FDI in services, developments in technology and the advent of IT era, etc. (Banga 2005). In India’s case, one of the widely debated dimensions of the services sector has been the rise of software and IT-enabled services (including call centers, BPO, etc.). India’s services exports increased steeply in recent years and is around 2.7 per cent of the global exports in services in 2008 (IMF, 2010). The global competitive edge of the Indian economy in services sector vis-à-vis goods sector can be gauged by comparing this figure with India’s share in global exports of goods which was around 1.2 per cent in 2008 (IMF, 2010). The potential global market for services is expanding even further. For example, the US health care reform bill passed in March, 2010 is expected to open up several new opportunities for ITES/BPO firms in India. This is expected to bring in 35 million more Americans under the insurance cover which means millions of more enrollments and transactions. The reform has also made it mandatory for a change from the present system of paper records to that of digitized records. This provides
tremendous opportunity for data entry, validation and maintenance of records (Suraj, 2010). In India’s Balance of Payments (BOPs) statements, ‘outsourcing’ is classified under the category ‘software exports’ and ‘business services exports’ within ‘miscellaneous exports’ which is a sub-category of services. The composition of India’s services export has changed dramatically in favour of ‘miscellaneous’ services which include ‘outsourcing’.
This Chapter is divided into four sections including the introductory section. Section 1.2 explains the importance of services sector in general and its subcomponent ITES/BPO sector for Indian economy. Reviewing the characteristics of services sector as a whole would be helpful to provide a background as outsourcing is still evolving and detailed break up of services (including outsourcing or ITES/BPO services) are available only since the year 2000. The scope and objective of this study are set out in section 1.3. Chapter scheme of this study is covered in section 1.4.
1.2 Importance of Services and Outsourcing in India
Many rapidly growing developing economies, such as Korea, China, etc. have seen declining share of agriculture in their GDP replaced by rising shares of manufacturing in

13
the initial stages of development. In contrast to this, in India the decline in the share of agriculture sector in GDP has been picked up by the service sector, while manufacturing sector’s share has witnessed a stagnated share in GDP since 1991 (Panagariya, 2008). Within service sector, some services like software and telecommunication services have grown faster not only in terms of their share in India’s GDP but also in terms of their share in trade and FDI (Banga, 2005). Further, it may be noted that India has a net surplus in services trade as against the deficit in merchandise trade and this has helped India to contain its current account deficit. According to the IMF (2010), Balance of Payments Statistics, the share of India’s services trade in total trade (merchandise and services) has increased significantly over the years, from around 17.8 per cent in 1995 to 35.4 per cent in 2008. This is mainly due to increase in exports of information technology enabled services (ITES) or computer and information services and other business services (broadly known as outsourcing of services). India’s share in world service exports is now more than double the share of merchandise exports (Table 1.1). The composition of services exports has changed dramatically in favour of miscellaneous services (Figures 1.1a & 1.1b). Miscellaneous services exports include software and other business services. For the global
economy as a whole, the item ‘other services’ exports constituted around 50 per cent of total world services exports in 2008 (Figure 1.2).
Table 1.1: India’s Share in World Trade in Per cent
Services Merchandise
1995 0.6 0.61996 0.5 0.61997 0.7 0.61998 0.8 0.61999 1.0 0.72000 1.1 0.72001 1.1 0.72002 1.2 0.82003 1.3 0.82004 1.7 0.92005 2.1 1.02006 2.4 1.02007 2.5 1.12008 2.7 1.2
Source: Author’s calculation using IMF, BoP Statistics 2010
Due to the rising importance of services sector and recent pick up in service exports from India, FDI inflows into India are also shifting increasingly away from manufacturing sector, towards services sector. The average share of services in total FDI in the period 1990-94 increased from 10.5 per cent to 28.3 per cent in the period 1995-1999 (UNCTAD, 2004).
It may be noted that the backbone behind the growth of Business Process Outsourcing (BPO) industry

14
in India is the development of IT. IT is an ‘enabling’ technology and mastering its use generates externalities throughout the economy. Information technology covers all activities and technologies that involve the handling of information by electronic means: that is, information acquisition, storage, retrieval, processing, transmission and control (Hanna, 1994). The diffusion of IT or software can result in increasing returns to scale, as the average cost of
such set of instructions declines with each new user (Kraemer and Dedrick 1999). For these reasons, ITES growth is believed to be important for enhancing national productivity and competitiveness, spurring exports and economic growth. Brynjolfsson and Hitt (1996) argued that IT investments have much greater returns than investments, in labour or other types of capital. Kraemer and Dedrick (1994) used data from 1984 to 1990 for twelve Asia-Pacific countries that represented different levels of economic development and found a significant relationship between growth rates in IT investment and both productivity and economic growth at the national level. This study defines IT investment as total spending for computer hardware, software and services within a country. The study conducts correlation analysis and indicates a strong correlation between IT investment and GDP per capita, education levels and structure of
Figure 1.1a: Miscellaneous ServiceExports - India (1990-91)
Figure 1.1b: Miscellaneous ServiceExports - India (2008-09)
Figure 1.2: Other Services Export - World (2008)

15
economy (share of employment in the service sector). Further, the advances in IT are promoting productivity in the financial service markets including banks and capital market (Hanna 1994). ‘Just in time’ inventory system is yet another example of how information technology is capital saving and enables higher productivity. By dramatically reducing inventory levels, it reduces on working capital requirements in manufacturing enterprises. A study in West Germany indicated that the use of information technology can lead to energy saving up to 38 per cent in road transportation and 15-20 per cent in the household sector (Kelkar, et al, 1991). WTO (2005) indicates that countries like India and Philippines have substantial unemployment and underemployment problems. Therefore, jobs created and investment made in the IT services exporting sector are likely to be net additions to total employment and investment. Countries such as Singapore, Taiwan, Israel and Ireland
have promoted production and use of computers and software as a part of their national economic strategy and have witnessed noticeable results. Further, information technology can help avoid delay due to cumbersome procedures in ports, etc. In this context, Roy and Bagai (2005) indicate that international trading process with India is cumbersome and bureaucratic. Indian ports are characterized by delays when compared to international norms (Table 1.2).
Merchandise exporters and importers have to face multiplicity of agencies relating to transport, customs, etc. This may be one reason why outsourcing of services from India has grown much faster than merchandise exports which depends heavily on physical infrastructure and bureaucratic procedures. The relative dependence of IT enabled services on physical infrastructure like seaports, road, etc., is lesser. In countries like India where
Table 1.2: Delays at Ports and Airports in India
Transaction Location International Norm
Air freight Delhi airport Export 2.5 days Less than 12 hoursImport 15 days Less than 12 hoursContainerized sea freight Mumbai Ship waiting time 3-5 days Less than 6 hoursExport dwell time 3-5 days Less than 18 hoursImport dwell time 7-14 days Less than 24 hours
Source: Roy and Bagai (2005), World Bank.

16
there are enormous challenges for building a sound infrastructure, IT can help to an extent.
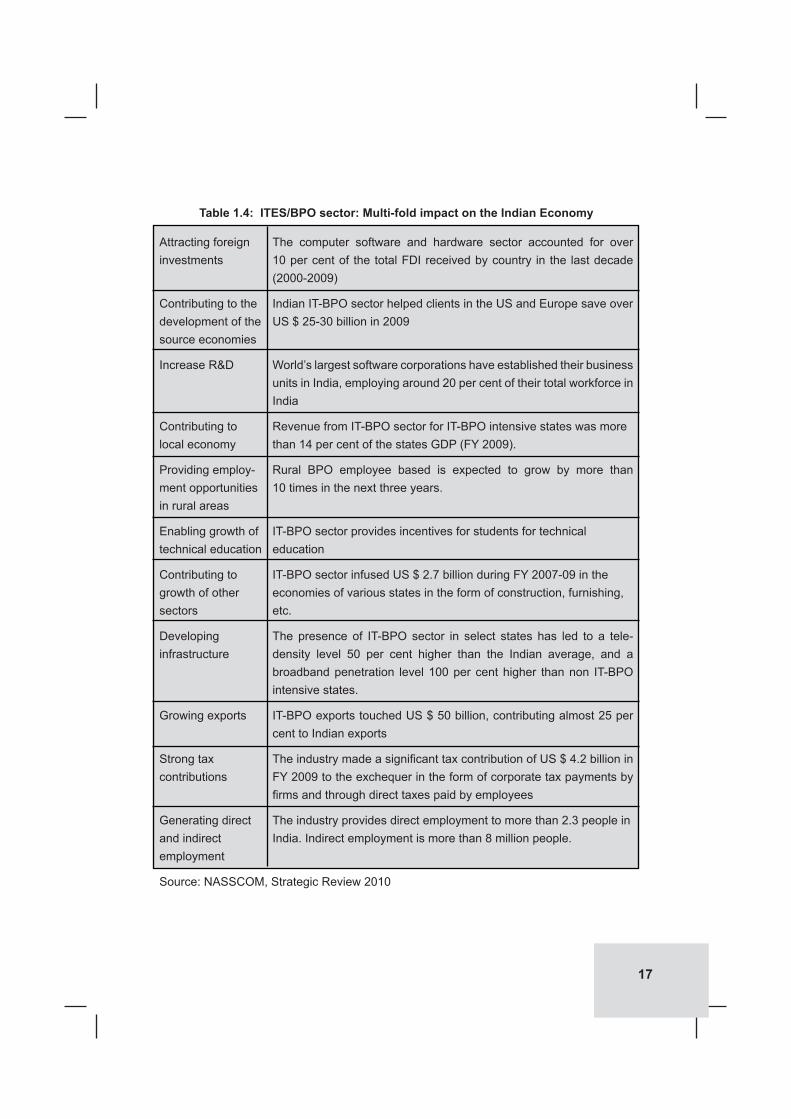
In India over the period 2001-10, the annual financing gap for investment in infrastructure needs is estimated at US$ 13.9 billion (Table 1.3). So far, FDI has played a very small role in the overall financing of infrastructure in India (UNCTAD, 2008). The application of IT makes administrative and management processes of infrastructure efficient, transparent and unbiased. A table summarizing the multi-fold impact of ITES/BPO sector on the Indian economy is set out below (Table 1.4 and 1.5). Further, IT based governance, popularly known as e-governance, is now universally accepted strategy to realize good governance. It promotes comprehensive monitoring and assessment of government performance. In this regard, the
Government of India has already launched an ambitious programme for e-governance.
Inclusive growth remains a major goal for the Indian Government and industry. High GDP growth has to be accompanied by more balanced development, with the benefits of progress being shared by citizens at the grass root levels. India’s ITES/BPO sector can be instrumental in bringing about financial, cultural, gender and digital inclusion (Table 1.6).
Table 1.7 shows the rapid growth of employment in India’s ITES/BPO sector which nearly doubled from around 12 lakh in 2006 to around 22 lakh in 2009. Apart from direct employment, the industry generates indirect employment for more than 8.2 million people who are involved
Table1.3: Infrastructure Needs and Financing Gaps (Billions of dollars)
World Bank estimates Fiscal Years 2001-10
Category Investment needs Financing gap 2007-12
Energy 26.5 8.7 30.0Roads 11.6 2.8 15.2Telecom 5.4 1.2 13Ports 0.8 0.6 3.6Railways 3.1 0.4 12.6Airports 0.5 0.2 1.6Total 47.9 13.9 98.8
Source: UNCTAD(2008),World Investment Report.
Government of India estimates projected investment needs
17
Table 1.4: ITES/BPO sector: Multi-fold impact on the Indian Economy
Attracting foreign The computer software and hardware sector accounted for overinvestments 10 per cent of the total FDI received by country in the last decade
(2000-2009)
Contributing to the Indian IT-BPO sector helped clients in the US and Europe save overdevelopment of the US $ 25-30 billion in 2009source economies
Increase R&D World’s largest software corporations have established their business units in India, employing around 20 per cent of their total workforce in India
Contributing to Revenue from IT-BPO sector for IT-BPO intensive states was morelocal economy than 14 per cent of the states GDP (FY 2009).
Providing employ- Rural BPO employee based is expected to grow by more thanment opportunities 10 times in the next three years.in rural areas
Enabling growth of IT-BPO sector provides incentives for students for technicaltechnical education education
Contributing to IT-BPO sector infused US $ 2.7 billion during FY 2007-09 in thegrowth of other economies of various states in the form of construction, furnishing,sectors etc.
Developing The presence of IT-BPO sector in select states has led to a tele-infrastructure density level 50 per cent higher than the Indian average, and a
broadband penetration level 100 per cent higher than non IT-BPO intensive states.
Growing exports IT-BPO exports touched US $ 50 billion, contributing almost 25 per cent to Indian exports
Strong tax The industry made a significant tax contribution of US $ 4.2 billion incontributions FY 2009 to the exchequer in the form of corporate tax payments by
firms and through direct taxes paid by employees
Generating direct The industry provides direct employment to more than 2.3 people inand indirect India. Indirect employment is more than 8 million people.employment
Source: NASSCOM, Strategic Review 2010

18
Table 1.5: Transforming India Using IT
Areas Contribution of Indian technology-business services by 2020
Economy 6 per cent of annual GDP 28 per cent of annual exports
Employment 30 million urban employment (direct and indirect) Significant job creation in rural and non-metro areas Increased diversity (women are 50 per cent of the total workforce) Significant global career opportunities due to location-independent
models
Growth Infrastructure developmentoutside 8-10 satellite townships around Tier-1 citiesmetro 10-15 Tier-II cities with upgraded basic and business infrastructurecities
Reduced ICT can provide solutions at a fraction of the cost of traditional solutionsfiscal burden and reduce public expenditure on these areas (health care, education,
financial services and public services)
Globally Additional revenues of US $ 50-80 billion through innovation, drivingreputed additional GDP contribution of 1.5 to 2 per cent.innovativesolutions
Source: NASSCOM, Strategic Review 2010.
Table 1.6: ITES/BPO sector and India’s Inclusive Growth
Key Area Role for IT-BPO sector
Healthcare 50 per cent of Indians do not have access to primary healthcare-In this regard IT can play a major role in providing healthcare at half the cost
Effectively increase outreach to rural population Enable remote access to remote doctors through electronic diagnostic
devices and real time video conferencing Building and operating next-generation processes
Financial 80 per cent of Indian households are unbanked-IT can enable access services for 200 million families Overcome challenges to provide services in rural areas Mobile banking and remittance; Internet kiosks for distribution of select
financial products; Low cost ATM

19
in support activities, such as, transportation, security and catering (NASSCOM, 2010). At present, over 30 per cent of total employee base of Indian IT sector are women, 60 per cent of firms offer employment to differently-abled people, while 58 per cent of total employment is originally from Tier-II/III cities (NASSCOM, 2010). It is reported that IT firms are now recruiting and training even non-technical employees including B.Sc., B.Com. and B.A. graduates as their
services can be availed at low cost (DNA, 2010)1. Further, IT employees were among the biggest consumer spenders in India. The industry also makes significant tax contribution to the exchequer in the form of corporate tax payments by IT-BPO firms and through direct taxes paid by employees. The industry has played a key role in regional development with IT-BPO intensive states accounting for over 14 per cent of respective State’s GDP (NASSCOM 2010). Further, IT-
Education and India faces a three-fold shortage in teachers-IT can address this throughskill develop- remote solutionsment ICT solutions can overcome challenges of traditional solutions (e.g., virtual
classrooms, recorded lectures by senior faculties, modular multimedia content)
Public services India suffers from a leakage of 40-50 per cent in public food distribution-use of IT can ensure transparency
E-Governance enhancing basic citizen services UIDAI to create identity for each citizen in the country
Connectivity Community service centres, with broadband connectivity, to provide alland Access government services to citizen services-also create opportunities for
livelihood
Source: NASSCOM, Strategic Review 2010.
Table 1.7: Professionals employed in Indian ITES/BPO Sector
2006 2007 2008 2009 2010 F
IT Service and Software Exports 513,000 690,000 877,000 958,000 993,000
BPO Exports 415,000 553,000 635,000 738,000 768,000
Domestic market 365,000 378,000 450,000 500,000 525,000
Total 1,293,000 1,621,000 1,962,000 2,196,000 2,286,000Note: F=ForecastSource: NASSCOM, Strategic Review 2010
1DNA News paper (2010), May 16, page 2.

20
BPO intensive States accounted for 58 per cent of engineering colleges in India which strengthen India’s technical manpower.
Further, the rise of ITES/BPO exports may stimulate R&D activities in India. Historically, India spends only a small fraction of its GDP on R&D. It receives very little foreign exchange by way of royalty and license fee receipts (RBI, 2010b). In India, about 70 per cent of R&D is undertaken by the central and state governments, an additional 27 per cent by enterprises (both public and private sector industries) and less than 3 per cent by universities and other higher education institutions. In contrast, in OECD countries, the private sector finances 50-60 per cent of R&D (Dahlman and Utz, 2005). Universities also undertake research to a much larger extent in developed countries and have stronger linkages with the corporate world. Low R&D intensity in India is evident from its small share in global patenting. Therefore, despite producing scientific manpower, India is weak on turning its research into profitable applications. However, there are signs of change. ITES/BPO sector has enabled an environment for innovation. The industry has enhanced India’s credibility as a business destination and put India on the global map (NASSCOM, 2010). Growth in IT enabled industry is helping India to build confidence in
other technologically oriented area and building a sound R&D base. Software made the ‘Brand India’ a respected one, paving the way for other sectors. For instance, in India there is now a growing set of firms that develop semiconductor technology and provide affiliated services (Arora, 2008). The Indian Software Association estimates that about two hundred semiconductor firms currently operate this facility in India, and of these, about 60 per cent are involved in chip design. Many of these firms are Indian based. The number of US patent grants to the Council for Scientific and Industrial Research (CSIR), for example, increased from just six in 1990-91 to 196 in 2003-04. Intel and Texas Instruments are using India as an R&D hub for microprocessors and multimedia chips (Dahlman and Utz, 2005). The success of the ITES industry has influenced competitiveness in other sectors. As a part of cost reduction strategy, global firms are increasingly unwilling to keep expensive R&D teams together for various projects. Wipro, an Indian firm provides such firms with an alternative to R&D by permanent in-house teams. Wipro is probably the world’s biggest R&D services firm. Further, India has a large number of contract research firms in other areas as well like chemistry, biology and pharmaceutical fields (Dahlman and Utz, 2005). The success of software export has surely
21
played a significant role in signaling the potential of India as a location for R&D activities (Arora, 2008).
In short, the direct economic impact from the growth of the Indian ITES/BPO industry is growing rapidly. It provides significant support to India’s Balance of Payments position and helps in accretion of foreign exchange reserves. The Economic Survey, 2005 projects that value addition in IT and BPO services would rise in future. In conclusion, the excitement regarding India’s ITES/BPO exports is not just about foreign exchange earnings or employment-generation. Rather, it is an example for multifold impact on the economy. In fact, due to India’s success in outsourcing, many countries are now trying to emulate India’s achievement.
1.3 Scope and Objectives of the Study
Given the significant role played by services exports in sustainability of India’s Balance of Payments and overall development, an attempt is made in this study to analyze one of the major and rapidly growing components of India’s services trade, i.e., ‘IT-enabled exports of services or outsourcing of services’. India is now having extensive ITES/BPO
firms with a diversified structure (Table 1.8).
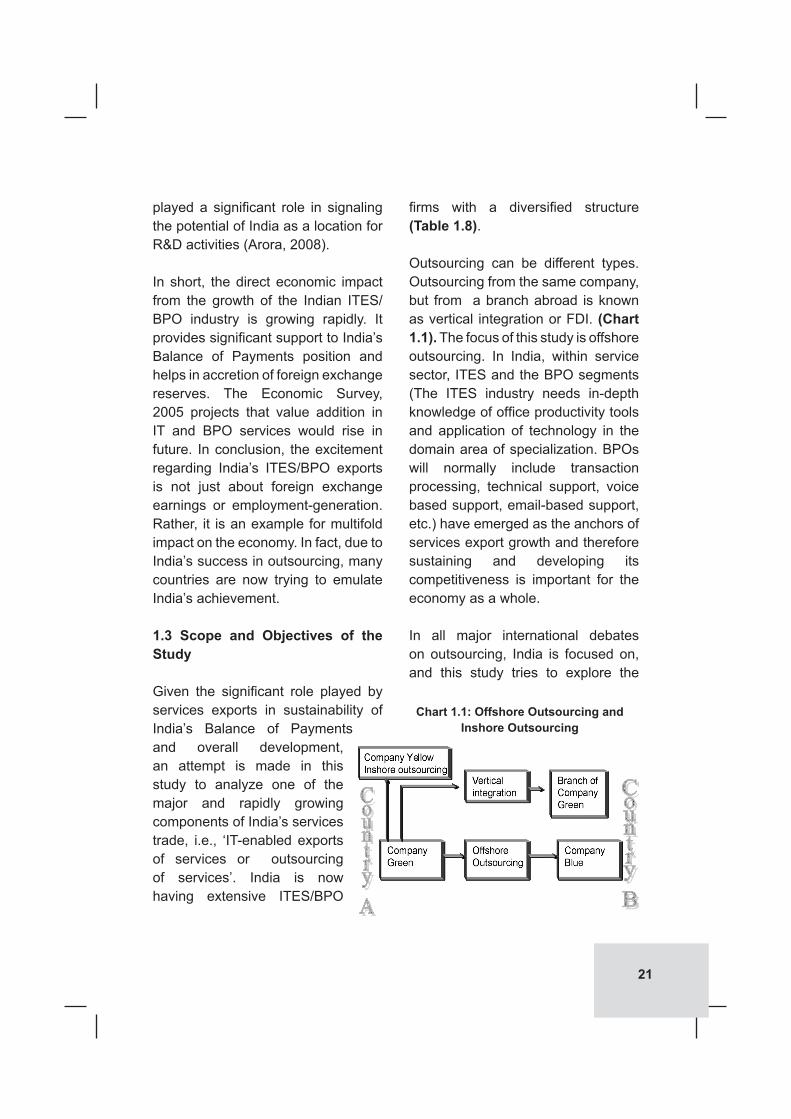
Outsourcing can be different types. Outsourcing from the same company, but from a branch abroad is known as vertical integration or FDI. (Chart 1.1). The focus of this study is offshore outsourcing. In India, within service sector, ITES and the BPO segments (The ITES industry needs in-depth knowledge of office productivity tools and application of technology in the domain area of specialization. BPOs will normally include transaction processing, technical support, voice based support, email-based support, etc.) have emerged as the anchors of services export growth and therefore sustaining and developing its competitiveness is important for the economy as a whole.
In all major international debates on outsourcing, India is focused on, and this study tries to explore the
Chart 1.1: Offshore Outsourcing and Inshore Outsourcing

22
Table1.8:StructureofIndianIT-BPOfirms
Number of % of total % of total Category Players Export Employees Work focus Revenues
Large sized, 7 43-45% ~30% Comprises Indian and MNC Revenue > third-party players US $ 1 billion Fully integrated player offering full spectrum (IT services, engineering & R&D services)and complex transformational deals Large scale operations and infrastructure Expanding their onsite/near-shore capabilities, these players have presence in over 60 countries
Mid sized, 75-80 35-37% ~30-35% Includes mid-tier Indian IT and Revenue US $ 1 MNC firms operating in more than million to US $ 1 one vertical and offering multiple billion services such as IT services,
engineering, R&D and software products
Near shore and offshore presence in over 30-35 countries
Most of these have large scale operations and infrastructure
Dedicated captive centres offering IT/BPO/Engg services
Emerging, 300-350 9-12% ~15-20% Indian third-party players Revenue dominate this category US $ 10 accounting for nearly half of million to this segment US $ 100 million Many of the players provide
full spectrum of services with specialization in certain segments like engineering services and niche IT services
Enhancing focus and strategy towards sub-Fortune 500/1000 firms Dedicated captive centres offering niche IT/BPO/Engg services
Small/Start >3,500 10-12% ~15-17% Smaller players focusing on Ups specific niches in either services, Revenue of verticals ≤ US $ 10 million
Source: NASSCOM, Strategic Review 2010

23
key features of India’s outsourcing sector.
The broad objectives set for the study are the following:-1. To examine the general perception
that developed countries are the only predominant countries that outsource (or contract out/import) services.
2. To study, whether India has a comparative advantage in services exports especially in ITES/BPO exports.
3. To examine whether outsourcing has led to unemployment in the US and the UK.
4. To examine the extent to which software and business services exports provide support to India’s balance of payments.
5. To measure the impact of economic growth in developed countries, such as, the US and the UK and exchange rate on India’s ITES/BPO exports.
6. To identify the determinants of ITES/BPO exports with the help of firm level data.
Both descriptive analysis and empirical techniques are used to meet these objectives. In brief
this study attempts to undertake a comprehensive analysis of outsourcing from India. The study is therefore titled as “Exports of Services and Offshore Outsourcing: An Empirical Investigation in the Indian Context”.
1.4 Organization of the Study
This study is organized into six Chapters, each Chapter being further structured in sections which address specific aspects of the theme of the respective Chapters.
Chapter 1 the Introductory Chapter identifies the importance of service sector for India. Within services sector, it focuses on IT-enabled outsourcing of services from India. The principal objectives and organization of the study are also set out in this Chapter.
Chapter 2 sets out the conceptual framework of the study. Various definitions and classifications of outsourcing are set out in this Chapter.
Chapter 3 deals with methodology adopted by this study. It explains various descriptives and empirical methods used in this study. It also provides hypotheses of this study.
Chapter 4 summarizes the international debate on outsourcing,

24
both theoretical and empirical. It also presents the evolution of international trade theory and explores the suitability of theory of international trade in goods to international trade in services.
Chapter 5 provides empirical analysis of various aspects of outsourcing
from India. It undertakes econometric investigations to find out the influence of different factors on ITES/BPO exports from India.
Chapter 6 sets out concluding observations and suggests areas of policy action. It also identifies the limitation of this study.

25
2.1 Introduction
Production and consumption of services have been increasing at a relatively faster pace than that of goods, as reflected in the increasing share of services in the composition of national income of many developing economies like India. Along with this, the cross-border trade in services has also attained a greater importance than earlier. The emergence of GATS as an integral pillar of the WTO bears testimony to this fact. Trade in services (and outsourcing) can occur both nationally as well as internationally. However, in this study, we are concerned only with the cross-border trade in services (offshore outsourcing). However, the connotations of terms like services, outsourcing, information technology enabled services, business processes outsourcing, etc., can get confusing and hence, in this chapter the conceptual underpinnings of some of these terms (especially, in the context of balance of payments statement) has been provided.
This Chapter is divided into six sections including the introduction. Section 2.2 covers conceptual
framework and characteristics of services. Section 2.3 discusses classification of services. Conceptual underpinnings and definitions of outsourcing are provided in section 2.4. section 2.5 provides outsourcing and Systems of Data Reporting. Section 2.6 provides the summary of the preceding sections.
2.2 The Concept and Characteristics of Services
As outsourcing is an integral part of services, it would be useful to deliberate on the evolution of concept and the characteristics of services. Seth (2006) provides a lucid description and classification of services. It states that in the writings of classical economists, the distinction between goods and services was considered in terms of productive and unproductive labour. As stated in Seth (2006), Smith (1776) viewed only those workers who are engaged in the ‘production of material goods as productive’. The other occupations which generated services, such as, those of painters, artists, teachers, etc., were regarded as unproductive. However, over the course of time, this view of services had to be abandoned,
2. OFFSHORE OUTSOURCING OF SERVICES: THE CONCEPTUAL FRAMEWORK

26
as services sector expanded and its importance in national income of the countries started increasing. It was no more possible to deny the fact that services can play an important role in economic development.
There also exist a variety of other classifications for services which are evolved over time. The classification of service products, developed by the United Nations, known as Central Product Classification (CPC), which helps in identification of service products (includes about 600 service products) is also being used by General Agreement on Trade in Services (GATS) for specifying the rules of trade in the arena of services (Banga, 2005). According to the Manual on Statistics of International trade in services, United Nations (2002), “The term services cover a heterogeneous range of intangible products and activities that are difficult to encapsulate within a simple definition. Services are also often difficult to separate from goods with which they may be associated in varying degrees”.
According to Balance of Payments and International Investment Position Manual (sixth edition, IMF (2009) “Services are the result of a production activity that changes the conditions of the consuming units, or facilitates the exchange of products or financial assets. Services are not generally separate items over which
ownership rights can be established and cannot generally be separated from their production”. However, it also mentions that “…..some knowledge-capturing products, such as computer software and other intellectual property products, may be traded separately from their production, like goods”. It defines goods as “physical, produced items over which ownership rights can be established and whose economic ownership can be passed from one institutional unit to another by engaging in transactions”.
2.3ClassificationofServices
The categorization of transactions to facilitate the trade in services (and WTO negotiations) has been adopted by GATS on January 1, 1995. The relative importance of each mode of services transaction is determined by the regulatory environment prevalent among the trading countries regarding trade in goods and services, movement of persons and technological capabilities of these countries.
WTO under its General Agreement on Trade in Services (GATS) categorizes four different ways in which services can be traded, viz., Mode 1, Mode 2, Mode 3 and Mode 4. In Mode 1, trade in services involves arm’s-length supply of services, with the supplier and buyer remaining in their respective locations. Trade of services in Mode 1 has come into

27
prominence because of the advances in information and communications technology. Mode 1 services also include services of firms that manage call centers, back offices and software programs. Trade in Mode 1 services is what most economists refer to as ‘outsourcing’. Mode 2 involves movement of the consumers to the location of the supplier. Under Mode 3, services are sold in the territory of a member by legal entities that have
established a presence there but originate in the territory of another member. Mode 4 includes services requiring the temporary movement of natural persons. A comparison of classification of trade in services provided by Bhagwati (1984) and GATS is set out in the Table 2.1.
Even though the distinguishing characteristics of services from goods based on tangibility and intangibility,
Table2.1:ClassificationofTradeinServices
Characteristics of Producers and Consumers of Services Bhagwati (1984) WTO (GATS)
Producers
Producer is immobile
Producer is mobile e.g., FDI
Producer is mobile e.g., Migrant labour
Producer is mobile
Consumers
Consumer is mobile
Consumer is immobile
Consumer is mobile
Category 2: Supplier of the services is immobile and the user of services is mo-bile, e.g., tourism.
Category 1: Supplier of the services is mobile and the user of services is im-mobile, e.g., teachers, doc-tors etc who migrate to the countries of their custom-ers.
Category 3: Both supplier and the user of services are mobile, e.g., cultural events, sports etc.
Mode 1:Supplier and buyer remaining in their respective locations.
Mode 2: Movement of con-sumers to the location of the supplier.
Mode 3: services are sold in the territory of a member by legal entities that have estab-lished a presence there but originate in the territory of an-other member.
Mode 4: includes services re-quiring the temporary move-ment of natural persons.

28
store of value, etc., might appear very simple, in real life situations, these distinctions are difficult to disentangle. These further create problems for classification of services. As stated by Seth (2006), each stage of social and economic transformation (or overall development) creates new services and in the process, causes a decline in some other services. For example, business process outsourcing came into prominence since the year 2000. Due to this ongoing process of ‘creative destruction’ the composition of services, at different stages of development, keeps on changing. We now go on to define the phenomenon of outsourcing, which is the key concept of this study.
2.4 Conceptual Underpinning of the Phenomenon of Outsourcing
There is no commonly accepted definition of outsourcing. Some of the interpretations/ definitions/connotations of the phenomenon of outsourcing are as follows:
The New Oxford dictionary of English (1998) defines outsourcing as “obtaining goods or service by contract from an outside supplier.” The term ‘outside’ can be interpreted to mean ‘outside the firm’ or even ‘outside the country (international or offshore outsourcing)’. Even though the
phenomenon of domestic (or inshore)2 outsourcing is very common, the policy makers have been compelled to pay attention to the phenomenon of international outsourcing. This is due to the implications of offshore outsourcing on employment and income distribution across countries in this era of globalization.
According to McKinsey (2003), effective outsourcing implies identifying and managing the “natural owner” of every activity in the value chain.
According to Feenstra and Taylor (2008), outsourcing is trade in intermediate inputs, which can sometimes cross borders several times before being incorporated into a final good that can be sold domestically or abroad. Grossman and Helpman (2001) state: “Outsourcing means more than just the purchase of raw materials and standardized intermediate goods. It means finding a partner with which a firm can establish a bilateral relationship and having the partner undertake relationship-specific investments so that it becomes able to produce goods or services that fit the firms’ particular needs”.
Bhagwati et al (2004) state that in the early 1980s, outsourcing referred to
2Inshore or domestic outsourcing takes place when a firm sub-contracts one of its business activities or processes to an outside supplier within the country. This is a common practice in the US and Europe and it is supposed to promote specialization.

29
the situation when firms purchased manufactured physical inputs from outside. However, in recent times, the interpretation of outsourcing is more applied to situations in international trade in services. This segment consists of arm’s-length, or ‘long–distance’ purchase of services abroad, mainly via electronic media. They have explained outsourcing as a process in which the innovating firms introduce a product in the domestic market and once the product matures, the production of this product is shifted to countries where it is cheaper to produce, with the innovating country eventually becoming an importer of the product. In this process, the home country loses low-wage jobs, but gain high-wage jobs. On the balance outsourcing according to them results in the transition of the innovator country to a high-value job oriented country.
Kirkegaard (2005) indicated that outsourcing refers to the purchasing of intermediate inputs by firms (or governments) at arm’s length. Raw material inputs are excluded. For instance, purchase of raw steel by Volkswagen would not be outsourcing, but if Volkswagen decided to purchase the doors for its cars from a supplier, rather than manufacture them itself, it would have “outsourced its production of car doors”. It is important to realize that this phenomenon is not new and has been going on since the
industrial revolution. However, the increasing use of Information and Communication Technology (ICT) in recent years has made outsourcing of a newer and wider range of services also possible. IT facilitates firms to outsource services that can be reproduced/conducted in digital form, such as IT support, back office services (payroll administration, accounting), call-centre services, software programming and some R&D functions. In brief, offshore outsourcing is not only confined to sourcing intermediate input in the form of manufacturing goods, but also to the various types of processes and services.
Ahuja (2004) focuses on the Business Process Outsourcing (BPO) which can be considered as a proper sub-set of offshore outsourcing. He states that outsourcing takes place when an organization transfers the control of a business process to a supplier, unlike subcontracting where buyer still controls the process. The main cause of emergence of BPOs is the overall cost reduction arising mainly due to cheaper communication costs and lower wages in the developing countries. The difference between outsourcing of intermediate inputs of manufactured products and of services also features in the various connotations of ‘outsourcing’ (UNCTAD, 2004). These differences are as follows:-
30
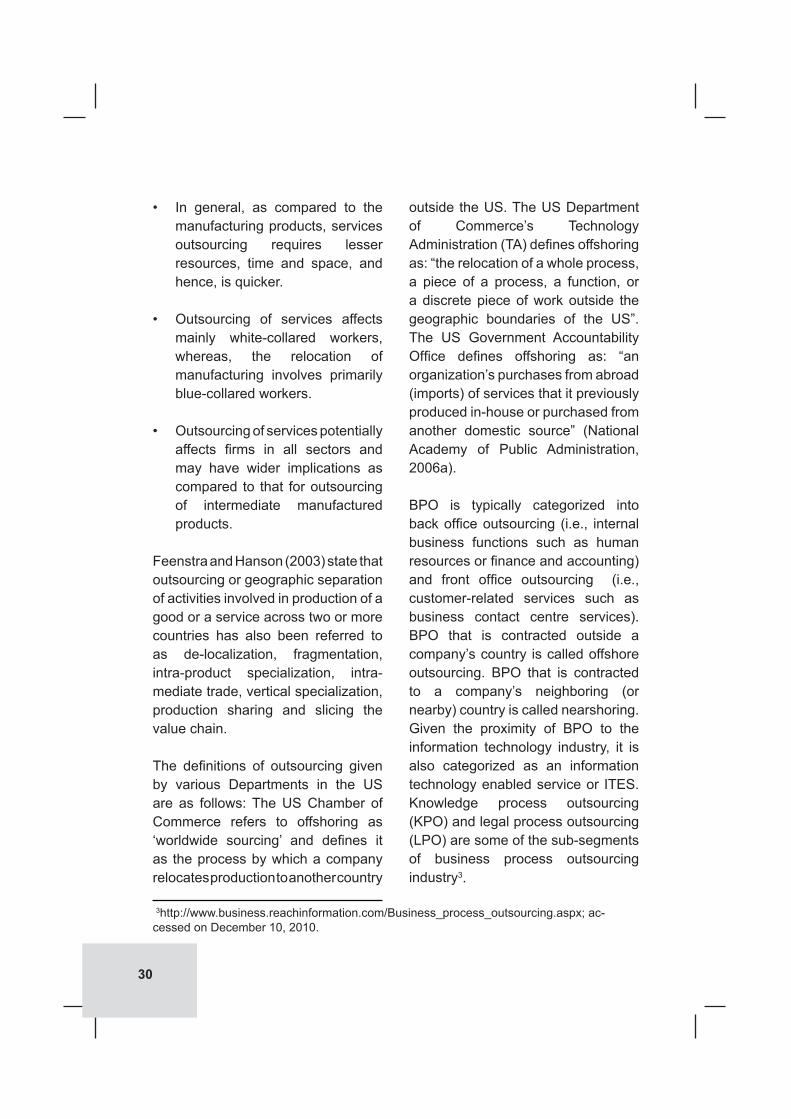
• In general, as compared to the manufacturing products, services outsourcing requires lesser resources, time and space, and hence, is quicker.
• Outsourcing of services affects mainly white-collared workers, whereas, the relocation of manufacturing involves primarily blue-collared workers.
• Outsourcing of services potentially affects firms in all sectors and may have wider implications as compared to that for outsourcing of intermediate manufactured products.
Feenstra and Hanson (2003) state that outsourcing or geographic separation of activities involved in production of a good or a service across two or more countries has also been referred to as de-localization, fragmentation, intra-product specialization, intra-mediate trade, vertical specialization, production sharing and slicing the value chain.
The definitions of outsourcing given by various Departments in the US are as follows: The US Chamber of Commerce refers to offshoring as ‘worldwide sourcing’ and defines it as the process by which a company relocates production to another country
outside the US. The US Department of Commerce’s Technology Administration (TA) defines offshoring as: “the relocation of a whole process, a piece of a process, a function, or a discrete piece of work outside the geographic boundaries of the US”. The US Government Accountability Office defines offshoring as: “an organization’s purchases from abroad (imports) of services that it previously produced in-house or purchased from another domestic source” (National Academy of Public Administration, 2006a).
BPO is typically categorized into back office outsourcing (i.e., internal business functions such as human resources or finance and accounting) and front office outsourcing (i.e., customer-related services such as business contact centre services). BPO that is contracted outside a company’s country is called offshore outsourcing. BPO that is contracted to a company’s neighboring (or nearby) country is called nearshoring. Given the proximity of BPO to the information technology industry, it is also categorized as an information technology enabled service or ITES. Knowledge process outsourcing (KPO) and legal process outsourcing (LPO) are some of the sub-segments of business process outsourcing industry3.
3http://www.business.reachinformation.com/Business_process_outsourcing.aspx; ac-cessed on December 10, 2010.

31
Conceptual clarity regarding the various usages of the term ‘outsourcing’ is required in order to deliberate on the reasons behind the initial occurrence and sustenance of outsourcing and its implication for employment and welfare loss/gain across countries. The empirical literature on outsourcing of services uses varied connotations of outsourcing. However, more often than not, the phenomenon of outsourcing, as a challenge to the policy makers, can broadly be equated to ITES and BPO. The classification of outsourcing services by UNCTAD4 is provided in (Table 2.2).
2.5 Outsourcing and Systems of Data Reporting
Even though there are differences in terms and definition for outsourcing
in different countries, a broad international comparison can be attempted using the IMF data. In its publication on BoP Statistics, the IMF provides data on import of services, which includes the categories most closely related to outsourcing- ‘other business services’ and ‘computing and information services’.
National Academy of Public Administration (2006a) of the US indicated that offshoring business operations are a difficult, elusive and exceedingly complex phenomenon. The disparity of viewpoints on offshoring stem from many factors, such as, lack of commonly accepted definition, varied reliability of data, inherent difficulty in measuring offshoring, etc. It may be noted that literature uses multiple terms to describe offshoring, such as,
Table2.2:BroadclassificationofITandOutsourcingServices
Call/contactcentreservices Back-officeservices ITservices
Help desk Claims processing Software developmentTechnical support/advice Accounts processing Application testingAfter-sales Transaction processing Content developmentEmployees enquires Query management Engineering and designClaims enquires Customer administration Product optimizationCustomer support/advice Processing Market research HR/payroll processing Answering services Data processing Prospecting IT outsourcing Information services Logistics processing Customer relationship Quality assurance Management Supplier invoices
Source: UNCTAD (2006) World Investment Report.
4UNCTAD (2006), World Investment Report

32
‘outsourcing’, ‘offshoring’, ‘offshore outsourcing’, BPO, ITES, IT services, software exports, computer and information services, business services, global sourcing, worldwide sourcing etc. Differences in terms used to indicate outsourcing hinder a clear and precise understanding of this phenomenon. Different institutions and different countries use these terms to broadly mean outsourcing.
In India, the RBI provides the data on Balance of Payments, and in its standard presentation, services are classified under the category of ‘Invisibles’. Services can be further subdivided into Travel, Transportation, Insurance, Government Not Included Elsewhere and Miscellaneous services (including ITES/BPO exports). As is widely known, outsourcing of services has become prominent in recent years. Hence, there is no uniform comparable data for outsourcing to and from different countries in the global context.
2.5.1 Data reporting by RBI
Presentation of Balance Payments Statistics by India follows, Balance of Payments Manual 5th edition (IMF, 1993). In India’s standard BoP format, trade in services comprises commercial services categorized into transportation, travel,
insurance, government services not included elsewhere and other commercial services under the head ‘miscellaneous services’ (Annex 2.1 & 2.2) (RBI, 2010c).
As per the practice of BoP compilation and presentation in India, ‘software services exports’ corresponds to ‘computer services’ and includes (i) hardware consultancy and implementation, (ii) software consultancy and implementation, (iii) database and data processing charges, and (iv) repair and maintenance of computers and software. With regard to ‘computer services’ (software services), for the purpose of BoP compilation, instead of Foreign Exchange Transactions Electronic Reporting System (FETERS) data on ‘software services’ receipts, data sourced from NASSCOM, which include both IT services and ITES-BPO services, are used, while on the debit side it reflects the payments captured through the FETERS purpose codes under the category ‘computer and information services’. This is done in view of full coverage under NASSCOM and inadequate reporting of data on software services under FETERS as some of the IT-enabled services are reported to have been covered under miscellaneous receipts (RBI, 2010c).

33
2.5.2DefinitionandConnotationofOutsourcing Used in this Study:
This study uses information provided under terms, such as, ITES, BPO, Software exports, Computer and Information Services exports, Business Services exports, etc., to get a comprehensive picture on the topic. The scope of this study is limited to ‘international or cross border outsourcing of services’ (offshore outsourcing).
This study mainly uses four sets of data, viz., data compiled by the Reserve Bank of India under its BoP statistics, NASSCOM, IMF and the Centre for Monitoring Indian Economy (CMIE). IMF, BoP statistics provide data on computer and information services and other business services under the category of services. In India’s BoP statistics there is a category miscellaneous services under which data on software services and business services are provided. However, this classification is available only from 2000-01 onwards (software
services from 2000-01 onwards and business services from 2004-05 onwards). This is but natural, as these services gained prominence only in recent years. Besides, data on BoP Statistics compiled by the RBI also makes use of the data on software exports as provided by NASSCOM. As mentioned earlier, data compiled and published by different agencies do not follow a uniform classification system and therefore, are not strictly comparable. This study uses information provided by various organizations under related terms to supplement each other, so that a wider picture or different aspects of outsourcing can be analyzed (Table 2.3).
2.6 Summary
Service sector is an ever expanding sector. Each stage of economic development creates new services. New services emerge and grow and old ones lose their prominence. Developments in information technology have brought numerous
Table 2.3: Information used in this Study to represent Outsourcing
S.No IMF, BoP Statistics RBI, BoP Statistics NASSCOM Others
1 Computer and information Miscellaneous ITES Offshoring services services Of which:
2 Other business services Software exports BPO Call centers
3 Business Services Outsourcing
34
new types of services into prominence, such as, outsourcing or ITES/BPO services. Due to multiplicity of definitions/connotations and usage of the term outsourcing, a narrower definition of offshore outsourcing of the services limits the scope of the study. The services relating to offshore outsourcing as mentioned in the BoP statements are: (i) other business services; (ii) computer
and information services exports; (iii) software exports; (iv) business services exports, etc. We realize that it does not capture the phenomenon of ‘offshore outsourcing’ entirety and to some extent underestimate it. However, for the sake of precision and comparability, we will adhere to this ‘operational’ definition of offshore outsourcing in this study.

35
Presentation of Quarterly data on Services under Balance of Payments and International Investment Position Manual, IMF
Total Services
Manufacturing services on physical inputs owned by others Maintenance and repair services n.i.e. Transport Travel Construction Insurance and pension services Financial services Charges for the use of intellectual property n.i.e. Telecommunications, computer and information services Other business services Personal, cultural and recreational services Government goods and services n.i.e
Source: Balance of Payments and International Investment Position Manual 6th Edition (2009). Note: ‘n.i.e’ indicates not included elsewhere
ANNEXURE 2.1

36
ANNEXURE 2.2
Presentation of Quarterly data on Balance of Payments Statistics, RBI
Total Services
Travel
Transportation
Insurance
G.n.i.e
Miscellaneous
of which:-
Software services
Business services
Financial services
Communication services
Source: India’s Overall Balance of Payments, RBI Bulletin, 2010Note: ‘G.n.i.e’ indicates Government Not Included Elsewhere

37
3. RESEARCH METHODOLOGY
This Chapter provides an overview of the methodological framework followed in the Study. This Chapter is organized into four sections. Section 3.1 briefly sets out the coverage and time span of the study. Section 3.2 describes the variables and data sources. Section 3.3 focuses on the methodologies adopted in this study and Section 3.4 lists out the hypotheses which are to be tested to draw inferences.
3.1 Coverage of the Study
This study is with reference to international outsourcing from India. Outsourcing of services from India became very prominent since the year 2000. The temporal coverage for empirical analysis to be undertaken in this study is 9 years, i.e., 2000-01 to 2008-09. One constraint for the longer time span is classification issues and the availability of data on ITES/BPO exports, as these exports became prominent only in recent years. However, wherever data for previous years are available, these have been analyzed to provide a background. Frequency of data used for empirical analysis is annual.
However, quarterly data is also used, where ever available.
3.2 Variables used and Data Sources
Under the standard presentation of balance of payments statistics, services come under the heading Invisibles. Services can be further subdivided into travel, transportation, insurance, government not included elsewhere and miscellaneous services. The category ‘miscellaneous services’ captures the information on software exports and business services, i.e., outsourcing. Despite the fact that outsourcing of services has become prominent in recent years, there is no uniform comparable data on source and destination wise outsourcing in the global context. In fact, various national and international level organizations have attempted to conceptualize the data issues relating to this sector. For instance, the Central Statistics Office, Government of India (2010b) indicates that “statistics on information and communication technology sector of India are not based on any harmonized concepts, definitions and classifications.

38
Data available are official by-products or generated by business associations, NGO’s and research institutions for their specific uses adopting concepts, methodologies and classification, which may not be according to the international standards”. However, a broad international comparison can be attempted using the data published by the International Monetary Fund (IMF). In its publication on BoP Statistics, the IMF provides data on import of services, which includes the categories most closely related to outsourcing- ‘other business services’
and ‘computing and information services’. Other business services comprise accounting, management consulting, call centers and other back-office operating; computing and information services comprise hardware consultancy, software implementation and data processing. OECD (2005a) indicates that the extent of international trade in IT and ICT-enabled business process services in international statistics can be approximated by using the IMF Balance of Payments categories ‘computer and information services’
Table 3.1: Brief Description of Data used and Analysis Undertaken in this Study

39
and ‘other business services’. These data contain the information on international outsourcing.
Since a single source of data does not give a comprehensive picture, this study mainly uses data from different sources (Table 3.1). Besides these sources, balance sheets /annual reports of corporate firms have been collected from SEBI, BSE and respective websites of companies and analyzed to know more about the firm’s business environment.
3.3 Research Methods
The present study uses descriptive and empirical techniques to draw inferences on various aspects of the study. To study various aspects of outsourcing, a number of empirical exercises are considered, which are: (i) computation of RCA index for examining the comparative advantage of different countries (ii) cointegration test and (iii) firm level panel data analysis. The methodological aspects of these analyses are detailed in Chapter 5. Descriptive analysis, i.e., charts, tabulations, ratios, growth rates, etc., are presented to provide a background to the econometric investigation in Chapter 5.
3.4 Research Questions
This study tries to answer a few research questions using parametric and non-parametric research
methods. These research questions are:
3.4.1 Research Question 1: Is the general perception that US and other developed countries alone outsource (or contract out/import) from developing countries correct? This question is answered by examining the import data on computer and information services and other business services of different countries. Further, intensity of import of these services by major countries in the world is also calculated.
3.4.2 Research Question 2: Does India have a comparative advantage in services exports especially in ITES/BPO exports?
This question is answered using RCA index.
3.4.3 Research Question 3: Has outsourcing to India led to unemployment in the US and the UK?
One of the major arguments supporting protectionism in the US and the UK arises from the loss of employment due to outsourcing from developing countries like India, China, etc. Using data from the US Bureau of Labor Statistics and the UK’s Annual Business Inquiry, this study attempts to analyze the trends in employment growth in relevant sectors in the US and the UK. Further,

40
this study tries to explore the relation between the US and the UK import of services and trend in employment in these countries in sectors that are amenable to outsourcing.
3.4.4 Research Question 4: What is the contribution of ITES/BPO sector to the Balance of Payments position of India?
To answer this question, this study use data mainly from BoP statistics of India. Since the US is the main destination of India’s ITES/BPO exports the study also investigates cyclical co-movement between each item of services exports including software and business services exports with the US GDP growth. In order to compute cyclical component of variables, the Hodrick-Prescott filter is used.
3.4.5 Research Question 5: Does economic growth in the US and Rupee/US $ exchange rate matter for software exports from India?
In theory, depreciation of domestic currency makes domestic exports more competitive and vice versa. NASSCOM indicates that appreciation of Rupee against US Dollar adversely affects software exports. Thus, an inverse relationship between appreciation of exchange rate of Rupee and India’s software exports is expected a priori. However, it is also indicated that exchange rate might
not affect exports much, as the profit margin in this rapidly growing sector is attractive for exporters even after moderate changes in exchange rate. Further studies have also pointed out that government policy measures, such as, fiscal concessions and general business environment, matter more than exchange rate variations. The present study analyzes the relationship between India’s software exports on the one hand and exchange rate and US GDP on the other through cointegration analysis.
3.4.6 Research Question 6: What are the important determinants of exports at firm level?
Apart from examining the explanatory factors for exports from India at the macro level, micro level information is used to explain the determinants of export intensity of ITES/BPO firms. Exports account for a major part of the business of most ITES/BPO firms in India. Thus, it becomes important to explain which factors determine their export performance. As per the traditional view in industrial organization, it is the monopoly power of firm which affects its conduct and market performance. Keeping in view this traditional paradigm, an attempt has been made to explain export performance with the help of possible variables including those representing monopoly power and conduct of firm. In industrial organization, efforts of firms in

41
terms of advertising, marketing and distribution represent their conduct in the market. Advertising and marketing is considered to be a part of non-pricing strategies of firms in market. Thus, it is generally believed that firms with high advertising intensity should perform better. This study uses the variable advertising intensity (i.e., advertising, marketing and distribution expenditure as a per cent of sales) which represents non-pricing strategies of firms. It is hypothesized that higher the advertising intensity, higher will be the export intensity.
Further, the age of the firm represents the proxy for learning through experience. Older firms may have more experienced workers and management and small improvements in the production process becomes a regular phenomenon. Due to more experience and knowledge of the market, they are assumed to have an edge over relatively new firms. The age of the firm may also have positive impact on scale of operations. Apart from this, old firms may also have a better understanding of consumers/clients and government policies (domestic as well as foreign). Further, they may have relatively better financial power through accumulated retained earnings. They may also get funds or capital at cheaper rate or better terms as their creditworthiness is known to the market. Therefore, it is posited that older firms with their experience are supposed to be better placed to penetrate in international market.
Absolute values of sales may not necessarily indicate the performance of a firm in the market relative to its competitors. Changes in sales may simply reflect changes in market size or change in general economic conditions. Therefore, a better measure of capturing firm’s market power is the proportion of the total market sales that a firm has been able to capture over the years. Market share of a firm indicates the extent to which the sale in the total market is shared by it. Higher the market share, higher would be the market power. Market share of the firm representing its monopoly power is expected to impact its exports performance positively. Efficiency of the firms and exports are expected to be positively correlated.
Another variable that is chosen for explaining the export performance of IT firms is in respect of economic performance of trading partner countries. Growth prospects in India’s major trading partner countries are often considered as a pre-requisite for rise in India’s ITES/BPO exports. It may be pointed out that over 80 per cent of India’s ITES/BPO exports are to the US and the UK. Thus, it is hypothesized that growth in the US and the UK economy is essential for growth in India’s ITES/BPO exports. Higher the growth in the US and the UK, higher would be the demand for ITES/BPO services from Indian firms.

42
4. TRADE IN SERVICES: THEORETICAL AND EMPIRICAL LITERATURE
4.1 Introduction
A set of diverse factors can determine the comparative advantage that in turn leads to trade between nations. A few of these are: (i) the availability of natural resources which explain the exports of OPEC countries; (ii) climatic factors that explain rice export from India and tea export from Sri Lanka; (iii) geographical proximity combined with political alliances that explain trade amongst the regional trading groups, such as, intra-European Union trade. Besides these, there are many ambiguous patterns of trade visible in the global economy which cannot be explained so easily, e.g., exports of automobiles and electronic products from Japan or the exports of aircraft from the US (Krugman and Obstfeld, 2000).
While nations generally benefit from international trade, trade can also alter the distribution of income between broad groups, such as workers and the owners of capital. The effects of trade on income distribution have long been a concern of international trade theorists. These concerns along with the perceived job losses in developed countries due to growing outsourcing
of services from developing countries like India, China, etc., are now at the center of real-world policy debates. Assessing claims like this in the context of outsourcing from India is one of the important tasks of this Chapter. This Chapter is organized into 6 sections including the introductory part. Section 4.2 provides a brief description about the debate on applying international trade theory on services. Section 4.3 provides the theoretical explanation for international outsourcing. Section 4.4 deals with empirical studies. Section 4.5 focuses on review of literature on outsourcing related to India. Section 4.6 sums up this Chapter.
4.2 Trade Theories: Application to Trade in Services
An attempt has been made in this section to analyze the differences between trade in goods and trade in services, and assess the applicability of the former to the latter. We also deliberate on the applicability of trade theories to the phenomenon of outsourcing.
There is a multiplicity of views on the applicability of theory on trade in

43
goods to trade in services. One view is that the theories of international trade are based on a well defined conceptual and analytical framework and therefore, this framework do not impose any limitation on using it for the understanding of trade in services. It seems that use of the word ‘good’ is a matter of tradition, not deliberately designed to exclude services (Hindley and Smith, 1984).
Referring to the study by Hindley and Smith (1984), Banga (2005) points out that differences in goods and services do not necessarily apply to trade. In the absence of a developed ‘theory’ of trade in services, the theories set forth to explain that trade in goods like new trade theory (new trade theory explains trade between countries that do not differ in terms of their comparative costs in producing goods but have competitive advantages of specializing, which cause trade) are often applied to services.
However, there were doubts regarding the appropriateness of trade theories to explain the trade in services. Moreover, services can be traded in different modes. According to Francois and Hoekman (2009), by definition, services are flows and so are not storable and their exchange frequently requires the proximity of supplier and consumer. This creates differences in the characteristics of trade in goods and services. The need or necessity of proximity of consumer
and producer (unlike in goods trade) creates a burden or barrier in services trade. This is known as the proximity burden (Christen and Francois, 2009). The intensity of proximity burden plays a role in the development of services. Since the early 1980s, technological change has progressively weakened the proximity burden. Bhagwati (1984) argued that trade in service would expand as a result of the incentive to ‘splinter’ the production chain geographically. By this process, services are ‘disembodied’ or ‘splintered’ from goods. This is also known as fragmentation. This leads to the basic changes in the structure and pattern of trade, as low-wage activities can be sliced away and outsourced. However, when compared to goods, trade in services requires a more prominent presence of local suppliers than cross-border suppliers because of the proximity burden. In this way, trade in services is different from trade in goods.
4.3 Outsourcing: Theoretical Approaches
In general, countries with low productivity have lower wages. This describes many manufacturing industries in India, which are less productive than their counterparts in the US or Europe. As a result of lower productivity in these industries, wages in India are low. However, in service activities productivity of the Indian workers is fairly comparable to their

44
counterparts in developed countries (Feenstra and Taylor, 2008). They give the example of call centers located in India wherein, the Indian employees are able to handle about the same number of calls as the employees in the call centers located in the US. India has a comparative advantage in service activities because its opportunity cost of producing services in terms of manufacturing is low relative to US (Feenstra and Taylor, 2008). The costs of outsourcing relatively unskilled manufacturing activities to India are higher than the costs of outsourcing skilled service activities. This is because outsourcing manufacturing activities also involve transportation costs. The poor quantity and quality of transport infrastructure, delays in transportation and bureaucratic hurdles add up to costs in the case of outsourcing manufacturing jobs to India. In this regard, better infrastructure in China vis-à-vis India makes it a preferable location for outsourcing manufacturing activities. Service activities on the other hand, do not rely as much on physical infrastructure, such as, transportation but instead require reliable and cheap communication media and the knowledge of English. The communication infrastructure is fairly good in India. English language skills, the time zone also provide India with comparative advantage in trade in services, and especially in BPOs (Feenstra and Taylor, 2008).
Marjit (2007) explains service trade in the information technology sector through ‘nature’ driven comparative advantage. Here, it is the time difference which emerges as an independent driving force of international trade besides taste, technology and endowment. The study indicates that trade in services sector related to IT sector does not require physical shipment of goods. For example, programming problems are e-mailed to India from the US at the end of the day (in the US). Indian software professionals start working on them in their regular office hours, while in the US the office remains closed because it is night in the US (because of time differences). By the time offices reopen in the next day morning in the US, the solutions for programming problems would have already arrived mainly as e-mail attachments from India. This means that the business operations can continue almost for 24 hours.
Bhagwati et al (2004) present a model of outsourcing with two factors of production, labour and capital, assuming diminishing returns to the labour and capital (Figure 4.1). Let the MPL curve in Figure 4.1 represent the marginal product of labour, given the fixed endowment of capital in the economy. Let Lo be the endowment of labour. The wage in terms of the final good is represented by Wo. The wage bill is the area formed by the

45
rectangle OWoEoLo. The return to capital is the area under MPL curve and above the horizontal line WoEo.
Given only one good, this model offers no scope for conventional international trade. Suppose, that an innovation allows the economy to buy the services of labour abroad electronically at the fixed wage W’. The economy continues to hire the same endowment of domestic labour, but now paying the lower wage. In this case, the economy buys LoL’ labour abroad paying the rectangle LoL’E’R for it. Domestic labour
receives OLoRW’ and capital the area under the MPL curve and above the horizontal line W’E’. The following economic effect is obtained now. The country’s total income rises by the triangular area EoRE’, which is the net gain from outsourcing. The income of labour, the ‘import-competing’ factor, declines by area WoEoRW’ and is redistributed to capital. Thus, capital owners make a gain WoEoE’W’. This model captures much of the popular rhetoric that expresses doubts about outsourcing. That is, the model shows that outsourcing would benefit society as a whole. But in the absence of a
Figure: 4.1 Gains from Outsourcing
Source: Bhagwati et al (2004)

46
method for some of the social benefits received by capital to be transferred to workers, firms or owners of capital receive more than 100 per cent of the social benefits from outsourcing, while workers experience losses.
Mitra and Ranjan (2005) present a theoretical model of offshore outsourcing and examine what starts this process and what determines the dynamics of this process once it has started. This study claims that the Y2K (year 2000 date switching issue in software) software crisis opened up opportunities for Indian IT companies, such as, Wipro, TCS, and Infosys. Outsourcing to India continued even after the temporary shock of the Y2K crisis was over. The initial advantage of a country in outsourcing activities can create a lock in effect5, whereby other countries which are latecomers have a comparative disadvantage.
Arora and Gambardella (2004) points out that outsourcing is advantageous for US and conclude that development of technology in emerging countries is unlikely to pose a long term threat to American technological leadership. Instead, the US economy will broadly benefit from the growth of new software producing regions. The US technological leadership rests in part upon the continued position of the US as the primary destination for highly
trained and skilled scientists and engineers from the world over.
Grossman and Rossi-Hansberg (2006) indicate in their study that, to better understand offshoring, we need a new paradigm for studying international trade that emphasizes not only on the exchange of complete goods, but also trade in specific tasks (task trade) or offshoring.
4.4 Empirical Studies
WTO (2005) indicates that the major determinants of outsourcing decisions are technical and institutional separability of work and the extent to which the task can be standardized. The study mentions that recent innovations, particularly in IT have made an increasing number of service tasks separable in time and space. Services can be standardized by making them as a set of instructions or tasks that workers can follow routinely and easily, e.g., accounting, billing, etc. If a firm decides to outsource, fixed managerial costs of the firm are limited to searching for a supplier and negotiating a contract and these searching costs can be considerably lower than setting up in-house production facilities. There are also variable managerial costs, such as, costs of monitoring and coordinating production. These
5Lock in effect means advantage of starting first. The firms that start a service first establish and capture the market first.

47
costs are usually lower with in-house production than with outsourcing and make outsourcing less attractive. The decision to outsource is thus based on finding the balance between fixed and variable costs that results in lowest total costs. Similarly, the size of market is also very important.
Gorg and Hanley (2009) provide an empirical analysis of the links between international services outsourcing, domestic outsourcing, profits and innovation using plant level data from Ireland covering the period 2000 to 2004. The study examines whether domestic and international outsourcing have similar effects on innovation. Expenditure on R&D is taken as proxy for innovation. This study finds a positive and statistically significant association between international services outsourcing and R&D activities. Such a positive effect can also be observed for domestic outsourcing of services, but the magnitude is smaller. This is because international outsourcing allows more scope for exploiting international factor price differentials, giving the firm more profits and more scope to restructure production activities towards innovation. More profit will allow more reinvestment in R&D activities. In short, outsourcing allows a plant to restructure activities towards more skill intensive activity. Liu and Trefler (2008) study the impact of outsourcing of services to
China and India on the US labour markets in a regression framework using data for the period 1996-2006. One speciality of this study is that it also considers the positive effect on the US economy due to the reverse flow or ‘inshoring’ which is the sale of services produced in the US to buyers in China and India. The study stresses that it is inappropriate to look only at the costs of outsourcing to low wage countries without looking at the benefits of inshoring to these countries. The study estimated positive effects of inshoring and negative effects of outsourcing and concludes that the net effect of inshoring and outsourcing was positive for United States.
Kirkegaard (2005) studied the winners and losers due to the outsourcing in Europe. The study makes use of descriptive analysis and concludes that a number of firms in Europe gain from outsourcing due to cost saving mostly arising from lower labour costs. It indicates that saving from outsourcing ranges from 30 to 60 per cent of the total cost.
Blinder (2006) in a descriptive study indicates that the patterns of man-made comparative advantage which explains trade, can and does change over time. Bhagwati (1994) has labeled this phenomenon ‘kaleidoscopic comparative advantage’ and this is critical to understand outsourcing. In earlier times, UK had a comparative advantage in textile manufacturing.

48
Later that advantage shifted to US. Presently, the comparative advantage in textile manufacturing has shifted to low-wage country China. The development in IT has resulted in third industrial revolution (involving present outsourcing) which will continue over next several decades (Blinder 2006).
Baily (2007) in an investigation for the period 1999-06 indicated that the US has allowed market forces to play out more strongly than Europe, resulting in more benefits and more costs to its economy. The US has a comparative advantage in services and at times despite an overvalued dollar there has been a consistent surplus in services trade. In short, trade in services has created number of jobs in the US. The study points out that the belief that billions of new workers entering the global workforce due to outsourcing, is misleading. Based on qualification and experience, in 2003 there were about 33 million workers in low-wage countries capable of replacing service jobs in the US. However, among these 33 million, only 4 million were really available because the quality of education, inadequate language skills and geographic location were all significant barriers. The study concludes that the net effect of offshoring is positive for the US economy in terms of increasing productivity and real income and lowering costs and thus inflation.
Mankiw and Swagel (2006) in a descriptive analysis using annual Bureau of Economic Analysis data indicated that outsourcing is unlikely to have resulted in significant job losses in the US. While trade is beneficial for the nation as a whole, a section of workforce is adversely affected due to the problem of dislocation. The appropriate policy response is to help affected workers in adjusting to the change. Polices aimed at preventing outsourcing could lead to lower living standards for both Americans and citizens of developing countries. The study also indicates that the topic of outsourcing is as much a political topic as an economic one, especially in the election years.
4.5 Literature on Outsourcing Related to India
Ahuja (2004) in a theoretical study focuses on the micro aspects of outsourcing. The study points out that only very limited information is available on outsourcing of services. Besides direct cost reduction, BPO also benefits developed countries through other channels, such as, through repatriation of earnings by national offshore providers located in developing countries. The study indicates that even though BPO may eventually bring many benefits to an economy, it may also bring distribution problems in the short run, resulting from job loss at a firm

49
or at an industry level. Recognizing the welfare implications, the study suggests a compensation criterion, i.e., to tax firm’s profits to relocate retrenched workers through training, etc.
Bhagwati, et al (2004) highlights on the effects of outsourcing from buyers’ side, especially focusing on the debate on job loss in the US. The study also points out that it is empirically wrong to believe that most of the service jobs will be outsourced to India and China due to low labour costs. Empirically, it may be seen that majority of the jobs in the US are in service industries like retailing, restaurants, tourism, etc., that require both consumer and producer to be present in the same place and, therefore, cannot be outsourced.
Using IMF’s Balance of Payments Statistics for the period 1983-03, the study by Amiti and Wei (2004a) brings out three interesting findings: (i) the belief that large industrialized countries outsource more intensely is not correct; (ii) outsourcing does not lead to decline in employment in country which outsources; and, (iii) in terms of economic size, it is the smaller economies which are outsource intensive. Outsourcing may lead to shedding of labour but the increased efficiency could eventually lead to higher production and an expansion of employment in other lines of work. Regarding outsourcing
and its effect on unemployment, the authors cite a study by McKinsey (2003), which indicates that more than 69 per cent of workers who lost their jobs due to imports in the US between 1979 and 1999 were re-employed. In this context, it may also be noted that a phenomenon known as ‘reverse outsourcing’ has begun to assert itself. For example, the Indian outsourcing firm Wipro, has added many US based consultants to its staff. Similarly, firms based in India and China have begun setting up bases in the US and hiring US workers.
Ramesh (2004) points out the vulnerabilities for labourers in India’s BPO sector. The study is based on field survey of call centers and has observed that firms often terminate the job to get rid of long-term commitments towards employees. Labourers who work on voice processes, are forced to live as Indians during day time and Westerner after sundown (since they have to interact with their clients in Western countries). Many a times, customers are irritable and abusive. Further, odd working time conflicts with the natural rhythm of human body resulting in increased healthcare costs besides affecting personal and social life. Workers are not entitled to national/religious holidays, as the firms work on the basis of clients’ calendar. The long-term opportunity costs of BPO work could be still higher as most of the
50
young workers are burning out their best time for higher education and instead working as ‘cyber coolies’. Further, women’s scope in the job is extremely constrained due to odd timings of work.
Sandhu (2006) examines the difficulties of unionizing in BPO sector in India. This study for the period 2000-04 is mainly based on interviews conducted on employees in Bangalore. It points outs that there have been attempts at unionizing the call centre industry since the year 2000. As a result, Information Technology Professionals’ Forum (ITPF) came into being and it gained recognition as an official organization from the Karnataka State Government as a society. The organization is registered as ‘society’ rather than a labour ‘union’ because of the perception that the nomenclature of union would have an adverse impact on labour status. Further, BPO workers oppose unions, which they associate with the pre-1991 era of slow economic growth and limited opportunities. BPO workers associate their work with upward mobility, clean work clothes, shiny buildings, etc.
Kumar (2001) in a descriptive analysis points out that export led growth has been the mainstay of the spectacular performance of the Indian software industry. This study cautions that despite exemplary performance of the Indian software industry, there is no
room for complacency in view of the competition from countries like China, Philippines, etc. In this regard, Indian software industry needs to strengthen its thrust on R&D activity. The study further points out that since India has natural advantage in software exports which is growing at a double digit level, there seems to be little relevance for tax breaks on a sustained basis.
The study by NASSCOM (2007) focuses on China and is based on a series of interactions with Chinese officials and interviews with IT software companies during 2006. At present the portfolio of services sourced from India are more broad-based than that of China. Further, India based service providers have already built a robust process of managing service delivery. This is still evolving in China. However, strong Government support, excellent quality of infrastructure and rapid pace of growth of domestic economy, are the major strengths of Chinese IT-BPO sector. Further, the geographical proximity and cultural similarity to advanced markets like Japan and Korea is a great help to Chinese IT-BPO sector. Lack of transparency in procedures and weak intellectual property protection are the major weaknesses of China.
Taganas and Kaul (2006) explore the strategies of firms in the Indian IT industry and their innovative behavior. The study collected data in response to a questionnaire based survey

51
and concludes that India’s software firms are generally weak to spur innovation within the industry. Most of the innovations are incremental rather than radical in nature. The study suggests Indian IT firms should further increase their focus on R&D to sustain their growth.
Joseph and Harilal (2001) in their descriptive study (using NASSCOM data) discuss India’s performance in software exports, implications of IT boom on availability of skilled manpower in other competing sectors and the possible threats to the sustained growth of software exports. The study indicates that institutional and policy reforms initiated by the government seem to have paid rich dividends in terms of making India a major exporter of software.
Patibandla and Petersen (2002) in their empirical study, focus on the role of Transnational Corporations (TNCs) in the evolution of India’s software industry. World class educational institutions in India including the IITs have provided a major incentive for TNCs to enter India to take advantage of the low-cost high-skilled workforce. The study also deals with theoretical issues relating to technological capabilities and spillovers. Open policies towards international trade and multinational investment is a major source of technology. However, local firms and workers in developing economies need to have
minimum capabilities to absorb new technologies.
The study concludes by pointing out that India’s software industry presents the case of an internationally competitive high-tech industry from a developing economy. Several factors have contributed towards its growth like the previous import substitution policies, which invested heavily in subsidized higher education and a critical level of technological endowments, emergence of a few dynamic local technocrat-entrepreneurs, the policy support and the entry of TNCs. The market reforms that were initiated in 1991 in India increased the openness of the economy and gave a big boost to the industry.
4.6 Summing Up
The received theories of international trade have traditionally centered on the exchange of goods. A theory for trade in services and outsourcing is still evolving. Conventionally, services were included under the category nontradables. However, technical progress has enabled several services to be exchanged long distance just like goods, rendering the criterion of non-tradability obsolete. With the passage of time, an increasing number of services joined the long-distance category. In fact, the current age in which services dominate the trade scenario is termed as the third

52
industrial revolution (Blinder, 2006). The non-tradability view of services is therefore no more valid. The debate on applying international trade theory in goods to services or development of a separate theory for trade in services is continuing. Grossman and Rossi-Hansberg (2006) indicate that the modern production process involves sets of tasks rather than manufacturing complete goods. In this regard, offshoring is more about ‘task trade’ or trade in specialized tasks. Therefore, we need a new framework for studying international trade that emphasizes not only the exchange of complete goods (conventional trade theory deals with trade in complete goods), but also trade in specific tasks or offshoring. According to Marjit (2007) it is time difference which emerges as an independent driving force of international trade besides taste, technology and endowment. Most of the theoretical literature on the topic examines the determinants of the decision to outsource. These studies focus on aspects like rise of technology, relationship-specific investment, incomplete contracts, search and matching concepts, distance between countries, etc., to explain outsourcing decisions.
Majority of the studies point out that fear of job loss in western countries related to outsourcing are exaggerated. The WTO (2005) indicates that, the impact of offshoring
services jobs is far stronger in the popular perception than on actual production, employment and trade patterns. The number of jobs affected by offshoring IT services is small when compared to the overall employment levels in the developed countries. Majority of the theoretical studies do not support trade barriers to prevent job losses due to outsourcing because it would result in net loss of welfare. Studies have pointed out that even though there is no loss of job at the aggregate level, there is a change in skill mix due to outsourcing. The study by Amiti and Wei (2004a) is very relevant in the context of anti-outsourcing legislations in developed countries, like the US. It points out that if size (i.e., in terms of GDP) of the economy is taken into account, developing countries not only export but also is a large importer of business services.
Regarding the emerging literature on this topic for India, it may be pointed out that, even though there are many reports in newspapers, magazines, etc., on outsourcing, there is a dearth of full-fledged focused studies on the various facets of outsourcing of services from India. Many of the studies focus on the conditions of employment in the BPO firms in India and the prospects for labour unions in this sector. A major limitation in conducting the studies in this arena is that of obtaining information/data

53
needed for any meaningful analysis. Other major lacunae of the existing studies are that they provide only a partial picture as they utilize only a single source of data/information like either NASSCOM database or questionnaire based surveys. A comprehensive study using all available sources of data/information on the topic is conspicuous by its absence. Economic Times and NASSCOM have conducted studies on outsourcing to India. But these studies are in the nature of review of industry performance at best. Ramesh
(2004) is a questionnaire based study focusing on labour issues and harsh conditions of work in Indian BPOs and points out the negative side of employment in BPOs. However, the recent reports indicate that there are also some positive aspects of employment in BPOs. Many BPOs have started measures for the benefit of their workers, like leisure trips, exercise courses, social interaction programmes, added financial incentives, etc. BPOs are also helping to create new employment opportunities.

54
5. OUTSOURCING FROM INDIA: AN EMPIRICAL ANALYSIS
5.1 Introduction
Chapter 5 is devoted to empirical analysis. Data used in this chapter are mainly from IMF, BoP statistics and CMIE. The International Monetary Fund (IMF) provides data on import of services (in its BoP Statistics), which includes the categories most closely related to outsourcing, i.e., ‘other business services’ and ‘computing and information services’. OECD (2005a) states that the extent of international trade in IT and ICT-enabled business process services in international statistics can be approximated by using the IMF Balance of Payments categories ‘computer and information services’ and ‘other business services’. Other business services comprise accounting, management consulting, call centers and other back-office operating; computing and information services comprise hardware consultancy, software implementation and data processing. Revealed Comparative Advantage (RCA) index is constructed to analyze the competitive advantage of various countries in ITES/BPO
exports. Econometric exercises, i.e., cointegration test and panel data analysis are done using E-views software. Besides the above, an attempt is made to examine the cyclical behavior of major components of services exports (including software and business services) from India in relation to cyclical behavior of economic activities in the US. Seasonally adjusted series has been used to remove trend using the Hodrick-Prescott filter. This Chapter is divided into nine sections including introduction. Section 5.2 attempts to calculate and compare the intensity of outsourcing in developing and developed countries. Section 5.3 calculates RCA index to examine the leading countries in the world in ITES/BPO exports. Section 5.4 investigates the impact of offshore outsourcing on jobs in the US and the UK. Section 5.5 examines the importance of ITES/BPO exports to India’s balance of payments and foreign exchange reserves. Section 5.6 investigates the long-run relationship between India’s ITES exports and the US economic growth which is the major market for

55
India using cointegration analysis. Section 5.7 provides a firm level analysis of structure of India’s ITES sector. Section 5.8 explores the major variables behind the growth of ITES/BPO firms in India through panel data analysis. Section 5.9 briefly explores the status of fiscal concession to ITES sector. Lastly section 5.10 summarizes the Chapter.
5.2 Intensity of Outsourcing by Developed and Developing Countries: A Comparison
In this section, we provide an empirical analysis of the intensity of outsourcing across the developing and developed countries. The data for this analysis is obtained from the Balance of Payments Statistics published by the International Monetary Fund. Annual data on imports of ‘Computer and Information Services’ and ‘Other Business Services’ is used for this exercise. The period of the study is 2000 to 2008 for computer and information services, and 1995 to 2008 for other business services. Periodicity of this exercise is constrained by availability of data. This analysis of data on imports of computer and information services and other business services shows that the media reports indicating the US and other developed countries are adversely affected by outsourcing (or contract out services) to developing
countries like India and China do not portray the complete reality. Our analysis shows that though in absolute levels the US and Germany are the top two importers of computer and information services in 2008, India is also a major importer in the world with a rank of 6th position (Table 5.1). This has also been demonstrated earlier by Amity and Wei (2004). However, it may be pointed out that, there is nothing unusual about the large economies in the world like the US and Germany importing more than smaller ones.
To get an idea of relative importance of outsourcing for an economy, it is important to know the intensity of imports or share of imports in the economy, i.e., imports as per cent of GDP. Therefore, for the same group of countries in Table 5.1, intensity of imports (computer and information services imports as per cent of GDP) is presented. From the Table 5.2 it can be seen that intensity of import is maximum for Luxembourg followed by Finland and Sweden. Even though at an absolute level, US stood as the biggest importer, its rank of intensity of imports of computer and information services is lower than many other countries. Intensity of imports of computer and information services of many developing countries including India and Brazil is higher than that of US.

56
Table 5.1: Import of Computer and Information Services (US $ billion)
Country 2000 2001 2002 2003 2004 2005 2006 2007 2008 Rank
United States 1.6 1.8 1.5 1.9 2.2 2.4 13.4 14.8 16.1 1
Germany 5.0 6.1 6.2 7.3 8.1 8.6 9.2 11.8 13.5 2
UK 1.3 1.7 2.0 2.9 3.4 4.0 4.7 5.3 6.3 3
Netherlands 1.2 1.3 1.6 2.4 3.1 3.7 4.5 5.5 5.7 4
Japan 3.1 2.6 2.2 2.1 2.2 2.4 3.1 3.6 4.0 5
India 0.6 0.9 0.9 0.7 0.9 1.3 2.0 3.5 3.4 6
Sweden 1.1 0.9 0.9 1.2 1.4 1.5 2.3 3.0 3.3 7
China,P.R 0.3 0.4 1.1 1.0 1.3 1.6 1.7 2.2 3.2 8
Spain 1.2 1.5 1.6 1.7 1.7 2.0 2.1 2.6 2.8 9
Brazil 1.2 1.1 1.2 1.1 1.3 1.7 2.0 2.3 2.8 10
Belgium - - 1.4 1.6 2.0 1.9 2.0 2.2 2.7 11
Canada 0.9 0.9 1.3 1.6 1.7 1.8 2.0 2.5 2.2 12
France 0.7 1.0 1.2 1.2 1.4 1.8 2.0 2.3 2.1 13
Italy 0.9 0.9 1.1 1.1 1.2 1.5 1.7 1.8 2.0 14
Finland 0.3 0.3 0.4 0.5 0.7 1.2 1.1 1.5 1.9 15
Norway 0.2 0.4 0.6 0.5 0.6 1.0 1.3 1.7 1.8 16
Austria 0.4 0.4 0.5 0.7 0.9 1.0 1.1 1.5 1.7 17
Russia 0.5 0.6 0.5 0.5 0.3 0.5 0.6 1.0 1.4 18
Australia 0.5 0.5 0.5 0.7 0.8 0.8 0.9 1.2 1.3 19
Ireland 0.3 0.6 0.6 0.4 0.4 0.4 0.7 0.9 1.0 20
Poland 0.2 0.3 0.3 0.4 0.4 0.4 0.6 0.9 1.0 21
Czech Republic 0.1 0.1 0.1 0.2 0.2 0.5 0.5 0.8 0.9 22
Malaysia 0.2 0.2 0.2 0.2 0.3 0.4 0.5 0.6 0.9 23
Hungary 0.1 0.2 0.2 0.3 0.4 0.5 0.6 0.7 0.8 24
Luxembourg 0.3 0.3 0.3 0.4 0.6 0.7 0.7 0.8 0.8 25
Note: Rank is for the year 2008(out of 88 countries).Source: Balance of Payments Statistics, IMF(2010)

57
Table 5.2: Intensity of Computer and Information Services Imports
Country 2000 2001 2002 2003 2004 2005 2006 2007 2008 Rank
Luxembourg 1.4 1.4 1.2 1.3 1.7 1.8 1.6 1.5 1.3 1
Finland 0.3 0.3 0.3 0.3 0.4 0.6 0.5 0.6 0.7 2
Sweden 0.4 0.4 0.3 0.4 0.4 0.4 0.6 0.7 0.7 3
Netherlands 0.3 0.3 0.4 0.4 0.5 0.6 0.7 0.7 0.7 4
Belgium 0.0 0.0 0.5 0.5 0.6 0.5 0.5 0.5 0.5 5
Hungary 0.3 0.3 0.3 0.3 0.4 0.4 0.5 0.5 0.5 6
Czech Republic 0.1 0.2 0.2 0.2 0.2 0.4 0.4 0.4 0.4 7
Austria 0.2 0.2 0.2 0.3 0.3 0.3 0.3 0.4 0.4 8
Singapore 0.2 0.3 0.3 0.4 0.3 0.3 0.5 0.4 0.4 9
Malaysia 0.2 0.2 0.2 0.2 0.3 0.3 0.3 0.3 0.4 10
Norway 0.1 0.2 0.3 0.2 0.2 0.3 0.4 0.4 0.4 11
Ireland 0.3 0.5 0.4 0.2 0.2 0.2 0.3 0.3 0.4 12
Germany 0.3 0.3 0.3 0.3 0.3 0.3 0.3 0.4 0.4 13
Romania 0.1 0.1 0.1 0.1 0.1 0.4 0.3 0.3 0.4 14
India 0.1 0.2 0.2 0.1 0.1 0.2 0.2 0.3 0.3 15
UK 0.1 0.1 0.1 0.2 0.2 0.2 0.2 0.2 0.2 16
Portugal 0.1 0.1 0.1 0.1 0.1 0.1 0.2 0.2 0.2 17
Poland 0.1 0.1 0.1 0.2 0.2 0.1 0.2 0.2 0.2 18
Spain 0.2 0.2 0.2 0.2 0.2 0.2 0.2 0.2 0.2 19
Brazil 0.2 0.2 0.2 0.2 0.2 0.2 0.2 0.2 0.2 20
Canada 0.1 0.1 0.2 0.2 0.2 0.2 0.2 0.2 0.1 21
Indonesia 0.0 0.0 0.0 0.0 0.2 0.2 0.2 0.2 0.1 22
Australia 0.1 0.1 0.1 0.1 0.1 0.1 0.1 0.1 0.1 23
United States 0.0 0.0 0.0 0.0 0.0 0.0 0.1 0.1 0.1 24
Italy 0.1 0.1 0.1 0.1 0.1 0.1 0.1 0.1 0.1 25
Note: Rank is for the year 2008(out of 88 countries); Intensity is calculated as Import as Per cent of GDPSource: Balance of Payments Statistics, IMF(2010)

58
Table 5.3: Import of Other Business Services (US $ billion)
Country 1995 1996 1997 1998 1999 2000 2001 2002 2003 2004 2005 2006 2007 2008 Rank
Germany 24 25 25 28 33 33 37 36 40 46 50 55 63 68 1
USA 18 21 23 25 32 34 35 37 40 44 50 46 50 58 2
Italy 16 17 17 21 18 18 20 20 24 27 31 36 45 49 3
Ireland 5 6 7 12 11 14 17 19 22 28 31 33 41 48 4
UK 9 11 11 14 16 17 18 20 23 27 30 36 44 47 5
Japan 32 33 32 28 26 24 24 25 23 25 27 30 35 41 6
China,P.R 7 7 6 6 7 7 8 8 10 14 16 21 30 39 7
France 17 17 16 16 15 15 16 19 23 24 26 29 34 36 8
Spain 6 6 7 8 9 10 11 12 15 18 20 25 32 36 9
Netherlands 12 12 13 14 14 17 19 21 24 26 27 24 26 29 10
Korea, Rep. 6 8 8 8 8 10 9 10 11 13 16 18 22 28 11
Belgium - - - - - - - 10 12 13 14 14 20 26 12
India 3 3 3 5 7 4 4 4 7 12 14 18 18 21 13
Sweden 3 3 3 6 7 8 9 10 11 12 12 14 17 20 14
Singapore 3 3 4 4 4 4 5 6 8 10 11 15 17 18 15
Russia 3 4 5 4 3 3 4 5 5 6 6 9 12 16 16
Canada 6 7 8 8 9 10 9 9 11 11 12 13 13 14 17
Brazil 2 2 3 3 2 3 4 4 4 5 7 9 11 14 18
Switzerland 1 1 1 1 2 2 2 3 3 6 9 8 11 13 19
Finland 3 3 2 2 2 3 2 4 5 5 7 7 9 13 20
Thailand 5 5 5 4 4 4 3 4 4 4 5 7 10 12 21
Saudi Arabia 6 10 12 6 7 8 5 4 5 7 0 0 6 10 22
Angola 1 1 2 2 2 2 3 2 2 2 3 3 6 9 23
Norway 2 2 3 3 3 3 3 3 3 4 5 6 7 9 24
Austria 10 11 12 11 4 3 4 4 5 6 6 7 8 9 25
Israel 2 2 2 2 3 4 4 4 4 4 5 5 7 8 26
Poland 2 1 1 2 2 2 2 2 2 2 3 4 5 6 29
Australia 2 2 2 2 2 2 2 2 2 2 3 3 4 6 30
Note: Ranks are for the year 2008Source: Balance of Payments Statistics, IMF(2010)

59
Table 5.4: Intensity of Other Business Services Imports
Country 1995 1996 1997 1998 1999 2000 2001 2002 2003 2004 2005 2006 2007 2008 Rank
Rep. of Congo 21.3 27.2 22.4 33.9 28 17.1 21.8 22.2 15.4 13.1 15.4 23 31.6 - 1
Lebanon - - - - - - - 0.3 11.7 16 14.8 16.6 18.4 25 2
Angola 24.5 20 19.7 29.7 26.2 19.2 29.3 13.7 12 11.2 10.6 6.8 10.6 10.3 3
Suriname 8.7 7 8.7 6.3 5.5 6.3 8.4 6.4 5.5 6.7 10 7.5 8.3 7.8 4
Guyana 2 1.8 1.7 2.6 2.7 1.8 2.7 3.4 2.5 4.8 2.3 3.4 3.5 4.2 5
Estonia 1.1 1.9 2.2 2.7 2.6 3.2 3.4 2.9 3.5 2.9 2.9 2.8 3.1 3 6
Rwanda 0.8 0 1.1 0.5 0.6 0.6 0.6 0.6 - - - 1.6 2.7 3 7
Côte d’Ivoire 2.5 2.6 2.9 2.7 2.5 2.5 2.9 3.1 2.3 2 1.6 1.7 1.3 2.6 8
Spain 1 1 1.2 1.3 1.5 1.7 1.8 1.8 1.7 1.7 1.8 2 2.3 2.2 9
Italy 1.4 1.3 1.4 1.7 1.5 1.6 1.8 1.7 1.6 1.5 1.7 1.9 2.1 2.1 10
Austria 4.2 4.8 5.9 5 1.7 1.8 1.9 1.8 1.8 1.9 2.1 2.1 2 2.1 11
Botswana 1.3 1.4 1.9 2.6 1.9 1.2 1 1.1 1.4 1.2 1.2 1.4 1.9 2.1 12
Saudi Arabia 4.4 6.4 7.3 4.2 4.4 4.5 2.5 2.4 2.3 2.9 0 0 1.5 2 13
Norway 1.5 1.4 1.9 2.2 2.1 1.8 1.8 1.8 1.5 1.4 1.7 1.8 1.8 1.9 14
Germany 1 1 1.2 1.3 1.5 1.7 1.9 1.8 1.7 1.7 1.8 1.9 1.9 1.9 15
India 0.8 0.8 0.8 1.1 1.6 0.9 0.8 0.8 1.2 1.7 1.7 2 1.7 1.7 16
UK 0.8 0.9 0.8 1 1.1 1.1 1.2 1.3 1.2 1.2 1.3 1.5 1.6 1.7 17
Ghana 1.4 1.3 1.5 1.5 1.4 2.2 2.3 2.1 3 2.8 1.9 2.3 2.1 1.7 18
France 1.1 1.1 1.1 1.1 1 1.2 1.2 1.3 1.3 1.1 1.2 1.3 1.3 1.3 19
Fiji 5.9 5.1 5.5 6.5 6.3 2.3 1.8 1.1 1.3 1.1 1.3 1.9 1.5 1.1 20
Russia 1 1.1 1.3 1.4 1.6 1.3 1.2 1.5 1.2 1 0.8 0.9 0.9 1 21
Nicaragua 2.2 2.1 2.4 2.2 2.1 2 1.7 1.2 1.5 1.3 1 1.1 1.1 1 22
Costa Rica 0.9 1.4 1 1.1 1.1 1.3 1.3 1.2 1 0.9 0.9 0.9 0.9 0.9 23
China 1 0.8 0.6 0.6 0.7 0.6 0.6 0.5 0.6 0.7 0.7 0.8 0.9 0.9 24
Japan 0.6 0.7 0.7 0.7 0.6 0.5 0.6 0.6 0.5 0.5 0.6 0.7 0.8 0.8 25
Brazil 0.2 0.2 0.3 0.4 0.4 0.5 0.8 0.7 0.8 0.7 0.8 0.8 0.8 0.8 26
Ethiopia 0.7 0.8 0.9 0.9 1.1 1 1 0.9 1.4 1.5 1.1 0.9 0.8 0.7 27
United States 0.2 0.3 0.3 0.3 0.3 0.3 0.3 0.3 0.4 0.4 0.4 0.3 0.4 0.4 28
Dominican Rep. 0.1 0.1 0.1 0.1 0.1 0.1 0.1 0.1 0.1 0.1 0.1 0.1 0.1 0.1 29
Sudan 1 0.1 0 0 0.1 0.1 0 0 0 0.1 0.1 0.1 0 30
Note: Ranks are for the year 2007. Intensity is calculated as Import of other business services as per cent of GDP.Source: Computed from Balance of Payments Statistics, IMF(2010)

60
Besides, computer and information and services, another component of offshore outsourcing which we analyze in this study is the category ‘other business services’. In this regard, Table 5.3 shows that the top three importers of other business services in 2008 were Germany, the US and Italy. India and China- two countries that are major topics of discussion as major exporters of ITES/BPO services are themselves significant importers of other business services (with a value of US $ 21 billion for India and US $ 39 billion for China, and ranked 13th and 7th in the world respectively, (Table 5.3). This clearly points out that the biggest importers in computer and information services and other business services are leading developed countries like the US and the UK followed by emerging countries like India and China. Calculation of intensity of import of business services, indicates that smaller under developed African countries like Congo, Lebonon, Angola, etc., are much more outsourcing-intensive than developed countries like the US and the UK (Table 5.4)
In short, we can say that even though industrialized countries outsource (contract work to other countries) more than developing countries in absolute terms, in terms of size of economy (GDP), it is the developing countries which import more than developed countries. This has also been demonstrated earlier by
Amity and Wei (2004). The general perception that global trade in ITES/BPO services is dominated by lopsided one-way outsourcing by developed countries from developing countries is not supported by the available data.
5.3 RCA Index: Methodology
The study computes Revealed Comparative Advantage (RCA) index for different countries to find out countries that have a comparative advantage in computer and information services exports. The study used the Balassa Index (1965) to measure the ‘Revealed Comparative Advantage’ (RCA). The formula for calculation of this index is stated in equation 5.1.
RCA = (Xij/Xit)/(Xnj/Xnt)= (Xij/Xnj)/(Xit/Xnt) ......(5.1)
Where X represents exports, i is a country, j is a commodity (or industry), t is a set of commodities (or industries) and n is a set of countries. RCA measures a country’s exports of a commodity (or industry) relative to its total exports and to the corresponding exports of a set of countries. A comparative advantage is ‘revealed’, if RCA > 1. If RCA is less than unity, the country is said to have a comparative disadvantage in exports of the commodity/industry. An alternative RCA index (RCA 2) is also computed. RCA 2 recognizes the possibility of simultaneous exports (X) and imports (M) within a particular

61
service/industry (Utkulu and Seymen, 2004).
RCA 2 = (Xij-Mij) / (Xij+Mij)……..(5.2)
In the case of equation 5.2, the index ranges from -1 (Xij = 0 revealed comparative disadvantage) to +1 (Mij = 0 revealed comparative advantage).
RCA index is calculated to find out countries that have a comparative advantage in business services and
computer software related exports. Tables 5.5 and 5.6 presented below give the RCA 1 indices for merchandise goods exports and services exports calculated using BoP statistics. A broad comparison clearly points out that India has advantage in exporting services which includes outsourcing of services when compared with export of goods (Figure 5.1). Further, the indices point out that in the case of India, the RCA in goods export is gradually decreasing while that of services export is increasing.
Table 5.5: RCA 1-Export of Goods of Select Countries
1995 1996 1997 1998 1999 2000 2001 2002 2003 2004 2005 2006 2007 2008Mexico 1.1 1.1 1.1 1.1 1.2 1.1 1.2 1.2 1.2 1.2 1.2 1.2 1.2 1.2China,P.R. 1.1 1.1 1.1 1.1 1.1 1.1 1.1 1.1 1.1 1.1 1.1 1.1 1.1 1.1Germany 1.1 1.1 1.1 1.1 1.1 1.1 1.1 1.1 1.1 1.1 1.1 1.1 1.1 1.1Netherlands 1 1 1 1 1 1 1 1 1 1 1 1 1 1Japan 1.1 1.1 1.1 1.1 1.1 1.1 1.1 1.1 1.1 1.1 1 1 1 1Philippines 0.8 0.8 0.8 1 1.1 1.1 1.1 1.1 1.1 1.1 1.1 1.1 1 1Singapore 1 1 1.1 1.1 1 1 1 1 1 1 1 1 1 1France 1 1 1 1 1 1 1 1 1 1 1 1 1 1US 0.9 0.9 0.9 0.9 0.9 0.9 0.9 0.9 0.9 0.9 0.9 0.9 0.9 0.9India 1 1 1 0.9 0.9 0.9 0.9 0.9 0.9 0.8 0.8 0.8 0.8 0.8UK 0.9 0.9 0.9 0.9 0.9 0.9 0.9 0.8 0.8 0.8 0.8 0.8 0.8 0.8Ireland 1.1 1.1 1.1 1 1 1 1 0.9 0.8 0.8 0.8 0.7 0.7 0.7
Source: Balance of Payments Statistics, IMF(2010)
Table 5.6: RCA 1-Export of Services of Select Countries
1995 1996 1997 1998 1999 2000 2001 2002 2003 2004 2005 2006 2007 2008Ireland 0.5 0.5 0.5 0.9 0.9 1 1.2 1.3 1.6 1.7 1.9 2.1 2.2 2.4UK 1.3 1.3 1.3 1.4 1.5 1.5 1.5 1.6 1.7 1.8 1.8 1.8 2 2India 0.9 0.9 1 1.3 1.4 1.4 1.4 1.4 1.4 1.6 1.7 1.9 1.8 1.8US 1.4 1.4 1.4 1.4 1.4 1.4 1.4 1.4 1.5 1.5 1.5 1.5 1.5 1.5France 1.2 1.2 1.1 1.1 1.1 1.1 1.1 1.1 1.1 1.1 1.1 1.1 1.1 1.1Singapore 0.8 0.8 0.8 0.8 0.8 0.8 0.8 0.9 0.9 0.9 0.9 1 1.1 1Philippines 1.8 2 1.9 1 0.5 0.4 0.4 0.4 0.4 0.5 0.5 0.6 0.8 0.9Japan 0.7 0.7 0.7 0.7 0.6 0.7 0.7 0.7 0.7 0.8 0.8 0.8 0.8 0.9Netherlands 1 1 1 1 1 1 1 1 1 0.9 1 0.9 0.9 0.8Germany 0.7 0.7 0.7 0.7 0.7 0.7 0.7 0.7 0.7 0.7 0.7 0.7 0.7 0.7China,P.R. 0.7 0.6 0.6 0.6 0.6 0.6 0.6 0.5 0.5 0.5 0.5 0.4 0.5 0.5
Source: Balance of Payments Statistics, IMF(2010)

62
Figure 5.1: Trend in RCA of India (Goods and Services)
Table 5.7 : RCA-1 Export of Computer and Information Services (select countries)
Countries 2000 2001 2002 2003 2004 2005 2006 2007 2008
China,P.R. 0.4 0.4 0.5 0.6 0.6 0.6 0.7 0.7 0.8
France 0.3 0.4 0.4 0.3 0.3 0.3 0.3 0.3 0.2
Germany 1.5 1.6 1.5 1.4 1.3 1.2 1.1 1.2 1.2
India 9.4 12.7 12.9 12.6 10.3 9.9 9.2 9.0 9.2
Japan 0.8 0.7 0.5 0.4 0.3 0.2 0.2 0.2 0.1
Netherlands 0.8 0.5 0.7 1.2 1.2 1.1 1.3 1.4 1.2
Philippines 0.7 0.2 0.3 0.2 0.2 0.5 0.3 0.7 0.8
Singapore 0.3 0.3 0.3 0.3 0.2 0.2 0.4 0.4 0.4
United Kingdom 1.2 1.2 1.2 1.3 1.4 1.2 1.2 1.0 0.9
United States 0.6 0.6 0.5 0.5 0.5 0.5 0.5 0.5 0.4
Ireland 13.4 11.3 9.8 8.6 8.6 7.8 6.7 6.7 6.4
Source: Computed from Balance of Payments Statistics, IMF(2010)

63
Data for calculating RCA 1 and RCA 2 at a more disaggregated level, i.e., computer and information services is available only for few countries (Table 5.7 and 5.8). Computation of RCA 1 and RCA 2 indices for select countries shows that India and Ireland have clear revealed advantage in export of computer and information services over developed country like the US.
5.4 Outsourcing and Job Losses in Developed Countries: An Empirical Investigation
Objective of this section is to empirically analyze whether there is any severe adverse impact on employment in the US and the UK
due to outsourcing. It is difficult to assess the actual loss of jobs in these countries due to offshore outsourcing as relevant micro level data in this regard are not available. However, this study makes a broad attempt to understand the trend. In this regard, the data on employment trends is obtained from the Bureau of Labor Statistics, US and Annual Business Inquiry, UK. Data on outsourcing, i.e., Computer and Information Services’ and ‘Other Business Services’ is obtained from IMF, BoP Statistics. The period of the study is 2004 to 2009 as the study is constrained by availability of disaggregated level data on US employment in sectors which are amenable for offshore outsourcing.
Table 5.8 : RCA 2-Computer and Information Services (select countries)
Countries 2000 2001 2002 2003 2004 2005 2006 2007 2008
Ireland 0.9 0.9 0.9 0.9 1.0 1.0 0.9 0.9 0.9
India 0.8 0.8 0.8 0.9 0.9 0.9 0.9 0.8 0.9
Finland -0.2 -0.1 0.1 0.1 0.0 0.1 0.1 0.1 0.6
Sweden 0.1 0.2 0.3 0.3 0.3 0.3 0.2 0.4 0.4
UK 0.5 0.5 0.5 0.5 0.5 0.5 0.5 0.5 0.4
Spain 0.2 0.2 0.2 0.3 0.3 0.3 0.3 0.3 0.4
Canada 0.5 0.4 0.3 0.3 0.3 0.3 0.4 0.3 0.4
China,P.R 0.1 0.1 -0.3 0.0 0.1 0.1 0.3 0.3 0.3
Belgium - - 0.1 0.1 0.1 0.2 0.2 0.1 0.2
Austria -0.1 -0.1 -0.1 0.0 0.0 0.1 0.2 0.1 0.1
Netherlands 0.0 -0.2 -0.1 0.1 0.1 0.0 0.1 0.1 0.1
Germany -0.1 -0.1 -0.1 0.0 0.0 0.0 0.0 0.0 0.1
Norway 0.5 0.2 -0.3 -0.2 0.0 -0.1 0.0 -0.2 0.0
USA 0.6 0.5 0.6 0.5 0.5 0.5 -0.1 -0.1 -0.1
Source: Computed from Balance of Payments Statistics, IMF(2010)

64
Table5.9:Top20FirmsprovidersofIT/ITESservicestoOtherfirms
S.No Firm Rank Firms Rank Firms Rank Head qtrs/ in in in Base of the 2006 2008 2010 Firm: Country
1 IBM 1 Accenture 1 Accenture 1 USA
2 Sodexho 2 IBM 2 Infosys 2 India Alliance Technologies
3 Accenture 3 Infosys 3 Sodexo 3 France Technologies
4 Hewlett-Packard 4 Sodexo 4 Wipro Technologies 4 India
5 Capgemini 5 Capgemini 5 IBM 5 USA
6 ARAMARK 6 TCS 6 ISS 6 Denmark
7 Wipro 7 Wipro 7 TCS 7 India Technologies Technologies
8 CGI Group 8 Hewlett-Packard 8 ARAMARK 8 USA
9 Unisys 9 Genpact 9 CSC 9 USA
10 Cognizant 10 Tech Mahindra 10 Convergys 10 USA Technology solution
11 HCL Technologies 11 HCL Technologies 11 ACS 11 USA
12 Mastek 12 EDS 12 Jones Lang LaSalle 12 USA
13 EMCOR 13 ACS 13 CB Richard Ellis 13 USA
14 Genpack 14 CGI Group 14 Johnson controls 14 USA
15 Johnson Controls 15 HOV Services 15 Diebold 15 USA
16 Xchanging Ltd 16 Mastek 16 Amdocs 16 -
17 ClientLogic 17 Spi 17 Capgemini 17 France
18 Tele Tech 18 Colliers International 18 Colliers International 18 USA
19 LASON 19 WNS Globas 19 NCR 19 USA Services
20 Patni Computer 20 hiSoft Technology 20 Genpact 20 India systems International (formerly owned by GE)
Source: 1. Tabulated from website of International Association of Outsourcing Professionals. 2. Websites of various firms.

65
In general the present debate surrounding offshore outsourcing and job losses implicitly assumes that developed countries do not have comparative advantage in any of the service sector jobs that are exposed to international competition. There is hype that developed countries will lose jobs to developing countries due to outsourcing. Actually, developed countries like the US and the UK and a number of other advanced countries are themselves significant exporters of services. Similarly, section 5.2 of this Chapter proves that developing countries, including India, are themselves big importers of computer and information services and other business services. Therefore, it is very much possible that the developed countries are getting significant contracts or export order from other countries including developing countries, in various services and is thus creating more jobs in their own country. This would result in net job gain for developed countries, which may more than compensate any job loss due to outsourcing from developing countries.
In this regard, it is worthwhile to note the ranking of the firms by International Association of Outsourcing Professionals (IAOP) which is a professional association for organizations and individuals involved in outsourcing. In the IAOP
ranking for the year 2010, for the category of firms with more than US $50 million of revenue or 5,000-plus employees, the top 10 players included a mix of firms from the US, Europe and Asia providing IT, facility services, customer relationship management and other services (Table 5.9). In descending order of rank, the top firms are: (1) Accenture, US; (2) Infosys Technologies, India; (3) Sodexo, France; (4) Wipro Technologies, India; (5) IBM, US; (6) ISS, Denmark; (7) Tata Consultancy Services, India; (8) ARAMARK, US; (9), CSC, US; and (10) Convergys, US6. This clearly shows that the arena of international outsourcing is a highly competitive field, where companies based in both developed and developing countries co-exist. In fact, among the top 20 firms during 2010, majority of the firms are from US.
5.4.1 Impact of Offshore Outsourcing on US Jobs
To examine whether there is any job loss at absolute level in US due to outsourcing, a list of occupations amenable to offshore outsourcing in the US and its demographic composition is prepared (Table 5.10). This table indicates that maximum occupations potentially affected by offshoring are in the category, accountants and auditors,
6Available at https://www.iaop.org/content/23/196/2043/ accessed on January 2, 2011

66
Accountants and auditors 1,754 61.8 8 10.3 6.3Insurance underwriters 97 62.8 13.6 3.2 11.5Architects, except naval. 204 25.3 2.5 4.8 6.9Aerospace engineers 136 10 6.1 7.8 8.3Materials engineers 33 -1 -1 -1 -1Mining and geological engineers,including mining safety engineers 11 -1 -1 -1 -1Petroleum engineers 26 -1 -1 -1 -1Chemical engineers 65 18.4 11 7.8 2.6Nuclear engineers 11 1 1 1 1Civil engineers 338 7.1 4.1 10.6 7.3Agricultural engineers 3 1 1 1 1Electrical and electronics engineers 314 9.4 5.1 17 5.1Industrial engineers, includinghealth and safety 186 17.4 2.9 12.4 9.5Mechanical engineers 3.2 5.9 4 10.1 5.8Marine engineers and naval architects 12 1 1 1 1Engineers, all other 346 13.8 6.7 13.9 6.1Surveyors, cartographers, and photogrammetrists 53 18.2 6.4 3.1 2.8Computer scientists and systems analysts 759 26.9 7.5 14.7 6.1Operations research analysts 108 46.9 10.7 8.4 5.8Actuaries 21 1 1 1 1Statisticians 35 1 1 1 1Miscellaneous mathematical science occupations 3 1 1 1 1Astronomers and physicists 13 1 1 1 1Chemists and materials scientists 113 30 7.2 19.6 6.6
Table 5.10: United States: Occupations Potentially Affected* by Offshoring (Contd.)
Categories
2009
TotalEmployedin sectors
(inthousands)
Per cent of total
WomenBlack or African
AmericanAsian
Hispanic or Latino

67
Atmospheric and space scientists 6 1 1 1 1Physical scientists, all other 127 37.4 2.1 18.6 4.1Environmental scientists andgeoscientists 91 29.5 1 2.7 1.2Agricultural and food scientists 32 1 1 1 1 Biological scientists 98 45.1 4.7 13.6 5.1Medical, dental, and ophthalmic laboratory technicians 96 51.8 6.7 5.9 16.4Librarians 206 81.8 5.3 3 6.8 Other teachers and instructors 758 68.3 9.5 3.9 8.6Economists 36 1 1 1 1Urban and regional planners 23 1 1 1 1Technical writers 51 50.4 3.3 1.7 3.9 Writers and authors 178 62.7 7.3 1.3 3.1Editors 169 55.8 3.7 5.4 1.3Air traffic controllers and airfield operations specialists 40 1 1 1 1First-line supervisors/managers of retail sales workers 3311 44.1 7.7 5.8 10.3 First-line supervisors/managers of non-retail sales workers 1291 28 6.1 4.5 9Insurance sales agents 548 46.3 6.3 2.1 9.5Real estate brokers and sales agents 860 54.6 5.7 4.8 7.4Securities, commodities, and financial services sales agents 329 27.9 5.6 4.5 7.8Sales representatives, services, all other 514 33.4 8.6 3.7 11.4Computer and information systemsmanagers 471 29 6.1 7 6.2Medical records and health information technicians 103 88.7 17.8 4.3 18.6Computer and mathematical occupations 3481 24.8 6.7 15.7 5.4 Computer scientists and systems analysts 759 26.9 7.5 14.7 6.1 Computer programmers 498 20.2 5 13 5.4 Computer software engineers 952 20.2 5.3 26.6 3.5 Computer support specialists 384 26.7 11.7 8.3 7.5 Database administrators 110 35.3 5.1 14 7.3 Network and computer systems administrators 207 22.3 5.6 7 7.6 Network systems and data communications analysts 401 24.7 6.2 9.4 5.5
Table 5.10: United States: Occupations Potentially Affected* by Offshoring (Contd.)
Categories
2009Total
Employedin sectors
(inthousands)
Per cent of total
WomenBlack or African
AmericanAsian
Hispanic or Latino

68
Secretaries and administrativeassistants 3176 96.8 8.3 1.9 9.2 Computer operators 115 52.3 21.5 4.2 14.4 Data entry keyers 375 79.1 14.8 5.2 13.3 Word processors and typists 163 92.2 17.1 37 19 Desktop publishers. 7 1 1 1 1 Insurance claims and policy processing clerks 252 82.7 16.7 1.8 12.9 Mail clerks and mail machine operators, except postal service 104 50 24.3 5.3 10.1 Office clerks, general 1002 81.9 13.1 5.5 13.9Human resources assistants, except payroll and timekeeping. 44 1 1 1 1 Receptionists and information clerks 1277 91.5 9.8 2.5 15.1 Reservation and transportation ticket agents and travel clerks. 111 57.9 16.5 5.5 9 Information and record clerks, all other 109 87 19.5 2.8 10.4File clerks 324 81.8 14.6 4.5 13.8Bookkeeping, accounting, and auditing clerks. 1306 92.2 6.6 3.7 7.5Payroll and timekeeping clerks. 150 86.7 15.1 3.9 14.4Billing and posting clerks and machine operators. 481 89.9 13.4 2.9 13.9Telephone operators. 41 1 1 1 1 Communications equipment operators, all other. 15 1 1 1 1Tellers 432 87 10.4 5 13.7Statistical assistants 21 1 1 1 1Total Offshorable Jobs 21,113
Table 5.10: United States: Occupations Potentially Affected* by Offshoring (Concld.)
Categories
2009Total
Employedin sectors
(inthousands)
Per cent of total
WomenBlack or African
AmericanAsian
Hispanic or Latino
Source: Bureau of Labor Statistics, United States Note: * tabulated based on the identification of offshorable jobs by Welsum and Reif (2005)

69
occupations relating to computer software and receptionists. It can also be seen that majority (share) of these offshorable jobs in 2009 belonged to women.
Table 5.11 sets out trends in the information technology related US jobs that can be easily outsourced from developing countries like India. Disaggregated data on jobs in accountancy, medical and computer occupations shows that most of
the jobs including that of computer and information systems managers, computer software engineers, etc., have in general shown a rising trend. However, most of the jobs have declined in 2009. But 2009 is an exceptional year due to global financial crisis, which has originated in the US, and therefore, loss of jobs in 2009 cannot be directly linked to offshore outsourcing.Table 5.12 provides trends in low skilled occupations in the US, such
Table 5.11: Trend in Accountancy, Medical and ComputerOccupations in US (in thousands)
Categories 2005 2006 2007 2008 2009
Accountants and auditors 1683 1779 1806 1762 1,754 -(2.3) (5.7) (1.5) -(2.4) -(0.5)Computer and information systems managers 351 401 467 475 471 (4.2) (14.2) (16.5) (1.7) -(0.8)Medical records and health information 121 98 83 98 103technicians (33.0) -(19.0) -(15.3) (18.1) (5.1)Computer and mathematical occupations 3246 3209 3441 3676 3481
(3.4) -(1.1) (7.2) (6.8) -(5.3) Computer scientists and systems analysts 745 715 825 837 759 (6.4) -(4.0) (15.4) (1.5) -(9.3) Computer programmers 581 562 526 534 498 (3.0) -(3.3) -(6.4) (1.5) -(6.7) Computer software engineers 832 846 907 1034 952 (2.3) (1.7) (7.2) (14.0) -(7.9) Computer support specialists 334 314 332 382 384 (2.8) -(6.0) (5.7) (15.1) (0.5) Database administrators 89 90 104 93 110 -(5.3) (1.1) (15.6) -(10.6) (18.3) Network and computer systems 200 180 214 227 207 administrators (5.3) -(10.0) (18.9) (6.1) -(8.8) Network systems and data communications 322 356 383 422 401 analysts (3.2) (10.6) (7.6) (10.2) -(5.0)Total 8504 8550 9088 9540 9120Growth (2.6) (0.5) (6.3) (5.0) -(4.4)
Note: Figures in parenthesis are growth rate in per cent.Source: Computed from Bureau of Labor Statistics, United States

70
Table 5.12: Trend in Occupation of Secretaries &Administrative Assistants in US (in thousands)
Categories 2005 2006 2007 2008 2009Secretaries and administrative assistants 3499 3455 3401 3296 3176 -(0.7) -(1.3) -(1.6) -(3.1) -(3.6) Computer operators 184 185 160 134 115 -(3.7) (0.5) -(13.5) -(16.3) -(14.2) Data entry keyers 495 475 449 415 375 -(1.8) -(4.0) -(5.5) -(7.6) -(9.6) Word processors and typists 295 256 214 149 163 -(7.5) -(13.2) -(16.4) -(30.4) (9.4) Desktop publishers. - - 4 4 7 - - - (0.0) (75.0) Insurance claims and policy processing 263 274 283 275 252 clerks -(5.1) (4.2) (3.3) -(2.8) -(8.4) Mail clerks and mail machine operators, 132 123 123 123 104 except postal service -(14.3) -(6.8) (0.0) (0.0) -(15.4) Office clerks, general 965 1035 1097 176 1002 -(1.7) (7.3) (6.0) -(84.0) (469.3)Human resources assistants, except payroll 66 56 49 52 44and timekeeping. (3.1) -(15.2) -(12.5) (6.1) -(15.4) Receptionists and information clerks 1376 1403 1441 1413 1277 (0.2) (2.0) (2.7) -(1.9) -(9.6) Reservation and transportation ticket 169 156 144 136 111 agents and travel clerks. (5.0) -(7.7) -(7.7) -(5.6) -(18.4) Information and record clerks, all other - - - 101 107 - - - (5.9) (1.9)File clerks 376 363 403 364 324 -(2.8) -(3.5) (11.0) -(9.7) -(11.0)Bookkeeping, accounting, and auditing clerks. 1456 1511 1490 1434 1306 -(7.1) (3.8) -(1.4) -(3.8) -(8.9)Payroll and timekeeping clerks. 164 158 181 158 150 (7.2) -(3.7) (14.6) -(12.7) -(5.1)Billing and posting clerks and machine 427 422 442 516 481operators. (86.5) -(1.2) (4.7) (16.7) -(6.8)Telephone operators. - - 40 48 41 - - - (20.0) -(14.6) Communications equipment operators, - - - 8 11 all other. - - - (37.5) (36.4)Tellers 418 432 472 466 432 -(1.4) (3.3) (9.3) -(1.3) -(7.3)Statistical assistants - - 21 19 21 - - - -(9.5) (10.5)Total 6406 6397 6499 6353 5975Growth rate in employment (0.9) -(0.1) (1.6) -(2.2) -(5.9)
Note: Figures in parenthesis are growth rate in per cent.Source: Computed from Bureau of Labor Statistics, United States.

71
as, secretaries and administrative assistants, data entry operators, typists, clerks, etc. It indicates that most of the low skilled jobs are showing a declining trend. Part of this decline in jobs may be the result of offshore offshoring. However, it may be noted that some jobs are likely to disappear anyway as they will increasingly become automated/digitized. Further, as the economy grows labour force may be shifting to better job opportunities from relatively low skilled low paid jobs.
In Table 5.13, we aggregate the jobs which are most amenable to outsourcing.This is required to find
out the link between employment in the US and import of computer and information services and other business services by the US (or outsourcing by US from other countries). From the Figure 5.2, it can be seen that aggregate employment in the US in sectors which are said to be most affected by outsourcing sector is actually showing a rising trend along with the rising trend in import of computer and information services and other business services by US (offshore outsourcing).
In this context, Kirkegaard (2003) reported that the majority of the US jobs, projected to be lost in
Table 5.13: Trend in Employment in Sectors Amenable to Offshore Outsourcing in US ( in thousands)
Employment Categories 2004 2005 2006 2007 2008 2009
Accountants and auditors 1,723 1,683 1,779 1,806 1,762 1,754Computer and information systemsmanagers 337 351 401 467 475 471Medical records and health informationtechnicians 91 121 98 83 98 103Computer and mathematicaloccupations 3,140 3,246 3,209 3,441 3,676 3,481Secretaries and administrative assistants 3,522 3,499 3,455 3,401 3,296 3,176Human resources assistants, except payroll and timekeeping. 64 66 56 49 52 44File clerks 387 376 363 403 364 324Bookkeeping, accounting, and auditing clerks. 1,567 1,456 1,511 1,490 1,434 1,306Payroll and timekeeping clerks. 153 164 158 181 158 150Billing and posting clerks and machine operators. 229 427 422 442 516 481Telephone operators. - 40 48 41Total 11,213 11,389 11,452 11,803 11,879 11,331
Source: Compiled from Bureau of Labor Statistics, United States

72
occupational categories threatened by outsourcing pay less than the average wage in US. This suggest that many of these jobs would face natural elimination in future, through technological change, regardless of whether they are outsourced to offshore locations or not. In short, some occupations have declined in the US, but the declines were concentrated in low-skilled occupations. Kirkegaard (2003) also indicates that the US
economy every quarter generates/produces many more job opportunities than are projected to be lost to outsourcing. Table 5.14 indicates that on an average total employment (in five sectors) is increasing in the US, except in the year 2009 which is an exceptional year due to global financial crisis.
It may also be indicated that the outsourcing phenomenon itself can
Figure 5.2: Trend in Import of Computer & Information Services and Other Business Services by US and Employment in Select Sectors in US

73
create new jobs in the US economy through efficiency and productivity gains. The US had experienced faster productivity growth since the second half of 1990’s (when outsourcing really picked up). The pick up in services sector growth has been the key for this (Baily, 2007). Amiti and Wei (2004b) found that service outsourcing is positively correlated with labour productivity in the US. Rapid development of computer technology comprising hardware, software, networks, and the Internet
along with falling prices led to the spread of information technology enabled services throughout the economy and enhanced the productivity of workers (Lee and Mather, 2008). In short, the offshore outsourcing does not necessarily lead to a decline in employment in service importing country. This is because many existing services sector had expanded and new services had emerged due to rapid technological developments providing enough space for both domestic and
Table 5.14: Total Employed persons by industry in US (in thousands)
Categories 2004 2005 2006 2007 2008 2009
Total 16 years and above 139,252 141,730 144,427 146,047 145,362 139,877 Of which: 1 Agriculture, forestry, fishing, and hunting 2,232 2,197 2,206 2,095 2,168 21032 Mining, quarrying, and oil and gas extraction 539 624 687 736 819 7073 Construction 10,768 11,197 11,749 11,856 10,974 97024 Manufacturing 16,484 16,253 16,377 16,302 15,904 14,2025 Wholesale and retail trade 20,869 21,405 21,328 20,937 20,585 19,684 Growth rate in Per Cent Total 16 years and above 1.1 1.78 1.9 1.12 -0.47 -3.77 Of which: 1 Agriculture, forestry, fishing, and hunting -1.89 -1.57 0.41 -5.03 3.48 -32 Mining, quarrying, and oil and gas extraction 2.67 15.77 10.1 7.13 11.28 -13.683 Construction 6.21 3.98 4.93 0.91 -7.44 -11.594 Manufacturing -2.47 -1.4 0.76 -0.46 -2.44 -10.75 Wholesale and retail trade 0.79 2.57 -0.36 -1.83 -1.68 -4.38 Average of above 5 sectors 1.06 3.87 3.17 0.14 0.64 -8.67
Source: Computed from Bureau of Labor Statistics, United States

74
foreign services providers. Further, liberalization in trade in services will also increase the tradability of services.
5.4.1.1 Productivity Trend in the US
In this section, we broadly examine the trend in changes in output per hour in non-farm sector of US. In this regard, it may be mentioned that there has been considerable debate that IT revolution has led to increase in productivity in non-agriculture sector in advanced economies. In fact, many advanced countries have tried to achieve higher productivity by outsourcing many operations to countries with comparative advantage. In the case of US, labour productivity trend shows an upward shift particularly in recent years. Growth rate of the US labour productivity (LPY) in the nonfarm business sector accelerated in the post 2000 Q1 period if we compare it with the earlier period of 1970 Q1 to 1999 Q4. The data on nonfarm business productivity used in this analysis are from Bureau of Labor Statistics (BLS). The quarterly nonfarm business productivity growth is converted to an index and transformed to logarithm. Using simple trend analysis with dummy used for 2000:Q1 to 2010:Q1 period shows that slope of PY was sharper in latter period indicating faster growth (Figure 5.3 and Table 5.15).
These result confirm the findings of Holman, et al (2008) that the US Productivity (as measured by output per hour) surged during the latter half of the 1990s, led by rapid output growth in industries that produced, sold, or intensively used information technology products. A similar study by Baily (2007) for the period 1970:Q4 to 2007:Q2 also indicates the US has experienced faster productivity growth since 1996:Q4 due to growth in services. The present study extending the period of analysis to 2010:Q1 finds the sharper upward shift since the year 2000:Q1. It is generally believed that firms were able to harness the information technology revolution to introduce new methods of production, management controls and services. From this exercise even though, we cannot conclude that outsourcing to India has increased productivity in US, it can be seen that in general ITES services have increased productivity in the US economy.
Table 5.15: Trend in Labour Productivity in US Nonfarm Business
(% per quarter)
Trend Rate of Growth of Labour Productivity
1970 Q1- 1999 Q4 1.64
2000 Q1- 2010 Q3 3.03
*significant at 1 per cent level

75
5.4.2 Impact of Offshore Outsourcing on UK Jobs
Second major destination of India’s ITES/BPO exports is Europe, especially, the UK. Major occupation potentially affected by offshoring in the UK is set out in the Table 5.16. Table 5.17 presents the trend in jobs in UK since 2000 in various sectors. It indicates that on an average most of the jobs have shown an increasing trend, except in mining and quarrying, fishing and manufacturing. Among these occupations, mining and quarrying and fishing are not generally considered as an offshorable jobs, and therefore the decline in jobs in these sectors cannot be blamed
on outsourcing from India or other countries.
Trends in offshorable jobs like jobs relating to computer, R&D, accounting, secretarial services, etc., in the UK are set out in Table 5.18. It indicates that during the period 2004-2007 on average, jobs in this area has shown moderate increase in the UK. However, low skilled jobs, such as, data processing has declined indicating the possibility of its outsourcing. Jobs in skilled activities like R&D, technical testing and analysis have significantly increased in the UK. Further, jobs in legal, accountancy and auditing services have also increased. At an absolute level jobs in computer and
Figure 5.3: Productivity trend in US Non-farm Business

76
related activities and other business services (which are closely related to outsourcing) has increased along with increase in imports of computer and information services and other business services by UK (Table 5.19 and Figure 5.4). This indicates that there is no direct evidence of any fall at absolute level in employment in UK due to outsourcing. In this context, it is worth noting that rules and legislations favouring own citizens may limit the globalization of IT-enabled
services or offshoring of jobs. For example, even if certain accounting activities can be offshored, there are restrictions in many countries that the final stamp of approval may need to be given by a certified accountant in the home country (UNCTAD, 2004). The highlight is that even in one of the most debated offshored activities to India (call centre activities and secretarial services), jobs in the UK have increased in recent years (Table 5.18).
Table 5.16: Europe: Occupations Potentially Affected By Offshoring
Physicists, chemists and related professionals
Mathematicians, statisticians and related professionals
Other specialist managers
Computing professionals
Architects, engineers and related professionals
Business professionals
Legal professionals
Archivists, librarians, and related information professionals
Computer associate professionals
Finance and sales associate professionals
Business services agents and trade brokers
Administrative associate professionals
Secretaries and keyboard-operating clerks
Numerical clerks
Client information clerks
Source: Cited in OECD (2005a), based on EULFS (2004)

77
Table 5.17: Growth in Employment in UK (Whole Economy) (in per cent)
Average 2000 2001 2002 2003 2004 2005 2006 2007 2000-07Agriculture, Fishing, Production,
Construction, Distribution and
Service Industries 2.6 1.7 -0.1 -0.2 1.3 1.4 -1.3 1.9 0.9
Agriculture, hunting and forestry - - 1.3 -8.9 12.5 1.2 -4.9 3.8 -
Fishing - 25 -20 0 -8.3 9.1 -8.3 0 -0.4
Mining and quarrying -3.9 -4.1 -5.6 4.5 -7.1 4.6 -2.9 -9.1 -3
Manufacturing -3 -4.2 -5.2 -6.1 -3.5 -4.6 -3.3 -2.4 -4
Electricity, gas and water supply 2.2 -5.1 3.8 -11 10.7 -5.2 7.9 10.9 1.8
Construction 2.1 -1.3 -1.2 1.7 1.4 3.4 0.1 2.7 1.1
Distribution industries 1.9 1.1 0.5 0.5 0.9 -0.7 -4 3 0.4
Hotels and restaurants 2.7 1 2 2.3 2.7 -0.4 0.7 0.1 1.4
Transport, storage and
communication 4.6 4.1 -0.7 -1.2 0.1 2.5 -4.3 1.8 0.9
Real estate, renting and business
activities 4.7 4.3 1.6 0.5 3.9 5.5 -0.2 4.8 3.2
Education 7.5 2.8 1.9 3.4 0.5 3.8 1.2 1.5 2.8
Health and social work -0.4 7.4 1.2 -0.5 10.2 5 1.5 0.2 3.1
Other community, social and
personal service activities 4.9 4 2.3 0.1 -0.1 1.6 0.2 0.7 1.7
Note: Total employment is average during the yearSource: Computed from Annual Business Inquiry (UK)

78
Table 5.18: Growth rate of Employment in Business Activities in UK (in Per cent)
Avg.Employment in:- 2003 2004 2005 2006 2007 2004- 2007
Hardware consultancy 4.3 -4.2 -8.7 -4.8 15.0 -0.7Software consultancy and supply 11.3 -0.8 1.1 0.5 3.8 1.2Publishing of software - 7.7 -14.3 -16.7 0.0 -5.8Other software consultancy and supply - -1.1 1.7 1.1 3.9 1.4Data processing 3.9 -3.8 2.0 -23.1 7.5 -4.3Database activities -6.7 14.3 31.3 -23.8 18.8 10.1Other computer related activities -14.9 -5.3 2.8 -4.5 3.8 -0.8Research and Development -8.5 4.1 1.0 1.0 -1.0 1.3Legal activities 1.3 1.0 1.0 -1.9 9.3 2.3Accounting, book-keeping and auditing, tax consultancy -1.4 7.0 6.1 -7.4 8.9 3.7Market research and public opinion polling 10.9 -11.8 44.4 -7.7 1.7 6.7Business and management consultancy -2.6 8.0 4.9 10.4 4.0 6.8Management activities of holding Companies - 16.7 -8.9 9.8 -3.6 -Architectural and engineering activitiesand related technical consultancy -0.9 3.5 5.4 0.8 6.6 4.1Technical testing and analysis 0.0 3.3 32.3 -7.3 15.8 11.0Advertising -10.4 10.5 -6.3 -5.6 9.5 2.0Investigation and security activities 5.4 4.0 2.2 -1.1 -2.7 0.6Secretarial and translation services -4.5 -9.5 -5.3 0.0 22.2 1.9Other business activities not elsewhere -0.6 2.6 9.2 2.6 7.8 5.5Call centre activities - 95.0 15.4 33.3 -13.3 32.6
Note: Total employment is average during the yearSource: Computed from Annual Business Inquiry (UK)

79
Table 5.19: Number of Enterprises in UK in Computer and related activities and Other Business Activities
Year Computer and Other business Total related activities activities (including call center) 1995 53,673 221,334 275,007
1996 63,984 232,929 296,913
1997 84,959 249,005 333,964
1998 104,355 261,872 366,227
1999 124,501 289,254 413,755
2000 129,125 304,002 433,127
2001 129,369 313,814 443,183
2002 123,184 328,722 451,906
2003 109,340 340,321 449,661
2004 103,139 363,543 466,682
2005 102,502 395,805 498,307
2006 103,306 417,899 521,205 2007 109,117 447,000 556,117
Source: Annual Business Inquiry (UK)
Figure 5.4: Trend in Import of Computer & Information Services and Other Business Services by UK and Number of Enterprises in select Sectors in UK

80
5.4.3 Outsourcing and Employment in US and UK: A Summary
From the Tables given above, it can be seen that, in general, offshoring from developing countries, such as, India does not appear to have any disproportionately large effect on skilled tasks or jobs in the US or the UK. The total unemployment rates (per cent of labour force) in the US and the UK indicated a declining trend for the past many years, before the onset of financial crisis of 2008 (Figure 5.5). However, insecurity among some sections of workers will increase if the impact of outsourcing on workers is sudden and unpredictable (Coe, 2008). This
would have effect on worker’s actual or perceived job security and on labour’s bargaining power. Evidence of this is found in the US, where workers in industries and occupations involved in tradable goods express higher levels of economic insecurity than other workers (Coe, 2008).
It may be also pointed out that conventional wisdom that firms from developed countries offshore to developing countries to reduce costs is not completely true. For example, 85 per cent of the US service offshoring is with other OECD countries (developed countries) and not to developing countries. Table 5.20 shows that majority of
Figure 5.5: Unemployment in US and UK

81
Table 5.20: Cross-Border Services Trade of United States-2008 (million US dollars)
Exports Imports All countries 525,786 All countries 364,366
10 largest countries 290,160 10 largest countries 205,0961 United Kingdom 62,545 United Kingdom 43,5372 Canada 45,775 Germany 26,3663 Japan 41,245 Japan 24,4834 Germany 28,160 Canada 24,4215 Mexico 24,040 Bermuda 17,0926 Ireland 22,767 France 16,4997 France 17,916 Mexico 15,7588 Switzerland 17,242 Switzerland 14,8299 China 15,870 India 12,12310 Netherlands 14,600 Ireland 9,988 Other countries 235,626 Other countries 159,270
Source: Bureau of Economic Analysis, United States
Figure 5.6: Importance to Firms of Factors in Choosing anOutsourcing Provider (in per cent)

82
the countries among top ten trading countries in services of the US in 2008 were developed countries and not developing countries. Further, there are other aspects, such as, expertise and capability of service provider besides the cost factor which stimulate outsourcing. Trefler (2005) reports that service providers’ expertise or capability and service providers’ flexibility are the two prime factors in choosing an outsourcing provider. Low cost/price in which India and other developing countries is having significant advantage comes third (Figure 5.6).
It is particularly important to note that developed countries like the US and the UK which are big exporters and importers of services gain from trade in services. Short-term job losses in these countries, if any, due to outsourcing are well compensated by cost reduction and productivity gain made by these countries. The net result of outsourcing is that, both developing countries and developed countries ultimately gain from outsourcing. For example, while industrial countries gain in terms of productivity, cost reduction, etc., developing countries gain in terms of employment, foreign exchange earning, etc.
Table 5.21: India’s ITES Exports and Current Account Receipts
Year Software Business Software and services as per services as per business services cent of current cent of current as per cent of account receipts account receipts current account receipts7
2000-01 8.16 - 8.16
2001-02 9.28 - 9.28
2002-03 10.03 - 10.03
2003-04 10.69 - 10.69
2004-05 11.44 3.34 14.78
2005-06 12.11 4.78 16.89
2006-07 12.86 5.97 18.83
2007-08 12.79 5.32 18.12
2008-09 13.13 4.66 17.80
Source: Computed from RBI Bulletin, various issues.
7RBI started publishing data on software exports and business services from 2000-01 and 2003-04 onwards respectively when these categories became prominent.

83
5.5 Outsourcing and India’s Balance of Payments
Whenever service exports growth had fallen, India faced balance of payments difficulties, e.g., during 1988-1990 (Figure 5.7). The appropriate level of the current account deficit (CAD) for India has been a debatable issue. According to Tarapore (2006), the appropriate level of the CAD is a dynamic concept and cannot be fixed. Acceleration in the growth of current earnings reduces the need to access international financial markets and strengthens the ability to achieve
higher growth without encountering severe financing constraints. Viability of the CAD depends on the availability of normal capital flows, as opposed to exceptional financing. If the ratio of CAD to GDP is regarded as the target variable, the ratio of current receipts to GDP can be regarded as the instrument variable. Accordingly, a sustainable CAD is dependent on the current receipts to GDP ratio. (Tarapore, 2006).
It is generally perceived that India’s exports of ITES/BPO services have significantly contributed to current
Figure 5.7: Growth in India’s Services Exports

84
2000-01 6,341 - 3,463 9,927 25,926 13,317 45,452 77,719 42,2812001-02 7,556 - 3,480 9,584 29,181 16,218 44,703 81,440 54,1062002-03 9,600 - 4,653 11,163 32,325 17,640 53,774 95,699 76,1002003-04 12,800 - 5,165 14,068 40,708 22,736 66,285 119,793 112,9592004-05 17,700 5,167 7,762 20,382 46,666 21,691 85,206 154,739 141,5142005-06 23,600 9,307 9,198 24,752 56,780 25,620 105,152 194,839 151,6222006-07 31,300 14,544 9,391 27,936 68,714 31,470 128,888 243,446 199,1792007-08 40,300 16,772 9,938 33,270 91,803 44,261 166,162 315,037 309,7232008-09 46,300 16,445 14,946 38,933 100,789 47,547 189,001 352,535 251,985 As a Per cent of Foreign Exchange Reserves2000-01 15.0 - 8.2 23.5 61.3 31.5 107.5 183.8 1002001-02 14.0 - 6.4 17.7 53.9 30.0 82.6 150.5 1002002-03 12.6 - 6.1 14.7 42.5 23.2 70.7 125.8 1002003-04 11.3 - 4.6 12.5 36.0 20.1 58.7 106.0 1002004-05 12.5 3.7 5.5 14.4 33.0 15.3 60.2 109.3 1002005-06 15.6 6.1 6.1 16.3 37.4 16.9 69.4 128.5 1002006-07 15.7 7.3 4.7 14.0 34.5 15.8 64.7 122.2 1002007-08 13.0 5.4 3.2 10.7 29.6 14.3 53.6 101.7 1002008-09 18.4 6.5 5.9 15.5 40.0 18.9 75.0 139.9 100 Growth Rate in Per Cent2001-02 19.2 - 0.5 -3.5 12.6 21.8 -1.6 4.8 28.02002-03 27.1 - 33.7 16.5 10.8 8.8 20.3 17.5 40.62003-04 33.3 - 11.0 26.0 25.9 28.9 23.3 25.2 48.42004-05 38.3 - 50.3 44.9 14.6 -4.6 28.5 29.2 25.32005-06 33.3 80.1 18.5 21.4 21.7 18.1 23.4 25.9 7.12006-07 32.6 56.3 2.1 12.9 21.0 22.8 22.6 24.9 31.42007-08 28.8 15.3 5.8 19.1 33.6 40.6 28.9 29.4 55.52008-09 14.9 -1.9 50.4 17.0 9.8 7.4 13.7 11.9 -18.6Avg.Growth 28.4 37.4 21.5 19.3 18.7 18.0 19.9 21.1 27.2
Source: Computed from Reserve Bank of India Bulletin, Various Issues.
Foreign Exchange
Reserves as on End March
of financial year
Table 5.22: India’s Software and Business Service exports andForeign Exchange Reserves
(in US $ million)
Year SoftwareBusiness Service
Miscellane-ous Exclud-ing Software
andBusiness
Services Excluding Software
andBusiness
Invisibles Excluding Software
and Business
Transfers Merchan-dise
Current Account Receipts

85
account receipts and thus provided support to India’s balance of payments position (Table 5.21 and Table 5.22).
The rise of ITES sector has relieved some pressure on private transfer receipts which are one of the main sources of India’s foreign exchange earnings. It may be seen from the Table 5.22 that the contribution of software services and business services to the growth of foreign exchange reserve has been consistently rising over the years while that of merchandise trade and other services is coming down. ITES/BPO services have also increased capital inflows by attracting FDI. However, it may be noted that growth of this item is quite sensitive to the growth of world economy and hence, these flows may exhibit sharper volatility as compared to the other components of BoPs.
Both outsourcing and remittances have led to the rapid accumulation of India’s foreign exchange earnings (Table 5.21). However, unlike private transfers, outsourcing leads to number of positive externalities (with multiplier effect) including addition to domestic production capacities, growth of new
firms in the country, new employment opportunities within the country (both direct and indirect employment), and brand building. The growth of Indian ITES/BPO sector has exhibited multiplier effects on hotel, tourism, transport, construction, banking sector, etc. It may be noted that, software industry is a labour intensive industry. This is evident from the fact that, salary accounted for over 35 per cent of total cost of ITES/BPO industries during 2009 (Table 5.23). Development of IT sector also helps in improvement of overall governance of the country.
5.5.1 Cyclical Behavior of Major Components of Current Account Receipts
In this section, an attempt has been made to examine the correlation of various items of India’s current account receipts (including software and business services) with the business cycles witnessed by the US. For this purpose, quarterly data during 2000-01Q1 to 2009 Q1on the various components of India’s current account receipts (as published by the RBI) and the seasonally adjusted US
Table5.23:SalaryasPercentageofTotalExpenses(Averageof106ITES/BPOfirms)
Average Mar-04 Mar-05 Mar-06 Mar-07 Mar-08 Mar-09Salary as a % of TotalExpenses of 106 ITES/BPO Firms 32.9 35.8 37.6 39.9 38.9 36.7
Source: Computed using CMIE database.

86
GDP data (as published by the US Bureau of Economic Analysis) have been used. The list of variables is provided in Table 5.24.
The rationale behind choosing the US GDP is (i) it is a major economy in the world and (ii) US is a major destination of Indian software & business services exports. To begin with, the quarterly data on different components of exports (in logarithmic terms) is seasonally adjusted. Thereafter for this seasonally adjusted
series trend was removed using the Hodrick-Prescott filter. After removing trend from seasonally adjusted series, cyclical component of each series has been computed.
Correlation of cyclical component of each item of current account receipts with the cyclical component of the US GDP has been provided in Table 5.25. It shows that correlation between the cyclical behavior of the US GDP and software & business services exports (CYSB) is statistically significant at
Table 5.24: List of Variables
Sr. Notation Description of Variable Unit of MeasurementNo.
1 CYEG Export of Goods US Dollar converted into log2 CYINC Receipts under Income US Dollar converted into log3 CYMIS Miscellaneous services receipts US Dollar converted into log4 CYPTR Private transfer receipts US Dollar converted into log5 CYSB Software and business services US Dollar converted into log receipts6 CYSOFT Software exports US Dollar converted into log7 CYTRAN Transportation US Dollar converted into log8 CYUS US GDP US Dollar converted into log
Table 5.25: Correlation of Major Items under India’s Current Account with US GDP
Correlation between: CYEG CYINC CYMIS CYPTR CYSB CYSOFT CYTRAN
CYUS 0.66** 027** 0.48** 0.006 0.56** 0.33** 0.36**
Note: ** Indicates significance at 5 per cent level.
Table 5.26: Amplitude of Cyclical Components of Current Account Receipts
Indicator CYEG CYINC CYMIS CYPTR CYSB CYSOFT CYTRAN
Standard Deviation 0.08 0.15 0.12 0.14 0.11 0.07 0.09

87
5 per cent. In fact, this correlation of CYUS with CYSB is higher than with most of other components of services exports from India. This reflects that Indian software and services exports have strong association with the US business cycle stressing the need for diversification of markets. However, the amplitude of cycle of CYSB is much more stable than other services exports (Table 5.26). In other word, upswing and downswings in exports from this sector are moderate as compared with other export items of current account receipts.
5.5.2 IT Share Price Indices and Capital Market
Foreign investment is an important item under capital account of India’s
balance of payments. Indian capital market is no longer insulated from global economic events. Slowdown in global economy, especially in the US economy has impacted the capital market of India making them volatile, thereby affecting investment activities. As a concept, volatility, variability or dispersion in price of an asset measures how far the current price of an asset deviates from its average past prices. Greater this deviation, greater is the volatility in the asset price. This may be normalized by the mean to get the coefficient of variation for the series. Table 5.27 reports the coefficient of variation of major indices (daily data) of BSE obtained from SEBI database since the year 2000 (between Jan 2000 and Sept 2, 2010). It indicates
Table5.27:CoefficientofVariationofMajorIndicesofBSE
Indices CoefficientofVariation
BSE-Sensex 59.72
BSE-100 60.94
BSE Oil and Gas 76.54
BSE Metal 78.28
BSE Health 46.09
BSE FMCG 44.69
BSE Consumer durables 68.80
BSE-PSU 63.78
BSE Capital 92.66
BSE-Auto 68.52
BSE-Teck 11.71 BSE-IT 45.71
Note: Daily data for the period January 3, 2000 to Sept 2, 2010.For BSE-Teck daily data for the period Jan 31, 2000 to Sept 2, 2010.

88
that among all indices BSE-Teck (BSE-Teck includes scrips classified under information technology, media and telecom sectors), BSE-FMCG and BSE-IT (BSE-IT index represent major ITES firms) were among the top stable sectoral indices on the BSE (Table 5.27 and Figure 5.8). This shows a relatively high level of confidence of investors in the IT sector (BSE-Teck and BSE-IT) as compared with other indices such as BSE Oil and Gas, BSE Metal, BSE Consumer durables, etc.
5.6 Determinants of India’s Software Exports: A Cointegration Analysis
In this section, we have attempted an empirical investigation regarding whether there exists a non-spurious
relationship between India’s software exports and the US economic growth. We have used cointegration methodology to test the hypothesis that India’s software exports are cointegrated with the US economic growth. We test the hypothesis by estimating the co-integrating relationship between India’s software exports as the dependent variable and US GDP (proxy for external demand conditions) and nominal exchange rate (Indian Rupee per US $) as the explanatory variables. We have used the quarterly data and the time-span of the empirical investigation carried out in this section is upto 2009 Q1. Data on US GDP has been sourced from the International Finance Statistics, IMF. All the series have been subject to
Figure 5.8: Movement in BSE-Index

89
logarithmic transformation. The data description and their specification for cointegration test are given in Table 5.28.
Prior to testing for any long-term causal relationship between these variables, we need to check the stationarity and the order of integratedness of the variables to be used in the cointegrating equation (Appendix).
The unit root test results (Table 5.29) on the variables at the log levels indicates that we cannot reject the null hypothesis that there is unit root in all the three series. In order to find out the order of integratedness of the series, we first difference the series and find the unit roots in the first difference of the log levels of these series. It can be seen from Table 5.30 that all the first differences of all the three variables are stationary. This implies that the LSOFTEX, LUSGD, LEXCH, i.e., log levels of the variables indicated in Table 5.29, are I(1).
We now proceed to estimate equation software exports as dependent variable and US GDP and exchange rate as the independent variable, as all the variables are integrated of the same order, viz., I(1). If the residuals of this equation - εt are stationary, it implies that a long run relationship or cointegration of India’s software exports with the US GDP and rupee-US $ exchange rate. In Table 5.31, we report the empirical estimates of equation 5.12. The empirical results of the stationarity of the residuals of the cointegration equation are reported in Table 5.32.
It can be seen from Table 5.32 that the residuals of the estimated equation are stationary at 10 % level of significance. Thus, we can infer a long-run cointegrating relationship between LSOFTEX as the explained variable and LUSGD, LEXCH as the explanatory variables. The empirical estimates provided in Table 5.31 indicate that the elasticity of India’s
Table 5.28: Data Sources for Cointegration Analysis
S.No. Notation Description Source Units of measurement
1 USGDP US GDP IMF, International Billions US $ Finance Statistics
2 SOFTEX Software exports RBI Rupees crore (BoP basis)
3 EXCH Exchange rate: RBI Rupees per US $

90
software exports with respect to rupee-US $ exchange rate is about 0.84, whereas, that with respect to the US GDP it is about 11.
5.7 Structure of India’s ITES/BPO Firms: An Overview
In this section, we attempts to understand structure of India’s ITES/
BPO firms. For this purpose we compile firm level annual data from CMIE data base. Our sample size 106 firms, which includes major ITES firms like Infosys, Wipro, etc. Period of this analysis is for six years, i.e., from 2004 to 2009. Selection of number of firms and period of analysis is constraint by availability of data on sales, foreign exchange earnings
Table 5.29: ADF Unit Root Tests for the Data Series Used in the Study (a)
Series Test- Critical Value of Test Statistics at Result (Ho: Series Statistics 1 % level 5 % level 10 % level has a unit root)
LSOFTEX 3.42 -4.12 -3.49 -3.17 Don’t Reject HoLUSGD 0.53 -4.11 -3.48 -3.16 Don’t Reject HoLEXCH -2.27 -4.11 -3.48 -3.16 Don’t Reject Ho
Note: “Ho: The series under consideration has a unit root”; “H1: The series under consideration is stationary”.L stands for Logarithm of variables in levels.* Significant at 1 per cent level.The maximum number of lags included in ADF test is 10. Tests include a trend and intercept.
Table 5.30: ADF Unit Root Tests for the Data Series Used in the Study (b)
Test- Result InferenceSeries Statis- 1% 5% 10% (Ho: Series has a unit tics level level level root
DLSOFTEX -6.19* -4.12 -3.49 -3.17 Reject Ho: DLSOFTEX ~ I(0) LSOFTEX ~ I(1)
DLUSGD -5.18* -4.11 -3.48 -3.16 Reject Ho: DLUSGD ~ I(0) LUSGD ~ I(1)
DLEXCH -5.12* -4.11 -3.48 -3.16 Reject Ho: LEXCH ~ I(0) LEXCH ~ I(1)
Note: “Ho: The series under consideration has a unit root”; “H1: The series under consideration is stationary”.L stands for Logarithm of variables in levels.* Significant at 1 per cent level.The maximum number of lags included in ADF test is 10. Tests include a trend and intercept.
Critical Value of Test Statistics at

91
and expenses. In this analysis we found that even though there are number of firms operating in the ITES area, analysis of the data from our sample shows that top few firms are leading in all spheres of economic activity including sales, foreign exchange earnings, R&D activities and expenses. Share of other firms in terms of above mentioned indicators are very small. In short, India’s ITES sector is dominated by few big firms followed by number of smaller firms.
5.8 Determinants of Export Intensity of ITES/BPO: Panel Data Analysis
In this section we attempt to identify the determinants of export intensity of ITES/BPO firms in India. For this purpose, we have selected 90 ITES/BPO firms from the CMIE database which include major firms (Annex 5.1). The CMIE database sources the data on firms from their balance sheets and profit and loss accounts statements. The time-span of the data that have been used in the study is 2003-04 to 2008-09. The selection of time-span of the study was constrained by the availability of data. As we have the data for 90 ITES/BPO firms for six years, we were able to construct a balanced panel with 540 observations. The details of the variables that we have used in the empirical analysis in this section have been provided in Table 5.33.
The hypothesis that we test is laid down in equation 5.13a and 5.13b. The relationship and logic for a priori relationships between export intensity and the explanatory variables have been presented in Table 5.34.
The study uses the panel data model which is being increasingly used in economic research. This is because, panel data incorporates more information and variability, less collinearity among variables, allows more degrees of freedom and hence, more efficient estimates of parameters (Gujarati, 2003). Thus, panel data are better suited to study the dynamics of change.
Simple pooled regression assumes that the mean values of the variables and relationship between them remains same across time and for all cross-sections.
5.8.1 Determinants of Export Intensity of ITES/BPO: Panel Data Estimates
Panel data analysis is undertaken using data for a sample of 90 firms for the period 2003-04 to 2008-09. The sample represents most of the top firms providing ITES services including Infosys, Wipro, etc. Firm level data on foreign exchange

92
LSOFTEXt = C + β1 LUSGDt + β2LEXCHt + εt ……….. … 5.12
Table 5.31: Determinants of Software Exports
Dependent Variable: LSOFTEXMethod: Least Squares
Variable Coefficient Std.Error t-Statistic Prob. C -99.96119 1.349685 -74.06258 0.0000
LUSGD 11.32282 0.196964 57.48660 0.0000
LEXCH 0.842440 0.220841 3.814697 0.0003
R-squared 0.992208 Mean dependent var 8.627297
Adjusted R-squared 0.991957 S.D. dependent var 1.695903
S.E. of regression 0.152096 Akaike info criterion -0.883556
Sum squared resid 1.434256 Schwarz criterion -0.783200
Log likelihood 31.71558 Hannan-Quinn criter. -0.843959
F-statistic 3947.477 Durbin-Watson stat 0.886298
Prob(F-statistic) 0.000000
Table 5.32: Residuals of the Estimated Equation
Null Hypothesis: RESIDUAL has a unit rootExogenous: ConstantLag Length: 5 (Automatic based on SIC, MAXLAG=10)
t-Statistic Prob.*
Augmented Dickey-Fuller test statistic -2.717462 0.0771Test critical values: 1% level -3.546099 5% level -2.911730 10% level -2.593551 *MacKinnon (1996) one-sided p-values.

93
earnings, advertising, marketing and distribution expenses, sales, expenses and age of sample firms are collected from CMIE database. Data on GDP of major trading partners, viz., the US and the UK are taken from the World Economic Outlook database of the IMF. A composite index is constructed using GDP growth of the US and the UK and change in India’s share of exports to these countries. Data on REER and NEER are taken from RBI database. The notation used and
units of measurement are set out in Table 5.33.
Fixed effect model is selected because it will take care of oligopolistic characteristics of firms in the sample. Needless to mention that this study includes major ITES firms as a random sample from this industry would not have been the most representative one. The alternative models presented in Table analyze the relationship between export intensity of the firm
Table 5.33: Panel Data Analysis-Variables
Notation Description Source Units of measurement
1 Ex Export Intensity of the firm as CMIE Percentage captured by the Foreign exchange earnings as a per cent of sales2 AG Age of the firm CMIE Number of years since inception of the firm3 EFFIC Efficiency of the firm as captured CMIE Percentage by Operational expenses as percent of sales 4 UKUS Weighted growth rate of US Constructed Percentage and UK7 using data from the World Bank 5 REER Percentage change in Real RBI Percentage Effective Exchange Rate 6 NEER Percentage change Nominal RBI Percentage Effective Exchange Rate 7 ADV Advertising, marketing and CMIE Percentage distribution expenses as per cent of sales 8 MKT Market share of the firm CMIE Percentage
7Weights for US and UK are based on market share of these countries in India’s ITES/BPO exports, provided by NASSCOM. For US it varies between 68 per cent in 2004 to 61 per cent in 2009. For UK it varies between 15 per cent in 2004 to 18 per cent in 2009.

94
(foreign exchange earnings as a per cent of sales) and % variation in REER, advertising intensity, influence of economic activity of the major markets, efficiency, market share, and age of the firm during the period 2004 to 2009. A quick overview of the empirical results shows that advertising intensity, economic growth in major markets, viz., the US and the UK have positive impact on firm’s ITES exports (Table 5.35). Appreciation (depreciation) of REER is having a negative (positive) impact on exports intensity of India’s ITES/
BPO firms, as expected . Variables, viz., age and monopoly power of the firm (market share) do not emerge as statistically significant explanatory variables even though the signs of these coefficients are consistent with a priori expectations.
In Table 5.36, we substitute the variable NEER instead of REER. A glance of the Table shows that results are almost similar to Table 5.35, where we have taken REER as explanatory variable. Furthermore, age, monopoly power of the firm and
Table 5.34: Expected Relationship between Explanatory Variables and Foreign Exchange Earnings of the ITES Firms
Dependent Variable: Ex: Foreign exchange earnings as a per cent of Sales
Explanatory Expected Sign Variables Description oftheCoefficient of explanatory variable
1 Age When age increases (experience increase), Positive firm knows the market better and therefore its exports increase
2 Advertising When advertising intensity increases, Positive intensity its exports increase
3 REER or REER or NEER and export move in opposite Negative NEER direction
4 Market share Indicates monopoly power of firm Positive of each firm
5 Efficiency As efficiency increases, its exports should increase. Positive
6 USUK As growth in major market (US and UK) increases, composite firms’ exports are expected to increase. Positive index
Ex = f ( AG, ADV, MKT, EFFIC,USUK, REER) -------(5.13a) Ex = f ( AG, ADV, MKT, EFFIC,USUK,NEER)---------(5.13b)

95
Table 5.35: Determinants of Export Intensity of ITES/BPO : Fixed Effect Model (a)
Dependent Variable: Ex Fixed Effect Coefficient Std.Error t-Statistic Prob.
Explanatory Variables C 69.37* 4.93 14.04 0.00Age 0.11 0.28 0.39 0.69Advertising intensity 0.39* 0.14 2.67 0.00Mkt share 0.18 0.63 0.27 0.78Efficiency 0.00 0.00 0.25 0.79USUK 0.76* 0.25 3.02 0.00REER -0.11* 0.05 -2.00 0.04
R2 0.98 F Statistics 249.5Adj.R2 0.97 Prob (F-statistic) 0.00N 540
Note:* denotes statistical significance at 1 per cent level, respectively.
Table 5.36: Determinants of Export Intensity of ITES/BPO Fixed Effect Model (b)
Dependent Variable: Ex Fixed Effect Coefficient Std.Error t-Statistic Prob.
Explanatory Variables C 71.71* 4.57 15.67 0.00Age -0.03 0.27 -0.12 0.89Advertising intensity 0.39* 0.14 2.78 0.00Mkt share 0.34 0.52 0.65 0.51Efficiency 0.00 0.00 0.25 0.80USUK 0.64* 0.23 2.78 0.00NEER -0.06@ 0.03 -1.60 0.10
R2 0.98 F Statistics 293.95Adj.R2 0.98 Prob (F-statistic) 0.00N 540
Note:* and @ denote statistical significance at 1 per cent and 10 per cent levels, respectively.
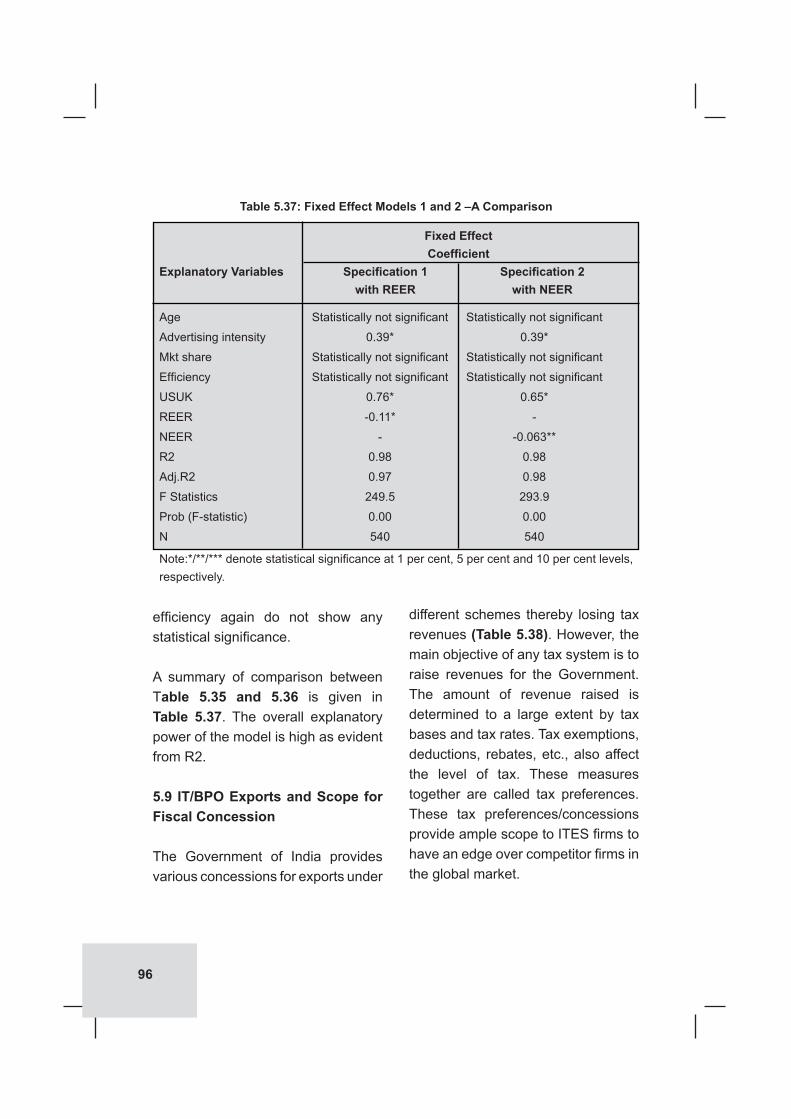
96
Table 5.37: Fixed Effect Models 1 and 2 –A Comparison
Fixed Effect CoefficientExplanatoryVariables Specification1 Specification2 with REER with NEER
Age Statistically not significant Statistically not significant
Advertising intensity 0.39* 0.39*
Mkt share Statistically not significant Statistically not significant
Efficiency Statistically not significant Statistically not significant
USUK 0.76* 0.65*
REER -0.11* -
NEER - -0.063**
R2 0.98 0.98
Adj.R2 0.97 0.98
F Statistics 249.5 293.9
Prob (F-statistic) 0.00 0.00
N 540 540
Note:*/**/*** denote statistical significance at 1 per cent, 5 per cent and 10 per cent levels, respectively.
efficiency again do not show any statistical significance.
A summary of comparison between Table 5.35 and 5.36 is given in Table 5.37. The overall explanatory power of the model is high as evident from R2.
5.9 IT/BPO Exports and Scope for Fiscal Concession
The Government of India provides various concessions for exports under
different schemes thereby losing tax revenues (Table 5.38). However, the main objective of any tax system is to raise revenues for the Government. The amount of revenue raised is determined to a large extent by tax bases and tax rates. Tax exemptions, deductions, rebates, etc., also affect the level of tax. These measures together are called tax preferences. These tax preferences/concessions provide ample scope to ITES firms to have an edge over competitor firms in the global market.

97
Table 5.38: Revenue Foregone on Account of Export Concessions under Different Schemes
(Rs. crore)
Schemes 2004-05 2005-06 2006-07 2007-08 2008-09 2009-10Total 35,430 37,590 55,072 59,149 49,053 43,622of which:Advance License Scheme 8851 13261 17928 17654 12389 10682EOU/EHTP/STP 7678 10277 14386 18978 13401 8015EPCG 4710 5332 9152 10521 7833 5574DEPB Scheme 9671 5650 4842 5341 7092 8806SEZ 1314 1070 2194 1804 2324 3204
Share in totalAdvance License Scheme 25.0 35.3 32.6 29.8 25.3 24.5EOU/EHTP/STP 21.7 27.3 26.1 32.1 27.3 18.4EPCG 13.3 14.2 16.6 17.8 16.0 12.8DEPB Scheme 27.3 15.0 8.8 9.0 14.5 20.2SEZ 3.7 2.8 4.0 3.0 4.7 7.3
Note: Figures for 2007-08, 2008-09 are provisional and 2009-10 is estimated.Source: Union Budget, Various years, Government of India.
During 2008-09, the effective tax rate in India was 22.8 per cent, which was well below the statutory tax rate of 33.9 per cent. Effective tax rate is the ratio of total taxes paid (including surcharge and education cess) to the total profits before taxes. Further, the tax liability across firms is unevenly distributed due to various tax preferences in the Statute. The industry-wise distribution of effective tax rate of firms shows that while the effective tax rate of almost all the industries is below the statutory level, it is very low for the IT-enabled services providers and BPO service providers and software development
agencies at 13.1 per cent and 11.8 per cent respectively (Table 5.39). This shows that the scope for Government support to ITES-BPO sector through offering fiscal concession, like tax breaks, tax rebates etc., is limited and therefore ITES-BPO industry should not expect extension of concessions in this regard.
Besides the tax preferences, Government of India (The Department of Telecom) has recently come out with the memorandum to introduce the concept of work from home agents in India. The concept has been introduced for firms registered

98
under ‘Other Service Providers’, which includes call centers, network operation, tele-marketing, tele-education, etc. This is expected to help in leveraging opportunities in the tier 2 and 3 Indian cities to maintain low cost of operations. The concept of home agent is expected to help Indian ITES/BPO firms to remain cost competitive (Singh, 2009). It may be noted that offshore BPO destinations like Philippines, China, etc. are becoming strong competitors to India by providing low cost ITES/BPO services.
5.10 Summary
Since world trade in services including ITES/BPO is growing at a much faster rate than trade in goods, it will provide opportunity to India to
raise its share of services in world trade. RCA index shows that India’s revealed comparative advantage is in export of services, more specifically on computer and information services exports. ITES/BPO exports are giving significant support to India’s Balance of Payments position and therefore, it is very important for Indian economy. The empirical results confirm that growth in the US is one of the important determinants of India’s computer and information services exports. Another important fact to be noted is that even though there is much media attention on outsourcing sector in India and other developing countries, especially regarding loss of employment in developed countries like the US and the UK due to contracting of services abroad, the maximum gains
Table 5.39: Industry wise Effective Tax Rate (in per cent)
Sector Number of Firms Effective Tax Rate
ITES, BPO service providers 6493 13.1Software Development Agencies 8166 11.8Sub Total 14659 Avg. 12.45 Grand Total Avg. 22.80 2007-08ITES, BPO service providers 7,181 15.0Software Development Agencies 9,172 12.0Sub Total 16,353 Avg. 13.50 Grand Total Avg. 22.00
Note: Grand total included samples from all sectors like manufacturing industries, financial institutions, services, trading, etc.Source: Union Budget, Various years, Government of India.
2008-09
99
from services trade is actually going towards these countries. Further, analysis undertaken in this Chapter does not show any adverse impact on US employment due to offshore outsourcing. Data from US Bureau of Labor Statistics and Annual Business Inquiry of UK does not shows any decline in skill intensive activities at absolute level in the US and the UK due to outsourcing from developing countries. Firm level econometrics
analysis also confirms that growth of the US and the UK economy is very important for the India’s ITES/BPO exports. However, this indicates concentration of market risk. In this context it is worthy to note that, McKinsey study revealed that more than three-fourth of the value being created in the global economy through offshoring goes to the US and receiving countries like India get only 22 per cent (Dey, 2004).

100
Annex 5.1: List of ITES/BPO Firms Used for Panel Data Analysis
S.No ITES/BPO Firms
1 3I Infotech Ltd. 2 Accel Frontline Ltd. 3 Aftek Ltd. 4 Aptech Ltd. 5 Aztecsoft Ltd. [Merged] 6 B 2 B Software Technologies Ltd. 7 Bristlecone India Ltd. 8 C G-V A K Software & Exports Ltd. 9 C M C Ltd. 10 California Software Co. Ltd. 11 Cambridge Solutions Ltd. 12 Chakkilam Infotech Ltd. 13 Compucom Software Ltd. 14 Compulink Systems Ltd. 15 Computech International Ltd. 16 Core Projects & Technologies Ltd. 17 Cranes Software Intl. Ltd. 18 Danlaw Technologies India Ltd. 19 Datamatics Global Services Ltd. 20 Educomp Solutions Ltd. 21 Encore Software Ltd. 22 F C S Software Solutions Ltd. 23 Financial Technologies (India) Ltd. 24 Fortune Infotech Ltd. 25 Four Soft Ltd. 26 Geodesic Ltd. 27 Geometric Ltd. 28 Globsyn Infotech Ltd. 29 H C L Technologies Ltd. 30 Hexaware Technologies Ltd. 31 I C S A (India) Ltd. 32 I T C Infotech India Ltd. 33 Infosys Technologies Ltd. 34 Infotech Enterprises Ltd. 35 Intertec Communications Ltd. 36 Jubilant Biosys Ltd. 37 K L G Systel Ltd. 38 K P I T Cummins Infosystems Ltd. 39 Kale Consultants Ltd. 40 Kals Information Systems Ltd. 41 L G S Global Ltd. 42 Larsen & Toubro Infotech Ltd. 43 Logix Microsystems Ltd. 44 Lucid Software Ltd. 45 Mascon Global Ltd.
S.No ITES/BPO Firms
46 Mastek Ltd. 47 Megasoft Ltd. 48 Melstar Information Technologies Ltd. 49 Micro Technologies (India) Ltd. 50 Moschip Semiconductor Technology Ltd. 51 Mphasis Ltd. 52 N I I T Ltd. 53 N I I T Technologies Ltd. 54 Netlink Solutions (India) Ltd. 55 Nettlinx Ltd. 56 Nihar Info Global Ltd. 57 Northgate Technologies Ltd. 59 Nucleus Software Exports Ltd. 59 Ontrack Systems Ltd. 60 Onward Technologies Ltd. 61 Oracle Financial Services Software Ltd. 62 P S I Data Systems Ltd. 63 Panoramic Universal Ltd. 64 Patni Computer Systems Ltd. 65 Polaris Software Lab Ltd. 66 Quintegra Solutions Ltd. 67 R S Software (India) Ltd. 68 R Systems International Ltd. 69 Ram Informatics Ltd. 70 Ramco Systems Ltd. 71 Rolta India Ltd. 72 S Q L Star International Ltd. 73 Sasken Communication Technologies Ltd. 74 Saven Technologies Ltd. 75 Softsol India Ltd. 76 Sonata Information Technology Ltd. 77 Spanco Ltd. 78 Subex Ltd. 79 Take Solutions Ltd. 80 Tanla Solutions Ltd. 81 Tata Elxsi Ltd. 82 Tata Technologies Ltd. 83 Tech Mahindra Ltd. 84 Teledata Informatics Ltd. 85 Tera Software Ltd. 86 Virinchi Technologies Ltd. 87 Visu International Ltd. 88 Wipro Ltd. 89 Zensar Technologies Ltd. 90 Zylog Systems Ltd.
Note: 90 firms are selected for the period 2003-04 to 2008-09 on the basis of availability of data for all the variables selected for the analysis (i.e., foreign exchange earnings, advertising, marketing and distribution expenses, sales, expenses and age of sample). The sample includes most of the top firms providing ITES/BPO services including Infosys, Wipro, Tech Mahindra etc. Source:CMIE database

101
6. CONCLUSIONS AND POLICY SUGGESTIONS
6.1 Hypothesis and majorfindings
This study set a number of hypotheses (discussed in detail in Chapter 3). In brief the hypotheses set are, India has comparative advantage in services exports especially in ITES/BPO exports. Software and Business services exports give significant support to India’s BoP. Outsourcing from developing countries are not leading to unemployment in the US and the UK. The economic growth in the US and the UK is important for India’s ITES/BPO exports. There is an inverse relationship between appreciation of Rupee and India’s ITES/BPO exports. Firm specific variables like, advertising is an important determinant of promoting ITES/BPO exports. Summary of major findings with respect to these hypotheses are set out below:- 1. Computation of RCA index indicates that India is having comparative advantage in export of services including export of computer and information services. Further the trend in indices point out that the RCA in goods export by India is gradually coming down.
2. ITES/BPO sector provide significant support to India’s current account and thus balance of payments. It has helped in diversification of current account receipts, which earlier was heavily depending on private transfers. It also contributes to capital account by attracting foreign investment in ITES/BPO sector. Foreign exchange earnings from ITES/BPO exports have significantly contributed to rising foreign exchange reserves position of India. However, there is a strong association between India’s ITES/BPO exports and the US GDP. Correlation between the cyclical behavior of the US GDP and software and business services exports is statistically significant at 5 per cent level and this correlation is stronger than other components of services exports from India. Further, the upswing and downswing in exports of ITES/BPO sector are moderate as compared with other export items of current account receipts.
3. Analysis of employment data in the US and the UK undertaken in this study clearly point out that outsourcing to India does not have any significant effect on skilled employment in the US or the UK at an absolute level. Further,

102
MNCs from the developed countries seem to be dominating in international outsourcing business. Among the top 10 firms in outsourcing sector, most of the firms are from developed countries. It is also noted that the US is having a consistent surplus in trade in services for the past many years. An analysis of trend in the US labour productivity during 1970 Q1 to 2010 Q3 in nonfarm business sector shows that growth in nonfarm labour productivity accelerated at sharper rate in post 2000 period. This upward shift is mainly attributed to the recent growth in ITES world over indicating that ITES sector has helped US economy rather than harming it.
4. We have attempted an empirical investigation regarding whether there exists a non-spurious relationship between India’s software exports and the US economic growth. From our analysis we infer a cointegrating relationship between India’s software exports and US economic growth and Rupee/US dollar exchange rate. 5. Panel data analysis using a sample of 90 firms indicates that advertising intensity of firms, growth in major markets, viz., the US and the UK have a positive impact on exports of India’s ITES/BPO firms. The importance of the US and the UK economic growth indicates country concentration risk of India’s ITES/BPO exports. This indicates that ITES/BPO firms will be victim to financial crisis/business cycles in these countries. Therefore,
diversification of market is essential for long term growth. MNCs having subsidiaries in India explored the Indian market for services even before Indian firms started giving attention to domestic market. However, in recent years even Indian firms are seeing domestic market as a good opportunity. Growing domestic market will give ITES/BPO firms an alternative market other than the US and the UK market. Appreciation of REER/NEER is likely to adversely impact firm’s exports. Age of the firm and market share of firm is not a significant factor in deciding exports. This indicates that relatively new companies are active in the exports business.
6. Top five importers of computer and information services or countries which outsource maximum in the year 2008 are developed countries like US, Germany and UK. However intensity of imports of these countries lags behind many small countries like Luxembourg, Finland and even India. Similarly, top five importers of business services in the year 2008 are developed countries like, Germany, US, Italy, Ireland, and UK. But it is natural that big economies import more than poor countries. However, in terms of economic size or in terms of GDP, it is poor countries like Republic of Congo, Lebanon, Angola, Surinam and Guyana which are more outsourcing intensive or importing maximum business services. This fact clearly goes against the anti-outsourcing legislations in developed countries.

103
6.1.1Otherfindings
7. In India, indefinite continuation of fiscal concession to this sector is not advisable as it has the potential to become a major source of revenue for the Government. Further, effective rate of tax of ITES/BPO sector is too low in India compared with tax rates in other sectors.
8. ITES/BPO exports are concentrated in few big firms indicating oligopoly tendencies. Majority of other Indian firms are too small to make their presence felt. A large number of smaller firms co-exist with these few big firms. In India, R&D activities among ITES/BPO firms are concentrated only around few big firms. However, emergence of number of smaller firms provides good potential for employment opportunities (both direct and indirect) in India.
9. ITES/BPO sector can play a major role in India’s inclusive growth. Besides export, more attention may be given to role of ITES in development of domestic economy and good governance.
6.2 Challenges for India’s ITES/BPO sector
The US dollar is the major currency in which ITES/BPO firms do their business. Therefore, fluctuation in the value of the Rupee/US dollar is a matter of concern. Appreciation in the
exchange rate along with rising costs may dampen attractiveness of ITES/BPO exports from India. Further, high attrition and rise in wage are increasing the costs for ITES/BPO firms. Rising frauds and data theft is also a matter for concern. Among many competitor countries, India ranks poor in business environment. In this regard, India’s competitor countries like China, Ireland, etc are having a far better domestic business environment. Competition in ITES/BPO sector is rising, especially from other low cost countries like the Philippines, China, Czech Republic, Ireland, etc. India needs to improve its infrastructure substantially to face the emerging competition. Diversifying ITES/BPO operational base to rural areas and 2nd tier and 3rd tier cities of India is a strategy to control cost. In this regard the recent move by Government of India regarding work from home agent concept is noteworthy. Further, the rise in anti-outsourcing legislations world-wide puts various trade barriers. Change in legislations visa rules, etc., in other countries is another matter of concern for Indian firms. India’s ITES/BPO firms also face concentration of market risk because the US and the UK constitute more than 70 per cent of the market of Indian ITES/BPO firms. Any slowdowns in economic growth in these countries do impact the business of Indian ITES/BPO firms.

104
6.3 Limitations of the Study
The study focuses on international outsourcing of services (ITES/BPO exports) and therefore excludes outsourcing of manufacturing activities and domestic outsourcing or inshore outsourcing. Even though attempt has been made to make the study as precise as possible, certain limitations are bound to creep into the study. Some of these are summarized below:-
There are number of limitations of the available data on ITES/BPO sector. First of all a comprehensive database on ITES/BPO firms are not available. Even the available data suffers from lack of uniformity in definition, classification, etc. Some of the problems with data on trade in services can be explained by factors such as reporting difficulties, collection methods (surveys or customs records), status of implementing Balance of Payments methodology in different countries and rules and complexity of the structures and operations of multinational firms (OECD, 2005a). Limitations of data preempt the scope for a detailed econometric investigation. For a firm level study the limited information on ITES/BPO companies provided by CMIE is utilized. However, this does not capture data on call centers, business services, etc. India’s BoP statistics capture data on non-resident payments and receipts.
However, much of the data on outsourcing in BoP is captured under the item ‘Miscellaneous’ or ‘Others’ which comprises number of items clubbed together. In this regard it is worth mentioning that RBI has made number of attempts to improve the data base including adding new purpose codes to capture finer disaggregated data of various services traded. More disaggregated data on the item ‘miscellaneous services’ is available only since 2000. Absence of a comprehensive data base necessitates use of information on the topic from media and press reports also. Database on call centre activities are very scanty except some limited information from press reports etc. Therefore, this study primarily concentrate on IT enabled outsourcing including software and business services. Data on outsourcing generated by different agencies like RBI, NASSCOM, CMIE, IMF, etc. are used since no single agency generates a comprehensive database for outsourcing. However, classifications of data by these agencies are not strictly uniform.
In view of all these limitations, it is accepted that there is scope for modification and improvement. However, these limitations do not undermine the relevance of the present study as it is comprehensive in nature and utilizes multiple sources of information to support its findings.

105
Description of Methodology
(i) Stationarity Tests
Before the testing for a non-spurious long-run relationship between the time series, the first step is to check the stationarity of the variables used in the models to be estimated. This is to verify whether a series is stationary or non-stationary and to identify the order of integration of the time-series used in the model. The importance of stationarity feature of the series is that the impact of shocks to a stationary time series dissipates in the long run. The identification of the order of integratedness of a series is important so as to avoid estimation of spurious regressions. It may be mentioned that, this section heavily draws on Brooks (2008) and Enders (2004), where a neat description of these methods have been provided.
A time series is said to be strictly stationary, if the joint distribution of Xt1, Xt2, ... Xtn is the same as the joint distribution of Xt1+ t,Xt2+ t,....., Xtn+ t, for all t1, t2, ....,tt, and t. The
distribution of the stationary process remains unchanged even if shifted in time by an arbitrary value of t time period. The mean and variance of Xt
are constant and the covariances of Xt depend only on the lag or difference t = t1-t2, not on t1 or t2.
(a) Unit Root Test
Unit root tests identify the time-series properties or the data generating processes (DGP) of the variables used in the study. Dickey-Fuller (DF) test (Dickey and Fuller, 1979) is based on independently and identically distributed (iid) errors. In the following discussions, we have briefly touched upon the specification of a unit root process based on Enders (2004) and Brooks (2008). The basic objective of the test is to examine the null hypothesis that the series Yt contains a unit root, i.e., f = 1. Suppose we are given an AR(1) process, as specified in equation 5.3
Yt =fYt-1 + ut -1 < f < 1 (5.3)
where ut is a white noise error term. If f = 1, that is, in the case of a unit
APPENDIX

106
root, equation (5.3) becomes a random walk model without drift, which is a non-stationary stochastic process. Thus, the null hypothesis or H0 is: “Series Yt contains a unit root” versus alternative hypothesis “Ht : Yt series is stationary”.
Substracting Yt-1 from both the sides of equation (5.3), we obtain equation (5.4) or (5.4a).
Yt - Yt-1 = fYt-1 -Yt-1+ ut (5.4) = (f-1)Yt-1 +ut (5.4a)
Equation (5.4a) can be alternatively written as equation (5.5) as DYt=dYt-1 +ut (5.5)
where d = (f - 1) and D as usual first difference operator. This transformation of coefficients from f to d enables us to test the hypothesis as to whether the coefficient of Yt-1 are statistically significantly different from zero or not.
The three types of non-stationary series and the methods for testing for the presence of a unit roots in time series as described by Enders (2004) are presented in equations (5.5) to (5.7).
DYt=aodYt-1 +ut (5.6)
DYt=ao + dYt-1 + a2 t+ut (5.7)
Equation (5.5) describes a non-stationary series process which can be made stationary after differencing it once and it has neither a drift (intercept) nor the deterministic trend (captured by time variable t). It is a pure random walk model. Equation (5.6) has a drift but no trend and equation (5.7) has both a drift and the linear trend. The parameter of interest in regression equations (5.5) to (5.7) is d, if d = 0 the {Yt} sequence contains a unit root. The null hypothesis (Ho) of presence of a unit root in series Yt is rejected in favour of the alternative hypothesis (H1) of stationarity in {Yt} The Augmented Dickey-Fuller (ADF) test which we have applied in the present empirical analysis consists of estimating the regression equation (5.8).
where
ut is a pure white noise term. , DYt-2= (Yt-2 - Yt-3) and so on. The number of lagged difference terms to include is often determined empirically, the idea being to include enough terms so that the error term is serially uncorrelated. (ii) Cointegration Test: Residual Based approach The residual-based tests for cointegration are due to Engle and

107
Granger (1987). A great deal of economic theory generally deals with long run equilibrium relationships generated by market forces and behavioural rules. If a stationary linear combination of the time series exists, the non-stationary time series are said to be cointegrated. The stationary linear combination is called the cointegrating equation and is interpreted as a long-run equilibrium relationship among the variables.
In a single equation framework, assuming that Yt ~ l(1), the two-step estimation procedure by Engle and Granger (1987) involves the following procedure:
(1) To test whether the series are cointegrated, the cointegration regression equation (5.9) is estimated
by ordinary least square (OLS). Yt=b1 + b2X2t + b3X3t + ut (5.9)
For the estimated model, the SRF is as specified in equation (5.10). Yt=b1 + b2X2t + b3X3t + ut (5.10)
Keeping the residual on the r.h.s we get equation (5.11) Yt-b1 - b2X2t - b3X3t = ut (5.11)(2) Again, the residuals when expressed in this way can be considered a linear combination of the variables. We can perform an ADF test on the residual sequence to determine whether it has a unit root. If the residuals obtained by equation are found to be I(0), then the variables Y and X are cointegrated and have a long run relationship.
^
^ ^ ^ ^
^ ^ ^

108
REFERENCES
Accenture. 2004. “Driving High-Performance Outsourcing: Best Practices from the Masters, Executive Survey Results,” Technical Report.
Adlung, Rudolf and Aaditya Matoo. 2008. “The GATS” in A Handbook of International Trade in Services,” Matoo, Aaditya, Robert M. Stern and Gianni Zanini, eds. Oxford.
Ahuja, Rajeev. 2004. “Outsourcing and Job Loss: A Protectionist Fallacy,” Indian Council for Research on International Economic Relations. Working paper No.136.
Ahuja, S. 1993. “Liberalisation of Trade in Services: The Revealed Comparative Advantage Approach.” Foreign Trade Review, Vol. XXVIII, No.1.
Amiti, Mary and Wei, Shang-Jin. 2004a. “Fear of Outsourcing: is it Justified,” International Monetary Fund, Working Paper No. 04/186.
Amiti, Mary and Wei. Shang-Jin. 2004b. “Service Outsourcing, Productivity and Employment: Evidence from the United States,”
International Monetary Fund, Working Paper No. WP/05/238.
Antras, Pol. 2005. “Comments and Discussion” in Trefler, Daniel “Service Offshoring: Threats and Opportunities,” Brookings Trade Forum on Offshoring White-Collar Work. May.
Antras, Pol; Luis Garicano and Esteban Rossi- Hansberg. 2005. “Offshoring in Knowledge Economy,” National Bureau of Economic Research. Working Paper No. 11094.
Aron, Ravi and Jitendra V Singh. 2005. “Getting Offshoring Right,” Harvard Business Review, December.
Arora, Anil. 2007. “International Trade: Theories and current trends in the globalised world,” Deep and Deep publications, New Delhi.
Arora, Ashish. 2008. “The Indian Software Industry and Its Prospects,” in Sustaining India’s Growth Miracle. Jagdish N.Bhagwati and Charles W Calomiris, eds. New Delhi: Stanza Publication.

109
Arora, Asish and Alfonso Gambardella. 2004. “The Globalization of the Software Industry: Perspectives and Opportunities for Developed and Developing Countries.” National Bureau of Economic Research, Working Paper No:10538.
Baily, Martin Neil. 2007. “US Services Trade and Offshoring,” Presentation at Princeton’s CEPS Symposium on Offshoring in The Brookings Institution, November 16.
Balassa, B . 1967. Trade Liberalization Among Industrial Countries. New York: McGraw Hill.
Balassa,B .1965. “Trade Liberalisation and ‘Revealed’ Comparative Advantage,” The Manchester School, Vol. 33, Issue 2, pp. 99-123.
Baldwin, Richard.2006. “Globalisation: The Great Unbundling(s),” Prime Minister’s Office, Economic Council of Finland, September. Available at: http://hei.unige.ch/~baldwin/PapersBooks/Unbundling_Baldwin_06-09-20.pdf.
Banerjee Pritam. 2006. “Towards an Appropriate Approach to Trade Diplomacy in Services,” in Beyond the Transition Phase of WTO: An Indian Perspective on Emerging Issues, Dipankar Sengupta, Debashis Chakraborty, and Pritam Banerjee, eds. Academic Foundation, New Delhi.
Banga, Rashmi. 2005. “Critical Issues in India’s Service-Led Growth,” Indian Council of Research in International Economic Research. Working Paper,171, October.
Bartel, Ann P, Saul Lach and Nachum Sicherman. 2008. “Outsourcing and Technological Innovations: A Firm-Level Analysis,” Discussion Paper Series No. 6731, Centre for Economic Policy Research, March.
Batra, Ravi and Hamid Beladi .2010. “Outsourcing and the Heckscher–Ohlin Model,” Review of International Economics. Vol.18, No.2.
Bauamol, William J.1967. “Macroeconomics of Unbalanced Growth: The Anatomy of Urban Crisis,” American Economic Review, Vol. 57, Issue 3.
Bauamol ,William J; B Blackman and Edward N. Wolff.1985. “Unbalanced Growth Revisited: Asymptotic Stagnancy and New Evidence,” American Economic Review, Vol. 75, Issue 4.
Bhagwati, Jagdish N. 1964. “The Pure theory of international trade: A survey,” Economic Journal.Vol.74.No.293.
Bhagwati, Jagdish N .1984a. “Why are Services Cheaper in the Poor Countries?,” The Economic Journal Vol. 94. No.374

110
Bhagwati, Jagdish N. 1984b. “Splintering and Disembodiment of Services and Developing Nations,” World Economy, Vol. 7, Issue 2.
Bhagwati, Jagdish N and TN Srinivasan.1984. Lectures on International Trade. London: The MIT Press.
Bhagwati, Jagdish N. 1990. ‘‘Multilateralism at Risk: The GATT is Dead, Long Live the GATT,’’ The World Economy, Vol. 13. Issue 2.
Bhagwati, Jagdish N .1994. “Free Trade Old and New Challenges,” The Economic Journal, Vol.104.No. 423.
Bhagwati, Jagdish N, Arvind Panagariya and TN Srinivasan. 2004. “The Muddles Over Outsourcing,” Journal of Economic Perspectives, Vol. 18, No. 4.
Bhatt, M. S. and Asheref Illiyan. 2009. “Information Technology ( IT) in the Indian Economy: Policies, Prospects and Challenges,” New Century Publications, New Delhi.
Blinder, Alan S. 2006. “Offshoring: The Next Industrial Revolution,” Foreign Affairs, April. Vol. 85, No. 2.
Bresnahan, Timothy; Alfonso Gambardella and Annalee Saxenian. 2001. “Old Economy Inputs for New Economy Outcomes: Cluster
Formation in the Sew Silicon Valley,” Industrial and Corporate Change, Vol. 10, No. 4.
Bresnahan ,Timothy and Alfonso Gambardella .2002.“Old Economy” Inputs For “New Economy” Outcomes: Cluster Formation in the New Silicon Valleys, Paper to be presented at the Druid Summer Conference on “Industrial Dynamics of the New and Old Economy - who is embracing whom?” Copenhagen/Elsinore, June 6-8
Brooks, Chris. 2008. Introductory Econometrics for Finance, Second Edition, Cambridge University Press, New York.
Brynjolfsson, E. and Hitt, L. 1996. “Paradox Lost? Firm-Level Evidence on the Returns to Information Systems Spending,” Management Science, Vol. 42, No.4. pp 541-58.
Business Standard .2004. “EU may put squeeze on outsourcing,” May 5.
Business Standard .2009. “IT companies go slow on H-1 B visas,” July 16.
Business Standard.2010. “IT exports to be higher this financial year,” October 29.
CMIE, Prowess online database, Center for Monitoring Indian Economy.
111
Chanda, Rupa . 2002. “Trade in Health Services,” Bulletin of World health Organization, Vol. 80, No.2. http://www.who.int/bulletin/archives/80(2)158.pdf
Chanda, Rupa and Sasidaran G .2007. “GATS and Developments in India’s Service Sector” in India’s Liberalisation Experience: Hostage to the WTO?, Suparna Karmakar, Rajiv Kumar and Bibek Debroy, eds. Sage Publications.
Chaudhuri, Sumanta .2007. “Plurilateral Negotiations in Services” in India’s Liberalisation Experience: Hostage to the WTO?, Suparna Karmakar, Rajiv Kumar and Bibek Debroy, eds. Sage Publications
Chithelen, Ignatius. 2004. “Outsourcing to India: Causes, Reaction and Prospects,” Economic and Political Weekly, Vol. 39, No.10 pp. 1022-24.
Choi, E Kwan. 2007. “To Outsource or not to Outsource in an Integrated World,” International Review of Economics and finance. Vol. 16, pp. 521-27.
Choi, E Kwan. 2003. “Implications of Many Industries in the Heckscher-Ohlin Model,” in Handbook of International Trade. Choi, E Kwan and James Harrigan, eds. Blackwell.
Choi, Jai-Young and SH Yu. 2002. “External Economies in the International Trade Theory: A Survey”. Review of International Economics, Vol. 10. No. 4.
Christen, E. and J. Francois .2009. “Modes of Delivery in Services,” University of Linz, mimeo. June. Available at, http://www.cepr.org/meets/wkcn/2/2404/papers/Christen.pdf
Clark, Colin, 1940. The Conditions of Economic Progress, Macmillan, London.
Coe, David T. 2008. “Jobs on Another Shore,” Finance and Development, International Monetary Fund, March.
Dahlman, Carl and Anuja Utz. 2005. “India and the knowledge Economy: Leveraging strengths and Opportunities,” World Bank Institute Development Studies, The World Bank.
Daniels, Peter W. 2007. “A Global Service Economy” In the Handbook of service industries, John R Bryson and Peter W Daniels, eds. 103-125, Cheltenham, UK: Edward Elgar.
Das, Ram Upendra. 2005. Trade, Technology and Growth, Bookwell, New Delhi.

112
Das, Shyamanuja. 2009. “Credibility Crisis,” DATAQUEST, January 31. Vol. XXVII No.2.
Davis, Donald R.1995. “Intra-industry trade: A Heckscher-Ohlin-Ricardo Approach,” Journal of International Economics, Vol. 39, Issue 3-4.
De, Rajneesh. 2010. “Target India,” DATAQUEST, April 30. Vol. XXVIII No.08.
Deardorff, Alan V. 2005. “A trade theorist’s take on skilled-labour outsourcing” International Review of Economics and Finance. Vol. 14, Issue 3.
Deardorff, Alan V. and Robert M Stern. 2004. “Empirical Analysis of Barriers to International Services Transactions and the Consequences of Liberalization,” Research Seminar In International Economics, Discussion Paper No. 505.
Deardorff A.V. and Stern R.M. 2008. “Empirical Analysis of Barriers to International Services Transactions and the Consequences of Liberalisation”, in eds. A. Mattoo, R.M. Stern and G. Zanini, A Handbook of International Trade in Services, Oxford University Press, pp. 169-200
Deloitte . 2003. “Making the Offshore Call: The Road Map for Communications Operators,” Research report.
Dey, Dipankar . 2004. “Anxieties over offshoring: State Vs New Economy,” Economic and Political Weekly, Vol. 39, No.24. June.
Dickey, D.A. and W.A. Fuller.1979. “Distribution of the Estimators for Autoregressive Time Series with a Unit Root,” Journal of the American Statistical Association, Volume 74, No366, p. 427–431.
Dixit AK and V Norman. 1980. Theory of International Trade. Cambridge University Press.
DNA. 2010. “IT: Now a place for non-engineering students,” News paper, May 16, p2
DNA.2010. “Outsourcing has Western lawyers making a beeline for India,” DNA Money August 6, 2010 p24.
DNA. 2010. “IT cos set to pick tab for US border security,” Money, August 7, 2010, p21.
Economic Times. 2008. “US IT spend may dip 5 per cent in 2009,” Mumbai.
Ellsworth, PT. 1940. “A comparison of International Trade Theories”. The American Economic Review, Vol.30, No. 2.
Enders, Walter. 2004. “Applied Econometric Time Series,” Second Edition, Wiley India, New Delhi.

113
Enderwick, Peter. 2007. “Multinational Service Firms and Global Strategy,” In the Handbook of service industries, John R Bryson and Peter W Daniels, Cheltenham, eds. UK: Edward Elgar.
Engman, Michael. 2007. “Expanding International Supply Chains: The Role of Emerging Economies in Providing IT and Business Process Services: Case Studies of China, the Czech Republic, India and Philippines.” OECD Trade Policy Working Paper 52.
Engle, Robert F. and Clive W. J. Granger.1987. Co-integration and Error Correction: Representation, Estimation, and Testing, Econometrica, vol. 55, issue 2, pages 251-76
Feenstra Robert C and Gordon H Hanson.1996. “Globalization, Outsourcing and Wage Inequality,” National Bureau of Economic Research. Working Paper No. 5424.
Feenstra, Robert C and Gordon H Hanson.2003. “Global Production Sharing and Rising Inequality: A Survey of Trade and Wages,” in Handbook of International Trade. Choi, E.Kwan and James Harrigan, eds. Blackwell.
Feenstra, Robert C and Alan M. Taylor.2008. “International Economics,” Worth Publishers, United States.
Ferro, Anna. 2006. “International Outsourcing in the ICT Sector: Firms’ Strategies and High Skilled Workers within a Spatial Division of Labor,” The ICFAI Journal of Knowledge Management, Vol. IV No.2, June.
Financial Express. 2008. “WTO Talks Falter on Opening Markets for Services,” January 11, Mumbai.
Fisher, Allan G.B. 1935. The Clash of Progress and Security, London.
Francois, Joseph and Bernard Hoekman. 2009. “Services Trade and Policy,” Centre for Economic Policy Research. Discussion paper series No. 7616.
Gandhi and Ganesan . 2002. “The Role of Services Sector: A Comparative Analysis of India and Tamilnadu,” in Services Sector in the Indian Economy. Jegadish Gandhi and P Ganesan, eds. Deep and Deep Publications, New Delhi.
Gordon, Jim and Poonam Gupta . 2003. “Understanding India’s Services Revolution,” Paper prepared for the IMF-NCAER Conference, A Tale of Two Giants: India’s and China’s Experience with Reform, November 14-16, New Delhi.
GOI .Various issues. Annual Report, Ministry of Commerce, Government of India, New Delhi.

114
GOI .Various issues. Economic Survey, Ministry of Finance, Government of India, New Delhi.
GOI .2004. India Vision 2020, Planning Commission, Government of India, New Delhi.
GOI .2007. Annual Plan 2006-07, Planning Commission, Government of India, New Delhi.
GOI .2010a. National Accounts Statistics, Central Statistical Organisation, Government of India, New Delhi.
GOI .2010b. “Value Addition and Employment Generation in the ICT Sector in India”, Central Statistical Organisation, Government of India, New Delhi.
GOI .Undated. “A brief note on Electronic Commerce in WTO” Department of Commerce, Government of India, New Delhi.
Gorg, Holger and Aoife Hanley. 2009. “Services Outsourcing and innovation: An Empirical Investigation,” Centre for Economic Policy Research, Discussion Paper No. 7390.
Grimwade, Nigel. 2000. International Trade: New patterns of trade, production and investment. London and New York: Routledge.
Grossman Gene M and Elhanan Helpman. 2002a. “Outsourcing in a Global Economy,” National Bureau of Economic Research. Working Paper No. 8728.
Grossman Gene M and Elhanan Helpman. 2002b. “Integration versus Outsourcing in Industry Equilibrium,” The Quarterly Journal of Economics, February. pp. 85-120.
Grossman Gene M and Elhanan Helpman. 2003. “Outsourcing versus FDI in Industry Equilibrium,” Journal of the European Economic Association, Vol. 1. pp.317-27.
Grossman, Gene M. and Rossi-Hansberg, Esteban. 2006. “The Rise of Offshoring: It’s Not Wine for Cloth Anymore,” Princeton University, Paper prepared for the symposium sponsored by the Federal Reserve Bank of Kansas City.
Grossman,Gene M,and Elhanan Helpman.2001. “Integration Vs Outsourcing in Industry Equilibrium,” Discussion paper in Economics No.212, Woodrow Wilson School of Public and International Affairs, Princeton University.
Grubel, HG and PJ Lloyd. 1975. Intra-industry trade: The theory and measurement of international trade in differentiated products. London:Macmillan.

115
Guha, Piyali. 2010. “Budgeted for IT?,” DATAQUEST, April 30. Vol. XXVIII No.08.
Gujarati, Damodar N .2003. Basic Econometrics, International Edition, McGrawHill, Fourth Edition, Singapore.
Gupta, Poonam; Rana Hasan, Utsav Kumar. 2009. “Big Reforms but small payoffs: Explaining the Weak Record of Growth in Indian Manufacturing,” February 18, http://papers.ssrn.com/sol3/papers.cfm?abstract_id=1346042
Halcoussis, Dennis. 2005. Understanding Econometrics, Thomson South-Western, United States.
Hanna, Nagy. 1994. “Exploiting Information Technology for Development: A Case Study of India,” World Bank Discussion Papers No.246.
Harrigam, James. 2003a. “Introduction,” in Handbook of International Trade. Choi, E Kwan and James Harrigan, eds. Blackwell.
Harrigam, James. 2003b. “Specialisation and the Volume of Trade,” in Handbook of International Trade. Choi, E Kwan and James Harrigan, eds. Blackwell.
Helpman, E. 1981. “International trade in the presence of product differentiation, economies of scale and monopolistic competition,” Journal of international economics.Vol.11, Issue No.3.
Hijzen, Alexander. 2007. “International Outsourcing, Technological Change, and Wage Inequality,” Review of International Economics, Vol. 15. Issue 1.
Hindley, Brain and Alasdair Smith.1984. “Comparative Advantage and Trade in Services, World Economy, Vol.20.
Hoekman, B. M. and P. Sauve´. 1994. ‘‘Liberalizing Trade in Services,’’ World Bank Discussion Paper 243. Washington, D.C.: World Bank.
Hoekman, Bernard, Aaditya Matoo and Andre Sapir .2007. “The Political Economy of Services Trade Liberalization: a Case for International Regulatory Cooperation,” Oxford Review of Economic Policy, Vol. 23, No. 3.
Holman, Corey, Bobbie Joyeux and Christopher Kask.2008. “Labor Productivity trends since 2000, by sector and industry,” Monthly Labor Review. Bureau of Labor Statistics, February.
Horvat, Branko.1999. “The Theory of International Trade: An Alternative Approach,” Macmillan Press Ltd.
116
Huang, Yasheng. 2006. “China Could Learn from India’s Slow and Quiet Rise,” Financial Times. January 23.
Hufbauer, G.C. 1966. Synthetic materials and the theory of international trade. London: Duckworth.
IMF. 2001. “World Economic Outlook: The Information Technology Revolution, International Monetary Fund, October, Washington D.C.
IMF .1993. Balance of Payments Manual, Fifth edition, International Monetary Fund, Washington D. C.
IMF .2009. Balance of Payments and International Investment Position Manual, Sixth Edition, International Monetary Fund, Washington D. C.
IMF .Various issues. International Finances Statistics, International Monetary Fund, Washington D. C.
IMF .Various issues. Balance of Payments Statistics Year Book, International Monetary Fund, Washington D. C.
Infosys. 2009-10. Annual Report.
IMF. 2010. Balance of Payments Statistics CD-Rom, International Monetary Fund, February, Washington
Jadav, Narendra, Rajiv Ranjan and
Sujan Hajra. 2005. Remerging India: A Global Perspectives, ICFAI University Press.
Jain, Rajeev. 2005. “Firm Structure, Conduct and Economic Performance: A Study of Large and Medium Manufacturing Firms in India”, Thesis submitted to the Panjab University, Chandigarh.
Jalan, Bimal. 2002. India’s Economy in the new millennium: selected essays, New Delhi, Banglore: USB Publishers.
Jaumotte, Florence and Nikola Spatafora . 2007. “Asia Rising: A Sectoral Perspectives,” International Monetary Fund Working Paper 130.
Jones Ronald W. 2003. “Trade Theory and Factor Intensities: An Interpretative Essay,” in Handbook of International Trade. Choi, E Kwan and James Harrigan, eds. Blackwell.
Jones Ronald W. 2005. “Immigration vs. outsourcing: Effects on labor markets,” International Review of Economics and Finance, Vol. 14. Issue 2.
Joseph K J and K N Harilal. 2001. “Structure and Growth of India’s IT Exports: Implications of an Export-Oriented Growth Strategy,” Economic and Political Weekly, August 25. Vol. 36, No. 34.

117
Joseph K. J. 2009. “ASEAN-India Pact and Plantations: Realities of the Myths,” Economic and Political Weekly, October 31, Vol. XLIV, No. 44.Joshi, Mayur and Pradeep Akkunoor.2006. “Indian Call Centers woefully lacking in whistle-blowing policy and fraud response plan,” Indiaforensic Consultancy Services, Availble at: http://www.indiaforensic.com/callcenter.pdf acessed on November 26, 2010.
Joshi, Seema .2008. Growth and Structure of Tertiary Sector in Developing Economies, Academic Foundation, New Delhi.
Kalirajan, K.2000. “Restriction on Trade in Distribution Services,” Productivity Commission Staff Research Paper, AusInfo, Canberra (August).
Karmakar, Suparna. 2005. “India-Asean Cooperation in Services-An Overview,” Indian Council for Research on International Economic Relations, Working Paper 176.
Kelkar, Vijay L, Devendra N Chaturvedi and Madhav K Dar. 1991. “India’s Information Economy Role, Size and Scope,” Economic and Political Weekly, Vol. 14, No.35.
Khor, Martin . 2008. “Behind the July Failure of the WTO Talks on Doha,”
Economic and Political Weekly, August 16, Vol. XLIII, No. 33.
Kim, Hyun-Jeong. 2006. “The shift to the Service Economy: Causes and Effects,” Institute of Monetary and Economic Research. The Bank of Korea.
Kirankumar, Momaya 2004 ”Challenges for Indian Software Firms to Sustain their Global Competiveness,” Singapore Management Review, Vol.26, No.2.
Kirkegaard, Jacob F. 2005. “Outsourcing and Offshoring: Pushing the European Model Over the Hill, Rather Than Off the Cliff,” Peterson Institute for International Economics, Working Paper No.05-1.
Kirkegaard, Jacob F.2003. “Outsourcing-Stains on the White Collar?,” Institute for International Economics.
Kjeldsen-Kragh, Soren.2002. “International Economics,” Copenhagen Business School Press.
Kraemer, Kenneth L and Jason Dedrick. 1994. “Payoffs from Investment in Information Technology: Lessons from the Asia-Pacific Region,” World Development, Vol. 22. Issue 12.
Kraemer, Kenneth L and Jason Dedrick. 1999. “Information

118
Technology and Productivity: Results and Policy Implications of Cross-Country Studies,” Center for Research on Information Technology and Organizations, University of California, Working Paper No-PAC-144.
Kravis, I. B., A. W. Heston and R. Summers .1978. International Comparisons of Real Product and Purchasing Power. Baltimore: The Johns Hopkins University Press
Kravis, I. B., A. W. Heston and R. Summers .1982. World Product and Income. International Comparisons of Real Gross Product. Baltimore: The Johns Hopkins University Press.
Krugman, Paul R. 1990a. “New Theories of Trade among Industrial Countries”. The American Economic Review, Vol.73, No. 2.
Krugman, Paul R. 1990b. Rethinking International Trade. London: The MIT Press.
Krugman, Paul R. and Maurice Obstfeld. 2000. International Economic Theory and Policy, New York: Addison-Wesley.
Krugman, Paul R and Alasdair Smith. 1994. Empirical studies of strategic trade policy, University of Chicago Press.
Krugman, Paul.1994. “Introduction” in Empirical Studies of Strategic Trade Policy, Krugman, Paul and Alasdair Smith, eds. National Bureau of Economic Research Project, The University of Chicago Press, Chicago and London.
Kumar, N .2001. “Indian Software Industry Development: International and National Perspective, Economic and Political Weekly, Vol. 36, No.45.
Kumar, Nagesh and K.J. Josep.2005. “Export of Software and Business Process Outsourcing from Developing Countries: Lessons from the Indian Experience,” Asia-Pacific Trade and Investment Review, Vol. 1, No. 1.
Kumar, Nagesh and KJ Joseph. 2004. “National Innovation Systems and India’s IT Capability: Are there any lessons for ASEAN Newcomers?,” RIS Discussion paper # 72/2004.
Kumar, Shailendra. 2005. Trade in Services Advantage India, Bookwell, New Delhi.
Lall Sanjaya .1992. “Technological Capabilities and Industrialization,” World Development, Vol.20, No. 2.
Lee, Marlene A and Mark Mather.2008. “US Labor Force Trends,” Population Bulletin, Vol.63, No.2.

119
Levy, Frank. 2008. Comment on “Chapter The Indian Software Industry and Its Prospects” by Ashish Arora, in Sustaining India’s Growth Miracle, Jagadish N Bhagwati and Charles W. Calomiris, eds, Stanza publication.
Linder, S. B. 1961. An Essay on Trade and Transformation. New York: John Wiley
Liu, Runjuan and Daniel Trefler. 2008. “Much Ado about Nothing: American Jobs and The Rise of Service Outsourcing to China and India,” National Bureau of Economic Research, Working Paper No. 14061.
Mankiw, Gregory N. and Phillip Swagel. 2006. “The Politics and Economics of Offshore Outsourcing” NBER Working paper No. 12398.
Marjit, Sugata. 2007. “Trade Theory and the Role Time Zones,” International Review of Economics and Finance. Vol. 16, No. 2.
Markusen, James. 2005. “Modeling the Offshoring of white-collar services: From comparative advantage to the new theories of trade and FDI” NBER working paper 11827.
Marrewijk, Charles van .2002. International Trade and the World Economy, Oxford University Press.
Marshall, Alfred. 1890. Principles of Economic (8th ed., 1920), Macmillan
and Co. Ltd. Available at: http://www.econlib.org/library/Marshall/marP.html
Mathur, Vibha. 2005. WTO and India: Development Agenda for the 21st century, New Century Publication, New Delhi.
Mattoo, A. 1997. ‘‘National Treatment in the GATS: Corner-stone or Pandora’s Box?,’’ Journal of World Trade, Vol. 31. No.1, pp. 107–35.
Matoo, A. 1998. ‘’Financial Services and the WTO: Liberalization in the Developing and Transition Economies,’’ for presentation at the Workshop, ‘’Measuring Impediments to Trade in Services,’’ Productivity Commission, Canberra, April 30- May 1.
Mattoo, A. 2000. ‘‘Developing Countries in the New Round of GATS Negotiations: Towards a Proactive Role,’’ World Economy, Vol. 23. No. 4. pp. 471–89.
Mattoo, A. and C. Fink. 2002. ‘‘Regional Agreements and Trade in Services: Policy Issues,’’ World Bank Policy Research Working Paper No. 2852, June , Washington, D.C.: World Bank.
Mattoo, Aaditya. 2003. “Trade Note: Services in a Development Round,” World Bank September 10.

120
Matoo, Aaditya and Sacha Wunsch. 2004. “Pre-empting Protectionism in Services: The WTO and Outsourcing,” World Bank Policy Research Working Paper 3237.
Matoo, Aaditya and Robert M. Stern. 2008. “Overview” in A Handbook of International Trade in Services, Matoo, Aaditya, Robert M. Stern and Gianni Zanini, eds. Oxford.
Mattoo, Aaditya, and Pierre Sauve. 2008. “Regionalism in Services Trade.” In A Handbook of International Trade in Services, ed. Aaditya Mattoo, Robert M. Stern, and Gianni Zanini. Oxford: Oxford University Press.
McKinsey Report. 2003. “Offshoring: is it a win-win Game,” McKinsey Global Institute, San Francisco.
McKinsey on Economics. 2004. “Exploding the Myths of Offshoring,” Available at: http://www.mckinsey.com/mgi/reports/pdfs/exploding_myths/explodingoffshoringmyths.pdf
McMillin, Divya C. 2006. ‘’Outsourcing Identities: Call Centers and Cultural transformation in India,’’ Economic and Political Weekly, Vol. 41, No.3, pp. 235-41.
Melvin, James R . 1989. “Trade in Producer Services: A Heckscher-Ohlin Approach,” Journal of Political Economy, Vol. 97, No.5.
Melvin, James R. 1989. “Trade in Services, A Theoretical Analysis,” Institute of Research in Public Policy; Hali fax. Available at: h t t p : / /www.amazon .ca /Trade -services-theoretical-James-Melvin/dp/088645090X
Mildner, Stormy and Welf Werner. 2005. “Progress or Stagnation: Services Negotiations in the WTO Doha Development Round,” Intereconomics, May/June.
Mishra, PK.2010. “Capital Formation and Economic Growth: Dynamics,” SCMS Journal of Indian Management, July-September, Vol VII, No. III.
Mitra, Devashish and Priya Ranjan. 2005. “The Role of External Economies and Firm Heterogeneity,” National Bureau of Economic Research. Working Paper No.11718.
Morgan, Robert E and Constantine S. Katsikeas.1997. “Theories of International Trade, Foreign Direct Investment and Firm Internalization: A Critique,” Management Decision 35/1, pp.68-78.
Mukherjee, Arpita and Paramita Deb Gupta. 2006. “Prospects of IT-Enabled Services under Indo-US FTA,” Indian Council for Research in International Economic Relations, Working Paper No.187.

121
Murray, Roman. 1978. Telephone Marketing; How to Build Your Business by Telephone, McGraw Hill, New York.
NASSCOM. 2007. “Tracing China’s IT Software and Services Industry Evolution,” White paper, August.
NASSCOM Factsheet . undated. : “Information security environment in India-Nasscom analysis”. http://www.nasscom.in/upload/5216/Indian%20Security%20Environment%202005-06%20July%2006.pdf.
NASSCOM (Various Issues), “Strategic Review,” National Association of Software and Services Companies, New Delhi.
NASSCOM. 2007. “Tracing China’s IT Software and Services Industry Evolution,” Whitepaper prepared by Nasscom Research, August.
NASSCOM. 2007. “Case Study: Making Rural BPO a reality”. BPO Newsline. Issue No.73 http://www.nasscom.in/Nasscom/templates/NormalPage.aspx?id=53089
NASSCOM-IDC . 2005. “Key highlights of the Nasscom-IDC study on the domestic services IT-ITES market opportunity”. http://www.nasscom.in/upload/5216/Domestic%20Services.pdf
National Academy of Public Administration.2006a. “Off-shoring: An Elusive Phenomenon,” For the US Congress and the Bureau of Economic Analysis, January.
National Academy of Public Administration.2006b. “Off-shoring: How Big is it?, ” For the US Congress and the Bureau of Economic Analysis, October.
National Academy of Public Administration.2007. “Off-shoring: What are its Effects,” For the US Congress and the Bureau of Economic Analysis, January.
neoIT .2004., Offshoring in Central and Eastern Europe: A Closer Look at the Czech Republic, Poland and Hungary, Market Reports, Vol. 2, Issue 3.
Nguyen-Hong, D.2000. “Restrictions on Trade in Professional Services,” Productivity Commission, Staff Research Paper, AusInfo, Canberra (August).
OECD .2005a. Working Party on the Information Economy: Potential offshoring of ICT-intensive using occupations, Organization for Economic Co-operation and Development, Paris.
OECD .2005b. Trade and Structural Adjustment: Embracing Globalization, Organization for Economic Co-operation and Development, Paris.

122
Overman, Henry G, Stephen Redding, and Anthony J Venables . 2003. “Specialisation and the Volume of Trade,” in Handbook of International Trade. Choi, E Kwan and James Harrigan, eds. Blackwell.
Pal Parthapratim, and Mitali Dasgupta. 2009. “The ASEAN-India Free Trade Agreement: An Assessment,” Economic and Political Weekly, September 19, Vol. XLIV No. 38.
Panagariya, Arvind. 2008. “Transforming India,” in Sustaining India’s Growth Miracle, Jagadish N Bhagwati and Charles W. Calomiris, eds, Stanza publication.
Patibandla, Murali and Bent Petersen. 2002. “Role of Transnational Corporations in the Evolution of a High-Tech Industry: The Case of India’s Software Industry,” World Development, Vol.30, No.9.
Polley, William J. 2004. “Outsourcing on a Continuum of Intermediate Goods: Implications for Trade and Welfare,” Indian Journal of Economics and Business. Special issue.
Porter, M.E. 1990. The competitive advantage of nation. London: Macmillan.
Portugal-Perez, Alberto and John S. Wilson.2010. “Export Performance and Trade Facilitation Reform:
Hard and Soft Infrastructure” Policy Research Working Paper 5261, The World Bank, April.
Posner, M. 1961. “International trade and technical change,” Oxford Economic Papers, Vol.13, No. 3, pp.323-41.
Prasad H.A.C . 2007. “Strategy for India’s Services Sector: Broad Contours,” Working paper 1/2007, Ministry of Finance, Government of India.
Prasad H.A.C. 2005. “Market Access for Exports from India: Issues for Post-Cancun WTO Negotiations in Industrial, Agricultural and Services Sectors,” Ministry of Finance, Government of India, New Delhi.
PricewaterhouseCoopers . 2008. “Why isn’t IT spending creating more value? June.
Primo Braga, Carlos A. 2008. “E-Commerce Regulation: New Game, New Rules ? in A Handbook of International Trade in Services,” Matoo, Aaditya, Robert M. Stern and Gianni Zanini, eds. Oxford.
Rajwat, Yatish .2008. “Branding People: Salary Survey-IT,” Business World, February.
Ramesh P Babu. 2004. “Cyber Coolies’ in BPO - Insecurities and

123
Vulnerabilities of Non-Standard Work,” Economic and Political Weekly, Vol. 39, No.5.
Razdan, Ashwin. 2010. “It’s the Time to Samba,” DATAQUEST, January 15. Vol. XXVIII No.01.
Reddy, C. Rammanohar . 2003. “WTO Options to Contain BPO backlash in US,” July 27, The Hindu, Chennai.
Rediff News . 2006. “WTO Services: Ministry Moves Cabinet Note,” July 11, 2006 www.rediff.com/money/2006/jul/11wto.htm
RBI .2003. Report of the Technical Group on Re-examination of Data Reporting System on Software Exports’, March, Reserve Bank of India, Mumbai.
RBI .2009. Survey on Computer Software and Information Technology Services Exports 2007-08, RBI Bulletin, September, Reserve Bank of India, Mumbai.
RBI .2010a. Handbook of Statistics on Indian Economy 2010-11, Reserve Bank of India, Mumbai
RBI .2010b. Invisibles in India’s Balance of Payments: An Analysis of Trade in Services, Remittances and Income, RBI Bulletin, March, Reserve Bank of India, Mumbai.
RBI .2010c. Report of the Working Group on Balance of Payments Manual for India, RBI Bulletin, September, Reserve Bank of India, Mumbai.
RBI .Various issues. Report on Trend and Progress of Baking in India, Reserve Bank of India, Mumbai.
RBI .Various issues. Bulletin, Reserve Bank of India, Mumbai.
RBI .Various issues. Annual Report, Reserve Bank of India, Mumbai.
Rodriguez-Clare, Andres.2009. “Offshoring in a Ricardian World,” Pennsylvania State University and NBER, January.
Rodrik, Dani 2005. Comments and Discussion in Trefler, Daniel 2005. “Service Offshoring: Threats and Opportunities,” Brookings Trade Forum, Offshoring White-Collar Work.
Roy, Jayanta and Shweta Bagai. 2005. “Key Issues in Trade Facilitation,” World Bank Policy Research Working Paper No.3703. Washington, D.C: World Bank.
Sandhu, A. 2006. “Why Unions Fail in Organizing India’s BPO-ITES Industry,” Economic and Political Weekly, October 14.

124
Sapir, A and C.Winter.1994. “Services Trade,” in Surveys in International Trade, D.Greenaway and L.Winters, eds. Wiley-Blackwell.
Schumpeter, Joseph S. 1939. Business Cycles: A Theoretical, Historical and Statistical analysis of the Capitalist Process. New York: McGraw Hill.
Seth, Vijay K . 2006. Economics of Services: Story of transformation of Cindrella into queen of heart, Ane Books India, New Delhi.
Shah, Aashit and Vaibhav Parikh. undated. “Movement of Natural Persons Under the GATS in the Software Services Sector,” Nishith Desai Associates-Legal and Tax Counseling Worldwide.
Shingal, Anirudh, and Julien Chaisse. 2006. “A Burden or An Incentive: Developing World Trade and the Role of RTAs,” in Beyond the Transition Phase of WTO: An Indian Perspective on Emerging Issues, Dipankar Sengupta, Debashis Chakraborty and Pritam Banerjee, eds. Academic Foundation, New Delhi.
Singh, Harinam. 2009. “IT-enabled Good Governance in India” in Information Technology,” in the Indian Economy: Policies, Prospects and Challenges. MS Bhatt and Asheref Illiyan, eds. New Delhi: New Century Publications.
Singh, Jatinder. 2009. “Catalyzing a Turnaround,” DATAQUEST, January 31. Vol. XXVII No.02.
Somesh Kumar, Mathur. 2007. “Indian IT Industry: a performance analysis and a model for possible adoption,” Munich Personal RePEc Archive, MPRA paper No.2368.
Srinivasan, T.N . 2006. “China, India and the World Economy,” Economic and Political Weekly, Vol. 41. No.34.
Srinivasan, TN. 2003. “Integrating India with the World Economy,” in Reforming India’s External, financial, and fiscal policies. Anne O.Krueger and Sajjid Z. Chinoy, eds. California: Stanford University Press.
Srivastava, Prasoon. 2009. “Winning by Going Rural,” DATAQUEST, January 31. Vol. XXVIII No.02.
Stern, R, and Hoekman, B. 1987. “Negotiation on services,” World Economy, Vol.10, No.1, March.
Strassman, Paul . 1997. “Computers Have Yet to Make Companies More Productive,” Computerworld, September 15. http://www.strassmann.com/pubs/cw/yetprod.shtml
Strategy for India’s Services Sector: Broad Contours. 2007. Government of India. http://finmin.nic.in/WorkingPaper/1_2007_DEA.pdf

125
Subbarao, Duvvyri. 2010. “Five Frontier Issues in Indian Banking,” Inaugural Address at ‘BANCON 2010’ in Mumbai, December 3.
Suraj, PC. 2010. “A Big Bonanza,” DATAQUEST, May 31. Vol. XXVIII No.10.
Swenson, Deborah L. 2004. “Overseas Assembly and Country Sourcing Choices,” NBER Working Paper No. 10697.
Taganas, Rey AL and Kaul, Vijay Kumar. 2006. “Innovation Systems in India’s IT Industry: An Empirical Investigation,” Economic and Political Weekly, September 30.
Tarapore.SS. 2006. “Report of the Committee on Full Capital Account Convertibility,” Reserve Bank of India.
Taylor, Philip, Ernesto Noronha, Dora Scholarios and Premilla D’ Cruz. 2008. “Employee Voice and Collective Formation in Indian ITES-BPO Industry,” Economic and Political Weekly, Vol.43, No. 22, May 31.
The Economic Times. 2009. “India, Asean to fast-track services pact,” October 7. http://economict imes.indiat imes.com/news/economy/foreign-trade/India-Asean-to-fast-track-services-pact/articleshow/5095730.cms.
The Economist. 2007. “Information technology in India: Gravity’s Pull”. December. http://www.economist.com/node/10286436
The New Oxford Dictionary of English. 1998. Oxford University Press, New Delhi.
Thompson, Henry. 2003. “Robustness of the Stopler-Samuelson Intensity Price Link,” in Handbook of International Trade. Choi, E Kwan and James Harrigan, eds. Blackwell.
Tomiura, Eiichi. May . 2007. “Foreign Outsourcing, Exporting and FDI: A Productivity Comparison at the Firm Level,” Journal of International Economics, Vol. 72, issue 1,
Trefler, Daniel. 2005. “Offshoring: Threats and Opportunities,” Paper Prepared for the Brookings Trade Forum 2005, July 22. Washington D.C.
Tybout, James R. 2003. “Plant and Firm Level Evidence on “New” Trade Theories,” in Handbook of International Trade. Choi, E Kwan and James Harrigan, eds. Blackwell.
UNCTAD. 1988. Trade and Development Report, United Nations Conference on Trade and Development, New York.
UNCTAD. 1989. Trade in Services: Sectoral Issues, United Nations Conference on Trade and Development, New York.

126
UNCTAD. 1999. Lists Of Economic Needs Tests In The GATS Schedules Of Specific Commitments, Trade and Development Board.
UNCTAD.2004.World Investment Report , “The Shift Towards Services,” United Nations Conference on Trade and Development.
UNCTAD.2005a. Information Economy Report, United Nations Conference on Trade and Development, New York.
UNCTAD.2005b. World Investment Report, “Transnational Corporations and the Internationalization of R&D,” United Nations Conference on Trade and Development.
UNCTAD.2006. World Investment Report, “ FDI from Developing and Transition Economies: Implications for Development,” United Nations Conference on Trade and Development.
UNCTAD.2008. World Investment Report. “Transnational Corporations and the Infrastructure Challenge,” United Nations Conference on Trade and Development.
United Nations. 2002. Manual on Statistics of International Trade in Services, Geneva, Paris.
United Nations. 2005. “ICT and E-Business: Selected Trends and Issues on the ICT for Development Agenda,” Note by the UNCTAD Secretariat, December.
Utkulu, Utku and D. Seymen. 2004. “Revealed Comparative Advantage and Competitiveness: Evidence for Turkey vis-à-vis the EU/15”, European Trade Study Group 6th Annual Conference, September.
Varma, Roli and Everett M. Rogers. 2004. “India Cyber Workers in US,” Economic and Political Weekly, Vol. 39, No.52 December 25.
Vasudeva, PK . 2005. World Trade organization: Implications for Indian Economy, Pearson Education, Delhi.
Veeramani C, October. 2004. “Growing intra-industry trade in manufacturing: implications for policy,” Economic and Political Weekly, Vol. 39, No.41.
Velayudham, TK. 1998. Foreign Trade Theory and Practice. New Delhi: Wheeler Publishing
Vernon, R. 1966. “International investment and international trade in the product cycle,” Quarterly Journal of Economics, Vol. 80. No.2.
Vernon, R . 1974. “The Location of economic activity” in Economic

127
analysis and Multinational enterprise. Dunning, J.H, eds. London: Allen & Unwin.
Vincent, Sacha Wunsch, and Joanna McIntosh . 2005. WTO, E-Commerce and Information Technologies: From the Uruguay Round through the Doha Development Agenda, The United Nations ICT Task Force, United Nations.
Viramani, Arvind. 2003. “India’s External Reforms: Modest Globalization, Significant Gains,” Economic and Political Weekly Vol. 38, No. 32.
Walmsley T.L and L.A Winters .2002. “Relaxing the restrictions on the temporary movement of Natural Persons: A simulation Analysis,” November 4. https://www.gtap.agecon.purdue.edu/resources/download/2035.pdf
Walmsley, Terrie L. and L. Alan Winters. 2005. “Relaxing the Restrictions on the Temporary Movement of Natural Persons: A Simulation Analysis”, Journal of Economic Integration, December, 20(4).
Welsum, Desiree Van and Xavier Reif . 2005. “Potential Offshoring: Evidence from Selected OECD Countries,” Brookings Trade Forum, Brookings Institution Press.
Whalley, J. 2004. ‘’Assessing the Benefits to Developing Countries of Liberalization in Services Trade,’’ The World Economy, Vol. 27. Issue 8.pp 1123-53.
Winters, L. Alan . 2008. “The Temporary Movement of Workers to Provide Services . GATS Mode 4,” in Handbook of International Trade in Services. Aaditya Mattoo, Robert M. Stern, and Gianni Zanini, eds. Oxford University Press.
William, Pearce David .1992. Macmillan Dictionary of Modern Economics, Macmillan.
World Bank .2003. Global Economic Prospects and the Developing Countries 2004: Realizing the Promise of the Doha Round, The World Bank, Washington D. C.
World Bank .2002. ‘Trade in Services: Using Openness to Grow’, in Chapter 3, Global Economic Prospects, The World Bank, Washington D. C. World Bank. 2010. Doing Business Report 2010, The World Bank, Washington D.C.
World Economic Forum .2009. Global Competitiveness Report 2009-10.
WTO. 2005a. World Trade Report: Exploring the links between trade, standards and the WTO, Geneva, Switzerland.

128
WTO. 2005b. “COMMUNICATION FROM CANADA: Mode 4 Commitments and Economic Needs Tests,” Council for Trade in Services Special Session Committee on Specific Commitments. June. http://www. internat ional .gc.ca/ t rade-agreements-accords-commerciaux/assets/pdfs/SCSCW47.pdf
WTO.2008. World Trade Report, “Trade in a Globalizing World”, Geneva, Switzerland.
WTO. Various issues. Annual Report, World Trade Organization, Geneva, Switzerland
WTO. 2009. A Handbook on Reading WTO Goods and Services Schedules, Cambridge University Press, New York.
WTO. undated. Market Access-Unfinished business: Post-Uruguay Round Inventory and Issues, Special Studies-6.

129
92. Sri Lanka: A Study of India’s Trade and Investment Potential93. Potential for Export of IT Enabled Services from North Eastern Region
of India94. Potential for Export of Horticulture Products from Bihar and Jharkhand95. Increasing Wage Inequality in Developed Countries: Role of Changing
Trade, Technology and Factor Endowments96. Essays on Trade in Goods and Factor Movements Under Increasing
Returns to Scales97. Export of Organic Products from India: Prospects and Challenges98. Export Potential of Indian Medicinal Plants and Products99. Select Southern African Countries: A Study of India’s Trade and Investment
Potential100. BIMST-EC Initiative: A Study of India’s Trade and Investment Potential
with Select Asian Countries101. Some Aspects of Productivity Growth and Trade in Indian Industry102. Intra-Industry Trade In India’s Manufacturing Sector103. Export Potential of Indian Plantation Sector: Prospects and Challenges104. Fresh Fruits, Vegetables and Dairy Products: India’s Potential For Exports
to Other Asian Countries105. Biotechnology: Emerging Opportunities for India106. ASEAN Countries: A Study of India’s Trade and Investment Potential107. Essays on Globalisation and Wages in Developing Countries108. Select West African Countries: A Study of India’s Trade and Investment
Potential109. Indian Leather Industry: Perspective and Export Potential110. GCC Countries: A Study of India’s Trade and Export Potential111. Indian Petroleum Products Industry : Opportunities and Challenges112. Floriculture : A Sector Study113. Japanese & U.S. Foreign Direct Investments in Indian Manufacturing :
An Analysis114. Maghreb Region: A Study of India’s Trade and Investment Potential115. Strengthening R & D Capabilities in India116. CIS Region: A Study of India’s Trade and Investment Potential117. Indian Chemical Industry: A Sector Study118. Trade and Environment: A Theoretical and Empirical Analysis119. Indian Pharmaceutical Industry : Surging Globally120. Regional Trade Agreements: Gateway to Global Trade121. Knowledge Process Outsourcing: Emerging Opportunities for India122. Indian Mineral Sector and its Export Potential123. SAARC: An Emerging Trade Bloc
RECENT OCCASIONAL PAPERSOP. No. Title

130
124. Indian Capital Goods Industry - A Sector Study125. Financial Liberalization and Its Distributional Consequences126. ECOWAS: A Study of India’s Trade and Investment Potential127. Indian Textile and Clothing Industry in Global Context: Salient Features
and Issues128. Fair Trade : Fair Way of Enhancing Export Value129. Indian Automotive Industry: At The Crossroads130. CARICOM : A Gateway to the America131. IBSA : Enhancing Economic Cooperation Across Continents132. MSMEs and Globalisation: Analysis of Institutional Support System in
India and In Select Countries133. International Trade, Finance and Money: Essays in Uneven
Development134. Sikkim: Export Potential and Prospects135. Mizoram: Export Potential and Prospects136. Floriculture: A Sector Study137. Biotechnology Industry in India: Opportunities for Growth138. Indian Gems and Jewellery: A Sector Study139. SADC: A Study of India’s Trade and Investment Potential140. Innovation, Imitation and North South Trade: Economic Theory and
Policy141. COMESA (Common Market for Eastern and Southern Africa): A Study of India’s Trade and Investment Potential142. Indian Shipping Industry: A Catalyst for Growth143. New Renewable Energy in India: Harnessing the Potential144. Caribbean Community (CARICOM): A Study of India’s Trade and Investment Potential 145. West African Region: A Study of India’s Trade and Investment Potential 146. India’s Trade and Investment Relations with LDCs (Least Developed Countries): Harnessing Synergies147. Indian Electronic Industry : Perspectives and Strategies 148. Export Potential of Indian Plantation Sector: Prospects and Challenges149 Mercosur : A Study of India’s Trade and Investment Potential150. Openness and Growth of the Indian Economy: An Empirical Analysis151. The Commonwealth: Promoting a Shared Vision on Trade and
Investment152. Southern African Development Community (SADC): A Study of India’s Trade & Investment Potential153. Strategic Development of MSMEs: Comparison of Policy Framework and Institutional Support Systems in India and Select Countries154. Indian Chemical Industry : Exploring Global Demand155. Technological Interventions In Indian Agriculture for Enhancement of Crop Productivity

131
EXIM BANK’S MAJOR PROGRAMMES
Bank’s Major Programmes

132
AHMEDABADSakar II, Floor 1 ,Next to Ellisbridge Shopping Centre,Ellisbridge P. O., Ahmedabad 380 006.Phone : (91 79) 26576852/26576843 Fax : (91 79) 26577696E-mail : [email protected]
BANGALORERamanashree Arcade, Floor 4,18, M. G. Road, Bangalore 560 001.Phone: (91 80) 25585755/25589101-04 Fax: (91 80) 25589107E-mail : [email protected]
CHANDIGARHPHD House, Floor 1, Sector 31-A,Dakshin Marg, Chandigarh 160 031Phone : (91 172) 2641910/12/39/49 Fax : (91 172) 2641915E-mail : [email protected]
CHENNAI UTI House, Floor 1, 29, Rajaji Salai, Chennai 600 001.Phone : (91 44) 25224714/25224749 Fax : (91 44) 25224082E-mail : [email protected]
GUWAHATISanmati Plaza, Floor 4, Near Sentinel Building,G. S. Road, Guwahati 781 005.Phone : (91 361) 2462951/6013053 Fax : (91 361) 2462925E-mail : [email protected]
HYDERABADGolden Edifice, Floor 2, 6-3-639/640, Raj Bhavan Road,Khairatabad Circle, Hyderabad 500 004.Phone : (91 40) 23307816-21 Fax : (91 40) 23317843E-mail : [email protected]
KOLKATAVanijya Bhawan, Floor 4, (International Trade Facilitation Centre), 1/1 Wood Street, Kolkata - 700 016.Phone : (91 33) 22833419/22833420 Fax : (91 33) 22891727E-mail : [email protected]
MUMBAIMaker Chambers IV, Floor 8, 222, Nariman Point, Mumbai 400 021.Phone : (91 22) 22823320 / 92 / 94 Fax : (91 22) 22022132E-mail : [email protected]
NEW DELHIGround Floor, Statesman House, 148, Barakhamba Road, New Delhi 110 001.Phone : (91 11) 23474800Fax : (91 11) 23322758/23321719E-mail : [email protected]
PUNE44, Shankarseth Road, Pune 411 037. Phone : (91 20) 26403000 Fax : (91 20) 26458846E-mail : [email protected]
EXPORT-IMPORT BANK OF INDIAHEAD OFFICE
Centre One Building, Floor 21, World Trade Centre Complex, Cuffe Parade, Mumbai 400 005.Phone : (91 22) 22172600 Fax : (91 22) 22182572 E-mail : [email protected]
Website : www.eximbankindia.in
LONDON BRANCH88/90, Temple Chambers, 3-7, Temple Avenue, London EC4Y OHP, United Kingdom.
Phone : (44) 20 73538830 Fax : (44) 20 73538831 E-mail : [email protected]
IndianOffices OverseasOffices
ADDIS ABABA
Bole Kifle KetemaKebele - 19, (03/05), House No. 015-BAddis Ababa, Ethiopia,Phone : (251 116) 630079Fax : (251 116) 610170E-mail : [email protected]
DAKAR
Floor 1, 7, rue Félix Faure,B.P. 50666, Dakar, Senegal Phone : (221 33) 8232849Fax : (221 33) 8232853E-mail : [email protected]
DUBAI
Level 5, Tenancy 1B,Gate Precinct Building No. 3,Dubai International Financial Centre,PO Box No. 506541, Dubai, UAE.Phone : (971 4) 3637462Fax : (971 4) 3637461E-mail : [email protected]
JOHANNESBURG
Floor 2, Sandton City Twin Towers East,Sandhurst Ext. 3, Sandton 2196,Johannesburg, South Africa.Phone : (27 11) 3265103 / 13 Fax: (27 11) 7844511E-mail : [email protected]
SINGAPORE
20, Collyer Quay,# 10-02, Tung Centre,Singapore 049319.Phone : (65) 65326464Fax : (65) 65352131E-mail : [email protected]
WASHINGTON D.C.
1750 Pennsylvania Avenue NW,Suite 1202, Washington D.C. 20006,United States of America.Phone : (1 202) 223 3238Fax : (1 202) 785 8487E-mail : [email protected]