MARKETS FOR PENNSYLVANIA EXPORTS - Joint State ...
118
EASTERN EUROPEAN ·MARKETS FOR PENNSYLVANIA EXPORTS Report of the Task Force on East European Business Development .General Assembly of the Commonwealth of Pennsylvania JOINT STATE GOVERNMENT COMMISSION January 1995
-
Upload
khangminh22 -
Category
Documents
-
view
4 -
download
0
Transcript of MARKETS FOR PENNSYLVANIA EXPORTS - Joint State ...
EASTERN EUROPEAN ·MARKETS FORPENNSYLVANIA EXPORTS
Report of the Task Force onEast European Business Development
.General Assembly of the Commonwealth of PennsylvaniaJOINT STATE GOVERNMENT COMMISSION
January 1995
The Joint State Government Commission was created by the act of July1, 1937 (P.L.2460, No.459), as amended, as a continuing agency for thedevelopment offacts and recommendations on all phases ofgovernment forthe use of the General Assembly.
-11-

JOINT STATE GOVERNMENTCOMMISSION, 1995
OFFICERS
Roger A. Madigan, Chairman
Ivan Itkin, Treasurer
EXECUTIVE COMMITTEE
Senate Members
Robert C. JubelirerPresident Pro Tempore
F. Joseph LoeperMajority Leader
Robert J. MellowMinority Leader
D. Michael FisherMajority Whip
Leonard J. Bodack.Minority Whip
Noah W. WengerChairman, Majority Caucus
Michael A O'PakeChairman, Minority Caucus
House Members
Matthew J. RyanSpeaker
John M. PerzelMajority Leader
H. William DeWeeseMinority Leader
John E. BarleyMajOrity Whip
Ivan ItkinMinority Whip
Howard L. FargoChairman, Majority Caucus
Mark B. CohenChairman, Minority Caucus
MEMBER EX-OFFICIO
Roger A. Madigan, Commission Chairman
Conrad C. M. Arensberg, Counsel
David L. Hostetter, ~istant Counsel
-iii-

TASK FORCE ONEAST EUROPEAN BUSINESS DEVELOPMENT
SENATE MEMBERS
Michael M. Dawida, Chairman
Gibson E. Armstrong
HOUSE MEMBERS
David K. Levdansky. Vice Chairman
James Gerlach*
Robert W. Godshall
George T. Kenney Jr.
Marie A. Lederer
Thomas A. Michlovic
Herman Mibalich
Katie True
*Now member of Senate.
-v-

• .~.' .
.<
GENERAL ASSEMBLY OF THE COMMONWEALTH OF PENNSYLVANIA
JOINT STATE GOVERNMENT COMMISSIONllOoM 108 - fiNANCE BUILDING
IIAIUlISBUllG 17179
717.787~S97
FAX 717-787·7020
January 1995
TO THE MEMBERS OF THE GENERAL ASSEMBLY:
The Joint Slate Government Commission is pleased to present this reportentitled Eastern European Markets for Pennsylvania Exports which focuseson those East European markets that show the best immediate prospects forexport development.
The report is the result of the work of the Task Force on East EuropeanBusiness Development, chaired by Senator Michael M. Dawida, pursuantto Senate Resolution No. 33 adopted May 5, 1993.
Respectfully submitted,
-VlI-


TABLE OF CONTENTS
VOLUME I
INTRODUCTION . . . . . . . . . • . . . . . . . . . . . . . . . . . . . . . . . . . . . 1
EXECUTIVE SUMMARY 3
RECOMMENDATIONS. . . . . . • . . . . .. . . . . . . . . .. . . . .. . . . . . 7
POTENTIAL TRADING PARTNERS. . . . . . . . . . . . . . . . . . . . . .. 11
U.S. AND PENNSYLVANIA FOREIGN TRADE .....•........ 27
FEDERAL RESPONSE . . • . • . • . . . . . • . . . . • . . . • . . . . . . . . . . .. 63
PENNSYLVANIA'S RESPONSE . . . . . . . . . • . . • . • . . . . • . . • . . .. 71
PARTICIPANTS AT TASK FORCE HEARINGS ...•........... 91
SELECTED BIBLIOGRAPHY . . . . . . . . . . . . . . . . . . . . . . . . . • .. 97
-ix-
VOLUME II
I'Nn.ODucnON . . . .. . . . . . . . . . .. . . . . . .. .. . .. . .. . .. . . . .. . . . . . . . .. 1
APPENDIX A - WHERE TO GET EXPORT ASSISTANCE ..... 3
APPENDIX B - CAPITAL LOAN FUND ..........•......... 53
APPENDIX C - DESCRIPTIONS OF EASTEUROPEAN NATIONS ..............................•. 59
-x-

INTRODUCTION
As a state characterized by mature industries, Pennsylvania must be
ever alert to explore new avenues for furthering economic growth. The
export sector has experienced dramatic expansion in recent years,
especially in those areas of the world that are newly emerging as modern
economies. Among the most promising is Eastern Europe, which in the
late 1980's dramatically shook off the oppressive bonds of Communist
stagnation. With its rich representation ofpeople with cultural ties to this
region, Pennsylvania is admirably positioned to assist the process ofwealth
creation in Eastern Europe. Eastern Europe truly represents a natural
outlet for Pennsy'vania's entrepreneurial energies.
In order to discover the means whereby the Commonwealth could
best assist the citizens of Pennsylvania in opening the East European
market, the General Assembly appointed the Task Force on East European
Business Development to study the issue and make appropriate
recommendations with the assistance of its bicameral research agency, the
Joint State Government Commission. l Senator Michael M. Dawida chaired
1 1993 Senate ResollItion No. 33, Printer's No. 875, adopted May 5, 1993.
-1-

the task force. Under the task force's direction, Commission staff has
assembled its findings and recommendations in the following report.
-2-
EXECUTIVE SUMMARY
The East European Market
The breakup of the Soviet Bloc has led to the opening of a
potentially huge new market for U.S. exports in the nations that formerly
comprised it. However, the region has experienced great difficulties in
making the transition to a market economy. Along with political
instabilities, most of these nations must contend with ·high unemployment
and inflation and declining output. Poland, Czechoslovakia and Hungary
have so far succeeded best in stabilizing their economies.
In order to target its efforts productively, the Commonwealth
should focus on those East European markets that show the best immediate
prospects for expon development. The economic performance and.
apparent direction of the nation's economy are important factors. Other
key considerations include the size ofthe potential mark.et, political stability,
freedom from trade barriers, lessening of state controls, and a stable and
convertible currency.
The Commonwealth ofIndependentStates (CIS) fares poorly under
these criteria at present. However, a promising reform initiative is being
-3-
launched by Ukraine under President Leonid Kuchma. Among the Central
European nations, Poland, Hungary and the Czech Republic again present
the best picture, as. all have. made progress. in privatizing their economies
and strengthening their currencies.
Foreign Trade
As in the domestic economy, service exports have shown greater
growth than exports of goods and merchandise. The export markets in
Central Europe are truly burgeoning. Eastern Europe is the fastest
growing area in the world for U.S. service exports, while merchandise
exports to the region have grown by 24 percent per year since 1987.
Russia is already one of the leading trading partners of the U.S.
The fastest growing markets in Eastern Europe are Poland, Hungary a~d
the Czech Republic, both ~or the entire u.s. and for Pennsylvania.
Pennsylvania lags behind the other major manufacturing states in
level ofexports as a proportion of the economy, although it has closed the
gap somewhat since 1988. One study in~icates that state efforts to promote
exports can generate impressive results. It is therefore imperative that
state government support Pennsylvania businesses in their efforts to expand
overseas commerce.
-4-
Federal Trade Programs
Federal trade assistance programs can significantly assist
Pennsylvania businesses to find their way in .the Eastern European market.
This report describes five such programs that are administered by the U.S.
Department of Commerce.
Pennsylvania Trade Programs
The Pennsylvania Department of Commerce administers several
programs that can assist export growth:
Office ofInternational Trade. This is the central agency for
international trade development.
Capital Loan Fund. Export Assistance Loans are available
from the Fund to help finance the manufacture of products
for export.
Pennsylvania Export Partnership. This trade development
agency oversees the Trade Event Grant Program and the
Regional Export Matching Grant Program, which provide
financial and technical assistance to small and medium sized
firms participating in international trade fairs.
Appalachian Regional Commission. This joint state/federal
program provides a broad range of services to that portion
-5-
of Pennsylvania that is within the Appalachian region,
including export outreach assistance.
Other avenues of export assistance include multb-state trade
promotion groups and local economic development organization~.
The efforts of these governmental organizations can be augmented
through the formation of the Pennsylvania International Partners in
Progress (PIPP). This nonprofit consortium is under development to
provide a range of services to exporting firms through close cooperation
with a similar organization being formed in Eastern Europe.
-6-
RECOMMENDATIONS
The Task Force on East European Business Development
recommends:
1. Warsaw Office
An overseas representative office should be established by the Office
of International Trade in the center of the growing Eastern European
market place. The office should house an information clearinghouse and
marketing and research operations, in order to facilitate the expansion of
commercial contacts between Pennsylvania firms and potential markets in
the Eastern European nations. Since Poland, Hungary and the Czech
Republic appear .to be the most promising markets, and Poland is the
largest of these, Warsaw would. appear to be the ideal location for this
office.
2. Pennsylvania International Partners in Progress (PIPP)
PIPP is planned as an international nonprofit corporation
incorporated in Pennsylvania and open to all Pennsylvania companies
interested in doing business in Eastern Europe. The unique feature ofthis
structure is that a parallel organization of Eastern European business
-7-
entities is also being organized, providing PIPP with a direct link to the
targeted market. It is anticipated that PIPP will become fully operational
in three to five years and will receive substantial assistance from the
Commonwealth. The task force envisions that PIPP could also serve as a
conduit for current federal grants and assistance, such as subsidies, loan
guarantees and administrative support.
3. Amendments to the Capital Loan Fund Act
a) The task force supports proposals by the Depanment of
Commerce to strengthen the act, which can provide an iIiIportant source
of funds for export initiatives. In particular, the task force urges that the
loan limits be reviewed, that the job retention projects should emphasize
the competitiveness of small firms, that manufacturing service firms be
eligible for export assistance loans and that a signed contract not be
required as a prior condition for export assistance loans.
b} Although the Capital Loan Fund Act provides for loans to
processors of farm commodities, no reference is made to export
development. The General Assembly should amend the act to make
investments in export development by processors of value-added farm
commodities eligible for Class IV loans.
-8-

4. Funding of Export Assistance Loan Program
While the Export Assistance Loan Program is established by the
Capital Loan Fund Act, it differs from Class III loans under the same act
in that no line item appropriation is made for the former. Designation of
a source of funding for export assistance loans would help further the
Commonwealth's export development program.
5. Extension and Review of PEP Program
Service firms should be eligible to receive Trade Event Grants
under the Pennsylvania Export Partnership (PEP) program; these grants
are presently limited to manufacturing and processing firms. The program
should also be reviewed to streamline the grant approval process. The PEP
program should be continued beyond its present statutory sunset date of
June 30, 1995.
6. Performance Audit of SBDGs and LDD's
A performance audit should be conducted of the Small Business
Development Centers (SBDC's) and the local development districts (LDD's)
to ensure that they are assisting the export development program and are
not duplicating their efforts in the Appalachian region.
-9-

POTENTIAL TRADING PARTNERS
The late 1980's witnessed changes in the fonner Soviet Bloc that
were revolutionary by any measure. The collapse of the Soviet empire and
the breakup of the Union of Soviet Socialist Republics allowed millions of
people to begin transforming their socio-economic order from a
totalitarian command system to one based on representative government,
individual liberty and free enterprise. Among the many ramifications of
this development is the opening ofa potentially enormous market for u.s.
exports.
In this portion of the report, we will evaluate that market in terms
of its economic c4araeteristics. This section will list the characteristics of a
desirable overseas trading partner and use those criteria to indicate which
of the East European nations presently offers the best immediate prospects
for trade development. Presumably, the Commonwealth's eXport ini.tiative
should focus on those countries as well.
Economic Overview of Eastern Europe
The East European nations, with a few notable exceptions, exhibit
a sorry lack of macroeconomic stability and performance. Since the
-11-
breakup of the Soviet Bloc, there has been considerable economic and
political turmoil in almost every nation of Eastern Europe, resulting in
negative growth in total output and employment.
Table 1 shows estimates ofpopulation, Gross Domestic Product, per
capita Gross Domestic Product, the rate of inflation, the unemployment rate
and the rate of growth in GDP for the nations of Eastern Europe.2 The
statistics on population are the most reliable in the table. Most of the
macroeconomic data on GDP, inflation rates, unemployment rates and
growth rates are derived from official sources. The Central Intelligence
Agency notes that most of the official unemployment rates are quite low,
but that there are large numbers of unofficially unemployed workers
throughout Eastern Europe. Russia's official estimate of 1.4 percent
unemployment is particularly too "official" to be relied upon. All of the
GDP estimates are "purchasing power equivalents," which are unreliable
when the exchange rate falls dramatically, as it has in most of these
countries. The high inflation rates are reflected in a falling foreign
exchange rate and give rise to unreliable estimates ofthe dollar equivalents
21n this report, we refer to the former Soviet Bloc as Eastern Europe. The nationsthat formerly comprised the Soviet Union with the exception ofthe Baltic States (Estonia,Latvia and Lithuania) are referred to as the CIS nations, because they presently comprisethe Commonwealth ofIndependent States. The Baltic States, t1le fonner Soviet satellites,Albania and the nations that formerly comprised Yugoslavia are collectively referred toas Central Europe. Of course, the CIS nations include vast areas of Asia, but since thereport focuses lIlostly on Russia, Ukraine and Belaros, the CIS nations can be consideredpart of Eastern Europe fOr convenience of nomenclature.
-12-

Table I
Estimated Population. Gross Domeslic Product. InJlation Rate, ~-
Unemployment Rate, and Real Income Growth Ratefor Eastern European Nations in 1995
1M l00s 1993 1993 1M 1993Population GDP Per Capita Infialion Unemployment Growth(millions) (billions) GOP Rate Rate Rare
Commonwealth ofIndependent States(former Soviet Union)
Russia 149.3 $775 $5,191 252% 1.4% -12%
Ukraine 51.8 205 3,958 540 Large -16
Uzbel!istm 22.1 54 2,443 216 Large -4
Kazakhstan 17.2 60 3.488 336 Large -13
Belarus 10.4 61 5.865 360 Large -9
Azerl>aijan 7.6 16 2.039 240 Uarge -IS
T2jikistan 5.8 7 1.207 456 Uarge -21
Georgia 5.6 8 I,393 486 20 -S5
Kyrgyzstan 4.6 11 2,391 276 Large -13
MolOOva 4.4 16 S,6S6 360 Uarge -4
T\Dkmenistan 3.9 13 S,3!!!! 540 Large 8
AnneJlia 3.5 7 2.029 168 Large -10
Total, CIS 286 $1,232 $4,306 -119&
central Europe:
Poland 38.5 180 4,675 37 16 4
ROJIWIia 23.2 64 2.759 72 11
Vugoslavia 10.8 10 926 hyper 60 NO
Cuch Republic lQ.4 75 7,212 19 U 0
Hwagary lQ.3 57 5,534 23 13 -1
B1I1garia 8.8 34 ',864 64 16 -4
Slovakia 5.4 '1 5,741 23 14 -5
Croatia 4.7 22 4,681 312 21 -19·
Bcsnia-Herzegovina 4.6 ND NO ND ND ND t·_-Lithuania 3.8 12 '.158 188 2 -10
Albania ,.3 ND NO NO NO ND
-13....
I"j
!i!,--
SOURCE: U.s. BureauofCeDSUS, Intemational Data Base, 1995, and u.s. Central InrelliganceAFDCY,1'br World Fa.etbook. 1994 (Wasbiptan. iD.C.).
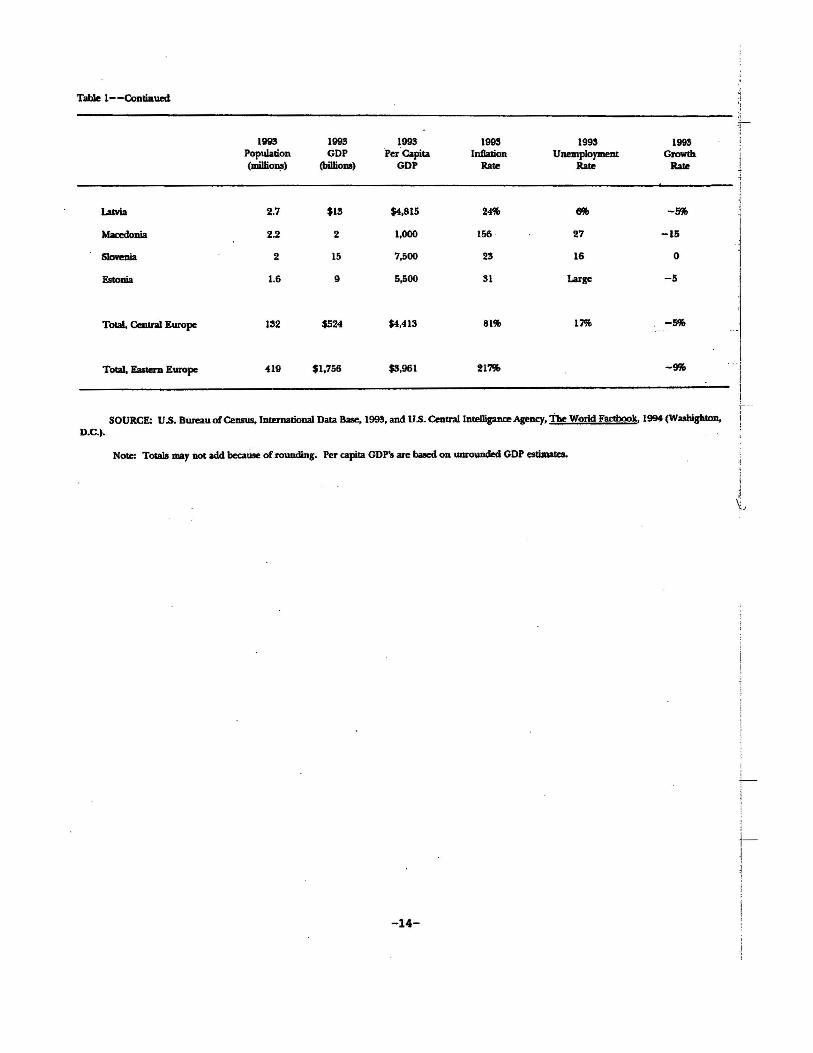
Table 1--Continued
1993 1993 1998 1993 1995 1995Population GOP Per Capita In1laUon Unemployment Growth(milJio~) (biIIioDl) GOP Rate Rate Rate
LaMa 2.7 $Ill $4,815 24'1& 6% -5%
Maa:donia 2.2 2 1,000 156 27 -15
SkweDia 2 15 7.500 25 16 0
Estonia 1.6 9 5,500 51 Large -5
Tolal, Central Europe 1112 $524 $4,413 81% 17% -59&
Total, Eastern Europe 419 $1,756 $5,961 21'1'J> -9'1&
Note: Tocala may not add becaUse ofroundiD(. Per capita GDP's are based on umounded GOP cstiJIIateI.
-14-
of a nation's output. In most countries, the estimates of GOP and· per
capita GOP are likely too low, and the decline in GOP is probably
overstated.
In the fornier Soviet Union, the two largest independent states are
Russia and Ukraine. Russia is apparently the largest and most productive
state in the CIS with a $775 billion GOP. The Ukraine is second with a
$205 billion GOP. Uzbekistan, Kazakhstan and Belarus are the next three
largest in terms of population and GDP. Belarus has a fairly small
population of 10.4 million people and a surprisingly high per capita GDP
of $5,865. The remaining seven states are small, and have low levels of
GDP and generally low per capita GDP's. Stagflation burdens the
Commonwealth nations, in that all are experiencing extremely high
inflation rates, large numbers of unemployed and falling real output and
productivity.
The recent economic malaise ofEastern Europe, ~cularlyof the
CIS nations, is due to dislocations caused by the panial transition froni a
state-controlled to a market economy. Prior to the 1989 breakup oCthe
Soviet Union, most Eastern European trade was controlled by the state and
conducted within the Council for Mutual Economic Assistance (CMEA), the
trade organization for the Soviet Bloc countries. With the disintegration
-15-

of the Soviet Union, the CMEA trading system collapsed.s The elaborate
state allocation of raw materials, intermediate goods and finished goods
ground to a halt..In most cases .the resources previously employed in the
CMFA net.work could not be shifted to new products, new locations or
different employments. This was because the state directed materials
allocation system was not and, in some cases, still has not been replaced by
a price and profit seeking allocation system.
As a result, Eastern European economies were saddled with a large
contingent ofeconomic resources trapped in unproductive and unprofitable
industries. These industries could no longer command a flow of state-
supplied raw materials, energy and intermediate products. Consequently,
the labor force in many of these industries was effectively unemployed,
although some were still paid wages by the state.
The response of almost all of the Eastern European nations has
been to continue the flow offunding to their state industries and the heavy
subsidieS for the production and distribution of many goods and services.
Oil and energy prices, for example, are set a,t a fraction of their world
energy price level to customers within Eastern Europe, while exported oil .
and gas are sold at the world market price. Bread prices are set·below the
sPatricias. Pollard, "Trade Between the United States and Eastern Europe,· FederalReserve Bank of St. Louis, Review, July/August 1994, pp. 25-37.
-16-
cost of wheat used in producing it; rents are set below the cost ofsupplying
housing. All of these activities are funded by the state by means of a large
expansion of the. money supply through new. bank loans and the printing
press. The result is a classic recipe for brewing inflation - - too many
rubles chasing too few goods.
The recent macroeconomic performance of the Central European
nations, with a few notable exceptions, is not much better. In general,
these nations have high rates of inflation, high rates of unemployment and
falling real output of goods and services. The notable exceptions are
.Poland, the Czech Republic and Hungary. These three have moderately
high inflation rates and somewhat less severe unemployment rates, and
their economies have either grown or stabilized their decline. Romania,
Slovakia, Slovenia and Estonia show higher inflation rates, higher
unemployment rates, lower per capita GDP and moderate declines in real
output and productivity. The Romanian economy grew in 1993, but its
inflation rate is debilitating and its per capita GDP is not up to the top
three.
In 1993, the total population of Eastern Europe was about 419
million. The total reported GDP was about $1.8 trillion. In the CIS
nations. population was 286 million and the GDPwas $1.2 trillion, resulting
in a per capita output ofabout $4,300. In Central Europe, the population
-17-
was 132 million and GDP was at least $524 billion, resulting in a per capita
GDP ofabout $4,400. In contrast, Pennsylvania, with a GDP ofabo~t$300
billion and 12. million residents, registered a _per:. capita..GDP... of about
$25,000. Pennsylvania's success is the result of being pan of a sound
national economy. The U.s. has experienced moderately low inflation,
generally low unemployment and moderate annual growth in real output .
almost every year since 1940. Even in our most virulent periods of
stagflation in 1974-75 and 1979-82, the inflation rate rarely exceeded 12
. percent annually and the level of output continued to grow.4
Criteria for Evaluating Trading Partners
In considering whether a foreign nation shows promise as a trading
partner, the level of GOP, the price level, total employment and
unemployment, and the national deficit or surplus are perhaps not as
important as the growth rates of these measures and the general direction
the economy is heading. Ideally, a viable and dependable trading partner
should be moving towards macroeconomic stability as measured by a falling
or stable and reasonably low inflation rate, a falling or stable and
reasonably low unemployment rate, a falling or stable government deficit
which is a reasonable fraction ofthe country's GDP and finally a stable and
4Economic Report of the President 1994. table B-62.
-18-
reasonably low real interest rate. The general level of macroeconomic
activity, as indicated by the level ofGDP and the per capita GDP, is a fairly
good indicator ofthe size of the marketJor Pennsylvaniaexponers.5
Trading partners should exhibit substantial political stability. The
country's political process should 'permit orderly, nonviolent change over
time in both policies and elected officials. A process which reasonably
protects minority political views without unduly thwarting the will of the
majority is desirable. Private property rights must be recognized, protected
and subjected to the rule oflaw.
Artificial barriers to trade and commerce, such as state licenses and
quotas on importing and exporting goods, are detrimental to mutually
beneficial trade and exchange based on comparative advantage. Free and
open trade generates information on costs and opportunities that is
reflected in prices and the demand and supply of goods and services
available to consumers and producers in the trading countries. A desirable
trading partner should be dismantling price controls on producer and
consumer goods. Government subsidies to favored industries and for
particular goods should be substantially reduced or eliminated.
5z. K. Wang &: L Alan Winters, "The Trading Potential ofEastern Europe," Journalof Economic Integration, Autumn, 1992, pp. 113-136.
-19-
State control of investment, output, prices, employment and o~er
aspects of economic activity should be gradually declining, and the
resources and manpower involv.ed in.state control and management should
be reemployed in useful activity elsewhere in the economy. State control
of international trade should be reduced and state sponsored monopolies
dismantled by an extensive privatization of economic activity.
A stable and convertible currency, with a known and primarily
market determined rate ofexchange, is a prerequisite to international trade
activity. All exchange controls on current account transactions should be
abolished and the controls on capital flow gradually reduced with the goal
of minimal regulation. The state should replace such controls with other
policy instruments, such as tariffs and the management of a stable hut
floating exchange rate generally pegged to the value ofa basket of foreign
currencies. Every CIS nation is depreciating its currency by engaging in
inflationary monetary and fiscal policies. In many East European nations,
the current market exchange rates are simply not av~lable. There may be
an official e~change rate and a black or gray market rate which is
substantially lower. The presence of a dual exchange rate, or the lack of
a known exchange rate, indicates that the currency is not convertible into
hard currency; international trading is then likely to resort to barter or to
risk severe currency devaluation.
-20-
As of 1993, East European nations were struggling, with varying
degrees ofdifficulty, to establish a currency suitable for international trade.6
In the Czech Republic.and Slovakia, the koruna is.30 per StU.S. dollar in
1993. The exchange rate has deteriorated over time, as the koruna traded
at 15 per U.S. dollar in 1989. At this time, the koruna is convertible for
almost all current account transactions. The Hungarian forint is almost
completely convertible in virtually all current account transactions. From
1989 to 1993, the forint declined in value from 59 to 94 to the U.S. dollar,
but this devaluation has not been as rapid as the inflation rate. The Polish
zloty;is, completely convertible for all current account transactions, and the
currency appreciated in recent years, but depreciated in 1993.
. .' By and large, the CIS nations do. not comply with the above
criteria. They are experiencing a raging inflation and plummeting
exchange rates. Most have yet to develop a coherent set of economic and
political policies that will permit sustained private growth and development.
Ukraine is struggling to break out of the sluggish command
economy based on central planning and control. Real output of goods and
services is apparently declining over the 1990-19947 period, while inflation
Snani Rodrik, "Foreign Trade in Eastern Europe's Transition: Early Results," NationalBureau of Economic Research, Working Paper No. 4064, (Cambridge, Mass., 1992), pp.1-57; The World Factbook.
. 'Craig R. Whitney, "East Europe's Hard Path to New Day," New York Times.September 30, 1994, pp. A9-All.
-21-
is rampant. The currency is not convertible, and there is no recent
information on its exchange rate value.
In October 1994, Ukrainian President Leonid Kuchma.unveiled a
comprehensive economic reform package that includes private ownership
of property and land~ reform of the financial system and an accelerated
program of privatization ofstate-owned industries.8 Private ownership of
land remains a contentious issue for the Communist-dominated
parliament. Ifthese reforms are adopted, however, the Ukrainian economy
will be firmly on the road to integration with the world economies, and the
future status of Ukraine as a valued .trading partner of Pennsylvania
businesses will brighten considerably.
The desirable characteristics of reasonable economic and political
stability are present in some degree in several Central European nations
such as Poland, Hungary and the Czech Republic. In addition, these three
nations have established and maintained a record of steady growth in
imports from United States over the past three years.
Since 1992} Poland, Hungary and the Czech Republic have
achieved a substantial degree of openness to foreign trade with Western
Europe and the United States. In all three countries, trade is now de-
SwUltraine President Proposes Reforms to Save Economy,· Wall Street Journal, OcL12, 1994, p. A-12.
-22-

monopolized and privatization of the foreign trade sector is proceeding
apace.9
In Poland, ~bout 60 percent o[ all impons are.. undertaken by
private entities and the fraction of exports in private enterprise is close to
25 percent. The number of private companies has grown· from 2000 in
1990 to well over 20,000 in 1993. It is estimated that Poland's imports
from the U.S., which were $900 million in 1993, will grow to $7 billion by
the year 2000.10 In other words, Poland's imports from the U.S. will grow
by. a,billion dollars per year in each of the next six years.
. ~... . In the Czech Republic, there has been a concerted effort to convert
its state-owned and -controlled economy to private enterprise. Those
measures resulted in a huge increase of private entrepreneurs involved in
commerce. There are over 225,000 such entrepreneurs as of 1993, and an
estimated 40 perc.ent of economic activity is privately owned and operated.
It is also estimated that 90 percent ofall domestic prices are set by market
forces in 1993.
Hungary is undergoing a difficult and painful transition to free
enterprise. As of 1993, approximately 50 percent of all economic activity
9See Rodrik. "Foreign Trade" for a discussion of the foreign ttade policies and thetrends in privatization of foreign and internal trade in Poland, Hungary and the CzechRepublic. .
IOU.S. Department of Commerce, Business America, 1994, p. 28.
-23-
was in the hands of private enterprise and, by all accounts, this percentage
will continue to rise. However, Hungary still suffers from a large external
debt and a continuing trade deficit along-with an internal budget deficiL
Nevertheless, the trend is decidedly toward Western-style economic
reform.
The demographic, political and economic characteristics of the ""
remaining Central European nations ate less desirable for export growth.
The Baltic nations of Lithuania, Latvia and Estonia are very small, and
their economies are still contracting due to the strain of privatization and
the breakdown of old trading patterns established by the Soviet Union.
Latvia and Estonia, however, are making some progress in stabilizing their
economies and implementing market reforms with only moderately high
inflation rates. Lithuania is privatizing and reforming its economy, but its
inflation rate is extremely high. All three countries wish to establish
trading contacts with Western economies. Other Central European
countries, such as Romania, Bulgaria, Slovakia and Slovenia, exhibit less
macroeconomic stability. These countries have, in general, been slower in
adopting market reforms, in privatizing enterprise, in freeing prices and
outputs to respond to market forces and in dismantling the state-owned
and- controlled economic system. These countries have not been as eager
as some others to integrate their economic activities and orient them
toward Western markets.
-24-
u.s. AND PENNSYLVANIA FOREIGN TRADE
This section of the report will use quantitative economic data to
analyze the following issues. with particular emphasis on Eastern Europe:
• Growth of exports as compared to other sectors of the U.S.
economy.
• Leading and fastest growing foreign markets for U.s. and
Pennsylvania exports.
• Leading and fastest growing East European markets for U.S. and
Pennsylvania exports.
• Goods for which Pennsylvania exports have grown fastest.
• Pennsylvania's performance as an exporter compared with that
of other states.
• Whether a state government initiative can help significandy to
increase Pennsylvania exports to Eastern Europe.
Growth of the Expon Sector
Foreign trade in 'merchandise exports and the provision ofservices
to foreign nationals has, in recent history. been the fastest growing
component of the United State's Gross Domestic Product (GDP). The
-25-

double digit annual growth rates in u.s. exports ofgoods and services that
began in 1986 and lasted through 1989 were, in part, the result of a rapid
and substantial fall in the foreign exchange value of the U.S. dollar.vis-a
vis all major foreign currencies. In part, the growth in demand for U.s.
exports was due to the relatively high levels of economic growth enjoyed
by our major international trading partners.
The falling prices of U.S. exports touched offan export boom that
began in 1986 and lasted until 1991. Since 1991, the foreign exchange
- value of the dollar has remained fairly constant (except for the falling value
of the dollar in terms of ~e yen and the mark), and our major trading
partners in Western Europe, Canada and Japan have remained mired in
a slump. As a result, the exportboom ofthe late 1980's has slowed in 1992
and 1993.
Table 2 shows the U.s. Gross Domestic Product~ merchandise
_exports, service exports and total exports to all foreign countries and
Eastern Europe over the 1980-1993 period. GDP grew in nominal tenns
by 135 percent over the 13-year period, a higher growth rate than that of
merchandise exports. In contrast, service exports almost quadrupled in this
same period. Merchandise exports to Eastern Europe lagged substantially
due to their large drop in the 1980-86 period, which may be attributed to
chilly international relations, the rise in value of the dollar and the decline
-26-
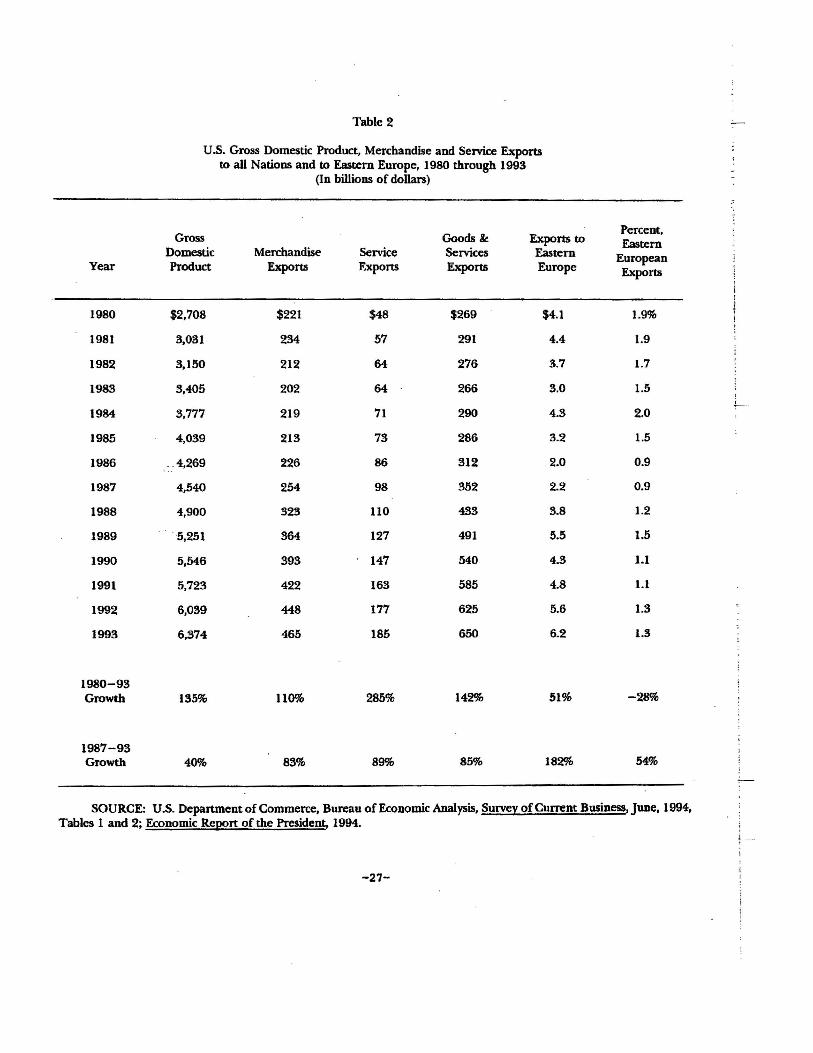
Table 2 -
U.S. Gross Domestic Product, Merchandise and Service Exportsto all Nations and to Eastern Europe, 1980 through 1993
(In billions of dollars)
Gross Goods Ie ExpOrts toPercent,Eastern
Domestic Merchandise Service Servkes Eastern EuropeanYear Product Exports Exports Exports Europe Exports
1980 $2,708 $221 $48 $269 $4.1 1.9%
1981 3,031 234 57 291 4.4 1.9
1982 3,150 212 64 276 3.7 1.7
1983 3,405 202 64 266 3.0 1.5.!--.-_.
1984 3,777 219 71 290 4.3 2.0
1985 4,039 213 73 286 3.2 1.5
1986 ,.4,269 226 86 312 2.0 0.9
1987 4,540 254 98 352 2.2 0.9
1988 4,900 323 no 433 3.8 1.2
1989 '5,251 364 127 491 5.5 1.5
1990 5,546 393 147 540 4.3 1.1
1991 5,723 422 163 585 4.8 1.1
1992 6,039 448 177 625 5.6 1.3
1993 6,374 465 185 650 6.2 1.3
1980-93Growth 135% 110% 285% 142% 51% -28%
1987-93Growth 40% 88% 89% 85% 182% 54%
SOURCE: U.S. Department of Commerce, Bureau of Economic Analysis, Survey ofCurrent Business, June, 1994,Tables 1 and 2; Economic Report of the PresideD!:. 1994.
i .-,
-27-
in the Soviet and the Warsaw Pact economies. Eastern Europe's share of
U.S. merchandise exports dropped from almost 2 percent in 1980 to less
than 1 percent in 1986-:87. In 1986 and.l987, while demand soared in the
rest of the world for U~S. merchandise exports, the Eastern European
demand for U.S. exports was flat.
In the 1987-93 period, exports grew faster than the GDP as a
whole, reversing the relationship that prevailed in 1980-86. The growth
rates of merchandise exports, service exports, total exports and
merchandise exports to Eastern Europe were more than double the growth
in GDP, and the growth rate of exports to Eastern Europe was four times.
as large as the growth in GDP. The share of Eastern European
merchandise exports rose from 0.9 percent to 1.3 percent. If the Eastern
European share were to regain the 1980 level ofalmost 2 percent, the level
of exports would rise by 50 percent and the dollar value of U.S. exports to
Eastern Europe would rise by $3.1 billion.
During the 1986-1991 period, the export sector of the GDP was
the fastest growing sector of the economy and a significant creator of new
jobs and income. Table 3 shows the compounded annual growth rates in
GDP, merchandise and service exports, exports to Eastern Europe and the
share ofGDP represented by exports ofgoods and services for the 1980-93
period. The growth in GDP has actually exceeded the growth in
-28-

Table 3
Rates or Growth in Gross Domestic Product, Merchandise and ServiceExports and the Ratio of Exports to GDP
1980 through 1993
Percent Percent GoodsPercent Change, Change, Percent· Exports to All ExportsChange, Goods Services Change, All Eastern Share of
YeaT GDP Exports Exports Exports Europe GDP
1980 9.9%
1981 12% 6% 19% 8% 7% 9.6
1982 4 -9 12 -5 -16 8.8
1983 8 -5 0 -4 -19 7.8
1984 11 8 11 9 43 7.7
1985 7 -3 3 -1 -26 7.1
1986 6 6 18 9 -38 7.3
1987 6 12 14 13 10 7.8
1988 8 27 12 23 73 8.8
1989 7 13 15 13 45 9.4
1990 6 8 16 10 -22 9.7
1991 3 7 11 8 12 10.2
1992 6 6 9 7 17 10.3
1993 6 4 5 4 11 10.2
1980-93AverageGrowth 6.8% 6.2% 11.1% 7.3% 7.5% 9.6%
1987-93AverageGrowth 6.9% 12.9% 13.6% 13.1% 24.1% 11.1%
SOURCE: U.S. Department of Commerce, Surveyor Current Business, June, 1994; EconooU.c Report of thePresident, 1994.
-29-
merchandise exports. However, the growth ofservice exports averaged an
11.1 percent compound ratc, a major factor in keeping the growth rate of
all exports at 7.3 percent. The growth in service exports .has been the
prime impetus for raising the total export share ofGDP to 10.2 percent in
the 1990's, because the merchandise and goods share ofexports actually fell
from 8.2 to 7.3 percent of GDP over the 13-year period. One obvious
exception to the general trend in goods exports is the goods export' picture
in Eastern Europe. The average compound growth rate in merchandise
exports to Eastern Europe is an astounding 24 percent for this same period.
This growth rate cannot be sustained in the long run, but it may remain
at a high level for several more years.
In 1993, U.S. imports .ofgoods exceeded exports of goods by $132
billion. This figure is typically referred to as the "trade deficit." However,
the sale of services by U.s. businesses to foreign nationals exceeded the
purchases of foreign services by U.S. nationals by $57 billion. The 1993
goods and services balance of trade deficit was thus reduced,to $75 billion.
Nevertheless, this deficit was significantly larger than the 1992 goods and
services deficit of $40 billion. Since the United States is in an economic
recovery, U.S. imports of goods increased by $53 billion from their 1992
level, while our less robust trading partners increased their purchases of
U.S. goods by only $17 billion. The resulting $36 billion increase in the
-30-

U.S. trade deficit is directly traceable to our increased goods deficit.
Since 1976, the United States has consistently incurred a negative
balance of payments in goods and services. Generally, the goods account
has been negative and the services account has had a positive balance. In
1993, the sale of services to foreigners was almost 30 percent of total
foreign exports, and service exports have been growing at a much faster
rate than goods exports. It appears that the United States has a
comparative advantage in the production and distribution of services, and
a comparative disadvantage in goods production. Consequently, any state
export promotion program should emphasize encouraging service exports.
It should be noted that the fastest growing area in the world .for U.S.
service exports is Eastern Europe.
The production and distribution ofservices as opposed to goods has
been the leading edge of growth in the United States since the 1960's; we
now see this trend evolving to the rest of our trading partners abroad.
Moreover, the annual growth rate for service exports is almost double the
growth in GDP over the 1987-93 period.
Exports to Particular Countries
Table 4A shows the U.S. merchandise exports by country for the
1988-93 period. The first pan of the table shows countries that imponed
goods worth $2 billion or more in 1993. The top trading partners are
-31-

Table 4A
U. S. Merchandise Exports to Countries with ExportsWorth More Than Two Billion in 1993
(Ranked by 1998 values, in millions of dollars)
1988-93 1990-93Annual Annual
Country 1988 1990 1993 Growth Growth
Canada $60,918 $82,966 $100,190 13% 7%
Japan 37,732 48,585 47,949 5 -0
Mexico 20.643 28,375 41,635 20 16
United Kingdom 18,404 23,484 26,376 9 4
Germany 14,331 18,690 18,957 6 °Taiwan 12,131 11,482 16,249 7 14
Korea 11,289 14,399 14,776 6 1
France 10,085 13,652 13,267 6 -1
Netherlands 10,094 13,016 12,839 5 -0
Singapore 5,770 8,019 11,676 20 15
Hong Kong 5,691 6,840 9,873 15 15
Belgium 7,281 10,314 8,876 4 -5
China 5,039 4,807 8,767 15 27
Australia 6,981 8,535 8,272 4 -1
Switzerland 4,206 4,944 6,804 12 13
Sandi Arabia 3,799 4,035 6,666 15 22
Italy 6,782 7,987 6,458 -1 -6
Malaysia 2,875 3,425 6,064 22 26
Brazil 4,289 5,062 6,045 8 6
Venezuela 4,611 3,107 4,599 :"0 16 .
Israel 3,247 8,200 4,420 7 13
Spain 4,217 5,208 4,181 -0 -7
Argentina 1,056 1,179 3,772 51 73
Thailand 1,964 2,991 3,768 18 9
Pbillippines 1,880 2,472 3,529 18 14
Turkey 1,848 2,253 8,483 17 17
Colombia 1,7!S8 2,038 3,229 17 19
-32-
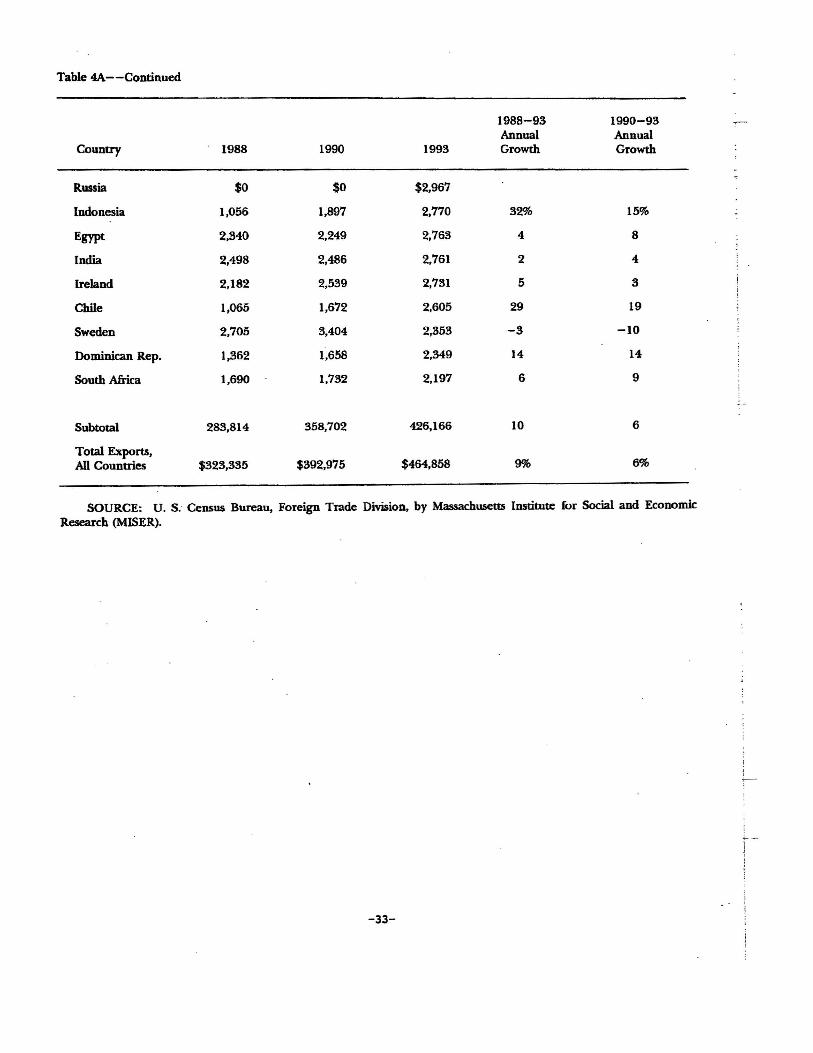
Table 4A--Continued
1988-93 1990-93Annual Annual
Country 1988 1990 1993 Growth Growth
Russia $0 $0 $2,967
Indonesia 1,056 1,897 2,770 32% 15%
Egypt 2,840 2,249 2,763 4 8
India 2,498 2,486 2,761 2 4
Ireland 2,182 2,539 2,731 5 3
Chile 1,065 1,672 2,605 29 19
Sweden 2,705 3,404 2,353 -3 -10
Dominican Rep. 1,362 1,658 2,349 14 14
South Africa 1,690 1,732 2,197 6 9
Subtotal 283,814 358,702 426,166 10 6
Total Exports,All Countries $323,335 $392,975 $464,858 9% 6%
SOURCE: u. S. Census Bureau, Foreign Trade Division, by Massachusetts Institute for Social and EconomicResearch (MISER).
-33-

Canada, which takes almost 22 percent ofall merchandise exports, followed
by Japan and Mexico. Exports to the top ten trading partners eq~al $304
billion, almost two-thirds of all goods exported from the U.S. A number
of other South American nations have experienced high annual growth
rates in imports from the U.S. since 1988, such as Argentina, Colombia and
Chile. [n addition, several high growth nations from the Pacific Rim have
exceptionally high growth rates of imports from the U.S.: Singapore,
Malaysia and Indonesia. Russia is the one Eastern European importer on
this list.
Table 4B shows the countries who have annual imports of U.S.
goods of between $250 million and $2 billion. There is tremendous
diversity in the growth rates among these countries. Again, the Latin
American trading partners have very high annual growth rates. Three
Central European countries also have very high growth rates: Poland,
Hungary and the Czech Republic. (The data for the Czech Republic is
included with the data for Czechoslovakia. The data on Table 5 show a
high rate of growth of US. importS for Czechoslovakia for the 1988-93
period.)
The countries shown on Table 4A and 4B account for $458 billion
or 98 percent of all U.S. exports produced and sold in 1993.
-34-
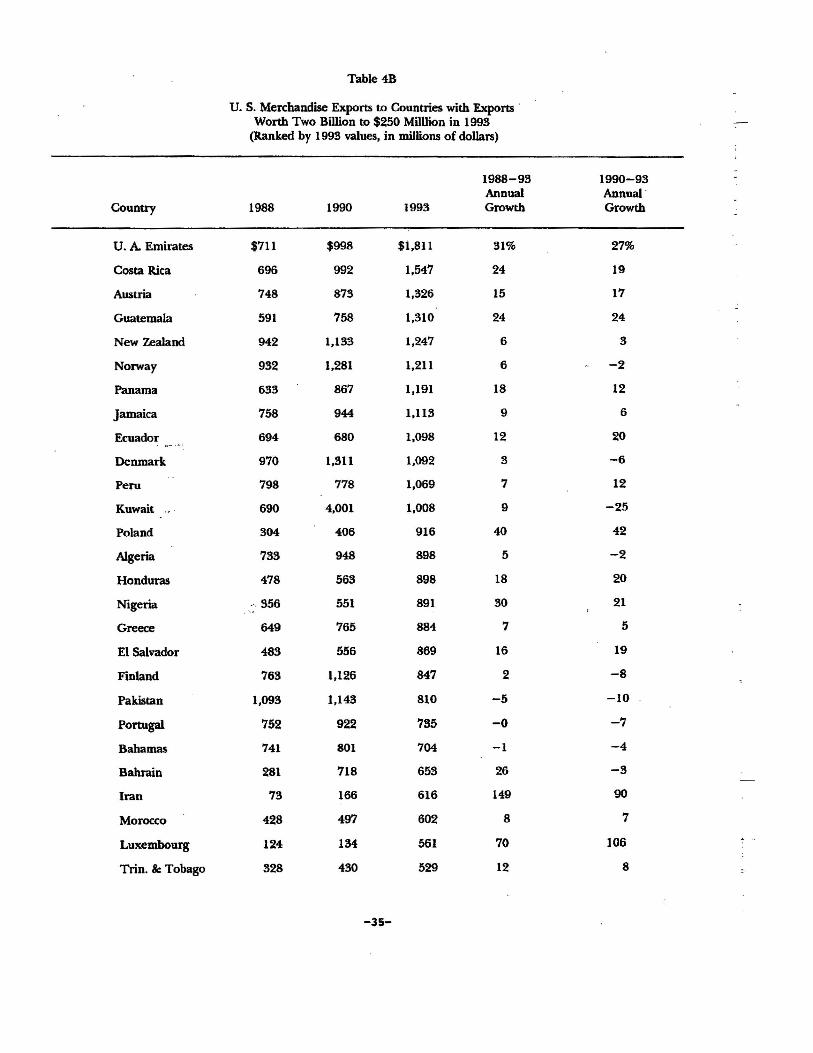
Table 4B
u. S. Merchandise Exports to Countries with Exports .Worth Two Billion to $250 MilUion in 1993
(Ranked by 1993 values, in unmons of dollars)
1988-93 1990-93Annual Annual·
Country 1988 1990 1993 Growth Growth
U. A Emirates $711 $998 $i,811 31% 27%
Costa Rica 696 992 1,547 24 19
Austria 748 873 1,326 15 17
Guatemala 591 758 1,310 24 24
New Zealand 942 1,133 1,247 6 3
Norway 932 1,281 1,211 6 -2
Panama 633 867 1,191 18 12
Jamaica 758 944 1,113 9 6
Ecuador 694 680 1,098 12 20
Denmark 970 1,311 1,092 3 -6
Peru 798 778 1,069 7 12
Kuwait 690 4,001 1,008 9 -25
Poland 304 406 916 40 42
Algeria 733 948 898 5 -2
Honduras 478 563 898 18 20
Nigeria -.356 551 891 30 21,'"
Greece 649 765 884 7 5
EI Salvador 483 556 869 16 19
Finland 763 1,126 847 2 -8
Pakistan 1,093 1,143 810 -5 -10
Portugal 752 922 735 -0 -7
Bahamas 741 801 704 -1 -4
Bahrain 281 718 653 26 -3
Iran 73 166 616 149 90
Morocco 428 497 602 8 7
Luxembourg 124 134 561 70 106
Trin. &: Tobago 328 430 529 12 8
-35-
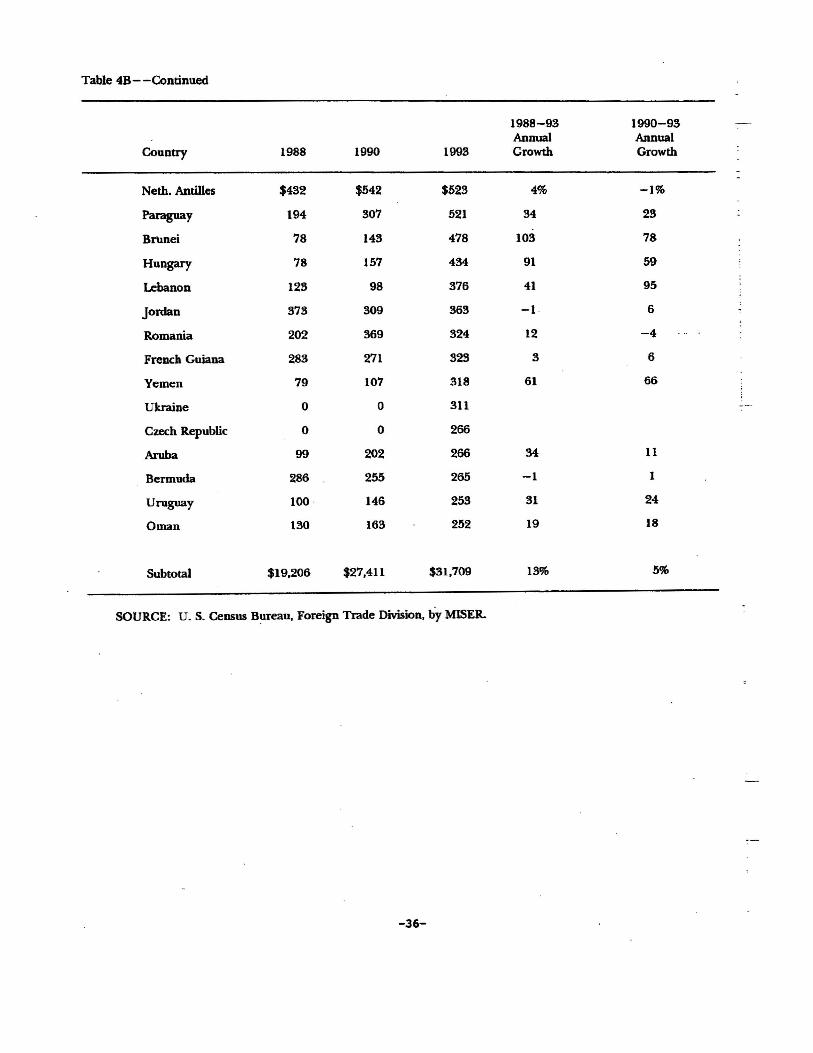
Table 4B- -Continued
1988-93 1990-93Annual Annual
Country 1988 1990 1993 Growth Growth
Neth. Antilles $432 $542 $523 4% -1%
Paraguay 194 307 521 34 23
Brunei 78 143 478 103 78
Hungary 78 157 434 91 59
Lebanon 123 98 376 41 95
Jordan 373 309 363 -1 6
Romania 202 369 324 12 -4
French Guiana 283 271 323 3 6
Yemen 79 107 318 61 66
Ukraine 0 0 311
Czech Republic 0 0 266
Aruba 99 202 266 34 11
Bermuda 286 255 265 -1 1
Uruguay 100 146 253 31 24
Oman 130 163 252 19 18
Subtotal $19,206 $27,411 $31,709 13% 5%
SOURCE: U. S. Census Bureau, Foreign Trade Division, by MISER.
-36-

Exports to Eastern Europe
Table 5 shows U.S. merchandise exports to Eastern Europe by
country for the 1988-93 period. Total merchandise exports grew by 11
percent annually; however, the growth rates are difficult to evaluate for
many of these countries because of dislocations caused by the breakup of
the Soviet Union in 1991 and the continuing war in the former Yugoslavia.
The export growth to the former Soviet Union is a modest 7 percent
annually. The countries showing the most robust growth are Poland,
Hungary and Czechoslovakia. Slovakia and Albania show promise, but are
very small importers of U.S. merchandise. Romania is a somewhat larger
importer of U.S. goods, and its growth. rate is a respectable 12 percent
annually.
Table 6 shows the United States exports of private services by
country and area for the 1988-93 period. The data on service exports is
not as complete as merchandise export data. Nevertheless, it is clear that
the export of services is the. fastest growing component of the U.S.
international trade activity. The average annual growth rate in service
exports is 17 percent over the 1988-93 period, and most of the countries
and areas have attained double digit growth rates over that period. The
Eastern European area is dearly the fastest growing importer of U.S.
siJpplied services, with an average annual growth rate of57 percent. Total
-37-
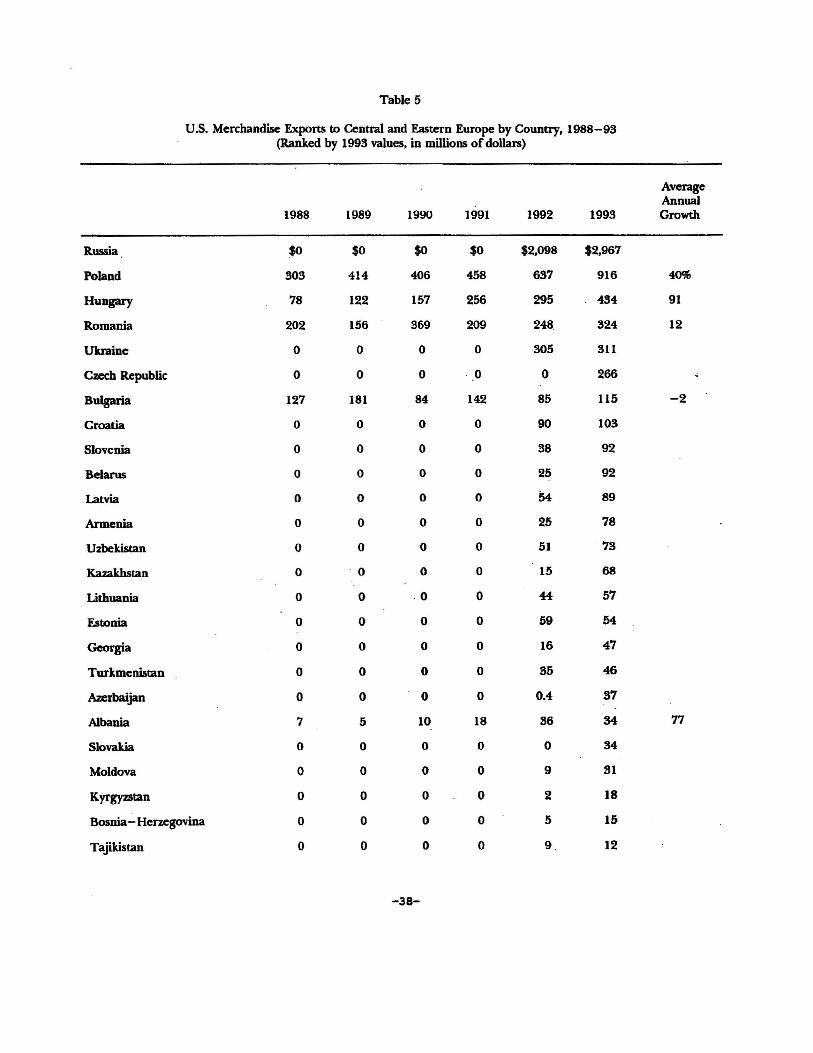
Table 5
U.S. Merchandise Exports to Central and Eastern Europe by Country, 1988-98(Ranked by 1993 values, in millions ofdollalS)
AverageAnnual
1988 1989 1990 1991 1992 1993 Growth
Russia $0 $0 $0 $0 $2,098 $2,967
Poland 303 414 406 458 637 916 40%
Hungary 78 122 157 256 295 434 . 91
Romania 202 156 369 209 248. 324 12
Ukraine 0 0 0 0 305 311
Czech Republic 0 0 0 ·0 0 266
Bulgaria 127 181 84 142 85 115 -2
Croatia 0 0 0 0 90 103
Slovenia 0 0 0 0 38 92
Belarus 0 0 0 0 25 92
Latvia 0 0 0 0 54 89
Armenia 0 0 0 0 25 78
Uzbekistan 0 0 0 0 51 73
Kazakhstan 0 ·0 0 0 15 68
lithuania 0 0 .0 0 44 57
Estonia 0 0 0 0 59 54
Georgia 0 0 0 0 16 47
Turkmenistan 0 0 0 0 35 46
Azerbaijan 0 0 0 0 0.4 37
Albania 7 5 10 18 36 M 77
Slovakia 0 0 0 0 0 M
Moldova 0 0 0 0 9 31
Kyrgyzstan 0 0 0 0 2 18
Bosnia- Herzegovina 0 0 0 0 5 15
Tajikistan 0 0 0 0 9 12
-38-
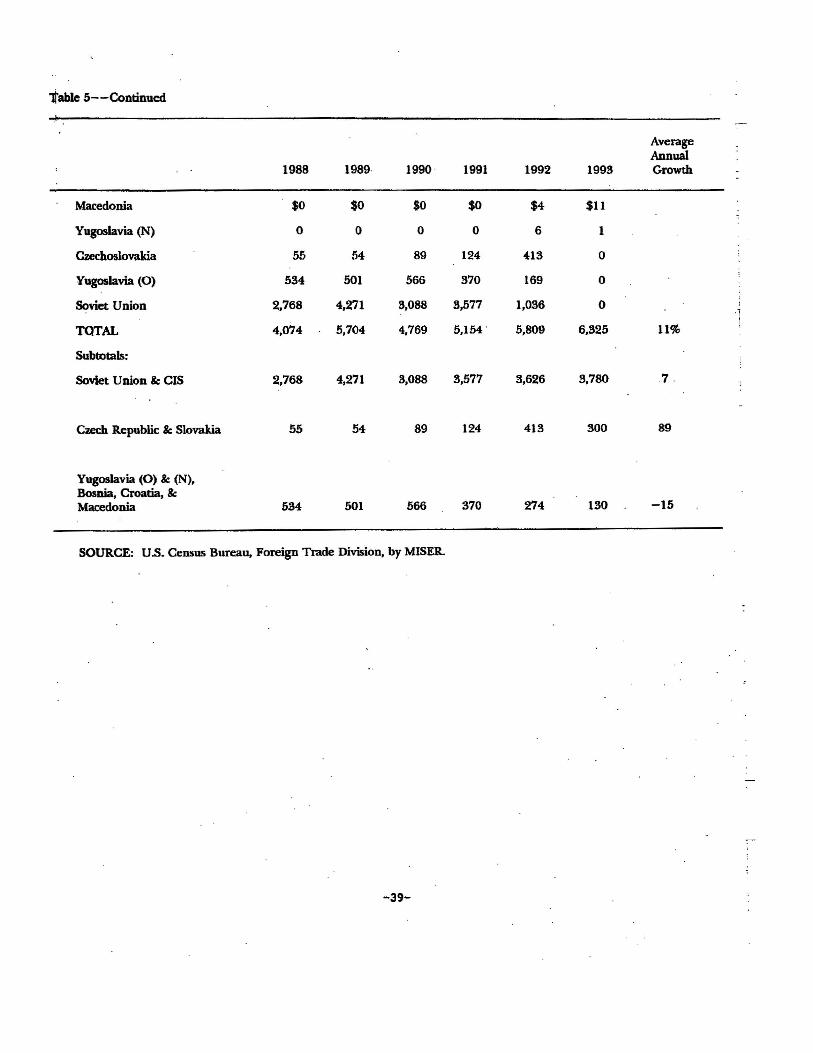
table 5--Continued
AverageAnnual
1988 1989· 1990 1991 1992 1993 Growth
Macedonia $0 $0 $0 $0 $4 $11
Yugoslavia (N) 0 0 0 0 6 1
Czechoslovakia 55 54 89 124 413 0
Yugoslavia (0) 534 501 566 370 169 0
Soviet Union 2,768 4,271 3,088 3,577 1,036 0 ;
01
TOTAL 4,074 5,704 4,769 5,154 . 5,809 6,325 11%
Subtotals:
Soviet Union Be CIS 2,768 4,271 3,088 3,577 3,626 3,780 7.
Czech Republic Be Slovdkia 55 54 89 124 413 300 89
Yugoslavia (0) &: (N),Bosnia, Croatia, BeMacedonia 534 501 370 274 130 -15
SOURCE: U.S. Census Bureau. Foreign Trade Division, by MISER.
-39-

-40-
service exports to Eastern Europe account for one percent of all service
exports in 1993. This is smaller than the 1.3 percent of merchandise
exports, but the high growth rate, even if moderated to half the current
level, ensures that Eastern Europe will consume a growing share of U.S.
service exports over the next five to ten years.
Exports from Pennsylvania
Table 7 shows the merchandise exports shipped from Pennsylvania
for the years 1991-93.11 Since Pennsylvania is a large and highly
diversified economy, the state's exports closely mirror those of the u.s.
economy.12 Well over two-thirds of the value of Pennsylvania's exports
were manufactured items in the first six categories: Industrial machinery
and computer equipment; electronic goods and electrical equipment;
chemicals and allied products; transportation equipment; primary metals;
and instruments and related products. While transportation equipment and
primary metals hold significant shares, they are clearly declining over the
past three years. Other industries which exhibit significandy declining
shares ofa growing export market are fabricated metal products; paper and
11InTables 7-9, we use OriginofMovements ofCommodities (OMC) data for statecomparisons of exports because it is the only data available on a timely basis and is .reasonably accurate for comparing rates of growth. PenDSylvania's true ~ue addedcontribution to the nation's exports may be larger than is recorded by the MISER data,but as long as the data are recorded consistently over time, the rate of growth in exportactivity should be fairly accurate. .
12Because the classification schemes differ between U.s. and Pennsylvania data. directcomparison between the categories is not always possible.
-41-
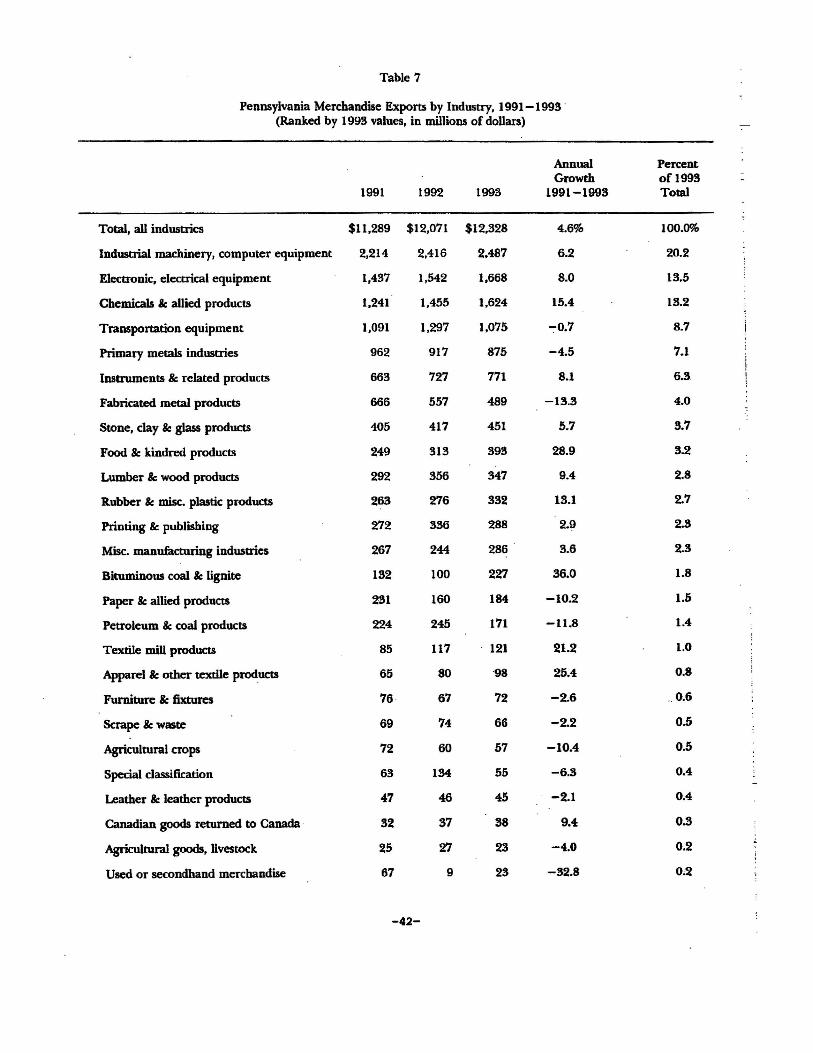
Table 7
Pennsylvania Merchandise Exports by Industry, 1991-1993 .(Ranked by 1993 values, in millions of dollars)
Annual PercentGrowth of 1993
1991 1992 1993 1991-1998 Total
Total, all industries $11,289 $12,071 $12,328 4.6% 100.0%
Industrial machinery, computer equipment 2,214 2,416 2.487 6.2 20.2
Electronic, electrical equipment 1,437 1,542 1,668 8.0 13.5
Chemicals Be allied products 1,241 1.4M 1.624 15.4 13.2
Transportation equipment 1,091 1,297 1.075 -:,0.7 8.7
Primary metals industries 962 917 875 -4.5 7.1
Instruments" related products 663 727 771 8.1 6.3
Fabricated metal products 666 557 489 -13.3 4.0
Stone, day Be glass products 405 417 451 5.7 3.7
Food Be kindred products 249 313 393 28.9 3.2
Lumber Be wood products 292 356 347 9.4 2.8
Rubber Be misc. plastic products 263 276 332 13.1 2.7
Printing Be publishing 272 336 288 2.9 2.3
Misc. manufacturing industries 267 244 286 3.6 2.3
Bituminous coal Ie lignite 182 100 227 36.0 1.8
Paper Be allied products 231 160 184 -10.2 1.5
Petroleum Ie coal products 224 245 171 -11.8 1.4
Textile mill products 85 117 121 21.2 1.0
Apparel Be other textile products 65 80 ·98 25.4 0.8
Furniture Ie fixtures 76 67 72 -2.6 .0.6
Scrape " waste 69 74 66 -2.2 0.5
Agricultural crops 72 60 57 -10.4 0.5
Special classification 63 134 55 -6.3 0.4
Leather Be leather products 47 46 45 -2.1 0.4
Canadian goods returned to Canada . 32 37 88 9.4 0.3
Agricultural goods, livestock 25 27 23 -4.0 0.2
Used or secondhand merchandise 67 9 23 -32.8 0,2
-42-

Table 7--Continued
Annual Percent -Growth ofl993
1991 1992 1993 1991-1993 Total
Oil Be gas extraction $12 $18 $21 37.5% 0.2%
Non-metallic minerals 12 10 20 33.3 0.2
Fishing, hunting Be trapping 14 15 7 -25.0 0.1
F01"e5try 5 11 6 10.0 0.0
Metal mining 39 7 6 -42.3 0.0
Tobacco manufactures 1 0.9 0.6 -20.0 0.0
SOURCE: MASSPORT trade development unit, adjustments to data from U.S. Census Bureau, Foreign TradeDivision, by MISER.
-43-
allied products; petroleum and coal ·products; agricultural crops; used
merchandise; fishing, hunting and trapping; metal mining; and tobacco
products. The most rapidly growing export industries in Pennsylvania are
chemicals and allied products; food and kindred products; rubber and
miscellaneous plastics; soft coal; textile mill products; apparel; oil and gas
extraction; and non - metallic minerals.
Tables 8 and 9 show Pennsylvania merchandise exports to foreign
nations. 13 Pennsylvania's major trading partners as shown in Table 8A are
almost identical with the major lrading partners ofthe United States shown
in Table 4A; even the rankings are highly correlated.- Table 4B and Table
8B include virtually the same countries, but the rank order is not highly
correlated. For Pennsylvania, the fastest growing major export markets as
shown on Table 8~ over the past three years have- been Singapore,
Thailand, Malaysia, Argentina, Turkey, Algeria, Ireland, Colombia and
Russia. (It is improbable that these extremely high growth rates can
continue for any extended period of time. Perhaps _the high growth
countries are importing capital g90ds from Pennsylvania, and these types
of purchases will be large and concentrated in time.) Ofthe smaller export
markets listed on Table 8B, the fastest growing in Eastern Europe are
13These tables can be compared with Tables 4and 5, which show parallel data for allU. S. exports. BeCause of the aforementioned limitations on availability of export databroken-down by states, the data only ron from 1990.
-44-
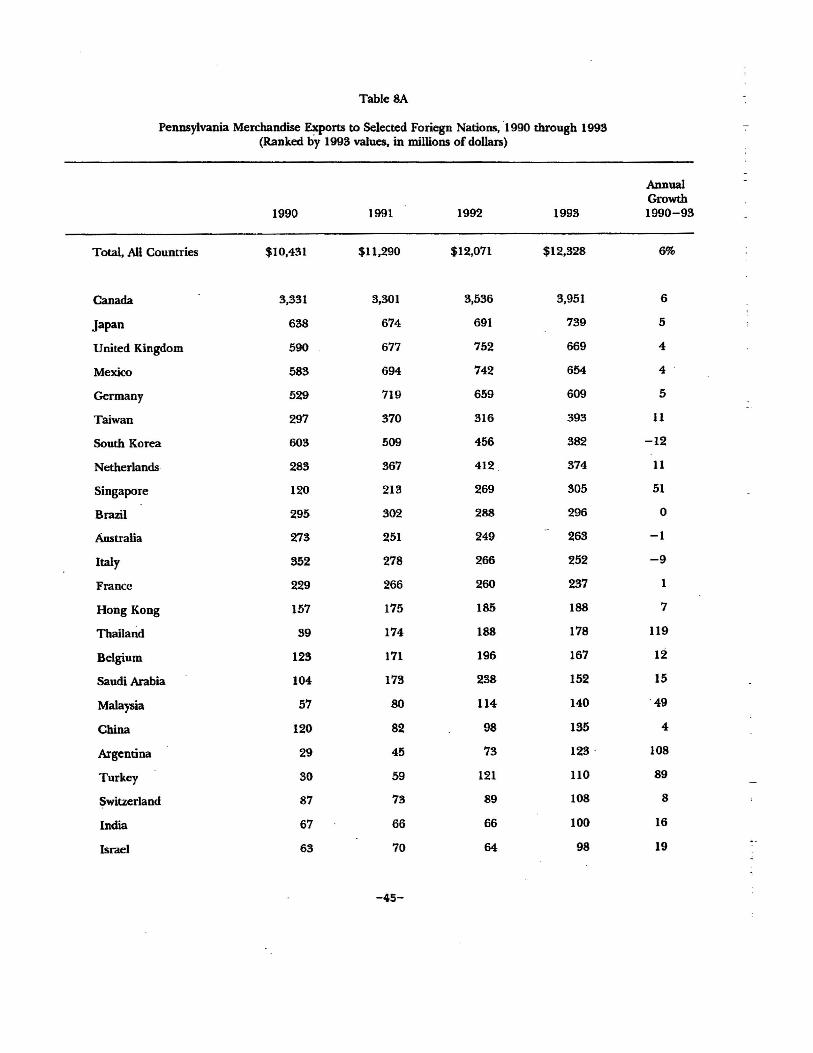
Table 8A
Pennsylvania Merchandise Exports to Selected Foriegn Nations, ·1990 through 1993 -(Ranked by 1993 values. in millions of dollars)
AnnualGrowth
1990 1991 1992 1993 1990-93
Total, All Countries $10,431 $11,290 $12,071 $12,328 6%
Canada 3,331 3,301 3,536 3,951 6
Japan 638 674 691 739 5
United Kingdom 590 677 752 669 4
Mexico 583 694 742 654 4
Germany 529 719 659 609 5
Taiwan 297 370 316 393 11
South Korea 603 509 456 382 -12
Netherlands· 283 367 412 374 11
Singapore 120 213 269 305 51
Brazil 295 302 288 296 0
Australia 273 251 249 263 -1
Italy 352 278 266 252 -9
France 229 266 260 237 1
Hong Kong 157 175 185 188 7
Thailand 39 174 188 178 119
Belgium 123 171 196 167 12
Saudi Arabia 104 173 238 152 15
Malaysia 57 80 114 140 ·49
China 120 82 98 135 4
Argentina 29 45 73 123 108
Turkey 30 59 121 110 89
Switzerland 87 73 89 108 8
India 67 66 66 100 16
Israel 63 70 64 98 19
-45-
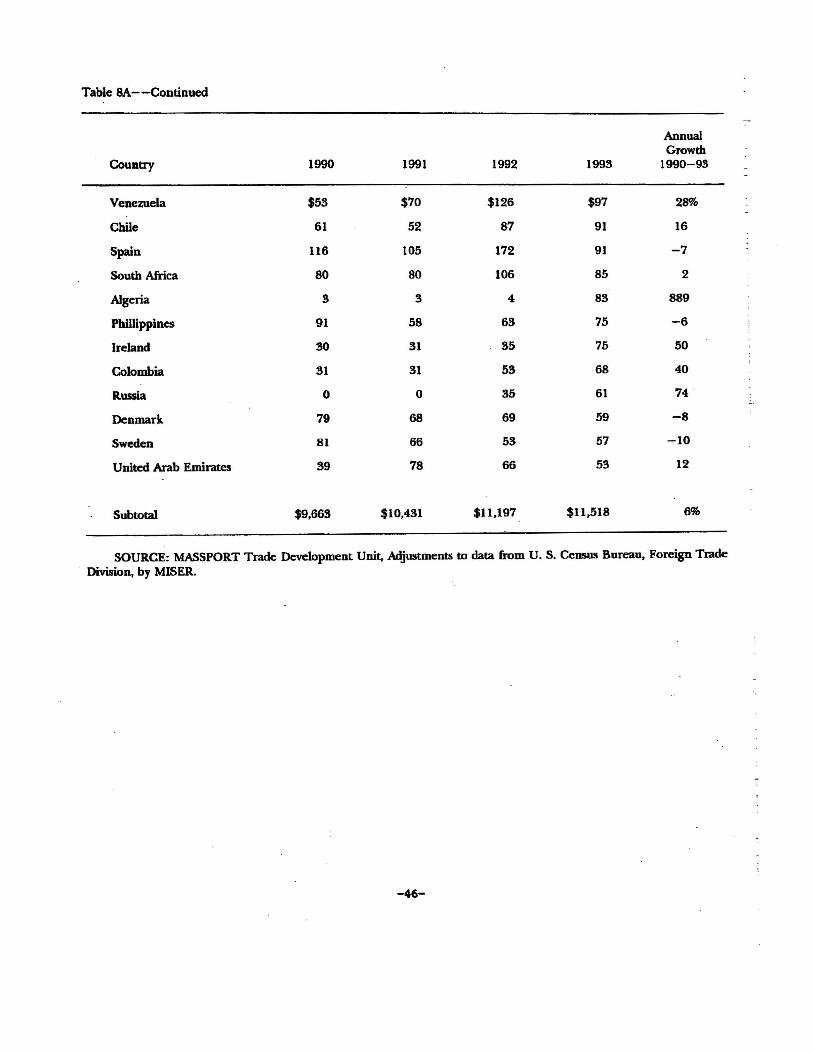
Table 8A--Continued
-AnnualGrowth
Country 1990 1991 1992 1993 1990-93
Venezuela $53 $70 $126 $97 28%
Chile 61 52 87 91 16
Spain 116 105 172 91 -7
South Africa 80 80 106 85 2
Algeria 3 3 4 83 889
Phillippines 91 58 63 75 -6
Ireland 30 31 35 75 50
Colombia 31 31 53 68 40
Russia 0 0 35 61 74 ---
Denmark 79 68 69 59 -8
Sweden 81 66 53 57 -10
United Arab Emirates 39 78 66 53 12
Subtotal $9,663 $10,431 $11,197 $11,518 6%
SOURCE: MASSPORT Trade Development Unit, Adjustments to data from U. S. Census Bureau, Foreign Trade- Division, by MISER.
-46-
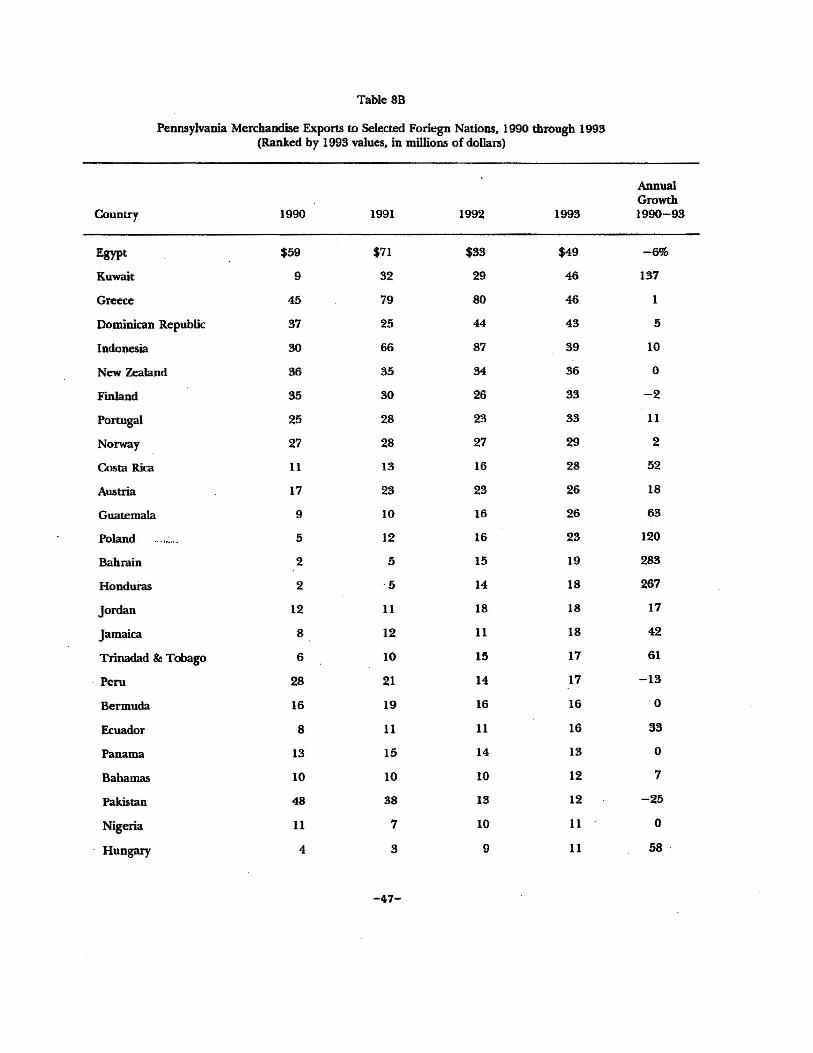
Table 8B
Peomylvania Merchandise Exports to Selected Foriegn Nations, 1990 through 1993(Ranked by 1993 values, in millions of dollars)
AnnualGrowth
Country 1990 1991 1992 1993 1990-93
Egypt $59 $71 $33 $49 -6%
Kuwait 9 32 29 46 137
Greece 45 79 80 46 1
Dominican Republic 37 25 44 43 5
Indonesia 30 66 87 39 10
New Zealand 36 35 34 36 0
Finland 35 30 26 33 -2
Portugal 25 28 23 33 11
Norway 27 28 27 29 2
Costa Rica 11 13 16 28 52
Austria 17 23 23 26 18
Guatemala 9 10 16 26 63
Poland 5 12 16 23 120
Bahrain 2 .5 15 19 283
Honduras 2 .5 14 18 267
Jordan 12 11 18 18 17
Jamaica 8 12 11 18 42
Trinadad Be Tobago 6 10 15 17 61
. Peru 28 21 14 17 -13
Bermuda 16 19 16 16 0
Ecuador 8 11 11 16 33
Panama 13 15 14 13 0
Bahamas 10 10 10 12 7
Pakistan 48 38 13 12 -25
Nigeria 11 7 10 11 0
Hungary 4 3 9 11 58
-47-
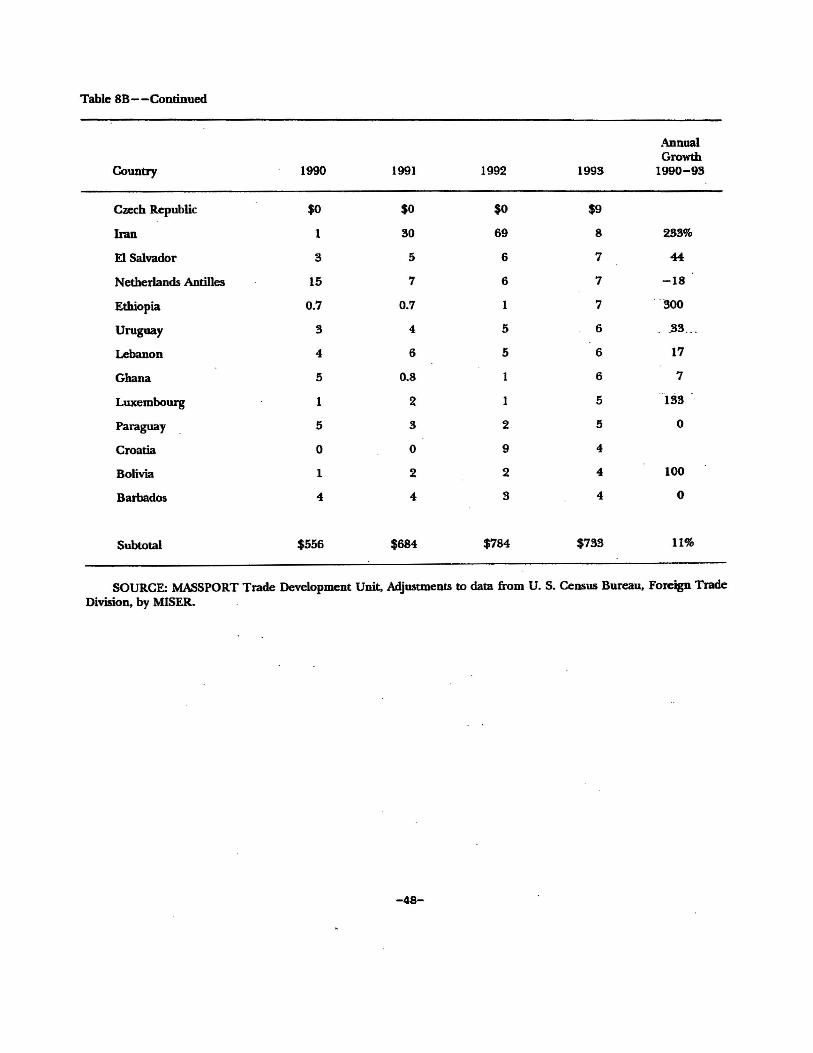
Table 8B--Continued
AnnualGrowth
Country 1990 1991 1992 1993 1990-93
Czech Republic $0 $0 $0 $9
Iran 1 30 69 8 233%
El Salvador 3 5 6 7 44
Netherlands Antilles 15 7 6 7 -18
Ethiopia 0.7 0.7 1 7 ·300
Uruguay 3 4 5 6 .33 .. _
Lebanon 4 6 5 6 17
Ghana 5 0.8 6 7
Luxembourg 1 2 1 5 IS8
Paraguay 5 3 2 5 0
Croatia 0 0 9 4
Bolivia 1 2 2 4 100
Barbados 4 4 3 4 0
Subtotal $556 $684 $784 $783 11%
SOURCE: MASSPORT Trade Development Unit, Adjustments to data from U. S. Census Bureau, Foreign TradeDivision, by MISER.
-48-

Poland and Hungary. These are small importers ofPennsylvania products,
but if their growth rates persist for any extended period of time, they will
move up the rankings rapidly.
Table 9 shows the Pennsylvania merchandise exports to Eastern
Europe by country for the 1990-93 period. The countries are broken into
two groups, the CIS nations and the Central European nations. For all
practical purposes there are only two CIS nations with any Pennsylvania
exports: Russia and Ukraine. Russia with 92 percent of the exports is
clearly a major trading partner.
. All of the Central European countries are minor trading partners
as of 1993. But the growth rates of some countries are impressive, if
sustained over another 5- to 10-year period. Three countries stand out
..as potential major trading partners: Poland, Hungary and the Czech
Republic. These three countries account for almost 80 percent of
Pennsylvania exports to Central Europe in 1993. All three exhibit high
growth rates in their demand for Pennsylvania exports. Exports to the two
nations that formerly comprised Czechoslovakia have tripled in three years.
However, in 1993,"the total exports to Eastern Europe were 1 percent of
Pennsylvania's total exports~ a smaller share than the 1.3 percent of U.S.
exports to Eastern European countries.
-49-
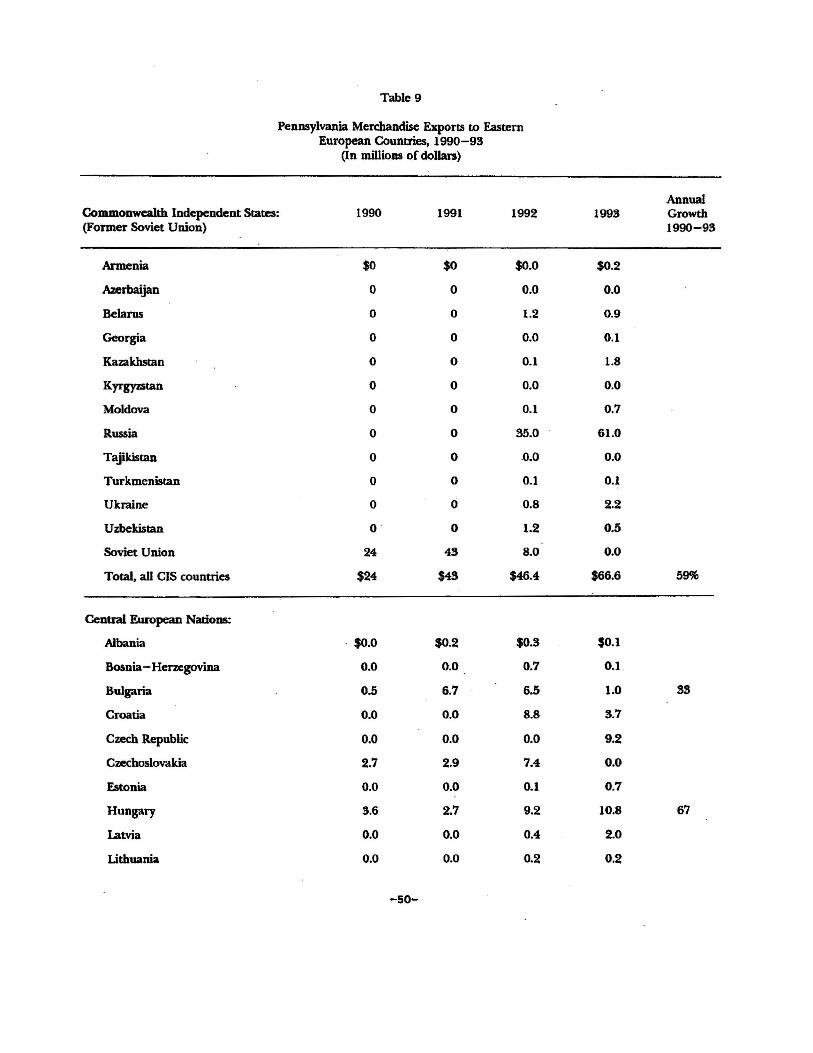
Table 9
Pennsylvania Merchandise Exports to EasternEuropean Countries, 1990-93
(In millions of dollars)
AnnualCommonwealth Independent States: 1990 1991 1992 199! Growth(Former Soviet Union) 1990-93
Armenia $0 $0 $0.0 $0.2
Azerbaijan 0 a 0.0 0.0
Belarus 0 0 1.2 0.9
Georgia 0 a 0.0 0.1
Kazakhstan 0 0 0.1 1.8
Kyrgyzstan 0 a 0.0 0.0
Moldova 0 0 0.1 0.7
Russia 0 0 35.0 61.0
TajikistaD 0 a .0.0 0.0
Turkmenistan 0 0 0.1 0.1
Ukraine a 0 0.8 2.2
Uzbekistan a a 1.2 0.5
Soviet Union 24 43 8.0 0.0
Total. all CIS countries $24 $43 $46.4 $66.6 59%
Centtal European Nalioos:
Albania . $0.0 $0.2 $0.3 $0.1
Bosnia- Herzegovina 0.0 0.0 0.7 0.1
Bulgaria 0.5 6.7 6.5 1.0
Croatia 0.0 0.0 8.8 3.7
Czech Republic 0.0 0.0 0.0 9.2
Czechoslovakia 2.7 2.9 7.4 0.0
Estonia 0.0 0.0 0.1 0.7
Hungary 3.6 2.7 9.2 10.8 67
Latvia 0.0 0.0 0.4 2.0
Lithuania 0.0 0.0 0.2 0.2
-50-
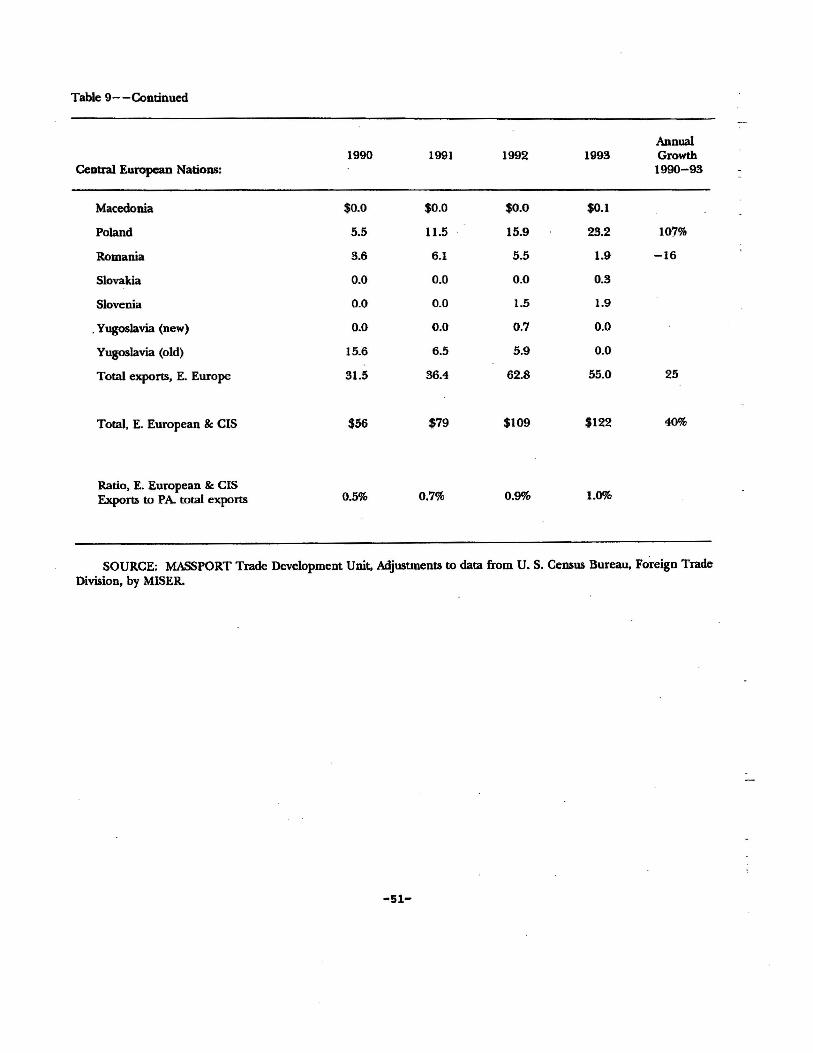
Table 9--Continued
Annual1990 1991 1992 1993 Growth
Central European Nations: 1990-93
Macedonia $0.0 $0.0 $0.0 $0.1
Poland 5.5 11.5 15.9 23.2 107%
Romania 3.6 6.1 5.5 1.9 -16
Slovakia 0.0 0.0 0.0 0.3
Slovenia 0.0 0.0 1.5 1.9
.Yugoslavia (new) 0.0 0.0 0.7 0.0
Yugoslavia (old) 15.6 6.5 5.9 0.0
Total exports, E. Europe 31.5 36.4 62.8 55.0 25
Total. E. European & CIS $56 $79 $109 $122 40%
Ratio, E. European & CISExports to PA total exports 0.5% 0.7% 0.9% 1.0%
SOURCE: MASSPORT Trade Development Unit, Adjustments to data from U. S. Census Bureau, Foreign TradeDivision, by MISER.
-51-
Exports by Individual States
Table 10 shows the direct manufacturing exports by state for 1986
and the merchandise exports by state for 1993.14 Table 10 also shows the
annual growth rate in exports over the 1976-86 and 1988-93 periods, and
the ratio of reported state exports to state personal incomes in 1986 and
1993. This last measure is an approximation of the relative importance of
international trade to the state's economic activity.
The rate of growth in exports over the two time periods is very
diverse. The average annual growth for all states was 9.1 percent in the .
1976-86 period, with a range from 51.4 percent for Nevada to 0.8 percent
for Illinois. Among the top fifteen exporting states (California to Georgia)
the average growth rate was 7.8 percent. However,· this average was
reduced by the disappointing performance of Pennsylvania, .Illinois and
New Jersey. These three states, along with Iowa, ranked in the bottom
four in growth in manufactured exports over the 1976-86 period. Most
of the states with very high growth rates were small exporters whose low
base levels ofexports help account for their high growth rates.
l+rhe 1986 export data are based on estimares from the Expprtll from ManufacturingEstablishments (EME) survey data. The 1993 state export data are from the estimates ofthe OMC generated by MISER. In 1986, the EME survey data allocated $158 billion inexports to the respective states; since the total value of exponed commodities was $226billion (see Table 2). $68 billion in export values were not allocated to the respectivestate! because of the limitations of EME data.
-52-
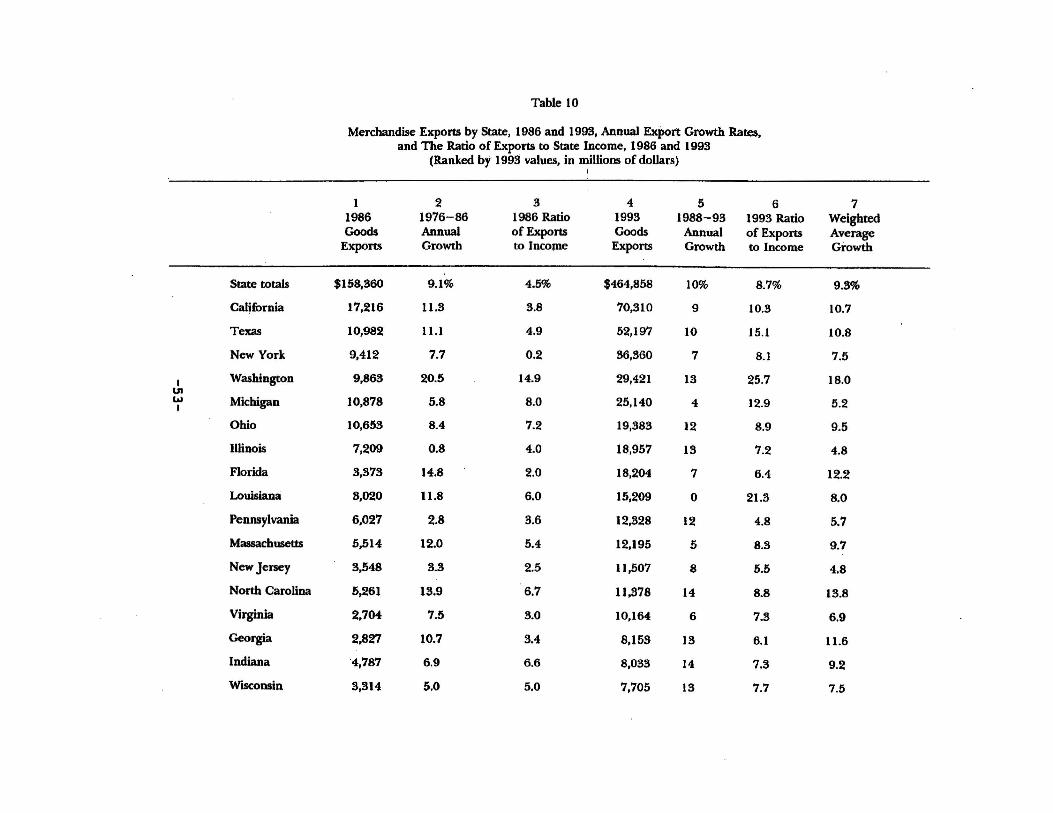
Table 10
Merchandise Exports by State, 1986 and 1998, Annual Export Growth Rates.and The Ratio of Exports to State Income, 1986 and 1993
(Ranked by 1993 values. in millions of doUars)I
1 2 3 4 5 6 71986 1976-86 1986 Ratio 1993 1988-93 1993 Ratio WeightedGoods Annual of Exports Goods Annual of Exports Average
Exports Growth to InCOme Exports Growth to Income Growth
State totals $158.360 9.1% 4.5% $464,858 10% 8.7% 9.3%
California 17,216 U.3 3.8 70,310 9 10.3 10.7
Texas 10,982 11.1 4.9 52,197 10 15.1 10.8
New York 9,412 7.7 0.2 36,360 7 8.1 7.5
I Washington 9,863 20.5 14.9 29,421 13 25.7 18.0Ulw Michigan 10,878 5.8 8.0 25,140 4 12.9 5.2I
Ohio 10,653 8.4 7.2 19,383 12 8.9 9.5
Illinois 7,209 0.8 4.0 18,957 13 7.2 4.8
Florida 3,373 14.8 2.0 18,204 7 6.4 12.2
Louisiana 3,020 U.8 6.0 15,209 0 21.3 8.0
Pennsylvania 6.027 2.8 3.6 12,328 12 4.8 5.7
Massachusetts 5,514 12.0 5.4 12.195 5 8.3 9.7
New Jersey 3.548 3.3 2.5 11,507 8 5.5 4.8
North Carolina 5,261 13.9 6.7 11,378 14 8.8 13.8
Virginia 2,704 7.5 3.0 10,164 6 7.3 6.9
Georgia 2,827 10.7 3.4 8,153 13 6.1 11.6
Indiana ·4,787 6.9 6.6 8,033 14 7.3 9.2
Wisconsin 3,314 5.0 5.0 7,705 13 7.7 7.5
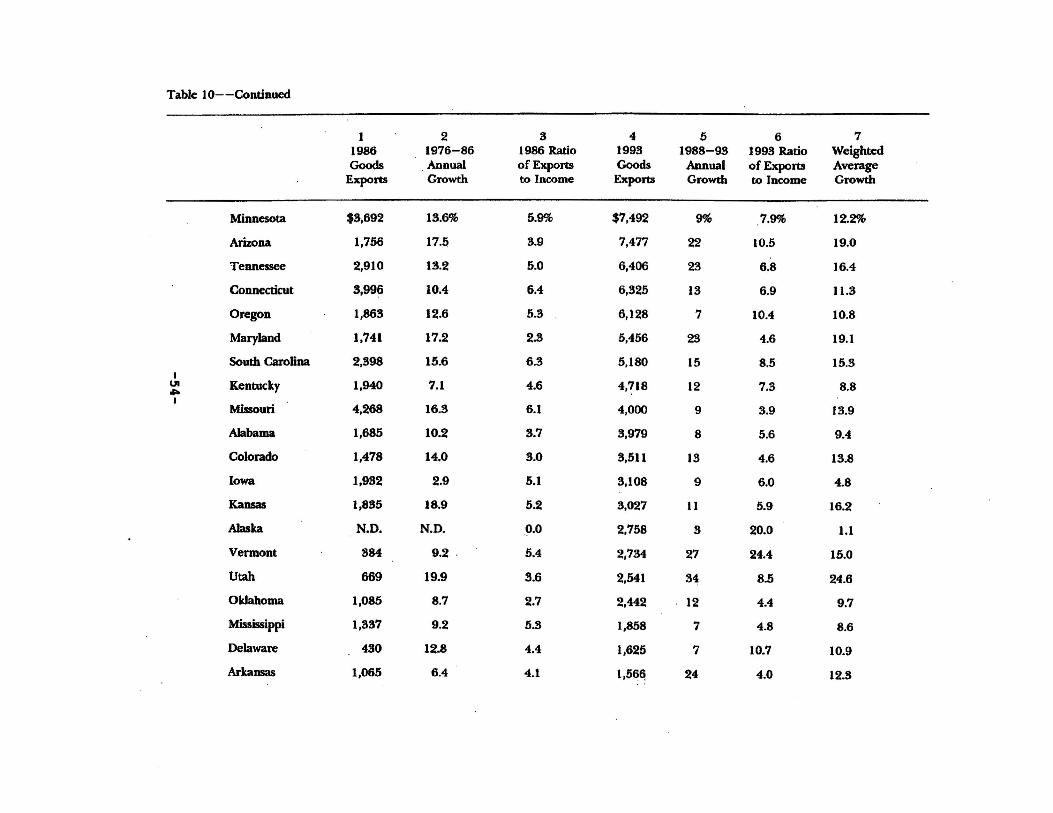
Table 10--Continued
1 2 3 4 5 6 71986 1976-86 1986 Ratio 1993 1988-93 1993 Ratio WeightedGoods Annual of Exports Goods Annual ofExpom Average
Exports Growth to Income Exports Growth to Income Growth
Minnesota $3,692 18.6% 5.9% $7,492 9% 7.9% 12.2%
Arizona 1,756 17.5, 3.9 7,477 22 10.5 19.0
Tennessee 2,910 18.2 5.0 6,406 23 6.8 16.4
Connecticut 8,996 10.4 6.4 6,325 13 6.9 11.3
Oregon 1,863 12.6 5.3 6,128 7 lOA 10.8
Maryland 1,741 17.2 2.8 5,456 23 4.6 19.1
South Caronna 2,398 15.6 6.3 5,180 15 8.5 15.3I
UI Kentucky 1,940 7.1 4.6 4,718 12 7.3 8.8...I
Missouri 4,268 16.3 6.1 4,000 9 3.9 13.9
Alabama 1,685 10.2 8.7 3,979 8 5.6 9.4
Colorado 1,478 14.0 3.0 3,511 13 4.6 13.8
Iowa 1,932 2.9 5.1 3,108 9 6.0 4.8
Kansas 1,835 18.9 5.2 3,027 II 5.9 16.2
Alaska N.D. N.D. ,0.0 2,758 3 20.0 1.1
Vermont 884 9.2 ' 5.4 2,734 27 24.4 15.0
Utah 669 19.9 3.6 2,541 34 8.5 24.6
Oldahoma 1,085 8.7 2.7 2,442 12 4.4 9.7
Mississippi 1,837 9.2 5.3 1,858 7 4.8 8.6
Delaware 430 12.8 4.4 1,625 7 10.7 10.9
Arkansas 1,065 6.4 4.1 1,56~ 24 4.0 12.3
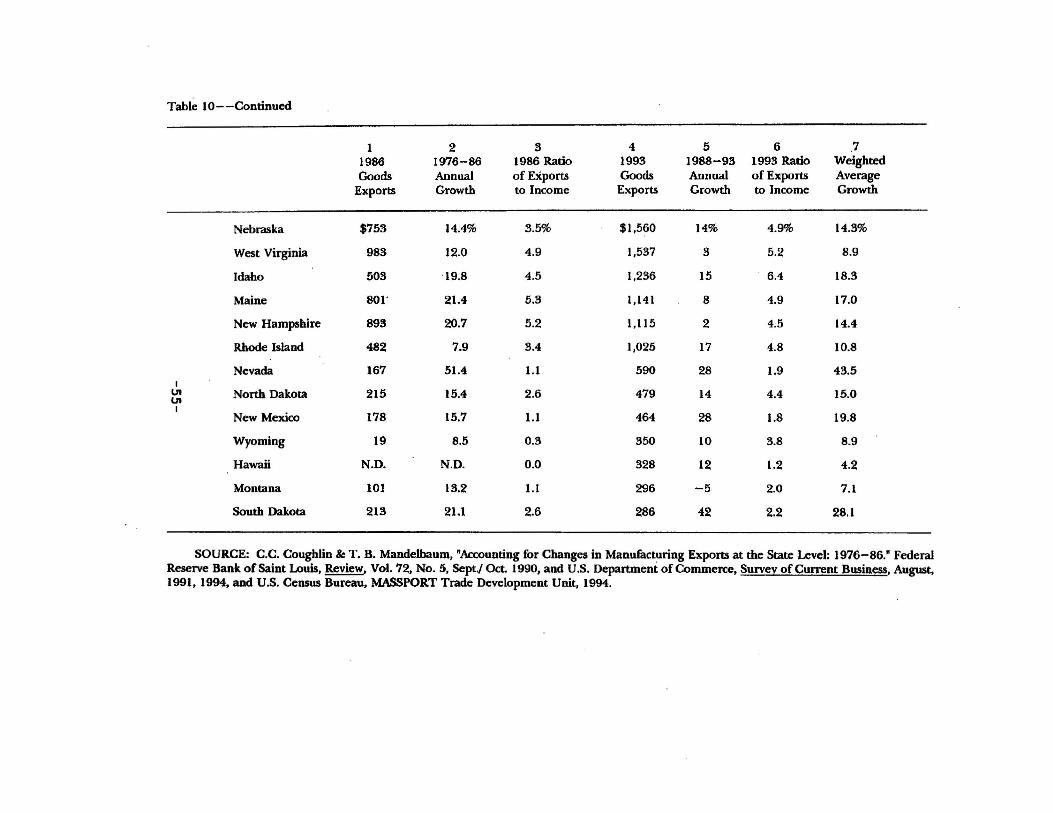
Table 10- -Continued
1 2 3 4 5 6 71986 1976-86 1986 Ratio 1993 1988-93 1993 Ratio WeightedGoods Annual ofEXporrs Goods Annual of Exports Average
Exports Growth to Income Exports Growth to Income Growth
Nebraska $753 14.4% 3.5% $1,560 14% 4.9% 14.3%
West Virginia 983 12.0 4.9 1,537 3 5.2 8.9
Idaho 503 '19.8 4.5 1,236 15 6.4 18.3
Maine 801' 21.4 5.3 1,141 8 4.9 17.0
New Hampshire 893 20.7 5.2 1,115 2 4.5 14.4
Rhode Island 482 7.9 3.4 1,025 17 4.8 10.8
Nevada 167 51.4 1.1 590 28 1.9 43.5I
U'l North Dakota 215 15.4 2.6 479 14 4.4 15.0U'l
I178 464 28 19.8New Mexico 15.7 1.1 1.8
Wyoming 19 8.5 0.3 350 10 3.8 8.9
Hawaii N.D. N.D. 0.0 328 12 1.2 4.2
Montana 101 13.2 1.1 296 -5 2.0 7.1
South Dakota 213 21.1 2.6 286 42 2.2 28.1
SOURCE: C.C. Coughlin &: T. B. Mandelbaum, "Accounting for Changes in Manufacturing Exports at the State Level: 1976-86." FederalReserve Bank of Saint Louis, Review, Vol. 72, No.5, Septj Oct. 1990, and U.S. Department of Commerce, Survey of Current Business, August,1991,1994, and U.S. Census Bureau, MASSPORT Trade Development Unit, 1994.
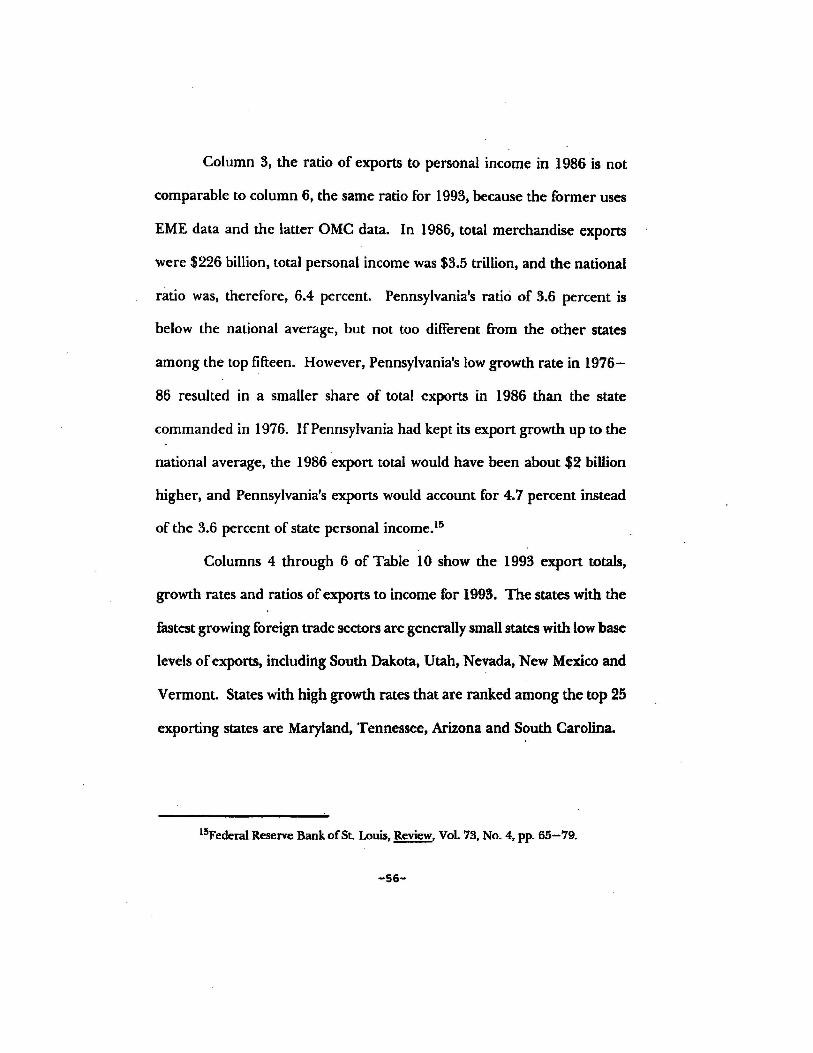
Column 3, the ratio of exports to personal income in 1986 is not
comparable to column 6, the same ratio for 1993, because the former uses
EME data and the latter OMC data. In 1986, total merchandise exports
were $226 billion, total personal income was $3.5 trillion, and the national
ratio was, therefore, 6.4 percent. Pennsylvania's ratio of 3.6 percent is
below the national average, but not too different from the other states
among the top fifteen. However, Pennsylvania's low growth rate in 1976
86 resulted in a smaller share of total exports in 1986 than the state
commanded in 1976. If Pennsylvania had kept its export growth up to the
national average, the 1986 export total would have been about $2 billion
higher, and Pennsylvania's exports would account for 4.7 percent instead
of the 3.6 percent of state personal income.ls
Columns 4 through 6 of Table 10 show the 1993 export totals,
growth rates and ratios ofexports to income for 1993. The states with the
fastest growing foreign trade sectors are generally small states with low base
levels ofexports, including South Dakota, Utah, Nevada, New Mexico and
Vermont. States with high growth rates that are ranked among the top 25
exporting states are Maryland, Tennessee, Arizona and South Carolina.
l5Federai Reserve BankofSt. Louis, Review, Vol. 73, No.4, pp. 65-79.
-56-

Column 7 combines the average annual growth rates of the 1976
86 period and the average annual growth rates of the 1988-93 period,
each weighted by the number of years involved. The national growth rate
is 9.3 percent. Maryland, Arizona and Washington are ranked among the
top twenty states in total exportS, and they dearly demonstrate a persistent
excellence in pursuing export growth. The three small states, Nevada,
South Dakota and Utah have also pursued export growth vigorously,
although they have low export base levels.
Among the top 15 ranked states in exports, New Jersey, Illinois,
Michigan and Pennsylvania have growth rates substantially below the
national average for the 1976-1993 period, although Pennsylvania has
performed better than the national average over the 1988-93 period.
Are the excellent export performances ofthe high growth states due
to especially effective state export promotion efforts, or are they due to the
particularly effective activities of private entrepreneurs and their labor
force? This question would require substantial research to answer, but
there is some evidence to suggest that state expenditures oil export
promotion are related to the level of exports by state (as opposed to the
growth rate). In an article published in the Federal Reserve Bank of St.
Louis, Review, the author concludes, based- on 1980 data, that state
-57-

spending on export p.romotion raises the level of exports.16 His results
indicate that $1,000 spent on exports will generate increased exports of
$432,000. This is a remarkable _result, but should be interpreted as a
conclusion based on one state raising its promotion expenditures, while the
other states do not. If many states compete by promoting their exports
vigorously, they cannot expect foreigners to buy more state exports on the
scale suggested by the above estimate. For a salient test of this proposition,
see Table 2 for the 1980-85 period, when U.S. merchandise exports
actually fell absolutely and as a percentage of GDP. Most states were
expanding their expenditures on export promotion during this time, but
the tenns of trade, the exchange rate, the price and quality of goods and
the incomes and tastes offoreign nationals detennined the level ofdemand
for U.S. exports, not the states' export promotion expenditures.
Prospects for Export Growth in Eastern Europe
.Most of the traditional large United States trading partners in
Western Europe, Canada and Japan show low or negative growth over the
1990-93 period. Among the major trading partners, two areas of the
world maintain high growth in their imports from the U.S.: Latin America
and the Pacific Rim. Pennsylvania should naturally focus its efforts on
16Cletus Coughlin, "The Competitive Nature ofStateSpendingon the Promotion ofManumcturing Imports: Federal Reserve Bank of St. Louis, Review, Vol. 70, 1988, pp.34-42.
-58-
promoting exports to these emerging export growth· centers. However, it
is probable that almost every state in the nation with an export promotion
office is also focusing. on these markets.
Eastern Europe is now emerging as a third area ofgrowth. Poland,
Hungary and the Czech Republic form a newly opened market for u.s.
exports, including 59 million potential consumers. This is a region where
Pennsylvania could play a significant role in market building. Export
markets generally grow independently of state sponsored efforts, but
growth may be stimulated somewhat by a concerted effort on the part of
potential trading partners. Therefore, it is in Pennsylvania's interest to
forge dose links with several countries that have a high growth potential
for mutually advantageous trade and exchange between Pennsylvania
businesses and consumers and their counterparts in Eastern Europe.
Increased export promotion efforts in the Central European market
may have a salutary effect on the.fortunes ofPennsylvania based exporters
and their Eastern European counterparts for several reasons.
The historical, cultural, familial and ethnic ties between the citizens
of Eastern Europe and the residents· of Pennsylvania can now be re
established. What was once forbidden or severely discouraged by the
Communist leadership is now encouraged by the current political climate.
-59-

Further, the initial opening ofnew market opportunities in Poland,
Hungary and the Czech Republic may lead to a gradual opening to other
promising East European economies, such as Belarus, Bulgaria, Romania
and even Yugoslavia. Beyond these, there lie the Baltic States, the Russian
Republic and other CIS nations that may recover from their current
economic difficulties and begin to play a peaceful and prosperous role
within the world economy. Policies proven to be successful in neighboring
countries may be adopted over time by nations that seek economic growth
and a rising standard ofliving. For example, Ukraine has recently adopted
a set of policies that emulate the Polish model of administering tlshock
therapy" to the economy. Similarly, ifthe Pennsylvania foreign trade office
results in successful outcomes in Poland, Hungary and the Czech Republic,
the successes will be replicated. Gradually one Eastern European nation
after another could take advantage of the Pennsylvania connection and its
opening to growth- and wealth-creating foreign trade opportunities.
The task force recommends the establishment of a new
Commonwealth trade office in Central Europe. The office should be in a
centrally located city within a centrally located nation. The city ofWarsaw
in Poland is a logical choice. This choice may be timely since the
economies of Poland, Hungary and the Czech Republic have begun to
experience positive growth after the steep decline over the past five years.
-60-
The economies of several other Central European nations may have
bottomed out and may begin to show surprising growth.
These new potential growth markets may enable Pennsylvania's
businesses to gain a foothold in a new and burgeoning export market. The
Commonwealth's foreign trade office is the first step in a concerted and
focused foreign trade initiative. A Commonwealth foreign trade office,
permanently established and staffed in Warsaw, will signify long-term
commitment to mutually prosperous commercial relationships in Central
Europe.
-61-


FEDERAL RESPONSE
Department of Commerce
The Department ofCommerce offers assistance and information to
exporters in order to increase U.S. competitiveness in the world economy
and collects economic statistics and social data for the use ofprivate analysts
and government planners. It also provides support for scientific,
engmeermg and technological research; promotes domestic and
international economic well being and development; and assists
international travel and tourism in the United States.
The Department of Commerce has established five programs that
may assist business development in Central and Eastern Europe, viz., the
United States and Foreign Commercial Service (US&FCS); the Business
Information Service for the Newly Independent States (BISNIS); the
United States - Russia Business Development Committee (BDC); the
Consortia of American Business in Eastern Europe (CABEE); and the
Consortia of American Business in the Newly Independent States
(CABNIS). A description of each of these programs follows.
-63-
United States and Foreign Commercial Service (US&FCS)
The United States and Foreign Commercial Service is the federal
government's primary export promotion agency. The service operates the
commercial sections of seventy large American embassies and handles
domestic duties as well.
The primary functions of this agency are to inform American
companies about business opportunities abroad, run trade fairs and furnish
general advice. Some ofthe agency's most important services are fee based.
US&FCS provides direct assistance for American, firms through' its
commercial offices in major foreign cities. The agency established a
commercial office in Moscow almost 20 years ago. New offices were
opened in Kiev and St. Petersburg' in 1992. Additional commercial offices
were more recently,opened in Tashkent, Uzbekistan; Almaty, Kazahkstan;
and Vladivostok., Russia. American Business Centers that will provide
Western-style business facilities on a fee basis will be within the five new
offices.
An important program offered by the US&FCS is the "Gold Key
Service". U.s. companies make arrangements directly with the overseas
commercial offices. For a fee, US&FCS will organize an entire schedule of
customized business appointments according to the goals identified by the
American firm.
-64-
Business Information Service for the Newly Independent States (BISNIS)
The Department of Commerce's Business Information Service for
the Newly Independent States is a one-stop shopping service offering
assistance to American firms interested in doing business in these markets.
BISNIS provides American firms with information on market and industry
developments, trade contacts and potential partner leads, government
programs supporting trade and invest~ent in the region, and general
market guidance. BISNIS draws upon numerous resources, including
commercial databases and publications, overseas reporting from u.s.
embassies and information from other government agencies. In addition
to preparing commercial reports on these markets, BISNIS has regular
publications describing market developments and identifying commercial
leads and potential NIS partners. These publications are sent free to
interested U.S. firms.
United States-Russia BUsiness Development Committee (BDC)
The U.8.- Russia Business Development Committee, which is co
chaired by U.S. Secretary of Commerce and the Russian Deputy Prime
Minister for trade, was established to foster economic and trade relations.
American companies can benefit through participation in BOC working
subgroups organized by the Department ofCommerce's trade development
-65-
industry sector offices and the Bureau ofExponAdministration. U.S. firms·
are encouraged to join the BDC subgroups and participate in events such
as trade missions, conferences, and other contacts with their Russian
counterpaJ1S..
Consortia of American Businesses in Eastern Europe (CABEE)
In June 1991, the Comfl;lerce Department initiated the Consortia
of American Businesses in Eastern Europe, a grant program designed to
stimulate trade between Central Europe and the United States and to assist
that region in the move toward privatization. CABEE ptovides grant funds
to trade organizations to defray the costs ofopening, staffing and operating
U.S. consonia offices in Central Europe.
The consortia are nonprofit U.s. firms interested in trade with
Central Europe. These organizations assist hundreds of q.lember fi~s
develop business relationships in Central Europe. The CABEE grant
program has prioritized Poland, the Czech Republic, Slovakia and Hungary
for project operations. In addition, the Commerce Department has
targeted five industry sectors for participation in this program:
agribusiness/agriculture, construction!housing, energy, environment and
telecommunications; grants were awarded to agribusiness, construction,
environment and telecommunications. Eight non-profit CABEE grantee
-66-

commercial offices are located: three in Warsaw, two in Prague, two in
Budapest and one in Sofia.
Consortia of American Businesses In the Newlv Independent States
(CABNIS)
In July 1992, the U.S. Commerce Department initiated the
CABNIS grant program to stimulate U.S. business in the CIS nations and
to assist the region in its move toward privatization. CABNIS provides
grant funds to non-profit organizations to defray the costs of opening,
staffing and operating U.S. consortia offices in the CIS. The CABNIS
program, which is modeled after CABEE, serves as a venue for U.S.
exporters who otherwise would be unable to enter such an evolving and
complex market alone.
As an example of how CABNIS works, the American Building
Products Export Council and the Home Builders Institute have
cosponsored and built American style sample homes in Warsaw. American
technology and personnel worked with their Polish counterparts to
construct these homes. The objective of this exercise is similar to a trade
show, with the intended result to be the generation of exports related to
manufactured housing, housing components and manufacturing related
services.
-67-

CABNIS consortia also work to enhance private sector development
in the CIS nations. This assistance can take the form of marketing host
country products, supportingo indigenous counterpart _organizations.
promoting joint ventures with local companies, or providing technical
training of local employees. The CABNIS offices are staffed with
knowledgeable. indigenous individuals experienced with the industries that
they represent.
CABNIS consortia remove many ofthe obstacles to exporting in the
CIS for small- °and medium-sized firms. By pooling commercial expertise
and other resources, Pennsylvania companies that otherwise could not
enter these marken; will be able to gain a competitive foothold.
Pennsylvania small to medium sized finns are encouraged to form a
nonprofit umbrella organization in order to apply for funding under this
program.
Other Federal Agencies
Depending upon a company's field of. activity. there are other
federal government agencies that can also be contacted for market
information on Eastern Europe. For instance, if the U.s. firm is interested
in mineral resources, it may contact the office of the Bureau of Mines
specializing in the Eurasian region, which will have a commodities specialist .
with extensive contacts in the region. Similarly, the Federal Aviation
-68-

Administration, Department of Agriculture, Department of Energy, the
Environmental Protection Agency and other federal agencies employ
specialists who are knowledgeable about the region.
For a detailed listing and explanation offederal programs designed
to help the Pennsylvania exporter, see Appendix A.
-69-

PENNSYLVANIA'S RESPONSE
The Commonwealth has several economic development initiatives
that have both direct and indirect impact on Pennsylvania exporters. These
may be divided into four types: Commonwealth agencies and programs;
state and federal joint programs; multi-state programs; and local
development agencies. Private and State initiative is creating Pennsylvania
International Partners in Progress (PIPP). a public/private partnership to
promote trade: development in Eastern Europe.
·Department ofCommerce/Pennsylvania Economic
Development Partnership
Office of International Trade (011]
The Commonwealth administers economic development and
foreign trade issues through the Office of International Trade of the
Department ofCommerce. OIT directs its resources to those Pennsylvania
based industries that provide the best opportunity to expand foreign
markets for Pennsylvania produced goods. The office implements
international marketing initiatives through the participation in international
trade shows and trade missions by Pennsylvania's small and medium sized
-71-
business. The office assists in securing export financing, insurance and
export loan guarantees through the use offederal and state programs. The
office advises the Governor and Secretary of Commerce on international
trade related matters.
Pennsylvania budgeted $2.8 million for OIT operations in fiscal
year 1993-94, an increase of37 percent over the $2.0 million allocated in
fiscal year 1992-93 and 91-92. Funds were applied to trade/export
promotion, investment attraction, agricultural export. promotion,
international tourism and other. Of the amount appropriated, $580,000
was allocated for operation ofthe International Trade Office in Harrisburg;
$1.2 million was allocated for the offices of overseas representatives in
Brussels, Frankfurt, Tokyo and Toronto;l7 $500;000 was allocated to a new
program, Pennsylvania Export Partnership (PEP); and $500,000 to the
l7The Brussels, FrankfurtandTok.yo offices are dedicated solely to representing theinterest of the Commonwealth of PennsylvaJlia. The Toronto office is a trade liaisonoffice. Pennsylvania, Indiana and WISConsin share the expenses of running this office.The office is housed with the U.S. Foreign and Commercial Service in Toronto and hasaccess to the Service's data resources. The Pennsylvania portion of the project issupervised by orr. The states participate in a regional endeavor in which each pays aportion of the total mark.eting costs incurred. Pennsylvania's share of the operatingexpenses is paid out of Commerce's operating budget.
-72-

Hardwood Development Corporation.18
The Office of International Trade has targeted the medical,
environmental, food processing and electronics instrumentation industries
for trade development assistance. The companies eligible for assistance are
small to medium sized, employing up to 2,000 employees; priority is given
to firms employing fewer than 500 employees. Presently, OIT targets
export markets in Western Europe, Canada, Mexico, Southeast Asia and
Latin America.
. Capital Loan Fund
Under the Capital Loan Fund,19 the Department of Commerce is
directed to determine eligibility requirements for certain federal loans and
180IT Budget (In thousands of doUars):
Fiscal Fiscal Fiscal PercentYear Year Year Change91/92 92/93 93/94 1993-94
Harrisburg Office $ 495 $ 525 $ 580 10.4%Overseas Office 1,005 1,150 1,220 6.0PEP 500Hardwood Dev. Center 500 ~ -2QQ 35.5Total $2,000 $2,094 $2,800 33.7%
Source: Office of International Trade, Department of Commerce.19Act ofJuly 2, 1984 (P.L.MS. No.1og), known as the Capital Loan Fund Ad;.
-73-
is authorized to make advances to area loan organizations (ALO'S)20 for the
purpose ofmaking cenain capital development and export assistance loans.
Class III Loans are made to support capital development projects of firms
.with fewer than 100 employees which demonstrate a substantial likelihood
of providing long-term increases in net new employment opportunities.
Loans are made to support the financing of land, buildings, machinery or
working capital for the manufacture of products for export. The Fund is
financed by appropriations from the General Fund and other sources. The
amount available to the Fund for fiscal year 1993-94 is $12 million,
unchanged from the previous fiscal year.
Another type ofloan intended to further export development is the·
Export Assistance Loan. The purpose of the loan is to provide funding to
small manufacturing concerns, with between 100 and 500 employees, who
are penetrating or significantly increasing their share of international
export markets. The Export Assistance Loan program was approved by the
Legislature, but a source of funding was never identified. The task force
believes' that identification of a funding source for this program would
facilitate the Commonwealth's export development initiative.
20Ute Pennsylvania Capital Loan Fund is administered through 21 designated localArea Loan Organizations. These organizations process the loan applications then submitthe completed application. with the local ALO's review, to the Depanment of Commercefor its review and approval. See Appendix B for list of ALO's.
-74-

The Capital Loan Fund Act provides for loans to processors of
value-added farm commodities as a Class IV loan. The purpose of the
loan is to provide funding to small secondary processing finns. Agricultural
processor loans are funded by means of inter-agency transfers from the
Depanrnent ofAgriculture and require the approval ofboth departments.
Historically, $1.0 million has been appropriated annually to the
Department of Agriculture for this program. The qualifications for
participation in this program are that the borrower must have 100 or fewer
full-time employees and must demonstrate a substantial likelihood of
providing long-term increases in net new employment opportunities. At
present, the act makes no provision for funding exports of this type. The
.task force believes that value-added agricultural commodities should be
.included in the export development initiative. Therefore, the act should
be amended to make investments in exports of those commodities eligible
for Class IV loans.
The Department of Commerce proposes administrative and
legislative changes to the Pennsylvania Capital Loan Fund.21 The
Department suggests that loan limits be raised; that the focus of job
retention projects be on increasing the competitiveness ofsmall companies;
21A draft copy of the proposed changes is on file· in the office of the Joint StateGovernment Commission.
-75-
that eligibility be expanded to include manufacturing service firms; and that
signed contract requirements be eliminated. The proposed changes are .
designed to improve both the efficiency and effectiveness of the program,
and the task force supports their adoption.
Pennsylvania Export Partnership (PEP)
The Pennsylvania Export Partnership is administered by the
Department of Commerce and funded by appropriation from the
Commonwealth. Funding of$500,OOO is provided for the fiscal yeat 1993
94. The Pennsylvania Export /Pannership Aet22 establishes the
Pennsylvania Export Pannership Advisory Board, directs the Department
of Commerce to develop certain international marketing initiatives, and
authorizes the Department to participate in and accept contributions for
trade development activities in cooperation with other nongovernmental
entities. The act establishes the Trade Event Grant Program and the
Regional Export Matching Grant Program and provides for additional
responsibilities of the Department of Commerce. PEP brings together
business, state and federal agencies, education, training and trade
development organizations -- all with the common goal ofpromoting and
22Act of July I, 1992 (P.L. 810, No.lS0), known as the Pennsylvania ExponPanncrship Act.
-76-

coordinating the export of Pennsylvania goods and services.
. One tool PEP uses to contribute to Pennsylvania's export
competitiveness is the Trade Event Grant Program. Under this program,
the Commonwealth provides matching funds of up to $2,500 to help small
and medium sized businesses defray certain costs associated with exhibiting
or attending an international trade event. The grants are designed to
encourage companies that could not otherwise afford to participate in these
events.
Trade event grant recipients receive marketing assistance from an
.. experienced trade specialist prior to and during the actual trade event.25
The trade specialist helps a company assess the competition, deterniine its
product's competitiveness, discover product improvements, identify and
meet with potential agents or distributors, and arrange meetings with
foreign buyers.
An applicant must be a business located within Pennsylvania, with
sales of$50 million or less and with 500 or fewer employees. The company
must either manufacture a product; process raw materials into products;
package or repackage products; or assemble, package and sell products.
Companies that have no proven export history will be given preference
23All applications must be submitted through a PEP Regional Export service Providerorganization to the Office of International Trade. A list of the Service Providers appearsin Appendix A A Trade Event Grant Program application and mt ofeligible trade eventsalso appears in Appendix A.
-77-
over experienced exporters; however, companies that have demonstrated
export initiative in new foreign markets are also eligible. Participation is
limited to one grant per company per fISCal year.
The Regional Export Matching Grant Program is also funded under
PEP. Under this program, OIT has selected ten nonprofit organizations
from across the Commonwealth to serve as PEP Regional Export Service
Providers. Seven Local Development Districts (LDD's), two Small Business
Development Centers and an Export Consortium were chosen as the
Regional Export Service Providers. OIT will assist these providers in the
development and execution of Regional Export Development Programs.
Funding of each of the providers is on a matching grant basis.
Providers are expected to identify and recruit companies to
participate in the Trade Event Grant Program. The providers are
responsible for assisting companies in the completion of the grant
application process and for conducting market research to assess the export
potential ofa company's product in a specific market. Each provider must
supply OIT with adequate justification for a company's participation in a
trade event for which grant assistance is being sought. In addition, the
provider is responsible for assisting'successful Trade Event Grant applicants
with the grant reimbursement process following their participation in a
trade event. The provider must also work closely with OIT to document
-78-

a company's success at a trade event.
The Export Partnership Act is due to expire on June 30, 1995, and
the task force urges its continuation.
Joint State/Federal Programs
The Pennsylvania Department ofCommerce utilizes various services
provided to staLes by the following federal agencies: the United States
Department of Commerce; United States Agency for International
Developmclll (AI D); Small Business Administration (SBA); Overseas Private
Investment Corporation (OPIC); State Department; Export/lmport Bank;
the U.S. Customs Department; and the Appalachian Regional Commission
(ARC).24
24Under the provisions ofthe Appalachian Regional Development Act of 1965, asamended, (P.L. 89-4), the Federal Government instituted a program to assist theAppalachian region in meeting its special problems to promote economic development,and to establish a framework for attacking irs common problems and meeting its commonneeds on a coordinated and concerted regional basis. The legislation authorized thecreation and funding ofl.ocal Development Districts (LDD's) baving a cbarterorauthority .that includes the economic development ofcounties or parts ofcounties or other politicalsubdivisions within the region. By act ofJune 8, 1965 (P.L.I07, No.74), the Governor wasauthorized to undertake such activities as may be necessary to implement the said Federallegislation, and by Executive Order No. 18, dated April 12, 1967, entitled TheAdministration of the Appalachia Program in Pennsylvania. the Governor directedCommerce to exercise the State's responsibilities in the Appalachia program.
-79-
The Appalachian region ofthe Commonwealth is divided into seven
multi-county local development districts (LDD's).25 The LOO's direct
federal and state funds to economically depressed rural.and urban areas
within Pennsylvania's Appalachian region.26 The LOO's provide business
financing and access to the Pennsylvania Capital Loan Fund; set up
business incubator facilities; assist businesses in foreign export sales; help
companies obtain state and federal government contracts; provide job
training programs; and promote tourism, community development and
energy conservation.27
2Local Development Districts and Counties Served:• Northwest Pennsylvania Regional Planning and Development Commission - Erie,
Warren, Crawford, Mercer, Venango, Forest. Lawrence, Clarion.• North Centl'lil Pennsylvania Regional Planning and Development Commission
McKean, Potter, Elk, Cameron, Jefferson, Clearfield.• Nonhern Tier Regional Planning and Development Commission - Tioga, Bradford,
Susquehanna, Sullivan, Wyoming.• Economic DevelopmentCouncil ofNortheastern Pennsylvania - Lackawanna, Wayne,
Pike, Luzerne, Monroe, Carbon, Schuylkill.• Southwestern Pennsylvania Regional Development Council - Beaver, Butler,·
Armstrong, Indiana, Allegheny, Westmoreland, Washington. Fayette, Greene.• SEDA-CounciJ of Governments - Clinton, Lycoming, Centre, Union, Montour,
Columbia, Northumberland, Snyder, Miftlin, JUniata. Perry.2&rhe LDD'sare undercontractwith the Pennsylvania DepanmentofCommerce to
.underta~e economic and enterprise development activities within their respectivegeographic areas. Adraftc:opy oftbe Agreement is on file in the office of the Joiot StateGovernment Commission.
27Under the agreement an LOD is to work cooperatively with existing resourceswithin its area, including, but not limited to, Small Business DevelopmentCenters, Private.Industry Councils, Ben Franlilin Technology Centers, Community Artion Agencies,Indwtrial Resource Centers, iDdwtrial development corporations and authorities, andhousing and redevelopment authorities. The agreement includes a clearly defined exportdevelopment component that directs the LOD to c:ooperate with the Office ofInternational Trade.
-80-

Appalachian Regional Commission (ARC)
TheAppalachian Regional Commission (ARC), ajoint state/federally
funded program, is. administered by. the Pennsylvania. Department of
Commerce and provides funding for export development. ARC funds are
utilized in two ways. First, the Department of Commerce administers the
Enterprise Development Program through the LDD's within· the
Appalachian region.28 The Enterprise Development Program is designed
to provide technical assistance to small and medium sized businesses located
within this region. Each LOD is required to offer services in three core
areas: development finance, procurement assistance and export outreach.
Under export outreach, the LDD's provide assistance to help
businesses obtain foreign export sales. Trained export specialists aid small
and medium sized companies that may have the potential to compete in
foreign markets. The specialists receive leads on foreign sales opportunities
through an extensive netWork of contacts, including offices of the U.S.
International Trade Administration (ITA) and the Department's Office of
International Trade. After identifying· possible matches, the specialists
provide a range of technical assistance to the business.
2&rbe seven local development disuicts represent 52 of the Commonwe3lth's 67counties and Serve as liaisons to the federal government. ARC activities are restricted tothat portion of the Commonwealth that is encompassed within the Appalachian Region.
-81-
The LDD's receive both state and federal funds to carry out the
Enterprise Development Program. State funds come from a line-item
appropriation made to the Department of Commerce for this purpose. In
fiscal year 1994-95, the seven LDD's received a total of $1.5 million in
state funds. These moneys are used to match federal funds received
through the ARC, which in federal fiscal year 1995 totalled $2.5 million.
It should be borne in mind that no fixed proportion of the $4 million in
funding is set aside for export outreach asSistance.
ARC funds have also been used to develop marketing guides for use
by certain industry sectors and to develop the computer link-up currently
in place between the Department and the LDD's. To access funds for
individual projects, applications must be submitted through an LDD and .
must pertain to projects that affect the Appalachian region. ARC moneys
must be matched with grantee funds, typically on a 50-50 basis.
Pennsylvania State University
Pennsylvania State University is active in Eastern Europe through
programs administered by the College of Agriculture and the Applied
Research Laboratory (ARL). The College of Agriculture and Extension
Education actively participates in international agricultural development
efforts by sending faculty and agriculture extension service providers to
-82-
Albania,. Lithuania, Latvia, Hungary, Poland and Ukraine. Upon their
return to Penn State, faculty members are expected to utilize the
experience gained in teaching the college ofagriculture students; extension
service workers use their experience to enhance extension services to
Pennsylvania's farmers.
The College ofAgriculture's activities in Eastern Europe are funded
entirely from the following federal sources: the Agency for International
Development, the Department of Agriculture and the United States
Information Service.
The College of Agriculture's involvement in Eastern Europe has
provided a unique opportunity not only to faculty and students but also to
Pennsylvania's farmers and processors of agricultural products. The
Pennsylvania food processing industry and Polish farmers and food
processors can benefit each other economically.
The Advance Research Laboratory (ARL) has been in existence for
more than 50 years performing research principally for the United States
Navy~ The naval research activities are funded by the Deparonent of
Defense. ARL does not utilize any of the University's funds in conducting
research activities. Due to the draw down in defense spending, ARL is
.seeking to work with private industry to translate dual-use technologies
and related skills into commercial applications.
-63-
The East European countries and Ukraine, in particular, were
highly advanced in the sciences during the Cold War era and have a large
pool of science and engineering talent." ARL is"" providing "technology
assessment" of technologies developed at that time by Ukrainian scientists,
including the "electronic beam." ARL has several exclusive agreements
with the Ukrainians to bring their technologies to Western industrial
markets.
Multi-state Trade Promotion" Groups
Pennsylvania is a member of the Council ofGreat Lakes Governors
and the Council ofState Government's Eastern Regional Conference. The
Great Lakes Council provides information on investment demographics and
other relevant statistics to major industries within the council membership.
The Council of Great Lakes Governors has undenaken a series of
business development projects in the international arena aimed at
generating additional sales, jobs, tax revenues and profits for the region.
The states, through the trade directors, target specific sectors holding
export opportunities for the region as whole in the areas of export
promotion, data base and marketing strategy development, joint venture
promotion and tourism.
-84-

The Export Task Force of the Council of State Government's
Eastern Regional Conference formed the International Trade Data
Network, which so far has linked up the trade offices of Rhode Island, New
Hampshire, Connecticut and Pennsylvania. The network draws from more
. than 40 federal agencies and other sources. As part of its efforts to
promote a regional trade strategy, the council had the Urban Institute
identify promising Northeastern export categories; among those
recommended were medical instruments, publications, hand tools and
electrical equipment.29
Local Agencies
County. regional and city economic development organizations are
actively engaged in trade development via the local development districts
~e Urban Institute, Targeting Export Markets For Pennsylvania. (New York:Council of State Governments Eastern Regional Conference, 1993). The report offers ananalysis of Pennsylvania's most competitive manufacturing export sectors and their chiefinternational markets.
-85-
and small business development centers (SBDC's).30 Funding for the
development districts comes from both state and federal sOurces. The
SBDC's are funded by the Commonwealth through .the .Department of
Commerce and on the federal level by the Small Business Administration.
The SBDC's have jointly developed Pennsylvania Export Network
Service (PENS), a software package to match foreign leads with
Pennsylvania firms in the right industry. In its first six months of
operation, the PENS program sent over 10,000 leads to almost 800
Pennsylvania firms. PENS has the potential to serve as the basis for the
development ofa much expanded data base serving all Pennsylvania based
firms.
30sman Business Development Ceot.ers (SBDC) and Counties Served:Gannon University SBne - Erie, Mercer, Crawford, Warren.Clarion University SBne - Potter, Vennago, Forest, Clarion, Armstrong,· Cameron,
Clearfield, McKean, m, Jefferson, Indiana (Indiana UniversityofPenDSylvaniaSatellite).
Ouquesne University SBOC - Butler, Lawrence, Beaver, Allegheny.University of Pittsburgh SBOC - Allegheny, Washington, Greene, Fayette.St. Vincent College SBOC - Westmoreland.St. Francis College saoc - Bedford, ~lair, Cambria, Fulton, Huntington, Somerset.Bucknell University SBOC -Centre, Clinton, Mifflin, Union, Lycoming, Montour,
Northumberland, Snyder, Juniata. Perry.Kutztown University Capital Region SBnc - Adams, Berks, Dauphin, Franklin, York,
Lancaster, Cumberland, Lebanon.University ofScranton saoc - Lackawanna, Monroe, Pike, Wayne, Wyoming,
Susquehanna, Tioga, Bradford.Wilkes College SBne - Luzerne, Columbia, Carbon, Schuylkill, Sullivan.Templc University SBOC - Philadclphia, Oelaware, Montgomery, Bucks, Chester.University of Pennsylvania, The Wharton School SBne - Philadelphia, Delaware,
Montgomery, Bucks, Chester.LaSalle College SBOC - Philadelphia, Delaware, Montgomery, Bucks, Chester.Lehigh University International Trade Developmcnt Center SBne - Lehigh,
Nonhampton, Montgomery.
-86-

The SBDC's provide small business in the Commonwealth a
competitive edge through free, individual management consulting and low
cost business training workshops.. A network of. university-based,
management assistance centers, the SBDC's employ consultants with
expertise in export assistance. The SBDC's sponsor seminars, consulting,
networking, product promotion, trade fairs, and business oriented
publications.
The LDD's provide general business advice which contains an
export development component. By entering into contracts with PEP, the
seven LDD's as export service providers, have committed themselves to
providing a level ofservice and expertise in the local development districts.
The task force supports this approach, but is concerned that duplication of
effort might result. The task force seeks positive results from the export
development program; a specific way of measuring those results would be
for OIT to develop a performance audit of the SBDC's and the LDD's.
Public/Private Partnerships
At present there are no public/private sector partnerships in
Pennsylvania to promote trade development. This could change with the
creation of Pennsylvania International Partners in Progress (PIPP), a
project proposed to be organized jointly by the Commonwealth and the
-87-
private sector. Although the Commonwealth may play an important role
in PIPP's development, it will not operate the organization. The project
will represent a business development initiative linking Pennsylvania
businesses to Eastern European businesses. PIPP's focus will be to increase
Pennsylvania's participation in the export markets of Central Europe and"
the Commonwealth of Independent States. PIPP appears to be a suitable
candidate for federal assistance via the CABEE or CABNIS consortia grant
programs.
PIPP will be an international nonprofit corporation incorporated in
Pennsylvania. Membership will be open to all businesses incorporated
within Pennsylvania. The corporation will be governed by a Board of
Directors, which will· set dues and fees, including additional fees for
translation and other services. Through the collection ofdues and support
from private sources, it is envisioned that the organization will quickly
become self sufficient.
The unique component of this organization is that a sister
organization will be created in Eastern Europe. This organization will
provide PIPP with a direct link to its service area.
Additionally, a bond program might be established that targets
Pennsylvania companies who conduct business in PIPP's service area. The
aim of the program would be to provide direct, flexible financial assistance
-88-

to Pennsylvania businesses interested in Central Europe and the CIS. This
program might includes low interest loans or loan guarantees, small scale
capital investment and other forms of financial assistance.
PIPP will also offer services such as translation, export assistance
and participation in humanitarian aid projects. Trade lead development
will be an important activity that will be facilitated by PIPP's structure.
Both entities will maintain databases of its members that can allow for
instantly linking Pennsylvania businesses with similar businesses in Eastern
Europe and the CIS. PIPP may also serve as an additional conduit for
federal export assistance, including federal grants, subsidies, loan
guarantees and administrative support.
If imple~ented as suggested, this approach will address both the
technical and financial concerns expressed by Pennsylvania business
regarding this market. The goal is to evolve from foreign aid to a wealth
building system. Under the proposed system new partnerships are fonned,
and both sides participate· financially, create jobs and reap the benefits of
their enterprise.
-89-

PARTICIPANTS AT TASK FORCE HEARINGS
I. Hearing. April 14. 1994. Pittsburgh
The hearing format was that of a round table discussion.
GERALD A. BURKE. CPA, Urish Popeck and Company, CertifiedPublic Accountants
BERNIE COLLIGAN. Office of the Mayor of Pittsburgh
EMANUEL DOMBAKIAN, Business Consultant for Eastern Europe,H. J. Heinz Company
SUZANNE ETCHEVERRY, University of Pittsburgh
RON FURNIVAL, Professional Services
ANN GLEASON, StaffAssistant, Office of the Honorable WilIiamJ.Coyne, M.C., United States House of Representatives
DUAN HOVANEC, Slovak. Translator
IGOR A. JOURIN, Ph.D., Assistant to Director, Office ofMulticultural Education, La Roche College
JOSEPH MALLINO. Chief Financial Officer, Alexander MillServices, Inc.
TIMONTHY W. MEHALLICK, Mehallick. Manufacturing Co.
GEORGE MORDWINKIN
STEPHEN W. PAULOVITCH, President, Erie Balaton
-91-

KATHRYN PETRUCCELLI, University of Pittsburgh graduatestudent in Russian and East European Studies
JAMES P. SHONBORN, Russian Translator
DOUG TAYLOR, Alexander Mill Services, Inc.
JOHN J. URBANIAK, Aviar Software Inc.
GWEN L. VENESKEY, Aviar Software Inc.
JAY WEINBERG, Maglev Inc.
K. DALE WISSMAN, President, Mountain Vest Corporation
II. HEARING, MAY 5, 1994, PHILADELPHIA
The hearings consisted of two parts: 1) a tour of the PackardAvenue and other Marine Terminal facilities on the Delaware River,and 2) discussions held in the Tioga Administration Building of thePhiladelphia Regional Port Authority.
Part I: Marine Terminal Facilities
HONORABLE JOSEPH L. ZAZYCZNY, Secretary ofAdministration, Commonwealth of Pennsylvania
Delaware River Port Authority:
PATRICIA A. HUGHES, Government Relations
JOSEPH MENTA, Assistant Director of Communications
Philadelphia Regional Port Authority:
TERRY FOLEY, Marketing Representative
WILLIAM B. McLAUGHLIN, III, Director of Communications,Governmental Be Public Affairs
-92-

Other Participant
REGINA MARIE LEDERERt Alcohol Education Specialist,Pennsylvania Liquor Control Board
Part II: Tioga Administration Building
RONALD K. BEDNAR, Regional Planning Specialistt Bureau ofCommunity Planning, Department of Community Affairs
HONORABLE JOSEPH L. ZAZYCZNY, Secretary ofAdministration, Commonwealth of Pennsylvania
Delaware River Port Authority
PATRICIA A. HUGHES, Government Relations
JOSEPH MENTA, Assistant Director of Communications
Philadelphia Regional Port Authority
TERRY FOLEY, Marketing Representative
WILLIAM B. McLAUGHLIN, III, Director of Communicationst
Governmental Be Public Affairs
Philadelphia Economic Development Corporation
RAYMOND W. DEVUNt Managert Program Development
STEPHEN E. MEVECt Manager, Research and Planning
Other Participants
ZORAN BALMAS deKIDEt President and CEO, EUR-AMCorporation
J. PETER HORAN, Account Representative, Janbridget Inc.
EDWARD P. KOLINKA, Quality International Ltd.
-93-
JOHN W. KOPCHA, President, Kopcha Resource Management, Ltd.
REGINA MARIE LEDERER, Alcohol Education Specialist,Pennsylvania Liquor Control Board
EDWARD W. LUKIEWSKI, President, Polonia Federal Savings andLoan Association
WILLIAM F. LYONS, Vice President, Navmar Applied SciencesCorporation
ANTHONY J. MADERA, AJM
ANDRE MICNIAK, Esquire
MARK PARKER, Sales Engineer, Kras Corporation
GREGORY W. PIASECKI, Administration, Piasecki AircraftCorporation
LAWRENCE PLUMMER, President, Kras Corporation
BOHDAN (BILL) PYTLOWANY, IDC-Group, Inc.
BERNARD M. RAYCA, Rayca International Group
PAMELA D. VARKONY, Partner, Director of Account Services,Spectrum Global
ZSOLT F. VARKONY, Parmer, Director of Marketing Services,Spectrum Global
EUGENE]. WLODKOWSKI, Executive Vice President, WashingtonSavings Association '
III. HEARINGS, JULY 6 & 7, 1994, STATE COLLEGE
The Penn State hearings were bifurcated: Part I ofthe University'spresentation was conducted by administrators with detailed briefingson activities in the area of agriculture, presented by the College ofAgriculture and Science; Part II was conducted by the Applied
-94-
Research Laboratory with presentations on technology assessmentcapabilities and activities in Central and Eastern Europe.
Part I: Nittany Lion Inn Conference Room
Pennsylvania State University (Office of the President)
RICHARD DIEUGENIO, Governmental Affairs
JOHN LEATHERS, Associate Vice President, CommonwealthEducational Systems
DAVID R. SCHUCKERS, Special Assistant to the President
College of Agriculture and Science
DONALD EVANS, Assistant Dean for Extension, Assistant DirectorCooperative Extension, Associate Professor of Agriculture andExtension Education
J. DEAN JANSMA. Associate Dean for International Programs andProfessor of Agricultural Economics
Applied Research Laboratory
L. RAY HETICHE, Director and Professor ofEngineering Research
PART II: Applied Research Laboratory
Pennsylvania State University (Office of the President)
RICHARD DIEUGENIO, Governmental Affairs
JOHN LEATHERS, Associate Vice President, CommonwealthEducational Systems
DAVID R. SCHUCKERS, Special Assistant to the President
Applied Research Laboratory
CHARLES H. BRICKELL, Research Associate
-95-
ROBERT J. HANSEN, Chief Scientist
L. RAY HElTCHE, Director and Professor ofEngineering Research
EDMOND D. POPE, Senior Research Associate
HENRY E. WATSON, Senior Research Associate
College of Agriculture and Science
DONALD EVANS, Assistant Dean for Extension, AssistantDirector Cooperative Extension, Associate Professor of Agricultureand Extension Education
-96-

SELECTED BIBLIOGRAPHY
PUBLICATIONS AVAILABLE IN THEJOINT STATE GOVERNMENT COMMISSION'S LIBRARY
Ben Franklin Information Center. Greater Philadelphia in the 21stCentury: A Regional Strategy for Industry Competitiveness, Phase!. Philadelphia: 1994.
_____.,..--. Greater Philadelphia in the 21st Century: Report onExporting to Eastern Europe for the Joint State GovernmentCommission Task Force for European Economic Development, aRegional Strategy for Industry. Phase II. Philadelphia: 1994.
CIS Market Atlas Including the Baltic States and Georgia. BusinessInternational Moscow. Moscow: September 1992.
Fulcher, Stan, Justin Ransome and Amy B. Shaw. An Overview ofLouisiana Law and its Application to Foreign Investors. State ofLouisiana, Department of Economic Development. Baton Rouge:1992.
• A Primer of International Business Law. State of--~--:~-
Louisiana, Department of Economic Development. Baton Rouge:1993.
____----,_,. Louisiana International Business Terminology. Stateof Louisiana, Department ofEconomic Development. Baton Rouge:1993.
Louisiana Importer's Guide. State of Louisiana,Department ofEconomic Development. Baton Rouge: 1993 (draft).
-97-
______. A Primer of Marketing Louisiana's Products in theGlobal Marketplace. State of Louisiana, Department of EconomicDevelopment. Baton Rouge: 1993 (draft).
Pennsylvania Chamber of Business and..Industry. Pennsylvania ExportAssistance Directory. Harrisburg: 1994.
Pennsylvania House of Representatives, Business and EconomicDevelopment Committee. Report of the Export Task Force.Harrisburg: 1994 (draft).
Pollard, Patricia S. 'Trade Between the United States and EasternEurope." The Federal Reserve Bank of St. Louis, Review, Vol. 76,No.4, July/August, 1994.
State of Louisiana, Department of Economic Development. Culture andBusiness Practices. Baton Rouge: 1992.
Urban Institute. Targeting Export Markets for Pennsylvania: An Analysisof Pennsylvania's Most Competitive Manufacturing Export Sectorsand Their ChiefInternational Markets. New York: 1993.
Vucinich Nick. Tapping New Markets: California's Role in PromotingInternational Trade. California Senate Office of Research.Sacramento: 1993.
PUBLICATIONS AVAILABLE IN THESTATE LIBRARY OF PENNSYLVANIA
Bruder, Eric T. "Vancouver Summit Initiatives Generate BusinessOpportunities in Russia: Business Infonnation Service for theNewly Independent States (BISNIS)." Business America, 17 May,1993. .
Burant, Stephen R., ed. East Germany: A Country Study. Washington:Library of Congress, 1987.
__~ . Hungary: A Country Study. Washington: Library ofCongress, 1989.
-98-

Central Intelligence Agency~ The World Factbook. Washington: 1994.
Curtis, Glenn E., ed. Poland: A Country Study. Washington: Library ofCongress, 1992.
Fabrizio, Lynn. "New U.s. - Russia Commission Pushes CommercialCooperation in Energy and Space." Business America, 20September, 1993.
Gawdiak, Ihor, ed. Czechoslovakia: A Country Study. Washington:Library of Congress, 1987.
Gunn, TrevorJ. "Racing to Enter the Russian Far East Market." BusinessAmerica, 23 August, 1993.
Joint State Government Commission. Report ofthe Task Force on DefenseRelated Industries. Harrisburg: 1993.
Lake, Anthony. From Containment to Enlargement. U.S. Department of',." State Dispatch, September 27, 1993.
Mowrey, Mark. "Poland: An Entrepreneurial Culture Takes Root."Business America, March, 1994.
Ring, Mary Ann. "Export Financing at the State Level." Business America,15 November, 1993.
U.S. Department of Commerce. "Small Business Center HelpsPennsylvania Exporters." Business America, 5 April, 1993.
"Construction Market Booms in Eastern Europe."Business America, 6 September, 1993.
_______-----,.:~ "Offering More Evidence That the World Is Changing,U.S. And Russian Hockey Teams Announce Joint Venture."Business America, 6 September, 1993.
'American Showhouse' in Warsaw Shows Poles theAdvantages of U.S. Housing Technology. Business AmeriCa, 20September, 1993.
-99-
__~_--:-_" "Doing Business in the Newly Independent States: AStep-by-step Guide for American Companies." Business America,20 September; 1993.
______~~-..,.... "Commerce's Market Development Cooperator ProgramReflects New Partnership Between Private Sector and FederalGovernment." Business America, 4 October, 1993.
______. "Unveiling National Export Strategy: Ask Not WhatYour Country Can Do for You, Ask What Exporting Can Do forYour Country and You." Business America, 4 October, 1993.
_______. "Sources of Export Financing." Business America, 1November, 1993.
"Big Emerging Markets Share of World ExportsContinues to Rise." BusinesS America, March, 1994.
''The National Export Strategy." Business America,April, 1994.
U.S. Depanment of State. "Assistance to Russia and Other NewlyIndependent States of the Former Soviet Union: Material Relatingto the Vancouver Summit and Tokyo G-7 Ministerial Meeting."Dispatch Supplement, April 1993.
Yancik, Joseph and Marianne Vanatta. "U.S. - Russian Oil and GasOfficials Establish Close Links for Future." Business America, 31May, 1993.
Zickel, Raymond E., ed. Soviet Union: A Country Study. Washington:Library of Congress, 1989.
-100-

NEWSPAPERS
Manasyev, Yuri N. "Russia's Vicious Circle." New York Times, February28, 1994.
Beck, Ernest. "Soros Begins Investing in Eastern Europe." Wall StreetJournal; June 1, 1994.
Binzen, Peter. ''Thinking Global Is His Key Strategy to Business Success."Philadelphia Inquirer, May 31, 1994.
_______."From the Main Line to Slovakia, All to Develop a FireExtinguisher." Philadelphia Inquirer, June 7, 1994..
Bloomberg Business News. "Greenwald Quits Czech Truck Maker." NewYork Times, September 8, 1994.
Bonner, Raymond. "A Survivor Thrives in the Ex-Soviet Silicon Valley.". New York Times, April 27, 1994.
Brown, Ken. "Cold War Over, Foreign Affairs Schools Refocus." NewYork Times, November 17, 1993.
Brown, Ronald H. "World Trade: The Big Job of Business." New YorkTimes, May 8, 1994.
Chapin, Christopher K. "Revamp U.s. Aid for Overseas Sales.1I New YorkTimes, February 20, 1994.
Chartrand, Sabra. "From Russia, with Red Tape: A Technology Boom - Despite Bureaucratic Snafus, Americans Rush in to Broker to theWest." New York Times, August 8, 1994.
Cipriano, Ralph. "Shipyard Gets a Tenant in Bid to Turn Private.". Philadelphia Inquirer, May 26, 1994.
Dochat, Tom. "Wide Open Trade by U.S. Urged: Visitor PromotesCommerce Between State, European Community.1I HarrisburgPatriot News, November 10, 1993.
~101-
Ducan, Deb. "Our View: Exports Hold Economic Key for Growth."Valley News Dispatch, April 4, 1994.
Duoisin, Marc. "Russians Warm to Shipyard." Philadelphia Inquirer, April11, 1994.
Erlanger, Steven. "Now That Parliament's Gone, Can Yeltsin ReallyReform Russia's Economy?" New York Times, October 6, 1993.
______~. "Russia's Workers Pay Price as Military Industries Fade."New York Times, December 3, 1993.
______..,-. "Russia Lurches Funher along the Capitalist Road."New York Times, July 5, 1994.
Fedushak, Natalia. "Ukraine President Proposes Reforms to SaveEconomy." Wall Street Tournai, October 12, 1994.
Friedman, Thomas L. "Not Red, but Still a Bear." New York Times,February 28, 1994.
Gleason, Jerry L. "Ben Franklin Partnership Grants Awarded."Harrisburg Patriot News, August 6, 1994.
Glenny, Misha. "Ukraine's Great Divide." New York Times, July 15, 1994.
Gnoffo, Anthony, Jr. "Unisys Lands a $127 Million Russian Contract."Philadelphia Inquirer, March 11, 1994.
Goldman, Marshall 1. "Do Business in Russia? For Now, No." New YorkTimes, August 7, 1994.
Gordon, Michael R. "As Its World View Narrows, Russia Seeks a NewMission." New York TImes, November 29, 1993.
_ .........~~~~. "Perry Says Caution Is Vital to Russian Partnership."New York Times, March 15, 1994.
Greenhouse, Steven. "Russia and NATO Agree to Closer Military Links."New York Times, June 23, 1994.
-102-
Harrisburg Patriot News. "Outside Evaluation: State Makes Economic. Honor Roll." May 26, 1994.
___.,.--__.. "Economic Rejoinder: State Ranks High in BusinessClimate, Says Assessment of Development Assets." May 29, 1994.
Hershey, Robert D., Jr. "Export Fall Broadens Trade Gap." New YorkTImes, March 23, 1994.
Holcomb, Henry J. "Shipyard Proposal Picks up Some Steam."Philadelphia Inquirer, March 25, 1994.
______. "Casey Selects 4 to Serve on New Waterfront Board."Philadelphia Inquirer, April 14, 1994.
"Learning Pitfalls of Foreign Trade." PhiladelphiaInquirer, June 20, 1994.
"U.S. To Offer Export Help at a Center Here."Philadelphia Inquirer, July 29, 1994.
"Chilean Fruit Imports Down 19 Percent Here."Philadelphia Inquirer, August 5, 1994.
Ignatius, Adi. "Pragmatic Pair: Yeltsin Holds the Line for Reform withHelp from an Old Critic." Wall Street [oumal, March 23, 1994.
.. "Russian Software Firms Look Overseas." Wall Street----~~
Joumal, July 8, 1994.
Johnston, David. "Group to Foster Trade with Nonhern Europe."Philadelphia Inquirer, May 1, 1994.
Knox, Andrea. "Penna. Supplies the World." Philadelphia Inquirer,August 3, 1994.
New York Times. "Russian Aid Is Put at Risk over New Taxes on Loans."May 2, 1994.
Newman, Barry. "Disappearing Act: West Pledged Billions of Aid toPoland -- Where Did it All Go?" New York TImes, February 23,1994.
-103-·

__-=:-----:--:--~ "Prague's Progress: Czech Republic Makes a SmoothTransition to Ways of the West." Wall Street Tournal,July 6, 1994.
Philadelphia Inquirer. "Want to Do Big Business in Other Lands?" June20, 1994. "
Possehl, Suzanne. "A Russian Heavy Industry Strains to Become Flexible."New York Times, April 9, 1994.
Raphael, Therese. "Unstoppable Reform in Russia." Wall Street TournaI,January 18, 1994.
Rubin, Trudy. '7he Good, Bad and Ugly in the Ex-Soviet Union: TheWest Must Help Privatize Russian Firms." Philadelphia Inquirer,July 7, 1994.
Schmemann, Serge. "Russia's Military: A Shriveled and Volatile Legacy."New York TImes, November 28, 1993.
Simons, Marlise. "East Europe Sniffs Freedom's Air, and Gasps." NewYork Times, November 3, 1994.
Solomon, Caleb. "''Texaco, Partners Plan to Develop Arctic Fields." WallStreet TDumal, April 12, 1994.
Speeter, Michael. 'jRussia Promises Budget Curb to Win a Loan of $1.5Billion." New York Times, March 23, 1994.
__~~~~. "Far North in Russia, the Mines' Fatal Blight." NewYork Times, March 28, 1994.
______,. "Soaring Unemploymen"t Is Spreading Fear in Russia."New York Times, May 8, 1994.
"Azerbaijan, Potentially Rich, Is Impoverished byWarfare." New York Times, June 2, 1994.
"A Russian Pyramid Collapses, Burying Belief inCapitalism." New York Times, July 28, 1994.
Stevenson, Richard W. "Russia's Arms Makers Try Change." New YorkTimes, May 2, 1994.
-104-
Thomas, Paulette. "Trade Deficit Grew in January from December." WallStreet Tournai, March 23, 1994.
Tucker, Neely. "On the Warsaw Stock Exchange, Volatility Is the Nameof the Game." Philadelphia Inquirer, September 6, 1994.
Turner, David I. "Teaching Russians the Ins and Outs of AmericanCapitalism." Philadelphia Inquirer, June 20, 1994.
Valley News Dispatch. "We Must Work at Bringing Jobs to Valley." May26, 1994.
Wall Street TournaI. "Russia to Allow Land Ownership." October 21,1993.
Whitney, Craig R. "Russia Opens up Market, but Few Have the Money."New York Times, November 18, 1993.
__-:==--_--::'_. "East Europe's Hard Path to New Day." New YorkTimes, September 30, 1994.
York (Pa.) Daily Record. "Pa. Can Create Better Export Record -- theUrban Institute Cites Manufacturing Diversity as an UnusedStrength." August 19, 1993.
Zoblin, Nikolai. '''The Mafiacracy Takes Over." New York Times, July 26,1994.
MAGAZINES
Baker, Stephen. ''Top of the News: Suddenly, There's AluminumEverywhere." Business Week, 25 October, 1993.
Business Week. "International Outlook: Will Ye1tsin Get the Parliamentof His Dreams?" 6 December, 1993.
Challenge. "Cohesion -- The Challenge Now Is to Combine a Wellfunctioning Intergovernmental Financial System with Other PolicyInstruments." November-December, 1993.
-105-
Corwin,Julie and Douglas Stanglin. ''The Looting ofRussia: The CountryIs a Vast Bazaar in Which the Easiest Way to Get Rich Is to Steal."U.S. News & World Report, 7 March, 1994.
Cowley, Andrew. "Ukraine: The Birth and Possible Death of a Country."The Economist, 7 May, 1994.
Duffy, Brian and Jeff Trimble. ''The Wise Guys of Russia: MafialikeOrganized-crime Groups Prey on a Vast Country -- and moveinto America." U.S. News & World Report, 7 March 1994.
Economist. "Russia's Struggle: Can They Make a Democracy?" 2 October,1993.
"Bessarabian Homesick Blues." 30 October, 1993.
______--. "Ex-Yugoslavia: Upfjord, No Paddle Yet." 30 October,1993.
"Russian Farm Land: Europe's Once and FutureGranary." 30 October, 1993.
"Your Policy or Mine?" 30 October, 1993.
______. "Mess in Moscow." 29 January, 1994.
"Anatomy of the Beast: Ukraine Has Not Yet Taken aSingle Basic Decision about Economic Reform. Why Not?" 7 May,1994.
___..,.-"._~.• "Fault Lines: If Ukraine Breaks Up, There Will BeViolence." 7 May, 1994.
______. "How to Wreck an Economy: Ukraine Is a Case Studyof How .Not to Refonn an Economy." 7 May, 1994.
__~~_-=-' "Mythic State: Ukraine Is an Ambitious Project inNation-building, Which Has Yet to Prove.!t Can Succeed." 7 May,1994.
"Wanted: A Leader -- Change Is Inevitable inUkraine -- But It Might Not Be for the Better." 7 May, 1994.
... 106-
___~__• "Where the Wild Things Are: One Thing Can StopUkraine from Falling Apart - - Economic Growth." 7 May, 1994.
______. "Oil Pipelines: No Way Out." 28 May, 1994.
Galuszka, Peter. "International Outlook: In Moscow, It's the Day of theGenerals." Business Week, 25 October, 1993.
__~~_~_' Juliette Rossant and John Rossant. "Exxon of theSteppes?: Russia's Lukoil Is Pushing its Way into Gigantic OilProjects." Business Week, 14 March, 1994.
_____~-. "It's like Climbing the Himalayas': Can a Russian-bornHarvard MBA Save a Decrepit Tractor Factory?" Business Week, 2May, 1994.
"Toss Another Match into the Russian Tinderbox:Labor." Business Week, 6 June, 1994.
Hartman, Curtis. "Adventures in Carpetbagging. The Quest: To Turn$100,000 into $10 Million ... In Siberia." Worth, June, 1994.
Hofheinz, Paul. "Europe: Rising in Russia -- Chaos Continues toIncrease, but So Does Western Investment. Despite Great Risks,Companies Large and Small Still See an Ultimate Payout~" Fortune,24 January, 1994.
Karatnycky, Adrian. "Rumblings in the Ex-Soviet Bloc: How the EastWas Lost." National Review, 27 June, 1994.
Klein, Joe. "Primal Enterprise: Prosperity Is Seeping Slowly, Spottily, tothe Masses." Newsweek, 11 July, 1994.
Medvedev, Zhores A "Russia's Oil: Temporary Problems or TerminalCrisis?" Challenge, May-June 1994.
Newsweek. "Russia: Capitalism -- Or a Con Game?" 8 August, 1994.
Nortone, Rob. "Strategies for the Export Boom. America's Big ExportersAre Striking it Rich Overseas - - And So Are Thousands ofSmallerEntrepreneurs. Here's How They're Doing it." Fortune, 22 August,1994.
-107-
Powell, Scott and Bibi Kasrai. "A Guide to the New East." Euromoney(supplement) February, 1992. . .
Rodrik, Dani. "Foreign Trade in Eastern Europe's Transition: EarlyResults, Working Paper 4064." National Bureau· of EconomicResearch, May, 1992.
Rossant, Juliette and Peter Galuszka. "International Outlook: Why theWest May Come up Empty ina Monster Oil Patch." Business Week,30 May, 1994.
Sachs, Jeffrey. ''Toward Glasnost in the IMF: The Solution for the RussianEconomy Is Not to Drop the IMFs Goal of Low Inflation, but toDesign a Framework of Assistance to Help Achieve That Goal."Challenge, May-June 1994.
Specter, Michael. ''The Great Russia Will Live Again." New York TimesMagazine, 19 June, 1994.
State Legislatures: National Conference of State Legislatures. "Invisible·Export:· Foreign Tourists Bring Lots of Fresh Currency into thisCountry, and States Are Experimenting with All Kinds of Lures toAttract Them and It." December, 1993.
State Legislatures: National Conferen~e ofState Legislatures. "Statestats:U.S. Leads the World in Worker Productivity." July, 1994.
Wallich, Christine I. and Ritu Nayyar. "Russia's Intergovernmental FiscalRelations: A Key to National Cohesion." Challenge, NovemberDecember, 1993.
Watson, Russell, Dorinda Elliot, Andrew Nagorski and Betsy McKay."Yeltsin's Coup De Grace. Russia: Will His Power Play SaveDemocracy -- or Just Lead to More Chaos?" Newsweek, 4October, 1993.
Zang, Z. K. And L. Alan Winters. ''The Trading Potential of EasternEurope." Journal of Economic Integration, Autumn 1994.
-108-