Mid-term Management Plan
45
Mid-term Management Plan FY 4/2023 (ending April 30, 2023) to FY 4/2025 (ending April 30, 2025) June 10, 2022
-
Upload
khangminh22 -
Category
Documents
-
view
0 -
download
0
Transcript of Mid-term Management Plan

Mid-term Management PlanFY 4/2023 (ending April 30, 2023) to FY 4/2025 (ending April 30, 2025)
June 10, 2022

2
Executive Summary
As companies both within and outside Japan reevaluate the importance of DX, the Company projects
that the EC Business and the Financial Business will expand further.
The Company will create sales gains across all businesses by riding this large wave.
We will strive for balanced growth that will allow more investment into our businesses on the
back of high marginal income ratios while improving operating margin.
1. Further Expanding Market
2. Expanding Market Share
3. Improving Margin
COVID-19 has greatly increased the number of customer contacts. The Company will expand market
share, improving LTV by ensuring that customer contacts are not transitory and yield continued use.
(C) 2022 RACCOON HOLDINGS, Inc. 3
About Raccoon Group

(C) 2022 RACCOON HOLDINGS, Inc.
Value Created to Date
Founded in 1993 with 1 million yen, the Company has continued to grow by pioneering new and
efficient distribution systems as an alternative to the “information,” “settlement,” and “logistics”
functions of wholesalers.
FY 4/2020FY 4/2017FY 4/2010FY 4/2002
* Figures for FY 4/2013 and earlier have been recalculated for reference purposes to conform to current net sales calculationsNet sales
Financial Business
FY 4/1993 FY 4/2006
Founded
ListedListed on the
Tokyo Stock
Exchange
FY 4/1998
E-Commerce Business
Inter-company credit settlement
BtoB marketplace
4
Service starts in May 2009 as SD Payment
Rent liability guarantee
Online Receivables Guarantee
First in industry
Excess inventory sales
Group Overall

(C) 2022 RACCOON HOLDINGS, Inc.
Significance of Raccoon Group’s Existence
5
Raccoon Group Corporate Philosophy
Stocking
Payment
Sales
Accounting
Issues for SMEs
Close store to attend
exhibitions & wholesalers
Strict conditions such as
advance payment
Wholesale transactions with 3,000
companies online
Combined credit settlement for
multiple companies at once
Unable to conduct
nationwide sales
Manual invoicing and
payment management Freed from invoicing work
Branch out to small regional stores
Credit management
Risk of nonpayment by
business partners
Expand business partners with no risk of
nonpayment
Selling companies
(manufacturers, etc.)
Buying companies
(retail stores, etc.)
RACCOON’s services
Making corporate activities more efficient and convenientCreate business infrastructure for SMEs that allows even small new companies to succeed in the shortest possible time by making the right efforts
Group Overall

(C) 2022 RACCOON HOLDINGS, Inc.
Raccoon Group’s Strengths
6
Provide BtoB services suited to the times based on an understanding of customers and
the industry and through use of proprietary data foundations
3 Strengths
Understanding
customers
Utilizing
technology
Data assets
Data not found with competitors such as
user data, credit data, transaction data,
proprietary research, etc.
Power to utilize technology
suited to the times
Deep understanding of the
newest customer needs,
business practices and
industry knowledge
Group Overall
(C) 2022 RACCOON HOLDINGS, Inc.
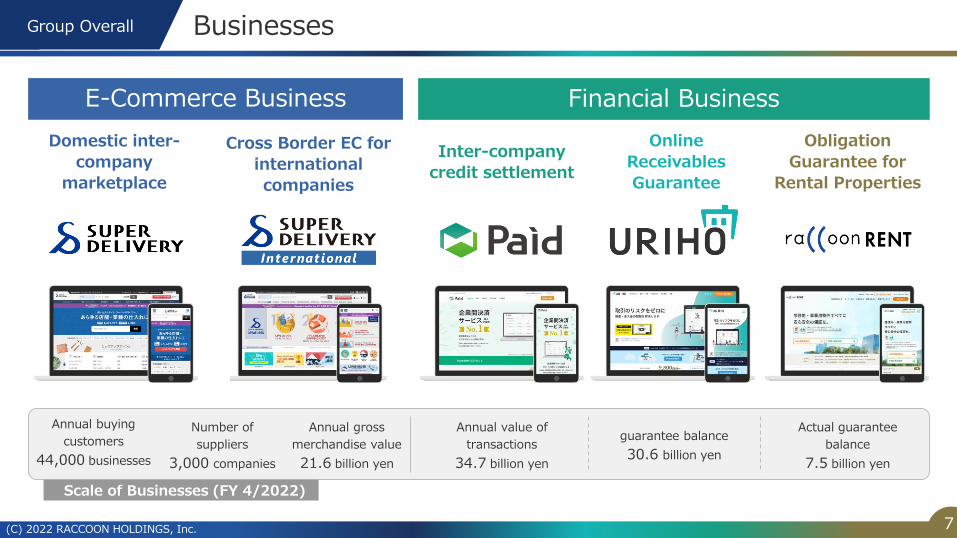
Businesses
7
Domestic inter-
company
marketplace
Online
Receivables
Guarantee
Inter-company
credit settlement
E-Commerce Business Financial Business
Obligation
Guarantee for
Rental Properties
Cross Border EC for
international
companies
Annual buying
customers
44,000 businesses
Number of
suppliers
3,000 companies
Annual gross
merchandise value
21.6 billion yen
guarantee balance
30.6 billion yen
Actual guarantee
balance
7.5 billion yen
Annual value of
transactions
34.7 billion yen
Scale of Businesses (FY 4/2022)
Group Overall

(C) 2022 RACCOON HOLDINGS, Inc.
Future Vision & Position of the Mid-Term Management Plan
• Growth in each business due to increase in new customers despite effects of COVID-19
• Focus investment into existing businesses during Mid-Term Management Plan period to take
advantage of newly acquired customer base
Achieve No.1 in existing businesses & create new future No.1 businesses
No.1 in market for existingbusinesses
8
Creation of
new No.1businesses
Future VisionMid-Term PlanPeriod
COVID-19Business Creation Period
FY 4/2022 FY 4/2025FY 4/2020
Creation of business
* Lifetime Value
Creating business infrastructure that allows small new companies to succeed in the shortest possible time
Improve customer
LTV*
Customer expansionthrough DX opportunities
Group Overall

(C) 2022 RACCOON HOLDINGS, Inc. 9
Mid-term Management Plan Summary

(C) 2022 RACCOON HOLDINGS, Inc.
Theme of the Mid-term Management Plan
10
We will strive for sustainable business growth by concentrating
investment into existing businesses and increasing LTV to develop the
increased membership in the midst of COVID-19 into a solid customer base.
Sustainable business growth by
improving LTV
From Breadth to Depth
Group Overall

(C) 2022 RACCOON HOLDINGS, Inc.
Mid-term Business Targets for Key Indices
• Aim to improve operating income margin while investing in growth against backdrop of high
marginal income ratio (over 70%)
• Assertive shareholder returns with a goal of 25% ROE
Fiscal year ended April 30, 2022
(results)
Fiscal year ending April 30, 2025
(planned)
Growth rate
Net sales4,789
million yen➡
7,700 million yen
CAGR
+17%
Operating income
1,126million yen
➡2,310
million yenCAGR
+27%
Operating income margin
23.5% ➡ 30.0% +6.5pt
ROE 6.7%*1
(13.6% excluding extraordinary losses)
➡ 25.0%+18.3p
t(+11.4pt)
*1 Temporary decline in ROE due to impairment of investment securities and goodwill
2,950
4,598
599
986
814
1,511
427
605
4.7 billionyen
7.7 billion yen
CAGR+17%
62%Composition
ratio
40%Composition
ratio
60%Composition
ratio
(C) 2022 RACCOON HOLDINGS, Inc. 11
Breakdownof net salesUnit: million yen
Sales growth in all businesses. Operating income growth of CAGR+27% by improving margin
ECBusiness
Financial Business
Group Overall
Fiscal year ended April 30, 2022 (results)
Fiscal year ending April 30, 2025 (planned)
38%Composition
ratio

(C) 2022 RACCOON HOLDINGS, Inc.
Profit Structure that Increases Operating Margin
• Increase in SG&A expenses such as labor costs are not linked to sales and show moderate rise due to
systemization
• Plans to increase operating income margin while making aggressive investment for growth during the Mid-
Term Management Plan period
Profit structure in which net sales and SG&A expenses are not in proportion and operating income margin tends to increase
12
Group Overall
0%
5%
10%
15%
20%
25%
30%
To operating income margin of
30%
SG&A
Net sales
Operating income margin
Mid-term Management Plan period

(C) 2022 RACCOON HOLDINGS, Inc.
Continuously Growing Market
• Increase in companies preparing for digital shift and credit concerns due to COVID-19
• Upward trend is expected to continue, increase in future penetration rates predicted as a result
Both businesses have low penetration rate despite large market, but expansion is predicted
13
Financial BusinessE-Commerce Business
Results amid COVID-192019→2022
Old transactions methods
(sales/phone/FAX) remain; BtoB EC
ratio is low (5.1%) compared to BtoC
(22.2%)
Digitalization to increase BtoB
transaction efficiency continues,
increase in EC ratio to BtoC levels
predicted
Apparel & goods
wholesale market
38
trillion yen
Buying
customers
2.1x
Number of
suppliers
2.2x
GMV
1.9x
Paid transaction
volume
1.6x
Receivables
guarantee balance
2.3x
Rent guarantee
balance
1.3x
Majority of BtoB companies conduct
account receivable transactions, but
awareness of receivables guarantee
services is low, 1.0% penetration rate
Awareness rose due to credit
concerns during COVID-19 & work
DX, rise in penetration rate will
continue
Wholesale EC ratio5.1%
BtoB account
receivable balance
182
trillion yen
Receivables guarantee penetration rate
1.0%
Results amid COVID-192019→2022
Group Overall
(C) 2022 RACCOON HOLDINGS, Inc.
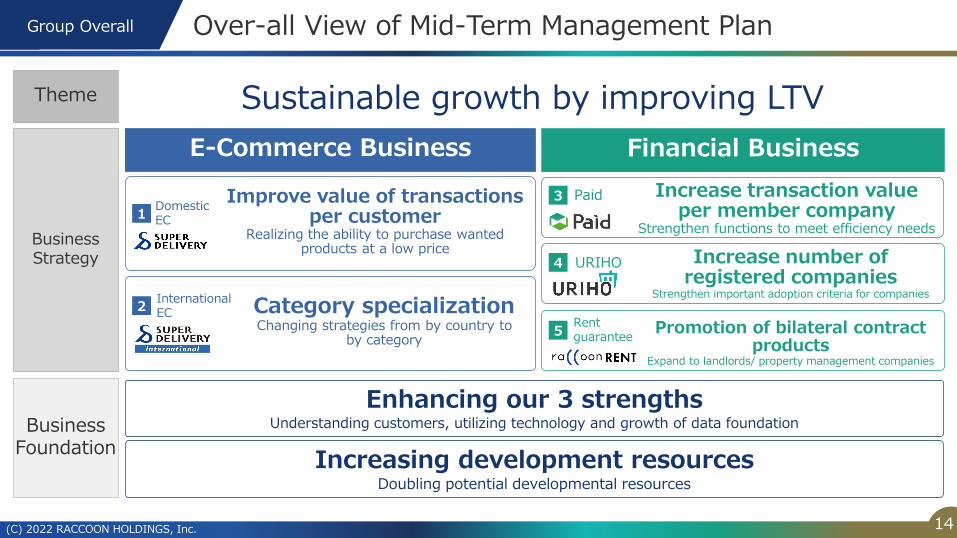
Over-all View of Mid-Term Management Plan
14
Business Foundation
Business Strategy
Theme Sustainable growth by improving LTV
Increase number of registered companies
Strengthen important adoption criteria for companies
Increase transaction value per member company
Strengthen functions to meet efficiency needs
Financial BusinessE-Commerce Business
3
4
Promotion of bilateral contract products
Expand to landlords/ property management companies
5
Paid
URIHO
Enhancing our 3 strengthsUnderstanding customers, utilizing technology and growth of data foundation
Increasing development resourcesDoubling potential developmental resources
Category specialization Changing strategies from by country to
by category
Improve value of transactions per customer
Realizing the ability to purchase wanted products at a low price
DomesticEC
InternationalEC
1
2Rentguarantee
Group Overall

(C) 2022 RACCOON HOLDINGS, Inc. 15
Business Strategy

(C) 2022 RACCOON HOLDINGS, Inc. 16
EC Business:
Domestic
46%
Net sales composition: FY 4/2022(ended April 30, 2022)
BtoB marketplace for wholesale transactions between
manufacturers, retailers and service industry, etc.
Category specialization strategy
Improve value of transactions per customer
1
2
SUPER DELIVERY (SD)
Domestic
International

(C) 2022 RACCOON HOLDINGS, Inc.
Summary of Business Structure and Environment
Pursuing sales growth by increasing value of transactions per customer backed by growing market due to the progression of digital shift
17
Business Structure Business Environment
Net sales
Gross merchandise
value (GMV)
Take rate
Share among customers
Value of transactions per buying customer
No. of buying customers
×
×
×
Domestic market is level
Value of transactions perbuying customer is level
Aim for rise in proportion of purchases from SD
Increase due to digital shift
Wholesale market scale
EC ratio
×
Increase due to digital shift
Fixed revenue
Fluctuating revenue
Shift due to change in registration plan fees
Current plans have free basic fee +10~15% commission+
Take rate increasing,while fixed revenue is decreasing
Outlook
Priority
EC Business: Domestic

(C) 2022 RACCOON HOLDINGS, Inc. 18
Target Market (EC Wholesale for Small Enterprises)
• With the digital shift, BtoB’s EC ratio estimated to grow 20+%, on par with BtoC
• The EC wholesale market is expected to grow into a 1 trillion yen market
*1 Wholesale market size: Market size calculated based on amount of purchased good by retail trade industry, from 2020 Economic Conditions Survey, 2016 Economic Census, Basic Survey on Commercial and Manufacturing Structure and Activities (all by the Ministry of Economy, Trade and Industry); “small” pertains to “less than 4 employees”
*2 Means of sale: Based on the sales proportion by wholesale means of sale in in “BtoB-EC Market: Current Situation & Future Prospects 2022” (survey by Impress Corporation). EC includes in-house EC, BtoB malls and wholesale purchases through BtoC malls
*3 BtoC EC ratio: Calculated by the Company based on BtoC EC ratio for relevant genres in “FY2020 E-Commerce Market Survey ” (Ministry of Economy, Trade and Industry)
Current EC WholesaleMarket Size *1
250.0 billion yen
38trillion yen
Apparel & general goods
wholesale market
Percentage for
small enterprises
(4 persons or less)
Wholesale EC ratio
×
13%
5.1%
×
BtoB wholesale means of sale *2
Driver of Market Growth: EC ratio
Outlook for EC ratio and the market
20+%
EC ratio
to 1 trillion yen
EC wholesale market
Reference: BtoC EC ratio *3 for
Apparel & goods 22.2%( 2020 )
EC5.1%
In-personsales
Phone, e-mail, FAX
EDI
Exhibitionorders
EC Business: Domestic
EC ratio of in-house EC and malls combined in 5.1% for BtoB wholesale, with more potential for growth

(C) 2022 RACCOON HOLDINGS, Inc. 19
Business Conditions of Super Delivery (Domestic)
• Steady increase in number of buying customers as a result of expanding needs due to COVID-19
and aggressive investment into advertising
• Average sale per customer remains level when excluding special demand for masks, etc. due to
COVID-19, however there is much potential for expanding purchases from SD
Value of transactions per customer
Level trend continues
Number of buying customersBoth new and repeat customers
increased in the midst of COVID-19
New customers
Repeat customers
Purchasing ratio by SD
customers
At 20%, there is growth potential
Value of Transactions per CustomerNumber of Buying Customers
* Survey for SD members (conducted FY 4/2022, n=602)
Other than retail trade
Retail tradeSD
20%
Other ECs
ManufacturersWholesale stores
Other
EC Business: Domestic

(C) 2022 RACCOON HOLDINGS, Inc.
Priority Measures
• Double promotional investment and use points systems and coupons to increase value of
transactions per buying customer
• Assign a merchandiser (MD) for each product category to increase in-demand products
• Utilize AI based on behavioral data to promote website personalization
Increase rate of SD purchases by customers and aim to improve value of transactions per customer
Cost
needs
Product
needs
* Based on survey of SD members (conducted 4/2022, n=929)
Responding to Product NeedsFind products you want
Increase in-demand products by assigning MDs
Personalizing website
Responding to Cost NeedsRealize low costs through promotional investment
Increase return rate of points
program
Distribute shipping coupons to
increase new purchases
TOP 5 Customer Needs Requests to improve SD
20
15%
14%
Product findability
Product information
32%
19%
17%
Shipping
Sales/campaigns
Product prices
EC Business: Domestic

(C) 2022 RACCOON HOLDINGS, Inc. 21
EC Business:
International
Net sales composition: FY 4/2022(ended April 30, 2022)
16%
BtoB marketplace for hassle-free, risk-free
wholesale transactions between manufacturers and
international businesses
SD export
Category specialization strategy
Improve value of transactions per customer
2 International
Domestic1

(C) 2022 RACCOON HOLDINGS, Inc. 22
Business Structure and Strategic Priority Measures
The Company implemented a category strategy to increase buying customers and SD ratio one
category at a time
SD market share
×
Repeated increase/decrease in multi-year cycles
Differs by categoryIncrease share starting from stronger
categories
Upward trend of borderlessEC users
due to travel restrictions
Affected by change in business registration plan
Global trade market
Ratio of exports from
Japan
×Varying increase/decrease by
category
Business Structure
Net sales
Gross merchandise
value(GMV)
Take rate
Value of transactions per buying customer
No. of buying customers
×
×
Fixed revenue
Fluctuating revenue
+Take rate is increasing, fixed revenue
on downward trend
Priority
Priority
Business Environment Outlook
EC Business:
International

(C) 2022 RACCOON HOLDINGS, Inc. 23
Target Market
• The Company previously strategized by country, but will shift to a categoric strategy in consideration of country risks
• Become No.1 one category at a time, aiming to become the future No.1 service in exports
Target Market forSD International *1
1.4 trillion yen
Export market size of
global consumer goods
Export market size of
consumer goods from Japan
Ratio of current SD
item categories
Strategy by Category to increase SD’s Share
Health &
cosmetics
Fashion
Hobby, leisure
and sportsFurniture
Stationary/crafts
Electronics
Dishes and
kitchen area
Books
Other general goods
Roadmap to increase SD’s share
No.1 in exports from Japan
No.1 in exports in many categories
No.1 in exports in specific categories
*1 Export market size: Calculated by the value of Consumer Goods exports in 2019 from WITS (World Integrated Trade Solution). Converted at 130 yen to the U.S. dollar.
*2 Export amount by category: Estimated value calculated as the ratio of export value excluding “Export to affiliates” out of “Value of goods exported international” in “Ministry of Economy, Trade and Industry Basic Survey of Japanese Business Structure and Activities” (2021)
Export amount by category *2
1.4trillion
yen
856trillion yen
×
2.8%
5.8%
×
EC Business:
International
Japan’s export market is 1.4 trillion yen, even when only accounting for products handled on SD

(C) 2022 RACCOON HOLDINGS, Inc.
Priority Measures
• Expand range of “Japan brands” through cooperation with local governments
• Adopt DeepL for translation to display the correct language for each country
• Realize low prices and shipping costs through promotional investment and cooperation with
international logistics companies
First, strive for No.1 in exports from Japan in specific product categories
Responding to need for low pricesBecoming a low-price, easy-to-use website
Reduce shipping costs
Cooperation with international logistics
companies
Doubling promotional investment
Use of points/coupons
Strengthening specific categoriesShow the world the attractiveness of Japanese products
“Japan Brand”Cooperation with local
governments
Improve translation accuracy
Adopt DeepL
Top 5 Criteria by international Customers for Selecting Suppliers
* Based on survey of SD international members (conducted FY 4/2022, n=210)
24
58%
53%
Fast delivery time
Many product types
79%
73%
70%
Reliability
Low purchase price
Low shipping costs
EC Business:
International
(C) 2022 RACCOON HOLDINGS, Inc. 25
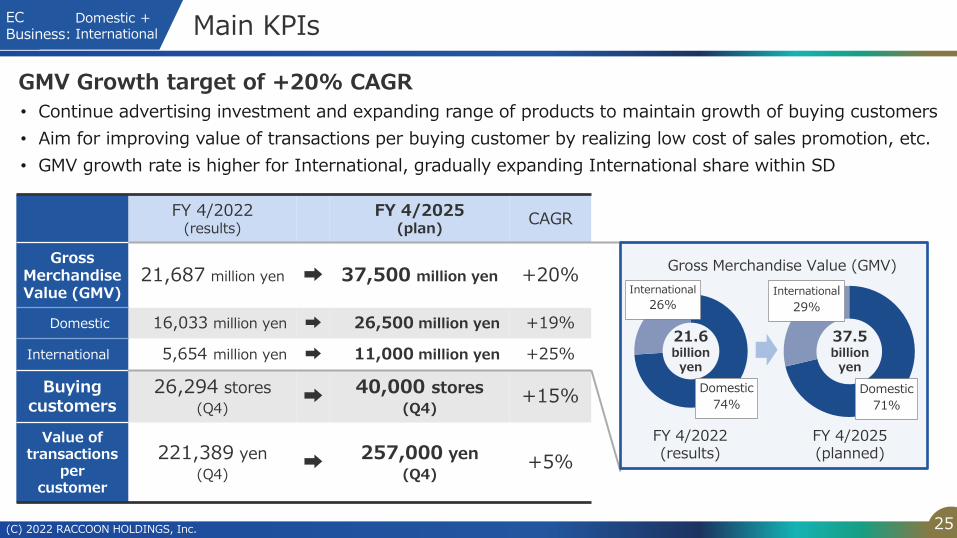
Main KPIs
• Continue advertising investment and expanding range of products to maintain growth of buying customers
• Aim for improving value of transactions per buying customer by realizing low cost of sales promotion, etc.
• GMV growth rate is higher for International, gradually expanding International share within SD
GMV Growth target of +20% CAGR
FY 4/2022(results)
FY 4/2025(plan)
CAGR
Gross Merchandise Value (GMV)
21,687 million yen ➡ 37,500 million yen +20%
Domestic 16,033 million yen ➡ 26,500 million yen +19%
International 5,654 million yen ➡ 11,000 million yen +25%
Buying customers
26,294 stores
(Q4)➡ 40,000 stores
(Q4)+15%
Value of transactions
per customer
221,389 yen
(Q4)➡ 257,000 yen
(Q4)+5%
Domestic
74%
International
26%
Domestic
71%
International
29%
FY 4/2022(results)
FY 4/2025(planned)
Gross Merchandise Value (GMV)
21.6billionyen
37.5billionyen
Domestic +International
EC Business:

(C) 2022 RACCOON HOLDINGS, Inc. 26
Financial Business: Paid
12%
Net sales composition: FY 4/2022(ended April 30, 2022)
A deferred payment service between enterprises
that can eliminate the time and energy used to
collect bills and the risk of uncollected bills
Increase number of registered companies
Increase transaction value per member company3
4
Promotion of bilateral contract products
5 Rentguarantee
Paid
URIHO
Paid
(C) 2022 RACCOON HOLDINGS, Inc.
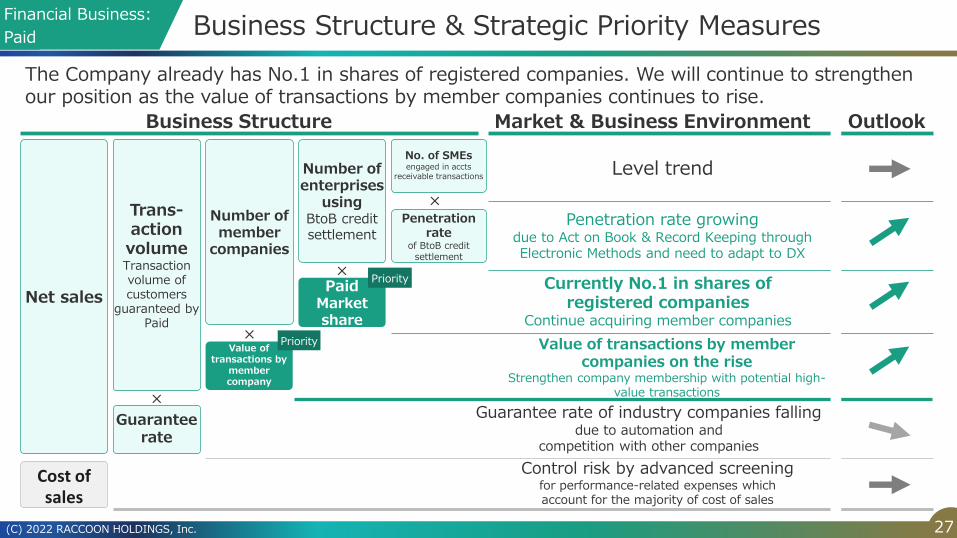
Business Structure & Strategic Priority Measures
The Company already has No.1 in shares of registered companies. We will continue to strengthen our position as the value of transactions by member companies continues to rise.
27
Business Structure Market & Business Environment
Value of transactions by member companies on the rise
Strengthen company membership with potential high-value transactions
Currently No.1 in shares of registered companies
Continue acquiring member companies
Penetration rate growingdue to Act on Book & Record Keeping throughElectronic Methods and need to adapt to DX
Level trend
Guarantee rate of industry companies fallingdue to automation and
competition with other companies
Control risk by advanced screeningfor performance-related expenses whichaccount for the majority of cost of sales
Net sales
Trans-action volumeTransaction volume of customers
guaranteed by Paid
Guarantee rate
×
No. of SMEsengaged in accts
receivable transactions
Penetration rate
of BtoB credit settlement
Value of transactions by
member company
PaidMarket share
Number of member
companies
Number of enterprises
usingBtoB credit settlement
×
×
×
Priority
Outlook
Priority
Cost of sales
Financial Business:
Paid

(C) 2022 RACCOON HOLDINGS, Inc. 28
Market & Business Environment
• We lead the industry in member companies with a 48% share of the market
• Value of transactions per member company are high and growing in certain business types with a high proportion of Paid customers
*1 The Company s estimated invoiced payment amount out of annual inter-company transactions of small and medium enterprises, based on data from “Basic Survey on Small and Medium Enterprises” (Small and Medium Enterprise Agency) on accounts receivable and notes receivable, accounting for annual turnover of receivables (Payment Terms Improvement Committee Report), private final consumption expenditure (Cabinet Office) and cashless payment rates (Ministry of Economy, Trade and Industry), etc.
*2 Japan Marketing Research Organization
Market share of member companies for BtoB credit settlement*2
Inter-company accounts receivable transaction volume by SMEs*1
Other transactions
53 trillion yen
Value of transactions by member companies on Paid
Q1 Q2 Q3 Q4 Q1 Q2 Q3 Q4 Q1 Q2 Q3 Q4
FY 4/2020 FY 4/2021 FY 4/2022
Certain business types
Other business types
(2020) (September 2021)
116 trillion yen
Accounts receivable transactions
Company C6%
Company B20%
Company A26%
48% share
Paid
No.1
Companiesusing such services
Financial Business:
Paid
Inter-company accounts receivable transactions among small and medium enterprises (SMEs) are large at 116 trillion yen with large potential for growth

(C) 2022 RACCOON HOLDINGS, Inc. 29
Priority Measures
Increase transaction value per member company by capturing certain business types, aim for No.1 in transaction volume in such segments
• Strengthen functions to meet efficiency needs such as screening pass rates, speed, efficiency
effects and guarantee limit to attract companies with high LTV
30%
29%
Reasonable usage fees
High approved amount
43%
34%
30%
High screening pass rate
Fast screening results
High efficiency/ DX effects
Top 5 Criteria to Increase Usage Amount on Paid
* Based on survey of Paid users and service termination survey (conducted 4/2022, n=185)
Strengthen functions to meet customers’ efficiency & DX needs
Screeningpass rate
+10%
Expand flexibility of
Guarantee limit
Efficiencyfunctions
Reduce screening documents, simplify
registration information
Screeningautomation
2 days 10 minutesAverage for certain eligible companies Certain eligible companies Certain business types
Financial Business:
Paid
(C) 2022 RACCOON HOLDINGS, Inc.
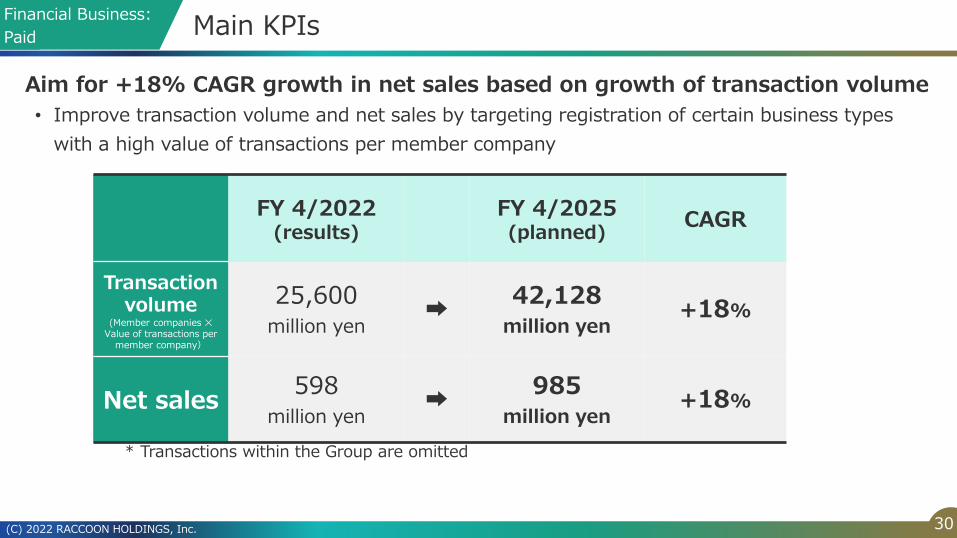
Main KPIs
Aim for +18% CAGR growth in net sales based on growth of transaction volume
FY 4/2022(results)
FY 4/2025(planned)
CAGR
Transaction volume
(Member companies ✕Value of transactions per
member company)
25,600million yen
➡42,128
million yen+18%
Net sales598
million yen➡
985million yen
+18%
* Transactions within the Group are omitted
• Improve transaction volume and net sales by targeting registration of certain business types
with a high value of transactions per member company
Financial Business:
Paid
30

(C) 2022 RACCOON HOLDINGS, Inc. 31
Financial Business: URIHO
17%
Net sales composition: FY 4/2022(ended April 30, 2022)
Online receivables guarantee service
for non-payment by business partners
Increase number of registered companies
Increase transaction value per member company
3
4
Promotion of bilateral contract products
5 RentGuarantee
Paid
URIHO
URIHO

(C) 2022 RACCOON HOLDINGS, Inc. 32
Integrating Brand Name for Accounts Receivables Guarantee Services
T&G Accounts Receivables Guarantee integrated brand name into “URIHO” in May 2022
From May 31, 2022
Plan A9,800 yen/month, 10 million yen
total guarantee
Plan B29,800 yen/month, 30 million yen
total guarantee
Plan C99,800 yen/month, 70 million yen
total guarantee
Fix
ed-ra
te sy
stem
Com
mon to
new
&
existin
g tra
nsactio
ns
Sales guarantee2% of the invoice amount,
guaranteed for the invoice amount
Threshold guarantee
59,800 yen/month, 30 million yen total
guarantee
*Continued availability for currently subscribed customers
Per
transa
ctio
n
New
tra
nsa
ctio
ns
Fix
ed-ra
te
syste
m
Curre
nt
transa
ctio
ns
N/A for new contracts
Brand nameintegrated
* Changed service name of
*
Financial Business:
URIHO

(C) 2022 RACCOON HOLDINGS, Inc.
Business Structure and Strategic Priority Measures
BtoB account receivable guarantee penetration rate is expected to grow; we will capture these needs through proactive contract acquisition
33
Business Structure Market & Business Environment
By capturing need for robust guarantees,
Guarantee amount on the rise
Assertive expansion of customer base
to meet the growing needs of a growing market
Due to increase in IT companies that conduct many transactions and the diversification of risks,
penetration rate is rising
Level trend
Rate for industry companies fallingdue to automation and
competition with other companies
Net sales
guarantee balance
total balance of obligations
guaranteed by URIHO
Rates
×
No. of SMEsconducting accounts
receivable transactions
BtoB accounts receivable guarantee
penetration rate
Guarantee amount
Cost of salesControl risk by advanced screening
for performance-related expenses whichaccount for the majority of cost of sales
URIHOMarket share
Registered enterprises
No. of Enterprises
using BtoB account
receivables guarantees
×
×
×
Priority
Outlook
Financial Business:
URIHO

(C) 2022 RACCOON HOLDINGS, Inc. 34
Market Environment
• Japan’s BtoB account receivable guarantee penetration rate is small at 1% with great growth potential
• With URIHO’s guarantee balance at 1% of the market, there is significant room for market share
expansion
* 1 Allied Market Research, “Trade Credit Insurance Market 2020-2027”
* 2 Estimated by the Company based on data on bills and accounts receivable from the “Financial Statements Statistics of Corporations by Industry” (Ministry of Finance), private final consumption expenditure (Cabinet Office) and cashless payment rates (Ministry of Economy, Trade and Industry), etc.
* 3 Estimated by the Company based on the Nikkei, “Total obligation of major accounts receivable guarantee companies” (December 11, 2020) and the General Insurance Association of Japan, “Statistics by line.”
(million USD)
9,390
18,140
2019 2027
CAGR +8.6%
Global transaction credit insurance premium market
projection*1(2020)
Domestic BtoB account receivables transactions*2
BtoB accountsreceivable balance
182trillion yen
BtoB accounts receivable guarantee penetration rate
1.0%(1.9 trillion yen)
(2020)
Domestic BtoB account receivables companies guarantee balance*3
URIHO
1.0% (18.9 billion yen)
Guarantee balanceof leading companies
1.9trillion yen
Financial Business:
URIHO
Both the Japan and global market is growing due to an increase in IT enterprises that conduct many transactions and the diversification of risk

(C) 2022 RACCOON HOLDINGS, Inc. 35
Priority Measures
• Strengthening screening pass rate, guarantee limit and screening speed to become the service of
choice when starting
• Improve customer satisfaction by providing risk information
Aim for No.1 in contracts by capturing increasing needs by market growth
* Based on survey for guarantee service users(conducted 4/2022, n=33)
Strengthening Important Starting Criteria
Screeningpass rate
+10%
Guarantee limitIncrease limit for
sole proprietors, etc.
Provide riskinformation
Strengthen functions
Screeningautomation
1.5 days 0.5 daysAverage for certaineligible companiesCertain eligible companies Certain eligible companies
URIHOorder-made plan
-14pt
-14pt
-5pt
-4pt
Scope, content of guarantee
Guarantee rate
Guarantee limit
Screening pass rate
URIHO69%69%
68%
65%63%
Scope, content of guarantee
Providing risk information
Guarantee rateScreening speed
* Based on survey for BtoB accounts receivable guarantee users(conducted 4/2022, n=301)
TOP 4 gaps in URIHOsatisfaction and importanceTop 5 purchasing criteria
Financial Business:
URIHO
Providing reminder functions

(C) 2022 RACCOON HOLDINGS, Inc. 36
Main KPIs
• Increase guarantee balance by adding more member companies, leading to growth in net
sales
Aim for growth of +32% CAGR for guarantee balance and +23% CAGR for net sales
FY 4/2022(results)
FY 4/2025(planned)
CAGR
Guarantee balance
(Number of member companies X
Guarantee amount)
30,755
million yen➡
70,000million yen
+32%
Net sales814
million yen➡
1,511million yen
+23%
Financial Business:
URIHO
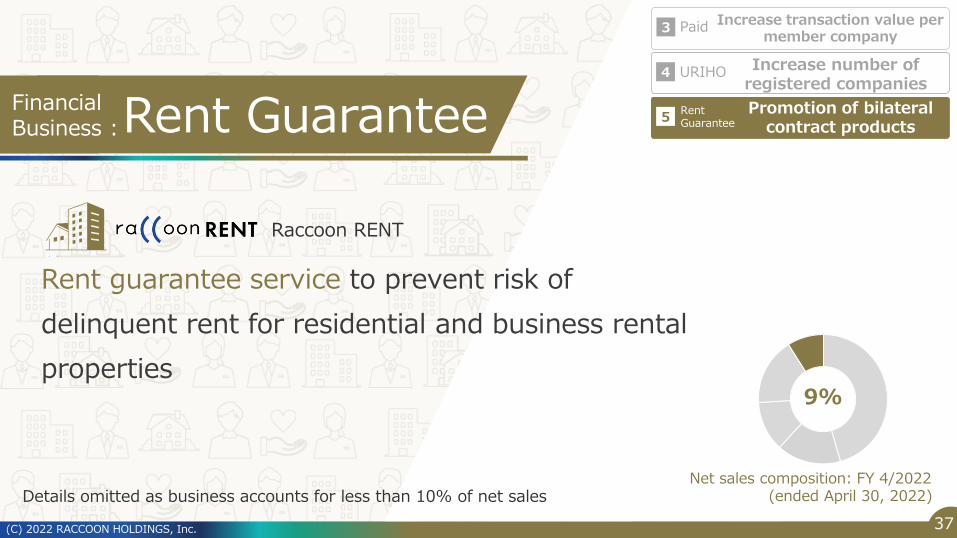
(C) 2022 RACCOON HOLDINGS, Inc. 37
Details omitted as business accounts for less than 10% of net sales
Rent Guarantee
9%
Rent guarantee service to prevent risk of
delinquent rent for residential and business rental
properties
Increase number of registered companies
4
Promotion of bilateral contract products
5
URIHO
Raccoon RENT
Net sales composition: FY 4/2022(ended April 30, 2022)
FinancialBusiness :
Increase transaction value per member company
3 Paid
RentGuarantee

(C) 2022 RACCOON HOLDINGS, Inc. 38
Investment & Shareholder Return Policy

(C) 2022 RACCOON HOLDINGS, Inc.
Investment & Shareholder Returns Policy
The Company’s policy is to actively offer shareholder returns while securing funds for
investment in future growth.
39
Investment & Shareholder Return Policy
Operatingcash flow
Approx. 4.0 billion yen*Cumulative total during period of Mid-term Management Plan
(Fiscal year ending April 30, 2023 to fiscal year ending April 30, 2025)
Shareholderreturns
Dividends
Share repurchases
Dividend payout ratio
45~50%
Flexible execution depending on share price
Future growth investments
Active investment into business foundations for each service
(C) 2022 RACCOON HOLDINGS, Inc.
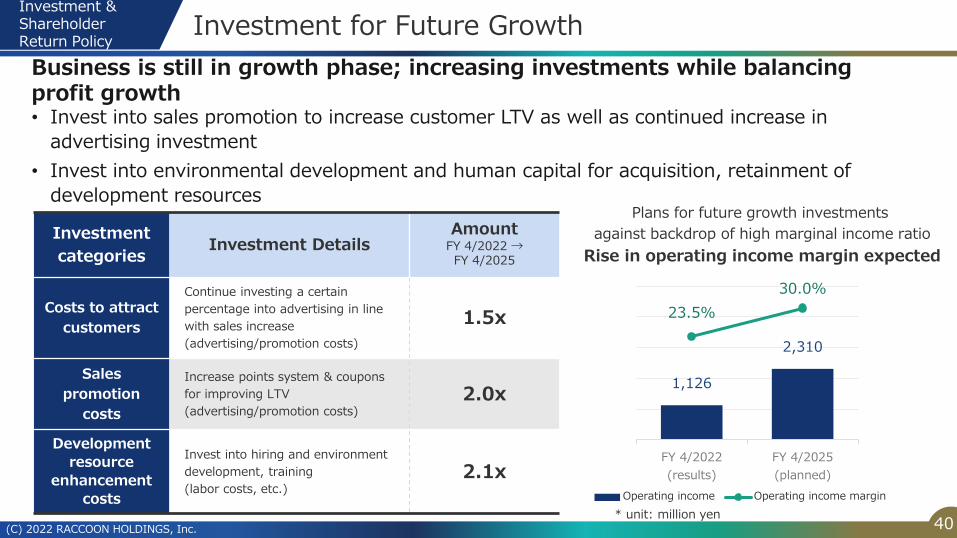
Investment for Future Growth
• Invest into sales promotion to increase customer LTV as well as continued increase in
advertising investment
• Invest into environmental development and human capital for acquisition, retainment of
development resources
Business is still in growth phase; increasing investments while balancing profit growth
40
Investment
categoriesInvestment Details
AmountFY 4/2022 → FY 4/2025
Costs to attract
customers
Continue investing a certain
percentage into advertising in line
with sales increase
(advertising/promotion costs)
1.5x
Sales
promotion
costs
Increase points system & coupons
for improving LTV
(advertising/promotion costs)
2.0x
Development
resource
enhancement
costs
Invest into hiring and environment
development, training
(labor costs, etc.)
2.1x
Plans for future growth investments
against backdrop of high marginal income ratio
Rise in operating income margin expected
* unit: million yen
1,126
2,310
23.5%
30.0%
FY 4/2022
(results)
FY 4/2025
(planned)
Operating income Operating income margin
Investment & Shareholder Return Policy

(C) 2022 RACCOON HOLDINGS, Inc.
ESG Information
41

(C) 2022 RACCOON HOLDINGS, Inc.
Basic Policy
Solving social issues through business
Making corporate activities more
efficient and convenient
Corporate Philosophy
Basic Sustainability Policy
42
ESG Information
Providing business infrastructure to support a wide range of transactions
We will strive to improve corporate value by appropriately managing and
minimizing risks inherent in our business operations and maximizing business
opportunities
Furthermore, we will contribute to the realization of a
sustainable global environment and society together with our stakeholders
(C) 2022 RACCOON HOLDINGS, Inc.
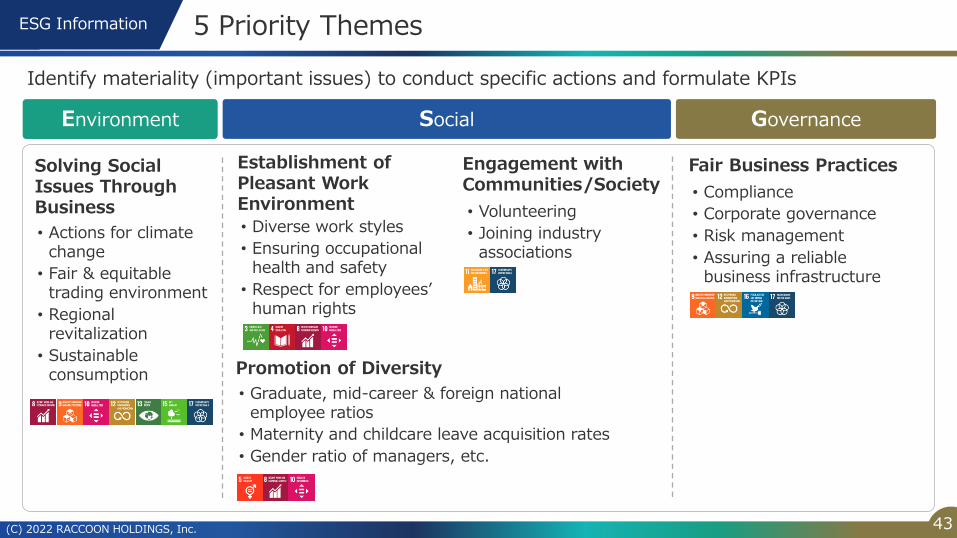
5 Priority Themes
Identify materiality (important issues) to conduct specific actions and formulate KPIs
43
ESG Information
Environment Social Governance
Establishment of Pleasant Work Environment
• Diverse work styles
• Ensuring occupational health and safety
• Respect for employees’ human rights
Promotion of Diversity
• Graduate, mid-career & foreign national employee ratios
• Maternity and childcare leave acquisition rates
• Gender ratio of managers, etc.
Engagement with Communities/Society
• Volunteering
• Joining industry associations
Fair Business Practices
• Compliance
• Corporate governance
• Risk management
• Assuring a reliable business infrastructure
Solving Social Issues Through Business
• Actions for climate change
• Fair & equitable trading environment
• Regional revitalization
• Sustainable consumption

44
Conclusion
Penetration of DX to increase wholesale EC ratio (5%) and receivables guarantees (1%),
resulting in forecast market growth of several times
In addition to expansion in number of customers, improve LTV (value per customer and
repeat purchase ratio) to plan for net sales growth of CAGR+17%
While increasing investment in each business that is in the growth phase, plan to improve
operating profit margin to 30% (+6.5pt) and grow operating income by CAGR+27%
1. Further Expanding Market
2. Expanding Market Share
3. Improving Margin

(C) 2022 RACCOON HOLDINGS, Inc. 45
Regarding handling of this material
Forward-looking statements contained in this document are based on
current information and are subject to change due to macroeconomic
trends, market conditions, trends in industries pertaining to the
Company, and other internal and external factors. The Company
makes no representation or warranty as to the accuracy or
completeness of the information contained herein.