Seven Years' Observation of Mid-Upper Tropospheric Methane from Atmospheric Infrared Sounder
22
Remote Sens. 2010, 2, 2509-2530; doi:10.3390/rs2112509 Remote Sensing ISSN 2072-4292 www.mdpi.com/journal/remotesensing Article Seven Years’ Observation of Mid-Upper Tropospheric Methane from Atmospheric Infrared Sounder Xiaozhen Xiong 1,2, *, Chris Barnet 2 , Eric Maddy 1,2 , Jennifer Wei 1,2 , Xingpin Liu 1,2 and Thomas S. Pagano 3 1 Dell Perot Systems Government Services, Fairfax, VA 22031, USA 2 Center for Satellite Applications and Research (STAR), National Environmental Satellite, Data, and Information Service (NESDIS), NOAA, Camp Springs, MD 20746, USA; E-Mails: [email protected] (C.B.); [email protected] (E.M.); [email protected] (J.W.); [email protected] (X.L.) 3 NASA/Jet Propulsion Laboratory, Pasadena, CA, USA; E-Mail: [email protected] * Author to whom correspondence should be addressed; E-Mail: [email protected]; Tel.: +1-301-316-5020; Fax: +1-301-238-2398. Received: 20 September 2010; in revised form: 28 October 2010 / Accepted: 5 November 2010 / Published: 9 November 2010 Abstract: The Atmospheric Infrared Sounder (AIRS) on EOS/Aqua platform provides a measurement of global methane (CH 4 ) in the mid-upper troposphere since September, 2002. As a thermal infrared sounder, the most sensitivity of AIRS to atmospheric CH 4 is in the mid-upper troposphere with the degree of freedom of ~1.0. Validation of AIRS CH 4 product versus thousands of aircraft profiles (convolved using the AIRS averaging kernels) demonstrates that its RMS error (RMSE) is mostly less than 1.5%, and its quality is pretty stable from 2003 to 2009. For scientific analysis of the spatial and temporal variation of mid-upper tropospheric CH 4 (MUT-CH 4 ) in the High Northern Hemisphere (HNH), it is more valuable to use the AIRS retrieved CH 4 in a layer of about 100 hPa below tropopause (“Representative Layer”) than in a fixed pressure layer. Further analysis of deseasonalized time-series of AIRS CH 4 in both a fixed pressure layer and the “Representative Layer” of AIRS (only for the HNH) from 2003 to 2009 indicates that, similar to the CH 4 in the marine boundary layer (MBL) that was found to increase in 2007–2008, MUT-CH 4 was also observed to have a recent increase but the most significant increase occurred in 2008. MUT-CH 4 continued to increase in 2009, especially in the HNH. Moreover, the trend of MUT-CH 4 from 2006 to 2008 is lower than the trend of CH 4 in the MBL by 30–40% in both the southern hemisphere and HNH. This delay for the MUT-CH 4 increase of about OPEN ACCESS
-
Upload
independent -
Category
Documents
-
view
1 -
download
0
Transcript of Seven Years' Observation of Mid-Upper Tropospheric Methane from Atmospheric Infrared Sounder

Remote Sens. 2010, 2, 2509-2530; doi:10.3390/rs2112509
Remote Sensing ISSN 2072-4292
www.mdpi.com/journal/remotesensing Article
Seven Years’ Observation of Mid-Upper Tropospheric Methane from Atmospheric Infrared Sounder
Xiaozhen Xiong 1,2,*, Chris Barnet 2, Eric Maddy 1,2, Jennifer Wei 1,2, Xingpin Liu 1,2 and Thomas S. Pagano 3
1 Dell Perot Systems Government Services, Fairfax, VA 22031, USA 2 Center for Satellite Applications and Research (STAR), National Environmental Satellite, Data, and
Information Service (NESDIS), NOAA, Camp Springs, MD 20746, USA;
E-Mails: [email protected] (C.B.); [email protected] (E.M.);
[email protected] (J.W.); [email protected] (X.L.) 3 NASA/Jet Propulsion Laboratory, Pasadena, CA, USA; E-Mail: [email protected]
* Author to whom correspondence should be addressed; E-Mail: [email protected];
Tel.: +1-301-316-5020; Fax: +1-301-238-2398.
Received: 20 September 2010; in revised form: 28 October 2010 / Accepted: 5 November 2010 /
Published: 9 November 2010
Abstract: The Atmospheric Infrared Sounder (AIRS) on EOS/Aqua platform provides a
measurement of global methane (CH4) in the mid-upper troposphere since September,
2002. As a thermal infrared sounder, the most sensitivity of AIRS to atmospheric CH4 is in
the mid-upper troposphere with the degree of freedom of ~1.0. Validation of AIRS CH4
product versus thousands of aircraft profiles (convolved using the AIRS averaging kernels)
demonstrates that its RMS error (RMSE) is mostly less than 1.5%, and its quality is pretty
stable from 2003 to 2009. For scientific analysis of the spatial and temporal variation of
mid-upper tropospheric CH4 (MUT-CH4) in the High Northern Hemisphere (HNH), it is
more valuable to use the AIRS retrieved CH4 in a layer of about 100 hPa below tropopause
(“Representative Layer”) than in a fixed pressure layer. Further analysis of deseasonalized
time-series of AIRS CH4 in both a fixed pressure layer and the “Representative Layer” of
AIRS (only for the HNH) from 2003 to 2009 indicates that, similar to the CH4 in the
marine boundary layer (MBL) that was found to increase in 2007–2008, MUT-CH4 was
also observed to have a recent increase but the most significant increase occurred in 2008.
MUT-CH4 continued to increase in 2009, especially in the HNH. Moreover, the trend of
MUT-CH4 from 2006 to 2008 is lower than the trend of CH4 in the MBL by 30–40% in
both the southern hemisphere and HNH. This delay for the MUT-CH4 increase of about
OPEN ACCESS

Remote Sens. 2010, 2
2510
one year than CH4 in the MBL as well as the smaller increase trend for MUT-CH4 suggest
that surface emission is likely a major driver for the recent CH4 increase. It is also found
that the seasonal cycle of MUT-CH4 is different from CH4 in the MBL due to the impact of
transport, in addition to the surface emission and the photochemical loss.
Keywords: methane; mid-upper troposphere; satellite; AIRS; trend; seasonal cycle
1. Introduction
As one of the most important greenhouse gases, atmospheric methane (CH4) is 25 times more
effective on a per unit mass basis than carbon dioxide in absorbing long-wave radiation on a 100-year
time horizon, and accounts for 18% of the total of 2.66 W m−2 of the anthropogenically produced
greenhouse gas radiative forcing [1]. The concentration of CH4 over the globe has risen dramatically
since the preindustrial era [2-4]. However, CH4 mixing ratio is almost stable since 2000 [5,6], and a
renewed increase was found in 2007 and 2008 [7,8]. The increase of CH4 in 2007 was believed to be
largely caused by wetlands with a large tropical contribution [7], and Dlugokencky et al. [8] suggested
the most likely drivers of the CH4 anomalies during 2007 and 2008 were greater than average
precipitation in the tropics plus anomalously high temperatures in the Arctic, however it is still hard to
quantify the impacts from different sources in different regions. One large uncertainty in the
quantification of methane emissions can be from the high northern latitude regions [9]. For example,
CH4 is found to release from both thawing lakes and soils [10], and Shakhova et al. [11] recently
reported convincing evidence of CH4 outgassing from the Arctic continental shelf off northeastern
Siberia (Laptev and East Siberia Sea).
In recent years, space-borne remote sensing has been employed for the measurement of CH4 with
large spatial and temporal coverage. Two major types of measurement are the measurement of the total
column using the near-infrared (NIR) spectrum and the measurement of the MUT-CH4 using the
thermal infrared (TIR) spectrum. The NIR measurements in operation include the SCanning Imaging
Absorption spectroMeter for Atmospheric CHartographY (SCIAMACHY) instrument onboard
ENVISAT [12], and the Greenhouse gases Observation SATellite (GOSAT) which carries the Thermal
And Near-infrared Sensor for carbon Observation (TANSO) [13]. The TIR measurements in operation
include the Tropospheric Emission Spectrometer (TES) on NASA Earth Observing System (EOS)
Aura mission [14], the AIRS on EOS Aqua mission [15], and the Infrared Atmospheric Sounding
Interferometer (IASI) on European polar Meteorological Operational Platform (METOP-1) [16,17].
GOSAT also carries TIR measurement.
As one of the space-borne thermal infrared sounders in operation, AIRS was launched in polar orbit
(13:30, ascending node) on the EOS/Aqua satellite in May 2002. It is the first hyperspectral infrared
sounder designed to support weather forecast [15] and CH4 is one of the research products. AIRS has
been very stable since its launch in 2002 [18], and has provided more than eight years’ observation of
CH4. This paper reviews the characteristics of the data from this sensor (Section 2) and its validation
(Section 3). Since only about one piece of information of CH4 can be obtained (the degree of freedom
is ~1.0) from AIRS, it is important to determine which layer from the AIRS retrieved CH4 profile can

Remote Sens. 2010, 2
2511
be best used to analyze the variation of MUT-CH4 with the least artificial impact from the sensor itself
and the retrieval algorithm. The use of the AIRS retrieved CH4 in a layer about 100 hPa below
tropopause and its comparison with in situ aircraft measurements is also discussed in Section 3.
Section 4 analyzes the deseasonalized time-series of MUT-CH4 in a fixed pressure layer and the
“representative layer” (for the HNH only), as well as its comparison with the CH4 in the lower
troposphere from ground-based measurements. A summary and conclusions are given in Section 5.
2. Characteristics of CH4 Retrieval from AIRS
AIRS has 2,378 channels covering 649–1,136, 1,217–1,613 and 2,169–2,674 cm−1 at high spectral
resolution (λ/∆λ = 1200), and the noise, which is represented as the equivalent change in temperature
(Ne∆T) at a reference temperature of 250 K, ranges from 0.14 K in the 4.2 µm lower tropospheric
sounding wavelengths to 0.35 K in the 15 µm upper tropospheric sounding region [15]. The spatial
resolution of AIRS is 13.5 km at nadir, and in a 24-hour period AIRS nominally observes the complete
globe twice per day. For retrieval in both clear and partial cloudy scenes, 9 AIRS fields-of-view
within the footprint of the Advanced Microwave Sounding Unit (AMSU) are used to derive a single
cloud-cleared radiance spectrum in a field-of-regard (FOR). The cloud-cleared FOR radiance spectrum
is then used for retrieving profiles with a spatial resolution of about 45 km. The CH4 first guess profile,
which is also the “a priori” mean profile, in the retrieval is given as a function of latitude and pressure
(to capture its strong latitudinal and vertical gradients), and is generated by using a non-linear
polynomial fitting to some in situ aircraft measurements and model data [19]. The atmospheric
temperature profile, water profile, surface temperature and surface emissivity required as inputs in CH4
retrieval are derived from other AIRS channels using the version 5 of AIRS product retrieval software.
These data are available at the NASA Goddard Earth Sciences Data and Information Services Center
(DISC) (http://disc.gsfc.nasa.gov/AIRS/index.shtml/). An “off-line” version of the AIRS product is run
at NOAA National Environmental Satellite, Data, and Information Service (NESDIS), Center for
Satellite Application and Research (STAR), where the data are thinned to a 3° × 3° spatial grid, and
these data are available at NOAA/NESDIS/STAR by request. The data from NOAA are routinely
reprocessed with algorithm updates.
2.1. Sensitivities of AIRS
71 CH4 channels near 7.6 µm H2O band are used in the retrieval. To illustrate the sensitivities of
AIRS, we first define it as the change in brightness temperature divided by the thickness of layer
(∆T/∆Z, unit: K/km). Figure 1 shows the sensitivities of these AIRS channels for a 2% change of CH4
mixing ratio in different layers for three typical profiles in polar, tropics and mid-latitude region
respectively. It is evident that the most sensitive layers are in the mid-upper troposphere. Given that
the methane band resides inside the broad 7.6 µm H2O band, the moisture optical depth pushes the CH4
peak sensitivity upwards, so for the peak CH4 absorption channels (red lines), the most sensitive layers
are at 150–300 hPa in the tropics, and 200–400 hPa in the mid-latitude region. The most sensitive
layers for weak CH4 absorption channels (dark lines) are at an altitude of about 50–100 hPa lower than
those of the peak channels in the tropics and mid-latitude regions. In the polar, the most sensitive
layers are at 300–600 hPa, and the sensitivities are much less than in the tropics and mid-latitude

Remote Sens. 2010, 2
2512
regions. Obviously, from Figure 1 we can see the information from these channels is redundant, so
seven retrieval layers are used, which are 0.016–36 hPa, 36–160 hPa, 160– 260 hPa, 260–359 hPa,
359–460 hPa, 460–596 hPa, and 596–1,100 hPa (marked with dark dash lines in the top panel of
Figure 1). The thickness of layer is about 100 hPa in the most sensitive regions between 150 and
600 hPa. For a more accurate computation of the radiative transfer in the atmosphere, the atmosphere
is divided into 100 layers [20].
Figure 1. AIRS sensitivity (∆T/∆Z, unit: K/km) for a 2% change in CH4 mixing ratio for
atmosphere profiles in polar, tropics and mid-latitude respectively. Each line represents the
sensitivity for each of the 71 AIRS channels used in the retrieval. The locations of these 71
channels in the AIRS spectrum are marked as colored squares in the bottom panel, and the
red squares represent peak absorption channels near 13,06 cm−1, and the black squares
represent far wing weak absorption channels. The bottom panel is the change of brightness
temperature (∆T, unit: K) in the spectrum spanning from 1,210 to 1,400 cm−1 for a 2%
change in the total column of CH4 for polar, tropics and mid-latitude profiles respectively.
Blue crosses are the noise level of AIRS channels.

Remote Sens. 2010, 2
2513
In the bottom panel of Figure 1, we can see that for a 2% change of CH4 total column in the
atmosphere, the changes of brightness temperature (∆T) in CH4 spectrum for the tropical profile and
mid-latitude profile are very similar, and they are significantly larger than the noise level in the
channels near 1,306 cm−1. However, for the polar profile the ∆T for most channels are close to the noise
level. These indicate that in the tropics and the mid-latitude regions, AIRS can detect a 2% change or less
of the total column of CH4; however in the polar region, AIRS can barely detect a 2% change.
2.2. Variation of Degree of Freedom (DOF)
In the AIRS retrieval algorithm, the retrieval solution is obtained by finding the eigenvectors and
eigenvalues of the covariance matrix of the sensitivity, weighted by an inverse of the estimates of the
precision and accuracy of our radiative transfer model and the errors and noise in the measurements.
The corresponding eigenvalues give an indication of the usefulness of each component and the
component corresponding to small eigenvalues is thrown away or heavily damped in order to get a
stable solution. We define the degrees of freedom (DOF) as the fractional number of significant
eigenfunctions used in the retrieval process, so variation of DOFs reflects the change of sensitivity of
the retrieval, and represents how much portion of the retrieved value is from the satellite observation
approximately (the rest is from the “a priori”). As an example, Figure 2 shows the variation of DOFs
in two regions, and on average the DOFs over South Asia and Alaska-Canada are 1.03 ± 0.11(10.6%)
and 0.67 ± 0.068 (10.2%), respectively. Overall, DOFs in the lower latitude regions are larger than in
the high latitude regions, in summer is larger than in winter, and during the daytime is larger than
during the nighttime. Due to the impact of Asian summer monsoon, which brings more moisture into
South Asia and induces deep convection, variation of DOFs in South Asia is pronounced. Over
Alaska-Canada the DOFs are anti-correlated with the tropopause height represented in hPa and the
correlation coefficient is −0.70, and that means the higher the tropopause height (corresponding to a
smaller pressure level), the larger the DOF. Lower DOFs in the polar region in winter are mainly due
to the lower lapse rate. In general, the relationship between tropopause height and DOF is not obvious
if compared to the fact that the lower lapse rate leads to lower DOF. As the DOFs in winter are smaller
than in summer, measurement of CH4 from space is more difficult in winter season in the polar region.
Considering the large variation of tropopause in the HNH, using the retrieved CH4 in a layer 50 to
250 hPa below tropopause to analyze CH4 variation in the real atmosphere is better than using CH4 in a
fixed pressure layer [21].
Due to the temporal and spatial variation of DOFs, some of the variation in the retrieved CH4 is
from artificial effects, which adds more complexity in analyzing CH4 variation in the real atmosphere
using the retrieved CH4 data alone. For example, in cases when the DOF are small, the retrieved values
are mostly from the “a priori”. A rough estimate indicates that the uncertainty attributed to the
variation of DOF is less than 0.8% in the high northern hemisphere [22] and 0.3% over South Asia.
This artificial impact has to be taken into account when analyzing the satellite retrieval product derived
from any thermal infrared sounder, and while comparing the retrieval products with model simulations
and/or in situ measurements, it is strongly recommended to apply the averaging kernels [19,23]. The
trace of the averaging kernel matrix is equivalent to DOF.

Remote Sens. 2010, 2
2514
Figure 2. Seasonal variation of Degree of Freedom (DOF) in two regions: South Asia
(80–110°E, 20–35°N) and Alaska-Canada (165–90°W, 60–70°N). Lower panel shows the
anti-correlation between DOFs and the tropopause height over Alaska-Canada.
3. Validation of AIRS CH4
3.1. Validation Data Set
In situ aircraft measurements of CH4 profiles are used for validations, which include (1) the profiles
from NOAA Earth System Research Laboratory, Global Monitoring Division (NOAA/ESRL/GMD)
Carbon Cycle Group obtained by routinely collecting air samples on biweekly to monthly aircraft
flights at over twenty sites; (2) the profiles from specific campaigns, such as the Intercontinental
Chemical Transport Experiment (INTEX) A and –B, Stratosphere-Troposphere Analyses of Regional
Transport in 2008 (START08) and The Arctic Research of the Composition of the Troposphere from
Aircraft and Satellites (ARCTAS).
(1) NOAA/ESRL/GMD aircraft measurements: Air samples are collected using turboprop aircraft
with maximum altitude limits of 300–350 hPa. Individual flights required about 1.5 hours to
complete. Measurements are made by collecting samples of air (approximately 0.7 liter volume at
40 psa) in glass containers. Twelve to twenty flasks are held in a suitcase-sized container, and
collection of air in a single flask at a unique altitude allows a sampling vertical resolution of up to
400 m in the boundary layer. After each flight the flask packages are shipped to the NOAA
laboratory in Boulder, Colorado for trace gas analysis. Table 1 lists the locations of these sites and
their profile number used in validation.
(2) The INTEX-A field mission was conducted in the summer of 2004 (1 July to 15 August 2004)
over North America (NA) and the Atlantic. This effort had a broad scope to investigate the

Remote Sens. 2010, 2
2515
transport and chemistry of long-lived greenhouse gases, oxidants and their precursors, aerosols
and their precursors, as well their relationship with radiation and climate. NASA’s DC-8 and J-31
were joined by aircraft from a large number of European and North American partners to explore
the composition of the troposphere over NA and the Atlantic as well as radiative properties and
effects of clouds and aerosols in a coordinated manner [24]. An air sample is collected in a
conditioned, evacuated 2-L stainless steel canister equipped with a bellows valve, and is returned
to the UC-Irvine laboratory for CH4 analysis using gas chromatography (GC, HP-5890A) with
flame ionization detection. The use of the primary CH4 calibration standards dating back to late
1977 ensures that these measurements are internally consistent. The measurement accuracy is ±1%
and the analytical precision at atmospheric mixing ratios is about 1 ppbv [6, 25].
(3) INTEX-B was a major NASA led multi-partner atmospheric field campaign completed in the
spring of 2006 (http://cloud1.arc.nasa.gov/intex-b/). INTEX-B was performed in two phases. In its
first phase (1–21 March), INTEX-B operated as part of the MILAGRO campaign with a focus on
observations over Mexico and the Gulf of Mexico. In the second phase (17 April–15 May), the
main INTEX-B focus was on trans-Pacific Asian pollution transport. Multiple airborne platforms
carrying state of the art chemistry and radiation payloads were flown in concert with satellites and
ground stations during the two phases of INTEX-B [26]. The CH4 aircraft measurements in
INTEX-B are similar to INTEX-A.
(4) START08 was conducted using the NSF/NCAR Gulfstream V research aircraft during April–June
2008 [27]. START08 was designed to study the chemical transport characteristics of the
extratropical upper troposphere and lower stratosphere region. A total of 18 research flights
covered a large region of North America (25–65°N in latitude and up to 14.3 km vertical range).
Methane was measured in situ by the Unmanned Aircraft Systems Chromatograph for
Atmospheric Trace Species. The 2-channel gas chromatograph employed a N2O-doped electron
capture detector to measure methane at intervals of 140 s. The measurements were calibrated
in-flight using whole air standards.
(5) The ARCTAS mission was conducted in April and June–July 2008 by the Global Tropospheric
Chemistry Program and the Radiation Sciences Program of NASA. Its objective was to better
understand the factors driving current changes in Arctic atmospheric composition and climate.
Three research aircrafts (DC-8, P-3, B-200) were used and a total of 24 research flights had been
made. The aircraft were based in Alaska in April (ARCTAS-A) and in western Canada in
June–July (ARCTAS-B). The DACOM instrument used is an infrared tunable diode laser
absorption spectrometer which makes measurements of CH4 (as well as CO and N2O) at a 1 Hz
sample rate. The CH4 accuracy is tied to NOAA/ESRL/GMD carbon cycle group standards and is
nominally 1%, and the precision is 0.1% (1 sec, 1 sigma). CH4 observations during ARCTAS-A
showed little variability and no indication of significant April emissions from Arctic ecosystems.
The July observations in ARCTAS-B over the Hudson Bay Lowlands revealed higher wetland
emissions of methane than previously recognized [28].

Remote Sens. 2010, 2
2516
Table 1. 26 Sites of NOAA/ESRL/GMD aircraft measurements and the number of aircraft
profiles used for validation. The profiles are used when there are valid AIRS retrieved
profiles within 800 km in the same day in our gridded run data.
CODE Location Latitude, Longitude Profiles used
AAO Bondville, IL, United States 40.05, −88.37 202
BGI Bradgate, IA, United States 42.82, −94.41 23
BNE Beaver Crossing, NE, United States 40.80, −97.18 73
BRM BERMS, SK, Canada 54.34, −104.99 9
CAR Briggsdale, CO, United States 40.37, −104.30 124
CMA Cape May, NJ, United States 38.83, −74.32 87
DND Dahlen, ND, United States 48.14 , −97.99 76
ESP Estevan Point, BC, Canada 49.58, −126.37 131
ETL East Trout Lake, SK, Canada 54.35, −104.98 90
FWI Fairchild, WI, United States 44.66, −90.96 24
HAA Molokai Island, HI, United States 21.23, −158.95 45
HFM Harvard Forest, MA, United States 42.54, −72.17 49
HIL Homer, IL, United States 40.07, −87.91 85
LEF Park Falls, WI, United States 45.93, −90.27 122
NHA Worcester, MA, United States 42.95, −70.63 67
NWR Niwot Ridge, CO, United States 40.05, −105.58 45
OIL Oglesby, IL, United States 41.28, −88.94 35
PFA Poker Flat, AL, United States 65.07, −147.29 72
RIA Rowley, IA, United States 42.40, −91.84 26
RTA Rarotonga, Cook Islands −21.25, −159.83 42
SCA Charleston, SC, United States 32.77, −79.55 83
SGP Southern Great Plains, OK, United States 36.80, −97.50 128
TGC Sinton, TX, United States 27.73, −96.86 82
THD Trinidad Head, CA, United States 41.054, −124.151 70
VAA Cartersville, GA, United States 32.91, −79.36 8
WBI West Branch, IO, United States 41.725, −91.353 72
AIRS averaging kernels have been applied to the in situ aircraft data for validation [23]. Because of
the limits of aircraft altitude, the in situ profiles provided by NOAA/ESRL/GMD are mostly below the

Remote Sens. 2010, 2
2517
most sensitive region of AIRS and do not span the entire vertical range defined by the AIRS weighting
functions. Extrapolation to the aircraft profiles is required to generate validation profiles. In this paper
we used the monthly averaged CH4 data from an Atmospheric General Circulation Model
(AGCM)-based chemistry transport model (hereinafter ACTM) [29] to extrapolate from the top of the
in situ aircraft profile to the top of atmosphere.
For the validation exercise using NOAA/ESRL/GMD aircraft data, we simply used AIRS gridded
run data archived at NOAA/NESDIS/STAR, and the collocated AIRS retrieved profiles from AIRS
ascending mode (1:30 pm local time) were selected if they are within 800 km of each site. For the
validation exercise using campaign data, we computed AIRS retrievals at the standard product spatial
resolution of 45 km, and the collocated AIRS retrieved profiles were selected if they are within 200 km
of aircraft measurements. The mean of the collocated profiles were compared with in situ aircraft
measurements (convolved using the averaging kernels).
3.2. Validation Results
Figure 3 shows the validation using data from eight sites of NOAA/ESRL/GMD aircraft
measurements, and a combination of aircraft data from 26 sites (Table 1). The eight sites used as
examples were selected from southmost (i.e., RTA) to northmost (i.e., PFA) among these 26 sites.
Since the upmost level of these aircraft measurements is usually below 350 hPa, only the data at layer
359–460 hPa are compared in Figure 3. However, this layer is below the most sensitive layers of AIRS,
which is at about 200–400 hPa in the tropics and mid-latitude regions, so the correlation between the
AIRS retrievals and the aircraft measurements should be smaller than expected if using data in the
most sensitive layers. The correlation coefficients are about 0.5–0.6 for sites near the tropics and
mid-latitude regions, and decrease significantly in the high latitude regions, i.e., 0.39 for site ETL
(54.35°N) and 0.14 for site PFA (65.07°N). The RMSE also increases from ~0.5–0.7% in the tropics
and mid-latitude regions to 0.94% for high latitude site ETL and 1.02% for site PFA. After merging all
data in 26 sites, the correlation coefficient of AIRS retrieval with observation is 0.65 and RMSE is
0.73%. These results are obviously hampered by the non-ideal validation data used, in which the
temporal difference between AIRS and in situ aircraft measurements is at least a couple of hours, and
the spatial difference is as large as 800 km. Even so, these results indicate that space-borne observation
by AIRS has a certain capability to map the variation of CH4 in the mid-upper troposphere, but this
capability deteriorates towards the polar region. One reason for the low correlation coefficient in the
high northern latitude regions is associated with the large difference in spatial collocation of AIRS
observations (within 800 km) with aircraft measurements as the air masses in such a big area with a
radius of 800 km are more likely different in the polar regions than in the mid-latitude regions, and
using campaign data from ARCTAS, the correlation is much better, as will be shown in Figure 4.
Compared to validation made in Xiong et al. [19] that used 671 profiles, more recent aircraft
measurements from NOAA/ESRL/GMD since February, 2006 were used. The retrieval algorithm is
almost the same, except for some minor changes in channels. Some minor patches/changes in the
whole retrieval system have also been made, and the impact of these changes is insignificant on CH4
results. One of the more significant changes in the retrieval was to accommodate the noise degradation
in AMSU Channel 4, which impacts the cloud-clearing and retrievals of temperature, moisture and

Remote Sens. 2010, 2
2518
surface emission, which, in turn, may impact the quality of all AIRS products. However, a rough
estimate of AIRS CH4 quality based on the validation error and correlation coefficient in different
years from 2004 to 2009 does not show any trend in the retrieval bias and RMSE, so the quality of
AIRS CH4 product so far is relatively stable.
Figure 3. Scatter plot of AIRS vs in situ aircraft observations of CH4 at layer 359–460 hPa
for 8 sites separately and a mix of all profiles from 26 sites from August 2003 to December
31, 2009 (N = 1,813). The dashed line is the 1:1 line, and the Pearson correlation
coefficient (R), bias and RMSE (in parenthesis) are given. X-axis is the in situ aircraft
observations.
In Figure 4 data from several campaigns were used. Compared to aircraft measurements from
NOAA/ESRL/GMD sites in Figure 3, these aircraft measurements mostly took samples to higher
altitudes up to 200 hPa. So, in addition to the data at layer 359–460 hPa, data in a higher layer at
260–359 hPa is also compared. Except in the upper layer in INTEX-B, the correlation coefficients are
mostly larger than in Figure 3. The most significant improvement is in the high northern latitude
regions, as illustrated from ARCTAS data in the bottom two panels. However the RMSE in ARCTAS
data is still larger than in middle-lower latitude regions.

Remote Sens. 2010, 2
2519
Figure 4. Same as Figure 3 but for two layers at 260–359 hPa and 359–460 hPa,
respectively and using aircraft observations from campaigns INTEX-A, INTEX-B,
START08 and ARCTAS.
3.3. The Representative Layer in the AIRS Retrieved CH4 Profile for Scientific Analysis in the HNH
CH4 is well mixed in the troposphere; however, it has a large vertical gradient in the boundary layer
and near tropopause. In the most CH4 sensitive layer of AIRS in the mid-upper troposphere, variation
of CH4 mixing ratio is relatively small. Such a characteristic allows us to use the AIRS retrieved CH4
mixing ratio in its most sensitive layer for analyzing the variation of MUT-CH4, which is obviously
better than using the AIRS retrieved CH4 in a fixed pressure layer. As detailed by Xiong et al. [21], in
the HNH the most sensitive layer of AIRS to CH4 has a good correlation with the tropopause, thus a
layer 50 to 250 hPa below tropopause, which is defined as the “Representative Layer” of AIRS, was
chosen for scientific analysis. We noted that when the tropopause is very low, for example at 400 hPa
in the polar region, the layer 50 to 250 hPa below tropopause will be at 450 to 650 hPa, which may be
out of the most sensitive region of AIRS and the impact from surface emission could be significant
(with a large vertical gradient of CH4 mixing ratio near 650 hPa). So, in this paper we define the top
level as 500*(Ptrop)−0.5 and lower level as 2,500*(Ptrop)−0.5, where Ptrop is the pressure of tropopause.
In such definition the “Representative Layer” is thinner in the high latitude regions than that defined in
Xiong et al. [21].
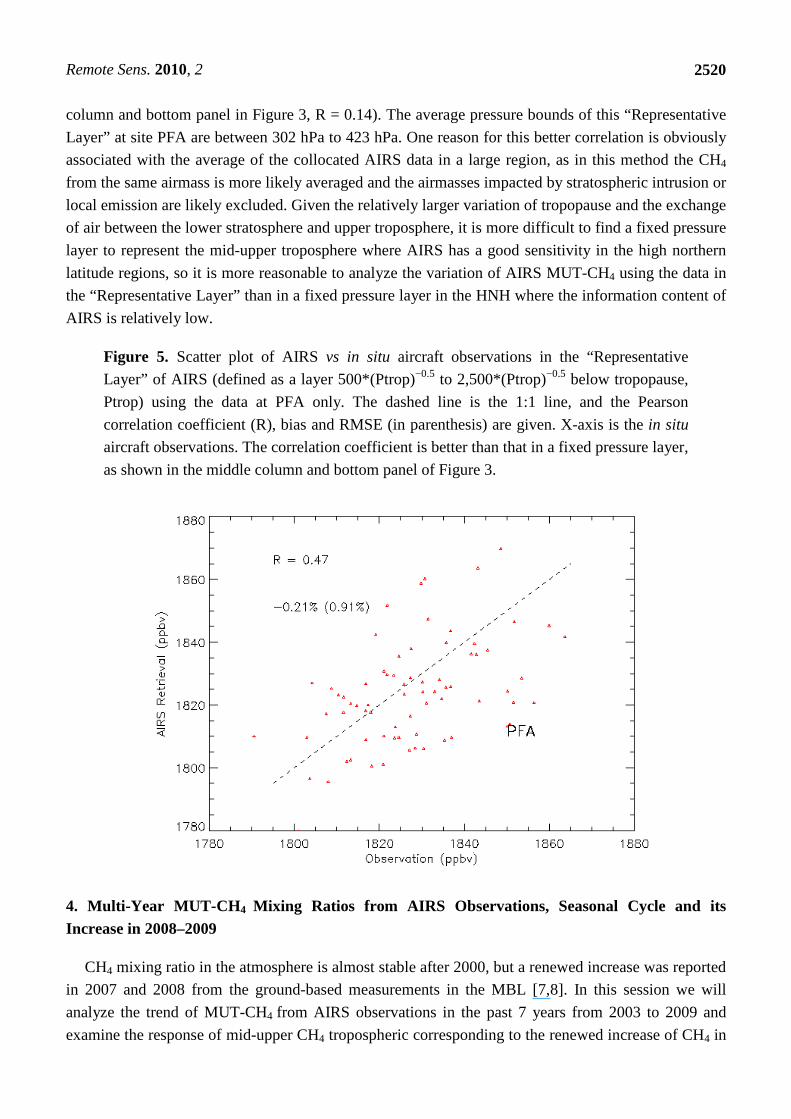
As an example, using the data from the site PFA in the high northern latitude region, Figure 5
shows that the AIRS retrieved CH4 in its “Representative Layer” has a much better correlation with
in situ aircraft measurements, R = 0.47, as compared to that in a fixed pressure layer (see the middle
Remote Sens. 2010, 2
2520
column and bottom panel in Figure 3, R = 0.14). The average pressure bounds of this “Representative
Layer” at site PFA are between 302 hPa to 423 hPa. One reason for this better correlation is obviously
associated with the average of the collocated AIRS data in a large region, as in this method the CH4
from the same airmass is more likely averaged and the airmasses impacted by stratospheric intrusion or
local emission are likely excluded. Given the relatively larger variation of tropopause and the exchange
of air between the lower stratosphere and upper troposphere, it is more difficult to find a fixed pressure
layer to represent the mid-upper troposphere where AIRS has a good sensitivity in the high northern
latitude regions, so it is more reasonable to analyze the variation of AIRS MUT-CH4 using the data in
the “Representative Layer” than in a fixed pressure layer in the HNH where the information content of
AIRS is relatively low.
Figure 5. Scatter plot of AIRS vs in situ aircraft observations in the “Representative
Layer” of AIRS (defined as a layer 500*(Ptrop)−0.5 to 2,500*(Ptrop)−0.5 below tropopause,
Ptrop) using the data at PFA only. The dashed line is the 1:1 line, and the Pearson
correlation coefficient (R), bias and RMSE (in parenthesis) are given. X-axis is the in situ
aircraft observations. The correlation coefficient is better than that in a fixed pressure layer,
as shown in the middle column and bottom panel of Figure 3.
4. Multi-Year MUT-CH 4 Mixing Ratios from AIRS Observations, Seasonal Cycle and its Increase in 2008–2009
CH4 mixing ratio in the atmosphere is almost stable after 2000, but a renewed increase was reported
in 2007 and 2008 from the ground-based measurements in the MBL [7,8]. In this session we will
analyze the trend of MUT-CH4 from AIRS observations in the past 7 years from 2003 to 2009 and
examine the response of mid-upper CH4 tropospheric corresponding to the renewed increase of CH4 in

Remote Sens. 2010, 2
2521
the MBL in 2007–2008. A global view of its yearly change during 2007–2009 is shown in Figures 6
and 7. The trend of AIRS CH4 and its comparison with ground-based measurements [30] for three
focus regions in southern hemisphere, south Asia and the HNH will be discussed separately.
4.1. Global View of MUT-CH4 and Its Increase during 2007–2009
Figure 6 shows the mean of MUT-CH4 at layer 160–260 hPa and the annual increase in 2007, 2008
and 2009. The upper left panel is the difference of 2007 minus the mean during 2003–2006, and the
upper right panel is the difference of 2009 minus 2008 and the lower left is the difference of 2008
minus 2007. The 2007 increase of CH4 observed in the MBL is not evident in the mid-upper
troposphere, however, the increase in 2008 is significant over the globe, and the largest increase of up
to 15–20 ppbv occurs near the tropics. The 2008 increase in the HNH is up to 10 ppbv, but the increase
in high southern hemisphere is small. From 2008 to 2009 MUT-CH4 continued to increase in most
regions, and the largest increase is in the high northern latitude regions, as shown in Figure 7 and
Table 2. However, there is little increase near the tropics in 2009. Since the most sensitive layer of
AIRS in the high latitude regions is towards to a lower altitude than in the mid-latitude regions and
tropics, the annual change in the high latitude regions can be better shown from Figure 7. Table 2 lists
the amount of increase of MUT-CH4 in two layers and in three regions during 2007–2009. The
locations of these three regions are shown in upper left panels in Figures 6 and 7.
Table 2. Annual change of MUT-CH4 during 2007–2009 in layers 160–260 hPa and
260–359 hPa (in parenthesis) for three regions. The change of the CH4 mixing ratios in
2007 is obtained by subtracting the mean from 2003 to 2006 (unit: ppbv).
2007 2008 2009 Alaska-Canada −0.32(1.06) 5.42(4.93) 5.89(5.11)
South Asia −1.58 (0.93) 12.89(7.0) −0.29 (0.09) South Hemisphere −1.63(−0.48) 1.92(3.06) 3.53(1.65)
Figure 6. Global distribution of MUT-CH4 for layer at 160–260 hPa during 2003–2006 and
its annual change during 2007–2009. The color bar in the lower left is for the annual
change, and the color bar in the lower right is for the mean distribution.

Remote Sens. 2010, 2
2522
Figure 6. Cont.
Figure 7. Same as Figure 6 but for layer at 359 hPa.
Remote Sens. 2010, 2
2523
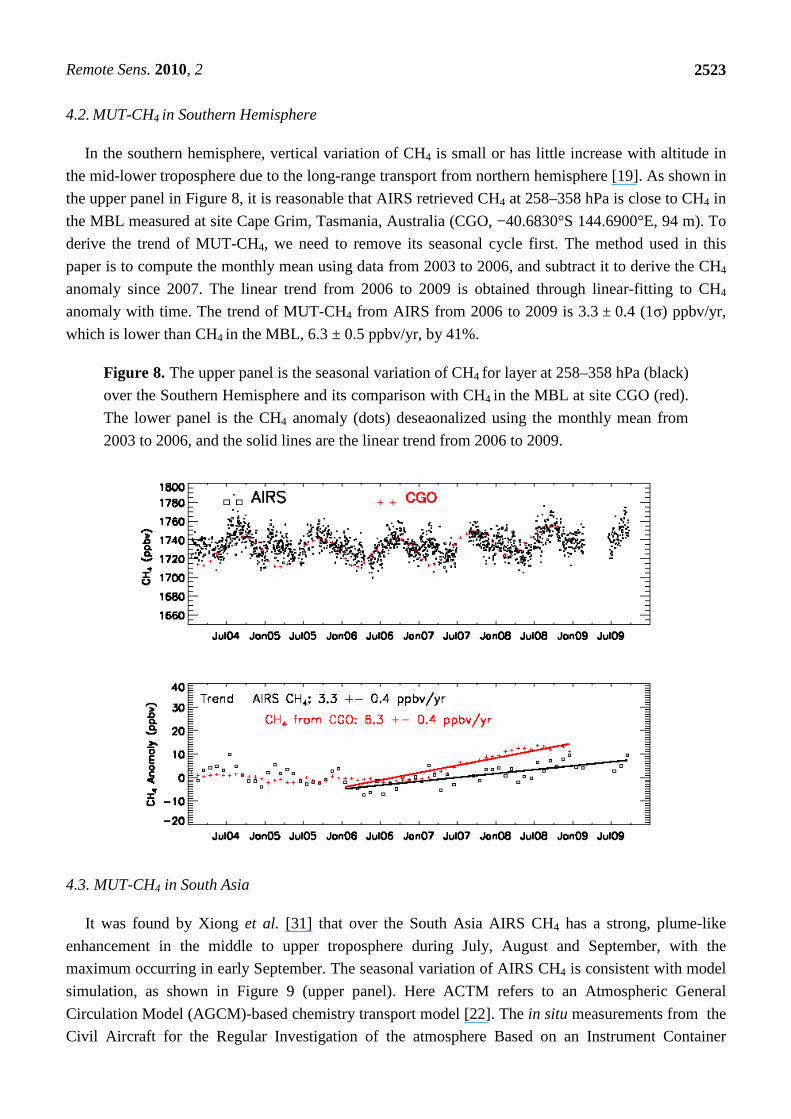
4.2. MUT-CH4 in Southern Hemisphere
In the southern hemisphere, vertical variation of CH4 is small or has little increase with altitude in
the mid-lower troposphere due to the long-range transport from northern hemisphere [19]. As shown in
the upper panel in Figure 8, it is reasonable that AIRS retrieved CH4 at 258–358 hPa is close to CH4 in
the MBL measured at site Cape Grim, Tasmania, Australia (CGO, −40.6830°S 144.6900°E, 94 m). To
derive the trend of MUT-CH4, we need to remove its seasonal cycle first. The method used in this
paper is to compute the monthly mean using data from 2003 to 2006, and subtract it to derive the CH4
anomaly since 2007. The linear trend from 2006 to 2009 is obtained through linear-fitting to CH4
anomaly with time. The trend of MUT-CH4 from AIRS from 2006 to 2009 is 3.3 ± 0.4 (1σ) ppbv/yr,
which is lower than CH4 in the MBL, 6.3 ± 0.5 ppbv/yr, by 41%.
Figure 8. The upper panel is the seasonal variation of CH4 for layer at 258–358 hPa (black)
over the Southern Hemisphere and its comparison with CH4 in the MBL at site CGO (red).
The lower panel is the CH4 anomaly (dots) deseaonalized using the monthly mean from
2003 to 2006, and the solid lines are the linear trend from 2006 to 2009.
4.3. MUT-CH4 in South Asia
It was found by Xiong et al. [31] that over the South Asia AIRS CH4 has a strong, plume-like
enhancement in the middle to upper troposphere during July, August and September, with the
maximum occurring in early September. The seasonal variation of AIRS CH4 is consistent with model
simulation, as shown in Figure 9 (upper panel). Here ACTM refers to an Atmospheric General
Circulation Model (AGCM)-based chemistry transport model [22]. The in situ measurements from the
Civil Aircraft for the Regular Investigation of the atmosphere Based on an Instrument Container

Remote Sens. 2010, 2
2524
(CARIBIC), a project to study and monitor important chemical and physical processes in the Earth’s
atmosphere, provide evidence for the enhancement of CH4 during the summer [32]. The highest
MUT-CH4 in late summer is close to the ground-based measurements in Mt. Waliguan, China (WLG,
36.2879°N 100.8964°E, 3,810 m) while the annual average of MUT-CH4 is about 70 ppbv lower than
ground-based measurements. The linear trend for MUT-CH4 from 2006 to 2009, 6.2 ± 1.3 ppbv/yr, is
very close to the trend of CH4 in the WLG from 2006 to 2008. However, different from CH4 in the
MBL that starts to increase in 2007, significant increase of MUT-CH4 is evident in 2008. Also, AIRS
MUT-CH4 shows a decrease in 2005, which is not obvious from the ground-based measurements.
Figure 9. The upper panel is the seasonal variation of the MUT-CH4 at layer 160–259 hPa
(black line is the running mean over a biweekly window) and its comparison with the
model simulation by ACTM (Green line) and ground-based measurements of CH4 mixing
ration at site WLG(red crosses). The lower panel shows the anomaly of MUT-CH4 and
CH4 at WLG and the linear trend for both of them (solid red line and black line are almost
overlapped).
4.4. MUT-CH4 in the HNH
The mixing ratio of MUT-CH4 from AIRS is about 60 ppbv lower than CH4 in the MBL measured
at site Barrow, Alaska, USA (BRW). The low value of MUT-CH4 in May agrees with the decrease of
CH4 in the MBL. However, MUT-CH4 starts to increase in June–July due to the enhanced vertical
convection, and possibly a combination from the enhanced emissions from wetlands or permafrost
regions. On the contrary, due to the photochemical reaction, the CH4 in the MBL reaches the minimum
in the summer. This summer minimum for CH4 in the MBL is not evident from the AIRS observed
MUT-CH4, even though sometimes the low mixing ratios were observed from NOAA/ESRL/GMD

Remote Sens. 2010, 2
2525
aircraft measurements, but relatively high mixing ratios were also observed in some other times. The
trend of MUT-CH4 from AIRS from 2006 to 2009 in the high northern latitude region is
3.9 ± 1.0 ppbv/yr, which is close to that in the Southern Hemisphere, but lower than the CH4 in the
MBL at Barrow, Alaska (BRW). Both the AIRS retrievals and ground measurements are more
scattered than in Figure 8, which is associated with the larger emission sources in the HNH. As in the
South Asia, AIRS MUT-CH4 shows a decrease in 2005, and in agreement with AIRS, the
ground-based measurements also show similar decrease in this period.
Figure 10. Same as Figure 8 but using ground-based measurements at site BRW, and
MUT-CH4 is derived from the AIRS retrieved CH4 in the “Representative Layer” of AIRS.
4.5. Seasonal Cycle of MUT-CH4
Using the data in Figures 8–10, we computed the monthly average of MUT-CH4 and CH4 during
2004 to 2009 to get their seasonal cycles. As described by Xiong et al. [22], the seasonal cycle of
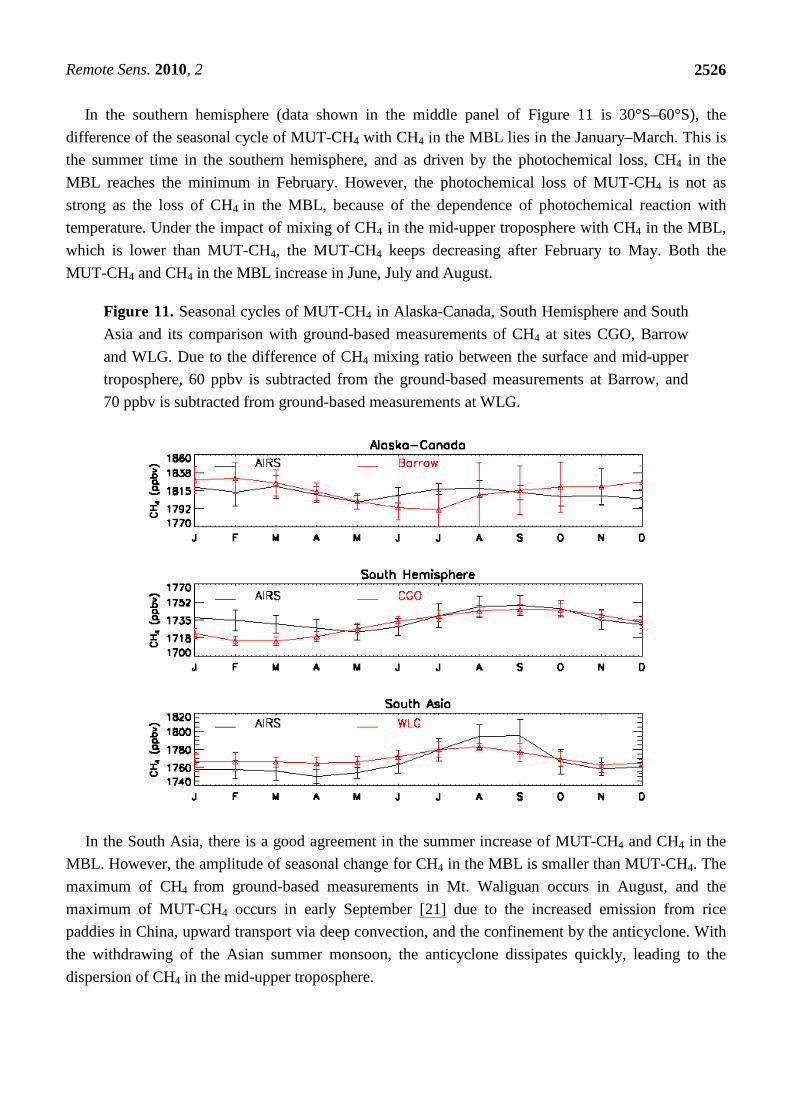
MUT-CH4 in the HNH is nearly opposite to CH4 in the MBL, and particularly MUT-CH4 has a
summer high while CH4 in the MBL reaches the minimum in summer. This difference of seasonal
cycle is evident from the top panel of Figure 11. The CH4 mixing ratios in the MBL are about
70–80 ppbv higher than in the mid-upper troposphere during the winter-spring seasons, but in
June–July this difference is reduced by about 50%. Both of them show a decrease from March to May,
and MUT-CH4 reaches its seasonal minimum in May, but the minimum of CH4 in the MBL occurs in
July, which is driven by the photochemical loss of CH4. The summer increase of MUT-CH4 is mainly
driven by the enhanced upward convection in this period. Obviously, the increase of CH4 emission
from the high northern ground, especially in the early summer, will impact the CH4 in the mid-upper
troposphere, which, in turn, will join in the global circulation and impact the climate.
Remote Sens. 2010, 2
2526
In the southern hemisphere (data shown in the middle panel of Figure 11 is 30°S–60°S), the
difference of the seasonal cycle of MUT-CH4 with CH4 in the MBL lies in the January–March. This is
the summer time in the southern hemisphere, and as driven by the photochemical loss, CH4 in the
MBL reaches the minimum in February. However, the photochemical loss of MUT-CH4 is not as
strong as the loss of CH4 in the MBL, because of the dependence of photochemical reaction with
temperature. Under the impact of mixing of CH4 in the mid-upper troposphere with CH4 in the MBL,
which is lower than MUT-CH4, the MUT-CH4 keeps decreasing after February to May. Both the
MUT-CH4 and CH4 in the MBL increase in June, July and August.
Figure 11. Seasonal cycles of MUT-CH4 in Alaska-Canada, South Hemisphere and South
Asia and its comparison with ground-based measurements of CH4 at sites CGO, Barrow
and WLG. Due to the difference of CH4 mixing ratio between the surface and mid-upper
troposphere, 60 ppbv is subtracted from the ground-based measurements at Barrow, and
70 ppbv is subtracted from ground-based measurements at WLG.
In the South Asia, there is a good agreement in the summer increase of MUT-CH4 and CH4 in the
MBL. However, the amplitude of seasonal change for CH4 in the MBL is smaller than MUT-CH4. The
maximum of CH4 from ground-based measurements in Mt. Waliguan occurs in August, and the
maximum of MUT-CH4 occurs in early September [21] due to the increased emission from rice
paddies in China, upward transport via deep convection, and the confinement by the anticyclone. With
the withdrawing of the Asian summer monsoon, the anticyclone dissipates quickly, leading to the
dispersion of CH4 in the mid-upper troposphere.

Remote Sens. 2010, 2
2527
5. Summary and Conclusions
As a thermal infrared sounder, AIRS on EOS/Aqua platform has provided a unique measurement of
mid-upper tropospheric CH4 (MUT-CH4) since September 2002. From the analysis of AIRS
sensitivity, it is clear that AIRS is capable of detecting a less than 2% change of atmospheric CH4 total
column in the tropics and mid-latitude regions, but its capability deteriorates to about 2% or more in
the polar region. Validation with in situ aircraft measurements demonstrated that the retrieval RMSEs
are mostly less than 1.5%; however, this validation is limited due to the poor collocation of AIRS data
with aircraft measurements, including the altitude limit, time discrepancy (at least a few hours) and
spatial coverage. The number of aircraft measurements in the southern hemisphere and high northern
latitude regions is limited for validation. Overall, the AIRS CH4 product is stable during the period
from 2003 to 2009, so we used this product to examine the trend of mid-upper tropospheric CH4,
particularly to investigate the response of MUT-CH4 to the recent increase of atmospheric CH4 near
the surface.
One challenge in the use of AIRS observation of CH4 is due to the limited information content from
thermal infrared sounder, and the degree of freedom (DOF) of the retrieval is about 1.0. In the high
northern latitude regions, it was found that the DOF is correlated with the tropopause height, i.e., when
the tropopause height is higher in summer season, the DOF is larger and AIRS has a better sensitivity
to detect the variation of atmospheric CH4. Due to the change of AIRS sensitivity with altitude and
season, the AIRS retrieved CH4 in the “Representative Layer” was used for analysis in the HNH. The
advantages of using “Representative Layer” CH4 for analysis are: (1) it represents the retrievals near
the most sensitive layer; (2) it avoids the interference of stratospheric intrusion and/or minimize the
impact from surface emission. The improvement in the correlation coefficient between AIRS CH4 and
in situ measurements in the “Representative Layer” suggests that this use of CH4 in “Representative
Layer” is valuable. Due to the difficulty in retrieving CH4 in the high northern latitude regions, more
work is still required to improve the retrievals, validation and usage of the retrievals for
scientific analysis.
Analysis of deseasonalized time-series of AIRS CH4 in both a fixed pressure layer and the
“Representative Layer” in the HNH from 2003 to 2009 indicates that the MUT-CH4 increases about
3–6 ppbv/yr from 2006 to 2009, which is less than CH4 observed in the MBL. The most significant
increase of MUT-CH4 is about 13 ppbv near tropics and south Asia in 2008, and it continues to
increase in 2009 but with a smaller rate. In the HNH, the increase in 2009 is about 5–6 ppbv.
Compared to CH4 in the lower troposphere that has the most significant increase in 2007, the increase
of MUT-CH4 is delayed about 1 year. If the major driver of recent CH4 increase is the increased
surface emission, it will be easy for us to understand the delay of the MUT-CH4 increase and its lower
increase rate than the CH4 observed in the MBL, as the mixing of the surface emission needs some
time and the mixing in the whole atmosphere leads to its dilution in the whole atmosphere.
The seasonal cycles of MUT-CH4 are different from CH4 in the MBL, which suggests that in the
mid- upper troposphere, the impact of transport is of equivalent importance as the surface emission and
the photochemical loss in controlling the seasonal cycle. Unlike the CH4 in the MBL that reaches the
minima in both the northern latitude summer and the southern latitude summer, the MUT-CH4 has a
seasonal high. This summer increase of MUT-CH4 in the HNH suggests that the enhanced summer
Remote Sens. 2010, 2
2528
convection may provide a pathway for the CH4 emitted from the high northern latitude regions, thus
the release of CH4 from northern wetlands, lakes and thawing permafrost may play a more important
role for climate change than expected, and calls for more study.
Acknowledgements
This research was supported by funding from NOAA Office of Application & Research. The views,
opinions, and findings contained in this paper are those of the authors and should not be construed as
an official National Oceanic and Atmospheric Administration or U.S. Government position, policy, or
decision. The data of INTEX-A and B used in this publication was obtained from Aura Validation
Data Center (AVDC) (http://avdc.gsfc.nasa.gov/index.php) and the aircraft measurements of
INTEX-NA were carried out by Donald R. Blake of Department of Chemistry, University of
California, Irvine; and airborne CH4 data from INTEX-B and ARCTAS were provided by Glen Sachse
and Glenn Diskin of NASA Langley. ARCTAS data were downloaded from
(ftp://ftp-air.larc.nasa.gov/pub/ARCTAS/). The CH4 data of START08 aircraft measurements were
carried out by Dale Hurst and Jim Elkins of NOAA/ESRL/GMD. We appreciate Colm Sweeney at
NOAA/ESRL/GMD for providing the aircraft measurements data.
References
1. Solomon, S.; Qin, D.; Manning, M.; Chen, Z.; Marquis, M.; Averyt, K.B.; Tignor, M.; Miller,
H.L. Climate Change 2007: The Physical Science Basis: Contribution of Working Group I to the
Fourth Assessment Report of the Intergovernmental Panel on Climate Change; Cambridge
University Press: Cambridge, UK and New York, NY, USA, 2007; p. 996.
2. Rasmussen, R.A.; Khalil, M.A.K. Atmospheric methane in recent and ancient atmospheres:
Concentrations, trends, and interhemispheric gradient. J. Geophys. Res. 1984, 89, 11599-11605.
3. Nakazawa, T.; Machida, T.; Tanaka, M.; Fujii, Y.; Aoki, S.; Watanabe, O. Differences of the
atmospheric CH4 concentration between the Arctic and Antarctic regions in pre-industrial/pre-
agricultural era. Geophys. Res. Lett. 1993, 20, 943-946.
4. Dlugokencky, E.J.; Steele, L.P.; Lang, P.M.; Masarie, K.A. The growth rate and distribution of
atmospheric methane. J. Geophys. Res. 1994, 99, 17021-17044.
5. Dlugokencky, E.J.; Houweling, S.; Bruhwiler, L.; Masarie, K.A.; Lang, P.M.; Miller, J.B.; Tans,
P.P. Atmospheric methane levels off: Temporary pause or a new steady-state? Geophys. Res. Lett.
2003, 30, doi: 10.1029/2003GL018126.
6. Simpson, I.J.; Chen, T.-Y.; Blake, D.R.; Rowland, F.S. Implications of the recent fluctuations in the
growth rate of tropospheric methane. Geophys. Res. Lett. 2002, 29, doi:10.1029/2001GL014521.
7. Rigby, M.; Prinn, R.G.; Fraser, P.J.; Simmonds, P.G.; Langenfelds, R.L.; Huang, J.; Cunnold,
D.M.; Steele, L.P.; Krummel, P.B.; Weiss, R.F.; O’Doherty, S.; Salameh, P.K.; Wang, H.J.;
Harth, C.M.; Mühle, J.; Porter, L.W. Renewed growth of atmospheric methane. Geophys. Res.
Lett. 2008, 35, doi: 10.1029/2008GL036037.

Remote Sens. 2010, 2
2529
8. Dlugokencky, E.J.; Bruhwiler, L.; White, J.W.C.; Emmons, L.K.; Novelli, P.C.; Montzka, S.A.;
Masarie, K.A.; Lang, P.M.; Crotwell, A.M.; Miller, J.B.; Gatti, L.V. Observational constraints on
recent increases in the atmospheric CH4 burden. Geophys. Res. Lett. 2009, 36,
doi:10.1029/2009GL039780.
9. Zhuang, Q.; Melack, J.M.; Zimov, S.; Walter, K.M.; Butenhoff, C.L.; Khalil, M.A.K. Global
methane emissions from wetlands, rice paddies, and lakes. Eos Trans. AGU 2009, 90,
doi:10.1029/2009EO050001.
10. Walter, K.M.; Zimov, S.A.; Chanton, J.P.; Verbyla, D.; Chapin, F.S. Methane bubbling from
Siberian thaw lakes as a positive feedback to climate warming. Nature 2006, 443, 71-75.
11. Shakhova, N.; Semiletov, I.; Salyuk, A.; Yusupov, V.; Kosmach, D.; Gustafsson, Ö. Extensive
methane venting to the atmosphere from sediments of the East Siberian arctic shelf. Science 2010, 327, 1246-1250.
12. Frankenberg, C.; Bergamaschi, P.; Butz, A.; Houweling, S.; Meirink, J.F.; Notholt, J.; Petersen,
A.K.; Schrijver, H.; Warneke, T.; Aben, I. Tropical methane emissions: A revised view from
SCIAMACHY onboard ENVISAT. Geophys. Res. Lett. 2008, 35, doi:10.1029/2008GL034300.
13. Yokota, T.; Aoki, T.; Eguchi, N.; Ota, Y.; Yoshida, Y.; Oshchepkov, S.; Bril, A.; Desbiens, R.;
Morino, I. Data retrieval algorithms of the SWIR bands of the TANSO-FTS sensor aboard
GOSAT. J. Remote Sens. Soc. Jpn 2008, 28, 133-142.
14. Payne, V.H.; Clough, S.A.; Shephard, M.W.; Nassar, R.; Logan, J.A. Information-centered
representation of retrievals with limited degrees of freedom for signal: Application to methane
from the Tropospheric Emission Spectrometer. J. Geophys. Res. 2009, 114,
doi:10.1029/2008JD010155.
15. Aumann, H.H.; Chahine, M.T.; Gautier, C.; Goldberg, M.D.; Kalnay, E.; McMillin, L.M.;
Revercomb, H.; Rosenkranz, P.W.; Smith, W.L.; Staelin, D.H.; Strow, L.L.; Susskind, J.
AIRS/AMSU/HSB on the aqua mission: Design, science objectives, data products, and processing
systems. IEEE Trans. Geosci. Remote Sens. 2003, 41, 253-264.
16. Crevoisier, C.; Nobileau, D.; Fiore, A.M.; Armante, R.; Chédin, A.; Scott, N.A. Tropospheric
methane in the tropics—First year from IASI hyperspectral infrared observations. Atmos. Chem.
Phys. 2009, 9, 6337-6350.
17. Razavi, A.; Clerbaux, C.; Wespes, C.; Clarisse, L.; Hurtmans, D.; Payan, S.; Camy-Peyret, C.;
Coheur, P.F.,Characterization of methane retrievals from the IASI space-borne sounder. Atmos.
Chem. Phys. 2009, 9, 7889-7899.
18. Aumann, H.H.; Pagano, T.S. Using AIRS and IASI data to evaluate absolute radiometric accuracy
and stability for climate applications. Proc. SPIE 2008, 7085, doi: 10.1117/12.795225.
19. Xiong, X.; Barnet, C.; Maddy, E.; Sweeney, C.; Liu, X.; Zhou, L.; Goldberg, M. Characterization
and validation of methane products from the Atmospheric Infrared Sounder (AIRS). J. Geophys.
Res. 2008, 113, doi: 10.1029/2007JG000500.
20. Strow, L.L.; Hannon, S.E.; De Souza-Machado, S.; Motteler, H.E.; Tobin, D. An overview of the
AIRS radiative transfer model. IEEE Trans. Geosci. Remote Sens. 2003, 41, 303-313.
21. Xiong, X.; Barnet, C.; Wei, J.; Maddy, E. Information-based mid-upper tropospheric methane
derived from Atmospheric Infrared Sounder (AIRS) and its validation. Atmos. Chem. Phys.
Discuss. 2009, 9, 16331-16360.
Remote Sens. 2010, 2
2530
22. Xiong, X.; Barnet, C.; Zhuang, Q.; Machida, T.; Sweeney, C.; Patra, P.K. Mid-upper tropospheric
methane in the high northern hemisphere: Space-borne observations by AIRS, aircraft
measurements and model simulations. J. Geophys. Res. 2010, 115, D19309.
23. Maddy, E.S.; Barnet, C.D. Vertical resolution estimates in Version 5 of AIRS operational
retrievals. IEEE Trans. Geosci. Remote Sens. 2008, 46, 2375-2384.
24. Singh, H.B.; Brune, W.H.; Crawford, J.H.; Jacob, D.J.; Russell, P.B. Overview of the summer
2004 Intercontinental Chemical Transport Experiment-North America (INTEX-A). J. Geophys.
Res. 2006, 111, doi:10.1029/2006JD007905.
25. Simpson, I.J.; Rowland, F.S.; Meinardi, S.; Blake, D.R. Influence of biomass burning during
recent fluctuations in the slow growth of global tropospheric methane. Geophys. Res. Lett. 2006, 33, L22808.
26. Singh, H.B.; Brune, W.H.; Crawford, J.H.; Flocke, F.; Jacob, D.J. Chemistry and transport of
pollution over the Gulf of Mexico and the Pacific: Spring 2006 INTEX-B campaign overview and
first results. Atmos. Chem. Phys. 2009, 9, 2301-2318.
27. Pan, L.L.; Bowman, K.P. ; Atlas, E.L. ; Wofsy, S.C. ; Zhang, F.; Bresch, J.F.; Ridley, B.A.;
Pittman, J.V.; Homeyer, C.R. ; Romashkin, P.; Cooper, W.A. The Stratosphere-Troposphere
analyses of Regional Transport 2008 (START08) Experiment. Bull. Amer. Meteor. Soc. 2010, 91,
327-342.
28. Jacob, D.J.; Crawford, J.H.; Maring, H.; Clarke, A.D.; Dibb, J.E.; Ferrare, R.A.; Hostetler, C.A.;
Russell, P.B.; Singh, H.B.; Thompson, A.M.; Shaw, G.E.; McCauley, E.; Pederson, J.R.; Fisher,
J.A. The ARCTAS aircraft mission: design and execution. Atmos. Chem. Phys. Discuss. 2009, 9,
17073-17123.
29. Patra, P.K.; Takigawa, M.; Ishijima, K.; Choi, B.-C.; Cunnold, D.; Dlugokencky, E.J.; Fraser, P.;
Gomez-Pelaez, A.J.; Goo, T.-Y.; Kim, J.-S.; Krummel, P.; Langenfelds, R.; Meinhardt, F.; Mukai,
H.; O’Doherty, S.; Prinn, R.G. ; Simmonds, P.; Steele, P.; Tohjima, Y.; Tsuboi, K.; Uhse, K.;
Weiss, R.; Worthy, D.; Nakazawa, T. Growth rate, seasonal, synoptic, diurnal variations and
budget of methane in lower atmosphere. J. Meteorol. Soc. Jpn. 2009, 87, 635-663.
30. GLOBALVIEW-CH4: Cooperative Atmospheric Data Integration Project—Methane; [CD-ROM],
NOAA ESRL: Boulder, CO, USA, 2009.
31. Xiong, X.; Houweling, S.; Wei, J.; Maddy, E.; Sun, F.; Barnet, C. Methane plume over south Asia
during the monsoon season: Satellite observation and model simulation. Atmos. Chem. Phys.
2009, 9, 783-794.
32. Schuck, T.J.; Brenninkmeijer, C.A.M.; Baker, A.K.; Slemr, F.; von Velthoven, P.F.J.; Zahn, A.
Greenhouse gas relationships in the Indian summer monsoon plume measured by the CARIBIC
passenger aircraft. Atmos. Chem. Phys. 2010, 10, 3965-3984.
© 2010 by the authors; licensee MDPI, Basel, Switzerland. This article is an open access article
distributed under the terms and conditions of the Creative Commons Attribution license
(http://creativecommons.org/licenses/by/3.0/).