Using NASA Satellite and Reanalysis to Provide Climate Data ...
Upload
khangminh22Category
view
1download
0
HAL Id: hal-02872319https://hal.archives-ouvertes.fr/hal-02872319
Submitted on 17 Jun 2020
HAL is a multi-disciplinary open accessarchive for the deposit and dissemination of sci-entific research documents, whether they are pub-lished or not. The documents may come fromteaching and research institutions in France orabroad, or from public or private research centers.
L’archive ouverte pluridisciplinaire HAL, estdestinée au dépôt et à la diffusion de documentsscientifiques de niveau recherche, publiés ou non,émanant des établissements d’enseignement et derecherche français ou étrangers, des laboratoirespublics ou privés.
REanalysis of the TROpospheric chemical compositionover the past 40 years FIRE ENGINE View project
FUELMON -remote FUEL break MONitoring for forestfire protection View project
M.G. Schultz, L. Backman, yves Balkanski, S. Bjoerndalsaeter, R. Brand, J.P.Burrows, S. Dalsoeren, M. de Vasconcelos, B. Grodtmann, D. A.
Hauglustaine, et al.
To cite this version:M.G. Schultz, L. Backman, yves Balkanski, S. Bjoerndalsaeter, R. Brand, et al.. REanalysis of theTROpospheric chemical composition over the past 40 years FIRE ENGINE View project FUELMON-remote FUEL break MONitoring for forest fire protection View project. [Research Report] Max-Planck-Institut für Meteorologie e.V., Hamburg. 2007. �hal-02872319�

See discussions, stats, and author profiles for this publication at: https://www.researchgate.net/publication/271585931
REanalysis of the TROpospheric chemical composition over the past 40 years
Technical Report · August 2007
CITATIONS
9READS
405
38 authors, including:
Some of the authors of this publication are also working on these related projects:
FIRE ENGINE View project
FUELMON - remote FUEL break MONitoring for forest fire protection View project
Leif Backman
Finnish Meteorological Institute
61 PUBLICATIONS 936 CITATIONS
SEE PROFILE
Yves Balkanski
Université Paris Saclay and CEA
282 PUBLICATIONS 21,805 CITATIONS
SEE PROFILE
Angelika Heil
Max Planck Institute for Meteorology
65 PUBLICATIONS 5,062 CITATIONS
SEE PROFILE
Judith Johanna Hoelzemann
Universidade Federal do Rio Grande do Norte
38 PUBLICATIONS 1,801 CITATIONS
SEE PROFILE
All content following this page was uploaded by Yves Balkanski on 08 December 2016.
The user has requested enhancement of the downloaded file.
REanalysis of the TROpospheric chemical composition over the past 40 years
A long-term global modeling study of tropospheric chemistry funded under the 5th EU framework programme
Project Number: EVK2-CT-2002-00170 (RETRO)Call identifier: EESD-ESD-3 (JO 2000/C 324/09)
FINAL REPORTFINAL REPORT
edited by Martin G. Schultz

M.G. Schultz, L. Backman, Y. Balkanski, S. Bjoerndalsaeter, R. Brand, J.P. Burrows, S. Dalsoeren, M. de Vasconcelos, B. Grodtmann, D.A. Hauglustaine, A. Heil, J.J. Hoelzemann, I.S.A. Isaksen, J. Kaurola, W. Knorr, A. Ladstaetter-Weißenmayer, B. Mota, D. Oom, J. Pacyna, D. Panasiuk, J.M.C. Pereira, T. Pulles, J. Pyle, S. Rast, A. Richter, N. Savage, C. Schnadt, M. Schulz, A. Spessa, J. Staehelin, J.K. Sundet, S. Szopa, K. Thonicke, M. van het Bolscher, T. van Noije, P. van Velthoven, A.F. Vik, F. Wittrock REanalysis of the TROpospheric chemical composition over the past 40 years (RETRO) — A long-term global modeling study of tropospheric chemistry Final Report Jülich/Hamburg, Germany, August 2007 Published as report no. 48/2007 in the series „Reports on Earth System Science“ of the Max Planck Institute for Meteorology, Hamburg, ISSN 1614-1199 The RETRO project was funded under the 5th EU framework programme Contract Number: EVK2-CT-2002-00170 (RETRO) Call identifier: EESD-ESD-3 (JO 2000/C 324/09) Co-ordinating institute: Max Planck Institute for Meteorology, Hamburg, Germany Co-ordinating scientist: Dr. Martin G. Schultz (now at ICG-2, Forschungszentrum Jülich, Germany) Project web page: http://retro.enes.org Ftp server: ftp://ftp.retro.enes.org

Contents
Contents................................................................................................................................................... 3 1. Abstract ............................................................................................................................................... 5 2. Background, Scientific/Technical Objectives and Innovation ............................................................ 9
2.1 Rationale........................................................................................................................................ 9 2.2 Objectives.................................................................................................................................... 11 2.3 Innovation.................................................................................................................................... 14
3. Project Structure and Management ................................................................................................... 15 3.1 The RETRO consortium.............................................................................................................. 15 3.2 Work package structure............................................................................................................... 15 3.3 Coordination activities ................................................................................................................ 17 3.4 Project timeline............................................................................................................................ 19
4. Main Scientific Results ..................................................................................................................... 21 4.1 New Emission Inventories and Analysis of Emission Trends..................................................... 21 4.2 Collection and Use of Atmospheric Observations ...................................................................... 33 4.3 Investigations of Model Sensitivities and Definition of Evaluation Strategy ............................. 37 4.4 The RETRO Reanalysis Simulations .......................................................................................... 42 4.5 Policy Implications and Scenario Studies ................................................................................... 57
5. Conclusions ....................................................................................................................................... 63 6. References ......................................................................................................................................... 65 7. Publications ....................................................................................................................................... 71
7.1 Peer Reviewed Journal Articles and PhD theses ......................................................................... 71 7.2 Conference Contributions............................................................................................................ 76
8. The Consortium: Partner contribution summaries ............................................................................ 85 8.1 Max Planck Institute for Meteorology (MPG-IMET) ................................................................. 85 8.2 Laboratoire des Sciences du Climat et de l'Environnement (LSCE)........................................... 90 8.3 University of Oslo (UiO)............................................................................................................. 94 8.4 Royal Netherlands Meteorological Institute (KNMI) ................................................................. 97 8.5 University of Cambridge (UCamb) ........................................................................................... 100 8.6 Norwegian Institute for Air Research (NILU) .......................................................................... 103 8.7 University of Bremen (IUP) ...................................................................................................... 105 8.8. Swiss Federal Institute of Technology (ETH-Z) ...................................................................... 108 8.9 Finnish Meteorological Institute (FMI)..................................................................................... 111 8.10 TNO Built Environment and Geosciences .............................................................................. 114 8.11 Tropical Research Institute (IICT) .......................................................................................... 117 8.12 Max-Planck-Institute for Biogeochemistry, Jena (MPI-BGC)................................................ 119
9. RETRO Deliverables....................................................................................................................... 121 9.1 Project Reports .......................................................................................................................... 121 9.2 Other deliverables...................................................................................................................... 122


5
1. Abstract
Contract n° EVK2002-CT-00170 Project Duration: 01/2003-06/2006
Title REanalysis of the TROpospheric chemical composition over the past 40 years (RETRO)
Objectives: • exploit (often under-utilised) existing data sets from ground based stations,
aircraft, and satellite instruments, integrating these into common datasets, • develop tools for the analysis, interpretation and exploitation of the data, • formulate recommendations for future measurement strategies, • assess changes in trace compound emissions and their effect on tropospheric
chemical composition and aerosols, and the associated radiative forcing, over the past 40 years,
• provide an assessment of uncertainties caused by climate variability, • evaluate emission control strategies in Europe, • predict changes over the next 20 years in tropospheric composition, and
radiative forcing through model studies using the emission scenarios defined for the IPCC 2001 climate assessment,
• analyze the magnitude of intercontinental pollutant transport.
Scientific achievements: • first detailed, comprehensive and consistent data sets on global emissions
from fossil and biofuel combustion and from open vegetation burning covering the time period 1960-2000; available as gridded data sets with 0.5°×0.5° and monthly mean resolution,
• first global long-term atmospheric chemistry integrations with several state-of-the-art models using the ERA-40 meteorological data, the RETRO emissions and other constrains in a consistent and well-documented manner,
• analysis of key parameters controlling the interannual and seasonal variability and the longer-term trends in the tropospheric composition related to ozone and its precursors,
• development of new software tools for the analysis of observational data and model results; standardisation of model output and data formats and definition of model evaluation metrics and skill scores,
• development of a comprehensive data base for tropospheric composition observations with complete metadata definition and a user-friendly interface for data access,
• multi-model analysis of specific scenarios related to power generation and the traffic sector in OECD countries,
• contributions to the IPCC 4th assessment report through participation in a multi-model assessment study coordinated by the ACCENT network of excellence
Main deliverables:
• gridded data sets of global emissions from 1960 to 2000 (D1-4) • gridded data sets of simulated concentrations of ozone and ozone precursors
from 1960 to 2000 (D4-3) • data base of atmospheric observations (D2-1 and D2-2) • several reports; in particular:
6
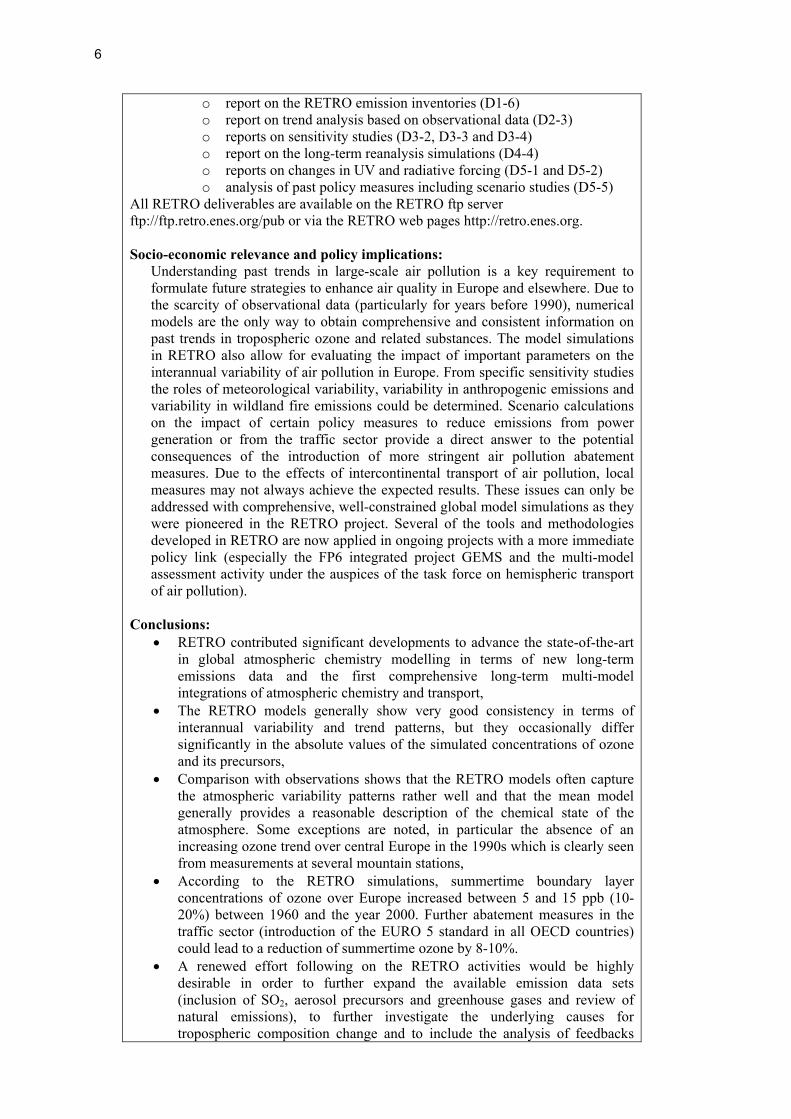
o report on the RETRO emission inventories (D1-6) o report on trend analysis based on observational data (D2-3) o reports on sensitivity studies (D3-2, D3-3 and D3-4) o report on the long-term reanalysis simulations (D4-4) o reports on changes in UV and radiative forcing (D5-1 and D5-2) o analysis of past policy measures including scenario studies (D5-5)
All RETRO deliverables are available on the RETRO ftp server ftp://ftp.retro.enes.org/pub or via the RETRO web pages http://retro.enes.org. Socio-economic relevance and policy implications:
Understanding past trends in large-scale air pollution is a key requirement to formulate future strategies to enhance air quality in Europe and elsewhere. Due to the scarcity of observational data (particularly for years before 1990), numerical models are the only way to obtain comprehensive and consistent information on past trends in tropospheric ozone and related substances. The model simulations in RETRO also allow for evaluating the impact of important parameters on the interannual variability of air pollution in Europe. From specific sensitivity studies the roles of meteorological variability, variability in anthropogenic emissions and variability in wildland fire emissions could be determined. Scenario calculations on the impact of certain policy measures to reduce emissions from power generation or from the traffic sector provide a direct answer to the potential consequences of the introduction of more stringent air pollution abatement measures. Due to the effects of intercontinental transport of air pollution, local measures may not always achieve the expected results. These issues can only be addressed with comprehensive, well-constrained global model simulations as they were pioneered in the RETRO project. Several of the tools and methodologies developed in RETRO are now applied in ongoing projects with a more immediate policy link (especially the FP6 integrated project GEMS and the multi-model assessment activity under the auspices of the task force on hemispheric transport of air pollution).
Conclusions:
• RETRO contributed significant developments to advance the state-of-the-art in global atmospheric chemistry modelling in terms of new long-term emissions data and the first comprehensive long-term multi-model integrations of atmospheric chemistry and transport,
• The RETRO models generally show very good consistency in terms of interannual variability and trend patterns, but they occasionally differ significantly in the absolute values of the simulated concentrations of ozone and its precursors,
• Comparison with observations shows that the RETRO models often capture the atmospheric variability patterns rather well and that the mean model generally provides a reasonable description of the chemical state of the atmosphere. Some exceptions are noted, in particular the absence of an increasing ozone trend over central Europe in the 1990s which is clearly seen from measurements at several mountain stations,
• According to the RETRO simulations, summertime boundary layer concentrations of ozone over Europe increased between 5 and 15 ppb (10-20%) between 1960 and the year 2000. Further abatement measures in the traffic sector (introduction of the EURO 5 standard in all OECD countries) could lead to a reduction of summertime ozone by 8-10%.
• A renewed effort following on the RETRO activities would be highly desirable in order to further expand the available emission data sets (inclusion of SO2, aerosol precursors and greenhouse gases and review of natural emissions), to further investigate the underlying causes for tropospheric composition change and to include the analysis of feedbacks

7
between tropospheric ozone, climate change and aerosols.
Dissemination of results: • more than 30 articles appeared in peer reviewed scientific journals with direct
or indirect contributions from the RETRO project, • RETRO project results were presented in more than 100 conference
contributions and presentations at international meetings, • a specific session on “tropospheric trends and variability” was inaugurated at
the EGU General Symposium 2004 and was repeated in 2006 and 2007, • RETRO emission data sets are being used in several ongoing research
projects (e.g. GEMS and TFHTAP, GREENCYCLES, etc.), • All RETRO data sets and reports are available on the RETRO ftp server
ftp://ftp.retro.enes.org/pub or via the RETRO web pages at http://retro.enes.org.
Keywords:
Tropospheric ozone, air quality, global atmospheric chemistry, anthropogenic emissions, biomass burning, trends and variability, power generation, traffic emissions

8

9
2. Background, Scientific/Technical Objectives and Innovation
2.1 Rationale The available historic observations of tropospheric ozone and its precursors provide ample evidence for a large-scale increase of ambient air pollutant concentrations throughout the northern hemisphere beginning with the industrialisation and accelerating after World War II (cf. Volz and Kley, 1988; Logan, 1994; Staehelin et al., 1994; Logan et al., 1999; Oltmans et al., 1998, 2006; Roemer, 2001; Akimoto, 2003; Brasseur et al., 2003; Jaffe et al., 2003; Galloway et al., 2004; Simmonds et al., 2004; Rinsland et al., 2007; Assonov et al., 2007; US EPA, 2000; IPCC, 2001) The increasing pollutant levels have caused various detrimental effects on human health (Donaldson et al., 1999; WHO, 2003), agricultural crops (Chameides et al., 1999; Emberson et al., 2001; Fowler et al., 2003; Wang and Mauzerall, 2004), natural ecosystems (cf. Bobbink et al., 1998; Ashmore, 2005; Volk et al., 2006; Karnosky et al., 2007) and cultural heritage (Watkiss et al., 2001; Brimblecombe, 1987a, 1987b; Jacobson, 2002). While the worst consequences are associated with extreme events and air pollution in cities, there is also substantial evidence for adverse impacts of lower air pollution levels (Lippmann et al., 2003; WHO, 2003). To mitigate these it is important to understand the changes in the so-called background pollutant concentrations.
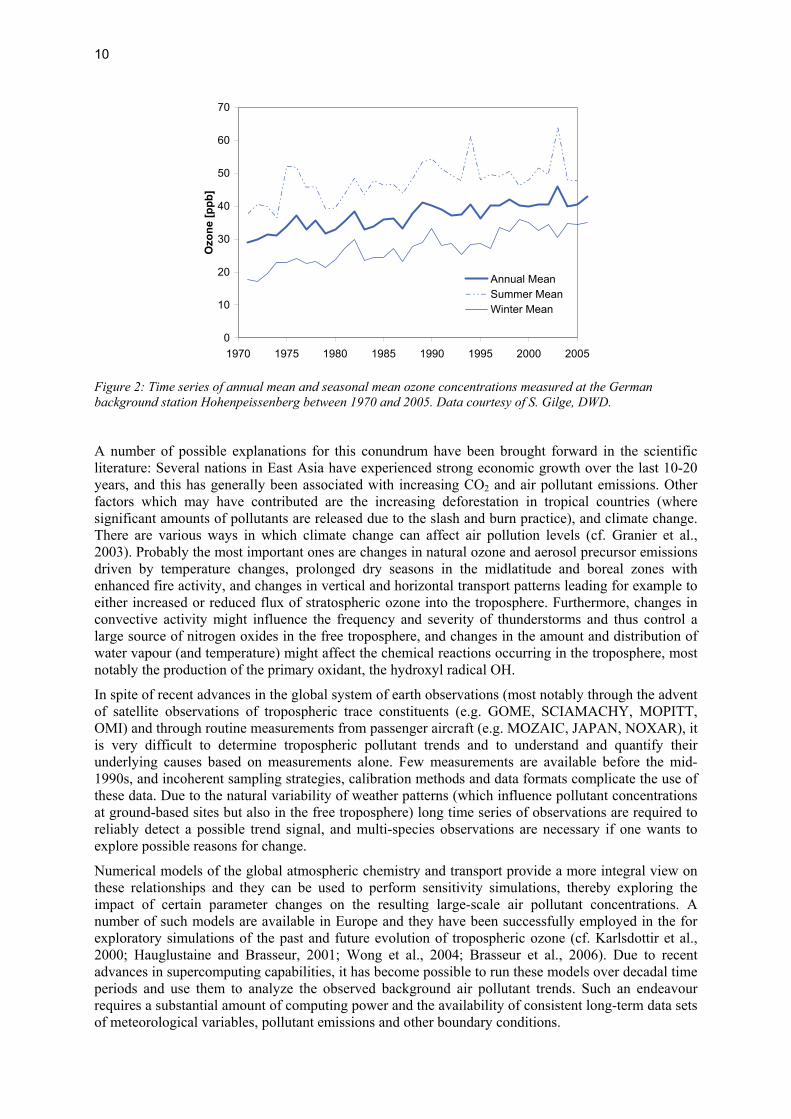
Before the 1980s when several industrialized countries began to introduce legislation and abatement measures to curb air pollution, the increase in background pollutant concentrations was consistent with rising emissions of greenhouse gases and air pollutants from anthropogenic activities. Since the 1990s the emissions of ozone precursors in Europe, North America and Japan have significantly decreased. This led to an observable reduction in the urban and rural concentrations of ozone precursor species (Figure 1; see also Volz-Thomas et al., 2003; Monks et al., 2003). Even on the global scale carbon monoxide concentrations measured at several remote locations show a significant decrease during the 1990s (Novelli et al., 2003), and a decline of Arctic haze during the 1980s and 1990s was reported by Bodhaine and Dutton (1993). However, no clear downward trend could be determined for tropospheric ozone which is photochemically produced in the troposphere from these precursor substances (Figure 2; cf. Logan et al., 1999; Roemer, 2001; Volz-Thomas et al., 2003; Simmonds et al., 2004; Oltmans et al., 2006). More recent observations also seem to indicate a reversal of the declining trend for CO (Rinsland et al., 2007).
NO2
NO
10
15
20
25
30
35
40
45
50
55
1981 1983 1985 1987 1989 1991 1993 1995 1997 1999 2001 2003
year
conc
entr
atio
n( μ
g/m
3 )
NO2
NO
10
15
20
25
30
35
40
45
50
55
1981 1983 1985 1987 1989 1991 1993 1995 1997 1999 2001 2003
year
conc
entr
atio
n( μ
g/m
3 )
Figure 1: Observed reduction of ozone precursor species at urban stations in North Rhine Westphalia from 1981 to 2003. The symbols show annual average concentrations of nitrogen oxides. A similar decrease was observed for carbon monoxide and some regulated hydrocarbons (i.e. benzene, toluene). Figure courtesy H. Geiß, FZ Jülich.
10
0
10
20
30
40
50
60
70
1970 1975 1980 1985 1990 1995 2000 2005
Ozo
ne [p
pb]
Annual MeanSummer MeanWinter Mean
Figure 2: Time series of annual mean and seasonal mean ozone concentrations measured at the German background station Hohenpeissenberg between 1970 and 2005. Data courtesy of S. Gilge, DWD.
A number of possible explanations for this conundrum have been brought forward in the scientific literature: Several nations in East Asia have experienced strong economic growth over the last 10-20 years, and this has generally been associated with increasing CO2 and air pollutant emissions. Other factors which may have contributed are the increasing deforestation in tropical countries (where significant amounts of pollutants are released due to the slash and burn practice), and climate change. There are various ways in which climate change can affect air pollution levels (cf. Granier et al., 2003). Probably the most important ones are changes in natural ozone and aerosol precursor emissions driven by temperature changes, prolonged dry seasons in the midlatitude and boreal zones with enhanced fire activity, and changes in vertical and horizontal transport patterns leading for example to either increased or reduced flux of stratospheric ozone into the troposphere. Furthermore, changes in convective activity might influence the frequency and severity of thunderstorms and thus control a large source of nitrogen oxides in the free troposphere, and changes in the amount and distribution of water vapour (and temperature) might affect the chemical reactions occurring in the troposphere, most notably the production of the primary oxidant, the hydroxyl radical OH.
In spite of recent advances in the global system of earth observations (most notably through the advent of satellite observations of tropospheric trace constituents (e.g. GOME, SCIAMACHY, MOPITT, OMI) and through routine measurements from passenger aircraft (e.g. MOZAIC, JAPAN, NOXAR), it is very difficult to determine tropospheric pollutant trends and to understand and quantify their underlying causes based on measurements alone. Few measurements are available before the mid-1990s, and incoherent sampling strategies, calibration methods and data formats complicate the use of these data. Due to the natural variability of weather patterns (which influence pollutant concentrations at ground-based sites but also in the free troposphere) long time series of observations are required to reliably detect a possible trend signal, and multi-species observations are necessary if one wants to explore possible reasons for change.
Numerical models of the global atmospheric chemistry and transport provide a more integral view on these relationships and they can be used to perform sensitivity simulations, thereby exploring the impact of certain parameter changes on the resulting large-scale air pollutant concentrations. A number of such models are available in Europe and they have been successfully employed in the for exploratory simulations of the past and future evolution of tropospheric ozone (cf. Karlsdottir et al., 2000; Hauglustaine and Brasseur, 2001; Wong et al., 2004; Brasseur et al., 2006). Due to recent advances in supercomputing capabilities, it has become possible to run these models over decadal time periods and use them to analyze the observed background air pollutant trends. Such an endeavour requires a substantial amount of computing power and the availability of consistent long-term data sets of meteorological variables, pollutant emissions and other boundary conditions.
11
Since about thirty years, numerical models of the physical atmosphere have been successfully employed in weather prediction and for the retrospective analysis of weather patterns and events in so-called reanalysis simulations. This has become possible through the development of sophisticated mathematical methods of integrating various kinds of observational data into the numerical simulation in order to prevent a model drift or biases; a process called data assimilation. At the time when the RETRO proposal was formulated, the European Centre for Medium Range Weather Forecast (ECMWF) was producing a major reanalysis to reproduce the weather over the last 40-some years from 1957 to the year 2001 (Uppala et al., 2005). This prompted the idea to apply a similar concept and undertake the first global long-term reanalysis simulations of tropospheric chemistry as a concerted European research effort. The project assembled a consortium of 12 European research institutions involved in various aspects of data analysis and modelling and began its work in January 2003.
2.2 Objectives The primary objective of the RETRO project was to understand, detect and assess long-term changes and interannual variability of the tropospheric chemical composition over the last 40 years, thereby providing the essential framework within which to understand possible future changes.
The proposed research programme therefore formulated as its goal to carry out the first comprehensive global long-term simulations where changes in emissions, meteorology, and stratospheric conditions are taken into account in a consistent manner, i.e. to perform a reanalysis of the tropospheric chemical composition over the last 40 years. In order to deliver on this primary objective the project aimed at:
• exploiting (often under-utilised) existing data sets from ground based stations, aircraft, and satellite instruments, integrating these into common datasets,
• developing tools for the analysis, interpretation and exploitation of the data, • formulating recommendations for future measurement strategies, • assessing changes in trace compound emissions and their effect on tropospheric chemical
composition and aerosols, and the associated radiative forcing, over the past 40 years, • providing an assessment of uncertainties caused by climate variability, • evaluating emission control strategies in Europe, • predicting changes over the next 20 years in tropospheric composition, and radiative forcing
through model studies using the emission scenarios defined for the IPCC 2001 climate assessment,
• analyzing the magnitude of intercontinental pollutant transport.
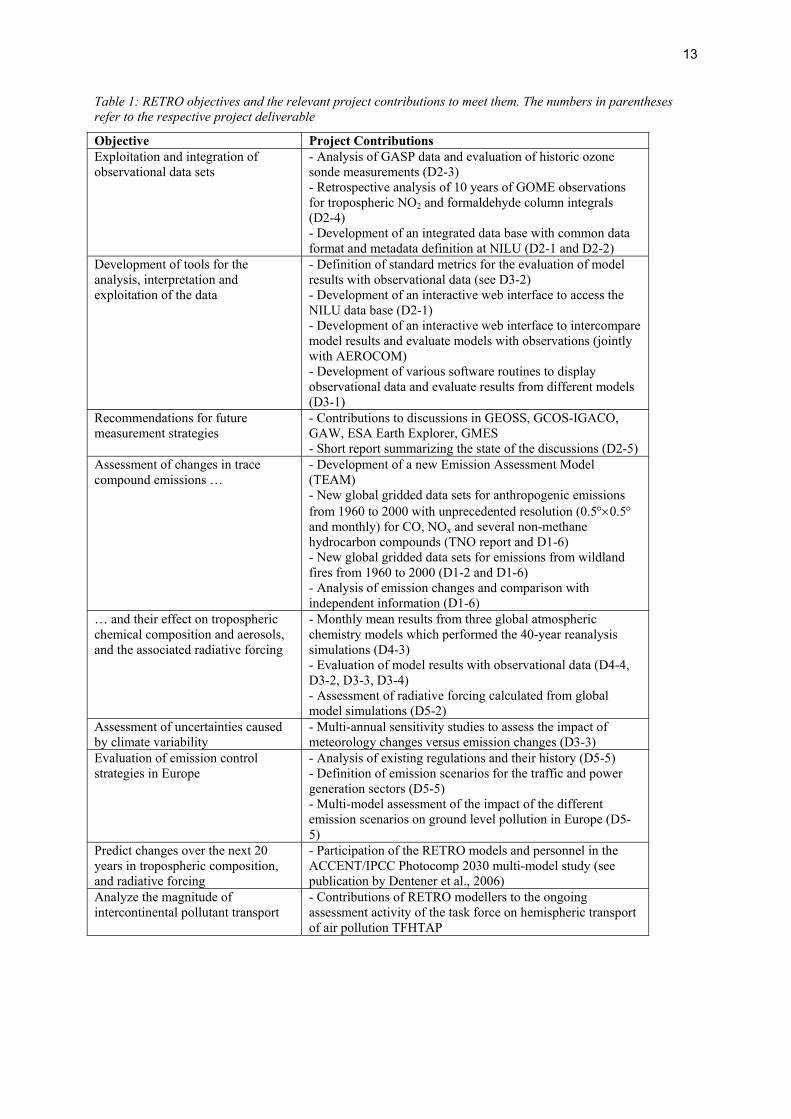
Table 1 provides an overview how these objectives were met in the project.
The application of the ECMWF reanalysis ERA-40 was the first major exploitation of that data set for atmospheric composition studies and it was therefore expected to make a significant European contribution to investigations of global change. The simulations carried out in the RETRO project were addressing one of the key recommendations for further research from the IPCC 2001 report, namely to provide baseline data against which future climate scenarios can be evaluated.
The RETRO model integrations considered key pollutant species (ozone, CO, NOx, HNO3, VOC), key compounds in tropospheric oxidation (ozone, OH, H2O2, CO, methane), and key compounds for radiative forcing (methane, ozone, H2O). For technical reasons and due to limited resources, the project focused entirely on reactive gas-phase compounds and ignored the potentially important impacts from changes in aerosol compounds and aerosol precursor species (SO2, sulphate, black carbon, organic carbon, dust and sea salt). A major effort was necessary to ensure that model input (emission fluxes) and stratospheric boundary data are consistent and representative for the time period of the simulations. It would have required too many resources to extend this effort to include all relevant aerosol compounds as well.

12
The project adopted a multi-model ensemble approach in order to quantify and reduce the uncertainties due to the formulation of any individual model. Altogether five different European models participated in the RETRO simulations. Three of these were chemistry transport models which made direct use of the ERA-40 data to specify the meteorology and transport patterns (TM4 run by KNMI, p-TOMCAT run by University of Cambridge and CTM2 run by UiO). The other two models were general circulation models with a chemistry module built into the code (LMDz-INCA by LSCE and ECHAM5-MOZ/MOZECH by MPG-IMET). The ECHAM5-MOZ model was developed specifically for the RETRO project because of concerns regarding the use of ERA-40 data for chemistry transport modelling. All models were evaluated and their performance was assessed through intercomparisons, sensitivity studies, and careful evaluation with available observational data. Three of the five models (the two general circulation models and the TM4 model) ran the complete 41-year reanalysis simulations, while the others were used for time slice experiments and sensitivity studies focusing on the 1990s.
13
Table 1: RETRO objectives and the relevant project contributions to meet them. The numbers in parentheses refer to the respective project deliverable
Objective Project Contributions Exploitation and integration of observational data sets
- Analysis of GASP data and evaluation of historic ozone sonde measurements (D2-3) - Retrospective analysis of 10 years of GOME observations for tropospheric NO2 and formaldehyde column integrals (D2-4) - Development of an integrated data base with common data format and metadata definition at NILU (D2-1 and D2-2)
Development of tools for the analysis, interpretation and exploitation of the data
- Definition of standard metrics for the evaluation of model results with observational data (see D3-2) - Development of an interactive web interface to access the NILU data base (D2-1) - Development of an interactive web interface to intercompare model results and evaluate models with observations (jointly with AEROCOM) - Development of various software routines to display observational data and evaluate results from different models (D3-1)
Recommendations for future measurement strategies
- Contributions to discussions in GEOSS, GCOS-IGACO, GAW, ESA Earth Explorer, GMES - Short report summarizing the state of the discussions (D2-5)
Assessment of changes in trace compound emissions …
- Development of a new Emission Assessment Model (TEAM) - New global gridded data sets for anthropogenic emissions from 1960 to 2000 with unprecedented resolution (0.5°×0.5° and monthly) for CO, NOx and several non-methane hydrocarbon compounds (TNO report and D1-6) - New global gridded data sets for emissions from wildland fires from 1960 to 2000 (D1-2 and D1-6) - Analysis of emission changes and comparison with independent information (D1-6)
… and their effect on tropospheric chemical composition and aerosols, and the associated radiative forcing
- Monthly mean results from three global atmospheric chemistry models which performed the 40-year reanalysis simulations (D4-3) - Evaluation of model results with observational data (D4-4, D3-2, D3-3, D3-4) - Assessment of radiative forcing calculated from global model simulations (D5-2)
Assessment of uncertainties caused by climate variability
- Multi-annual sensitivity studies to assess the impact of meteorology changes versus emission changes (D3-3)
Evaluation of emission control strategies in Europe
- Analysis of existing regulations and their history (D5-5) - Definition of emission scenarios for the traffic and power generation sectors (D5-5) - Multi-model assessment of the impact of the different emission scenarios on ground level pollution in Europe (D5-5)
Predict changes over the next 20 years in tropospheric composition, and radiative forcing
- Participation of the RETRO models and personnel in the ACCENT/IPCC Photocomp 2030 multi-model study (see publication by Dentener et al., 2006)
Analyze the magnitude of intercontinental pollutant transport
- Contributions of RETRO modellers to the ongoing assessment activity of the task force on hemispheric transport of air pollution TFHTAP
14
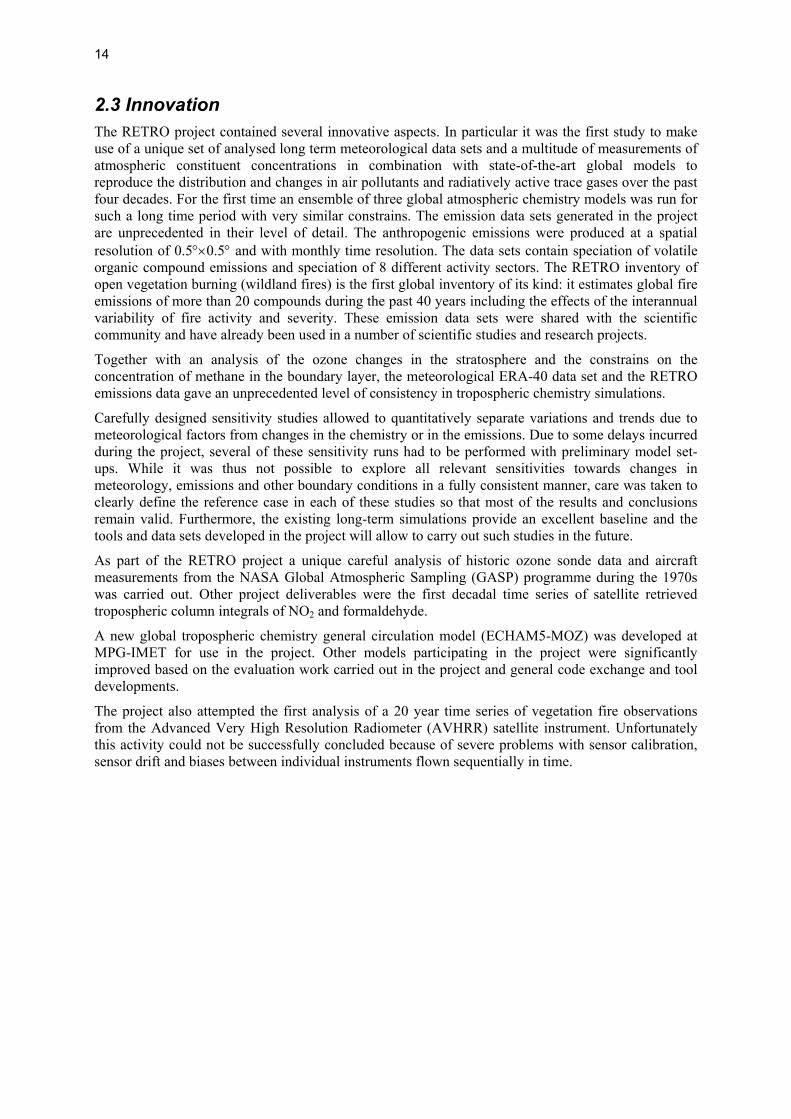
2.3 Innovation The RETRO project contained several innovative aspects. In particular it was the first study to make use of a unique set of analysed long term meteorological data sets and a multitude of measurements of atmospheric constituent concentrations in combination with state-of-the-art global models to reproduce the distribution and changes in air pollutants and radiatively active trace gases over the past four decades. For the first time an ensemble of three global atmospheric chemistry models was run for such a long time period with very similar constrains. The emission data sets generated in the project are unprecedented in their level of detail. The anthropogenic emissions were produced at a spatial resolution of 0.5°×0.5° and with monthly time resolution. The data sets contain speciation of volatile organic compound emissions and speciation of 8 different activity sectors. The RETRO inventory of open vegetation burning (wildland fires) is the first global inventory of its kind: it estimates global fire emissions of more than 20 compounds during the past 40 years including the effects of the interannual variability of fire activity and severity. These emission data sets were shared with the scientific community and have already been used in a number of scientific studies and research projects.
Together with an analysis of the ozone changes in the stratosphere and the constrains on the concentration of methane in the boundary layer, the meteorological ERA-40 data set and the RETRO emissions data gave an unprecedented level of consistency in tropospheric chemistry simulations.
Carefully designed sensitivity studies allowed to quantitatively separate variations and trends due to meteorological factors from changes in the chemistry or in the emissions. Due to some delays incurred during the project, several of these sensitivity runs had to be performed with preliminary model set-ups. While it was thus not possible to explore all relevant sensitivities towards changes in meteorology, emissions and other boundary conditions in a fully consistent manner, care was taken to clearly define the reference case in each of these studies so that most of the results and conclusions remain valid. Furthermore, the existing long-term simulations provide an excellent baseline and the tools and data sets developed in the project will allow to carry out such studies in the future.
As part of the RETRO project a unique careful analysis of historic ozone sonde data and aircraft measurements from the NASA Global Atmospheric Sampling (GASP) programme during the 1970s was carried out. Other project deliverables were the first decadal time series of satellite retrieved tropospheric column integrals of NO2 and formaldehyde.
A new global tropospheric chemistry general circulation model (ECHAM5-MOZ) was developed at MPG-IMET for use in the project. Other models participating in the project were significantly improved based on the evaluation work carried out in the project and general code exchange and tool developments.
The project also attempted the first analysis of a 20 year time series of vegetation fire observations from the Advanced Very High Resolution Radiometer (AVHRR) satellite instrument. Unfortunately this activity could not be successfully concluded because of severe problems with sensor calibration, sensor drift and biases between individual instruments flown sequentially in time.
15
3. Project Structure and Management
3.1 The RETRO consortium To accomplish its goal to understand, detect and assess long-term changes and interannual variability of the tropospheric chemical composition over the last 40 years the RETRO project brought together a consortium of 12 partners (Table 2) with expertise in atmospheric modelling and measurements. Of the partners listed in Table 2, five have a long record in the development and application of global atmospheric chemistry and general circulation models, and four institutions are known for their skills in measuring atmospheric trace constituents or interpreting these measurements. The other partners are experts in other aspects of the biogeochemical system and the derivation of emission data, which is crucial of any attempt to analyse the chemical composition of the troposphere in historic or recent times. Detailed information on the individual partners’ contributions is given in section 8 of this report. We would also like to acknowledge the support of the Research Centre Jülich, Germany (FZJ), where the project coordinator moved after the official end of the project. FZJ made the computing resources available to carry out the second reanalysis run with the ECHAM5-MOZ model.
Table2: List of partner institutes participating in the RETRO project
Partner Institution 1 Max-Planck-Institute for Meteorology (MPG-IMET), Hamburg, Germany
2, 13 Laboratoire des Sciences du Climat et de l'Environnement (LSCE), Gif-sur-Yvette, France*
3 University of Oslo (UiO), Oslo, Norway 4 Royal Netherlands Meteorological Institute (KNMI), De Bilt, The Netherlands 5 University of Cambridge (UCamb), Cambridge, UK 6 Norwegian Institute for Air Research (NILU), Kjeller, Norway 7 Institute of Remote Environmental Physics and Remote Sensing, University of Bremen (IUP),
Bremen, Germany 8 Swiss Federal Institute of Technology (ETH-Z), Zürich, Switzerland 9 Finnish Meteorological Institute (FMI), Helsinki, Finland
10 TNO, Apeldoorn, The Netherlands 11 Tropical Research Institute (IICT), Lisboa, Portugal§ 12 Max-Planck-Institute for Biosphere Research (MPI-BGC), Jena, Germany
* for administrative reasons, LSCE is formally represented as two partners (CNRS/LSCE=2 and CEA/LSCE=13) § all administrative duties and work contributions from IICT were transferred to the Instituto Superior de Agronomia of the University of Lisbon (ISA.DEF) in year 2 of the project
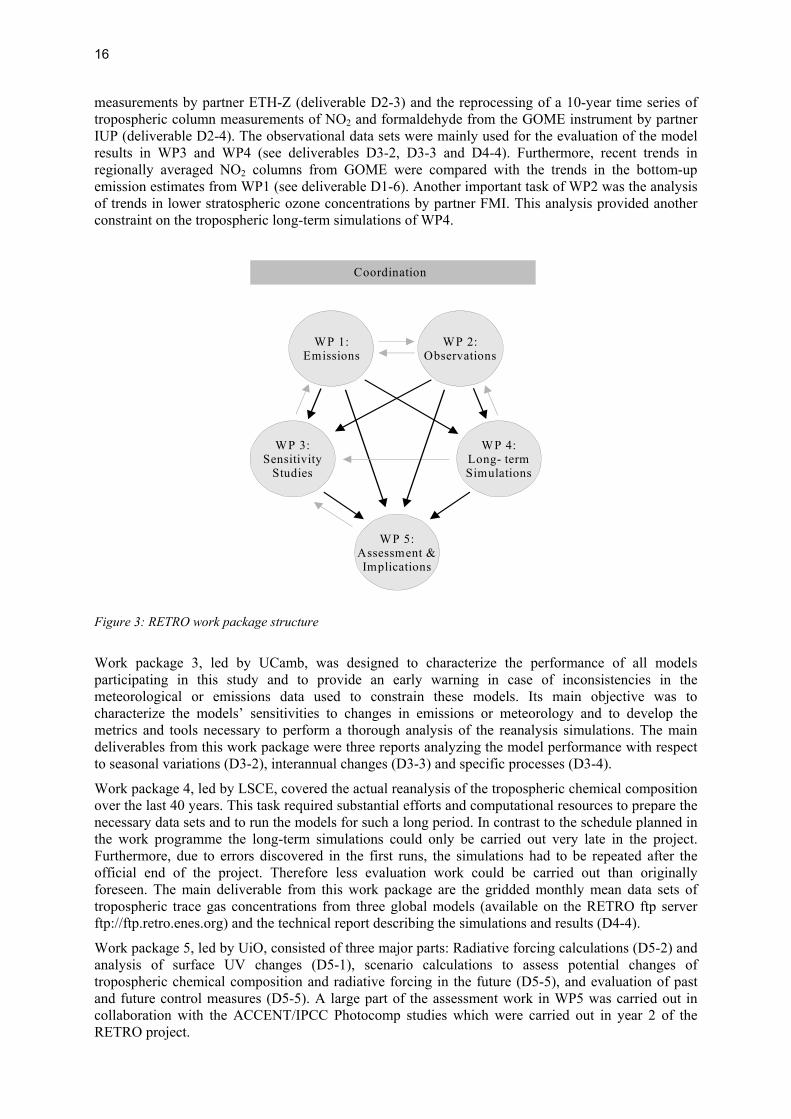
3.2 Work package structure The project consisted of five scientific work packages plus the coordination activities. Figure 3 shows the structure of the project and the dominant links between the individual work packages.
Work Package 1, led by MPG-IMET, had the task to improve the available estimates of historic emissions from fossil fuel and biofuel combustion, open vegetation burning, biogenic and other natural sources and compile a consistent data set of emissions over the last 40 years. The focus of this work was placed on the emissions from fossil and biofuel combustion (partners TNO and MPG-IMET) and the emissions from open vegetation burning (partners MPG-IMET, MPI-BGC, IICT). The resulting data sets were used as input to the model simulations in WPs 3 and 4 and provided the baseline data for the assessment work package (WP5). The emission data sets were also used to help the interpretation of the observational data in WP2.
Work package 2, led by NILU, collected and evaluated historic and recent chemical observations from a variety of measurement platforms and developed a new distributed data base to make these data available to the wider research community. Three main tasks in this work package were the analysis of aircraft data from the GASP programme in the 1970s and the evaluation of historic ozone sonde
16
measurements by partner ETH-Z (deliverable D2-3) and the reprocessing of a 10-year time series of tropospheric column measurements of NO2 and formaldehyde from the GOME instrument by partner IUP (deliverable D2-4). The observational data sets were mainly used for the evaluation of the model results in WP3 and WP4 (see deliverables D3-2, D3-3 and D4-4). Furthermore, recent trends in regionally averaged NO2 columns from GOME were compared with the trends in the bottom-up emission estimates from WP1 (see deliverable D1-6). Another important task of WP2 was the analysis of trends in lower stratospheric ozone concentrations by partner FMI. This analysis provided another constraint on the tropospheric long-term simulations of WP4.
Coordination
WP 1:Emissions
WP 2:Observations
WP 5:Assessment &Implications
WP 3:Sensitivity
Studies
WP 4:Long- termSimulations
Figure 3: RETRO work package structure
Work package 3, led by UCamb, was designed to characterize the performance of all models participating in this study and to provide an early warning in case of inconsistencies in the meteorological or emissions data used to constrain these models. Its main objective was to characterize the models’ sensitivities to changes in emissions or meteorology and to develop the metrics and tools necessary to perform a thorough analysis of the reanalysis simulations. The main deliverables from this work package were three reports analyzing the model performance with respect to seasonal variations (D3-2), interannual changes (D3-3) and specific processes (D3-4).
Work package 4, led by LSCE, covered the actual reanalysis of the tropospheric chemical composition over the last 40 years. This task required substantial efforts and computational resources to prepare the necessary data sets and to run the models for such a long period. In contrast to the schedule planned in the work programme the long-term simulations could only be carried out very late in the project. Furthermore, due to errors discovered in the first runs, the simulations had to be repeated after the official end of the project. Therefore less evaluation work could be carried out than originally foreseen. The main deliverable from this work package are the gridded monthly mean data sets of tropospheric trace gas concentrations from three global models (available on the RETRO ftp server ftp://ftp.retro.enes.org) and the technical report describing the simulations and results (D4-4).
Work package 5, led by UiO, consisted of three major parts: Radiative forcing calculations (D5-2) and analysis of surface UV changes (D5-1), scenario calculations to assess potential changes of tropospheric chemical composition and radiative forcing in the future (D5-5), and evaluation of past and future control measures (D5-5). A large part of the assessment work in WP5 was carried out in collaboration with the ACCENT/IPCC Photocomp studies which were carried out in year 2 of the RETRO project.
17
3.3 Coordination activities The project was coordinated by the Max Planck Institute for Meteorology (MPG-IMET). A project office was installed with two part-time staff members who assisted the coordinating scientist in the preparation of meetings and conference sessions, editing of reports and the budgetary overview. The project office was also responsible for setting up and maintaining the project web site (http://retro.enes.org) and the ftp server. Table 3 provides an overview on the project meetings and major conferences with contributions from the project. A detailed list of conference contributions can be found in section 6 of this report.
Through invitation of external scientists to the project meetings and through discussions at international conferences the RETRO scientists continuously communicated the project achievements and subjected their results to the judgement of independent colleagues. Peer review of scientific articles submitted to various international journals (see publication list in section 6) also served to benchmark the progress made in the project.
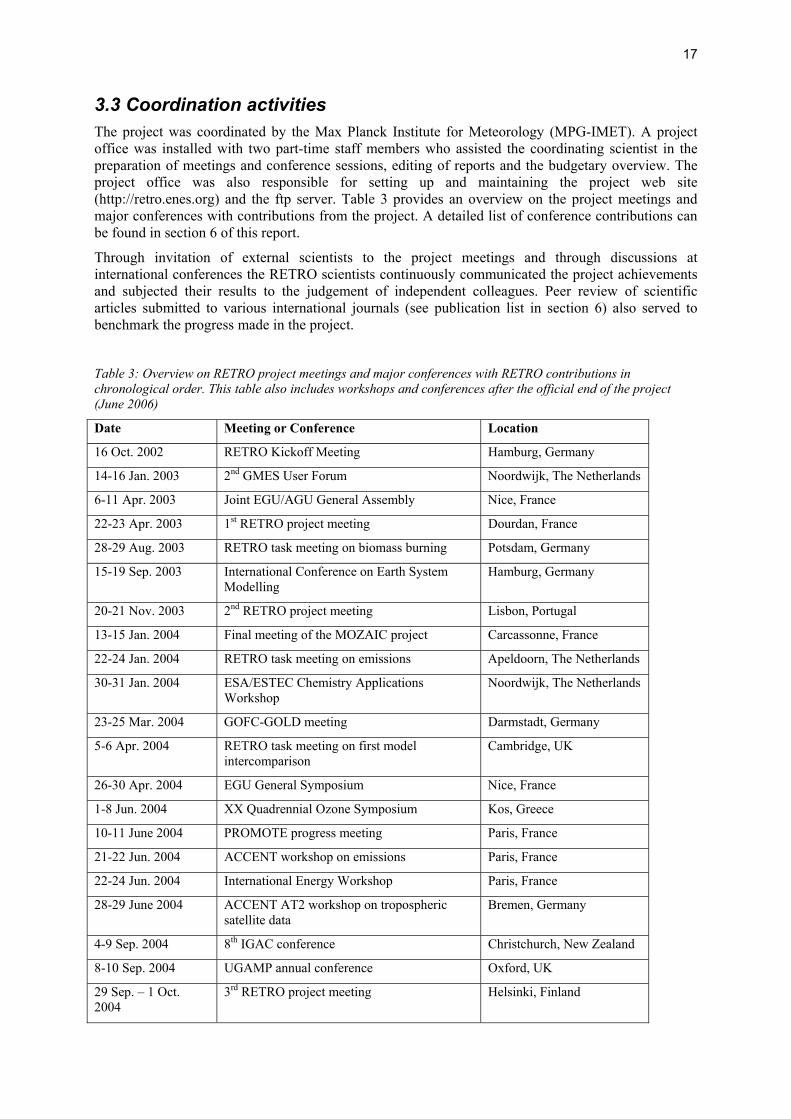
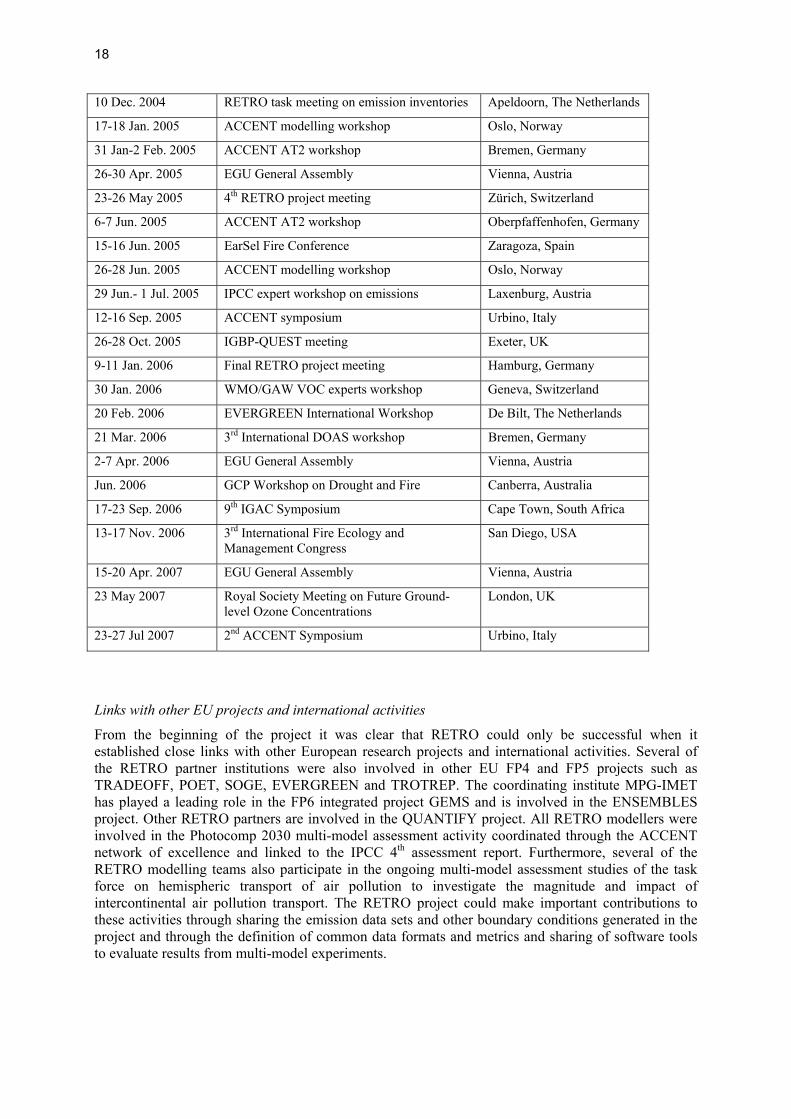
Table 3: Overview on RETRO project meetings and major conferences with RETRO contributions in chronological order. This table also includes workshops and conferences after the official end of the project (June 2006)
Date Meeting or Conference Location
16 Oct. 2002 RETRO Kickoff Meeting Hamburg, Germany
14-16 Jan. 2003 2nd GMES User Forum Noordwijk, The Netherlands
6-11 Apr. 2003 Joint EGU/AGU General Assembly Nice, France
22-23 Apr. 2003 1st RETRO project meeting Dourdan, France
28-29 Aug. 2003 RETRO task meeting on biomass burning Potsdam, Germany
15-19 Sep. 2003 International Conference on Earth System Modelling
Hamburg, Germany
20-21 Nov. 2003 2nd RETRO project meeting Lisbon, Portugal
13-15 Jan. 2004 Final meeting of the MOZAIC project Carcassonne, France
22-24 Jan. 2004 RETRO task meeting on emissions Apeldoorn, The Netherlands
30-31 Jan. 2004 ESA/ESTEC Chemistry Applications Workshop
Noordwijk, The Netherlands
23-25 Mar. 2004 GOFC-GOLD meeting Darmstadt, Germany
5-6 Apr. 2004 RETRO task meeting on first model intercomparison
Cambridge, UK
26-30 Apr. 2004 EGU General Symposium Nice, France
1-8 Jun. 2004 XX Quadrennial Ozone Symposium Kos, Greece
10-11 June 2004 PROMOTE progress meeting Paris, France
21-22 Jun. 2004 ACCENT workshop on emissions Paris, France
22-24 Jun. 2004 International Energy Workshop Paris, France
28-29 June 2004 ACCENT AT2 workshop on tropospheric satellite data
Bremen, Germany
4-9 Sep. 2004 8th IGAC conference Christchurch, New Zealand
8-10 Sep. 2004 UGAMP annual conference Oxford, UK
29 Sep. – 1 Oct. 2004
3rd RETRO project meeting Helsinki, Finland
18
10 Dec. 2004 RETRO task meeting on emission inventories Apeldoorn, The Netherlands
17-18 Jan. 2005 ACCENT modelling workshop Oslo, Norway
31 Jan-2 Feb. 2005 ACCENT AT2 workshop Bremen, Germany
26-30 Apr. 2005 EGU General Assembly Vienna, Austria
23-26 May 2005 4th RETRO project meeting Zürich, Switzerland
6-7 Jun. 2005 ACCENT AT2 workshop Oberpfaffenhofen, Germany
15-16 Jun. 2005 EarSel Fire Conference Zaragoza, Spain
26-28 Jun. 2005 ACCENT modelling workshop Oslo, Norway
29 Jun.- 1 Jul. 2005 IPCC expert workshop on emissions Laxenburg, Austria
12-16 Sep. 2005 ACCENT symposium Urbino, Italy
26-28 Oct. 2005 IGBP-QUEST meeting Exeter, UK
9-11 Jan. 2006 Final RETRO project meeting Hamburg, Germany
30 Jan. 2006 WMO/GAW VOC experts workshop Geneva, Switzerland
20 Feb. 2006 EVERGREEN International Workshop De Bilt, The Netherlands
21 Mar. 2006 3rd International DOAS workshop Bremen, Germany
2-7 Apr. 2006 EGU General Assembly Vienna, Austria
Jun. 2006 GCP Workshop on Drought and Fire Canberra, Australia
17-23 Sep. 2006 9th IGAC Symposium Cape Town, South Africa
13-17 Nov. 2006 3rd International Fire Ecology and Management Congress
San Diego, USA
15-20 Apr. 2007 EGU General Assembly Vienna, Austria
23 May 2007 Royal Society Meeting on Future Ground-level Ozone Concentrations
London, UK
23-27 Jul 2007 2nd ACCENT Symposium Urbino, Italy
Links with other EU projects and international activities
From the beginning of the project it was clear that RETRO could only be successful when it established close links with other European research projects and international activities. Several of the RETRO partner institutions were also involved in other EU FP4 and FP5 projects such as TRADEOFF, POET, SOGE, EVERGREEN and TROTREP. The coordinating institute MPG-IMET has played a leading role in the FP6 integrated project GEMS and is involved in the ENSEMBLES project. Other RETRO partners are involved in the QUANTIFY project. All RETRO modellers were involved in the Photocomp 2030 multi-model assessment activity coordinated through the ACCENT network of excellence and linked to the IPCC 4th assessment report. Furthermore, several of the RETRO modelling teams also participate in the ongoing multi-model assessment studies of the task force on hemispheric transport of air pollution to investigate the magnitude and impact of intercontinental air pollution transport. The RETRO project could make important contributions to these activities through sharing the emission data sets and other boundary conditions generated in the project and through the definition of common data formats and metrics and sharing of software tools to evaluate results from multi-model experiments.
19
3.4 Project timeline According to the work plan the project was structured in three phases describing the status of the long-term reanalysis simulations: preparation, implementation and execution. During the preparation phase, decisions were made about the methodologies to be used to generate the necessary boundary conditions (including emissions data) for the long-term simulations. The model set-up was defined and discussions started about useful sensitivity experiments and data analysis tasks. In the second phase, all data sets had to be generated and tests on the model performance were made. Furthermore suitable metrics for model evaluation were defined and the analysis of model experiments related to the seasonal and interannual variability was carried out. The final phase was dedicated to the execution of the long-term reanalysis simulations and their analysis with respect to trends and variability patterns of tropospheric trace gases. Each of these phases was supposed to last for one year. However, during year two it became clear that the project would be delayed because of unexpected difficulties in generating the emissions data sets. Furthermore, it was discovered in year one of the project that the ERA-40 data set which was essential to provide the meteorological boundary conditions contains some inconsistencies and suffers in particular from excessive meridional overturning. This had important implications for the amount of trace gas exchange between the stratosphere and the troposphere in the tropospheric models used in the project. Because of the differing parameterisations for this process ways had to be found to deal with this problem in the individual RETRO models. Taken together, these delays caused the project to slip behind schedule and mandated the negotiation of a cost-neutral project extension until June 2006 as well as some re-arrangements of the project structure. In particular, it was decided to decouple the sensitivity simulations in WP3 from the long-term simulations of WP4 in the sense that the former did not make use of all the constraints defined for the latter. This means that models participating in these sensitivity studies used various different emission data sets and/or different meteorological fields.
When the long-term simulations were completed in February 2006 and some analyses had been performed on the results, errors were discovered in the set-up of all the three models which had run these experiments. Since the data sets from the long-term simulations are the main deliverable of the project, a decision was made to repeat these simulations in spite of the fact that this would cause another significant delay for the termination of the project. Due to various technical and administrative issues, the second run of the long-term simulations could only be started in October 2006 and the simulations lasted until January 2007. The remaining time was spent on the analysis of these model results and the preparation of the remaining deliverables including this final report.
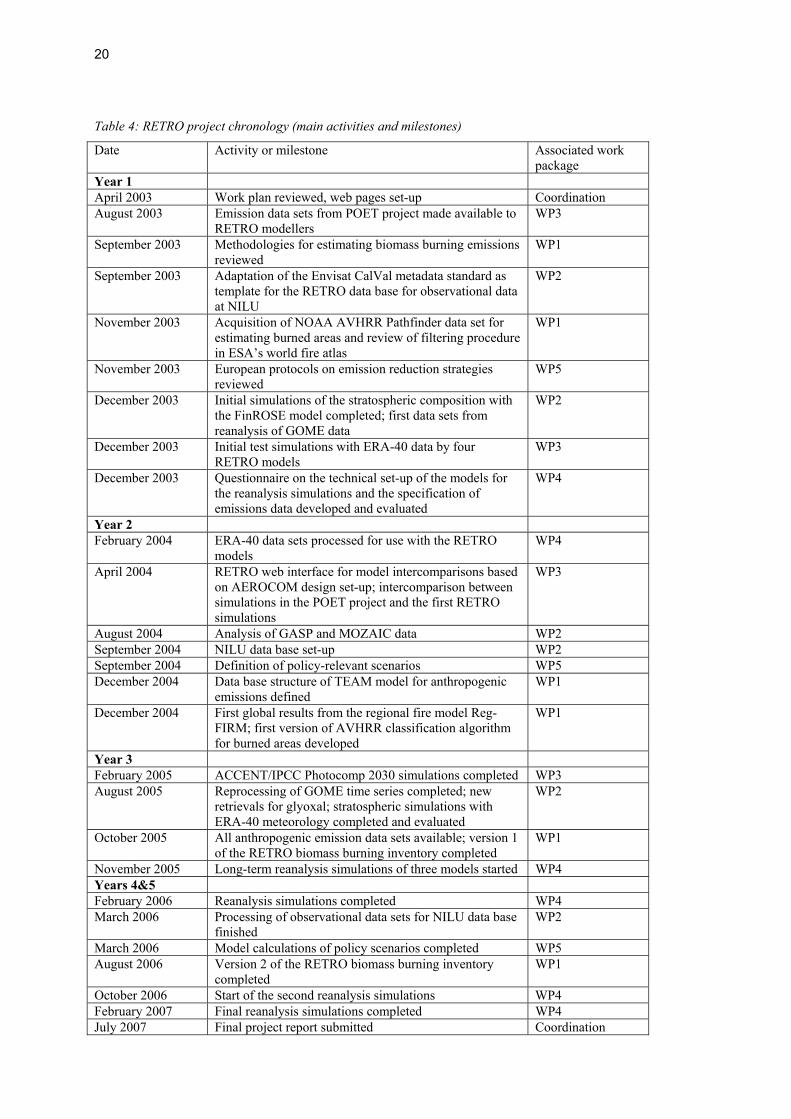
Several data analysis activities and work in the policy and implications work package occurred in parallel to these reanalysis activities. Table 4 provides a summary of the main RETRO activities and milestones in chronological order.
20
Table 4: RETRO project chronology (main activities and milestones)
Date Activity or milestone Associated work package
Year 1 April 2003 Work plan reviewed, web pages set-up Coordination August 2003 Emission data sets from POET project made available to
RETRO modellers WP3
September 2003 Methodologies for estimating biomass burning emissions reviewed
WP1
September 2003 Adaptation of the Envisat CalVal metadata standard as template for the RETRO data base for observational data at NILU
WP2
November 2003 Acquisition of NOAA AVHRR Pathfinder data set for estimating burned areas and review of filtering procedure in ESA’s world fire atlas
WP1
November 2003 European protocols on emission reduction strategies reviewed
WP5
December 2003 Initial simulations of the stratospheric composition with the FinROSE model completed; first data sets from reanalysis of GOME data
WP2
December 2003 Initial test simulations with ERA-40 data by four RETRO models
WP3
December 2003 Questionnaire on the technical set-up of the models for the reanalysis simulations and the specification of emissions data developed and evaluated
WP4
Year 2 February 2004 ERA-40 data sets processed for use with the RETRO
models WP4
April 2004 RETRO web interface for model intercomparisons based on AEROCOM design set-up; intercomparison between simulations in the POET project and the first RETRO simulations
WP3
August 2004 Analysis of GASP and MOZAIC data WP2 September 2004 NILU data base set-up WP2 September 2004 Definition of policy-relevant scenarios WP5 December 2004 Data base structure of TEAM model for anthropogenic
emissions defined WP1
December 2004 First global results from the regional fire model Reg-FIRM; first version of AVHRR classification algorithm for burned areas developed
WP1
Year 3 February 2005 ACCENT/IPCC Photocomp 2030 simulations completed WP3 August 2005 Reprocessing of GOME time series completed; new
retrievals for glyoxal; stratospheric simulations with ERA-40 meteorology completed and evaluated
WP2
October 2005 All anthropogenic emission data sets available; version 1 of the RETRO biomass burning inventory completed
WP1
November 2005 Long-term reanalysis simulations of three models started WP4 Years 4&5 February 2006 Reanalysis simulations completed WP4 March 2006 Processing of observational data sets for NILU data base
finished WP2
March 2006 Model calculations of policy scenarios completed WP5 August 2006 Version 2 of the RETRO biomass burning inventory
completed WP1
October 2006 Start of the second reanalysis simulations WP4 February 2007 Final reanalysis simulations completed WP4 July 2007 Final project report submitted Coordination
21
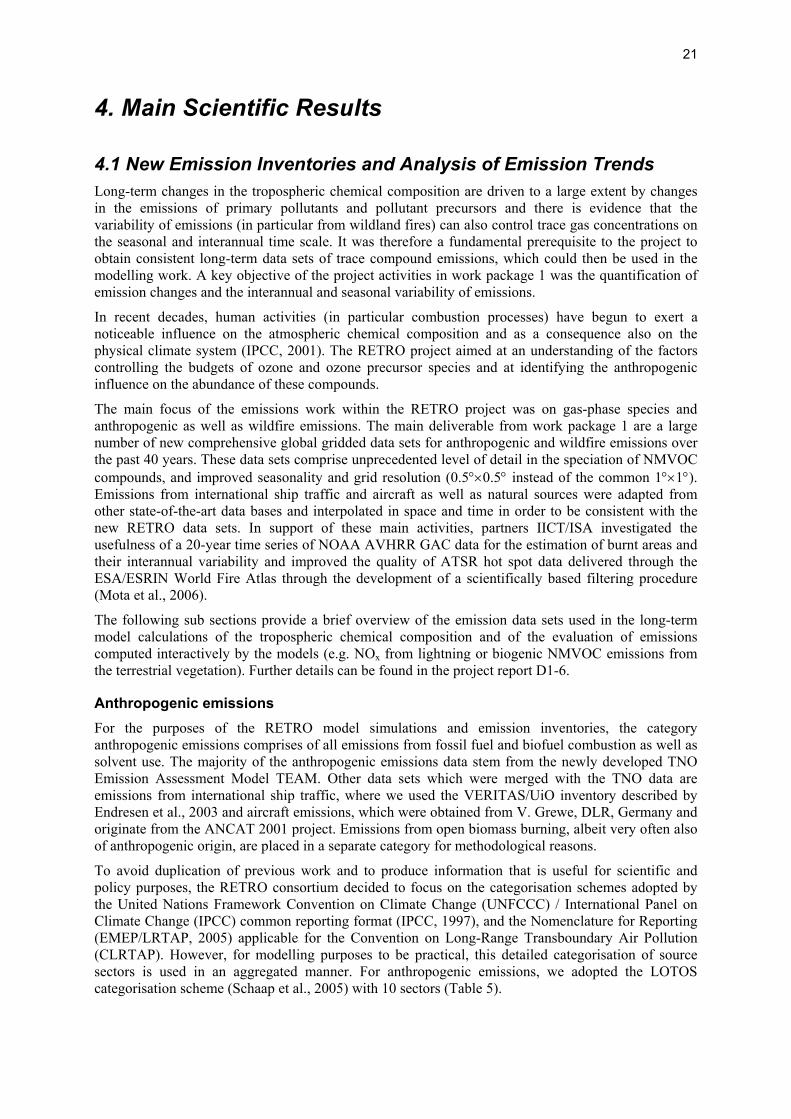
4. Main Scientific Results
4.1 New Emission Inventories and Analysis of Emission Trends Long-term changes in the tropospheric chemical composition are driven to a large extent by changes in the emissions of primary pollutants and pollutant precursors and there is evidence that the variability of emissions (in particular from wildland fires) can also control trace gas concentrations on the seasonal and interannual time scale. It was therefore a fundamental prerequisite to the project to obtain consistent long-term data sets of trace compound emissions, which could then be used in the modelling work. A key objective of the project activities in work package 1 was the quantification of emission changes and the interannual and seasonal variability of emissions.
In recent decades, human activities (in particular combustion processes) have begun to exert a noticeable influence on the atmospheric chemical composition and as a consequence also on the physical climate system (IPCC, 2001). The RETRO project aimed at an understanding of the factors controlling the budgets of ozone and ozone precursor species and at identifying the anthropogenic influence on the abundance of these compounds.
The main focus of the emissions work within the RETRO project was on gas-phase species and anthropogenic as well as wildfire emissions. The main deliverable from work package 1 are a large number of new comprehensive global gridded data sets for anthropogenic and wildfire emissions over the past 40 years. These data sets comprise unprecedented level of detail in the speciation of NMVOC compounds, and improved seasonality and grid resolution (0.5°×0.5° instead of the common 1°×1°). Emissions from international ship traffic and aircraft as well as natural sources were adapted from other state-of-the-art data bases and interpolated in space and time in order to be consistent with the new RETRO data sets. In support of these main activities, partners IICT/ISA investigated the usefulness of a 20-year time series of NOAA AVHRR GAC data for the estimation of burnt areas and their interannual variability and improved the quality of ATSR hot spot data delivered through the ESA/ESRIN World Fire Atlas through the development of a scientifically based filtering procedure (Mota et al., 2006).
The following sub sections provide a brief overview of the emission data sets used in the long-term model calculations of the tropospheric chemical composition and of the evaluation of emissions computed interactively by the models (e.g. NOx from lightning or biogenic NMVOC emissions from the terrestrial vegetation). Further details can be found in the project report D1-6.
Anthropogenic emissions For the purposes of the RETRO model simulations and emission inventories, the category anthropogenic emissions comprises of all emissions from fossil fuel and biofuel combustion as well as solvent use. The majority of the anthropogenic emissions data stem from the newly developed TNO Emission Assessment Model TEAM. Other data sets which were merged with the TNO data are emissions from international ship traffic, where we used the VERITAS/UiO inventory described by Endresen et al., 2003 and aircraft emissions, which were obtained from V. Grewe, DLR, Germany and originate from the ANCAT 2001 project. Emissions from open biomass burning, albeit very often also of anthropogenic origin, are placed in a separate category for methodological reasons.
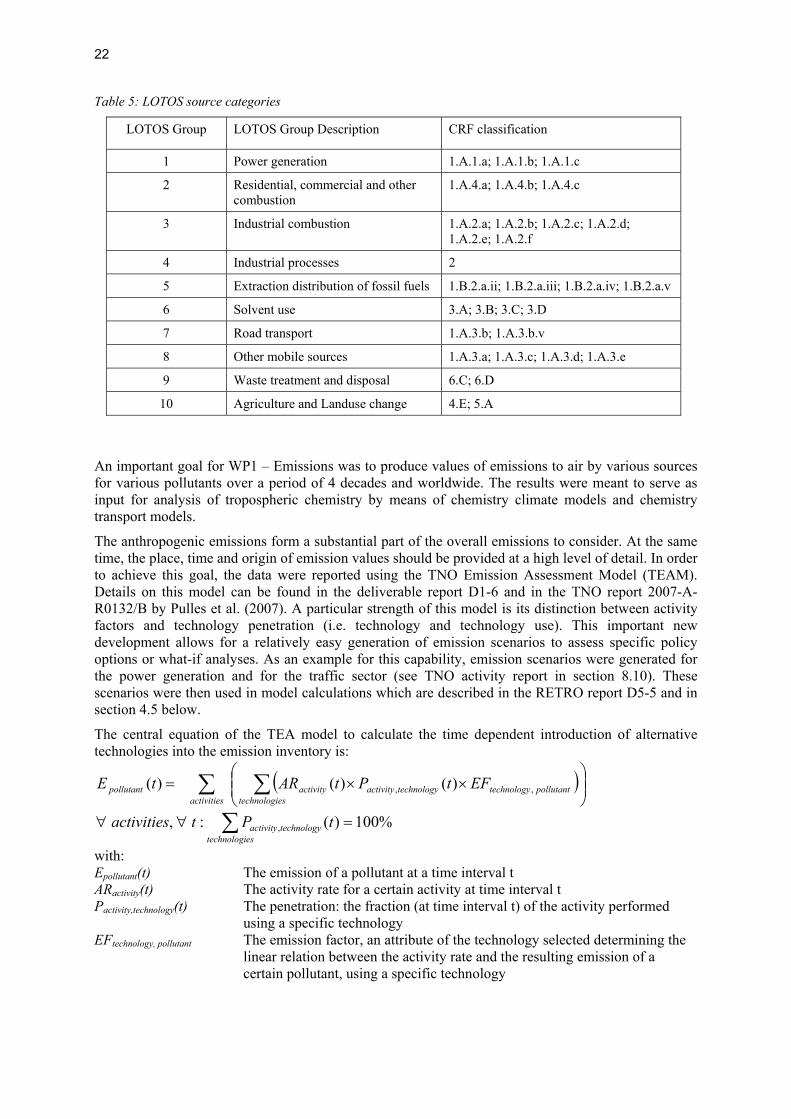
To avoid duplication of previous work and to produce information that is useful for scientific and policy purposes, the RETRO consortium decided to focus on the categorisation schemes adopted by the United Nations Framework Convention on Climate Change (UNFCCC) / International Panel on Climate Change (IPCC) common reporting format (IPCC, 1997), and the Nomenclature for Reporting (EMEP/LRTAP, 2005) applicable for the Convention on Long-Range Transboundary Air Pollution (CLRTAP). However, for modelling purposes to be practical, this detailed categorisation of source sectors is used in an aggregated manner. For anthropogenic emissions, we adopted the LOTOS categorisation scheme (Schaap et al., 2005) with 10 sectors (Table 5).
22
Table 5: LOTOS source categories
LOTOS Group LOTOS Group Description CRF classification
1 Power generation 1.A.1.a; 1.A.1.b; 1.A.1.c
2 Residential, commercial and other combustion
1.A.4.a; 1.A.4.b; 1.A.4.c
3 Industrial combustion 1.A.2.a; 1.A.2.b; 1.A.2.c; 1.A.2.d; 1.A.2.e; 1.A.2.f
4 Industrial processes 2
5 Extraction distribution of fossil fuels 1.B.2.a.ii; 1.B.2.a.iii; 1.B.2.a.iv; 1.B.2.a.v
6 Solvent use 3.A; 3.B; 3.C; 3.D
7 Road transport 1.A.3.b; 1.A.3.b.v
8 Other mobile sources 1.A.3.a; 1.A.3.c; 1.A.3.d; 1.A.3.e
9 Waste treatment and disposal 6.C; 6.D
10 Agriculture and Landuse change 4.E; 5.A
An important goal for WP1 – Emissions was to produce values of emissions to air by various sources for various pollutants over a period of 4 decades and worldwide. The results were meant to serve as input for analysis of tropospheric chemistry by means of chemistry climate models and chemistry transport models.
The anthropogenic emissions form a substantial part of the overall emissions to consider. At the same time, the place, time and origin of emission values should be provided at a high level of detail. In order to achieve this goal, the data were reported using the TNO Emission Assessment Model (TEAM). Details on this model can be found in the deliverable report D1-6 and in the TNO report 2007-A-R0132/B by Pulles et al. (2007). A particular strength of this model is its distinction between activity factors and technology penetration (i.e. technology and technology use). This important new development allows for a relatively easy generation of emission scenarios to assess specific policy options or what-if analyses. As an example for this capability, emission scenarios were generated for the power generation and for the traffic sector (see TNO activity report in section 8.10). These scenarios were then used in model calculations which are described in the RETRO report D5-5 and in section 4.5 below.
The central equation of the TEA model to calculate the time dependent introduction of alternative technologies into the emission inventory is:
( )∑ ∑ ⎟⎟⎠
⎞⎜⎜⎝
⎛××=
activities estechnologipollutanttechnologytechnologyactivityactivitypollutant EFtPtARtE ,, )()()(
%100)(:, , =∀∀ ∑ tPtactivities
estechnologitechnologyactivity
with: Epollutant(t) The emission of a pollutant at a time interval t ARactivity(t) The activity rate for a certain activity at time interval t Pactivity,technology(t) The penetration: the fraction (at time interval t) of the activity performed
using a specific technology EFtechnology, pollutant The emission factor, an attribute of the technology selected determining the
linear relation between the activity rate and the resulting emission of a certain pollutant, using a specific technology

23
The input data for the TEAM model were obtained from various sources. Activity rates were taken from the International Energy Agency (IEA). These data cover the period of 1960-2000 for the OECD countries and of 1970-2000 for the non-OECD countries. By using the IEA conversion factors, all activity data have been converted to TJ. Solvent use emission data and residential biomass burning activity data have been obtained from a global inventory for anthropogenic NMVOC emissions that has been developed at TNO as input for EDGAR 2.0 and GEIA: http://www.mnp.nl/geia/data/-NMVOC_Groups/. Other information was obtained from the TROTREP project: http://atmos.chem.le.ac.uk/trotrep/. Data on technologies and emission factors come from the TROTREP project. These emission factors were developed mainly as expert judgements by the TROTREP emissions team at TNO. In this development several international emission factor collections were used and were interpreted towards average values for a country or a group of countries in specific years. Technologies were identified from the TROTREP emission factors as unique combinations of emission factors for CO, NOx and NMVOC for a specific year for specific country groups, mostly OECD and non-OECD for stationary combustion and ‘Western’ and ‘Non-western’ for road transport. The link between technologies and activities in the emission database created for the RETRO project is mainly based on the link between activities and emission factors that already existed in the TROTREP project.
After generating the annual national emission totals per species, the data were post-processed to derive global gridded data sets in monthly time resolution. For a few countries (Mongolia and Western Sahara) data had to be copied from adjacent regions with some assumptions for the regional differences. The TNO data sets were delivered in spreadsheet form to MPG-IMET where they were converted to netcdf format and further processed. Because of inconsistencies in the original reported data by IEA (which were not filtered out by TNO) some smoothing of the emissions data delivered by TNO was necessary (see Figure 4). This was done with a simple linear scaling procedure applied in various regions and for the individual emission sectors. The absence of a scientifically sound, homogenous time series of national activities and emission rates poses a substantial problem for reanalysing long-term atmospheric composition trends. The smoothing applied in the RETRO project provides a practical solution which may however introduce certain biases. For example, residential CO emissions in East Asia after 1980 increased by more than 15% as a result of the smoothing procedure (see Figure 4). While there is evidence from various field experiments that this is closer to reality than the officially reported emission estimates, it nevertheless signifies a substantial discrepancy to the official data and complicates the attribution of pollution trends over time.
Figure 4: Example for the smoothing process in the anthropogenic emissions data set. Left: sectorized emissions for CO in Eastern Asia as derived directly from the TNO data base; right: the same after the smoothing procedure has been applied.

24
The NOx, CO and NMVOC emissions from international ship traffic were obtained from the VERITAS/UiO inventory described by Endresen et al., 2003. In the absence of more detailed long-term trend information on these emissions, we applied a globally uniform scaling factor based on the world bunker fuel sales to derive a reasonable time series of these emissions (see activity report by UiO in section 8.3). Figure 5 shows a comparison of satellite observations of the enhancement of the tropospheric NO2 column with the ship traffic emissions data from the Endresen et al. (2003) - RETRO inventory. While this figure cannot provide further constrains on the absolute magnitude of these emissions, it nevertheless shows the very realistic description of the ship traffic locations in the Endresen et al., (2003) inventory. Both data sets show enhanced emissions in particular between India and Southeast Asia along a very narrow route.
Figure 5: NOx signature of shipping in the Indian Ocean (a) Tropospheric NO2 columns derived from SCIAMACHY data from August 2002 to April 2004 using the Differential Optical Absorption Spectroscopy (DOAS) technique and the reference sector method for the region of the Red Sea (5°N to 35°N and 30°E to 60°E). (b) Estimated distribution of ship traffic NOx emissions from Endresen et al. (2003) in the same region.
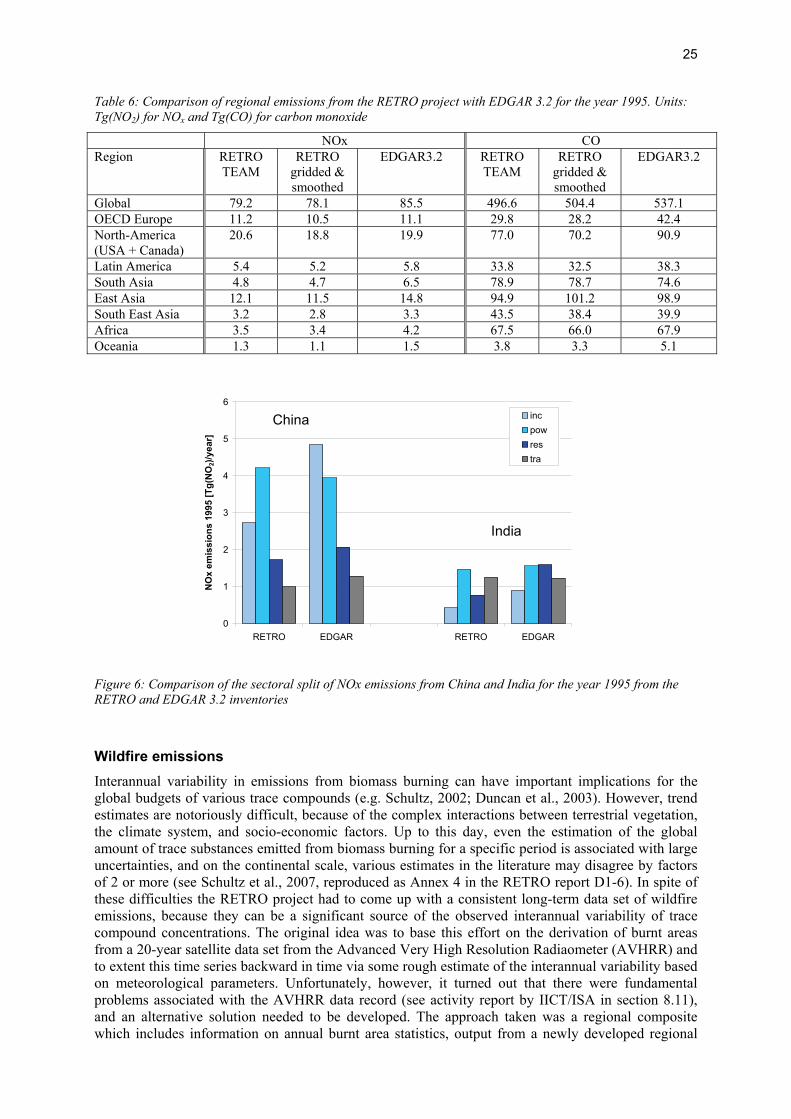
The anthropogenic emissions from the RETRO project were compared with other available inventories. Table 6 and Figure 6 below show a comparison for NOx and CO emissions with the EDGAR3.2 data base. A comparison with EMEP emission estimates can be found in the TNO activity report in section 8.10. Additional information is available in the RETRO report D1-6. NOx and CO emissions in EDGAR3.2 for the year 1995 are about 8% higher globally than the TEAM emissions. For NOx, the largest differences are found in the southern and eastern parts of Asia and in Africa while for CO the differences occur especially in OECD Europe and North America. In order to further investigate these differences, individual emission sectors were also compared. This analysis revealed that a large difference in NOx emissions from industrial combustion in East Asia, which are probably underestimated in the TEAM model (Figure 6). RETRO CO emission values for the United States on the other hand are closer to reports from the US EPA and more in line with the results of Parrish et al. (2002), who report a decrease in CO emissions during the 1990s from 65 Tg to 38 Tg.
25
Table 6: Comparison of regional emissions from the RETRO project with EDGAR 3.2 for the year 1995. Units: Tg(NO2) for NOx and Tg(CO) for carbon monoxide
NOx CO Region RETRO
TEAM RETRO
gridded & smoothed
EDGAR3.2 RETRO TEAM
RETRO gridded & smoothed
EDGAR3.2
Global 79.2 78.1 85.5 496.6 504.4 537.1 OECD Europe 11.2 10.5 11.1 29.8 28.2 42.4 North-America (USA + Canada)
20.6 18.8 19.9 77.0 70.2 90.9
Latin America 5.4 5.2 5.8 33.8 32.5 38.3 South Asia 4.8 4.7 6.5 78.9 78.7 74.6 East Asia 12.1 11.5 14.8 94.9 101.2 98.9 South East Asia 3.2 2.8 3.3 43.5 38.4 39.9 Africa 3.5 3.4 4.2 67.5 66.0 67.9 Oceania 1.3 1.1 1.5 3.8 3.3 5.1
0
1
2
3
4
5
6
RETRO EDGAR RETRO EDGAR
NO
x em
issi
ons
1995
[Tg(
NO
2)/y
ear]
incpowrestra
China
India
Figure 6: Comparison of the sectoral split of NOx emissions from China and India for the year 1995 from the RETRO and EDGAR 3.2 inventories
Wildfire emissions Interannual variability in emissions from biomass burning can have important implications for the global budgets of various trace compounds (e.g. Schultz, 2002; Duncan et al., 2003). However, trend estimates are notoriously difficult, because of the complex interactions between terrestrial vegetation, the climate system, and socio-economic factors. Up to this day, even the estimation of the global amount of trace substances emitted from biomass burning for a specific period is associated with large uncertainties, and on the continental scale, various estimates in the literature may disagree by factors of 2 or more (see Schultz et al., 2007, reproduced as Annex 4 in the RETRO report D1-6). In spite of these difficulties the RETRO project had to come up with a consistent long-term data set of wildfire emissions, because they can be a significant source of the observed interannual variability of trace compound concentrations. The original idea was to base this effort on the derivation of burnt areas from a 20-year satellite data set from the Advanced Very High Resolution Radiaometer (AVHRR) and to extent this time series backward in time via some rough estimate of the interannual variability based on meteorological parameters. Unfortunately, however, it turned out that there were fundamental problems associated with the AVHRR data record (see activity report by IICT/ISA in section 8.11), and an alternative solution needed to be developed. The approach taken was a regional composite which includes information on annual burnt area statistics, output from a newly developed regional
26
fire model (Reg-FIRM, see activity report by MPI-BGC in section 8.12), and some satellite data of the 1990s for the geographical and seasonal distribution of fires. The RETRO wildfire inventory limits itself to the open combustion of biomass since emissions from the closed combustion of waste wood and fuel wood are included in the anthropogenic TNO TEAM data base.
Due to the fact that there are no satellite observations available that cover the complete RETRO period, and the few attempts to generate longer-term time series of global burned areas or fire hot spots are still being evaluated, the RETRO inventory had to rely on statistical methods and modelling techniques. We performed an extensive survey of the recent literature and created a composite inventory based on what we think is the best available information in each continental-scale region. The articles that formed our information base describe fire inventories which were constructed with various satellite data products and various algorithms and/or models, and they are valid for different years. Different authors place their focus on different fire quantities and compounds (e.g. total carbon, black carbon, or carbon monoxide). This makes a comparison of inventories rather difficult and leads to the dreadful conclusion that even the uncertainties of current inventories are almost unknown. The review article by Schultz et al. (2007) may help to improve this situation through systematic evaluation of the available information in various world regions.
For the RETRO wildfire inventory we adopted a highly aggregated approach, which allows for a first systematic intercomparison of different existing fire inventories and highlights the problem areas. In general, three main factors contribute to the uncertainties of fire emissions estimates:
• burned area quantification: there are only few regions with accurate long-term monitoring of burned areas. Existing satellite products can give a reasonable qualitative description of fire occurrence and seasonality, but their quantitative use still suffers from retrieval problems such as improper orbital characteristics, cloud and smoke obscurence, and varying detection efficiency for different ecosystems,
• the amount of biomass actually combusted depends on the available fuel load, fuel moisture, the type of vegetation, the organic soil content and soil moisture, and the rate of spreading (driven by wind speed and moisture as well as the orography). Many of these parameters are highly variable and poorly determined on larger scales,
• the emission factors of chemically active trace species and greenhouse gases depend on the fuel type and the burning characteristics and are quite uncertain in many cases. While fires can often be considered as a mix of flaming and smoldering combustion processes if one is interested in larger scales, there may still be large variability in emission factors for example if the amount of soil organic matter that is exposed to burning varies strongly as in Indonesia or Siberia.
Each region has different major uncertainties, and the study undertaken in the context of this work (Schultz et al., submitted manuscript) contributes to a better understanding of what these uncertainties are although more detailed studies are necessary to reveal all of the uncertainties.
The general approach for estimating fire emissions is:
(1) E(i) = A × FL × CE × EF(i)
where E(i) is the emission flux (in kg m-2 s-1) of compound i, A denotes the burned area, FL the fuel load (dry biomass available for burning), CE the combustion efficiency (fraction of available biomass that is consumed by fire), and EF(i) is the emission factor (g species per kg dry matter burned). There is considerable confusion in the literature about the values of FL and CE for different ecosystems, and generally not enough information is made available to actually determine the cause of different emissions estimates in different regions. We therefore decided to base our inventory on aggregated estimates of total carbon emissions (CO2 and CO form about 90-95% of total carbon emitted), and we thus simplify equation (1) to:
(2) E(i) = A × Enet(C) × ER(i, C)
Here, Enet(C) is an aggregated quantity of net carbon emissions (in tonsC/ha), and ER(i, C) denotes the emission ratio of compound i relative to total carbon. The regional burnt area is distributed among

27
three broad ecosystem classes (forest, wooded, and grasslands), and separate emission factors are assigned to each of these (varying by continent as well). The variability of emissions in the RETRO inventory is entirely driven by variations in the burned area, which are either prescribed from forest service observations (Canada, US, and Siberia), or they are derived from a newly developed prognostic fire model (Reg-FIRM) and scaled to a representative year for which a detailed analysis exists in the literature. Siberian burned areas were also scaled, because it is known that only a fraction of the total area is monitored and there may be underreporting even in areas that are routinely surveyed. Tables 7 and 8 below summarize the main input parameters for the thirteen geographical regions defined in this study.
Table 7: Region definitions and summary of methodologies applied for the construction of the RETRO vegetation fire inventory. For details see manuscript by Schultz et al., 2007.
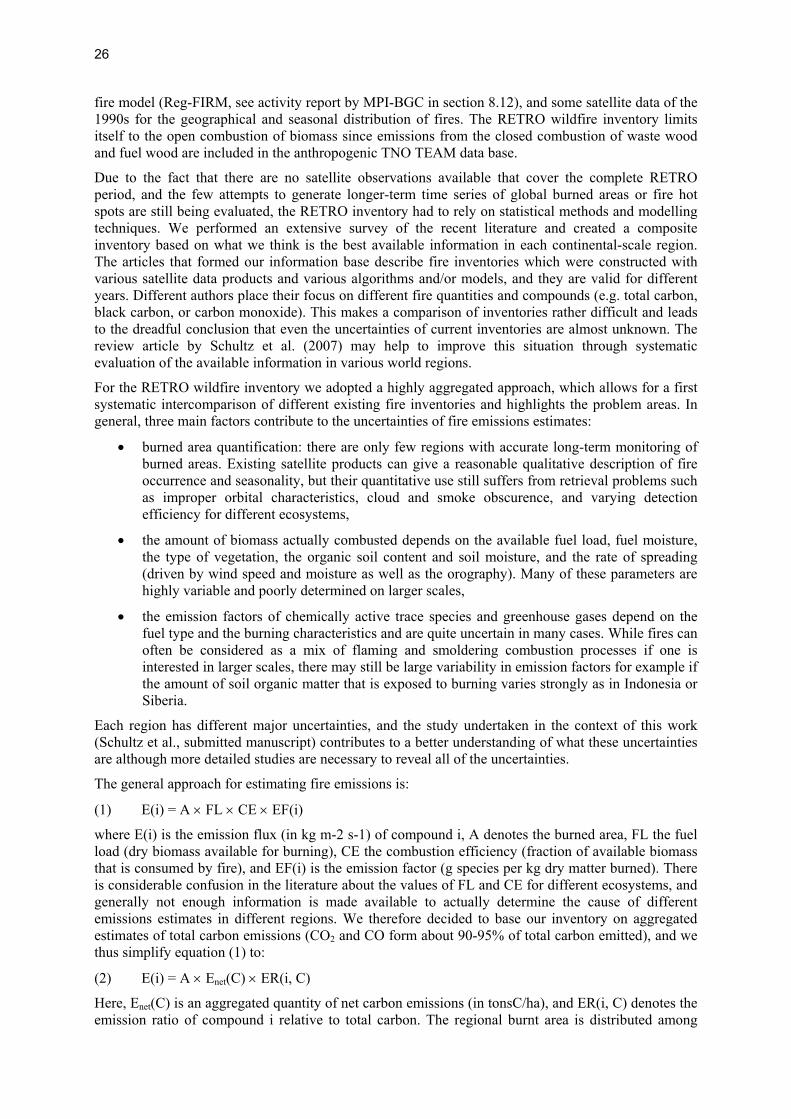
Figure 7 shows the 41-year time series of total carbon emissions from vegetation fires as derived from the RETRO wildfire inventory. The global annual totals range from 1410 to 3140 TgC/year with a modest long-term trend. The largest contributions are generally coming from Africa and South America, but the contribution from South East Asia is increasing over time. Some of the known extreme fire events (e.g. Indonesia 1997, Siberia and Central America 1998) are clearly visible in the time series, others may be missed or underestimated (e.g. Mongolia 1987). Generally, the emission estimates from the RETRO inventory are rather consistent with the values from the Global Fire Emission Database (GFED) version 2 (van der Werf et al., 2006)
28
Table 8: Net average carbon emissions per unit area and, in parantheses, average distribution of burned areas among the aggregate ecosystem classes. Table from Schultz et al., 2007.
0
500
1000
1500
2000
2500
3000
3500
1960 1965 1970 1975 1980 1985 1990 1995 2000
Tota
l dire
cxt c
arbo
n em
issi
ons
[TgC
/yea
r]
Australia
Indonesia
SE Asia
India
SH Africa
NH Africa+trop.forest
South America
Central America
Europe
contiguous US
Russian Federation+Mongolia
Canada
Alaska
Figure 7: Estimated total direct carbon emissions from wildland fires (i.e. excluding carbon release after degradation of remaining organic matter) for the 40-year period of RETRO.
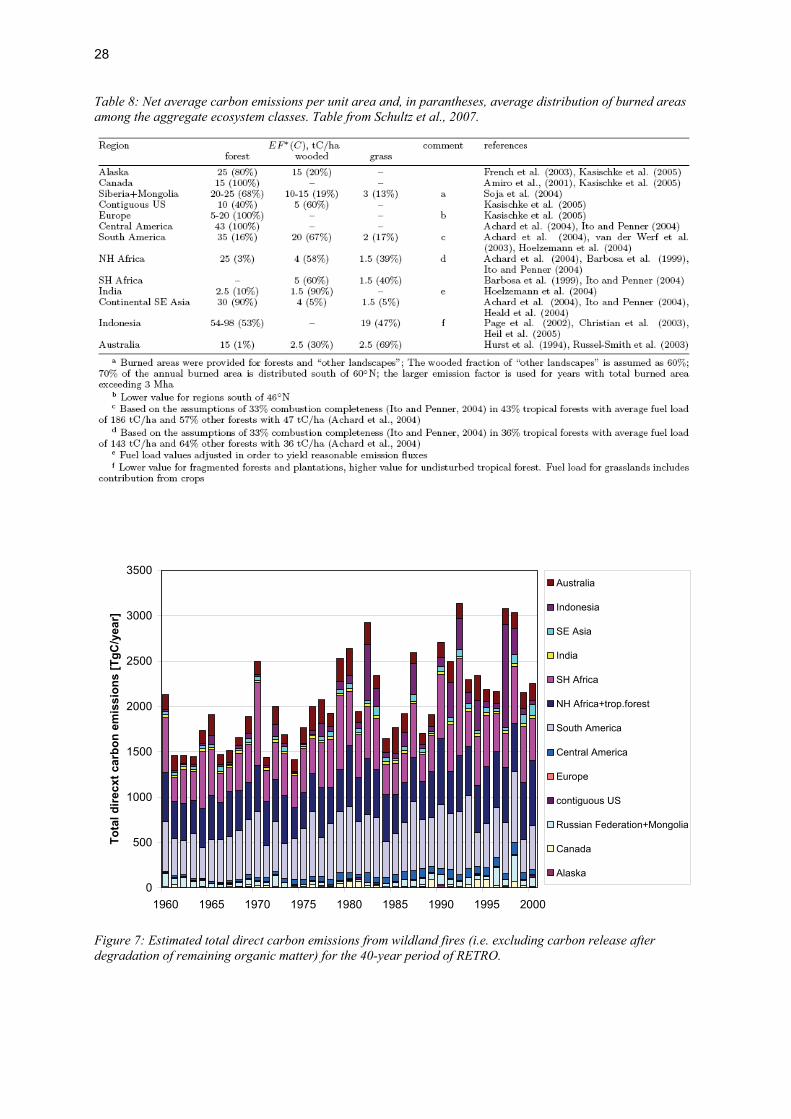
29
Table 9 shows a comparison of the RETRO global annual direct carbon emissions from open vegetation fires with various literature sources. The RETRO study is the first attempt to consolidate different emission estimates by taking into account the possible differences due to the large interannual variability in these emissions (see Figure 7).
Table 9: Comparison of annual direct total carbon emissions from wildland fires for specific years or time periods (from Schultz et al., 2007)
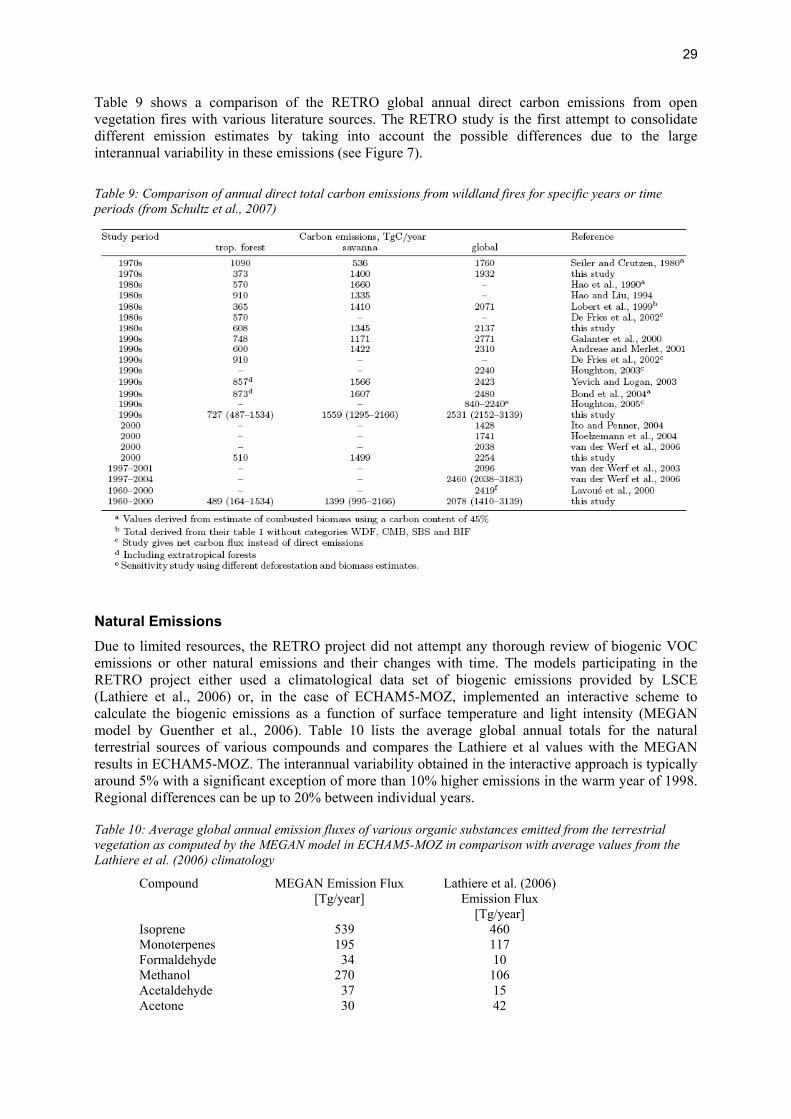
Natural Emissions Due to limited resources, the RETRO project did not attempt any thorough review of biogenic VOC emissions or other natural emissions and their changes with time. The models participating in the RETRO project either used a climatological data set of biogenic emissions provided by LSCE (Lathiere et al., 2006) or, in the case of ECHAM5-MOZ, implemented an interactive scheme to calculate the biogenic emissions as a function of surface temperature and light intensity (MEGAN model by Guenther et al., 2006). Table 10 lists the average global annual totals for the natural terrestrial sources of various compounds and compares the Lathiere et al values with the MEGAN results in ECHAM5-MOZ. The interannual variability obtained in the interactive approach is typically around 5% with a significant exception of more than 10% higher emissions in the warm year of 1998. Regional differences can be up to 20% between individual years.
Table 10: Average global annual emission fluxes of various organic substances emitted from the terrestrial vegetation as computed by the MEGAN model in ECHAM5-MOZ in comparison with average values from the Lathiere et al. (2006) climatology
Compound MEGAN Emission Flux [Tg/year]
Lathiere et al. (2006) Emission Flux
[Tg/year] Isoprene 539 460 Monoterpenes 195 117 Formaldehyde 34 10 Methanol 270 106 Acetaldehyde 37 15 Acetone 30 42
30
Figure 8 shows the interannual variability of global lightning NOx emissions from the three RETRO models which performed the long-term simulations. All three models use different parameterisations to compute the flash frequency and they apply different (but constant) scale factors to convert flash frequency to NOx emissions from thunderstorms. If one looks at the geographical distribution of lightning flashes in the individual models, then all three models generate a reasonable distribution compared to the LIS/OTD lightning detection sensors (Christian et al., 2003). Nevertheless, the results shown in Figure 8 reveal important differences with respect to the upper tropospheric NOx source by lightning between the models. While the two general circulation models (MOZECH and LMDz) show no significant trend in the lightning NOx emissions, there is a strong increase after 1980 in the TM4 model results. This finding points to an artifact in the ERA-40 data which is associated with the excessive precipitation over tropical oceans found in the evaluation of this data set (Bengtsson et al., 2004; Hagemann et al., 2005; Uppala et al., 2005). There is rather poor correlation between the results from all three models. This may have important implications when one attempts to investigate the feedbacks between climate change and atmospheric chemistry, because there are indications that the frequency and severity of thunderstorms might increase in a warmer climate, but given the differences in the RETRO simulations it is entirely unclear what this would imply for the upper tropospheric NOx source from lightning.
2
2.5
3
3.5
4
4.5
5
5.5
6
6.5
7
1960 1965 1970 1975 1980 1985 1990 1995 2000
N p
rodu
ctio
n fr
om li
ghtn
ing
[Tg/
year
] MOZECHTM4LMDz
Figure 8: Temporal evolution of the global annual NOx production (as TgN/year) from lightning in the three models which performed the 40-year simulations
Summary The RETRO project has made important contributions to advance the state of global atmospheric chemistry modeling by providing new global inventories of anthropogenic emissions and emissions from open vegetation fires. Furthermore, the analysis of natural emissions computed interactively by the models revealed some important uncertainties which should be addressed in future work. Significant differences remain in the estimates of biogenic emissions for specific compounds, and the interannual variability of NOx emissions from lightning must be regarded as highly uncertain.
Figure 9 below provides an overview of the geographical distribution of the RETRO NOx and CO emissions for 1970 and 2000 and Figure 10 summarizes the decadal mean sectoral composition of these data sets for the 1960s and 1990s. A more detailed version of this figure along with much additional information on the generation and evaluation of the RETRO emissions can be found in the project report D1-6.
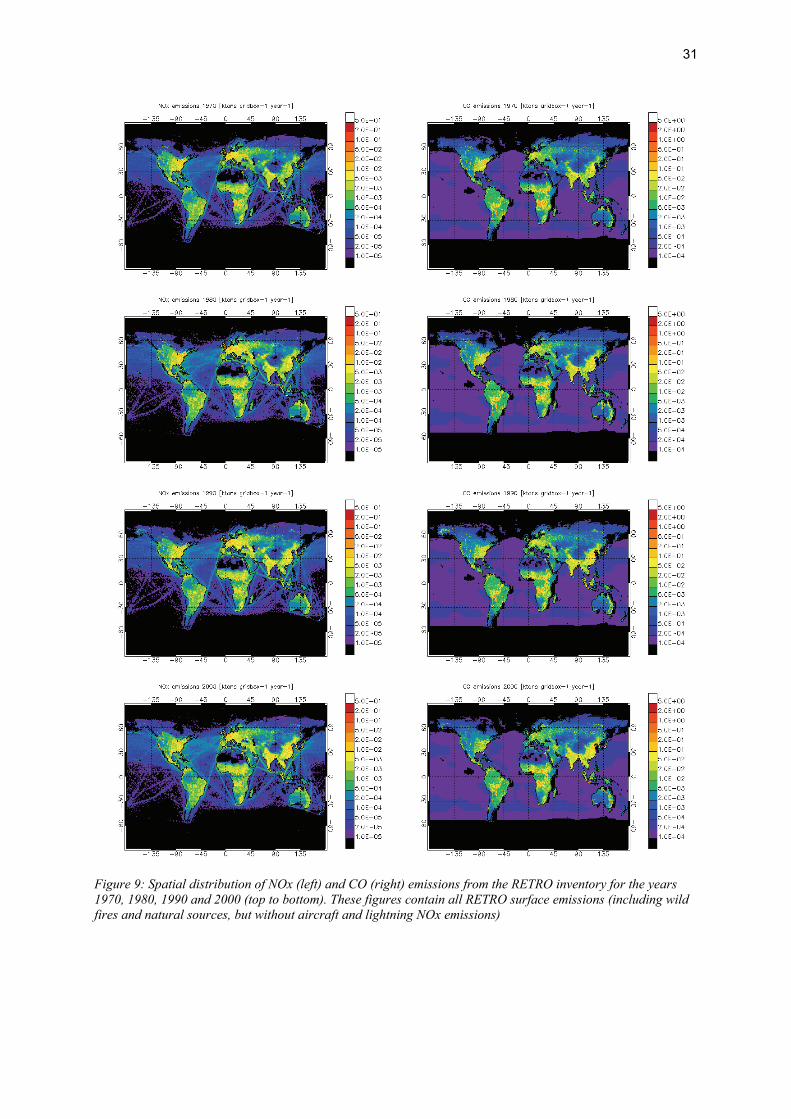
31
Figure 9: Spatial distribution of NOx (left) and CO (right) emissions from the RETRO inventory for the years 1970, 1980, 1990 and 2000 (top to bottom). These figures contain all RETRO surface emissions (including wild fires and natural sources, but without aircraft and lightning NOx emissions)
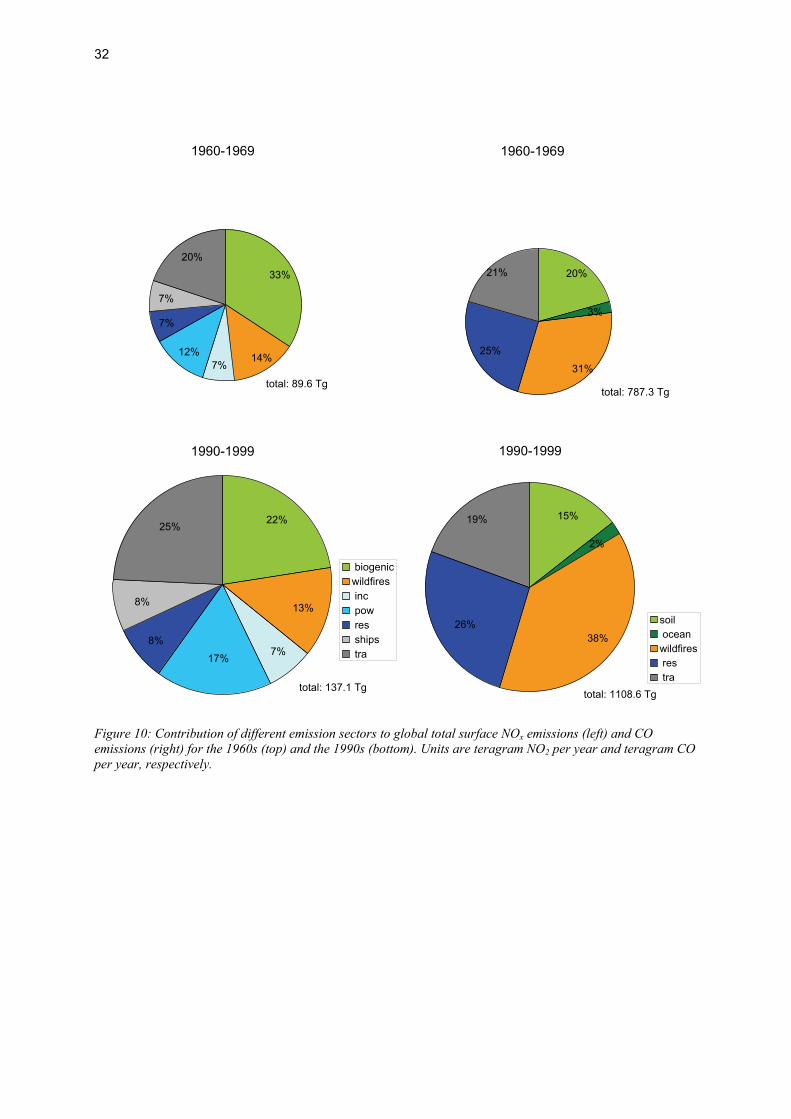
32
1960-1969
33%
14%7%
12%
7%
7%
20%
total: 89.6 Tg
1960-1969
21%
25%
31%
3%
20%
total: 787.3 Tg
1990-1999
25%
8%
8%
17%7%
13%
22%
biogenicwildfires inc pow res ships tra
total: 137.1 Tg
1990-1999
15%
2%
38%26%
19%
soil oceanwildfires res tra
total: 1108.6 Tg
Figure 10: Contribution of different emission sectors to global total surface NOx emissions (left) and CO emissions (right) for the 1960s (top) and the 1990s (bottom). Units are teragram NO2 per year and teragram CO per year, respectively.
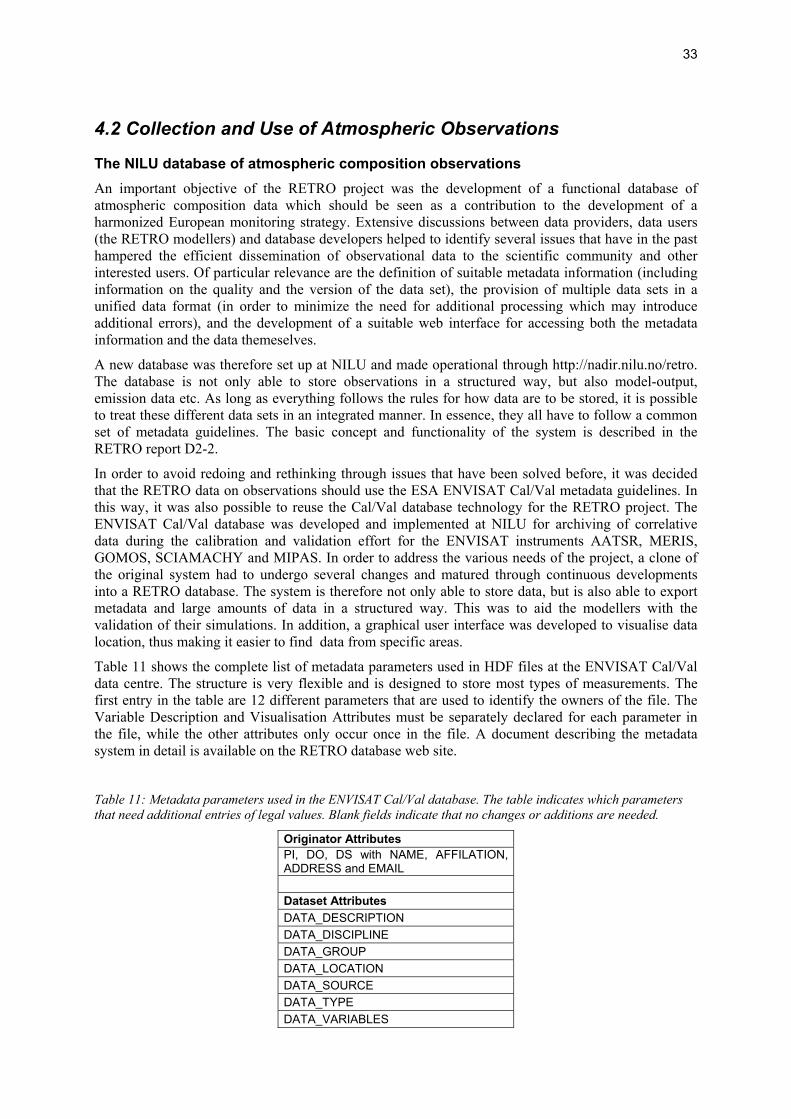
33
4.2 Collection and Use of Atmospheric Observations
The NILU database of atmospheric composition observations An important objective of the RETRO project was the development of a functional database of atmospheric composition data which should be seen as a contribution to the development of a harmonized European monitoring strategy. Extensive discussions between data providers, data users (the RETRO modellers) and database developers helped to identify several issues that have in the past hampered the efficient dissemination of observational data to the scientific community and other interested users. Of particular relevance are the definition of suitable metadata information (including information on the quality and the version of the data set), the provision of multiple data sets in a unified data format (in order to minimize the need for additional processing which may introduce additional errors), and the development of a suitable web interface for accessing both the metadata information and the data themeselves.
A new database was therefore set up at NILU and made operational through http://nadir.nilu.no/retro. The database is not only able to store observations in a structured way, but also model-output, emission data etc. As long as everything follows the rules for how data are to be stored, it is possible to treat these different data sets in an integrated manner. In essence, they all have to follow a common set of metadata guidelines. The basic concept and functionality of the system is described in the RETRO report D2-2.
In order to avoid redoing and rethinking through issues that have been solved before, it was decided that the RETRO data on observations should use the ESA ENVISAT Cal/Val metadata guidelines. In this way, it was also possible to reuse the Cal/Val database technology for the RETRO project. The ENVISAT Cal/Val database was developed and implemented at NILU for archiving of correlative data during the calibration and validation effort for the ENVISAT instruments AATSR, MERIS, GOMOS, SCIAMACHY and MIPAS. In order to address the various needs of the project, a clone of the original system had to undergo several changes and matured through continuous developments into a RETRO database. The system is therefore not only able to store data, but is also able to export metadata and large amounts of data in a structured way. This was to aid the modellers with the validation of their simulations. In addition, a graphical user interface was developed to visualise data location, thus making it easier to find data from specific areas.
Table 11 shows the complete list of metadata parameters used in HDF files at the ENVISAT Cal/Val data centre. The structure is very flexible and is designed to store most types of measurements. The first entry in the table are 12 different parameters that are used to identify the owners of the file. The Variable Description and Visualisation Attributes must be separately declared for each parameter in the file, while the other attributes only occur once in the file. A document describing the metadata system in detail is available on the RETRO database web site.
Table 11: Metadata parameters used in the ENVISAT Cal/Val database. The table indicates which parameters that need additional entries of legal values. Blank fields indicate that no changes or additions are needed.
Originator Attributes PI, DO, DS with NAME, AFFILATION, ADDRESS and EMAIL Dataset Attributes DATA_DESCRIPTION DATA_DISCIPLINE DATA_GROUP DATA_LOCATION DATA_SOURCE DATA_TYPE DATA_VARIABLES

34
DATA_START_DATE DATA_FILE_VERSION DATA_MODIFICATIONS DATA_CAVEATS DATA_RULES_OF_USE DATA_ACKNOWLEDGEMENT File Attributes FILE_NAME FILE_GENERATION_DATE FILE_ACCESS FILE_PROJECT_ID FILE_ASSOCIATION FILE_META_VERSION Variable Description Attributes VAR_NAME VAR_DESCRIPTION VAR_NOTES VAR_DIMENSION VAR_SIZE VAR_DEPEND VAR_DATA_TYPE VAR_UNITS VAR_SI_CONVERSION VAR_VALID_MIN VAR_VALID_MAX VAR_MONOTONE VAR_AVG_TYPE VAR_FILL_VALUE Variable Visualisation Attributes VIS_LABEL VIS_FORMAT VIS_PLOT_TYPE VIS_SCALE_TYPE VIS_SCALE_MIN VIS_SCALE_MAX
The RETRO database for observations is built around a MySQL relational database with an automatic file-processor to handle all incoming files and with a dynamic web-portal to allow easy, yet secure access for data users. A graphical user interface allows for easy selection of data sets by geographical region, parameter, time period, etc. In order to visualize the actual availability of the data set, a color coding has been developed (Figure 11). Observations that are readily available with one mouse-click are coded in green. If the user is first directed to another data base where he/she must further navigate and potentially sign some data protocol, the color code is yellow. If the data set is restricted to a specific user community, the color code is red. While it was not possible to fully develop this concept into an operational and sustainable data base within RETRO, the project nevertheless created some new ideas and therefore made valuable contributions to the harmonisation of the European and international monitoring activities.

35
Figure 11: Geospatial availability of EMEP SO2 data in the RETRO database including a color coding to indicate the accessability of individual data sets
The RETRO reports D2-2 and D2-5 also summarize existing initiatives to further develop the integrated monitoring of the atmospheric composition on the global to regional scale. Due to the work done in these initiatives (in part supported by institutes and staff involved in the RETRO project), there was little need for an independent assessment of the European monitoring strategy and an elaborate discussion of future monitoring needs. The two RETRO reports listed above are therefore relatively short and contain mere summaries with relevant links to GEOSS, GMES, GCOS-IGACO, etc.
Analysis of tropospheric ozone trends based on historic aircraft data Because of the very restricted data availability of historic ozone measurements, the description of tropospheric ozone changes by anthropogenic ozone precursor emissions heavily relies on numerical simulations, which is the main task of the EU-project RETRO. However, because of the complexity of the system and the restriction on computer resources, numerical simulations need simplifications of the reality and therefore the output of numerical simulations need to be compared with measurements. A particular activity of the RETRO project was therefore the search of old ozone measurements which can be used for model evaluation.
The knowledge of historical ozone in the UT/LS is mostly based on a confined number of regular ozone measurements from balloon stations with the longest measurement series starting in the late 1960s. In this study, we use ozone measurements from regular aircraft of the GASP project (Global Atmospheric Sampling Program) providing ozone data from four B-747 aircraft operated from USA from 1975 to 1979 to build a UT/LS ozone climatology of the second part of the nineteen seventies, as a first step towards an analysis of long-term changes in UT/LS ozone derived from aircraft measurements. The analysis also includes a comparison with more recent measurements of the MOZAIC program (Measurement of Ozone and Water Vapor by Airbus in Service Aircraft Program) to demonstrate the close resemblance of the two data sets in terms of vertical profiles, seasonal cycles and absolute abundances.
The GASP and MOZAIC data were binned relative to the dynamical tropopause, coordinates in equivalent latitudes were used for analysis of stratospheric data. Additionally, in the upper troposphere, averages were computed for specific regions of the world according to the GASP and MOZAIC flight routes. The analysis shows that the seasonality and concentrations of GASP ozone in the UT/LS are generally in agreement with MOZAIC (Fig. 12) and other observations in the literature. In addition, GASP aircraft ozone was compared to data from regular balloon ascents of the same period of time to verify early ozone sounding records. For the quantitative comparison, an altitude
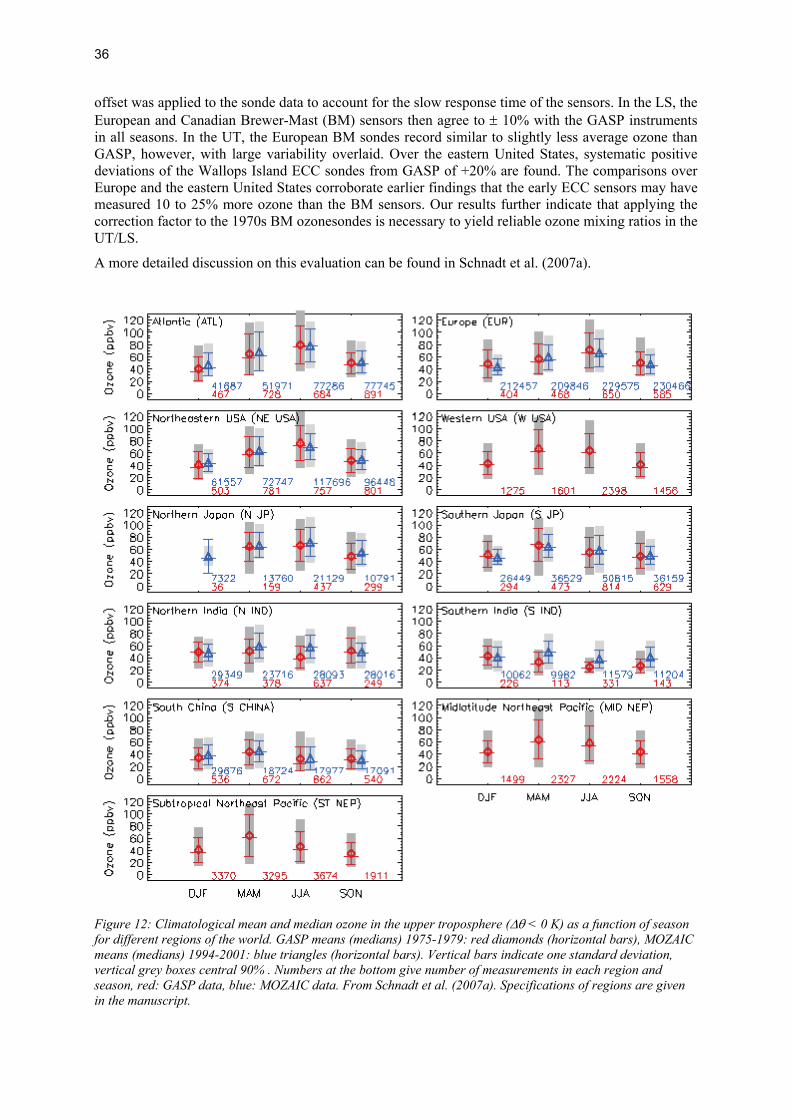
36
offset was applied to the sonde data to account for the slow response time of the sensors. In the LS, the European and Canadian Brewer-Mast (BM) sensors then agree to ± 10% with the GASP instruments in all seasons. In the UT, the European BM sondes record similar to slightly less average ozone than GASP, however, with large variability overlaid. Over the eastern United States, systematic positive deviations of the Wallops Island ECC sondes from GASP of +20% are found. The comparisons over Europe and the eastern United States corroborate earlier findings that the early ECC sensors may have measured 10 to 25% more ozone than the BM sensors. Our results further indicate that applying the correction factor to the 1970s BM ozonesondes is necessary to yield reliable ozone mixing ratios in the UT/LS.
A more detailed discussion on this evaluation can be found in Schnadt et al. (2007a).
Figure 12: Climatological mean and median ozone in the upper troposphere (Δθ < 0 K) as a function of season for different regions of the world. GASP means (medians) 1975-1979: red diamonds (horizontal bars), MOZAIC means (medians) 1994-2001: blue triangles (horizontal bars). Vertical bars indicate one standard deviation, vertical grey boxes central 90% . Numbers at the bottom give number of measurements in each region and season, red: GASP data, blue: MOZAIC data. From Schnadt et al. (2007a). Specifications of regions are given in the manuscript.
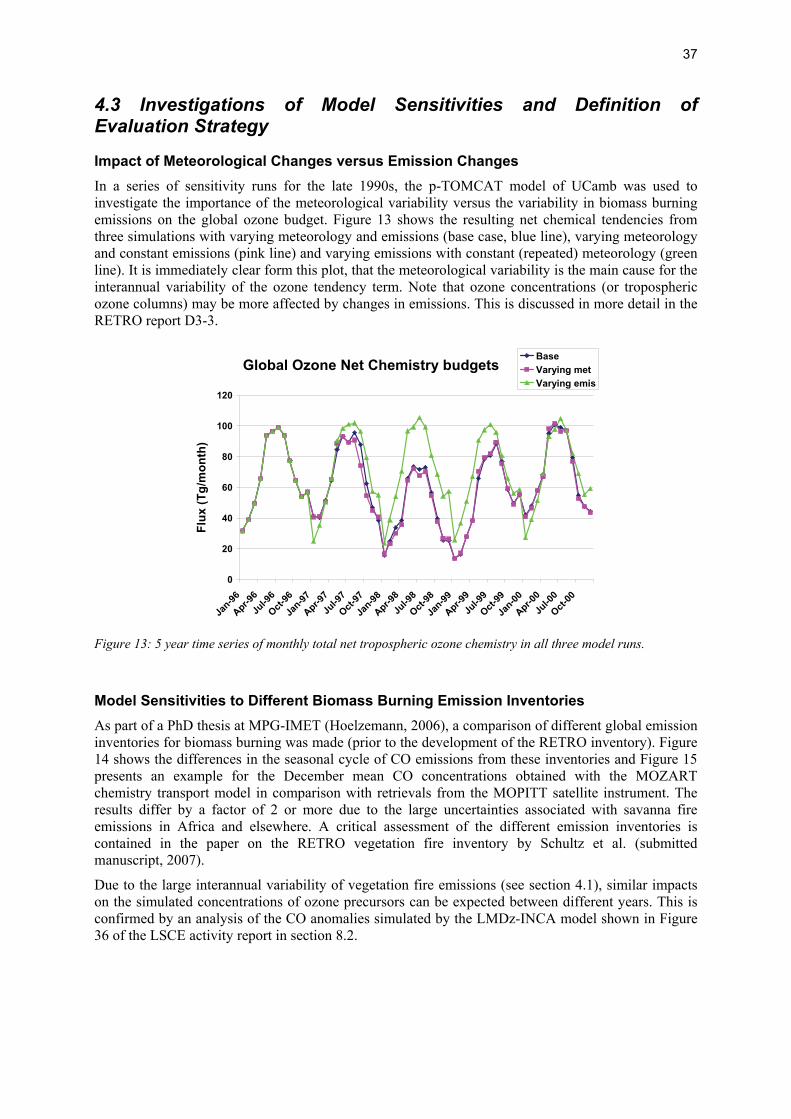
37
4.3 Investigations of Model Sensitivities and Definition of Evaluation Strategy
Impact of Meteorological Changes versus Emission Changes In a series of sensitivity runs for the late 1990s, the p-TOMCAT model of UCamb was used to investigate the importance of the meteorological variability versus the variability in biomass burning emissions on the global ozone budget. Figure 13 shows the resulting net chemical tendencies from three simulations with varying meteorology and emissions (base case, blue line), varying meteorology and constant emissions (pink line) and varying emissions with constant (repeated) meteorology (green line). It is immediately clear form this plot, that the meteorological variability is the main cause for the interannual variability of the ozone tendency term. Note that ozone concentrations (or tropospheric ozone columns) may be more affected by changes in emissions. This is discussed in more detail in the RETRO report D3-3.
Global Ozone Net Chemistry budgets
0
20
40
60
80
100
120
Jan-96
Apr-96Ju
l-96
Oct-96
Jan-97
Apr-97Ju
l-97
Oct-97
Jan-98
Apr-98Ju
l-98
Oct-98
Jan-99
Apr-99Ju
l-99
Oct-99
Jan-00
Apr-00Ju
l-00
Oct-00
Flux
(Tg/
mon
th)
BaseVarying metVarying emis
Figure 13: 5 year time series of monthly total net tropospheric ozone chemistry in all three model runs.
Model Sensitivities to Different Biomass Burning Emission Inventories As part of a PhD thesis at MPG-IMET (Hoelzemann, 2006), a comparison of different global emission inventories for biomass burning was made (prior to the development of the RETRO inventory). Figure 14 shows the differences in the seasonal cycle of CO emissions from these inventories and Figure 15 presents an example for the December mean CO concentrations obtained with the MOZART chemistry transport model in comparison with retrievals from the MOPITT satellite instrument. The results differ by a factor of 2 or more due to the large uncertainties associated with savanna fire emissions in Africa and elsewhere. A critical assessment of the different emission inventories is contained in the paper on the RETRO vegetation fire inventory by Schultz et al. (submitted manuscript, 2007).
Due to the large interannual variability of vegetation fire emissions (see section 4.1), similar impacts on the simulated concentrations of ozone precursors can be expected between different years. This is confirmed by an analysis of the CO anomalies simulated by the LMDz-INCA model shown in Figure 36 of the LSCE activity report in section 8.2.

38
monthly global CO totals in year 2000
0
10
20
30
40
50
60
70
1 2 3 4 5 6 7 8 9 10 11 12months
CO
in T
g
GWEM-1.3 gfed Hao&Liu mgs_scalcg_scal agr anthro biofuelbiogenic ocean
Figure 14: Monthly mean global CO emissions from various biomass burning inventories. (figure from Hoelzemann, 2006)
Figure 15: December 2000 monthly MOPITT CO concentrations (upper left panel) in ppbv at 700 hPa, compared to corresponding monthly mean CO concentrations of MOZART runs with the GWEM 1.3 inventory (A), the inventories based on ATSR active fires by Schultz, 2002 (H) ,and by C. Granier, unpublished (G), the GFED inventory version 1 by van der Werf et al., 2003 (J), and the climatological inventory by Hao et al., 1994 (K)
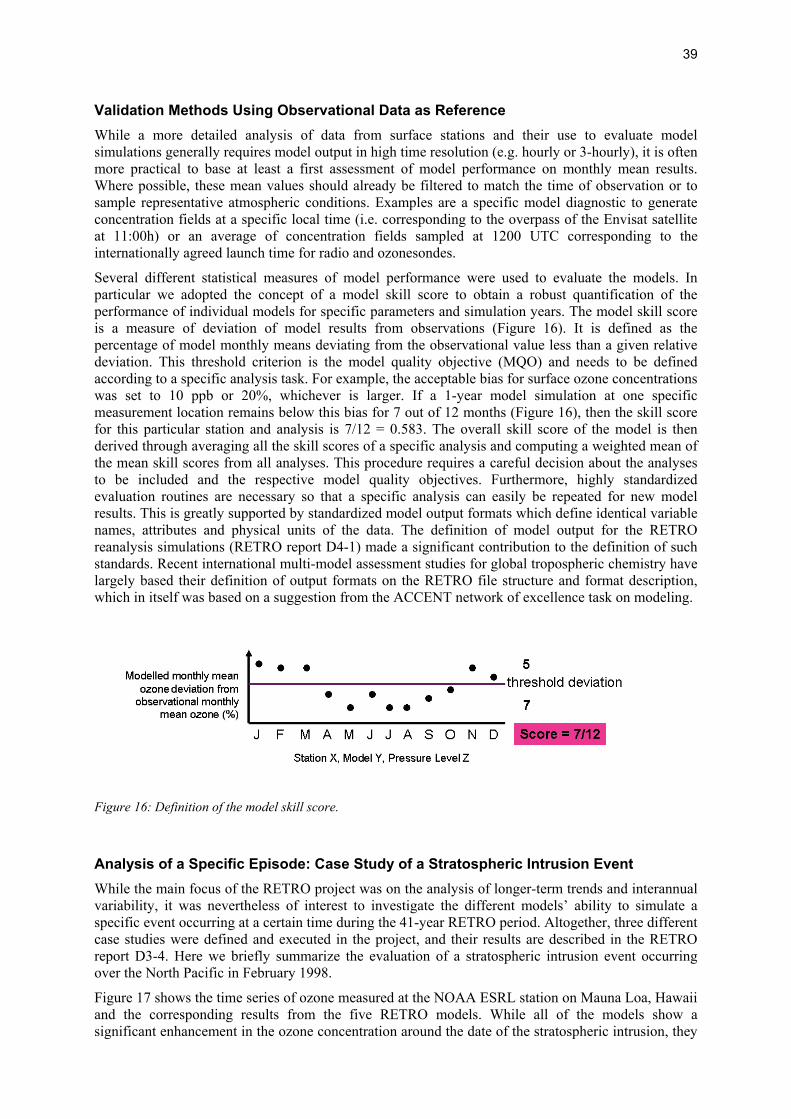
39
Validation Methods Using Observational Data as Reference While a more detailed analysis of data from surface stations and their use to evaluate model simulations generally requires model output in high time resolution (e.g. hourly or 3-hourly), it is often more practical to base at least a first assessment of model performance on monthly mean results. Where possible, these mean values should already be filtered to match the time of observation or to sample representative atmospheric conditions. Examples are a specific model diagnostic to generate concentration fields at a specific local time (i.e. corresponding to the overpass of the Envisat satellite at 11:00h) or an average of concentration fields sampled at 1200 UTC corresponding to the internationally agreed launch time for radio and ozonesondes.
Several different statistical measures of model performance were used to evaluate the models. In particular we adopted the concept of a model skill score to obtain a robust quantification of the performance of individual models for specific parameters and simulation years. The model skill score is a measure of deviation of model results from observations (Figure 16). It is defined as the percentage of model monthly means deviating from the observational value less than a given relative deviation. This threshold criterion is the model quality objective (MQO) and needs to be defined according to a specific analysis task. For example, the acceptable bias for surface ozone concentrations was set to 10 ppb or 20%, whichever is larger. If a 1-year model simulation at one specific measurement location remains below this bias for 7 out of 12 months (Figure 16), then the skill score for this particular station and analysis is 7/12 = 0.583. The overall skill score of the model is then derived through averaging all the skill scores of a specific analysis and computing a weighted mean of the mean skill scores from all analyses. This procedure requires a careful decision about the analyses to be included and the respective model quality objectives. Furthermore, highly standardized evaluation routines are necessary so that a specific analysis can easily be repeated for new model results. This is greatly supported by standardized model output formats which define identical variable names, attributes and physical units of the data. The definition of model output for the RETRO reanalysis simulations (RETRO report D4-1) made a significant contribution to the definition of such standards. Recent international multi-model assessment studies for global tropospheric chemistry have largely based their definition of output formats on the RETRO file structure and format description, which in itself was based on a suggestion from the ACCENT network of excellence task on modeling.
Figure 16: Definition of the model skill score.
Analysis of a Specific Episode: Case Study of a Stratospheric Intrusion Event While the main focus of the RETRO project was on the analysis of longer-term trends and interannual variability, it was nevertheless of interest to investigate the different models’ ability to simulate a specific event occurring at a certain time during the 41-year RETRO period. Altogether, three different case studies were defined and executed in the project, and their results are described in the RETRO report D3-4. Here we briefly summarize the evaluation of a stratospheric intrusion event occurring over the North Pacific in February 1998.
Figure 17 shows the time series of ozone measured at the NOAA ESRL station on Mauna Loa, Hawaii and the corresponding results from the five RETRO models. While all of the models show a significant enhancement in the ozone concentration around the date of the stratospheric intrusion, they

40
cannot reproduce the exact timing and shape of the observed ozone peak. The more detailed analysis described in the D3-4 report concludes that this is a consequence of the coarse model resolution together with some artifact of the driving meteorological data from ERA-40. Physical parameterizations of the models also play a role. For example, the vertical cross sections of the stratospheric ozone plume during the intrusion event have quite different shapes in the different models.
Figure 17: Ozone concentrations at Mauna Loa Observatory for 24-26/2/1997
Contribution to the ACCENT/IPCC Photocomp 2030 Modelling Study A large number of chemistry transport models, including all models participating in the RETRO project, have performed calculations for the Air Quality and Climate Change model exercise, aimed to contribute to the Fourth Assessment Report (AR4) of the IPCC. In this exercise new emission scenarios from the International Institute for Applied Systems Analysis (IIASA) have been applied in addition to the more pessimistic A2 scenario from the IPCC Special Report on Emissions Scenarios (SRES). As part of the exercise a detailed comparison has been made between the modeled tropospheric NO2 columns and GOME observations for the year 2000 (van Noije et al., 2006a). The tropospheric NO2 columns derived from satellite observations through their global coverage allow a detailed evaluation of tropospheric chemistry models including spatial and temporal variability on a range of scales. The differences between models and observations provide important information about the quality of emission inventories.
The differences between the model results and the retrievals were investigated for different regions of the world. For a proper comparison, model output was taken at 10:30 local time, corresponding with the pass over time of the satellite, and collocated with the clear-sky pixels along the track. As an example we show in Figure 18 the results for Europe (10oW–30oE, 35oN–60oN).
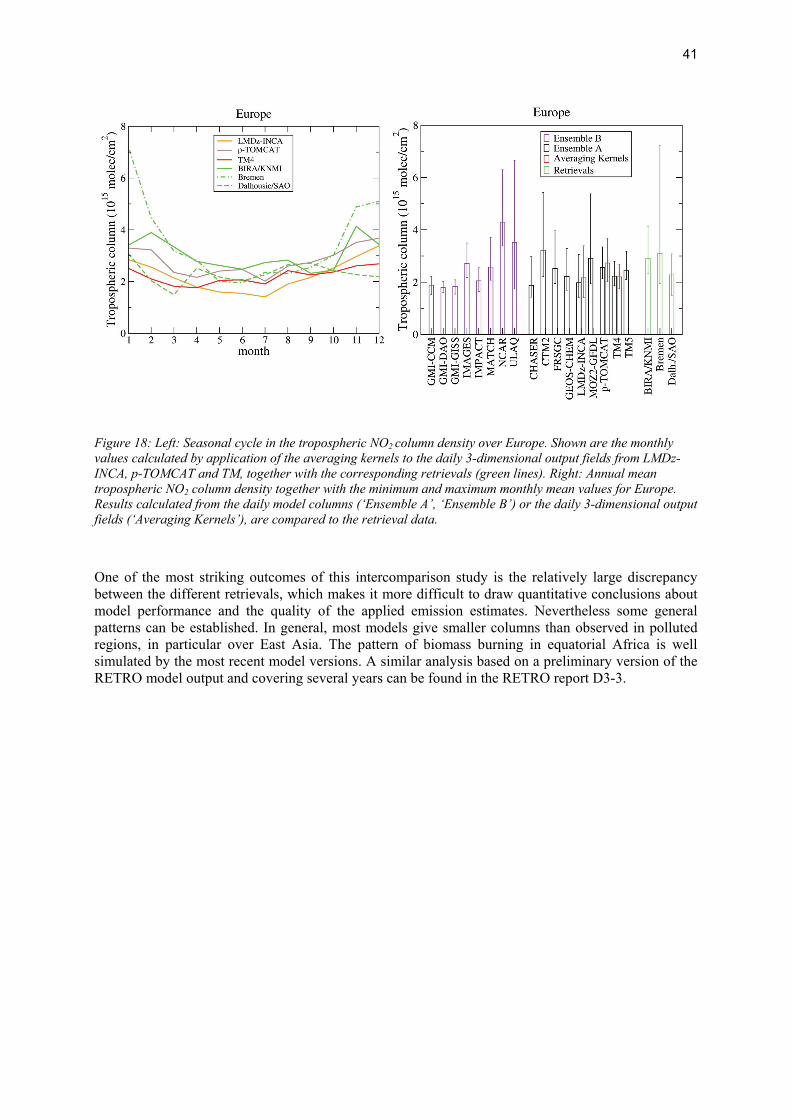
41
Figure 18: Left: Seasonal cycle in the tropospheric NO2 column density over Europe. Shown are the monthly values calculated by application of the averaging kernels to the daily 3-dimensional output fields from LMDz-INCA, p-TOMCAT and TM, together with the corresponding retrievals (green lines). Right: Annual mean tropospheric NO2 column density together with the minimum and maximum monthly mean values for Europe. Results calculated from the daily model columns (‘Ensemble A’, ‘Ensemble B’) or the daily 3-dimensional output fields (‘Averaging Kernels’), are compared to the retrieval data.
One of the most striking outcomes of this intercomparison study is the relatively large discrepancy between the different retrievals, which makes it more difficult to draw quantitative conclusions about model performance and the quality of the applied emission estimates. Nevertheless some general patterns can be established. In general, most models give smaller columns than observed in polluted regions, in particular over East Asia. The pattern of biomass burning in equatorial Africa is well simulated by the most recent model versions. A similar analysis based on a preliminary version of the RETRO model output and covering several years can be found in the RETRO report D3-3.
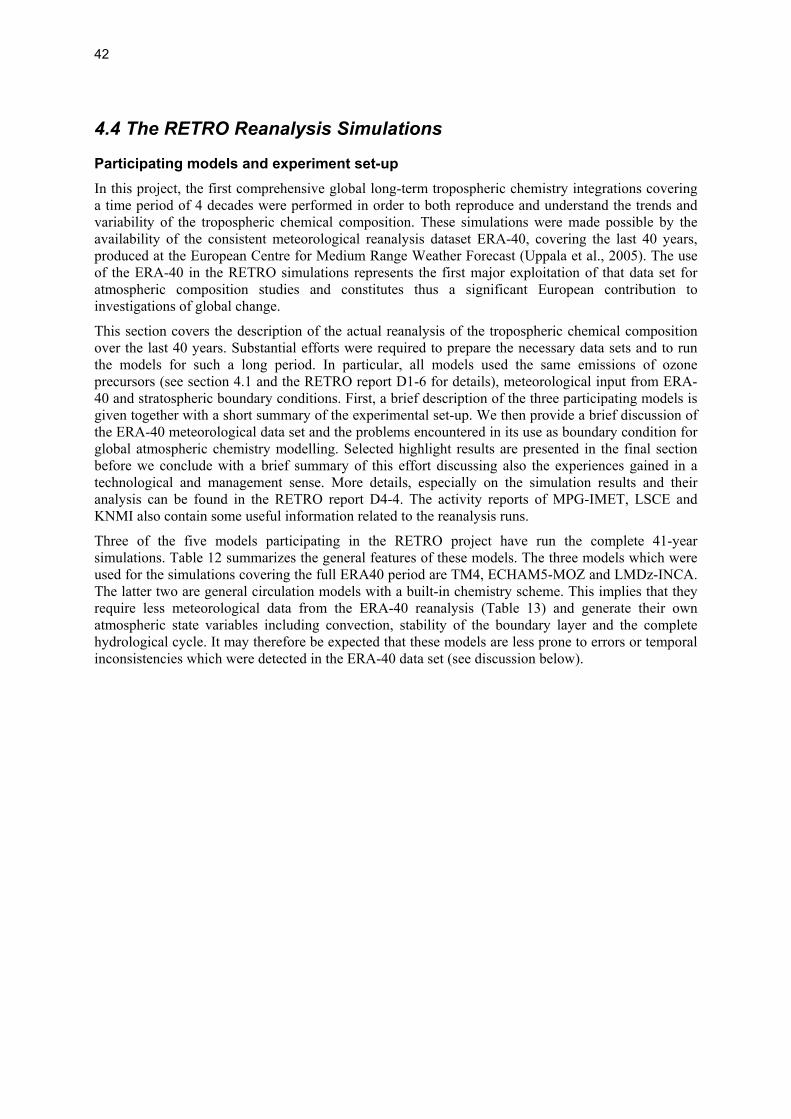
42
4.4 The RETRO Reanalysis Simulations
Participating models and experiment set-up In this project, the first comprehensive global long-term tropospheric chemistry integrations covering a time period of 4 decades were performed in order to both reproduce and understand the trends and variability of the tropospheric chemical composition. These simulations were made possible by the availability of the consistent meteorological reanalysis dataset ERA-40, covering the last 40 years, produced at the European Centre for Medium Range Weather Forecast (Uppala et al., 2005). The use of the ERA-40 in the RETRO simulations represents the first major exploitation of that data set for atmospheric composition studies and constitutes thus a significant European contribution to investigations of global change.
This section covers the description of the actual reanalysis of the tropospheric chemical composition over the last 40 years. Substantial efforts were required to prepare the necessary data sets and to run the models for such a long period. In particular, all models used the same emissions of ozone precursors (see section 4.1 and the RETRO report D1-6 for details), meteorological input from ERA-40 and stratospheric boundary conditions. First, a brief description of the three participating models is given together with a short summary of the experimental set-up. We then provide a brief discussion of the ERA-40 meteorological data set and the problems encountered in its use as boundary condition for global atmospheric chemistry modelling. Selected highlight results are presented in the final section before we conclude with a brief summary of this effort discussing also the experiences gained in a technological and management sense. More details, especially on the simulation results and their analysis can be found in the RETRO report D4-4. The activity reports of MPG-IMET, LSCE and KNMI also contain some useful information related to the reanalysis runs.
Three of the five models participating in the RETRO project have run the complete 41-year simulations. Table 12 summarizes the general features of these models. The three models which were used for the simulations covering the full ERA40 period are TM4, ECHAM5-MOZ and LMDz-INCA. The latter two are general circulation models with a built-in chemistry scheme. This implies that they require less meteorological data from the ERA-40 reanalysis (Table 13) and generate their own atmospheric state variables including convection, stability of the boundary layer and the complete hydrological cycle. It may therefore be expected that these models are less prone to errors or temporal inconsistencies which were detected in the ERA-40 data set (see discussion below).

43
Table12: Participating models general features
ECHAM5-MOZ (MOZECH)
LMDz-INCA TM4
Participants MPG-IMET S. Rast
M. Schultz
LSCE S. Szopa
D. Hauglustaine
KNMI T. van Noije
P. van Velthoven Resolution 2.8x2.8 L31 (up to 10
hPa) 3.75x2.5 L19 (up to 3hPa) 3.0x2.0 L25 (up to
0.48hPa) Total number of species
(number of advected tracers)
65 (63) 75 (73) or 89 (87) 37 (22)
Chemical scheme (number of reactions)
NMHC (135)
NMHC (332)
NMHC (95) Sulphur aerosols
Advection Convection
Boundary Layer
Lin+Rood 1996 Tiedtke 1989/Nordeng
1994 Monin Obukhov
Van-Leer 1977 Tiedtke 1989
LMDz
Russel and Lerner 1981 Tiedtke 1989
Holtslag+Boville
Wallclock time for 1 year simulation
22 h 50h 22h
Biogenic emissions including NOx
Interactive MEGAN model by Guenther et al.
(2006)
ORCHIDEE climatology (Lathiere et al., 2005)
ORCHIDEE climatology (Lathiere et al., 2005)
Lightning emissions Interactive (Grewe et al., 2000)
Interactive Interactive (Meijer et al., 2001); scaled to 5 Tg
N/yr for 1997 (ERA-40) Height distribution of
biomass burning emissions
Altitude profiles without segregation of vegetation
types
No Altitude profiles with segregation into 3 vegetation types
Ocean CO and other VOC emissions
POET (CO, C2H6, C3H8, higher alkanes,
C2H4, C3H6)
Erickson and, Taylor (1992) rescaled such asr
CO: 20.0, Isoprene: 0.88, C2H4: 0.688, C3H6: 0.,
C2H2: 0.20, alkenes: 0.27, CH3COCH3: 12.41Tg.yr-
1
POET (CO and CBM-4 categories from C2H6, C3H8, C2H4, C3H6)
Aircraft NOx emissions Grewe (2003) Annual total from Grewe (2003) distributed
according to ANCAT
Grewe (2003)
Stratospheric ozone Relaxed to stratospheric O3, NOx, and HNO3
down to 200 hPa in extra-tropics and 100 hPa in
tropics (10 day time constant)
Stratospheric O3 nudged toward climatology above
380K
O3 nudged toward climatology above 123 hPa: except 30N–30S, above 60 hPa
Key references Rast et al., in preparation ; Röckner et al. (2003); Horowitz et al. (2003)
Hauglustaine et al. (2004) Folberth et al. (2006)
van Noije et al. (2004, 2006)

44
Table 13: Meteorological variables of ERA-40 used in the various RETRO models
ECHAM5-MOZ
LMDz-INCA
TM4 Oslo-CTM2 pTOMCAT
Temperature X X X X Specific humidity X X X Geopotential height X Wind vector (u, v) X Wind divergence X X X Potential vorticity X X Horizontal mass flux X Convective mass flux X X Vertical diffusion X LWC X X IWC X X Cloud fraction X X Cloud levels X X Large-scale precipitation X X Convective precipitation X X Aerodynamical resistance X Friction velocity X Temperature 2m X Wind speed 10m Surface roughness X Surface pressure X X X Sea surface temperature X X Sea ice cover X The long-term model runs were performed chronologically in order to ensure consistency of the results. After the first runs were evaluated, some errors discovered in the results of all models mandated a second reanalysis run which occurred between October 2006 and February 2007. The model results were processed to adhere to the modern CF convention (standardized metadata information) and archived on the RETRO ftp server ftp://ftp.retro.enes.org/pub/model_results, where they are available for use by the scientific community, by interested stakeholders or by the public.
Besides using the same RETRO emission data sets, the models were also constrained with identical boundary conditions for boundary layer methane concentrations (see description in RETRO report D1-6) in order to avoid a spurious drift in methane concentrations (and as a consequence in tropospheric ozone) due to imbalanced sources and sinks. Two of the models (LMDz-INCA and TM4) employed the climatology of the lower stratosphere generated by the FMI Finrose model (see activity report by FMI in section 8.9), while the ECHAM5-MOZ model used a constant climatology.
Assessment of the ERA-40 Reanalysis Data Set During the first year of the project it was discovered that the ERA-40 data set suffered from a couple of inconsistencies in the data assimilation. These resulted in a number of step changes in some meteorological variables when new observational parameters had been introduced in the ECMWF data assimilation system. As a consequence, the ERA-40 circulation exhibits too strong meridional overturning and excessive tropical precipitation over the oceans (Uppala et al., 2005 and references therein). As we shall see in the discussion of the results, these ERA-40 features make it difficult to reliably distinguish between natural variability and assimilation artefacts in the calculated tropospheric trace gas concentrations. The example of lightning NOx emissions has already been discussed in section 4.1 above.
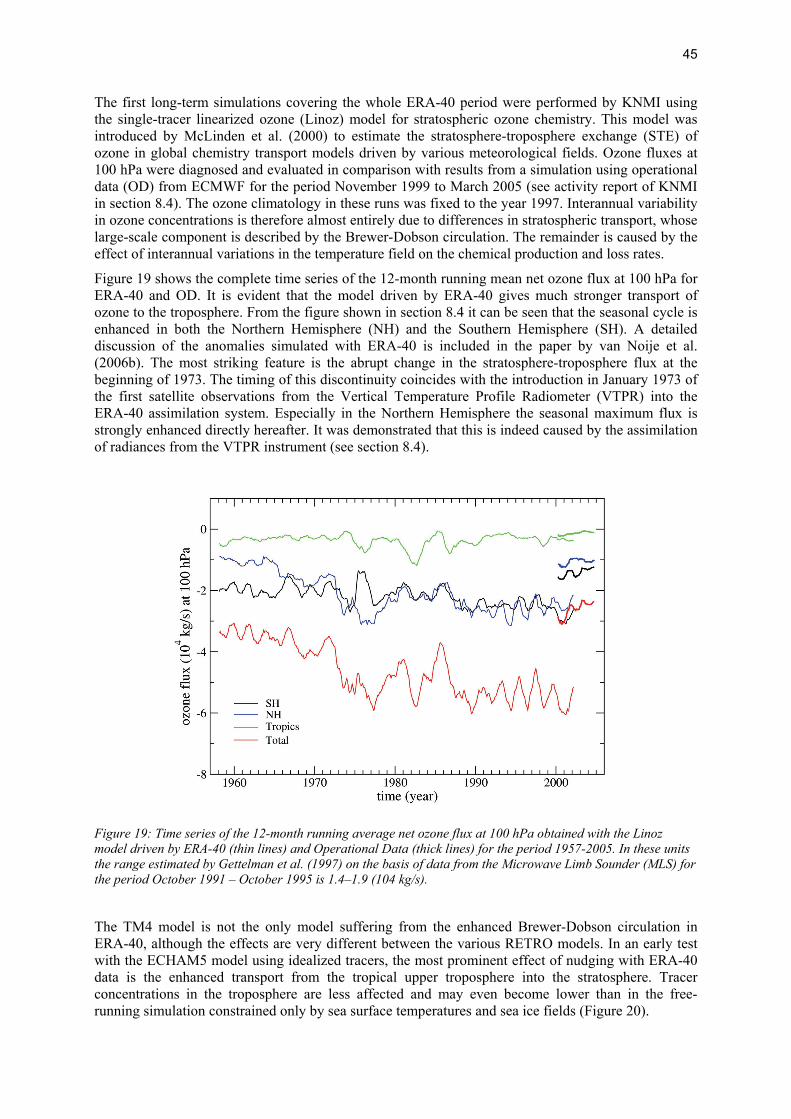
45
The first long-term simulations covering the whole ERA-40 period were performed by KNMI using the single-tracer linearized ozone (Linoz) model for stratospheric ozone chemistry. This model was introduced by McLinden et al. (2000) to estimate the stratosphere-troposphere exchange (STE) of ozone in global chemistry transport models driven by various meteorological fields. Ozone fluxes at 100 hPa were diagnosed and evaluated in comparison with results from a simulation using operational data (OD) from ECMWF for the period November 1999 to March 2005 (see activity report of KNMI in section 8.4). The ozone climatology in these runs was fixed to the year 1997. Interannual variability in ozone concentrations is therefore almost entirely due to differences in stratospheric transport, whose large-scale component is described by the Brewer-Dobson circulation. The remainder is caused by the effect of interannual variations in the temperature field on the chemical production and loss rates.
Figure 19 shows the complete time series of the 12-month running mean net ozone flux at 100 hPa for ERA-40 and OD. It is evident that the model driven by ERA-40 gives much stronger transport of ozone to the troposphere. From the figure shown in section 8.4 it can be seen that the seasonal cycle is enhanced in both the Northern Hemisphere (NH) and the Southern Hemisphere (SH). A detailed discussion of the anomalies simulated with ERA-40 is included in the paper by van Noije et al. (2006b). The most striking feature is the abrupt change in the stratosphere-troposphere flux at the beginning of 1973. The timing of this discontinuity coincides with the introduction in January 1973 of the first satellite observations from the Vertical Temperature Profile Radiometer (VTPR) into the ERA-40 assimilation system. Especially in the Northern Hemisphere the seasonal maximum flux is strongly enhanced directly hereafter. It was demonstrated that this is indeed caused by the assimilation of radiances from the VTPR instrument (see section 8.4).
Figure 19: Time series of the 12-month running average net ozone flux at 100 hPa obtained with the Linoz model driven by ERA-40 (thin lines) and Operational Data (thick lines) for the period 1957-2005. In these units the range estimated by Gettelman et al. (1997) on the basis of data from the Microwave Limb Sounder (MLS) for the period October 1991 – October 1995 is 1.4–1.9 (104 kg/s).
The TM4 model is not the only model suffering from the enhanced Brewer-Dobson circulation in ERA-40, although the effects are very different between the various RETRO models. In an early test with the ECHAM5 model using idealized tracers, the most prominent effect of nudging with ERA-40 data is the enhanced transport from the tropical upper troposphere into the stratosphere. Tracer concentrations in the troposphere are less affected and may even become lower than in the free-running simulation constrained only by sea surface temperatures and sea ice fields (Figure 20).
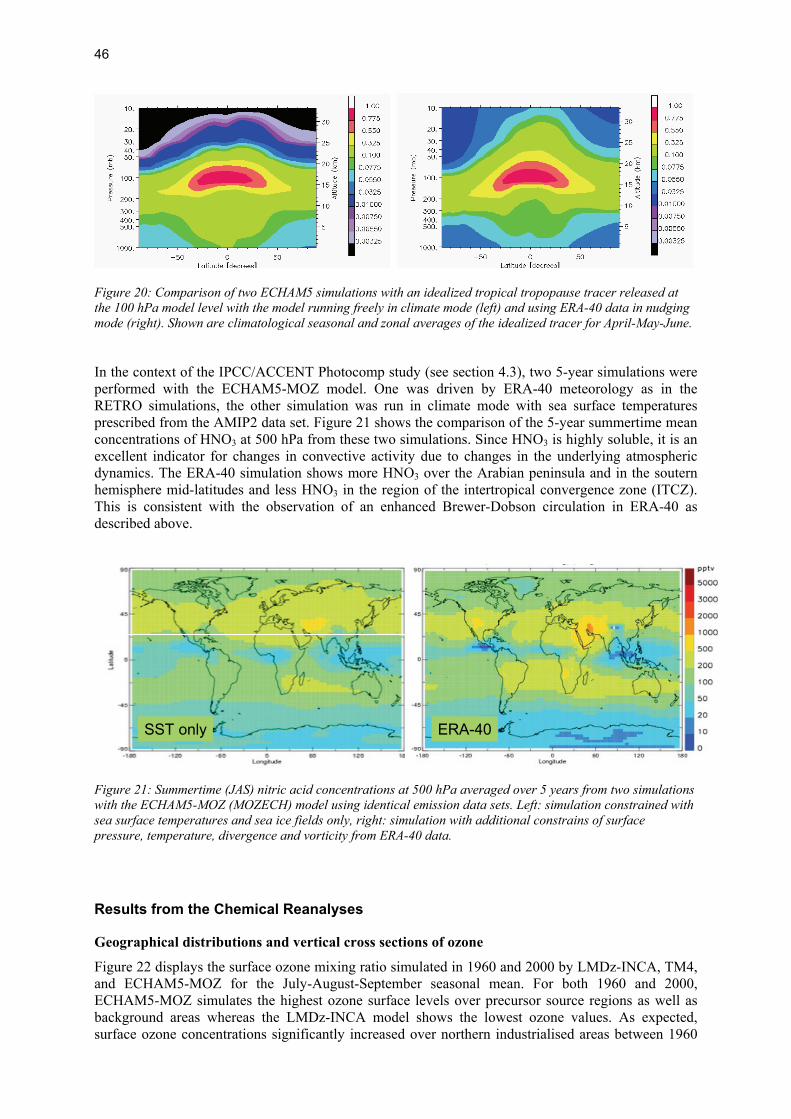
46
Figure 20: Comparison of two ECHAM5 simulations with an idealized tropical tropopause tracer released at the 100 hPa model level with the model running freely in climate mode (left) and using ERA-40 data in nudging mode (right). Shown are climatological seasonal and zonal averages of the idealized tracer for April-May-June.
In the context of the IPCC/ACCENT Photocomp study (see section 4.3), two 5-year simulations were performed with the ECHAM5-MOZ model. One was driven by ERA-40 meteorology as in the RETRO simulations, the other simulation was run in climate mode with sea surface temperatures prescribed from the AMIP2 data set. Figure 21 shows the comparison of the 5-year summertime mean concentrations of HNO3 at 500 hPa from these two simulations. Since HNO3 is highly soluble, it is an excellent indicator for changes in convective activity due to changes in the underlying atmospheric dynamics. The ERA-40 simulation shows more HNO3 over the Arabian peninsula and in the soutern hemisphere mid-latitudes and less HNO3 in the region of the intertropical convergence zone (ITCZ). This is consistent with the observation of an enhanced Brewer-Dobson circulation in ERA-40 as described above.
SST only ERA-40SST only ERA-40
Figure 21: Summertime (JAS) nitric acid concentrations at 500 hPa averaged over 5 years from two simulations with the ECHAM5-MOZ (MOZECH) model using identical emission data sets. Left: simulation constrained with sea surface temperatures and sea ice fields only, right: simulation with additional constrains of surface pressure, temperature, divergence and vorticity from ERA-40 data.
Results from the Chemical Reanalyses
Geographical distributions and vertical cross sections of ozone
Figure 22 displays the surface ozone mixing ratio simulated in 1960 and 2000 by LMDz-INCA, TM4, and ECHAM5-MOZ for the July-August-September seasonal mean. For both 1960 and 2000, ECHAM5-MOZ simulates the highest ozone surface levels over precursor source regions as well as background areas whereas the LMDz-INCA model shows the lowest ozone values. As expected, surface ozone concentrations significantly increased over northern industrialised areas between 1960
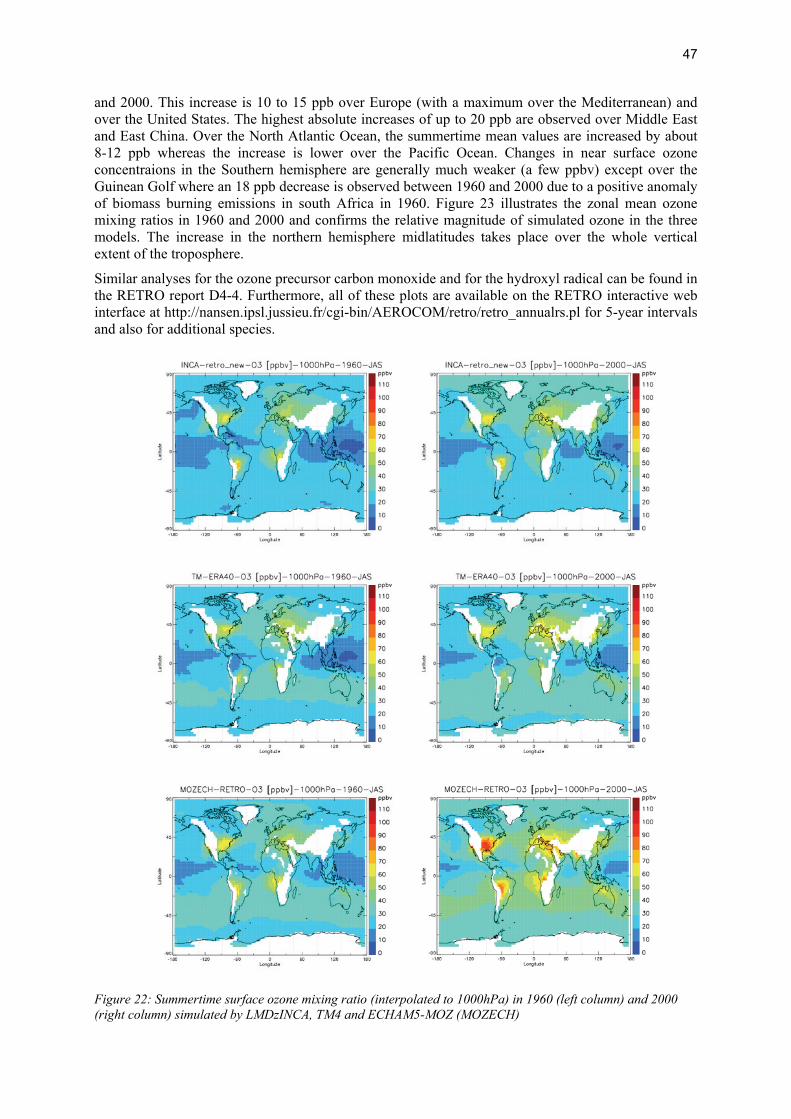
47
and 2000. This increase is 10 to 15 ppb over Europe (with a maximum over the Mediterranean) and over the United States. The highest absolute increases of up to 20 ppb are observed over Middle East and East China. Over the North Atlantic Ocean, the summertime mean values are increased by about 8-12 ppb whereas the increase is lower over the Pacific Ocean. Changes in near surface ozone concentraions in the Southern hemisphere are generally much weaker (a few ppbv) except over the Guinean Golf where an 18 ppb decrease is observed between 1960 and 2000 due to a positive anomaly of biomass burning emissions in south Africa in 1960. Figure 23 illustrates the zonal mean ozone mixing ratios in 1960 and 2000 and confirms the relative magnitude of simulated ozone in the three models. The increase in the northern hemisphere midlatitudes takes place over the whole vertical extent of the troposphere.
Similar analyses for the ozone precursor carbon monoxide and for the hydroxyl radical can be found in the RETRO report D4-4. Furthermore, all of these plots are available on the RETRO interactive web interface at http://nansen.ipsl.jussieu.fr/cgi-bin/AEROCOM/retro/retro_annualrs.pl for 5-year intervals and also for additional species.
Figure 22: Summertime surface ozone mixing ratio (interpolated to 1000hPa) in 1960 (left column) and 2000 (right column) simulated by LMDzINCA, TM4 and ECHAM5-MOZ (MOZECH)

48
Figure 23: Summertime zonal mean ozone mixing ratios in 1960 (left column) and 2000 (right column) simulated by LMDzINCA, TM4 and ECHAM5-MOZ
Trend analysis of the LMDz-INCA model The main feature of the 40-year simulation y LMDz-INCA (and also seen in the other two models) is an increase of zonal mean surface ozone concentrations in the northern hemisphere. Concentrations are maximum at ~45°N exceeding values of 45 ppb after about 1970 instead of 40-45 ppb in the early 1960s. Seasonal minimum concentrations at these latitudes also increased significantly. Using the ten highest daily values of surface ozone per year, trends were computed for each decade. Maximum ozone concentrations increased mostly at the end of the 1960s and in the early 1970s. In the 1980s, the positive trend is conserved mainly over Europe, India and North-Eastern USA but an overall decrease is simulated over the oceans. During the 1990’s, the maximum ozone continued to increase in NE-USA, and over Asia. The features in the southern hemisphere are more heterogeneous and no significant trend appears. The trend signals exhibit a large spatial and temporal heterogeneity. This provides an explanation for the difficulties to derive robust trend estimates from measurements of surface concentrations alone. Furthermore, ozone minima and maxima show significantly different features and have to be separated to deduce reliable tendencies. However, Figure 24 confirms an overall increase of maximum values and, to a lesser extent of minimum values when considering the whole period.
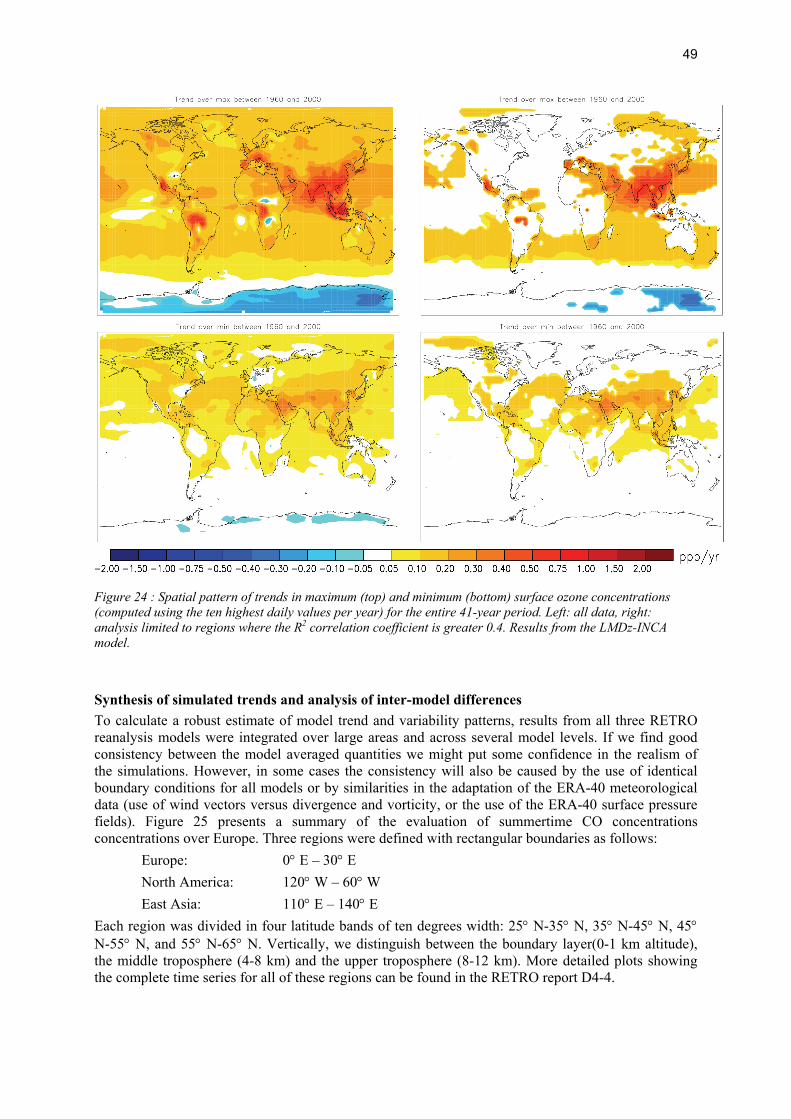
49
Figure 24 : Spatial pattern of trends in maximum (top) and minimum (bottom) surface ozone concentrations (computed using the ten highest daily values per year) for the entire 41-year period. Left: all data, right: analysis limited to regions where the R2 correlation coefficient is greater 0.4. Results from the LMDz-INCA model.
Synthesis of simulated trends and analysis of inter-model differences To calculate a robust estimate of model trend and variability patterns, results from all three RETRO reanalysis models were integrated over large areas and across several model levels. If we find good consistency between the model averaged quantities we might put some confidence in the realism of the simulations. However, in some cases the consistency will also be caused by the use of identical boundary conditions for all models or by similarities in the adaptation of the ERA-40 meteorological data (use of wind vectors versus divergence and vorticity, or the use of the ERA-40 surface pressure fields). Figure 25 presents a summary of the evaluation of summertime CO concentrations concentrations over Europe. Three regions were defined with rectangular boundaries as follows: Europe: 0° E – 30° E North America: 120° W – 60° W East Asia: 110° E – 140° E Each region was divided in four latitude bands of ten degrees width: 25° N-35° N, 35° N-45° N, 45° N-55° N, and 55° N-65° N. Vertically, we distinguish between the boundary layer(0-1 km altitude), the middle troposphere (4-8 km) and the upper troposphere (8-12 km). More detailed plots showing the complete time series for all of these regions can be found in the RETRO report D4-4.
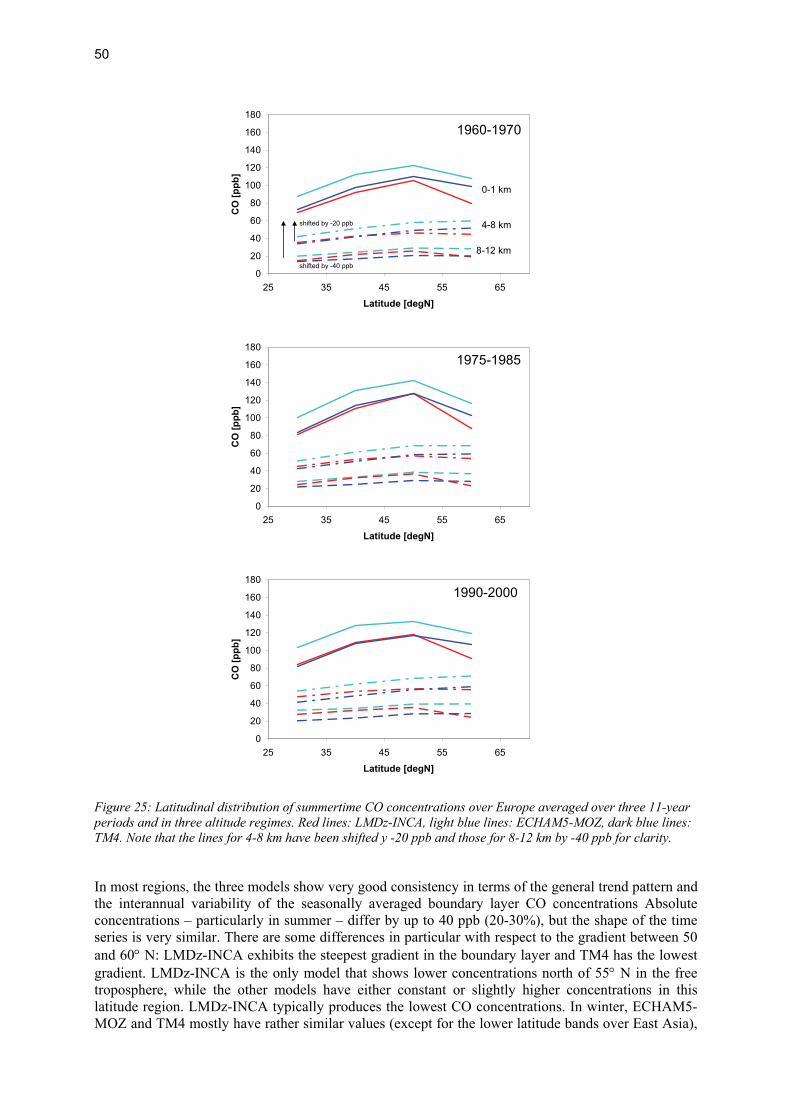
50
0
20
40
60
80
100
120
140
160
180
25 35 45 55 65
Latitude [degN]
CO
[ppb
]
0-1 km
4-8 km
8-12 km
shifted by -20 ppb
shifted by -40 ppb
1960-1970
0
20
40
60
80
100
120
140
160
180
25 35 45 55 65
Latitude [degN]
CO
[ppb
]
1975-1985
0
20
40
60
80
100
120
140
160
180
25 35 45 55 65
Latitude [degN]
CO
[ppb
]
1990-2000
Figure 25: Latitudinal distribution of summertime CO concentrations over Europe averaged over three 11-year periods and in three altitude regimes. Red lines: LMDz-INCA, light blue lines: ECHAM5-MOZ, dark blue lines: TM4. Note that the lines for 4-8 km have been shifted y -20 ppb and those for 8-12 km by -40 ppb for clarity.
In most regions, the three models show very good consistency in terms of the general trend pattern and the interannual variability of the seasonally averaged boundary layer CO concentrations Absolute concentrations – particularly in summer – differ by up to 40 ppb (20-30%), but the shape of the time series is very similar. There are some differences in particular with respect to the gradient between 50 and 60° N: LMDz-INCA exhibits the steepest gradient in the boundary layer and TM4 has the lowest gradient. LMDz-INCA is the only model that shows lower concentrations north of 55° N in the free troposphere, while the other models have either constant or slightly higher concentrations in this latitude region. LMDz-INCA typically produces the lowest CO concentrations. In winter, ECHAM5-MOZ and TM4 mostly have rather similar values (except for the lower latitude bands over East Asia),
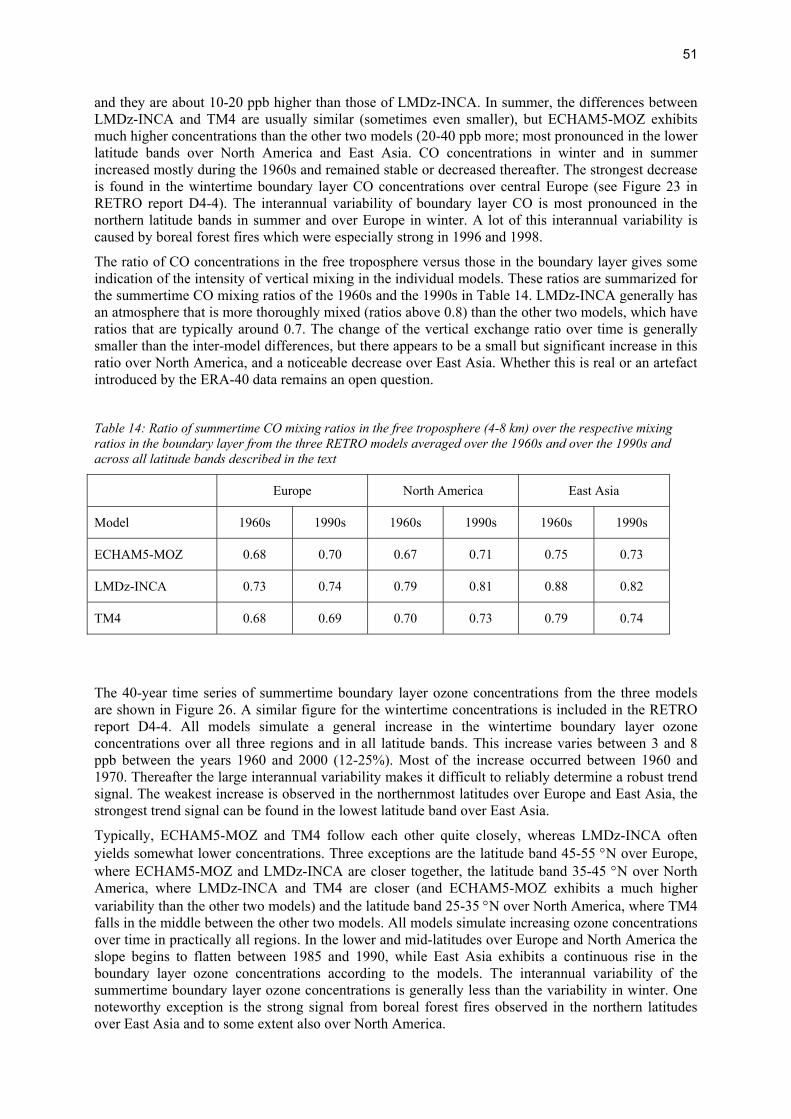
51
and they are about 10-20 ppb higher than those of LMDz-INCA. In summer, the differences between LMDz-INCA and TM4 are usually similar (sometimes even smaller), but ECHAM5-MOZ exhibits much higher concentrations than the other two models (20-40 ppb more; most pronounced in the lower latitude bands over North America and East Asia. CO concentrations in winter and in summer increased mostly during the 1960s and remained stable or decreased thereafter. The strongest decrease is found in the wintertime boundary layer CO concentrations over central Europe (see Figure 23 in RETRO report D4-4). The interannual variability of boundary layer CO is most pronounced in the northern latitude bands in summer and over Europe in winter. A lot of this interannual variability is caused by boreal forest fires which were especially strong in 1996 and 1998.
The ratio of CO concentrations in the free troposphere versus those in the boundary layer gives some indication of the intensity of vertical mixing in the individual models. These ratios are summarized for the summertime CO mixing ratios of the 1960s and the 1990s in Table 14. LMDz-INCA generally has an atmosphere that is more thoroughly mixed (ratios above 0.8) than the other two models, which have ratios that are typically around 0.7. The change of the vertical exchange ratio over time is generally smaller than the inter-model differences, but there appears to be a small but significant increase in this ratio over North America, and a noticeable decrease over East Asia. Whether this is real or an artefact introduced by the ERA-40 data remains an open question.
Table 14: Ratio of summertime CO mixing ratios in the free troposphere (4-8 km) over the respective mixing ratios in the boundary layer from the three RETRO models averaged over the 1960s and over the 1990s and across all latitude bands described in the text
Europe North America East Asia
Model 1960s 1990s 1960s 1990s 1960s 1990s
ECHAM5-MOZ 0.68 0.70 0.67 0.71 0.75 0.73
LMDz-INCA 0.73 0.74 0.79 0.81 0.88 0.82
TM4 0.68 0.69 0.70 0.73 0.79 0.74
The 40-year time series of summertime boundary layer ozone concentrations from the three models are shown in Figure 26. A similar figure for the wintertime concentrations is included in the RETRO report D4-4. All models simulate a general increase in the wintertime boundary layer ozone concentrations over all three regions and in all latitude bands. This increase varies between 3 and 8 ppb between the years 1960 and 2000 (12-25%). Most of the increase occurred between 1960 and 1970. Thereafter the large interannual variability makes it difficult to reliably determine a robust trend signal. The weakest increase is observed in the northernmost latitudes over Europe and East Asia, the strongest trend signal can be found in the lowest latitude band over East Asia.
Typically, ECHAM5-MOZ and TM4 follow each other quite closely, whereas LMDz-INCA often yields somewhat lower concentrations. Three exceptions are the latitude band 45-55 °N over Europe, where ECHAM5-MOZ and LMDz-INCA are closer together, the latitude band 35-45 °N over North America, where LMDz-INCA and TM4 are closer (and ECHAM5-MOZ exhibits a much higher variability than the other two models) and the latitude band 25-35 °N over North America, where TM4 falls in the middle between the other two models. All models simulate increasing ozone concentrations over time in practically all regions. In the lower and mid-latitudes over Europe and North America the slope begins to flatten between 1985 and 1990, while East Asia exhibits a continuous rise in the boundary layer ozone concentrations according to the models. The interannual variability of the summertime boundary layer ozone concentrations is generally less than the variability in winter. One noteworthy exception is the strong signal from boreal forest fires observed in the northern latitudes over East Asia and to some extent also over North America.

52
Latitude Europe North America East Asia
55-65
0
10
20
30
40
50
60
70
80
1960 1970 1980 1990 2000
Ozo
ne [p
pb]
ECHAM5-MOZLMDz-INCATM4
0
10
20
30
40
50
60
70
80
1960 1970 1980 1990 2000
Ozo
ne [p
pb]
0
10
20
30
40
50
60
70
80
1960 1970 1980 1990 2000
Ozo
ne [p
pb]
45-55
0
10
20
30
40
50
60
70
80
1960 1970 1980 1990 2000
Ozo
ne [p
pb]
0
10
20
30
40
50
60
70
80
1960 1970 1980 1990 2000
Ozo
ne [p
pb]
0
10
20
30
40
50
60
70
80
1960 1970 1980 1990 2000
Ozo
ne [p
pb]
35-45
0
10
20
30
40
50
60
70
80
1960 1970 1980 1990 2000
Ozo
ne [p
pb]
0
10
20
30
40
50
60
70
80
1960 1970 1980 1990 2000
Ozo
ne [p
pb]
0
10
20
30
40
50
60
70
80
1960 1970 1980 1990 2000
Ozo
ne [p
pb]
25-35
0
10
20
30
40
50
60
70
80
1960 1970 1980 1990 2000
Ozo
ne [p
pb]
0
10
20
30
40
50
60
70
80
1960 1970 1980 1990 2000
Ozo
ne [p
pb]
0
10
20
30
40
50
60
70
80
1960 1970 1980 1990 2000
Ozo
ne [p
pb]
Figure 26: Time series of summertime boundary layer ozone concentrations simulated by the three RETRO reanalysis models. For details on the region definitions, see text
Figure 27 summarizes the decadal mean trends in the boundary layer summertime ozone concentrations from the mean of the three models. According to our simulations the highest ozone values are found in the Mediterranean latitudes over Europe and ozone concentrations have increased by more than 10 ppb in this region since the 1960s. Central Europe and the northern part of the United States (including in particular the East coast urban agglomerations of New York and Washington) exhibit the second-highest ozone concentrations and experienced a similar rise over time. Up to the year 2000, the simulated boundary layer ozone concentrations over East Asia remained somewhat lower than over Europe and North America, but this region experiences the strongest increase, in particular in the latitude band 35-45 °N, where the values in the 1990s have come close to those over central Europe or the United States.
Future studies using the RETRO simulation results will have to carefully assess the quality of the mean-model results by comparing them to independent observational data sets. The RETRO report D4-4 contains some examples for such evaluations by comparing the interannual variability of ozone concentrations in the 1990s to data from the MOZAIC programme (see also activity report of MPG-
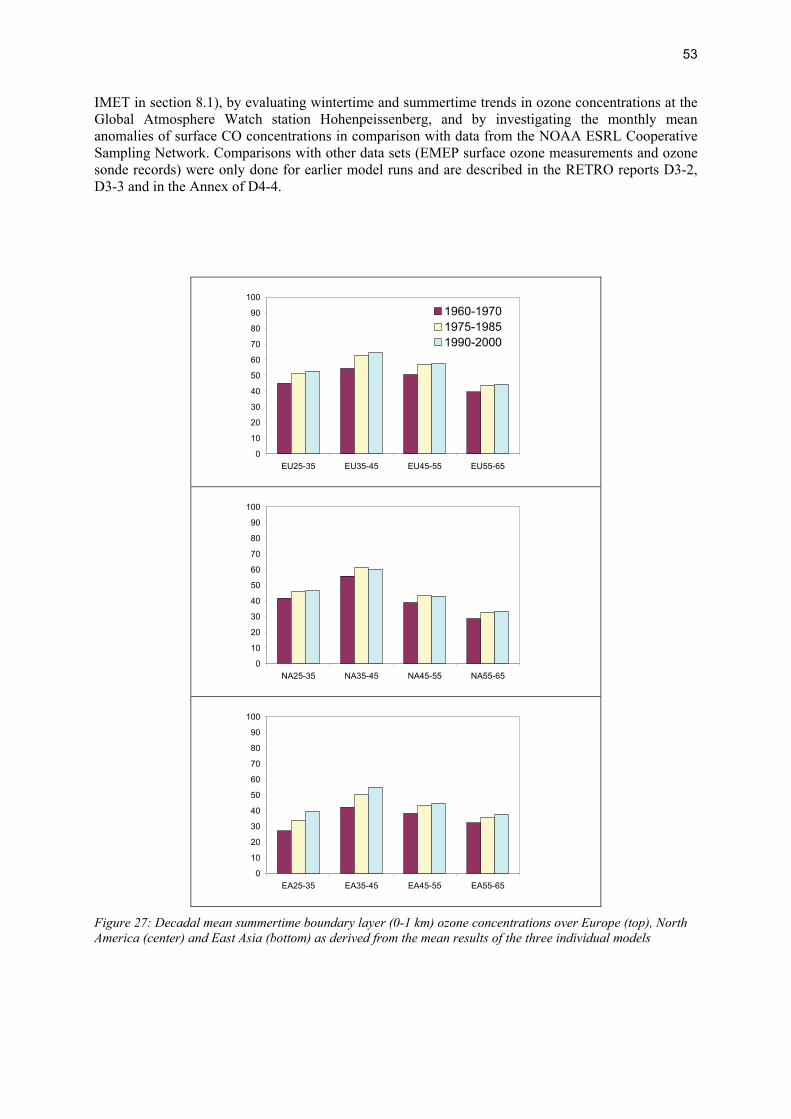
53
IMET in section 8.1), by evaluating wintertime and summertime trends in ozone concentrations at the Global Atmosphere Watch station Hohenpeissenberg, and by investigating the monthly mean anomalies of surface CO concentrations in comparison with data from the NOAA ESRL Cooperative Sampling Network. Comparisons with other data sets (EMEP surface ozone measurements and ozone sonde records) were only done for earlier model runs and are described in the RETRO reports D3-2, D3-3 and in the Annex of D4-4.
0
10
20
30
40
50
60
70
80
90
100
EU25-35 EU35-45 EU45-55 EU55-65
1960-19701975-19851990-2000
0
10
20
30
40
50
60
70
80
90
100
NA25-35 NA35-45 NA45-55 NA55-65
0
10
20
30
40
50
60
70
80
90
100
EA25-35 EA35-45 EA45-55 EA55-65
Figure 27: Decadal mean summertime boundary layer (0-1 km) ozone concentrations over Europe (top), North America (center) and East Asia (bottom) as derived from the mean results of the three individual models

54
Global ozone budget, tropospheric OH and chemical lifetime of methane From the long-term simulations we have analyzed budgets and lifetimes of ozone and methane. In these calculations we adopted a chemical tropopause defined as the 150-ppbv level of ozone. For each month a mean tropopause was determined based on the monthly mean ozone mixing ratio. The tropospheric ozone burden and lifetime together with the tropospheric OH concentration and the methane chemical lifetime simulated in the different models are presented in Figure 28. The results for TM4 and ECHAM5-MOZ have been updated compared to the results from the preliminary simulations presented in Annex A6 of Deliverable D4-4.
As shown in Figure 28a, in all three models that performed the long-term simulations the tropospheric ozone burden increases significantly between 1960 and 2000. LMDz-INCA and TM4 show very similar values over the whole period, with an increase of 31 resp. 37 Tg from 1960 to 2000. Largest discrepancies between the two models are observed during the 1970s. This is likely related to problems with ERA-40 in these years, which mostly affect the offline model TM4. The burden simulated by the UiO-CTM2 is also in close agreement with these models, while the ECHAM5-MOZ gives significantly higher values and a steady increase from 346 to 398 Tg in the period 1960-2000, or about 1.5 Tg/yr. Stevenson et al. (2006) arrived at an average tropospheric ozone burden of 345 Tg in 2000, based on an ensemble of 26 global models.
The ozone lifetime shown in Figure 28b was calculated on an annual basis as the ratio of the tropospheric burden and the ozone loss due to chemical destruction and dry deposition. ECHAM5-MOZ, LMDz-INCA and TM all give similar values and a decrease by about 2-3 days over the period of simulation. With the exception of the 1960 and 1970 simulations, the lifetimes calculated by UiO-CTM2 are in the same range and show a similar decrease. The year-2000 values calculated by these models are in good agreement with the multi-model mean estimate of 22.3 ± 2.0 days of Stevenson et al. (2006). p-TOMCAT gives slightly higher values for the late 1990s. The offline models generally show stronger interannual fluctuations than LMDz-INCA and ECHAM5-MOZ. Part of this variability may be related to spurious temporal inhomogeneities in the ERA-40 reanalysis, in particular in the vertical transport induced by the Brewer-Dobson circulation (van Noije et al., 2006a), and in the water vapour abundance and precipitation over the tropical oceans (Uppala et al., 2005; and references therein).
The models also provided the tropospheric OH concentration as a mass-weighted average over the tropospheric region (Figure 28c). Again temporal inhomogeneities in ERA-40 may be the reason for the relatively large interannual variability simulated with the offline TM model during the 1970s as well as for the relatively high increase since 1985 in this model. While TM and LMDz-INCA both show increasing OH after 1980 (year 2000 values are about 5% higher than year 1980 levels), no trend can be seen in the results of ECHAM5-MOZ. Trend estimates based on observations of methyl chloroform (CH3CCl3) (Prinn et al., 2001; Krol et al., 2003; Bousquet et al., 2005) provide some constrains and indicate that OH may have slightly decreased after 1980 in contrast to the RETRO model results. The average OH concentration in the troposphere is generally estimated to be in the range from 8 to 12⋅105 molec. cm-3 (IPCC, 2001) in reasonable agreement with the simulated values of LMDz-INCA and TM. The higher levels in ECHAM5-MOZ are related to the larger tropospheric ozone concentrations in this model (see Figure 28a and Figure 26) and to a relatively wet atmosphere (see Stevenson et al., 2006). Photolytic dissocation of ozone with subsequent reaction of the exited oxygen atoms with water vapour is an important source for OH in the troposphere.
The corresponding atmospheric lifetime of methane was calculated on an annual basis as the atmospheric methane burden divided by the total loss in the atmosphere, including the simulated chemical destruction due to reaction with OH in the troposphere plus an assumed fixed amount of 70 Tg/yr to account for the soil and stratospheric sinks. The result is shown in Figure 28d. The year 2000 values can be compared directly with the numbers presented by Stevenson et al. (2006), who calculated a multi-model mean atmospheric lifetime of 8.67 ± 1.32 yr for the year 2000. The RETRO simulations thus yield a significantly shorter lifetime than the ACCENT Photocomp study.
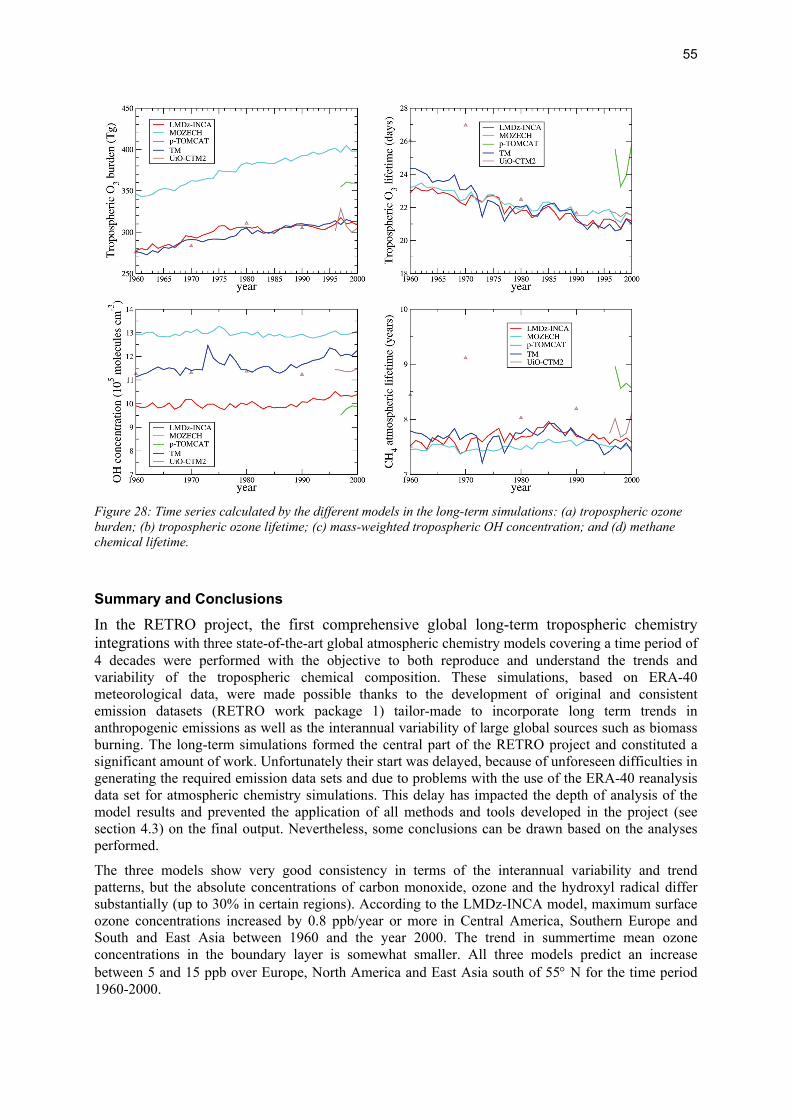
55
Figure 28: Time series calculated by the different models in the long-term simulations: (a) tropospheric ozone burden; (b) tropospheric ozone lifetime; (c) mass-weighted tropospheric OH concentration; and (d) methane chemical lifetime.
Summary and Conclusions
In the RETRO project, the first comprehensive global long-term tropospheric chemistry integrations with three state-of-the-art global atmospheric chemistry models covering a time period of 4 decades were performed with the objective to both reproduce and understand the trends and variability of the tropospheric chemical composition. These simulations, based on ERA-40 meteorological data, were made possible thanks to the development of original and consistent emission datasets (RETRO work package 1) tailor-made to incorporate long term trends in anthropogenic emissions as well as the interannual variability of large global sources such as biomass burning. The long-term simulations formed the central part of the RETRO project and constituted a significant amount of work. Unfortunately their start was delayed, because of unforeseen difficulties in generating the required emission data sets and due to problems with the use of the ERA-40 reanalysis data set for atmospheric chemistry simulations. This delay has impacted the depth of analysis of the model results and prevented the application of all methods and tools developed in the project (see section 4.3) on the final output. Nevertheless, some conclusions can be drawn based on the analyses performed.
The three models show very good consistency in terms of the interannual variability and trend patterns, but the absolute concentrations of carbon monoxide, ozone and the hydroxyl radical differ substantially (up to 30% in certain regions). According to the LMDz-INCA model, maximum surface ozone concentrations increased by 0.8 ppb/year or more in Central America, Southern Europe and South and East Asia between 1960 and the year 2000. The trend in summertime mean ozone concentrations in the boundary layer is somewhat smaller. All three models predict an increase between 5 and 15 ppb over Europe, North America and East Asia south of 55° N for the time period 1960-2000.

56
The simulated interannual ozone variability patterns during the 1990s compare well with data from the MOZAIC aircraft sampling programme and CO concentrations agree with monthly mean variability patterns derived from the NOAA ESRL Cooperative Sampling Network. A comparison of the ECHAM5-MOZ results with a long-term ozone record from the Global Atmosphere Watch station Hohenpeissenberg indicates however, that some factors leading to a general increase in the observed ozone concentrations are absent from the model simulations. A similar conclusion was reached based on an analysis of mountain site measurements at Jungfraujoch and Zugspitze and comparison with earlier model results.
Over Europe, the decadal mean simulated summertime boundary layer ozone concentrations increased by about 10 ppb in the Mediterranean region (latitude band 35°-45° N) and by 4-7 ppb north of 45° N between the 1960s and 1990s. This corresponds to a relative change of 18.2% (16.8-19.1% range in the individual models) in the Mediterranean region, 13.5 % (12.0-14.8%) from 45° N to 55° N and 11.8% (10.1-13.7%) from 55° N to 65° N. These results are remarkably consistent between the models. Taking into account the results from the comparison with mountain stations described above, these trends may yet underestimate the real changes in boundary layer ozone.
According to the model simulations, the largest increase in ozone concentrations over Europe and North America occurred between 1960 and 1970. Thereafter, the curves flatten out, but despite a wealth of measures to curb regional air pollution beginning during the 1980s, there are no indications of a general decrease in ozone concentrations. This is consistent with earlier findings that peak ozone concentrations in pollution episodes may have declined, but the so-called background concentrations continue to rise (Volz-Thomas et al., 2003 (EUROTRAC Synthesis report); Solberg et al., 2005; Jonson et al., 2006). In fact, the recent summers of 2003 and 2006 exhibited a number of ozone episodes which rival those in the 1980s and 1990s (cf. Vautard et al., 2005). Due to the lack of time, no further sensitivity runs could be performed which might have shed some light on the reasons for the increasing background trend and for the apparent underestimation of this trend in the models. Current hypotheses are: (i) errors in the prescribed precursor emission trends, (ii) changes in the transport patterns and stratosphere-troposphere exchange of ozone or (iii) a substantial role of changing methane concentrations.
The strongest increase in boundary layer ozone trends is simulated for the East Asian region. While the ozone concentrations here were only about 2/3 of the values in Europe and North America in the 1960s, they have reached comparable levels during the 1990s. Chan et al. (2003) report an increase in background ozone concentrations in Asia (Hong Kong) of 1.5 %/year during the 1990s. The RETRO simulations show a similar rate of increase (Figure 27). This problem has become even more pressing over the past few years due to the rapid economic growth in China. Comparisons of NO2 emission trends over China with tropospheric NO2 columns observed from space (see RETRO deliverable D1-6) indicate that the RETRO inventory severely underestimates the strong recent increase in ozone precursor emissions after 1996.
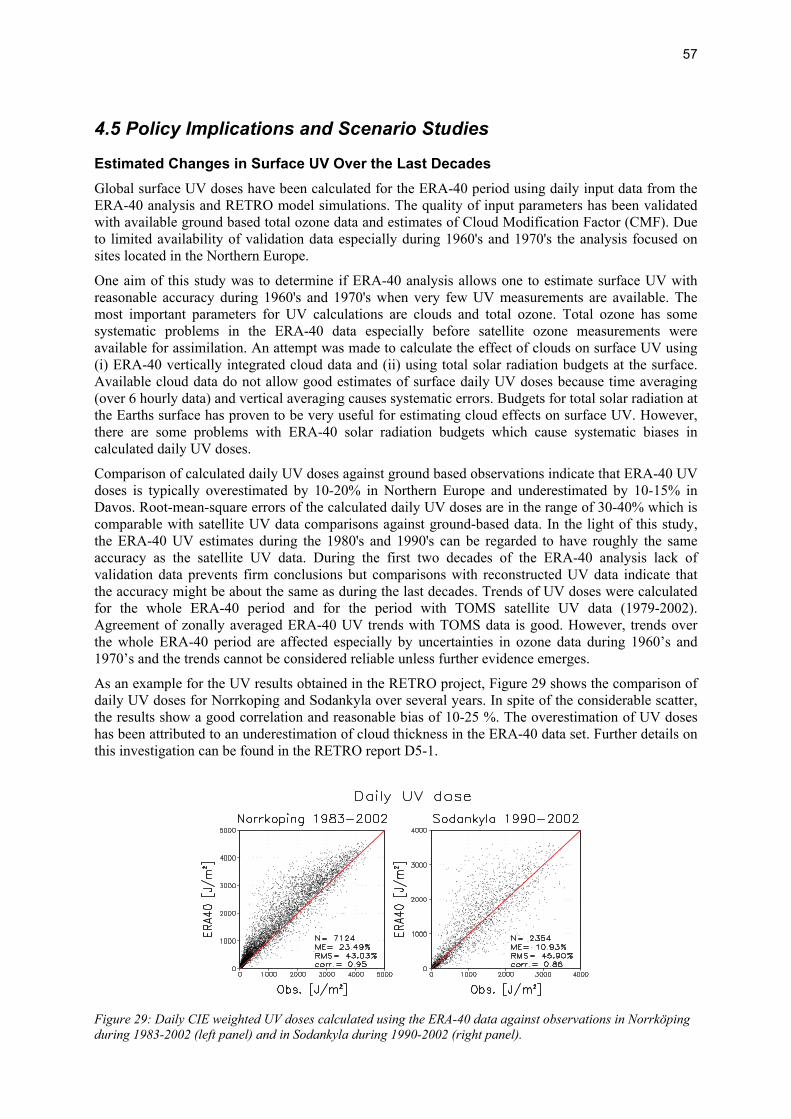
57
4.5 Policy Implications and Scenario Studies
Estimated Changes in Surface UV Over the Last Decades Global surface UV doses have been calculated for the ERA-40 period using daily input data from the ERA-40 analysis and RETRO model simulations. The quality of input parameters has been validated with available ground based total ozone data and estimates of Cloud Modification Factor (CMF). Due to limited availability of validation data especially during 1960's and 1970's the analysis focused on sites located in the Northern Europe.
One aim of this study was to determine if ERA-40 analysis allows one to estimate surface UV with reasonable accuracy during 1960's and 1970's when very few UV measurements are available. The most important parameters for UV calculations are clouds and total ozone. Total ozone has some systematic problems in the ERA-40 data especially before satellite ozone measurements were available for assimilation. An attempt was made to calculate the effect of clouds on surface UV using (i) ERA-40 vertically integrated cloud data and (ii) using total solar radiation budgets at the surface. Available cloud data do not allow good estimates of surface daily UV doses because time averaging (over 6 hourly data) and vertical averaging causes systematic errors. Budgets for total solar radiation at the Earths surface has proven to be very useful for estimating cloud effects on surface UV. However, there are some problems with ERA-40 solar radiation budgets which cause systematic biases in calculated daily UV doses.
Comparison of calculated daily UV doses against ground based observations indicate that ERA-40 UV doses is typically overestimated by 10-20% in Northern Europe and underestimated by 10-15% in Davos. Root-mean-square errors of the calculated daily UV doses are in the range of 30-40% which is comparable with satellite UV data comparisons against ground-based data. In the light of this study, the ERA-40 UV estimates during the 1980's and 1990's can be regarded to have roughly the same accuracy as the satellite UV data. During the first two decades of the ERA-40 analysis lack of validation data prevents firm conclusions but comparisons with reconstructed UV data indicate that the accuracy might be about the same as during the last decades. Trends of UV doses were calculated for the whole ERA-40 period and for the period with TOMS satellite UV data (1979-2002). Agreement of zonally averaged ERA-40 UV trends with TOMS data is good. However, trends over the whole ERA-40 period are affected especially by uncertainties in ozone data during 1960’s and 1970’s and the trends cannot be considered reliable unless further evidence emerges.
As an example for the UV results obtained in the RETRO project, Figure 29 shows the comparison of daily UV doses for Norrkoping and Sodankyla over several years. In spite of the considerable scatter, the results show a good correlation and reasonable bias of 10-25 %. The overestimation of UV doses has been attributed to an underestimation of cloud thickness in the ERA-40 data set. Further details on this investigation can be found in the RETRO report D5-1.
Figure 29: Daily CIE weighted UV doses calculated using the ERA-40 data against observations in Norrköping during 1983-2002 (left panel) and in Sodankyla during 1990-2002 (right panel).
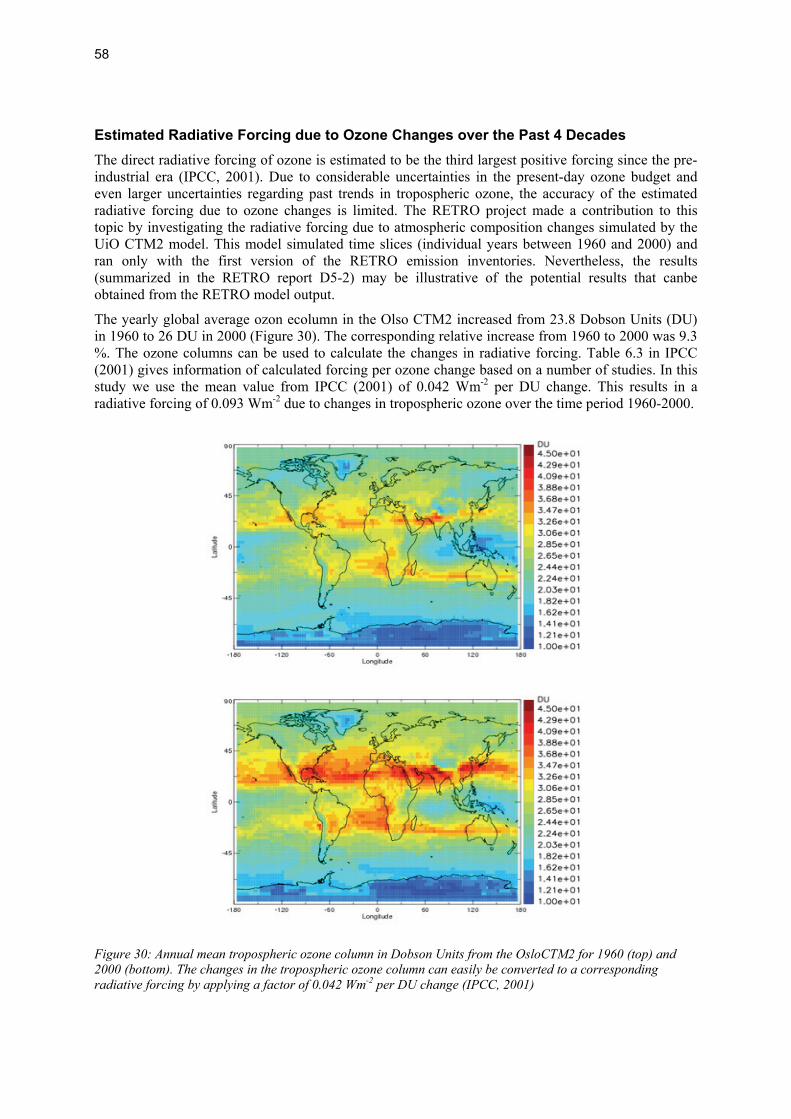
58
Estimated Radiative Forcing due to Ozone Changes over the Past 4 Decades
The direct radiative forcing of ozone is estimated to be the third largest positive forcing since the pre-industrial era (IPCC, 2001). Due to considerable uncertainties in the present-day ozone budget and even larger uncertainties regarding past trends in tropospheric ozone, the accuracy of the estimated radiative forcing due to ozone changes is limited. The RETRO project made a contribution to this topic by investigating the radiative forcing due to atmospheric composition changes simulated by the UiO CTM2 model. This model simulated time slices (individual years between 1960 and 2000) and ran only with the first version of the RETRO emission inventories. Nevertheless, the results (summarized in the RETRO report D5-2) may be illustrative of the potential results that canbe obtained from the RETRO model output.
The yearly global average ozon ecolumn in the Olso CTM2 increased from 23.8 Dobson Units (DU) in 1960 to 26 DU in 2000 (Figure 30). The corresponding relative increase from 1960 to 2000 was 9.3 %. The ozone columns can be used to calculate the changes in radiative forcing. Table 6.3 in IPCC (2001) gives information of calculated forcing per ozone change based on a number of studies. In this study we use the mean value from IPCC (2001) of 0.042 Wm-2 per DU change. This results in a radiative forcing of 0.093 Wm-2 due to changes in tropospheric ozone over the time period 1960-2000.
Figure 30: Annual mean tropospheric ozone column in Dobson Units from the OsloCTM2 for 1960 (top) and 2000 (bottom). The changes in the tropospheric ozone column can easily be converted to a corresponding radiative forcing by applying a factor of 0.042 Wm-2 per DU change (IPCC, 2001)
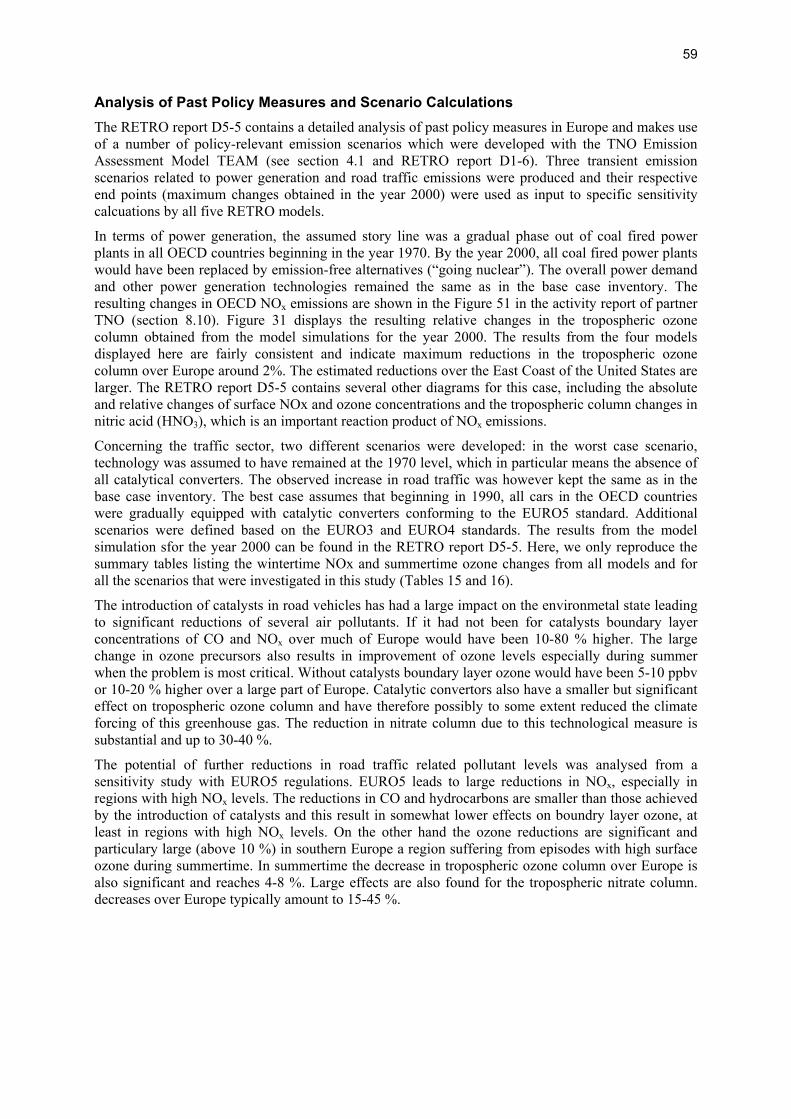
59
Analysis of Past Policy Measures and Scenario Calculations The RETRO report D5-5 contains a detailed analysis of past policy measures in Europe and makes use of a number of policy-relevant emission scenarios which were developed with the TNO Emission Assessment Model TEAM (see section 4.1 and RETRO report D1-6). Three transient emission scenarios related to power generation and road traffic emissions were produced and their respective end points (maximum changes obtained in the year 2000) were used as input to specific sensitivity calcuations by all five RETRO models.
In terms of power generation, the assumed story line was a gradual phase out of coal fired power plants in all OECD countries beginning in the year 1970. By the year 2000, all coal fired power plants would have been replaced by emission-free alternatives (“going nuclear”). The overall power demand and other power generation technologies remained the same as in the base case inventory. The resulting changes in OECD NOx emissions are shown in the Figure 51 in the activity report of partner TNO (section 8.10). Figure 31 displays the resulting relative changes in the tropospheric ozone column obtained from the model simulations for the year 2000. The results from the four models displayed here are fairly consistent and indicate maximum reductions in the tropospheric ozone column over Europe around 2%. The estimated reductions over the East Coast of the United States are larger. The RETRO report D5-5 contains several other diagrams for this case, including the absolute and relative changes of surface NOx and ozone concentrations and the tropospheric column changes in nitric acid (HNO3), which is an important reaction product of NOx emissions.
Concerning the traffic sector, two different scenarios were developed: in the worst case scenario, technology was assumed to have remained at the 1970 level, which in particular means the absence of all catalytical converters. The observed increase in road traffic was however kept the same as in the base case inventory. The best case assumes that beginning in 1990, all cars in the OECD countries were gradually equipped with catalytic converters conforming to the EURO5 standard. Additional scenarios were defined based on the EURO3 and EURO4 standards. The results from the model simulation sfor the year 2000 can be found in the RETRO report D5-5. Here, we only reproduce the summary tables listing the wintertime NOx and summertime ozone changes from all models and for all the scenarios that were investigated in this study (Tables 15 and 16).
The introduction of catalysts in road vehicles has had a large impact on the environmetal state leading to significant reductions of several air pollutants. If it had not been for catalysts boundary layer concentrations of CO and NOx over much of Europe would have been 10-80 % higher. The large change in ozone precursors also results in improvement of ozone levels especially during summer when the problem is most critical. Without catalysts boundary layer ozone would have been 5-10 ppbv or 10-20 % higher over a large part of Europe. Catalytic convertors also have a smaller but significant effect on tropospheric ozone column and have therefore possibly to some extent reduced the climate forcing of this greenhouse gas. The reduction in nitrate column due to this technological measure is substantial and up to 30-40 %.
The potential of further reductions in road traffic related pollutant levels was analysed from a sensitivity study with EURO5 regulations. EURO5 leads to large reductions in NOx, especially in regions with high NOx levels. The reductions in CO and hydrocarbons are smaller than those achieved by the introduction of catalysts and this result in somewhat lower effects on boundry layer ozone, at least in regions with high NOx levels. On the other hand the ozone reductions are significant and particulary large (above 10 %) in southern Europe a region suffering from episodes with high surface ozone during summertime. In summertime the decrease in tropospheric ozone column over Europe is also significant and reaches 4-8 %. Large effects are also found for the tropospheric nitrate column. decreases over Europe typically amount to 15-45 %.
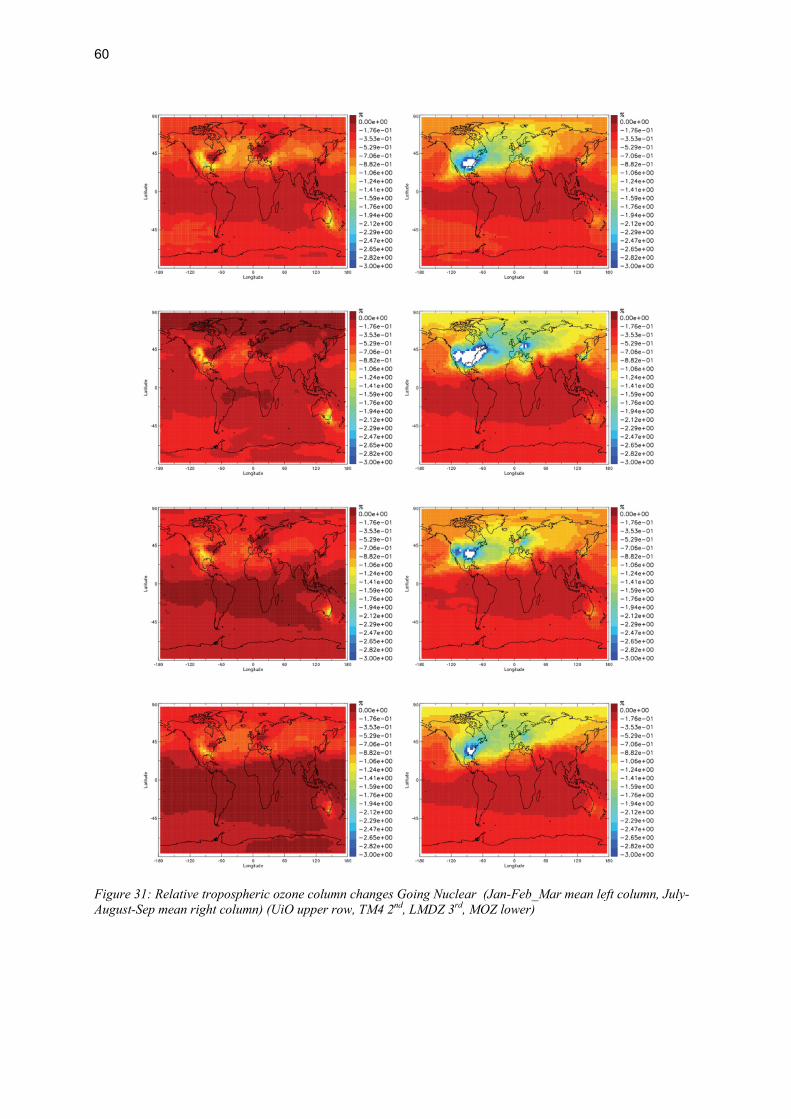
60
Figure 31: Relative tropospheric ozone column changes Going Nuclear (Jan-Feb_Mar mean left column, July-August-Sep mean right column) (UiO upper row, TM4 2nd, LMDZ 3rd, MOZ lower)
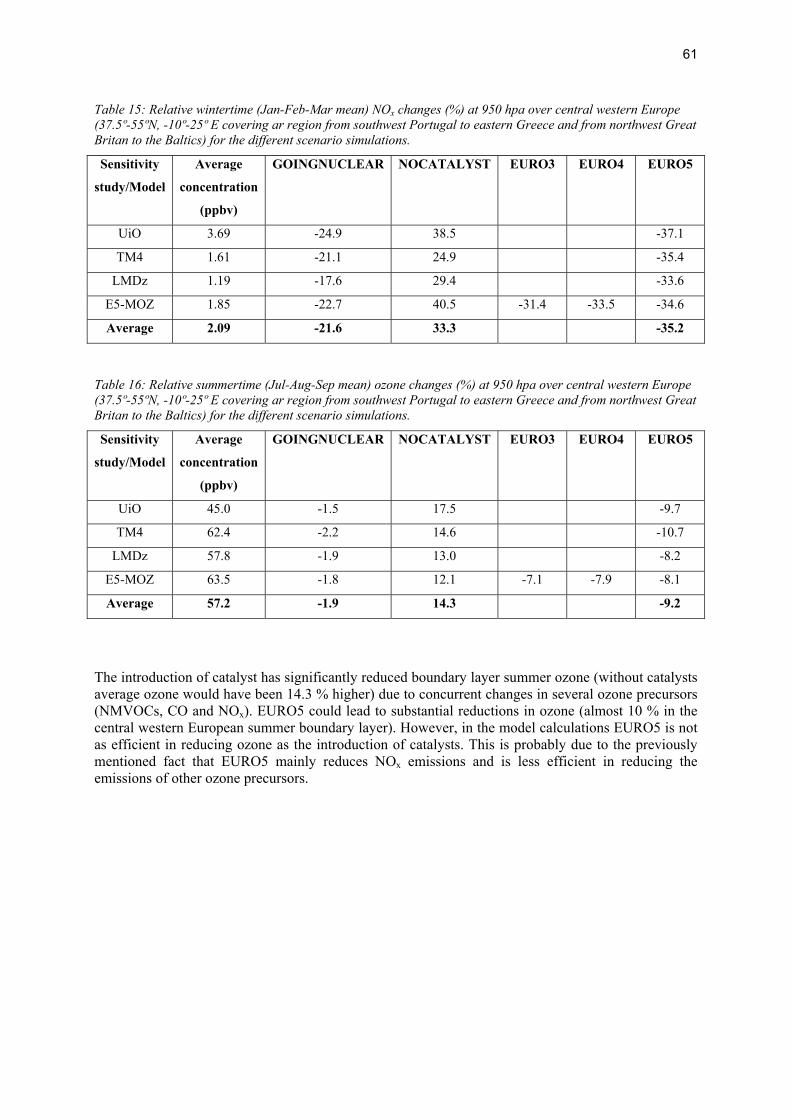
61
Table 15: Relative wintertime (Jan-Feb-Mar mean) NOx changes (%) at 950 hpa over central western Europe (37.5º-55ºN, -10º-25º E covering ar region from southwest Portugal to eastern Greece and from northwest Great Britan to the Baltics) for the different scenario simulations.
Sensitivity
study/Model
Average
concentration
(ppbv)
GOINGNUCLEAR NOCATALYST EURO3 EURO4 EURO5
UiO 3.69 -24.9 38.5 -37.1
TM4 1.61 -21.1 24.9 -35.4
LMDz 1.19 -17.6 29.4 -33.6
E5-MOZ 1.85 -22.7 40.5 -31.4 -33.5 -34.6
Average 2.09 -21.6 33.3 -35.2
Table 16: Relative summertime (Jul-Aug-Sep mean) ozone changes (%) at 950 hpa over central western Europe (37.5º-55ºN, -10º-25º E covering ar region from southwest Portugal to eastern Greece and from northwest Great Britan to the Baltics) for the different scenario simulations.
Sensitivity
study/Model
Average
concentration
(ppbv)
GOINGNUCLEAR NOCATALYST EURO3 EURO4 EURO5
UiO 45.0 -1.5 17.5 -9.7
TM4 62.4 -2.2 14.6 -10.7
LMDz 57.8 -1.9 13.0 -8.2
E5-MOZ 63.5 -1.8 12.1 -7.1 -7.9 -8.1
Average 57.2 -1.9 14.3 -9.2
The introduction of catalyst has significantly reduced boundary layer summer ozone (without catalysts average ozone would have been 14.3 % higher) due to concurrent changes in several ozone precursors (NMVOCs, CO and NOx). EURO5 could lead to substantial reductions in ozone (almost 10 % in the central western European summer boundary layer). However, in the model calculations EURO5 is not as efficient in reducing ozone as the introduction of catalysts. This is probably due to the previously mentioned fact that EURO5 mainly reduces NOx emissions and is less efficient in reducing the emissions of other ozone precursors.

62
63
5. Conclusions
The RETRO project generated the first comprehensive global long-term simulations (reanalyses) of the tropospheric chemical composition changes occurring between 1960 and 2000. The project focused on ozone and its precursor species and employed five state-of-the-art models of atmospheric chemistry and transport. Three of these models were employed for the reanalysis simulations while the other two were used for time slice simulations and specific sensitivity studies. Besides the main project objective to carry out these long-term simulations, the RETRO project made many other contributions to advance the scientific state-of-the-art and achieve a better understanding of the tropospheric composition trends and variability patterns. Of particular relevance are the generation of new global emission data sets, the development of a modern data base for observational data with consistent metadata information and the analysis of three policy scenarios concerning emissions from power generation and road traffic. All of these accomplishments were only possible due to the sustained enthusiasm of a highly interdisciplinary research team of 12 leading European research institutes. Even though not every objective promised in the original proposal could be met and a serious delay was encountered due to difficulties in generating the necessary emission data sets for the 41-year time period, the project was successful in the end to reach its main objective, and it is expected that the data sets and methodologies developed within RETRO will be of further use to the scientific community and in future policy assessments on air quality trends and chemistry climate interactions. The RETRO emission data sets are already being used in several ongoing projects, and substantial parts of the RETRO model output definition have been copied for recent assessment studies in the framework of the ACCENT and TFHTAP model intercomparison exercises. Furthermore, a plethora of software tools developed in the RETRO project has been gratefully adopted by several members of the scientific community.
The RETRO models generally show very good consistency in terms of interannual variability and trend patterns, but they occasionally differ significantly in the absolute values of the simulated concentrations of ozone and its precursors. This has an effect on the analysis of the global budgets of trace gases as was shown in section 4 of this report. Comparison with observations shows that the RETRO models often capture the atmospheric variability patterns rather well and that the mean model generally provides a reasonable description of the chemical state of the atmosphere. Some exceptions are noted, in particular the absence of an increasing ozone trend over central Europe in the 1990s which is clearly seen from measurements at several mountain stations. According to the RETRO simulations, summertime boundary layer concentrations of ozone over Europe increased between 5 and 15 ppb (10-20%) between 1960 and the year 2000. Further abatement measures in the traffic sector (introduction of the EURO 5 standard in all OECD countries) could lead to a reduction of summertime ozone by 8-10%.
Given the short time (in terms of manpower) available at the end of the project to analyse the RETRO model results and draw the necessary conclusions with the help of additional sensitivity simulations, it must be said that the project stopped “somewhere in the middle”. If additional funding could be made available in the future to continue this effort, a number of issues could be addressed which have now been covered only superficially or not at all. In particular, an extension of the RETRO emission data sets to aerosol species and greenhouse gases and the analysis of chemistry climate interactions including the role of aerosol composition changes would be of great value to advance the scientific understanding of chemistry climate interactions. New and extended observational data sets (in particular from satellite instruments) could be used and the model evaluation procedures developed in the project could be further refined to obtain a more robust assessment of past trends and variability patterns of the tropospheric chemical composition. A scientific project in continuation of RETRO could also through close interaction with GMES activities contribute to the development of a sustained atmospheric composition monitoring service and ensure that such services will deliver results of the highest quality.
64
In conclusion, we would like to summarize the main achievements of the RETRO project as follows:
• first detailed, comprehensive and consistent data sets on global emissions from fossil and biofuel combustion and from open vegetation burning covering the time period 1960-2000; available as gridded data sets with 0.5°×0.5° and monthly mean resolution,
• first global long-term atmospheric chemistry integrations with several state-of-the-art models using the ERA-40 meteorological data, the RETRO emissions and other constrains in a consistent and well-documented manner,
• analysis of key parameters controlling the interannual and seasonal variability and the longer-term trends in the tropospheric composition related to ozone and its precursors,
• development of new software tools for the analysis of observational data and model results; standardisation of model output and data formats and definition of model evaluation metrics and skill scores,
• development of a comprehensive data base for tropospheric composition observations with complete metadata definition and a user-friendly interface for data access,
• multi-model analysis of specific scenarios related to power generation and the traffic sector in OECD countries,
• contributions to the IPCC 4th assessment report through participation in a multi-model assessment study coordinated by the ACCENT network of excellence.

65
6. References
Akimoto, H. (2003), Global Air Quality and Pollution, Science, 302 (5651), 1716-1719.
Ashmore, M.R. (2005), Assessing the future global impacts of ozone on vegetation, Plant Cell and Environment, 28(8), 949-964.
Assonov, S.S., C.A.M. Brenninkmeijer, P.J. Jockel, R. Mulvaney, S. Bernard, J. Chappellaz (2007), Evidence for a CO increase in the SH during the 20th century based on firn air samples from Berkner Island, Antarctica, Atmos. Chem. Phys., 7, 295-308.
Bengtsson, L., K.I. Hodges, S. Hagemann (2004), Sensitivity of large-scale atmospheric analyses to humidity observations and its impact on the global water cycle and tropical and extratropical weather systems in ERA40, Tellus, 56A, 202-217.
Bobbink, R., M. Hornung, J.G.M. Roelofs (1998), The effects of air-borne nitrogen pollutants on species diversity in natural and semi-natural European vegetation, J. Ecology, 86 (5), 717-738.
Bodhaine, B.A., E.G. Dutton (1993), A Long-Term Decrease in Arctic Haze at Barrow, Alaska, Geophys. Res. Lett., 20 (10), 947-950.
Bousquet, P., D.A. Hauglustaine, P. Peylin, C. Carouge, P. Ciais (2005), Two decades of OH variability as inferred by an inversion of atmospheric transport and chemistry of methyl chloroform, Atmos. Chem. Phys., 5, 2635–2656.
Brasseur, G.P., Prinn, R.G., and Pszenny, A.A.P. (eds.), (2003), Atmospheric Chemistry in a changing world, Springer.
Brasseur, G.P., M. Schultz, C. Granier, M. Saunois, T., M. Botzet, E. Roeckner, and S. Walters (2006), Impact of Climate Change on the Future Chemical Composition of the Global Troposphere, J. Climate, 19(16), 3932-3951.
Brimblecombe, P. (1987a), The antiquity of smokeless zones, Atmospheric Environment 21, 2485-2485.
Brimblecombe P. (1987b), The Big Smoke, Methuen.
Chameides, W.L., X.S. Li, X.Y. Tang, X.J. Zhou, C. Luo, C.S. Kiang, J. St John, R.D. Saylor, S.C. Liu, K.S: Lam, T. Wang, F. Giorgi (1999), Is ozone pollution affecting crop yields in China?, Geophys. Res. Lett., 26(7), 867-870.
Chan, C.Y., L.Y. Chan, J.M. Harris (2003), Urban and background ozone trend in 1984-1999 at subtropical Hong Kong, South China, Ozone-Science and Engineering, 25 (6), 513-522.
Christian, H.J., R.J. Blakeslee, D.J. Boccippio, W.L. Boeck, D.E. Buechler, K.T. Driscoll, S.J. Goodman, J.M. Hall, W.J. Koshak, D.M. Mach, M.F. Stewart (2003), Global frequency and distribution of lightning as observed by the Optical Transient Detector. J. Geophys. Res, 108 4005, doi: 10.1029/2002JD002347.
Dentener, F.D., Stevenson, K. Ellingsen, T. van Noije, M. Schultz, M. Amann, C. Atherton, N. Bell, D. Bergmann, I. Bey, L. Bouwman, T. Butler, J. Cofala, B. Collins, J. Drevet, R. Doherty, B. Eickhout, H. Eskes, A. Fiore, M. Gauss, D. Hauglustaine, L. Horowitz, I. Isaksen, B. Josse, M. Lawrence, M. Krol, J.F. Lamarque, V. Montanero, J.F. Müller, V.H. Peuch, G. Pitari, J. Pyle, S. Rast, J. Rodriguez, M. Sanderson, N. Savage, D. Shindell, S. Strahan, K. Sudo, S. Szopa, O. Wild, G. Zeng, The Global Atmospheric Environment for the Next Generation (2006), Environ. Sci. Technol., 40, 3586 – 3594, doi:10.1021/es0523845.
Donaldson K., V. Stone, W. MacNee (1999), The toxicology of ultrafine particles. In: Particulate matter: Properties and effects upon health, (Eds RL Maynard and CV Howard), pp. 115-129. Springer-Verlag New York.

66
Duncan, B.N., R.V. Martin, A.C. Staudt, R. Yevich, and J.A. Logan (2003), Interannual and seasonal variability of biomass burning emissions constrained by satellite observations, J. Geophys. Res., 108 (D2), 4100, doi:10.1029/2002JD002378.
Emberson, L.D., M.R. Ashmore, F. Murray, J.C.I. Kuylenstierna, K.E. Percy, T. Izuta, Y. Zheng, H. Shimizu, B.H. Sheu, C.P. Liu, M. Agrawal, A. Wahid, N.M. Abdel-Latif, M. van Tienhoven, L.I. de Bauer, M. Domingos (2001), Impacts of air pollutants on vegetation in developing countries, Water Air Soil Poll., 130(1-4), 107-118.
Endresen, O., E. Sørgard, J.K. Sundet, S.B. Dalsøren, I.S.A. Isaksen, T.F. Berglen, G. Gravir (2003), Emissions from international sea transport and environmental impact, J. Geophys Res. 108 (D17), 4560, doi:10.1029/2002JD002898.
Fowler, D., J.W. Risman, M. Sutton, E. Nemitz, K. Pilegaard, M. Gallagher, J.-P. Tuovinen, J. Duyzer, L. Grünhage, U. Dämmgen, and S. Cieslik (2003), Deposition fluxes of air pollutants to terrestrial surfaces in Europe, chapter 2 in: Towards cleaner air in Europe – Science, tools, and applications, Midgeley, P. et al. (eds.), Margraf, Weikersheim, Germany.
Galloway, J.N., F.J. Dentener, D.G. Capone, E.W. Boyer, R.W. Howarth, S.P. Seitzinger, G.P. Asner, C.C. Cleveland, P.A: Green, E.A. Holland, D.M. Karl, A.F. Michaels, J.H. Porter, A.R. Townsend, C.J. Vorosmarty (2004), Nitrogen cycles: past, present, and future, Biogeochemistry, 70(2), 153-226.
Granier, C., Y. Balkanski, S. Bekki, I. Bey, W. Collins, F. Dentener, L. Ganzeveld, S. Houweling, J.F. Muller, J. Olivier, R. Sander, M. Sanderson, M. Schultz, J. Sciare, D. Stevenson, W. Sturges, C. Zerefos (2003), Impact of Climate Change on Tropospheric Ozone, chapter 5 in: Ozone-climate interactions, European Commission Air pollution research report No. 81, EUR 20623, Bruxelles.
Guenther, A., T. Karl, P. Harley, C. Wiedinmyer, P. I. Palmer, and C. Geron (2006), Estimates of global terrestrial isoprene emissions using MEGAN (Model of Emissions of Gases and Aerosols from Nature), Atmos. Chem. Phys., 6, 3181-3210.
Hagemann, S., K. Arpe and L. Bengtsson (2005), Validation of the hydrological cycle of ERA40, Reports on Earth System Science, 10/2005, Max Planck Institute for Meteorology, Hamburg.
Hauglustaine, D.A., G.P. Brasseur (2001), Evolution of tropospheric ozone under anthropogenic activities and associated radiative forcing of climate, J. Geophys. Res., 106 (D23), 32337-32360.
Hoelzemann, J.J. (2006), Global Wildland Fire Emission Modeling for Atmospheric Chemistry Studies, PhD thesis, Hamburg, published as Max Planck Report on Earth System Science, 28/2006.
IPCC (2001): Climate Change 2001: The Scientific Basis. Contribution of Working Group I to the Third Assessment Report of the Intergovernmental Panel on Climate Change [Houghton, J.T.,Y. Ding, D.J. Griggs, M. Noguer, P.J. van der Linden, X. Dai, K., Maskell, and C.A. Johnson (eds.)]. Cambridge University Press, Cambridge, United Kingdom and New York, NY, USA, 881pp.
Jacobson, M.Z. (2002), Atmospheric Pollution: History, Science and Regulation, Cambridge University Press, 399 pp.
Jaffe, D., H. Price, D. Parrish, A. Goldstein, J. Harris (2003), Increasing background ozone during spring on the west coast of North America, Geophys. Res. Lett., 30(12), Art. No. 1613.
Jonson, J.E., D. Simpson, H. Fagerli, S. Solberg (2006), Can we explain the trends in European ozone levels?, Atmos. Chem. Phys., 6, 51-66.
Karlsdottir, S., I.S.A. Isaksen, G. Myhre, T.K. Berntsen (2000), Trend analysis of O3 and CO in the period 1980-1996: A three-dimensional model study, J. Geophys. Res., 105 (D23), 28907-28933.
Karnosky, D.F., J.M. Skelly, K.E. Percy, A.H. Chappelka (2007), Perspectives regarding 50 years of research on effects of tropospheric ozone air pollution on US forests, Environmental Pollution, 147(3), 489-506.
67
Krol, M., M. C., Lelieveld, J., Oram, D. E., Sturrock, G. A., Penkett, S. A., Brenninkmeijer, C. A. M., Gros, V., Williams, J., and Scheeren, H. A. (2003), Continuing emissions of methyl chloroform from Europe, Nature, 421 (6919), 131–135.
Lathière, J., D.A. Hauglustaine, A. Friend, N. De Noblet-Ducoudré, N. Viovy, G. Folberth (2006), Impact of climate variability and land use changes on global biogenic volatile organic compound emissions, Atmos. Chem. Phys., 6, 2129-2146.
Lippmann, M., M. Frampton, J. Schwartz, D. Dockery, R. Schlesinger, P. Koutrakis, J. Froines, A. Nel, J. Finkelstein, J. Godleski, J. Kaufman, J. Koenig, T. Larson, D. Luchtel, L.J.S. Liu, G. Oberdorster, A. Peters, J. Sarnat, C. Sioutas, H. Suh, J. Sullivan, M. Utell, E. Wichmann, J. Zelikoff (2003), The US Environmental Protection Agency particulate matter health effects research centers program: A midcourse report of status, progress, and plans, Environmental Health Perspectives, 111 (8), 1074-1092.
Logan, J.A. (1994), Trends in the Vertical-Distribution of Ozone - An Analysis of Ozonesonde Data, J. Geophys. Res., 99 (D12), 25553-25585.
Logan, J.A., I.A. Megretskaia, A.J. Miller, G.C. Tiao, D. Choi, L. Zhang, R.S. Stolarski, G.J. Labow, S.M. Hollandsworth, G.E. Bodeker, H. Claude, D. De Muer, J.B. Kerr, D.W. Tarasick, S.J. Oltmans, B. Johnson, F. Schmidlin, J. Staehelin, P. Viatte, O. Uchino (1999), Trends in the vertical distribution of ozone: A comparison of two analyses of ozonesonde data, J. Geophys. Res., 104 (D21), 26373-26399.
McLinden, C.A., S.C: Olsen, B. Hannegan, O. Wild, M.J. Prather, J. Sundet (2000), Stratospheric ozone in 3-D models: A simple chemistry and the cross-tropopause flux, J. Geophys. Res., 105 (D11), 14653-14665.
Monks, P., A. Richard, F. Dentener, J. Jonson, A. Lindskog, M. Roemer, E. Schuepbach, T. Friedli, S. Solberg (2003), Tropospheric ozone and precursors, trends budgets and policy, TROTREP (EVK2-CT-1999-00043) Synthesis and Integration Report, University of Leceister, 52 pp.
Mota, B.W., J.M.C. Pereira, D. Oom, M.J.P. Vasconcelos, and M. Schultz (2006), Screening the ESA ATSR-2World Fire Atlas (1997–2002). Atmos. Chem. Phys., 6, 1409–1424.
Novelli, P.C., K.A. Masarie, P.M. Lang, B.D: Hall, R.C: Myers, J.W. Elkins (2003), Reanalysis of tropospheric CO trends: Effects of the 1997-1998 wildfires, J. Geophys. Res., 108(D15), Art. No. 4464.
Oltmans, S.J., A.S. Lefohn, H.E. Scheel, J.M. Harris, H. Levy, I.E. Galbally, E.G. Brunke, C.P. Meyer, J.A. Lathrop, B.J. Johnson, D.S. Shadwick, E. Cuevas, F.J. Schmidlin, D.W. Tarasick, H. Claude, J.B. Kerr, O. Uchino, V. Mohnen (1998), Trends of ozone in the troposphere, Geophys. Res. Lett., 25 (2), 139-142.
Oltmans, S.J., A.S. Lefohn, J.M. Harris, I. Galbally, H.E. Scheel, G. Bodeker, E. Brunke, H. Claude, D. Tarasick, B.J. Johnson, P. Simmonds, D. Shadwick, K. Anlauf, K. Hayden, F. Schmidlin, T. Fujimoto, K. Akagi, C. Meyer, S. Nichol, J. Davies, A. Redondas, E. Cuevas (2006), Long-term changes in tropospheric ozone, Atmos. Env., 40 (17), 3156-3173.
Parrish, D.D., M. Trainer, D. Hereid, E. J. Williams, K. J. Olszyna, R. A. Harley, J. F. Meagher, and F. C. Fehsenfeld (2002), Decadal change in carbon monoxide to nitrogen oxide ratio in U.S. vehicular emissions, J. Geophys. Res., 107 (D12) 10.1029/2001JD000720.
Prinn, R. G., Huang, J., Weiss, R. F., Cunnold, D. M., Fraser, P.J., Simmonds, P. G., McCulloch, A., Harth, C., Salameh, P., O’Doherty, S., Wang, R. H. J., Porter, L., and Miller, B. R. (2001), Evidence for substantial variations of atmospheric hydroxyl radicals in the past two decades Science, 293 (5532), 1048–1048.
Pulles, T., R. Brand, M. van het Bolscher, A. Visschedijk (2007), The Application of the Emission Inventory Model TEAM: Global Emissions from Fuel Combustion in the years 1960 to 2000, TNO report 2007-A-R0132-B.
68
Rinsland, C.P., A. Goldman, J.W. Hannigan, S.W. Wood, L.S. Chiou, E. Mahieu (2007), Long-term trends of tropospheric carbon monoxide and hydrogen cyanide from analysis of high resolution infrared solar spectra, Journal of Quantitative Spectroscopy & Radiative Transfer, 104(1), 40-51.
Roemer, M. (2001), Trends in ozone and precursors in Europe – status report TOR-2, Task Group 1, TNO-report R2001/244, Apeldoorn, The Netherlands.
Schaap, M. et al. (2005), LOTOS-EUROS: Documentation, TNO report B&O-A R 2005/297.
Schnadt Poberaj, C., J. Staehelin, D. Brunner, and V. Thouret (2007a), A UT/LS ozone climatology of the nineteen seventies estimated from the GASP aircraft measurement program, Atmos. Chem. Phys. Discuss., 7, 3451-3517.
Schultz, M. (2002), On the use of ATSR fire count data to estimate thew seasonal and interannual variability of vegetation fire emissions, Atmos. Chem. Phys., 2, 387-395.
Schultz, M.G, A. Heil, J.J. Hoelzemann, A. Spessa, K. Thonicke, J. Goldammer, A.C. Held, J.M. Pereira (2007), Global Emissions from Wildland Fires from 1960 to 2000, submitted to Global Biogeochem. Cycles
Sierk, B., Richter, A., Rozanov, A., v. Savigny, C., Schmoltner, A.M., Buchwitz, M., Bovensmann, H., and J.P. Burrows (2006), Retrieval and Monitoring of Atmospheric Trace Gas Concentrations in Nadir and Limb Geometry using the Space-Borne SCIAMACHY Instrument, Environmental Monitoring and Assessment, DOI: 10.1007/s10661-005-9049-9.
Simmonds, P.G., R.G. Derwent, A.L. Manning, G. Spain (2004), Significant growth in surface ozone at Mace Head, Ireleand, 1987-2003, Atmos. Env., 38, 4769-4778.
Solberg, S., R. Bergstrom, J. Langner, T. Laurila, A. Lindskog (2005), Changes in Nordic surface ozone episodes due to European emission reductions in the 1990s, Atmos. Env., 39 (1), 139-172.
Staehelin J, J. Thudium, R. Buehler, A. Volz-Thomas, W. Graber (1994), Trends in Surface Ozone Concentrations at Arosa (Switzerland), Atmos. Env., 28 (1): 75-87.
Stevenson, D.S., F.J. Dentener, M.G. Schultz, K. Ellingsen, T.P.C. van Noije, O. Wild, G. Zeng, M. Amann, C.S. Atherton, N. Bell, D.J. Bergman, I. Bey, T. Butler, J. Cofala, W.J. Collins, R.G. Derwent, R.M. Doherty, J. Drevet, H.J. Eskes, A.M. Fiore, M. Gauss, D.A. Hauglustaine, L.W. Horowitz, I.S.A. Isaksen, M.C. Krol, J.-F. Lamarque, M.G. Lawrence, V. Montanaro, J.-F. Muller, G. Pitari, M.J. Prather, J.A. Pyle, S. Rast, J.M. Rodriguez, M.G. Sanderson, N.H. Savage, D.T. Shindell, S.E. Strahan, K. Sudo, and S. Szopa (2006), Multi-model ensemble simulations of present-day and near-future tropospheric ozone, J. Geophys. Res., 111, D08301, doi:10.1029/2005JD006338.
Uppala, S.M., P.W. Kallberg, A.J. Simmons, U. Andrae, V.D. Bechtold, M. Fiorino, J.K. Gibson, J. Haseler, A. Hernandez, G.A. Kelly, X. Li, K. Onogi, S. Saarinen, N. Sokka, R.P. Allan, E. Andersson, K. Arpe, M.A. Balmaseda, A.C.M. Beljaars, L. Van De Berg, J. Bidlot, N. Bormann, S. Caires, F. Chevallier, A. Dethof, M. Dragosavac, M. Fisher, M. Fuentes, S. Hagemann, E. Holm, B.J. Hoskins, L. Isaksen, P.A.E.M. Janssen, R. Jenne, A.P. McNally, J.F. Mahfouf, J.J. Morcrette, N.A. Rayner, R.W: Saunders, P. Simon, A. Sterl, K.E: Trenberth, A. Untch, D. Vasiljevic, P. Viterbo, J. Woollen (2005), The ERA-40 re-analysis, Q. J. R. Meteorol. Soc., 131, 2961-3012.
US EPA (2000): USEPA, National Air Pollution Emission Trends, 1900-1998, United-States Environmental Protection Agency, EPA-454/R-00-002.
Van Noije, T.P.C., H.J. Eskes, F.J. Dentener, D.S. Stevenson, K. Ellingsen, M.G. Schultz, O. Wild, M. Amann, C.S. Atherton, D.J. Bergmann, I. Bey, K.F. Boersma, T. Butler, J. Cofala, J. Drevet, A.M. Fiore, M. Gauss, D.A. Hauglustaine, L.W. Horowitz, I.S.A. Isaksen, M.C. Krol, J.-F. Lamarque, M.G. Lawrence, R.V. Martin, V. Montanaro, J.-F. Müller, G. Pitari, M.J. Prather, J.A. Pyle, A. Richter, J.M. Rodriguez, N.H. Savage, S.E. Strahan, K. Sudo, and M. van Roozendael (2006a), Multi-model ensemble simulations of tropospheric NO2 compared with GOME retrievals for the year 2000, Atmos. Chem. Phys., 6, 2943-2979.
69
Van Noije, T.P.C., A. Segers, and P.F.J. van Velthoven (2006b), Time series of the stratosphere-troposphere exchange of ozone simulated with reanalyzed and operational forecast data, J. Geophys. Res., 111, D03301, doi:10.1029/2005JD006081.
Vautard, R., C. Honore, M. Beekmann, L. Rouil (2005), Simulation of ozone during the August 2003 heat wave and emission control scenarios, Atmos. Env., 39 (16), 2957-2967.
Volk, M., P. Bungener, F. Contat, M. Montani, J. Fuhrer (2006), Grassland yield declined by a quarter in 5 years of free-air ozone fumigation, Global Change Biology, 12(1), 74-83.
Volz, A., D. Kley (1988), Evaluation of the Montsouris Series of Ozone Measurements Made in the 19th-Century, Nature 332 (6161), 240-242.
Volz-Thomas, A., M. Beekmann, D. Derwent, K. Law, A. Lindskog, A. Prevot, M. Roemer, M. Schultz, U. Schurath, S. Solberg, and A. Stohl (2003), Tropospheric Ozone and its Control, Chapter 3 in: Towards Cleaner Air for Europe – Science, Tools and Applications, Part 1 from the EUROTRAC-2 Synthesis and Integration Project, Margraf Publishers, p. 73-122.
Wang, X., and D. L. Mauzerall (2004), Characterizing Distributions of Surface Ozone and its Impact on Grain Production in China, Japan and South Korea: 1990 and 2020, Atmos. Env., 38, 4383-4402.
Watkiss P, N Eyre, M Holland, A Rabl, and N Short (2001), “Impacts of air pollution on building materials” – “Effets de la pollution atmosphérique sur les matériaux de construction”, Pollution Atmosphérique, Special bilingual Issue Dec. 2001, 139-153.
WHO (2003): Health Aspects of Air Pollution with Particulate Matter, Ozone and Nitrogen Dioxide, Report on a WHO Working Group, Bonn, Germany, Report EUR/03/5042688, 98 pp.
Wong, S., W.C. Wang, I.S.A. Isaksen, T.K. Berntsen, J.K. Sundet (2004), A global climate-chemistry model study of present-day tropospheric chemistry and radiative forcing from changes in tropospheric O3 since the preindustrial period, J. Geophys. Res., 109 (D11), Art. No. D11309.

70
71
7. Publications
7.1 Peer Reviewed Journal Articles and PhD theses
Articles published in 2003 Brunner, D., J. Staehelin, H.L. Rogers, M.O. Köhler, J.A. Pyle, D. Hauglustaine, L. Jourdain, T.K.
Berntsen, M. Gauss, I.S.A. Isaksen, E. Meijer, P. van Velthoven, G. Pitari, E. Mancini, V. Grewe, R. Sausen (2003), An evaluation of the performance of chemistry transport models by comparison with research aircraft observations. Part 1: Concepts and overall model performance, Atmos. Chem. Phys.3, 1609-1631.
Edwards, D.P., J.-F. Lamarque, J.-L Attie, L.K. Emmons, A. Richter, J.-P. Cammas, J.C. Gille, G.L. Francis, M.N. Deeter, J. Warner, D.C. Ziskin, L.V. Lyjak, J.R. Drummond, and J.P. Burrows (2003), Tropospheric Ozone Over the Tropical Atlantic: A Satellite Perspective, JGR, 108(D8), 4237, doi:10.1029/2002JD002927.
Endresen, O., E. Sørgard, J.K. Sundet, S.B. Dalsøren, I.S.A. Isaksen, T.F. Berglen, G. Gravir (2003), Emissions from international sea transport and environmental impact, J. Geophys Res. 108 (D17), 4560, doi:10.1029/2002JD002898.
Ladstätter-Weißenmayer, A., J. Heland, R. Kormann, R. v. Kuhlmann, M.G. Lawrence, J. Meyer-Arnek, A. Richter, F. Wittrock, H. Ziereis, and J.P. Burrows (2003), Transport and build-up of tropospheric trace gases during the MINOS campaign: Comparision of GOME, in situ aircraft measurements and MATCH-MPIC-data, Atmos. Chem. Phys., 3, 1887–1902.
Stohl, A., H. Huntrieser, A. Richter, S. Beirle, O. Cooper, S. Eckhardt, C. Forster, P. James, N. Spichtinger, M. Wenig, T. Wagner, J. Burrows, and U. Platt (2003), Rapid intercontinental air pollution transport associated with a meteorological bomb, Atmos. Chem. Phys., 3, 969-985.
Vountas, M., A. Richter, F. Wittrock, and J.P. Burrows (2003), Inelastic scattering in ocean water and its impact on trace gas retrievals from satellite data, Atmos. Chem. Phys., 3, 1365-1375.
Articles published in 2004 Bauer, S.E., Y. Balkanski, M. Schulz, D.A. Hauglustaine, and F. Dentener (2004), Global modeling of
heterogeneous chemistry on mineral aerosol surfaces: Influence on tropospheric ozone chemistry and comparison to observations, J. Geophys. Res. vol.109, doi:10.1029/2003JD003868.
Hauglustaine, D.A., F. Hourdin, L. Jourdain, M.-A. Filiberti, S. Walters, J.-F. Lamarque and E.A. Holland (2004), Interactive chemistry in the Laboratoire de Météorologie Dynamique general circulation model : Description and background tropospheric chemistry evaluation, J. Geophys. Res. 109, 10.1029/2003JD003957.
Hoelzemann, J.J., M.G. Schultz, G.P. Brasseur, C. Granier, and M. Simon (2004), Global Wildland Fire Emission Model (GWEM): Evaluating the use of global area burnt satellite data, J. Geophys. Res. 109, D14S04.
Kunhikrishnan, T., M.G. Lawrence, R. von Kuhlmann, A. Richter, A. Ladstätter-Weißenmayer, and J.P. Burrows (2004), Semiannual NO2 plumes during the monsoon transition periods over the central Indian Ocean, GRL, 31, L08110, doi:10.1029/2003GL019269.
Kunhikrishnan, T., M.G. Lawrence, R. von Kuhlmann, A. Richter, A. Ladstätter-Weißenmayer, and J.P. Burrows (2004), Analysis of Tropospheric NOx Over Asia Using the Model of Atmospheric Transport and Chemistry (MATCH-MPIC) and GOME-Satellite Observations, Atmospheric Environment, 38 (4), 581-596.
Ladstätter-Weißenmayer, A., J. Meyer-Arnek, A. Schlemm, J.P. Burrows (2004), Influence of stratospheric airmasses on tropospheric vertical O3 columns based on GOME (Global Ozone Monitoring Experiment) measurements and backtrajectory calculation over the Pacific, Atmos. Chem. Phys., 4, 903-909
72
Olivié, D.J.L., P.F.J. van Velthoven, A.C.M. Beljaars, and H.M. Kelder (2004), Comparison between archived and off-line diagnosed convective mass fluxes in the chemistry transport model TM3, J. Geophys. Res. 109, doi:10.1029/2003JD004036.
Petritoli, A., P. Bonasoni, G. Giovanelli, F. Ravegnani, I. Kostadinov, D. Bortoli, A. Weiss, D. Schaub, A. Richter, and F. Fortezza (2004), First Comparison Between ground-based and Satellite-borne Measurements of Tropospheric Nitrogen Dioxide in the Po Basin, J. Geophys. Res., 109, D15307, doi:10.1029/2004JD004547.
Richter, A., V. Eyring, J.P. Burrows, H. Bovensmann, A. Lauer, B. Sierk, and P.J. Crutzen (2004), Satellite Measurements of NO2 from International Shipping Emissions, Geophys. Res. Lett., 31, L23110, doi:10.1029/2004GL020822.
Savage, N.H., K.S. Law, J.A. Pyle, A. Richter, H. Nüß, J.P. Burrows (2004), Using GOME NO2 satellite data to examine regional differences in TOMCAT model performance, Atmos. Chem. Phys., 4, 1895-1912.
Van Noije, T.P.C., H.J. Eskes, M. van Weele, and P.F.J. van Velthoven (2004), Implications of the enhanced Brewer-Dobson circulation in European Centre for Medium-Range Weather Forecasts reanalysis ERA-40 for the stratosphere-troposphere exchange of ozone in global chemistry transport models, J. Geophys. Res. 109, doi:10.1029/2004JD004586.
Articles published in 2005 Bertram, T.H., Heckel, A., Richter, A., Burrows, J.P., Cohen, R.C. (2005), Satellite measurements of
daily variations in soil NOx emissions, Geophys. Res. Lett., 32(24), doi:10.1029/2005GL024640.
Damski J. (2005), A Chemistry-Transport Model Simulation of the Stratospheric Ozone for 1980 to 2019, Finnish Meteorological Institute Contributions, PhD Thesis, 147 pp.
Hauglustaine, D., J. Lathière, G. Folberth, S. Szopa (2005), Evolution of tropospheric ozone during the 21st century, Geophys. Res. Letters 32, L24807, doi:10.1029/2005GL024031.
Heckel, A., A. Richter, T. Tarsu, F. Wittrock, C. Hak, I. Pundt, W. Junkermann, and J.P. Burrows (2005), MAX-DOAS measurements of formaldehyde in the Po-Valley, Atmos. Chem. Phys., 5, 909–918.
Irie, H., Sudo, K., Akimoto, H., Richter, A., Burrows, J.P., Wagner, T., Wenig, M., Beirle, S., Kondo, Y., Sinyakov, V.P., Goutail F. (2005), Evaluation of long-term tropospheric NO2 data obtained by GOME over East Asia in 1996–2002, Geophys. Res. Lett., 32, doi:10.1029/27 2005GL022770.
Isaksen, I.S.A., C. Zerefos, K. Kourtidis, C. Meleti, S.B. Dalsøren, J.K. Sundet, A. Grini, P. Zanis and D. Balis (2005), Tropospheric ozone changes at unpolluted and semi-polluted regions induced by stratospheric ozone changes, J. Geophys. Res. 110, D02302, doi:10.1029/2004JD004618.
Konovalov, I.B., M. Beekmann, R. Vautard, J.P. Burrows, A. Richter, H. Nüß, N. Elansky (2005), Comparison and evaluation of modelled and GOME measurement derived tropospheric NO2 columns over Western and Eastern Europe, Atmos. Chem. Phys., 5, 169-190.
Ladstätter-Weißenmayer, A., Meyer-Arnek, J., Richter, A., Wittrock, F., Burrows, J.P. (2005), Tropospheric O3 over Indonesia during biomass burning events measured with GOME (Global Ozone Monitoring Experiment) and compared with trajectory analysis, Atmospheric Chemistry and Physics Discussions, 5, 3105-3130.
Lathière, J., D.A. Hauglustaine, N. De Noblet-Ducoudré, G. Krinner, G.A. Folberth (2005), Past and future changes in biogenic volatile organic compound emissions simulated with a global dynamic vegetation model, Geophys. Res. Letters 32, L20818, doi:10.1029/2005GL024164.
Meyer-Arnek, J., Ladstätter-Weißenmayer, A., Richter, A., Wittrock, F., Burrows, J.P. (2005), A study of the trace gas columns of O3, NO2 and CH2O over Africa in September 1997, Faraday Discuss., 130, 387, DOI: 10.1039/b502106p.

73
Richter, A., Burrows, J.P., Nüß, H., Granier, C, Niemeier, U. (2005), Increase in tropospheric nitrogen dioxide over China observed from space, Nature, 437, 129-132, doi: 10.1038/nature04092.
Schaap, M. et al. (2005), LOTOS-EUROS: Documentation, TNO report B&O-A R 2005/297.
Schaub, D., A.K. Weiss, J.W. Kaiser, A. Petritoli, A. Richter, B. Buchmann, J.P. Burrows (2005), A transboundary transport episode of nitrogen dioxide as observed from GOME and its impact in the Alpine region, Atmos. Chem. Phys., 5, 23–37.
Sussmann, R., W. Stremme, J.P. Burrows, A. Richter, W. Seiler, M. Rettinger (2005), Stratospheric and tropospheric NO2 variability on the diurnal and annual scale: a combined retrieval from ENVISAT/SCIAMACHY and solar FTIR at the Permanent Ground-Truthing Facility Zugspitze/Garmisch, Atmos. Chem. Phys., 5, 2657-2677.
van Noije, T., and P. van Velthoven (2005), Tropospheric ozone and its precursors: reanalysis over the past 45 years and projections for 2030, Environmental Sciences, 2(2-3), 235-240.
Articles published in 2006 Brasseur, G.P., M. Schultz, C. Granier, M. Saunois, T., M. Botzet, E. Roeckner, and S. Walters,
Impact of Climate Change on the Future Chemical Composition of the Global Troposphere, J. Climate, 19(16), 3932-3951, 2006.
Buholzer, D., Ursachen von Ozontrends in der oberen Troposphäre und unteren Stratosphäre – eine Modellstudie, diploma thesis, ETHZ, Zürich, Switzerland, April 2006.
Dalsøren, S. B., and I. S. A. Isaksen, CTM study of changes in tropospheric hydroxyl distribution 1990–2001 and its impact on methane, Geophys. Res. Lett., 33, L23811, doi:10.1029/2006GL027295, 2006..
Dentener, F.D., Stevenson, K. Ellingsen, T. van Noije, M. Schultz, M. Amann, C. Atherton, N. Bell, D. Bergmann, I. Bey, L. Bouwman, T. Butler, J. Cofala, B. Collins, J. Drevet, R. Doherty, B. Eickhout, H. Eskes, A. Fiore, M. Gauss, D. Hauglustaine, L. Horowitz, I. Isaksen, B. Josse, M. Lawrence, M. Krol, J.F. Lamarque, V. Montanero, J.F. Müller, V.H. Peuch, G. Pitari, J. Pyle, S. Rast, J. Rodriguez, M. Sanderson, N. Savage, D. Shindell, S. Strahan, K. Sudo, S. Szopa, O. Wild, G. Zeng, The Global Atmospheric Environment for the Next Generation (2006), Environ. Sci. Technol., 40, 3586 – 3594, doi:10.1021/es0523845.
Dentener, F., J. Drevet, D. Stevenson, K. Ellingsen, T. van Noije, M. Schultz, C. Atherton, N. Bell, I. Bey, T. Butler, B. Eickhout, A. Fiore, J. Galloway, C. Caly-Lacaux, U. Kulshrestha, J.-F. Lamarque, V. Monranaro, J.F. Müller, J. Rodriguez, M. Sanderson, N. Savage, K. Sudo, S. Szopa, O. Wild, and G. Zeng, Nitrogen and sulfur deposition on regional and global scales: a multi-model evaluation, Global Biogeochem. Cycles, Vol. 20, No. 4, doi:10.1029/2005GB 002672, 2006.
Gauss, M., G. Myhre, I.S.A. Isaksen, W.J. Collins, F.J. Dentener, K. Ellingsen, L.K. Gohar, V. Grewe, D.A. Hauglustaine, D. Iachetti, J.-F. Lamarque, E. Mancini, L.J. Mickley, G. Pitari, M.J. Prather, J.A. Pyle, M.G. Sanderson, K.P. Shine, D.S. Stevenson, K. Sudo, S. Szopa, O. Wild, G. Zeng (2006), Radiative forcing since preindustrial times due to ozone change in the troposphere and the lower stratosphere, Atmos. Chem. Phys., p. 575-599. SRef-ID: 1680-7324/acp/2006-6-575.
Hoelzemann, J.J., Global Wildland Fire Emission Modeling for Atmospheric Chemistry Studies, PhD thesis, Hamburg, Dec. 2006, published as Max Planck Report on Earth System Science, 28/2006.
Konovalov, I.B., Beekmann, M., Richter, A., Burrows, J.P. (2006), Inverse modelling of the spatial distribution of NOx emissions on a continental scale using satellite data, Atmos. Chem. Phys., 6, 6: 1747-1770.
Lathière, J., D.A. Hauglustaine, A. Friend, N. De Noblet-Ducoudré, N. Viovy, G. Folberth (2006), Impact of climate variability and land use changes on global biogenic volatile organic compound emissions, Atmos. Chem. Phys., 6, 2129-2146.
74
Ma, J., Richter, A., Burrows, J.P., Nüß, H., van Aardenne, J.A. (2006), Comparison of model-simulated tropospheric NO2 over China with GOME-satellite data, Atmospheric Environment, 40, 593–604.
Mota, B.W., J.M.C. Pereira, D. Oom, M.J.P. Vasconcelos, and M. Schultz (2006), Screening the ESA ATSR-2World Fire Atlas (1997–2002). Atmos. Chem. Phys., 6, 1409–1424.
Nüß, H. (2005), An improved tropospheric NO2 retrieval for GOME and SCIAMACHY, PhD Thesis: University of Bremen (in german).
Ordóñez, C., A. Richter, M. Steinbacher, C. Zellweger, H. Nüß, J.P. Burrows, and A.S.H. Prévôt (2006), Comparison of 7 years of satellite-borne and ground-based tropospheric NO2 measurements around Milan, Italy, J. Geophys. Res., 111, D05310, doi:10.1029/2005JD006305.
Shindell, D.T., G. Faluvegi, D.S. Stevenson, L. K. Emmons, J.-F. Lamarque, G. Pétron, F.J. Dentener, K. Ellingsen, M. Amann, C.S. Atherton, N. Bell, D.J. Bergmann, I. Bey, T. Butler, J. Cofala, W.J. Collins, R.G. Derwent, R.M. Doherty, J. Drevet, H.J. Eskes, A.M. Fiore, M. Gauss, D.A. Hauglustaine, L.W. Horowitz, I.S.A. Isaksen, M.C. Krol, M.G. Lawrence, V. Montanaro, J.-F. Müller, G. Pitari, M.J. Prather, J.A. Pyle, S. Rast, J.M. Rodriguez, M.G. Sanderson, N.H. Savage, M.G. Schultz, S.E. Strahan, K. Sudo, S. Szopa, T.P.C. van Noije, O. Wild, and G. Zeng (2006), Multi-model simulations of carbon monoxide: Comparison with observations and projected near-future changes, J. Geophys. Res., 111, No. D19, doi:10.1029/2006JD007100.
Sierk, B., Richter, A., Rozanov, A., v. Savigny, C., Schmoltner, A.M., Buchwitz, M., Bovensmann, H., and J.P. Burrows (2006), Retrieval and Monitoring of Atmospheric Trace Gas Concentrations in Nadir and Limb Geometry using the Space-Borne SCIAMACHY Instrument, Environmental Monitoring and Assessment, DOI: 10.1007/s10661-005-9049-9.
Stevenson, D.S., F.J. Dentener, M.G. Schultz, K. Ellingsen, T.P.C. van Noije, O. Wild, G. Zeng, M. Amann, C.S. Atherton, N. Bell, D.J. Bergman, I. Bey, T. Butler, J. Cofala, W.J. Collins, R.G. Derwent, R.M. Doherty, J. Drevet, H.J. Eskes, A.M. Fiore, M. Gauss, D.A. Hauglustaine, L.W. Horowitz, I.S.A. Isaksen, M.C. Krol, J.-F. Lamarque, M.G. Lawrence, V. Montanaro, J.-F. Muller, G. Pitari, M.J. Prather, J.A. Pyle, S. Rast, J.M. Rodriguez, M.G. Sanderson, N.H. Savage, D.T. Shindell, S.E. Strahan, K. Sudo, and S. Szopa (2006), Multi-model ensemble simulations of present-day and near-future tropospheric ozone, J. Geophys. Res., 111, D08301, doi:10.1029/2005JD006338.
Szopa, S., D. Hauglustaine, R. Vautard, L. Menut (2006), Future global tropospheric ozone changes and impact on European air quality, Geophys. Res. Letters, 33 (14), 33 (14), doi:10.1029/2006GL025860.
Toenges-Schuller, N., O. Stein, F. Rohrer, A. Wahner, A. Richter, J.P. Burrows, S. Beirle, T. Wagner, U. Platt, and C. D.Elvidge (2006), Global distribution pattern of anthropogenic nitrogen oxide emissions: Correlation analysis of satellite measurements and model calculations, J. Geophys. Res., 111, D05312, doi:10.1029/2005JD006068.
Van Noije, T.P.C., H.J. Eskes, F.J. Dentener, D.S. Stevenson, K. Ellingsen, M.G. Schultz, O. Wild, M. Amann, C.S. Atherton, D.J. Bergmann, I. Bey, K.F. Boersma, T. Butler, J. Cofala, J. Drevet, A.M. Fiore, M. Gauss, D.A. Hauglustaine, L.W. Horowitz, I.S.A. Isaksen, M.C. Krol, J.-F. Lamarque, M.G. Lawrence, R.V. Martin, V. Montanaro, J.-F. Müller, G. Pitari, M.J. Prather, J.A. Pyle, A. Richter, J.M. Rodriguez, N.H. Savage, S.E. Strahan, K. Sudo, and M. van Roozendael (2006a), Multi-model ensemble simulations of tropospheric NO2 compared with GOME retrievals for the year 2000, Atmos. Chem. Phys., 6, 2943-2979.
Van Noije, T.P.C., A. Segers, and P.F.J. van Velthoven (2006b), Time series of the stratosphere-troposphere exchange of ozone simulated with reanalyzed and operational forecast data, J. Geophys. Res., 111, D03301, doi:10.1029/2005JD006081.
Vautard, R., S. Szopa, M. Beekmann, L. Menut, D.A. Hauglustaine, L. Rouil, M. Roemer (2006), Vautard R, Van Loon M, Schaap M, et al., Are decadal anthropogenic emission reductions in Europe consistent with surface ozone observations?, Geophys. Res. Lett., 33 (13), doi:10.1029/2006GL026080.

75
Vik, A.F., S. Bjørndalsæter, L. Backman, J. Staehelin, F. Wittrock, Report on the RETRO database for observations and recommendations for optimal use of the data, NILU report TR 7/2006, ref. U-103032, Kjeller, Norway, October 2006.
Wittrock, F., Richter, A., Oetjen, H., Burrows, J.P., Kanakidou, M., Myriokefalitakis, S., Volkamer, R., Beirle, S., Platt, U., Wagner, T. (2006), Simultaneous Global Observations of Glyoxal and Formaldehyde from Space, Geophys. Res. Lett., 33(16), doi:10.1029/2006GL026310.
Wittrock, F., The retrieval of oxygenated volatile organic compounds by remote sensing techniques, PhD Thesis: University of Bremen, 2006.
Articles published in 2007 Auvray, M., I. Bey, E. Llull, M.G. Schultz, S. Rast (2007), A model investigation of the impact of
long-range transport on tropospheric ozone chemical tendencies, J. Geophys. Res., 112,doi:10.1029/2006JD007137.
Dalsøren, S. B., Ø. Endresen, I. S. A. Isaksen, G. Gravir, and E. Sørgård (2007), Environmental impacts of the expected increase in sea transportation, with a particular focus on oil and gas scenarios for Norway and Northwest Russia., J. Geophys. Res., 112, 10.1029/2005JD006927.
Damski, J., L. Thölix, L. Backman, J. Kaurola, P. Taalas, J. Austin, N., Butchart, M. Kulmala, A (2007), Chemistry-transport model simulation of middle atmospheric ozone from 1980 to 2019 using coupled chemistry GCM winds and temperatures, Atmos. Chem. Phys., 7, 2165-2181, 2007.
Damski, J., Thölix, L., Backman, L., Taalas, P., and Kulmala, M., FinROSE – Middle Atmospheric Chemistry Transport Model, Boreal Environ. Res., in press, 2007.
Pulles, T., R. Brand, M. van het Bolscher, A. Visschedijk (2007), The Application of the Emission Inventory Model TEAM: Global Emissions from Fuel Combustion in the years 1960 to 2000, TNO report 2007-A-R0132-B.
Schnadt Poberaj, C., J. Staehelin, D. Brunner, and V. Thouret (2007a), A UT/LS ozone climatology of the nineteen seventies estimated from the GASP aircraft measurement program, Atmos. Chem. Phys. Discuss., 7, 3451-3517.
Submitted and unpublished articles Butler, T.M., M. G. Lawrence, B. Gurjar, J. van Aardenne, M. Schultz, J. Lelieveld, The
representation of emissions from megacities in global emissions inventories, submitted to Atmos. Env., 2006.
Savage, N.H., J.A. Pyle, P. Braesicke, F. Wittrock, A. Richter, H. Nüß, J.P. Burrows, M.G. Schultz, T. Pulles, M. van het Bolscher, The sensitivity of Western European NO2 columns to interannual variability of meteorology and emissions: a model –GOME study, submitted to Atmos. Sci. Lett., 2007.
Schnadt Poberaj, C., J. Staehelin, D. Brunner, and V. Thouret, Changes in UT/LS ozone between the late 1970s and the 1990s deduced from GASP and MOZAIC and comparison with ozonesondes, manuscript in preparation, 2007b.
Schultz, M.G, A. Heil, J.J. Hoelzemann, A. Spessa, K. Thonicke, J. Goldammer, A.C. Held, J.M. Pereira (2007), Global Emissions from Wildland Fires from 1960 to 2000, submitted to Global Biogeochem. Cycles

76
7.2 Conference Contributions
Conferences in 2003 Damski, J., L. Backman, L. Thölix, and J. Kaurola, A Chemistry-Transport Model Simulation of
Middle Atmosphere Ozone from 1980 to 2019 Using Coupled Chemistry GCM Winds and Temperatures (Poster presentation). In: International Conference on Earth System Modelling, Abstracts, p 49, 15-19 September 2003, Hamburg, Germany.
Fietkau, S., et al., One Year of Groundbased Multi Axis DOAS Measurements in Nairobi, 2nd International DOAS Workshop Heidelberg, September 2003
Heckel, A., et al., Multi-axis DOAS measurements during FORMAT campaign - First results in retrieving Formaldehyde, DPG Frühjahrstagung, March 2003
Ladstätter-Weißenmayer, A., et al., Tropospheric Ozone analysed with FURM (Full Retrieval Method) and compared with SHADOZ-O3-sondes measurements, 2nd International DOAS Workshop Heidelberg, September 2003.
Ladstätter-Weißenmayer, A., et al., Tropospheric Ozone based on satellite measurements of SCIAMACHY and GOME, EGU meeting, April 2003.
Medeke, T., et al., Multi-axis DOAS observations of atmospheric trace gases in Bremen, DPG Frühjahrstagung, March 2003.
Medeke, T., et al., Multi-axis DOAS observations of atmospheric trace gases at the Greenland ice cap, 2nd International DOAS Workshop Heidelberg, September 2003.
Nüß, H., et al., GOME NO2 Retrieval with individual AMF for Aerosol, Albedo, Orography and Profile, 2nd International DOAS Workshop Heidelberg, September 2003.
Nuess, H., et al., GOME NO2 Retrieval with Model Profiles, DPG Frühjahrstagung, March 2003.
Oetjen, H., et al., MAX-DOAS measurements in Ny-Ålesund and during the Andoya Campaign in 2003, 2nd International DOAS Workshop Heidelberg, September 2003.
Oetjen, H., et al., Observations of Atmospheric Trace Gases from 1994 to 2003, EGU meeting, April 2003.
Richter, A. et al. (2003), First NO2 Results from SCIAMACHY UV/vis Nadir Measurements, 2nd International DOAS Workshop, Heidelberg, September 2003.
Richter, A. et al. (2003), First Results from SCIAMACHY UV/vis Nadir Measurements, DPG Spring Meeting, March 2003.
Savage, N.H., and J.A. Pyle (2003), Quantifying maximum controllable contributions to the global ozone budget, Royal Meteorological Society Conference, Norwich, UK, 2003.
Sierk, B., et al., Tropospheric trace gas amounts from combined limb/nadir analysis of SCIAMACHY data, DPG Frühjahrstagung, March 2003.
Spessa, A., B. McBeth, K. Thonicke, I.C. Prentice, Modelling the relationship between fire frequency, rainfall and vegetation in the Kimberleys region Australia, using a fire model coupled to a DGVM. Proceedings of the 3rd International Wildland Fire Conference, Oct 2003, Sydney. (15 pp).
Tarsu, T., et al., Comparison between Trace Gas Measurements Performed with the MAX- DOAS Technique During the FORMAT Campaign, DPG Frühjahrstagung, March 2003.
Tarsu, T. et al., Comparison between Measurements Performed by different MAX-DOAS Instruments During the FORMAT Campaign 2002, 2nd International DOAS Workshop Heidelberg, September 2003.
77
Conferences in 2004 Auvray, M., I. Bey, E. Llull, and M. Schultz, Long-range transport over North Atlantic: fluxes to
Europe and chemical evolution, Poster presentation at 8th IGAC conference, Christchurch, New Zealand, Sept. 2004.
Backman, L., Damski, J., Ojanen, S.-M. and Thölix, L., Multi-year chemistry transport model simulation of middle atmospheric ozone using ERA-40 meteorological data: Comparison with observations, Stratospheric Ozone Workshop, 16-17 March, 2004, Zurich, Switzerland. Oral presentation, 2004.
Backman, L., Ojanen, S.-M., Thölix, L. and Damski, J., Multi-Year stratospheric simulations using FinRose-CTM, comparison with observations, Nordic ozone group meeting, 15-16 April, 2004, Helsinki, Finland. Oral presentation, 2004.
Backman L., Damski, J., Thölix, L. and Kaurola, J. (2004), A Chemistry-Transport Model Simulation of Middle Atmospheric Ozone from 1980 to 2019 Using Coupled Chemistry GCM Winds and Temperatures, Proceedings of the XX Quadrennial Ozone Symposium 1-8 June 2004, Kos, Greece., Vol.II, pp. 729-730, 2004.
Barimah, E., et al., Deriving an ocean colour product from measurements of the GOME and SCIAMACHY instruments, DPG Frühjahrstagung, March 2004.
Dalsøren, S.B., I.S.A. Isaksen, Emission changes 1990-2001, global and regional impact on tropospheric oxidants. Presentation at Aerozclim meeting, Oslo, Norway, June 2004
Dalsøren, S.B., I.S.A. Isaksen, C. Zerefos, K. Kourtidis, C. Meleti, J.K. Sundet, A. Grini, P. Zanis and D. Balis, Emission from international sea transportation and environmental impact. Poster presentation Quadrennial Ozone Symposium, Kos, Greece, June 2004
Dalsøren, S.B., I.S.A. Isaksen, C. Zerefos, K. Kourtidis, C. Meleti, J.K. Sundet, A. Grini, P. Zanis and D. Balis, Emission from international sea transportation and environmental impact, Poster presentation at Research conference for KlimaProg, Climate effects and Polar climate research, Lillehammer, Norway 2004.
Hoelzemann, J.J., G.P. Brasseur, C. Granier, M.G. Schultz, The Global Wildland Fire Emission Model GWEM, ACCENT meeting, Paris, June 2004.
Kaurola, J., A. Arola, J. Austin, N. Butchart, J. Damski, L. Backman, A. Tanskanen, and L. Tholix (2004), Surface UV trends derived from coupled chemistry-climate model simulations for the period 1980 to 2020, and 2000 to 2020, Proceedings of the XX Quadrennial Ozone Symposium 1-8 June 2004, Kos, Greece., p. 255-256.
Ladstätter-Weißenmayer, A., et al., Tropospheric O3 over Indonesia during biomass burning events measured with GOME and compared with trajectory analysis, 8th IGAC conference, September 2004.
Lathière, J., D. Hauglustaine, G. Krinner, G. Folberth, N. de Noblet-Ducoudré, and P. Friedlingstein, Impact of land use and vegetation changes on biogenic hydrocarbon emissions, Poster presentation at 8th IGAC conference, Christchurch, New Zealand, Sept. 2004.
Nüß, H., al., Improvements of GOME NO2 Retrieval, H. Nuess et al., EGU meeting, April 2004.
Rast, S., M.G. Schultz, and G.P. Brasseur, MOZECH: A New Coupled Chemistry General Circulation Model, presentation at EGU 1st assembly, Nice, France, 25-30 April 2004.
Richter, A. et al., Linking Tropospheric NO2 Measurements from SCIAMACHY to the GOME Time Series, EGU meeting, Nice, April 2004.
Richter, A., et al., Cloud effects in Tropospheric NO2 Columns retrieved from SCIAMACHY Nadir Measurements, DPG Frühjahrstagung, March 2004.
Savage, N., Using Satellite data to better understand global ozone budgets, ACCENT AT2 workshop on tropospheric satellite data, Bremen, Germany, June 2004.

78
Savage, N., C. Schnadt, G. Carver, F. O'Connor, C. Bridgeman, Validation of Tropospheric Chemistry model simulations forced with ERA-40 data, UGAMP annual conference, Oxford, 8-10 Sept. 2004.
Savage, N., Using Satellite data to better understand global ozone budgets, ACCENT workshop, Paris, June 2004.
Savage, N.H., C. Schnadt, J. Staehelin, M. Schultz, S. Rast, T. van Noije, P. van Velthoven, D. Hauglustaine, S. Laval, Y. Balkanski, and J.A. Pyle, Model evaluation of global tropospheric models forced with ERA-40 meteorology, poster presentation at EGU, Nice, France, 25-30 April 2004.
Schmoltner, A.-M., et al., Retrieval of stratospheric and tropospheric ozone from SCIAMACHY limb and nadir observations, A.-M. Schmoltner et al., EGU meeting, April 2004.
Schnadt, C., UTLS ozone changes between the late 1970s and the 1990s: A comparison between the GASP and MOZAIC measurements, oral presentation at EGU, Nice, France, 25-30 April 2004.
Schnadt, C., D. Brunner, J. Staehelin, and V. Thouret (2004), Tropospheric ozone trends since World War II: UTLS ozone changes between the late 1970s and 1990s estimated from the GASP and MOZAIC aircraft measurement programs, Proc. Quadr. Ozone Symp., 915-916, Kos, Greece.
Schultz, M.G., J.J. Hoelzemann, A. Heil, A Global Modeler’s User Requirements for Satellite-Based Fire Monitoring Products, presentation at the 1st GOFC-GOLD Geostationary Fire Monitoring Workshop, Darmstadt, March 2004.
Schultz, M.G. and the RETRO science team, RETRO modelling activities, presentation at the ACCENT workshop, Paris, June 2004.
Schultz, M., D. Hauglustaine et al., RETRO project results, Poster presentation at 8th IGAC conference, Christchurch, New Zealand, Sept. 2004
Schultz, M.G. and the RETRO science team, The RETRO project, presentation at the ACCENT TP&P meeting, Barnsdale, Oct. 2004.
Szopa, S., D. Hauglustaine, P. Ciais, Interannual variability of ozone, methane and carbon monoxide over the 1997-2001 period: a modelling study, Poster presentation at 8th IGAC conference, Christchurch, New Zealand, Sept. 2004.
Van Noije, T.P.C., P.F.J. van Velthoven, H. Eskes, and M. van Weele, Implications of the enhanced Brewer-Dobson circulation in ERA-40 for the downward transport of ozone to the troposphere, presentation at the XX Quadrennial Ozone Symposium, Kos, Greece, June 1-8, 2004.
Van Noije, T., P. van Velthoven, H. Eskes and M. van Weele, Stratosphere-Troposphere exchange of ozone in chemistry-transport models driven by ERA-40, in: Geophysical Research Abstracts, vol.6, 02654, 2004; EGU Nice April 2004.
Van Velthoven, P., T. van Noije, D. Olivié, R. Scheele, Use of ERA-40 data for chemistry-transport modeling, ACCENT workshop, Paris June 21-22, 2004.
Volz-Thomas, A., M.G. Schultz, V. Thouret, P. Nedelec, K. Thomas, H.-W. Pätz, Evaluation of the Global CTM MOZART-2 Using MOZAIC Data, Poster presentation at 8th IGAC conference, Christchurch, New Zealand, Sept. 2004.
Wang, P., et al., AMAXDOAS NO2 and CH2O measurements during the FORMAT Campaigns, EGU meeting, April 2004.
Wittrock, F., et al., Ground-based UV/vis observations of atmospheric trace gases at different latitudes, 8th IGAC conference, September 2004.

79
Conferences in 2005 Heckel, A., et al., GOME and SCIAMACHY Measurements of NO2 - Validation with ICARTT
Measurements and Export Patterns, ICARTT Data Workshop Durham, USA, August 09, 2005.
Heckel, A., et al., SCIAMACHY data products, MILAGRO / INTEX-B Joint Science Team Meeting, Boulder, USA, October 27, 2005.
Hoelzemann, J.J., M.G. Schultz, C. Granier, G.P. Brasseur, Intercomparison of Different Wildland Fire Emission Data Sets and their Effect on Global Tropospheric Carbon Monoxide and Ozone, EGU meeting, Vienna, 24-29 April 2005.
Isaksen, I.S.A., K. Ellingsen, M. Gauss, A. Søvde, S.B. Dalsøren, ACCENT/IPCC meeting, Oslo, Norway, Jan. 2005.
Isaksen, I.S.A., S. Dalsøren, CTM studies in hydroxyl distribution 1990-2001 and its impact on methane, oral presentation at 1st ACCENT Symposium, Urbino, Sept. 12-16, 2005.
Rast, S., M.G. Schultz, F. Dentener, D. Stevenson, J. Cofala, Air quality in a changing climate – Hamburg results from the ACCENT-IA3/IPCC activity Photocomp 2030, poster, 1st ACCENT Symposium, Urbino, Sept. 2005.
Richter, A., Measurements of tropospheric constituents from space - an overview, oral presentation at 1st ACCENT Symposium, Urbino, Sept. 12-16, 2005.
Richter, A., H. Nüß, A. Heckel, J.P. Burrows, C. Granier, Changes of tropospheric NO2 as observed by GOME and SCIAMACHY, Poster presentation at EGU meeting, Vienna, April 2005.
Richter, A., et al., Results from one decade of measurements from GOME and SCIAMACHY, AURA Science Meeting The Hague, The Netherlands, November 07, 2005.
Richter, A., et al., Retrieval of tropospheric species from SCIAMACHY UV/vis measurements, TPD / TNO meeting, Bremen, Germany, September 23, 2005.
Richter, A., Satellite observations of the atmosphere and the ocean surface, Heraeus Summer School “Physics of the Environment”, Bonn, Germany, September 3, 2005.
Richter, A., et al., Ground-based DOAS Measurements of Tropospheric Reactive Halogens, THALOZ Troposphere Halogens – Effect on Ozone, 3rd Annual Meeting, Vienna, Austria, April 28, 2005.
Richter, A., et al., Satellite Measurements of Tropospheric BrO, THALOZ Troposphere Halogens – Effect on Ozone, 3rd Annual Meeting, Vienna, Austria, April 28, 2005.
Richter, A., et al., The Impact of Clouds on UV/visible measurements of trace gases from space, ACCENT AT-2 3nd Annual Meeting, Oberpfaffenhofen, Germany, June 6, 2005.
Richter, A., et al., Monitoring Changes in Tropospheric Constitution from Space, ACCENT AT-2 meeting, Bremen, Germany, January 31, 2005.
Savage, N.H., J.A. Pyle, F. Wittrock, A. Richter, H. Nuess, J.P. Burrows, M.G. Schultz, T. Pulles and M. van het Bolscher, Interannual Variability and Sensitivity of Tropospheric Ozone and Its Precursors Investigated Using Modelling and Satellite Data, Conference Proceeding of the 1st ACCENT Symposium, Urbino, 2005.
Schnadt, C., D. Brunner, J. Staehelin, V. Thouret, Changes in UTLS ozone between the late 1970s and the 1990s deduced from commercial aircraft measurements of GASP and MOZAIC, Poster presentation at EGU meeting, Vienna, April 2005.
Schnadt, C., D. Brunner, J. Staehelin, and V. Thouret, Changes in UTLS ozone between the late 1970s and the 1990s deduced from commercial aircraft measurements of GASP and MOZAIC, oral presentation at ACCENT Symposium, Urbino, Italy, 12-16 Sep 2005.
Schultz, M.G., Emissions estimates for assessing the impacts of a future hydrogen economy, presentation at the ACCENT workshop on atmospheric sustainability, Laxenburg, Jan. 2005.
80
Schultz, M, The RETRO Team, RETRO program status overview, Poster presentation at EGU meeting, Vienna, April 2005.
Schultz, M.G., J.J. Hoelzemann, A. Heil, A. Spessa, K. Thonicke, J. Goldammer, A. Held, J.M.C. Pereira, D. Oom, A 40-year inventory of global emissions from wildfires, presentation at the EarSel conference, Zaragoza, 16-18 June 2005.
Schultz, M. and RETRO team, RETRO emission trends and variability, Poster presentation at 1st ACCENT Symposium, Urbino, Sept. 12-16, 2005.
Schultz, M.G., J.J. Hoelzemann, A. Heil, T. Pulles, R. Brand, M. van het Bolscher, S. Dalsøren, A. Spessa, K. Thonicke, J. Goldammer, A. Held, J.M. Pereira, RETRO emission inventories, SCOUT meeting, Hamburg, June 2, 2005.
Schultz, M.G., J.J. Hoelzemann, A. Heil, The need for quantitative satellite data for emissions modelling, presentation at the 1st QUEST-IGBP fire workshop, Exeter, Oct. 2005.
Staehelin, J., Changes in UTLS ozone between the late 1970s and the 1990s deduced from commercial aircraft measurements of GASP and MOZAIC, oral presentation at 1st ACCENT Symposium, Urbino, Sept. 12-16, 2005.
Szopa, S., D. Hauglustaine, L. Menut, R. Vautard, Evolution of the tropospheric composition in 2030: Impact on western European air quality, Poster presentation at 1st ACCENT Symposium, Urbino, Sept. 12-16, 2005.
van Noije, T., H. Eskes, F. Boersma, and P. van Velthoven, Variability and Trends in tropospheric NO2: evaluation with GOME observations and projected changes for 2030, Oral presentation at the EGU General Assembly, April 26, 2005, Vienna, Austria.
Van Noije, T., and P. van Velthoven, Tropospheric ozone and its precursors: reanalysis over the past 45 years and projections for 2030, Oral presentation at the Fourth International Symposium on Non-CO2 Greenhouse Gases (NCGG-4), July 5, 2005, Utrecht, The Netherlands.
Vik, A.F., S. Bjørndalsæter, C. Stoll, T. Krognes, R. Paltiel, T. Bårde, S.E. Walker, The RETRO database for observations, Poster presentation at EGU meeting, Vienna, April 2005.
Wittrock, F., S. Szopa, D. Hauglustaine, A. Richter, and J.P. Burrows, Global Observations of Formaldehyde, Poster presentation at 1st ACCENT Symposium, Urbino, Sept. 12-16, 2005.
Wittrock, F., A. Richter, J.P. Burrows, Global observations of formaldehyde, EGU meeting, Vienna, 24-29 April 2005.
Wittrock, F., et al., Profile retrieval from MAX-DOAS observations, NDSC workshop, Madrid, Spain, June 6, 2005.
Wittrock, F., et al., The Bremian DOAS network for atmospheric measurements (BREDOM), NDSC workshop, Madrid, Spain, June 6, 2005.
Wittrock, F., et al., Global observations of formaldehyde, RETRO annual meeting, Zürich, Suisse, May 24, 2005.
Wittrock, F., et al., Observations of formaldehyde during the FORMAT campaign and on global scale, 3rd annual meeting of the FORMAT project, Garmisch, Germany, February 9, 2005.
Wittrock, F., et al., Global observations of formaldehyde, Seminar on Physics and Chemistry of the Atmosphere, Bremen, Germany, January 21, 2005.
Wittrock, F., et al., Some Aspects of NO2 Total Column Retrieval from GOME-2, O3M-SAF AF-IV Meeting, Brussels, Belgium, November 02, 2005.

81
Conferences in 2006 Andreani-Aksoyoglu, S., J. Keller, C. Ordonez, A.S.H. Prevot, M. Schultz, Impact of various emission
scenarios for 1985-2010 on ozone in Switzerland, Poster EGU06-A-05521, EGU General Assembly, Vienna, April 2006.
Hauglustaine, D. A., RETRO project team, A multi-model simulation of the tropospheric composition over the past 40 years (solicited), EGU general assembly, Vienna, April 2-7, 2006.
Ladstätter-Weißenmayer, A., et al., Pollution events over the East Mediterranean: Synergistic use of GOME, ground based and sonde observations and models, EGU meeting, April 2006.
Oetjen, H., et al., Satellite Validation of Tropospheric Trace Gases with MAX-DOAS Measurements during the DANDELIONS field campaign, EGU meeting, April 2006.
Pereira, J.M.C., M. Schultz, D. Oom, B. Mota, Applications of remotely sensed burned area and severity data, oral presentation at the 3rd International Fire Ecology and Management Congress, San Diego, 13-17 Nov 2006.
Prévôt, A.S.H., C. Ordóñez, S. Andreani-Aksoyoglu, J. Keller, C. Hüglin, H.-E. Scheel, J. Staehelin, M. Schultz, S. Rast, R. Stuebi, P. Jeannet, W. Steinbrecht, H.J. Claude, V. Thouret, J.P. Cammas, W. Spangl, S. Szopa, D. Hauglustaine, T. van Noije, Air pollution trends around the Alps since 1992, EGU general assembly, Vienna, April 2-7, 2006.
Rast, S., T. van Noije, S. Szopa, D. Hauglustaine, P. van Velthoven, M.G. Schultz, Multimodel analysis of the sensitivity of the tropospheric chemical composition to emissions: Comparison of RETRO and ACCENT/IPCC Photocomp simulations, EGU general assembly, Vienna, April 2-7, 2006.
Richter, A., et al., One Decade of GOME and SCIAMACHY Tropospheric Measurements – Results, Applications, and Outlook, EGU General Assembly 2006, Vienna, Austria, April 2006
Richter, A., et al., Measurements of tropospheric Composition from Space with GOME and SCIAMACHY, ETH Zürich, Switzerland, March 27, 2006.
Richter, A., et al., How can we improve tropospheric Measurements from Space?, 3rd international DOAS workshop, Bremen, Germany, March 21, 2006.
Richter, A., et al., 10 Jahre Messungen troposphärischer Spurengase aus dem All – Ergebnisse, Grenzen und Perspektiven, Institut für Meteorologie und Klimaforschung Forschungszentrum Karlsruhe, Germany, January 13, 2006.
Richter, A., SO2 retrieval from SCIAMACHY nadir data, SADDU meeting, Bremen, Germany, January 12, 2006.
Richter, A., et al., Using GOME-2 measurements to extend the GOME/SCIAMACHY tropospheric NO2 record, First EPS MetOp RAO Workshop, May 2006.
Richter, A., et al., SCIAMACHY Measurements of tropospheric SO2, DPG Frühjahrstagung, March 2006.
Savage, N.H., RETRO Studies of seasonal cycles and sensitivity to dynamic and emissions of tropospheric ozone and precursors in the period 1997-2000, EGU general assembly, Vienna, April 2-7, 2006
Schultz, M.G., RETRO project team, Reanalysis of the tropospheric chemical composition over the past 40 years (poster), EGU general assembly, Vienna, April 2-7, 2006.
Schultz, M. and the RETRO team, Reanalysis of the tropospheric chemical composition over the past 40 years (RETRO), Poster IGAC Symposium, Cape Town, September 17-23, 2006.
Spessa, A., Climate and Human Drivers of Fire Activity and Emissions from Peat Fires in Borneo, 1997 to 2003 Global Carbon Project (GCP) Workshop on ‘Vulnerability of Carbon Pools of Tropical Peatlands in Asia’, Pekanbaru, Indonesia, January 2006
82
Spessa A., Simulating Global Fire Regimes, Fire-Vegetation Interactions and Emissions from Biomass Burning. GCP Workshop on Drought and Fire, Canberra, June 2006
Szopa, S., D. Hauglustaine, R. Vautard, L. Menut, Trends and interannual variability of tropospheric ozone concentrations over Europe from 1960 to 2000, EGU general assembly, Vienna, April 2-7, 2006.
Thölix, L., L. Backman, S-M. Ojanen, J. Damski, Analysis and validation of long-term chemistry-transport model simulations of middle atmospheric ozone, EGU general assembly, Vienna, April 2-7, 2006.
van Noije, T., The RETRO project, Presentation at the Evergreen International Workshop, February 20, 2006, De Bilt, The Netherlands.
van Noije, T., M. Schultz, S. Rast, S. Szopa, D. Hauglustaine, N. Savage, S. Dalsoren, F. Wittrock, H. Eskes, and P. van Velthoven, Model simulations of tropospheric NO2 compared with GOME retrievals for the years 1996-2000, Poster presented at the EGU General Assembly, April 7, 2006, Vienna, Austria.
Vik, A.F., S. Bjørndalsæter, C. Stoll, T. Krognes, T. Bårde, S.E. Walker, The RETRO database for observations, EGU general assembly, Vienna, April 2-7, 2006
Wittrock, F., M.G. Schultz, S. Rast, T.P.C. van Noije, S. Szopa, D. Hauglustaine, N.C. Savage, S.B. Dalsøren, A. Richter, J.P. Burrows, Model Simulations of Formaldehyde compared with GOME Observations from 1996 to 2000, EGU general assembly, Vienna, April 2-7, 2006.
Wittrock, F., et al., The retrieval of oxygenated volatile organic compounds by remote sensing techniques, 3rd international DOAS workshop, Bremen, Germany, March 22, 2006.
Wittrock, F., et al., Measurements of oxygenated volatile organic compounds by remote sensing techniques, WMO/GAW VOC experts workshop, Geneva, Suisse, January 30, 2006.
Wittrock, F., et al., Observations of oxygenated volatile organic compounds, DPG Frühjahrstagung, March 2006.
Wittrock, F., et al., Model simulations of formaldehyde compared with GOME measurements, EGU meeting, April 2006.
Wittrock, F., et al., Global observations of formaldehyde and glyoxal with space-borne and ground-based UV/vis instruments, EGU meeting, April 2006.
Conferences in 2007 Butler, T. M.; Lawrence, M. G.; Gurjar, B. R.; van Aardenne, J.; Schultz, M.; Lelieveld, J.m
Modelling the Effects of Megacities on Global Atmospheric Chemistry, EGU symposium, Vienna, April 2007, EGU2007-A-07196.
Heil, A; Langmann, B; Schultz, M; Rast, S; Graf, H., Atmospheric implications of Indonesian peat fires, EGU symposium, Vienna, April 2007, EGU2007-A-04124.
Le Page, Y.; Pereira, J.M.C; Trigo, R.; da Camara, C., Global view of the main patterns of fire activity variability from 1996 to 2006 using screened ESA World Fire Atlas data, EGU symposium, Vienna, April 2007, EGU2007-A-02447.
Rast, S.; Schultz, M.G., A modelling study on trends and variability of the tropospheric chemical composition over the last 40 years - sensitivity to emission and meteorological variability and insights from multi-model ensembles, EGU symposium, Vienna, April 2007, EGU2007-A-02383.

83
Schultz, M.G.; The RETRO team, Long-term changes in the global emissions of CO and NOx and implications for the tropospheric chemical composition, EGU symposium, Vienna, April 2007, EGU2007-A-04400.
Schultz, M.G. and the RETRO team, Past trends in atmospheric composition: Results from the RETRO project, invited presentation at the Royal Society Meeting on future ground-level ozone, London, May 2007.
Schultz, M.G. and the RETRO team, A 40-Year Reanalysis of the Tropospheric Chemical Composition (RETRO): Project Summary and Main Findings, Poster, ACCENT Symposium, Urbino, 23-27 July 2007.
Szopa, S.; Viovy, N.; Friedlingstein, P.; Hauglustaine, D.; Lathière, J.; Ciais, P., Impact of future ozone on the terrestrial biosphere: comparisons with the effects of climate change and CO2 increase, EGU symposium, Vienna, April 2007, EGU2007-A-07715.
Szopa, S., D. Hauglustaine, M. Schultz, S. Rast, T. van Noije. P. van Velthoven, Trends of tropospheric background ozone over the world during the last decades: How can state-of-the-art models reconcile with observations?, Poster, ACCENT Symposium, Urbino, 23-27 July 2007.

84
85
8. The Consortium: Partner contribution summaries
The RETRO project was only possible due to the wide range of expertise brought in by the 12 partner institutions across Europe. These groups are specialized in different areas related to the measurement and analysis of atmospheric trace gases and aerosols, the derivation of emission fluxes of pollutant species and aerosol compounds including in particular emissions from wildfires, and in global three-dimensional modelling of the physics and chemistry of the atmosphere. The following sections describe the specific tasks performed by each partner over the course of the project. The thematic overview of the project including its major results can be found in sections 3 and 4.
8.1 Max Planck Institute for Meteorology (MPG-IMET)
Personnel involved in project: Martin Schultz, Sebastian Rast, Thomas Diehl, Birgit Grodtmann, Angelika Heil, Judith Hoelzemann
Project objectives The MPG-IMET had the following responsibilities within the project:
• Project management • Leading work package 1 (preparation of emission data) • Development of biomass burning emission data set in cooperation with partner 12 • Implementation of new emission data sets and validation • Sensitivity studies with respect to emission parameters • Reanalysis integrations • Multi-decadal tagged tracer simulations for evaluation of cross boundary transport of
Pollution • Scenario calculations
In addition to the original work plan, MPG-IMET performed the following tasks: • Tool development • Preparation of a data set of the surface boundary conditions of atmospheric methane
concentrations • Reformatting of anthropogenic emission data from partner TNO and development of a
smoothing and regridding procedure • Adaptation and reformatting of aircraft emissions obtained from DLR, Oberpfaffenhofen • Reformatting of stratospheric boundary condition data set by partner FMI and derivation of
scaling factors • Contribution to the development and evaluation of a coupled chemistry climate model • Analysis of a case study on stratospheric ozone intrusions
Activity report
Year 1 • MPG-IMET organized the kickoff meeting of the project at Haus Rissen, Hamburg, in
October 2002 • A project office was installed and a project secretary (Mrs. B. Grodtmann) was hired • The project web site http://retro.enes.org was set-up • A survey of existing emission data sets was conducted and a planning document for the
preparation of emissions data was written (D1-1) • A special focus meeting on biomass burning emissions was organized • The development of the coupled chemistry-climate model MOZECH (now called ECHAM5-
MOZ) was finalized and model evaluation began. The development of this new model was
86
seen as an important project contribution, because of the inconsistencies in the hydrological cycle incurred in the ERA-40 data set (Hagemann et al., 2005).
• All required variable fields from the ERA-40 data set were acquired from ECMWF and reformatted for use with the ECHAM5-MOZ model
Year 2 • Contributed to the organisation of the third project meeting in Helsinki and three special focus
meetings on emissions and model validation • Presented an overview about the RETRO project at two international conferences: EGU, Nice,
April 2004, and Quadrennial ozone symposium, Kos, June 2004 • Established links to various other EU and other projects (POET, TRADEOFF, MOZAIC,
EVERGREEN, GMES-PROMOTE, AEROCOM) • IDL software tools for the analysis of model results and the preparation of model input data
sets were developed and made available to project partners • The ECHAM5-MOZ model participated in several sensitivity experiments, in the RETRO
model evaluation and in the ACCENT/IPCC Photocomp modelling exercise • Available data sets for biomass burning emissions were analyzed and a synthesis method for
estimating fire emissions over the past 40 years was developed • A data set to constrain methane surface concentrations over the past 40 years was developed
and made available to project partners • Aircraft emission data sets were obtained from an external source and reformatted and made
available to project partners
Years 3/4 • The RETRO project was presented at the EGU general symposia 2005 and 2006 in Vienna,
and at the first ACCENT symposium in Urbino • A final project meeting was organized in Hamburg in January 2006 • A work plan was designed to efficiently complete as many deliverables as possible before the
contractual end of the project. Several deliverables depended on the availability of the long-term simulation results and had thus to be delayed
• A structure and first draft of the final report was prepared before the RETRO project office had to close in June 2006
• Anthropogenic emission data sets were obtained from partner TNO and reformatted. A smoothing procedure and a regridding tool were developed to make these data available for the RETRO models. The emissions data were augmented with the data set of international ship traffic emissions from partner UiO and made available publicly on the RETRO web page
• The ECHAM5-MOZ model was adapted to the use of RETRO emissions and RETRO boundary conditions. A first long-term reanalysis simulation was performed between June and August 2006. Due to some errors detected in the set-up of this simulation, it was repeated from October to November 2006.
• The reanalysis simulations were analysed and the results compared with those from other RETRO models and with the results from the ACCENT/IPCC Photocomp exercise
• The RETRO policy scenarios related to power generation and road traffic were implemented in the ECHAM5-MOZ model and all scenarios were run and sent to partner UiO for analysis
• A case study of a stratospheric intrusion over Mauna Loa, Hawaii was analyzed and the results included in D3-4.
Main Results
A 40-year inventory of global emissions from wildland fires Estimating emissions from wildland fires on the global scale is a challenging task even for recent years where detailed information from satellites can help to identify major burning regions and temporal patterns of fire activity. Even more demanding was the goal of the RETRO project to develop a
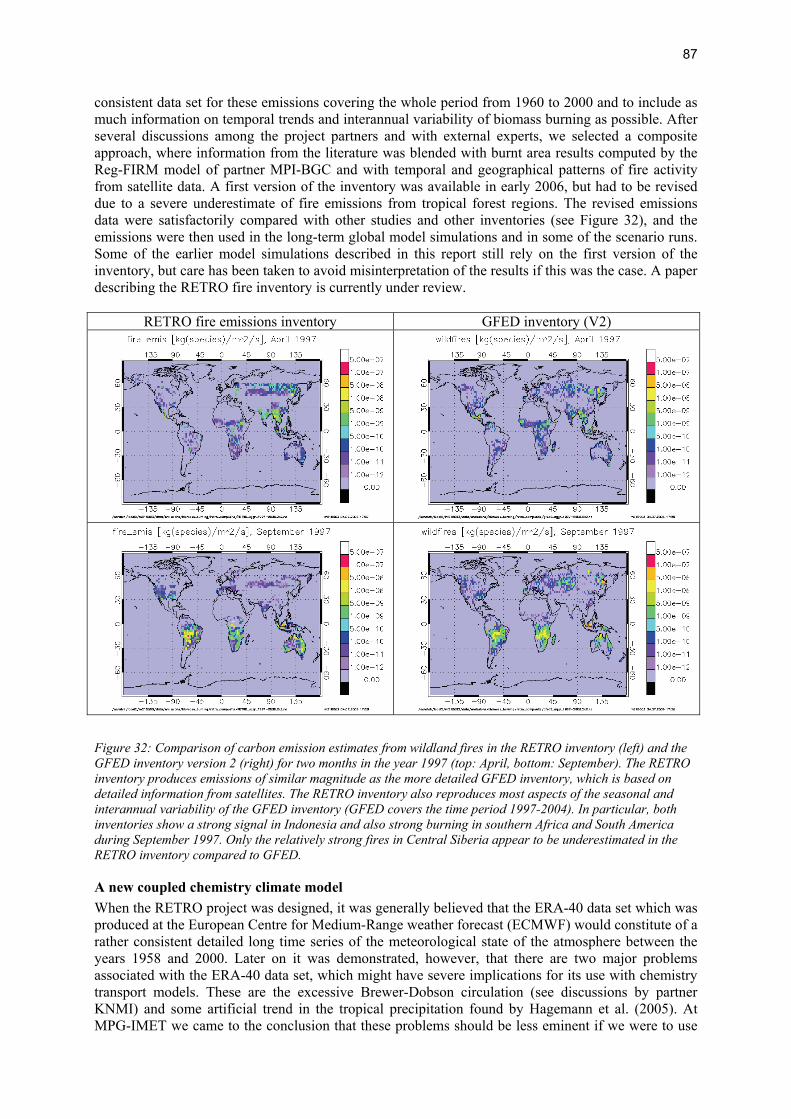
87
consistent data set for these emissions covering the whole period from 1960 to 2000 and to include as much information on temporal trends and interannual variability of biomass burning as possible. After several discussions among the project partners and with external experts, we selected a composite approach, where information from the literature was blended with burnt area results computed by the Reg-FIRM model of partner MPI-BGC and with temporal and geographical patterns of fire activity from satellite data. A first version of the inventory was available in early 2006, but had to be revised due to a severe underestimate of fire emissions from tropical forest regions. The revised emissions data were satisfactorily compared with other studies and other inventories (see Figure 32), and the emissions were then used in the long-term global model simulations and in some of the scenario runs. Some of the earlier model simulations described in this report still rely on the first version of the inventory, but care has been taken to avoid misinterpretation of the results if this was the case. A paper describing the RETRO fire inventory is currently under review.
RETRO fire emissions inventory GFED inventory (V2)
Figure 32: Comparison of carbon emission estimates from wildland fires in the RETRO inventory (left) and the GFED inventory version 2 (right) for two months in the year 1997 (top: April, bottom: September). The RETRO inventory produces emissions of similar magnitude as the more detailed GFED inventory, which is based on detailed information from satellites. The RETRO inventory also reproduces most aspects of the seasonal and interannual variability of the GFED inventory (GFED covers the time period 1997-2004). In particular, both inventories show a strong signal in Indonesia and also strong burning in southern Africa and South America during September 1997. Only the relatively strong fires in Central Siberia appear to be underestimated in the RETRO inventory compared to GFED.
A new coupled chemistry climate model When the RETRO project was designed, it was generally believed that the ERA-40 data set which was produced at the European Centre for Medium-Range weather forecast (ECMWF) would constitute of a rather consistent detailed long time series of the meteorological state of the atmosphere between the years 1958 and 2000. Later on it was demonstrated, however, that there are two major problems associated with the ERA-40 data set, which might have severe implications for its use with chemistry transport models. These are the excessive Brewer-Dobson circulation (see discussions by partner KNMI) and some artificial trend in the tropical precipitation found by Hagemann et al. (2005). At MPG-IMET we came to the conclusion that these problems should be less eminent if we were to use
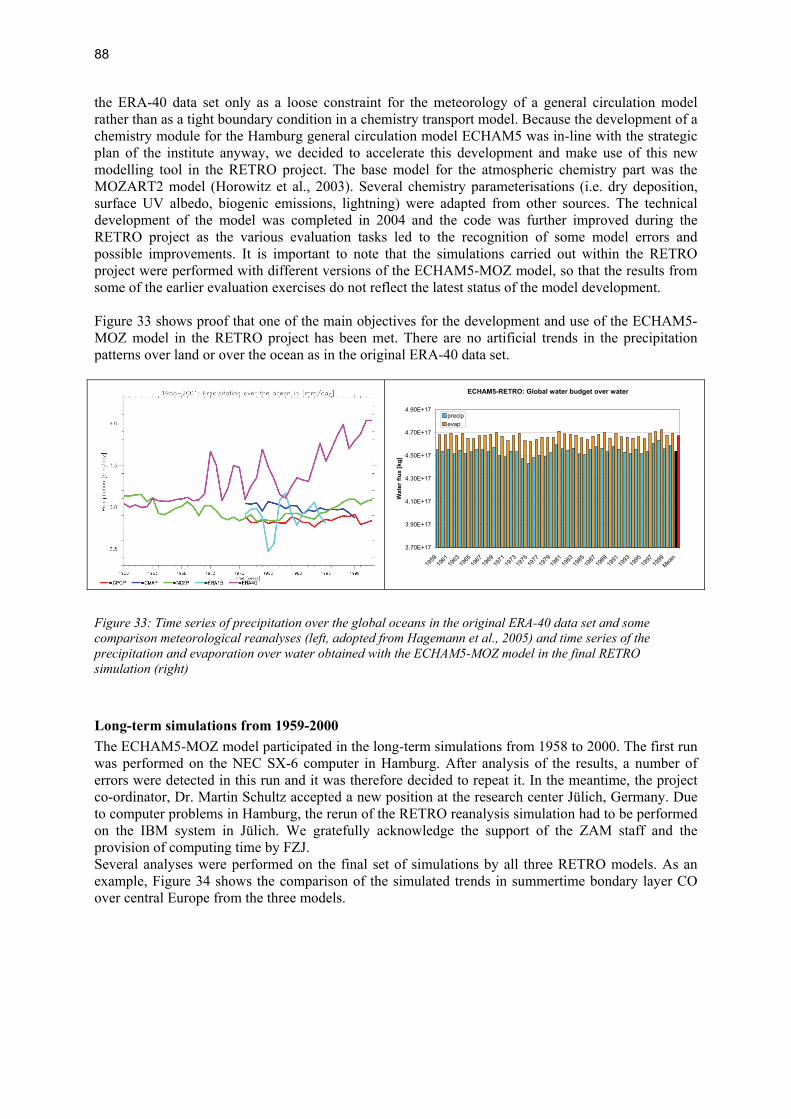
88
the ERA-40 data set only as a loose constraint for the meteorology of a general circulation model rather than as a tight boundary condition in a chemistry transport model. Because the development of a chemistry module for the Hamburg general circulation model ECHAM5 was in-line with the strategic plan of the institute anyway, we decided to accelerate this development and make use of this new modelling tool in the RETRO project. The base model for the atmospheric chemistry part was the MOZART2 model (Horowitz et al., 2003). Several chemistry parameterisations (i.e. dry deposition, surface UV albedo, biogenic emissions, lightning) were adapted from other sources. The technical development of the model was completed in 2004 and the code was further improved during the RETRO project as the various evaluation tasks led to the recognition of some model errors and possible improvements. It is important to note that the simulations carried out within the RETRO project were performed with different versions of the ECHAM5-MOZ model, so that the results from some of the earlier evaluation exercises do not reflect the latest status of the model development. Figure 33 shows proof that one of the main objectives for the development and use of the ECHAM5-MOZ model in the RETRO project has been met. There are no artificial trends in the precipitation patterns over land or over the ocean as in the original ERA-40 data set.
ECHAM5-RETRO: Global water budget over water
3.70E+17
3.90E+17
4.10E+17
4.30E+17
4.50E+17
4.70E+17
4.90E+17
1959
1961
1963
1965
1967
1969
1971
1973
1975
1977
1979
1981
1983
1985
1987
1989
1991
1993
1995
1997
1999
Mean
Wat
er fl
ux [k
g]
precipevap
Figure 33: Time series of precipitation over the global oceans in the original ERA-40 data set and some comparison meteorological reanalyses (left, adopted from Hagemann et al., 2005) and time series of the precipitation and evaporation over water obtained with the ECHAM5-MOZ model in the final RETRO simulation (right)
Long-term simulations from 1959-2000 The ECHAM5-MOZ model participated in the long-term simulations from 1958 to 2000. The first run was performed on the NEC SX-6 computer in Hamburg. After analysis of the results, a number of errors were detected in this run and it was therefore decided to repeat it. In the meantime, the project co-ordinator, Dr. Martin Schultz accepted a new position at the research center Jülich, Germany. Due to computer problems in Hamburg, the rerun of the RETRO reanalysis simulation had to be performed on the IBM system in Jülich. We gratefully acknowledge the support of the ZAM staff and the provision of computing time by FZJ. Several analyses were performed on the final set of simulations by all three RETRO models. As an example, Figure 34 shows the comparison of the simulated trends in summertime bondary layer CO over central Europe from the three models.

89
0
20
40
60
80
100
120
140
160
180
1960 1970 1980 1990 2000
CO
[ppb
]
ECHAM5-MOZLMDz-INCATM4
Figure 34: Simulated boundary layer (0-1 km) summertime CO concentrations from ECHAM5-MOZ, LMDz-INCA and TM4 from 1960 to 2000 over a rectangular region spanning central Europe from 0 to 30° E and 45-55° N.
Model evaluation with MOZAIC measurements The results from the ECHAM5-MOZ long-term simulation were compared with ozone measurements from the MOZAIC programme. Figure 35 below shows the comparison of monthly mean time series at various vertical levels above Frankfurt/Main, Germany. The model is found to generally capture the variability of ozone int he free troposphere rather well, but it exhibits a high bias of about 10ppb in the middle and upper troposphere.
Figure 35: Time series of monthly mean ozone concentrations at various altitude levels above Frankfurt/Main, Germany. Comparison of MOZAIC observations (black line with dots) and ECHAM5-MOZ model results (blue lines). The model levels correspond to the following pressure levels: level 10 = 240 hPa, level 17 = 500 hPa, level 22 = 720 hPa, level 25 = 850 hPa, level 28 = 960 hPa
90
8.2 Laboratoire des Sciences du Climat et de l'Environnement (LSCE)
Personnel involved in project Sophie Szopa, Didier Hauglustaine, Yves Balkanski, Yingshi Li
Project objectives
• Preparation of dust and sea salt emissions • Implementation of new emission data sets and validation • Sensitivity studies • Leading work package 4 (reanalysis integrations) • Radiative forcing calculations
In addition to the original work plan, LSCE performed the following tasks: • Preparation of biogenic emissions • Tool development
Activity report
Year 1 • The LSCE organised the first work meeting (Dourdan, April 2003) with all the partners. The
strategy of each work package was reaffirmed and refined and the preliminary works were presented.
• The LMDz-INCA model was adapted for use of ERA-40 meteorology. • Management of the 1st version of the RETRO planning document on long-term simulations of
atmospheric composition (RETRO planning document on long-term simulations of atmospheric composition)
Year 2 • IDL software tools, initially developed for the AEROCOM project, were adapted to allow
easy model intercomparisons. An internet platform, hosted by IPSL was developed to present simultaneously the plots of each modelling team (http://nansen.ipsl.jussieu.fr/cgi-bin/AEROCOM/retro/retro_annualrs.pl)
• Some new diagnostic subroutines were included in the LMDz-INCA. A simulation, designed to intercompare the five models, using ERA-40 meteorology and emissions from the POET project for the year 1997 was performed.
• The analysis of a five year LMDz-INCA simulation data was done to assess the ability of the model in simulating the interannual variability using ERA40 and to quantify the role of biomass burning emission variability. This work was presented at the IGAC Assembly.
Years 3/4 • Comparisons between LMDz-INCA outputs and formaldehyde tropospheric columns retrieved
from GOME measurements were done thanks to a collaboration with a RETRO partner F. Wittrock (University of Bremen).
• LMDz-INCA results and plots were provided for intercomparisons of the years 1997 and 2000.
• Participated in the ACCENT/ IPCC-AR4 modelling studies which included possible scenarios for 2030.
• Climatological biogenic emissions based on the ORCHIDEE vegetation model were provided. • Emissions data, methane forcing, stratospheric climatology and ERA 40 data for the whole 40
years were regridded for use in LMDz-INCA. • The LMDz-INCA 40 year simulation was performed requiring 4 months of computation.
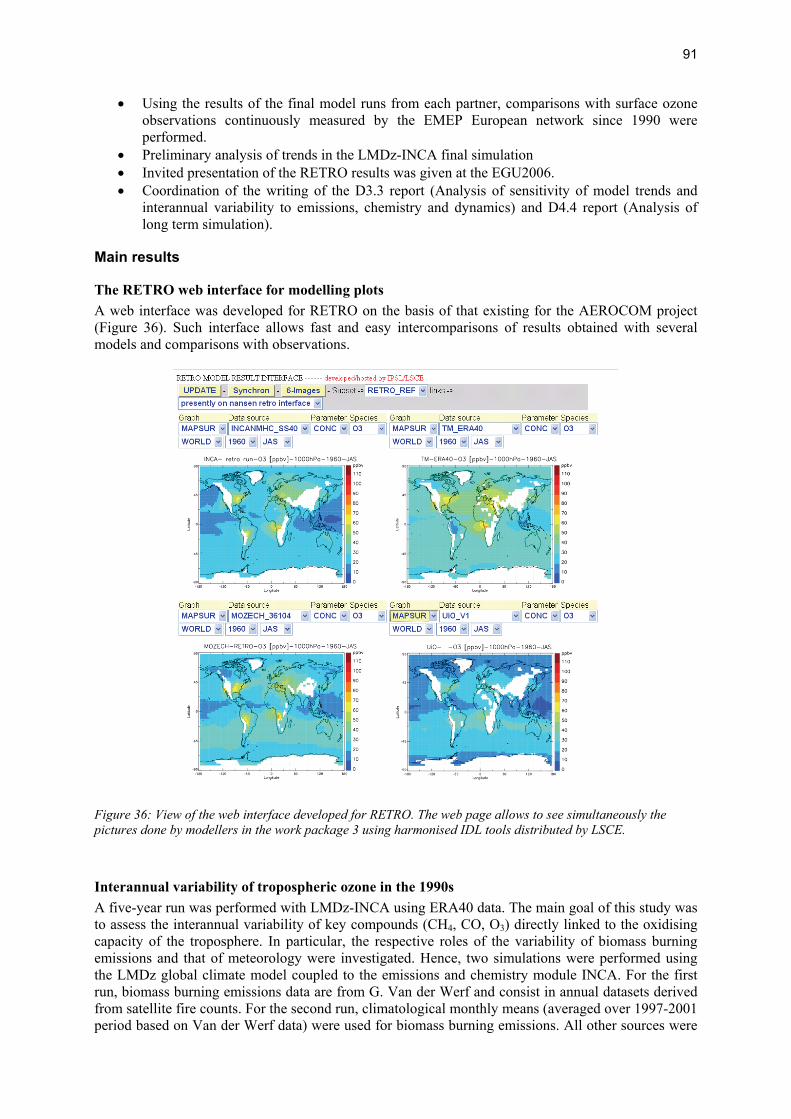
91
• Using the results of the final model runs from each partner, comparisons with surface ozone observations continuously measured by the EMEP European network since 1990 were performed.
• Preliminary analysis of trends in the LMDz-INCA final simulation • Invited presentation of the RETRO results was given at the EGU2006. • Coordination of the writing of the D3.3 report (Analysis of sensitivity of model trends and
interannual variability to emissions, chemistry and dynamics) and D4.4 report (Analysis of long term simulation).
Main results
The RETRO web interface for modelling plots A web interface was developed for RETRO on the basis of that existing for the AEROCOM project (Figure 36). Such interface allows fast and easy intercomparisons of results obtained with several models and comparisons with observations.
Figure 36: View of the web interface developed for RETRO. The web page allows to see simultaneously the pictures done by modellers in the work package 3 using harmonised IDL tools distributed by LSCE.
Interannual variability of tropospheric ozone in the 1990s A five-year run was performed with LMDz-INCA using ERA40 data. The main goal of this study was to assess the interannual variability of key compounds (CH4, CO, O3) directly linked to the oxidising capacity of the troposphere. In particular, the respective roles of the variability of biomass burning emissions and that of meteorology were investigated. Hence, two simulations were performed using the LMDz global climate model coupled to the emissions and chemistry module INCA. For the first run, biomass burning emissions data are from G. Van der Werf and consist in annual datasets derived from satellite fire counts. For the second run, climatological monthly means (averaged over 1997-2001 period based on Van der Werf data) were used for biomass burning emissions. All other sources were

92
kept annually constant throughout the 5 years. This preliminary study allowed to see an important impact due to the interannual variations of biomass burning emissions mainly for CO (see Figure 37) but also for O3. The major impacts are observed closed to the sources, i.e. for tropical latitudes during the 1997-1998 El Nino event or at high northern latitudes during the high boreal fire events in 2000. On the contrary, methane having a long lifetime and being far less emitted by biomass burning than by its other sources, is more influenced by meteorological variations than by biomass burning interannual variability.
Figure 37: Impact of meteorological variability and variability of biomass burning emissions on simulated CO results from LMDz-INCA. Top: LMDzINCA base run using ERA40 data and monthly datasets for biomass burning emissions; center: monthly mean anomalies from the same run with seasonal cycle removed; bottom: variability (monthly mean anomaly) due to meteorological variability only
Analysis of model performance for seasonal variations: Comparison with O3 ground based measurements In order to check the ability of the different 3D global models involved in RETRO to reproduce the seasonal variations of the European surface ozone, their results for the nineties were compared by LSCE with the European EMEP data. For the year 1997, the LMDz-INCA model seems to have the lowest dispersion of the points indicating in particular its ability to reproduce the standard deviation of the ozone observations. The results of the UiO, MOZECH and TM4 models are also fairly good whereas the TOMCAT results are quite scattered with some poor correlations at several stations (details see Annex of deliverable D4-4). The detailed analysis showed that the models reproduce the European 3 daytime filtered ozone with an absolute bias (one year average) ranging between 6.7 and 16 ppbv with the lowest bias obtained with UiO. For all models, except UiO, this corresponds to a positive bias due to overestimation of the ozone mixing ratio. Regarding the standard deviation ratio (smod/sobs), showing the ability of the model to reproduce the amplitude of ozone variations, p-tomcat, TM4 and MOZECH overestimate this ratio
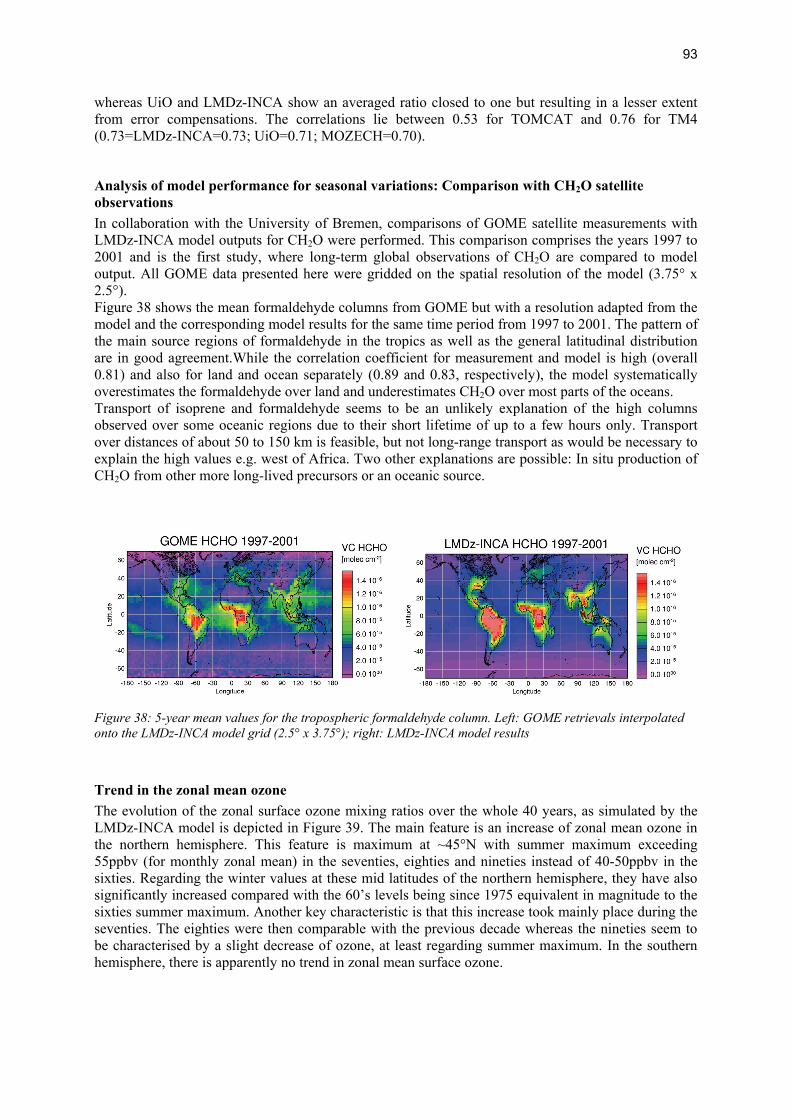
93
whereas UiO and LMDz-INCA show an averaged ratio closed to one but resulting in a lesser extent from error compensations. The correlations lie between 0.53 for TOMCAT and 0.76 for TM4 (0.73=LMDz-INCA=0.73; UiO=0.71; MOZECH=0.70).
Analysis of model performance for seasonal variations: Comparison with CH2O satellite observations In collaboration with the University of Bremen, comparisons of GOME satellite measurements with LMDz-INCA model outputs for CH2O were performed. This comparison comprises the years 1997 to 2001 and is the first study, where long-term global observations of CH2O are compared to model output. All GOME data presented here were gridded on the spatial resolution of the model (3.75° x 2.5°). Figure 38 shows the mean formaldehyde columns from GOME but with a resolution adapted from the model and the corresponding model results for the same time period from 1997 to 2001. The pattern of the main source regions of formaldehyde in the tropics as well as the general latitudinal distribution are in good agreement.While the correlation coefficient for measurement and model is high (overall 0.81) and also for land and ocean separately (0.89 and 0.83, respectively), the model systematically overestimates the formaldehyde over land and underestimates CH2O over most parts of the oceans. Transport of isoprene and formaldehyde seems to be an unlikely explanation of the high columns observed over some oceanic regions due to their short lifetime of up to a few hours only. Transport over distances of about 50 to 150 km is feasible, but not long-range transport as would be necessary to explain the high values e.g. west of Africa. Two other explanations are possible: In situ production of CH2O from other more long-lived precursors or an oceanic source.
Figure 38: 5-year mean values for the tropospheric formaldehyde column. Left: GOME retrievals interpolated onto the LMDz-INCA model grid (2.5° x 3.75°); right: LMDz-INCA model results
Trend in the zonal mean ozone The evolution of the zonal surface ozone mixing ratios over the whole 40 years, as simulated by the LMDz-INCA model is depicted in Figure 39. The main feature is an increase of zonal mean ozone in the northern hemisphere. This feature is maximum at ~45°N with summer maximum exceeding 55ppbv (for monthly zonal mean) in the seventies, eighties and nineties instead of 40-50ppbv in the sixties. Regarding the winter values at these mid latitudes of the northern hemisphere, they have also significantly increased compared with the 60’s levels being since 1975 equivalent in magnitude to the sixties summer maximum. Another key characteristic is that this increase took mainly place during the seventies. The eighties were then comparable with the previous decade whereas the nineties seem to be characterised by a slight decrease of ozone, at least regarding summer maximum. In the southern hemisphere, there is apparently no trend in zonal mean surface ozone.
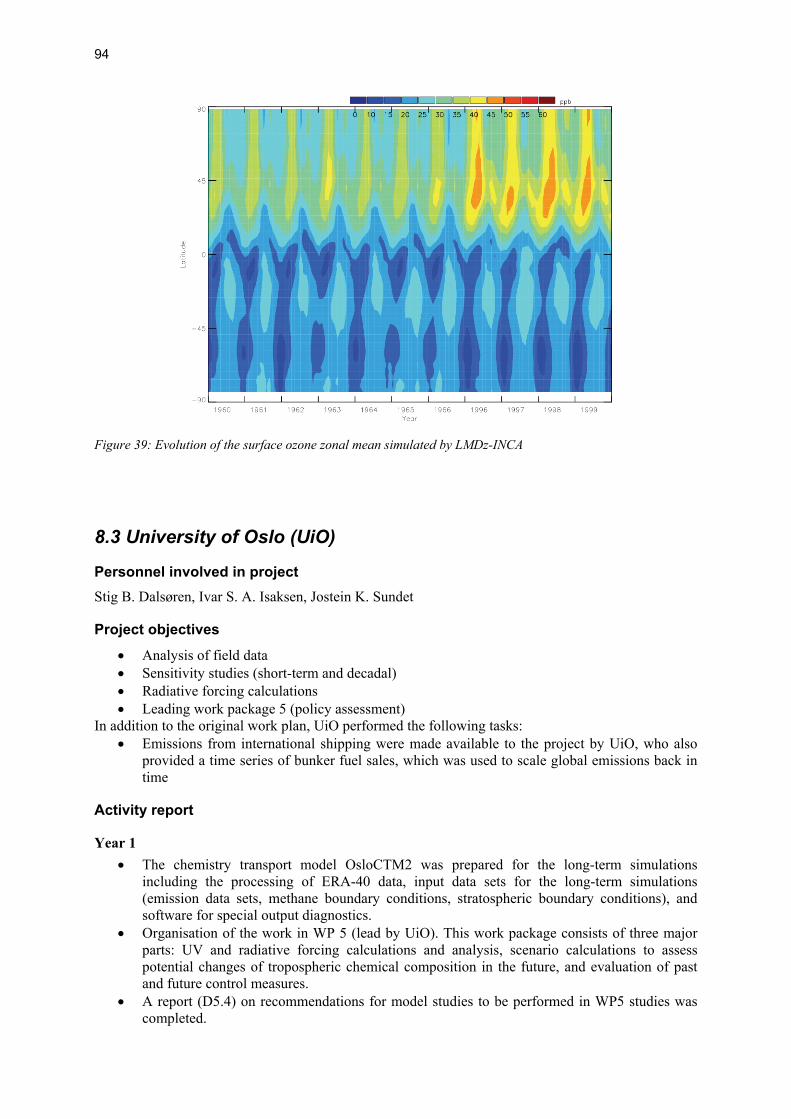
94
Figure 39: Evolution of the surface ozone zonal mean simulated by LMDz-INCA
8.3 University of Oslo (UiO)
Personnel involved in project Stig B. Dalsøren, Ivar S. A. Isaksen, Jostein K. Sundet
Project objectives
• Analysis of field data • Sensitivity studies (short-term and decadal) • Radiative forcing calculations • Leading work package 5 (policy assessment)
In addition to the original work plan, UiO performed the following tasks: • Emissions from international shipping were made available to the project by UiO, who also
provided a time series of bunker fuel sales, which was used to scale global emissions back in time
Activity report
Year 1 • The chemistry transport model OsloCTM2 was prepared for the long-term simulations
including the processing of ERA-40 data, input data sets for the long-term simulations (emission data sets, methane boundary conditions, stratospheric boundary conditions), and software for special output diagnostics.
• Organisation of the work in WP 5 (lead by UiO). This work package consists of three major parts: UV and radiative forcing calculations and analysis, scenario calculations to assess potential changes of tropospheric chemical composition in the future, and evaluation of past and future control measures.
• A report (D5.4) on recommendations for model studies to be performed in WP5 studies was completed.

95
Year 2 • Emissions from international shipping were made available to the project by UiO, who also
provided a time series of bunker fuel sales, which was used to scale global emissions back in time.
• UiO’s participation in WP3 consists of taking part in detailed model-data comparisons of seasonal variations to evaluate model performace using the ERA-40 data set. Another issue is to examine via sensitivity studies the relative importance of meterology and emissions in determining interannual variablility and to analyse the models in the context of data from field campaigns.
• A sensitivity study and intercomparison with models and observations for the period 1997-2000 was done. The Oslo group participated in the discussion and evaluations lead by the partners responsible for the presentations of model and observation comparisons
Years 3/4 • In WP4 UiO together with other RETRO models performed comprehensive global long-term
tropospheric chemistry integrations covering a time period of 4 decades in order to both reproduce and understand the trends and variability of the tropospheric chemical composition. The UiO model performed simulations for the years 1960,1970,1980,1990, 1996-2000.
• For WP5, calculations of UV-doses were made with the results from the OsloCTM2 and TM4 and the report on this deliverable (D5-1) was completed.
• Estimates and a report on composition and impact changes for the European region (D5-3) was made analysing UiO model results from WP4.
• Based on further analysis estimates of radiative forcing due to changes in tropospheric ozone the last four decades were made and reported in D5-2.
• A thorough analysis of past and present policy response to trends in European air pollution (D5.5). The first part (main contributor NILU) of the report consist of an assessment of historical protocols for emission reduction and air quality issues in order to make a detailed analysis of their performance and success in obtaining intended goals. Scenarios for D5-5 were developed (traffic changes/power plant emissions) and gridded emissions datasets based on these scenarios were delivered by TNO. These scenarios were employed in runs for the year 2000 by all models. UiO was lead author of the report and did the analysis of the model results
Main results
Emissions from international ship traffic
Figure 40: Global nitrogen oxide emissions from international ship traffic for the year 2000 from the VERITAS/UiO inventory (left) and temporal trend of these emissions based on bunker fuel sale statistics (right)
0
0.2
0.4
0.6
0.8
1
1.2
1960
1962
1964
1966
1968
1970
1972
1974
1976
1978
1980
1982
1984
1986
1988
1990
1992
1994
1996
1998
2000
Year
norm
aliz
ed g
loba
l bun
ker f
uel s
ales
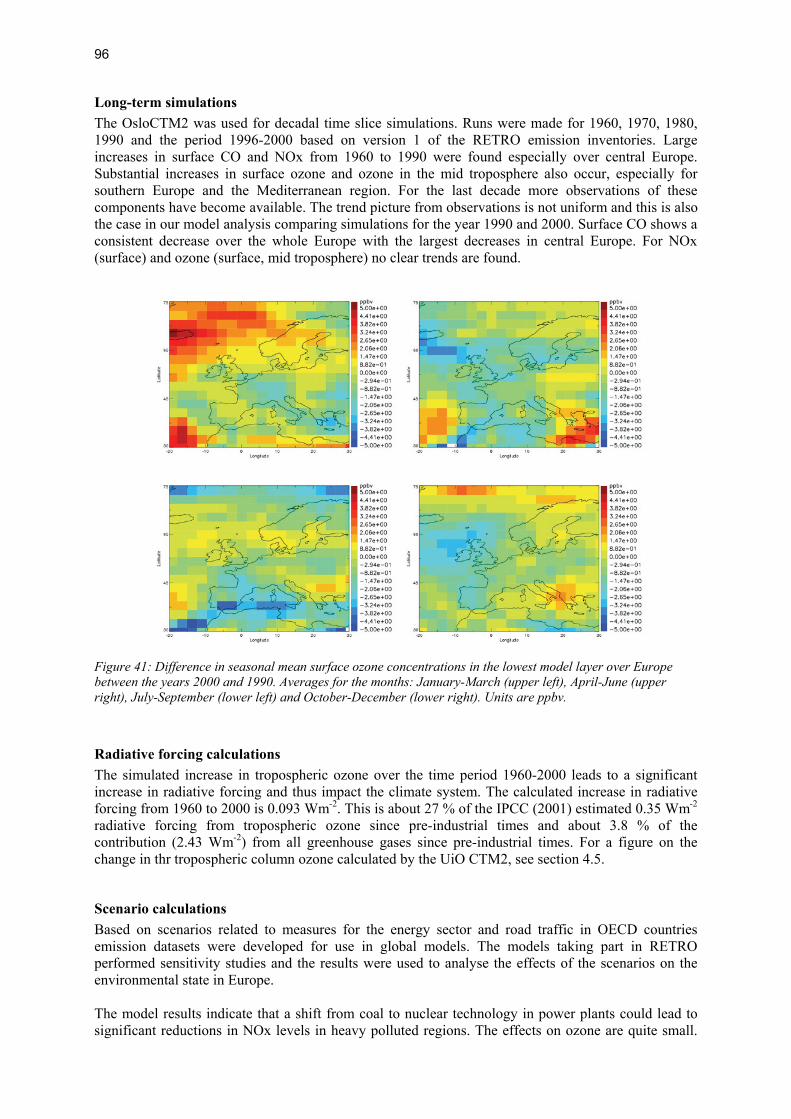
96
Long-term simulations The OsloCTM2 was used for decadal time slice simulations. Runs were made for 1960, 1970, 1980, 1990 and the period 1996-2000 based on version 1 of the RETRO emission inventories. Large increases in surface CO and NOx from 1960 to 1990 were found especially over central Europe. Substantial increases in surface ozone and ozone in the mid troposphere also occur, especially for southern Europe and the Mediterranean region. For the last decade more observations of these components have become available. The trend picture from observations is not uniform and this is also the case in our model analysis comparing simulations for the year 1990 and 2000. Surface CO shows a consistent decrease over the whole Europe with the largest decreases in central Europe. For NOx (surface) and ozone (surface, mid troposphere) no clear trends are found.
Figure 41: Difference in seasonal mean surface ozone concentrations in the lowest model layer over Europe between the years 2000 and 1990. Averages for the months: January-March (upper left), April-June (upper right), July-September (lower left) and October-December (lower right). Units are ppbv.
Radiative forcing calculations The simulated increase in tropospheric ozone over the time period 1960-2000 leads to a significant increase in radiative forcing and thus impact the climate system. The calculated increase in radiative forcing from 1960 to 2000 is 0.093 Wm-2. This is about 27 % of the IPCC (2001) estimated 0.35 Wm-2 radiative forcing from tropospheric ozone since pre-industrial times and about 3.8 % of the contribution (2.43 Wm-2) from all greenhouse gases since pre-industrial times. For a figure on the change in thr tropospheric column ozone calculated by the UiO CTM2, see section 4.5.
Scenario calculations Based on scenarios related to measures for the energy sector and road traffic in OECD countries emission datasets were developed for use in global models. The models taking part in RETRO performed sensitivity studies and the results were used to analyse the effects of the scenarios on the environmental state in Europe. The model results indicate that a shift from coal to nuclear technology in power plants could lead to significant reductions in NOx levels in heavy polluted regions. The effects on ozone are quite small.
97
This is much related to non-linear chemistry and in wintertime all models in fact show a small increase in ozone over central and northeastern Europe. In summer the models indicate reductions that might be of some importance with 0-5 % decrease in the European boundary layer and 1-2.5 % for the tropospheric column. The introduction of nuclear technology would result in a large reduction in nitrate, a component which is readily taken up in precipitation and contributes to acid rain. The introduction of catalysts in road vehicles has had a large impact on the environmental state leading to significant reductions of several air pollutants. If it had not been for catalysts boundary layer concentrations of CO and NOx over much of Europe would have been 10-80 % higher. The large change in ozone precursors also results in improvement of ozone levels especially during summer when the problem is most critical. Without catalysts boundary layer ozone would have been 5-10 ppbv or 10-20 % higher over a large part of Europe. The reduction in nitrate column due to this technological measure is substantial and up to 30-40 %. The potential of further reductions in road traffic related pollutant levels was analysed from a sensitivity study with EURO5 regulations. EURO5 leads to large reductions in NOx, especially in regions with high NOx levels. For CO and hydrocarbons the reductions are lower than those achieved by the introduction of catalytic converters. This results in somewhat lower effects on boundary layer ozone, at least in regions with high NOx levels. On the other hand the ozone reductions are significant and large (above 10 %) in southern Europe, a region suffering from episodes with high surface ozone during summertime. In summertime the decrease in tropospheric ozone column over Europe is also significant and reaches 4-8 %. Large effects are also found for the tropospheric nitrate column. Decreases over Europe typically amount to 15-45 %.
8.4 Royal Netherlands Meteorological Institute (KNMI)
Personnel involved in project Twan van Noije, Peter van Velthoven
Project objectives
• Collection and assessment of satellite observations • Short-term and decadal sensitivity studies • Policy assessment
In extension of the original work plan, KNMI performed the full long-term simulations over the period 1960-2000 with the offline chemistry transport model TM4.
Activity report
• Analysis of stratosphere-troposphere exchange in models driven by ERA-40. Improvement of the stratospheric boundary condition in tropospheric chemistry models (van Noije et al., 2004; 2006a).
• Planning of the long-term simulations [contribution to D4-1] • Preliminary and sensitivity simulations with the tropospheric chemistry version of the TM4
model [contribution to D3-2, D3-3]. • Long-term simulation of the tropospheric composition with TM4 [contribution to D2-6, D3-2,
D4-4]. • Analysis of trends and interannual variability in the tropospheric budget, burden and lifetime
of O3, the tropospheric burden of CO, the tropospheric concentration of OH, and the atmospheric chemical lifetime of CH4 from the long-term simulations of the models participating in the project [contribution to D4-4].
• Comparison of tropospheric NO2 columns from the models participating in the project with GOME observations for the period 1997–2000. Analysis of trends and interannual variability

98
over continental regions affected by pollution from anthropogenic activities and/or biomass burning [contribution to D2-6, D4-4].
Main results
Analysis of the implications of the enhanced Brewer-Dobson circulation on the stratosphere-troposphere exchange in a chemistry transport model Although the ERA-40 reanalysis is in many respects superior to earlier reanalysis data sets, serious problems of bias and inhomogeneities related to changes in the observing system have been identified. As an early contribution to the RETRO project, we demonstrated on the basis of an analysis for the year 1997 that the Brewer-Dobson circulation in ERA-40 is strongly enhanced compared to other meteorological data (van Noije et al., 2004). The impact of this enhanced circulation on the downward transport of ozone to the lowermost stratosphere and the troposphere was investigated using a simple model with linearized ozone (Linoz) chemistry in the stratosphere and upper troposphere. The resulting ozone fluxes across the 100-hPa level were found to be 2–3 times above the range 450–590 Tg/yr estimated by Gettelman et al. (1997) on the basis of observations. To evaluate the quality and temporal consistency of the large-scale Brewer-Dobson circulation in meteorological data from the ECMWF, we later calculated longer time series of the stratosphere-troposphere exchange of ozone using the same model setup (van Noije et al., 2006a). Simulations were performed with the 45-year reanalysis ERA-40 and with operational data for the period November 1999 to March 2005. In both hemispheres the ozone exchange fluxes are generally higher with ERA-40 than OD (see Figure 19 in section 4.4). Moreover, the ozone flux simulated with reanalyzed meteorological fields shows a marked discontinuity around the beginning of the year 1973, when the first satellite observations were introduced into the ERA-40 assimilation system. Already in the pre-satellite period the downward transport of ozone simulated with ERA-40 is generally somewhat faster than expected on the basis of the operational data for more recent years. After the introduction of satellite data the discrepancy becomes much more pronounced, particularly in the Northern Hemisphere. The impact of satellite data was further investigated using meteorological fields from an experimental run of the ERA-40 system in which the pre-satellite stream was extended through withdrawal of VTPR radiances during the first three months of 1973. On the basis of these data it was demonstrated that the enhancement of the circulation in the later period of the reanalysis is indeed caused by the insertion of satellite observations into the ERA-40 assimilation system (Figure 42).
Figure 42: Time series of the monthly net ozone flux at 100 hPa obtained with the official ERA-40 data set (thin lines) and with meteorological data from a run of the ERA-40 system in which no satellite data were assimilated for the months January–March 1973 (thick lines).
99
To study how the circulation in the ERA-40 and operational assimilation systems responds to the data insertion and readjusts to restore dynamical balance during forecast mode, we calculated the corresponding ozone fluxes for the year July 2001–June 2002 using winds from a range of forecasts with different forecast times and update frequencies. For the operational model we found that the strength of the large-scale circulation in both hemispheres equilibrates as a function of forecast time, but in an oscillating fashion. The corresponding global total downward ozone fluxes are in reasonable agreement with the observational estimates, especially for longer forecast times. For the ERA-40 reanalysis, on the other hand, the circulation during forecast mode becomes weaker all the time, but remains significantly stronger than in the operational system. The use of ERA-40 in chemistry-transport models therefore requires reconsideration of the stratospheric boundary conditions for various chemical constituents. Different methods were evaluated to simulate the downward transport of stratospheric ozone in tropospheric chemistry-transport models driven by ERA-40 meteorology. We concluded that it is necessary to constrain the ozone concentrations in the lower stratosphere by relaxation to climatology. If ozone is relaxed down to 100 hPa in the extratropics, the net downward transport of ozone during 1997 is reduced by more than a factor 2. The use of forecast winds aids to further reduce the transport of ozone into the lowermost stratosphere and the troposphere to more realistic values. It has the additional advantage that the stratosphere-troposphere exchange of chemical constituents other than ozone is improved concurrently. We evaluated the performance of the full chemistry version of our tropospheric chemistry transport model TM4 driven by the ERA-40 reanalysis by comparing the output for the year 2000 with an identical simulation driven by operational data from the ECMWF for the same year. The impact of the enhanced Brewer-Dobson circulation in ERA-40 is most pronounced in the extratropical upper troposphere, where ozone levels may be overpredicted by more than 25%.
Sensitivity studies Other sensitivity studies that we performed in the coarse of the RETRO project focused on the interannual variability due to meteorology, the resolution dependence, and on the impact of releasing the emissions from biomass burning above the model surface level. Specifically, we performed a multi-year simulation covering the period 1997-2000 with emissions fixed to the values estimated for the year 1997 within the EU project POET. The results from this run were presented at the RETRO meeting in Helsinki. The resolution dependence of the model was investigated by changing the horizontal grid from 6o x 4o to 3o x 2o. To test the impact of applying the emission height profile provided for the long-term simulations, we also performed a simulation for 1995–2000 with fire emissions released at the surface (see the section on the Indonesian fires in D3-2). For the long-term simulations we set up a version of the TM4 model following the specifications of the ‘Planning document on long-term simulations’ (D4-1). With this setup the model was run for the period 1960–2000 using the ERA-40 reanalysis as well as for the year 2000 using operational data from the ECMWF as meteorological input. Results from the long-term simulations are presented in the ‘Analysis of model performance for seasonal variations’ (D3-2) as well as in the ‘Report on process studies’ (D3-4), which includes an analysis of the stratospheric intrusion event during February 1997, of the long-range transport of a NOx plume from the Highveld region in South Africa across the Indian Ocean, and of the 1997 Indonesian wildfire event. For the analysis of surface UV trends we provided daily tropospheric ozone columns from this simulation. We also analyzed the tropospheric budget, burden and lifetime of ozone, the tropospheric burden of CO, the tropospheric concentration of OH, as well as the atmospheric chemical lifetime of CH4 from our model run as well as from the long-term simulations of the other models participating in the project. The results of this analysis are described in the ‘Technical description of the reanalysis simulations and comparison with observations including assessment of sector and region contributions’ (D4-4).
Evaluation of tropospheric NO2 column densities using multiple satellite retrievals Moreover, we performed an analysis based on the GOME NO2 retrieval by BIRA/KNMI to investigate the extent and causes of variability of NO2 concentrations during the 1990s. To systematically evaluate

100
the models with the retrieval, the modelled 10:30 local time NO2 columns were sampled at the time and place of the observations. The method of comparison is described in detail by van Noije et al. (2006b), who also present an intercomparison of different GOME retrieval products for the year 2000. In Figure 43 we present maps of the annual mean tropospheric NO2 column densities for 1997 and 2000, comparing the BIRA/KNMI retrieval with the ensemble mean of the RETRO models (LMDz-INCA, MOZECH, p-TOMCAT, TM4, and UiO-CTM2). We analyzed the seasonal and interannual variability for various continental regions. The results from this study are described in the ‘Report describing the collection and use of observations in RETRO’ (D2-6).
Figure 43: Retrieved and modelled annual mean tropospheric NO2 column densities for 1997 and 2000. The annual means are constructed by equal weighting of all scenes retrieved during the year.
8.5 University of Cambridge (UCamb)
Personnel involved in project Prof. J.A. Pyle, Dr N.H. Savage
Project objectives
• Leading work package 3 (model performance and sensitivity studies) • Analysis of field data • Sensitivity studies (short-term and decadal) • Policy assessment • Tool development
Activity report
Year 1 • Available software tools for data analysis and model intercomparison were assessed and
collected on a central web site. • The p-TOMCAT model was adapted for use of ERA-40 meteorology, and some new
diagnostic subroutines were included. The first results of the p-TOMCAT model using ERA-40 meteorology and emissions from the POET project for the year 1997 were performed.
• Using data from all the RETRO models an initial intercomparison was performed. The years 1997 and 2000 were selected for initial intercomparison activities as in both of these years

101
data from several large field campaigns as well as satellite data and long term data sets from surface networks and ozonesondes are available.
Year 2 • The University of Cambridge organised a workshop on model validation and contributed to
improved methods for model comparison. • The results from the p-TOMCAT model were improved by the use of ECMWF forecast data
rather than analyses. • As well as and also leading the model validation studies, a draft report on the validation of the
models was written and circulated as well as presenting early results on these model comparisons at the EGU 1st General Assembly.
• The first work on process studies was begun with preliminary work to enable the use of daily GOME NO2 data for model studies.
• Participated in the ACCENT/ IPCC-AR4 modelling studies which included possible scenarios for 2030.
Years 3/4 • The tools for the analysis of model output were further improved and adapted to RETRO
needs. • A new set of plots and statistics for the models was produced and a new draft of D3-2 has
been circulated to all modeling groups in time for the Zurich work meeting. • The new validation codes were run on the period 1997-2000 from the final output of all
models and the results analyzed and written up in deliverable D3-2. • Work on sensitivity studies was carried out using the p-TOMCAT model of interannual
variability in the period from 1996-2000 studied with the RETRO emissions and GOME NO2. An initial version of this work was presented at the ACCENT symposium in Urbino (Sept. 2005). It was subsequently extended, presented at the EGU annual assembly in Vienna and a report written as a section for the deliverable D3-3.
• Using the results of the final model runs a series of process studies were carried out including analysing a possible stratospheric intrusion at Mauna Loa, an long range transport event from South Africa and an analysis of the large biomass burning event in Indonesia in 1997. These were written up in deliverable D3-4.
Main results
Tools for regridding and visualisation of model results (D3-1) This was delivered via the RETRO website. A large collection of links to tools were publicised through this website allowing the partners to evaluate the most appropriate. IDL codes, observations and the model results used to do the validation in D3-2 were collected together and uploaded to the RETRO ftp site to ensure that all partners are able to reuse these tools and to ensure that they can provided to other users if requested.
Analysis of model performance for seasonal variations (D3-2) The model performance was evaluated with surface concentrations of ozone from CMDL, ozone profiles from WOUDC ozonesondes and surface concentrations of CO from the 1997 to 2000 period. Figure 44 shows an example of a plot from the report comparing the models monthly mean surface CO concentrations to observations. In addition the concentrations of key species and the ozone budgets in the models were intercompared. These results were all presented in the D3-2 report. The overall conclusions of this report were that although there are some problems related to stratosphere-troposphere exchange when using the ERA-40 data set the model performance when validated against data indicates that with careful treatment of the top-boundary condition it is possible to use this data for chemistry-transport modelling with a performance comparable to that in previous studies. Model results vary widely and the models cannot achieve an objective of being within 20% of

102
observations much of the time. However a standard set of data and methods for comparison such as those presented here would allow progress in global tropospheric chemistry modelling to be monitored and give an objective way of evaluating future model developments.
Figure44: Year-1997 Surface CO concentrations at Ascension Island (ASC) [from D3-2]. Model results from a preliminary set-up
Analysis of sensitivity of model trends and interannual variability to emissions, chemistry and dynamics (D3-3) Two main studies were carried out to contribute to this deliverable: a study on sensitivity to ERA40 meteorology and operational data and a comparison of the sensitivity to interannual variations in meteorology and emissions. The figure below shows some results from the second of these studies. Most of the variability in NO2 columns over regions impacted by biomass burning comes from variations in emissions – elsewhere the interannual variability can be as large but comes not from emissions but interannual variability in meteorology. The broad features of the GOME interannual variability are captured by the model giving confidence in the results.
Figure 45: Standard deviation of the tropospheric NO2 columns from GOME (upper left) and various p-TOMCAT simulations for JFM relative to five year means.

103
Report on process studies (D3-4) In order to evaluate the ability of the models to simulate tropospheric composition on shorter timescales the following case studies were performed: a comparison with ozone data a Mauna Loa in the period of a very strong stratospheric intrusion; an evaluation of a specific long range transport event observed using GOME and the massive East Asian fires which occurred in 1997.
8.6 Norwegian Institute for Air Research (NILU)
Personnel involved in project Aasmund Fahre Vik, Sjur Bjørndalsæter, Cristoffer Stoll, Jozef Pacyna, Damian Panasiuk
Project objectives
• Leading work package 2 (collection and use of observations) • Setup and maintenance of data archive • Tool development, data reformatting • Policy assessment: Analysis of the past performance of air quality and emission reduction
within EU and UN ECE regions
Activity report
WP2 • Demonstrator of data centre was set up and a plan for delivery of a final project data archive
was made. This included agreements of common metadata definitions and file format. • The Retro data centre for observational data was developed and presented at the project
meeting in Helsinki. • Data from several data archives were converted to the agreed format and uploaded to the data
centre. • Reports describing the data centre, the data and recommendations for future developments of
atmospheric data centres and for future monitoring were provided.
WP5 • First initial review of European past and present policy concerning air pollution was provided.
Results were presented on project meeting in Helsinki. • Next description of international conventions and EU directives concerning emissions and
concentration of NOx, VOC, CO, CH4, ozone and SO2 since 1970 to 2005 have been prepared in report „Review of past and present legislation concerning reduction of air pollution in Europe”. Protocols and directives concerning national emission ceilings, emissions from large combustion plants and motor vehicles was the main target of review.
Main results WP2 The main objectives of the use and collection of observations are twofold within RETRO. Firstly, the observations have been used to evaluate models and to define the stratospheric boundary conditions. Secondly, long-term trends were established directly from observations. For these two purposes, measurements from satellites, aircrafts, ozone sondes and the surface were collected in a data base at NILU. A preliminary web-portal, providing observational data for RETRO, was set up at NILU during the first year of the project. This site was both a feasibility study for testing out methods of providing data
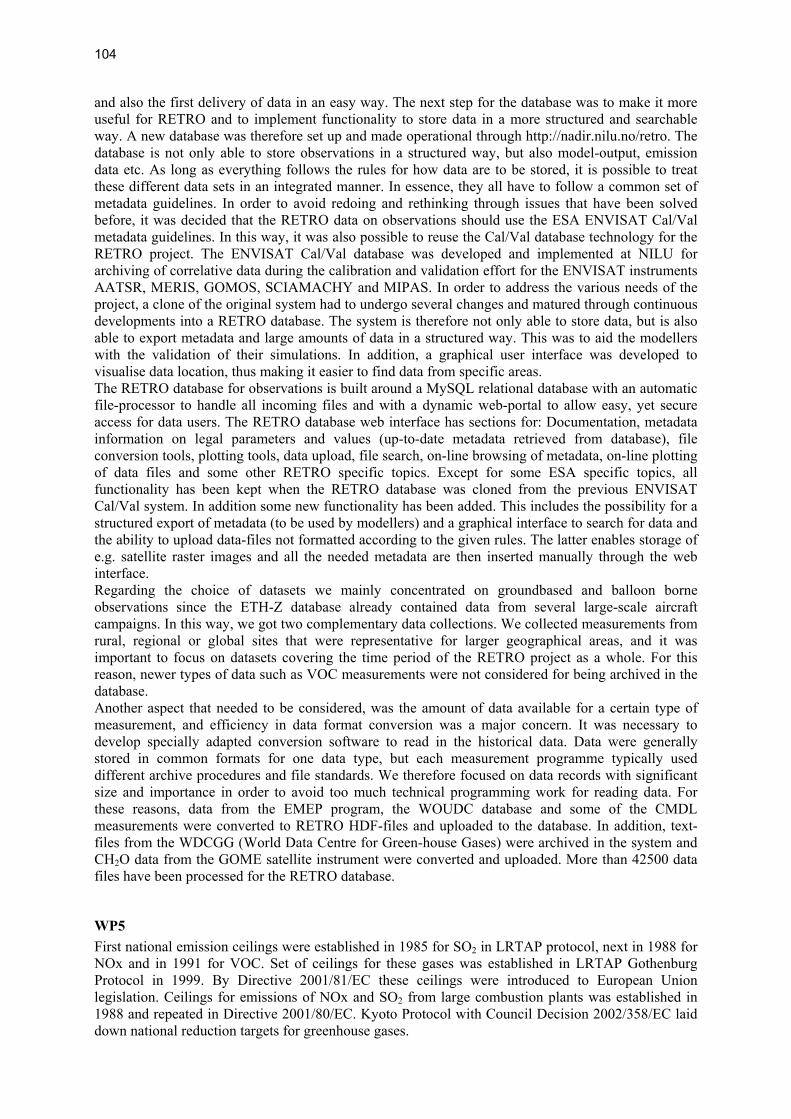
104
and also the first delivery of data in an easy way. The next step for the database was to make it more useful for RETRO and to implement functionality to store data in a more structured and searchable way. A new database was therefore set up and made operational through http://nadir.nilu.no/retro. The database is not only able to store observations in a structured way, but also model-output, emission data etc. As long as everything follows the rules for how data are to be stored, it is possible to treat these different data sets in an integrated manner. In essence, they all have to follow a common set of metadata guidelines. In order to avoid redoing and rethinking through issues that have been solved before, it was decided that the RETRO data on observations should use the ESA ENVISAT Cal/Val metadata guidelines. In this way, it was also possible to reuse the Cal/Val database technology for the RETRO project. The ENVISAT Cal/Val database was developed and implemented at NILU for archiving of correlative data during the calibration and validation effort for the ENVISAT instruments AATSR, MERIS, GOMOS, SCIAMACHY and MIPAS. In order to address the various needs of the project, a clone of the original system had to undergo several changes and matured through continuous developments into a RETRO database. The system is therefore not only able to store data, but is also able to export metadata and large amounts of data in a structured way. This was to aid the modellers with the validation of their simulations. In addition, a graphical user interface was developed to visualise data location, thus making it easier to find data from specific areas. The RETRO database for observations is built around a MySQL relational database with an automatic file-processor to handle all incoming files and with a dynamic web-portal to allow easy, yet secure access for data users. The RETRO database web interface has sections for: Documentation, metadata information on legal parameters and values (up-to-date metadata retrieved from database), file conversion tools, plotting tools, data upload, file search, on-line browsing of metadata, on-line plotting of data files and some other RETRO specific topics. Except for some ESA specific topics, all functionality has been kept when the RETRO database was cloned from the previous ENVISAT Cal/Val system. In addition some new functionality has been added. This includes the possibility for a structured export of metadata (to be used by modellers) and a graphical interface to search for data and the ability to upload data-files not formatted according to the given rules. The latter enables storage of e.g. satellite raster images and all the needed metadata are then inserted manually through the web interface. Regarding the choice of datasets we mainly concentrated on groundbased and balloon borne observations since the ETH-Z database already contained data from several large-scale aircraft campaigns. In this way, we got two complementary data collections. We collected measurements from rural, regional or global sites that were representative for larger geographical areas, and it was important to focus on datasets covering the time period of the RETRO project as a whole. For this reason, newer types of data such as VOC measurements were not considered for being archived in the database. Another aspect that needed to be considered, was the amount of data available for a certain type of measurement, and efficiency in data format conversion was a major concern. It was necessary to develop specially adapted conversion software to read in the historical data. Data were generally stored in common formats for one data type, but each measurement programme typically used different archive procedures and file standards. We therefore focused on data records with significant size and importance in order to avoid too much technical programming work for reading data. For these reasons, data from the EMEP program, the WOUDC database and some of the CMDL measurements were converted to RETRO HDF-files and uploaded to the database. In addition, text-files from the WDCGG (World Data Centre for Green-house Gases) were archived in the system and CH2O data from the GOME satellite instrument were converted and uploaded. More than 42500 data files have been processed for the RETRO database.
WP5 First national emission ceilings were established in 1985 for SO2 in LRTAP protocol, next in 1988 for NOx and in 1991 for VOC. Set of ceilings for these gases was established in LRTAP Gothenburg Protocol in 1999. By Directive 2001/81/EC these ceilings were introduced to European Union legislation. Ceilings for emissions of NOx and SO2 from large combustion plants was established in 1988 and repeated in Directive 2001/80/EC. Kyoto Protocol with Council Decision 2002/358/EC laid down national reduction targets for greenhouse gases.
105
In EU legislation first emission limit values were established for passenger cars in 1970 for hydrocarbons and CO. In 1975 sulphur content of liquid fuels was defined first time. In 1977 limit values for motor vehicles were completed for NOx. In 1988 first limit values for emissions of NOx, hydrocarbons and CO from heavy duty vehicles were established. Emissions from mobil sources were changed many times in 90-ties when standards called Euro I, II, III, IV and V were established. Directive 1999/96/EC established also limit values for emission of CH4 from gas engines. First limit values for emissions of NOx and SO2 from large combustion plants were established in 1988. In next year it was done for CO and SO2 for waste incineration plants and in 1994 for incineration of hazardous wastes. Directives 2001/80/EC and 2000/76/EC are recent EU legislation. Directives concerning emissions of VOC from stationary sources are implemented since 1994. Concentration of gases in ambient air was defined first time by EU directives for SO2 in 1980 and next for NO2 in 1985. In 1992 first standards for ozone were established. Daughter directives to 96/62/EC laid down new standards to implement by 2005 for CO and SO2 and by 2010 for NOx and ozone. The LRTAP Gothenburg Protocol also applied a set of emission limit values for NOx, VOC, CO and SO2.
8.7 University of Bremen (IUP) Institute of Remote Environmental Physics and Remote Sensing
Personnel involved in project Annette Ladstätter-Weißenmayer, Hilke Oetjen, Andreas Richter, Folkard Wittrock
Project objectives
• Extend analysis of GOME data (NO2, CH2O, ozone) for several years in the 1990s • Provide GOME stratospheric ozone column climatology for 1995-2000
The overall objective of partner 7’s work was to obtain a better knowledge of the concentrations and the global distribution of the tropospheric trace gases nitrogen dioxide (NO2) and (CH2O) formaldehyde. In order to accomplish this, algorithms for the retrieval of NO2 and CH2O were developed for the GOME instrument. Since for long-term satellite observations validation is crucial, similar algorithms were developed for ground-based instruments and results were compared. In contrast to the original description of work, it was decided to skip the development of a tropospheric ozone product. Existing methods such as FURM (Full Retrieval Method) and TEM (Tropospheric Excess Method) were found to be not accurate enough to fulfil the projects quality criteria. On the other hand, in the last year of the project, it was possible to retrieve for the first time tropospheric columns of the trace gas glyoxal from space (SCIAMACHY).
Activity report
Year 1 • Development of an improved CH2O algorithm for the creation of a consistent data set for the
entire GOME time series. • Quality check for the existing GOME NO2 algorithm.
Year 2 • Development of SCIAMACHY CH2O and NO2 algorithms in order to extend the GOME time
series. • Development of retrieval algorithms for ground-based instruments to provide validation data
sets for the satellite results.
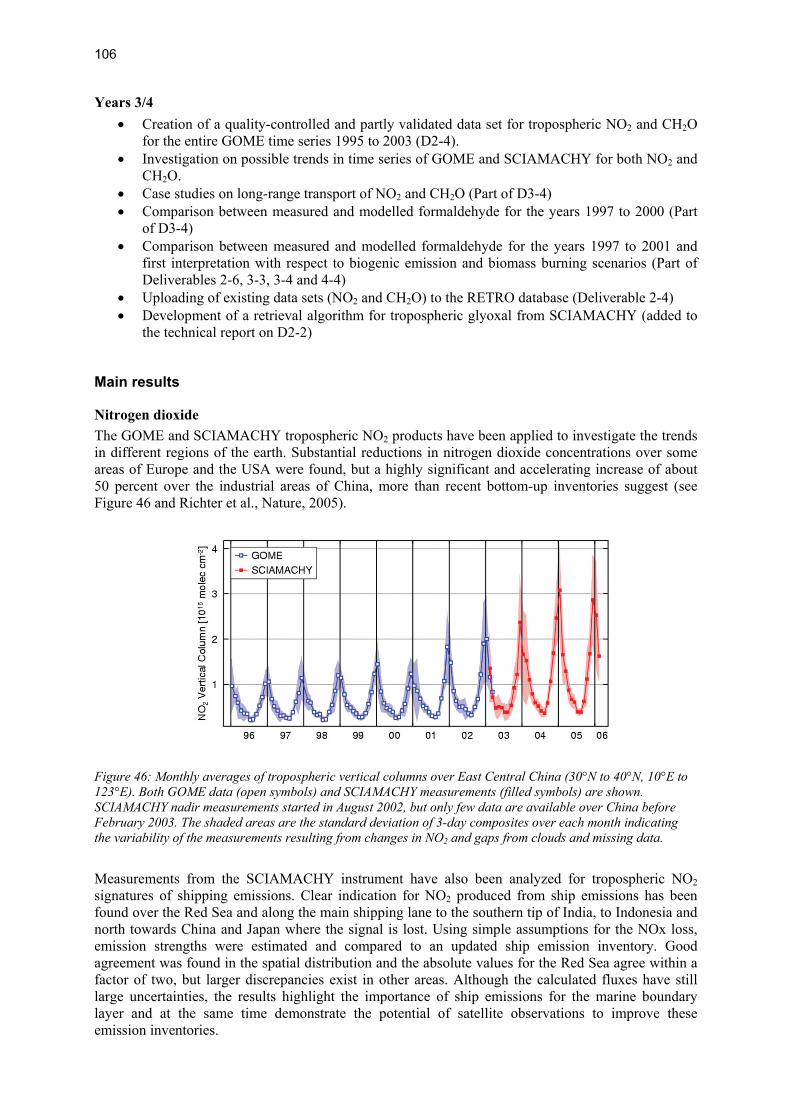
106
Years 3/4 • Creation of a quality-controlled and partly validated data set for tropospheric NO2 and CH2O
for the entire GOME time series 1995 to 2003 (D2-4). • Investigation on possible trends in time series of GOME and SCIAMACHY for both NO2 and
CH2O. • Case studies on long-range transport of NO2 and CH2O (Part of D3-4) • Comparison between measured and modelled formaldehyde for the years 1997 to 2000 (Part
of D3-4) • Comparison between measured and modelled formaldehyde for the years 1997 to 2001 and
first interpretation with respect to biogenic emission and biomass burning scenarios (Part of Deliverables 2-6, 3-3, 3-4 and 4-4)
• Uploading of existing data sets (NO2 and CH2O) to the RETRO database (Deliverable 2-4) • Development of a retrieval algorithm for tropospheric glyoxal from SCIAMACHY (added to
the technical report on D2-2)
Main results
Nitrogen dioxide The GOME and SCIAMACHY tropospheric NO2 products have been applied to investigate the trends in different regions of the earth. Substantial reductions in nitrogen dioxide concentrations over some areas of Europe and the USA were found, but a highly significant and accelerating increase of about 50 percent over the industrial areas of China, more than recent bottom-up inventories suggest (see Figure 46 and Richter et al., Nature, 2005).
Figure 46: Monthly averages of tropospheric vertical columns over East Central China (30°N to 40°N, 10°E to 123°E). Both GOME data (open symbols) and SCIAMACHY measurements (filled symbols) are shown. SCIAMACHY nadir measurements started in August 2002, but only few data are available over China before February 2003. The shaded areas are the standard deviation of 3-day composites over each month indicating the variability of the measurements resulting from changes in NO2 and gaps from clouds and missing data.
Measurements from the SCIAMACHY instrument have also been analyzed for tropospheric NO2 signatures of shipping emissions. Clear indication for NO2 produced from ship emissions has been found over the Red Sea and along the main shipping lane to the southern tip of India, to Indonesia and north towards China and Japan where the signal is lost. Using simple assumptions for the NOx loss, emission strengths were estimated and compared to an updated ship emission inventory. Good agreement was found in the spatial distribution and the absolute values for the Red Sea agree within a factor of two, but larger discrepancies exist in other areas. Although the calculated fluxes have still large uncertainties, the results highlight the importance of ship emissions for the marine boundary layer and at the same time demonstrate the potential of satellite observations to improve these emission inventories.
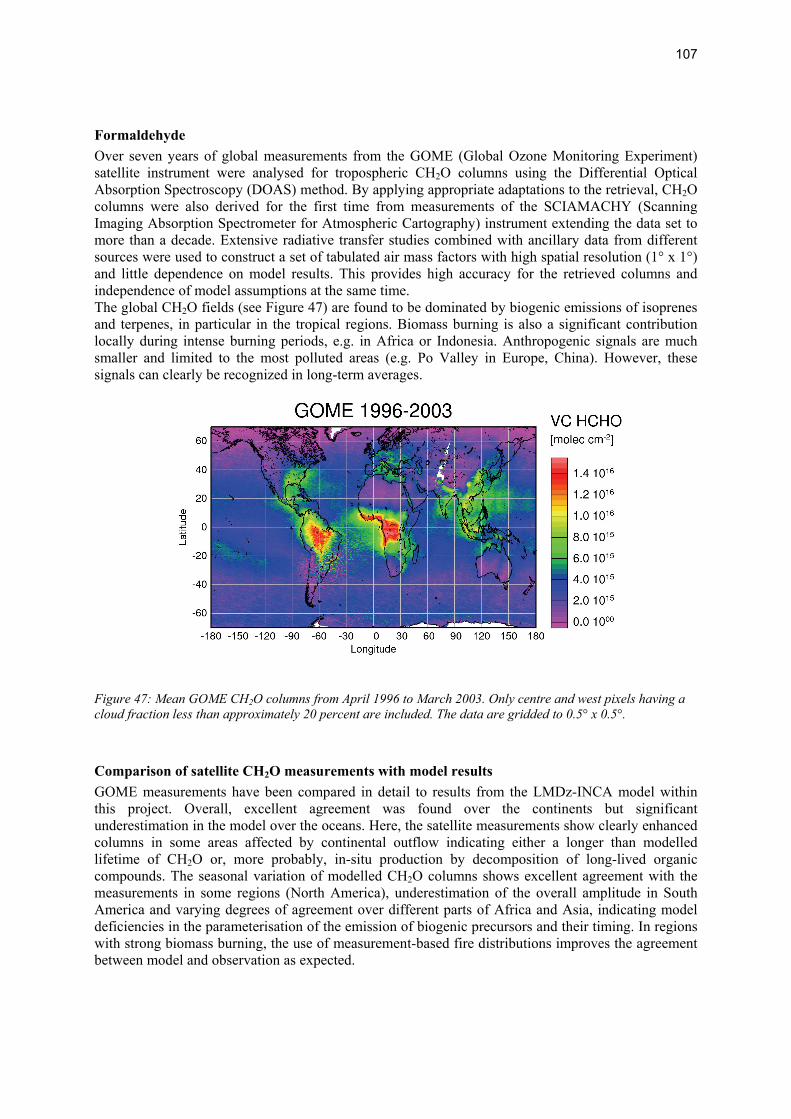
107
Formaldehyde Over seven years of global measurements from the GOME (Global Ozone Monitoring Experiment) satellite instrument were analysed for tropospheric CH2O columns using the Differential Optical Absorption Spectroscopy (DOAS) method. By applying appropriate adaptations to the retrieval, CH2O columns were also derived for the first time from measurements of the SCIAMACHY (Scanning Imaging Absorption Spectrometer for Atmospheric Cartography) instrument extending the data set to more than a decade. Extensive radiative transfer studies combined with ancillary data from different sources were used to construct a set of tabulated air mass factors with high spatial resolution (1° x 1°) and little dependence on model results. This provides high accuracy for the retrieved columns and independence of model assumptions at the same time. The global CH2O fields (see Figure 47) are found to be dominated by biogenic emissions of isoprenes and terpenes, in particular in the tropical regions. Biomass burning is also a significant contribution locally during intense burning periods, e.g. in Africa or Indonesia. Anthropogenic signals are much smaller and limited to the most polluted areas (e.g. Po Valley in Europe, China). However, these signals can clearly be recognized in long-term averages.
Figure 47: Mean GOME CH2O columns from April 1996 to March 2003. Only centre and west pixels having a cloud fraction less than approximately 20 percent are included. The data are gridded to 0.5° x 0.5°.
Comparison of satellite CH2O measurements with model results GOME measurements have been compared in detail to results from the LMDz-INCA model within this project. Overall, excellent agreement was found over the continents but significant underestimation in the model over the oceans. Here, the satellite measurements show clearly enhanced columns in some areas affected by continental outflow indicating either a longer than modelled lifetime of CH2O or, more probably, in-situ production by decomposition of long-lived organic compounds. The seasonal variation of modelled CH2O columns shows excellent agreement with the measurements in some regions (North America), underestimation of the overall amplitude in South America and varying degrees of agreement over different parts of Africa and Asia, indicating model deficiencies in the parameterisation of the emission of biogenic precursors and their timing. In regions with strong biomass burning, the use of measurement-based fire distributions improves the agreement between model and observation as expected.

108
Glyoxal (CHOCHO) Global fields of glyoxal (CHOCHO) columns have been derived from SCIAMACHY measurements. This is the first detection of CHOCHO in SCIAMACHY data, and the first global data set of CHOCHO available. The global distribution of glyoxal is found to be similar to that of CH2O and both the absolute values and the ratio to CH2O are of the expected magnitude. Over some regions of the oceans, SCIAMACHY CHOCHO columns are significantly enhanced and so far it is not clear if this is real or indicates an unresolved problem in the data analysis. With these results, global measurements of another relevant atmospheric hydrocarbon have become available for validation of model results.
Improvements of ground-based scattered light measurements To improve the sensitivity of ground-based DOAS observations to tropospheric absorbers, the instruments of the BREDOM network were modified to take not only zenith-sky, but also horizon-viewing measurements (Multi Axis DOAS or MAX-DOAS). This technical development in combination with extensive radiative transfer studies modelling the sensitivity and its dependence on boundary conditions (viewing geometry, surface albedo, aerosol loading) greatly enhanced the usefulness of this type of measurements. Development of a profile retrieval algorithm for ground-based MAX-DOAS measurements: Based on the sensitivity studies mentioned above, an automated optimal estimation based profile retrieval algorithm (BREAM) was developed for MAX-DOAS measurements. This method first determines appropriate aerosol settings using measurements of the O4 columns and then inverts the profile of the absorber of interest, e.g. NO2, CH2O, or CHOCHO. Depending on measurement conditions, 2 to 4 pieces of information can be retrieved, and in addition the optical aerosol depth. Results from the retrieval have been validated by comparison with independent measurements during two campaigns for NO2, CH2O, and aerosol depth, and good agreement was found. This constitutes a major improvement for the application of passive DOAS measurements, and due to its automated operation has the potential to complement existing in-situ and active DOAS measurements.
MAX-DOAS measurements of CH2O and CHOCHO and application to satellite validation MAX-DOAS measurements have been analyzed for CH2O and for the first time, also for CHOCHO, and the results compared to the satellite data. The diurnal variation of the two species is similar, indicating common sources. In the vicinity of anthropogenic emissions, CH2O shows larger variability, probably as a result of direct emissions which are thought to be negligible for CHOCHO. Even at the high altitude stations (Mérida and Zugspitze), CH2O could be detected, albeit at low concentrations. This and the profiles retrieved confirm other measurements that showed negative gradients of CH2O with altitude. The vertical profiles retrieved for CH2O and CHOCHO are similar, underlining again the link between these two reactive hydrocarbons.
8.8. Swiss Federal Institute of Technology (ETH-Z)
Personnel involved in project Prof. Johannes Staehelin, Dr. Christina Schnadt Poberaj
Project objectives
• Synthesis of historic ozone observations including search for unexploited data sets and quality assessment
• Analysis of long-term ozone trends The objective of Work Package 2 task 3 was to analyse the evolution of tropospheric ozone since the second world war. Existing historic ozone records including early aircraft measurements from the 1950s, the German TROZ project in the 1960s, NASA’s GASP program of the 1970s, MOZAIC

109
aircraft data from the 1990s, and long-term time series from balloon stations had to be used to deduce long-term changes.
Activity report
Year 1 • Identification of historic measurement data sets • Quality assessment of Payerne ozone sonde data
Year 2 CTM model evaluation using ozonesonde data As part of the test of model performance of the RETRO CTMs (MOZECH, p-TOMCAT, TM4, LMDzINCA, Oslo CTM2), model results were compared to ozonesonde data. For model evaluation, sensitivity simulations forced by ERA40 analyses were carried out for the year 1997. Ozonesonde stations considered in the comparison were Kagoshima, Sapporo, Tateno, Edmonton, Resolute, Goose Bay, Churchill, Hohenpeissenberg, Wallops Island, Payerne, and Lauder. All comparisons of model results with observations were calculated using monthly mean observations with the model results filtered to remove the days without observations. Several statistical measures of model performance, such as annual mean bias, model scores, correlation coefficients, and Taylor diagrams were used to evaluate the models.
Years 3/4 Analysis of historic ozone measurements from the 1950s and 1960s Thirteen tropospheric ozone profiles from aircraft measurements over England in the period of October 1952 to May 1953, which were published in a paper of the Meteorological Research Committee by Kay in 1953, were digitized and averaged. They were compared to tropospheric ozone profiles of the early 1970s and 1990s from European ozonesonde stations to assess long-term tropospheric ozone changes. The quality of early vertical ozone profile data from the 1960s from balloon flights that are available from the World Ozone and UV Data Centre (WOUDC) archive (so-called Regener sondes) was assessed on the basis of a literature study and personal communications with H. De Backer from the Royal Meteorological Institute of Belgium and S.J. Oltmans from NOAA. Prof. Peter Fabian was contacted to ask for availability of data from the TROZ (Troposphärisches Ozon) project in which ozone was measured in the late 1960s and the 1970s from civil air planes over Europe and Africa. Unfortunately, the TROZ data are not available any more. Extension of TRADEOFF database with GASP and long-term ozonesonde measurements For the purpose of model evaluation of the 40-year simulations carried out in the end of 2005/beginning of 2006, GASP ozone data and all available long-term ozonesonde data since the end of the 1960s were formatted in a chronological order and uploaded into the ETHmeg database, formerly known as TRADEOFF database (www.megdb.ethz.ch). Additionally, monthly files containing the horizontal and pressure coordinates of the data were provided to the modellers for the purpose of interpolating model results to the data coordinates (so-called TIMEPOS files). Long-term trend analysis of UT/LS ozone estimated from the GASP and MOZAIC aircraft programs To study upper tropospheric and lower stratospheric ozone trends during the last three decades, measurements from the NASA Air Sampling Program (GASP), carried out on flights of commercial B-747 airliners during the period 1975 to 1979, were evaluated and compared with data from the MOZAIC program (Measurement of OZone and water vapour by AIrbus in-service airCraft) that has been in operation since 1994. Potential temperature, potentical vorticity and equivalent latitudes, calculated from the 40-year reanalysis data of ECMWF (ERA40), were used to bin the aircraft data with respect to the dynamical tropopause and into the equivalent latitude system to display climatologies of GASP and MOZAIC ozone and differences in-between. In addition to the GASP-

110
MOZAIC comparison, the quality of the GASP ozone data was verified using balloon data from the late 1970s from Canadian and European ozonesonde stations.
Main results
CTM model evaluation using ozonesonde data The results of the model evaluation done by ETHZ can be summarised as follows: On the annual mean and averaged over ozonesonde stations, LMDzINCA, TM4, and MOZECH indicate a high bias in ozone throughout the troposphere. p-TOMCAT and Oslo CTM2 show a negative bias at 850 hPa. Whereas p-TOMCAT deviations turn positive in the middle and upper troposphere with large positive deviations at 300 hPa, Oslo CTM2 still has a small negative bias in the middle troposphere and only shows a small positive bias in the upper troposphere. Annual mean absolute relative deviations range from 15-18 % at 850 hPa, 11-25 % at 500 hPa, and 23-77 % at 300 hPa. With the exception of MOZECH, all models show smallest absolute relative deviations in the middle troposphere, somewhat larger biases in the lower, and largest deviations in the upper troposphere. In contrast, MOZECH shows the smallest biases in the lower troposphere, and larger deviations in the middle and upper troposphere. Annual mean correlations averaged over stations are highest at 850 hPa with the correlation coefficient ranging from 0.65 to 0.8. In the middle and upper troposphere, correlations are somewhat lower with values from 0.45 to 0.68 at 500 hPa, and 0.4 to 0.67 at 300 hPa. Altogether, TM4 shows highest correlations with observations with an altitude averaged value of 0.71. Lowest overall correlations are found for p-TOMCAT (r_av=0.53) due to problems in performance in the middle and upper troposphere. Moderate correlations are also found for MOZECH, especially in the upper troposphere (r_up=0.46), and for Oslo CTM2 (0.53-0.65).
Analysis of historic ozone measurements from the 1950s and 1960s The mean ozone profile obtained from aircraft measurements over England and Norway (Kay, 1953) in autumn/winter 1952/1953 is shown in Figure 48. Keeping in mind that the vertical resolution of the early measurements is very restricted, very low ozone concentrations were measured across the whole troposphere and lowermost stratosphere. This is especially the case for the UT/LS region, where ozone mixing rations seem unrealistically low. When comparing the Kay profiles with later ozonesondes it also becomes obvious that there is no indication of a chemical tropopause in the data. Some parts of this UT/LS low bias of these early measurements may indeed have resulted from meteorological conditions during the flights assuming that flights were only carried out under fair weather conditions. Filtering the later ozonesondes of the 1970s and 1990s for these conditions (high ozonopause), the agreement between the Kay measurements and later ozonesondes improves somewhat.
Figure 48: Mean and standard deviation of the Kay ozone measurements of the period November 1952 to February 1953

111
Although the 1950s ozone profiles do not seem very trustworthy, the comparison with later ozonesonde profiles in the 1970s and 1990s indicate in qualitative terms that tropospheric ozone has indeed been increasing since the second world war. According to H. De Backer and S.J. Oltmans, the 1960s Regener sondes had problems in changing sensitivity of the chemiluminescent detector during the course of the ascent. They were also very sensitive to different kinds of pollutants and to humidity. It was later determined that the tropospheric response of the sensor was probably low relative to even the Brewer-Mast sensor. Thus, our recommendation is that the Regener sonde data should be treated with much precaution, they should not be used in ozone trend analysis.
Long-term trend analysis of UT/LS ozone estimated from the GASP and MOZAIC aircraft programs The analysis of the 1975-1979 GASP data shows that the seasonality and concentrations of ozone in the UT/LS are generally in agreement with other observations in the literature. In addition, there is remarkable agreement between GASP and contemporary Brewer-Mast ozone soundings with differences in the lower stratosphere being less than ± 5 %. In the upper troposphere over Europe, where only a limited sample size of GASP data exists, differences are still only around ±10 %, except in the winter season. During wintertime, differences between GASP and ozone sounding data are significantly larger due to individual GASP flights possibly influenced by particular meteorology. The differences found between wintertime GASP and ozonesonde means is a good example of how data representativity might be hampered by the sampling size and a particular meteorology. Considering changes between the GASP 1975-1979 and MOZAIC 1994-2001 climatologies, the results can be summarised as follows: In the lowermost stratosphere, quasi-mean (means over equivalent latitudes) ozone decreased in autumn, winter, and spring in the northern extratropics, most probably attributable to stratospheric ozone depletion. In summer, on the contrary, ozone increased in the lowermost middle latitude stratosphere, which might have been caused by increasing NOx emissions from civil aircraft leading to enhanced ozone in-situ production. In the upper troposphere, largest ozone increases were found for several regions in tropical Asia, while ozone changes for the North Atlantic, North America and Europe varied with seasons. The comparison of long-term changes observed at Wallops Island, USA, with the changes observed between the two aircraft programs for the northeastern part of the US showed that ozone changes were very similar expect in spring. Over Europe, ozone changes from the European ozone sounding sites indicate a strong increase over the whole UT/LS as reported earlier in the literature. In contrast, the regular aircraft data hint to very little slightly negative changes over the same region. Different factors that might have contributed to the discrepancies in trends between the European ozonesonde stations and the regular aircraft measurements include possible problems in the data quality of the measurements, problems in the representativity of the climatologies, or changes in the reporting of the ozonesonde measurements. A more detailed discussion on the GASP climatology and long-term changes between the 1970s and 1990s has been submitted to Atmospheric Chemistry in Physics and is reproduced in deliverable D3-2.
8.9 Finnish Meteorological Institute (FMI)
Personnel involved in project Leif Backman, Laura Thölix, Sanna-Maria Ojanen, Jussi Kaurola, Juhani Damski, Petteri Taalas
Project objectives
• Collection and analysis of stratospheric ozone data for use as stratospheric boundary condition • Calculation of surface UV flux using the results from the reanalysis runs
In revision of the original work plan it was decided to forego the direct use of observational data for the stratospheric ozone boundary condition and instead perform long-term model simulations with the FinROSE model covering the ERA-40 time period (1958-2002).
112
Activity report
Year 1 • ERA-40 data downloaded from ECMWF (2.5x5.0 deg resolution, 60 levels, 466GB) • Preliminary test simulations for the 1990s showed the ozone model fields to be reasonable,
despite some problems in the ERA-40 meteorological data (e.g. too strong meridional circulation). The model output was compared to ozone soundings, satellite data and climatological data.
• The stratospheric chemistry transport model FinROSE-ctm was prepared for the 45-year simulation. The stratospheric simulation spanning from September 1957 to August 2002 was performed as a continuous run.
Year 2 • Results from the simulations (Multi-year chemistry transport model simulation of middle
atmospheric ozone using ERA-40 meteorological data: Comparison with observations) were presented at the Nordic ozone group meeting, Helsinki, Finland, April 2004, and at the Stratospheric Ozone Workshop, Zurich, Switzerland, March 2004.
• Stratospheric boundary condition data files were produced from daily average model output files. The ozone data set contains ozone mixing ratio as 3D monthly mean fields, covering the ERA-40 time period (1958-2002).
• The data was converted from grads to NetCDF and was uploaded to the RETRO data server in Sept 2004.
• The 3rd RETRO work meeting was hosted by FMI in Helsinki from Sept 29 to Oct.1, 2004.
Years 3/4 • The problems in the meridional circulation led to unrealistic distributions of long-lived species
in the model. Therefore the profiles of long-lives species, such as methane and N2O were ‘constrained’. The lower boundary condition was improved, e.g. a dynamical tropopause was introduced.
• The FinROSE-ctm was modified to be used in a supercomputing environment, e.g. some parallelization coding. The number of levels in the model was also increased from 24 to 32.
• An extensive comparison to ozone sonde data (Analysis and validation of long-term chemistry-transport model simulations of middle atmospheric ozone) was presented at EGU2006.
• Further improvements were needed, especially the ozone loss was too weak. The lower stratosphere was too dry, which resulted in weak heterogeneous chemistry. The UT/LS water vapour was improved and a final rerun was undertaken in May-June 2006.
• Global surface UV doses has been calculated for the ERA-40 period using daily input data from ERA-40 analyses and RETRO model simulations (D5-1). The quality of input parameters has been validated with available ground based total ozone data and estimates of Cloud Modification Factor (CMF). Due to limited availability of validation data especially during 1960s and 1970s the analysis was focused on Northern European sites.
Main results
FinROSE-CTM stratospheric ozone data Global stratospheric boundary conditions from September 1957 to August 2002 were prepared using the FinROSE chemistry-transport model (Damski 2005). The ozone data set contains ozone mixing ratio as 3D monthly mean fields produced from daily average model output together with the surface pressure and information about the vertical grid in NetCDF format. Global middle atmospheric simulations were done using 6 hourly ECMWF ERA-40 analysis winds and temperatures. The simulations were run with a horizontal grid resolution of 10x5 deg (long-lat) at
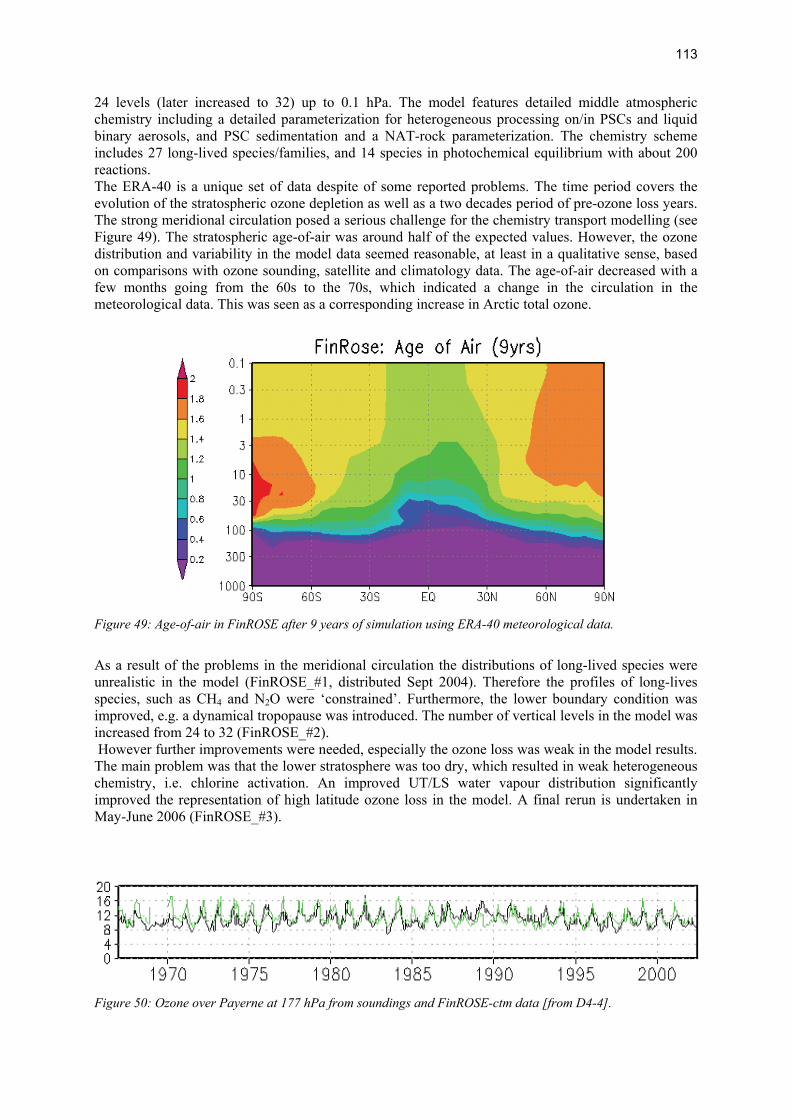
113
24 levels (later increased to 32) up to 0.1 hPa. The model features detailed middle atmospheric chemistry including a detailed parameterization for heterogeneous processing on/in PSCs and liquid binary aerosols, and PSC sedimentation and a NAT-rock parameterization. The chemistry scheme includes 27 long-lived species/families, and 14 species in photochemical equilibrium with about 200 reactions. The ERA-40 is a unique set of data despite of some reported problems. The time period covers the evolution of the stratospheric ozone depletion as well as a two decades period of pre-ozone loss years. The strong meridional circulation posed a serious challenge for the chemistry transport modelling (see Figure 49). The stratospheric age-of-air was around half of the expected values. However, the ozone distribution and variability in the model data seemed reasonable, at least in a qualitative sense, based on comparisons with ozone sounding, satellite and climatology data. The age-of-air decreased with a few months going from the 60s to the 70s, which indicated a change in the circulation in the meteorological data. This was seen as a corresponding increase in Arctic total ozone.
Figure 49: Age-of-air in FinROSE after 9 years of simulation using ERA-40 meteorological data.
As a result of the problems in the meridional circulation the distributions of long-lived species were unrealistic in the model (FinROSE_#1, distributed Sept 2004). Therefore the profiles of long-lives species, such as CH4 and N2O were ‘constrained’. Furthermore, the lower boundary condition was improved, e.g. a dynamical tropopause was introduced. The number of vertical levels in the model was increased from 24 to 32 (FinROSE_#2). However further improvements were needed, especially the ozone loss was weak in the model results. The main problem was that the lower stratosphere was too dry, which resulted in weak heterogeneous chemistry, i.e. chlorine activation. An improved UT/LS water vapour distribution significantly improved the representation of high latitude ozone loss in the model. A final rerun is undertaken in May-June 2006 (FinROSE_#3).
Figure 50: Ozone over Payerne at 177 hPa from soundings and FinROSE-ctm data [from D4-4].
114
Global surface UV doses The most important factors affecting surface UV radiation are solar zenith angle, ozone, clouds, aerosols, altitude and surface albedo. The ERA-40 data covers all of these factors except aerosols. Total ozone is also available from the RETRO model simulations for the whole ERA-40 period. Because the input parameters to UV calculations are essential the quality of total ozone and cloud data has been validated. Daily total ozone observations from Aroza (Switzerland) and Tromso (Norway) cover the whole ERA-40 period. In Aroza the comparison of ERA-40 total ozone show a rather good agreement during the period when satellite ozone data has been assimilated (1979-) with small mean error (ME) of 3% and RMS error about 6%. Also the period before satellites (1958-1972) is well captured in the ERA-40 data (ME 4% and RMS about 8%). However, the agreement is lower during the period with satellite assimilation without ozone (1973-1978) with ME about 12%, and RMS about 15%. These results are in accordance with the results by Dethov and Holm (2004). In Aroza the modelled total ozone by RETRO models (stratospheric ozone from FinROSE model combined with tropospheric ozone from UiO and KNMI models) don't agree as well as the ERA-40 during 1958-1973 and 1979-2002, but the 1973-1978 period is better simulated by the RETRO models (ME about -3%, and RMS about 11%). In Tromso the agreement between observations and ERA-40 data is much worse than in Aroza. The ME is 8%, 19% and 5% for the three periods, and RMS as high as 16%, 28% and 15%. Also the agreement of ozone from RETRO models with observations is rather low. For daily variations of surface UV the clouds are in many cased cases the dominant factor in addition to solar zenith angle changes (e.g. Calbo et al. 2005). The validation of ERA-40 clouds is difficult because observations of cloud optical properties are very sparse, but for calculating surface UV they are essential. However, at some sites pyranometer measurement of total solar radiation combined with corresponding modelled clear-sky values enable to calculate Cloud Modification Factor (CMF), which is the ratio of actul (or all-sky) values against clear-sky values. The comparison of CMF for total solar radiation for Jokioinen (Finland) show that the CMF calculated from ERA-40 data has ME of 15% and RMS of 34%. The corresponding values for Norrköping (Sweden) are 10% (ME) and 26% (RMS). Thus, the clouds in ERA-40 data are more transparent than the observed clouds at these sites. Allen et al. (2004) concluded that the all-sky radiation budget is poorly simulated, and the clear-sky absorbed solar radiation is overestimated in the ERA-40 data. Therefore, the quality of ERA-40 clouds for surface UV calculations cannot be regarded reliable. Daily CIE weighted (McKinley and Diffey 1987) surface UV doses calculated using ERA-40 have been compared with available observations at Jokioinen (1995-) and Sodankylä (1990-) and Norrköping (1983-). In addition comparisons have been made using reconstructed UV values at Davos (Switzerland) and Sodankylä (Lindfors at al. 2003 and 2005) for the whole ERA-40 period. All comparisons are characterized by substantial ME and large RMS between ERA-40 results and observations. The RMS values for ground-based measurements are Jokioinen 43%, Sodankylä 48%, Norrköping 43%, and for reconstructed data: Davos 32% and Sodankylä 35%. Northern European UV doses are overestimated by the ERA-40 results with ME of 21% in Jokioinen, 15% in Sodankylä (both ground-based data and reconstructed) and 23% in Norrköping. However, the UV doses for Davos are lower than the reconstructed (ME of -6%). Monthly UV doses at all stations compare somewhat better with observations than daily data. Acknowledgements: Aroza and Tromso total ozone data has been retrieved from the The World Ozone and Ultraviolet Radiation Data Centre (WOUDC). The Norrköping data has been provided by Weine Josefsson from SHMI. The authors are grateful to data originators.
8.10 TNO Built Environment and Geosciences (formerly: TNO Environment, Energy and Process Innovation)
Personnel involved in project Tinus Pulles, Maarten van het Bolscher, Roel Brand, Antoon Visschedijk
115
Project objectives
• Adaptation and refinement of 100 year data set of anthropogenic emissions with focus on the past 40 years
In extension of the original work plan the TNO group did not simply adapt the existing data base of van Aardenne et al., but instead developed a new data base system in order to produce consistent data sets of anthropogenic trace gas and aerosol emissions over the last four decades. These country-level data reflect the changes in emissions on the annual and seasonal time scales. The data were mapped onto a regular grid of 0.5°×0.5° resolution and made available to the project partners and publicly through the RETRO and GEIA web pages. Furthermore, the new data base was used to generate what-if scenarios to get insight in the impact of technological choices or policy measures related to power generation and road traffic.
Activity report In order to submit the required data sets on anthropogenic emissions, the following activities were carried out:
• developing the TNO emission assessment model (TEAM), enabling a structured and consistent collection of emission data
• collection of new data; • conversion and inclusion of existing data sets • developing inter-annual (seasonal) patterns of emission, depending on the type of activity • deriving of missing data (gap filling) by interpolation • post-processing of data, including gridding of data into 0,5º x 0,5º grid cells • data checks • production of data sets for application in models • Scenarios • development of alternatives to select from for scenario calculations • calculation of emission level results for various scenarios of technological developments and
policy implications Other activities:
• Participation in project meetings and work sessions, specifically for the work package activities
• Preparing presentations and publications on the work carried out • Contributions to biannual and project- or work package reporting
Main results
Emissions data base The database as developed in the project provides worldwide anthropogenic emission data for a 40-years period (1960 – 2000) for the compounds NOx, CO and NMVOC. This includes the first detailed speciation of NMVOC compounds in a global emissions data set. The database structure provides a fit-for-use tool with the following key characteristics: • Emissions for pollutants can be calculated based on the formula: Emission = Activity (Economy) [data] × Technology [data] × Behaviour. • Activity data are derived amongst others from the IEA. • Sector definitions are in full compliance with CRF/NFR. • It will be possible to convert emissions under other definitions into the database. The structure used in this project for the TNO emission database is based on the TNO Emission Assessment Model (TEAM). The approach of TEAM is described in all details in Pulles et al. (2006). The database structure is also anticipating on evaluation of amongst others the impact of policy measures, by including “Behaviour” as a component in the emissions calculation. Consequently, the impact of penetration of technologies can be included in the final results.
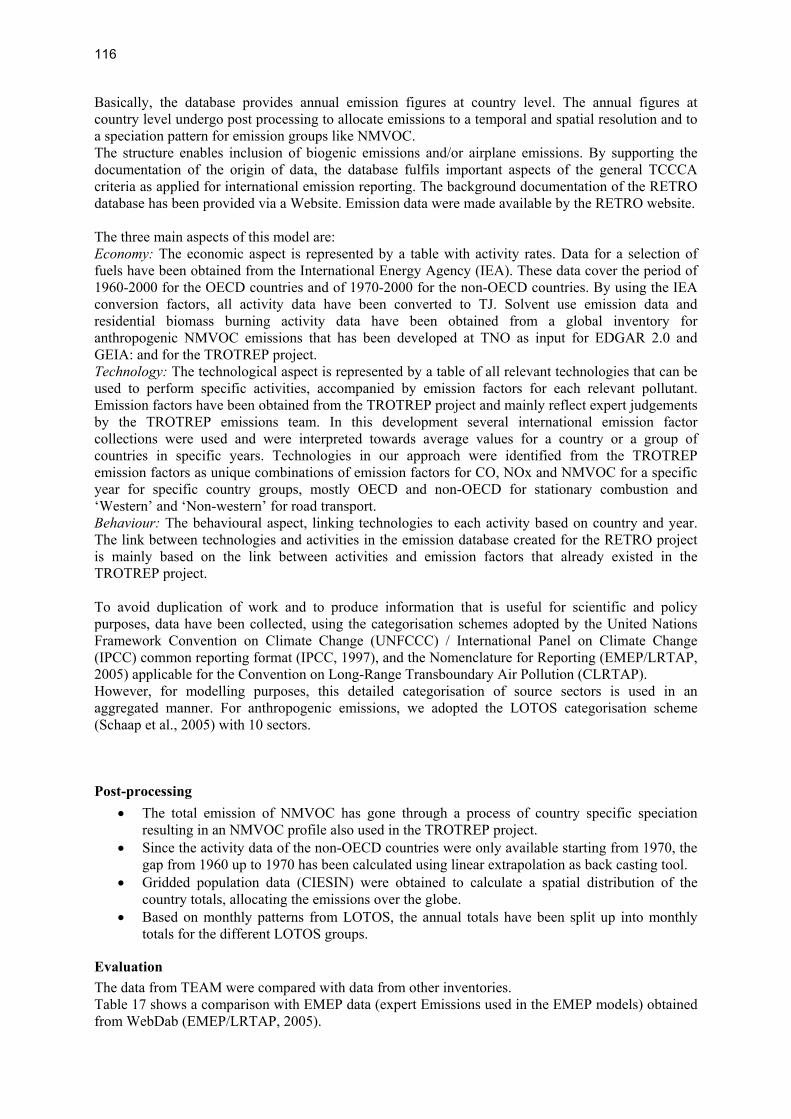
116
Basically, the database provides annual emission figures at country level. The annual figures at country level undergo post processing to allocate emissions to a temporal and spatial resolution and to a speciation pattern for emission groups like NMVOC. The structure enables inclusion of biogenic emissions and/or airplane emissions. By supporting the documentation of the origin of data, the database fulfils important aspects of the general TCCCA criteria as applied for international emission reporting. The background documentation of the RETRO database has been provided via a Website. Emission data were made available by the RETRO website. The three main aspects of this model are: Economy: The economic aspect is represented by a table with activity rates. Data for a selection of fuels have been obtained from the International Energy Agency (IEA). These data cover the period of 1960-2000 for the OECD countries and of 1970-2000 for the non-OECD countries. By using the IEA conversion factors, all activity data have been converted to TJ. Solvent use emission data and residential biomass burning activity data have been obtained from a global inventory for anthropogenic NMVOC emissions that has been developed at TNO as input for EDGAR 2.0 and GEIA: and for the TROTREP project. Technology: The technological aspect is represented by a table of all relevant technologies that can be used to perform specific activities, accompanied by emission factors for each relevant pollutant. Emission factors have been obtained from the TROTREP project and mainly reflect expert judgements by the TROTREP emissions team. In this development several international emission factor collections were used and were interpreted towards average values for a country or a group of countries in specific years. Technologies in our approach were identified from the TROTREP emission factors as unique combinations of emission factors for CO, NOx and NMVOC for a specific year for specific country groups, mostly OECD and non-OECD for stationary combustion and ‘Western’ and ‘Non-western’ for road transport. Behaviour: The behavioural aspect, linking technologies to each activity based on country and year. The link between technologies and activities in the emission database created for the RETRO project is mainly based on the link between activities and emission factors that already existed in the TROTREP project. To avoid duplication of work and to produce information that is useful for scientific and policy purposes, data have been collected, using the categorisation schemes adopted by the United Nations Framework Convention on Climate Change (UNFCCC) / International Panel on Climate Change (IPCC) common reporting format (IPCC, 1997), and the Nomenclature for Reporting (EMEP/LRTAP, 2005) applicable for the Convention on Long-Range Transboundary Air Pollution (CLRTAP). However, for modelling purposes, this detailed categorisation of source sectors is used in an aggregated manner. For anthropogenic emissions, we adopted the LOTOS categorisation scheme (Schaap et al., 2005) with 10 sectors.
Post-processing • The total emission of NMVOC has gone through a process of country specific speciation
resulting in an NMVOC profile also used in the TROTREP project. • Since the activity data of the non-OECD countries were only available starting from 1970, the
gap from 1960 up to 1970 has been calculated using linear extrapolation as back casting tool. • Gridded population data (CIESIN) were obtained to calculate a spatial distribution of the
country totals, allocating the emissions over the globe. • Based on monthly patterns from LOTOS, the annual totals have been split up into monthly
totals for the different LOTOS groups.
Evaluation The data from TEAM were compared with data from other inventories. Table 17 shows a comparison with EMEP data (expert Emissions used in the EMEP models) obtained from WebDab (EMEP/LRTAP, 2005).
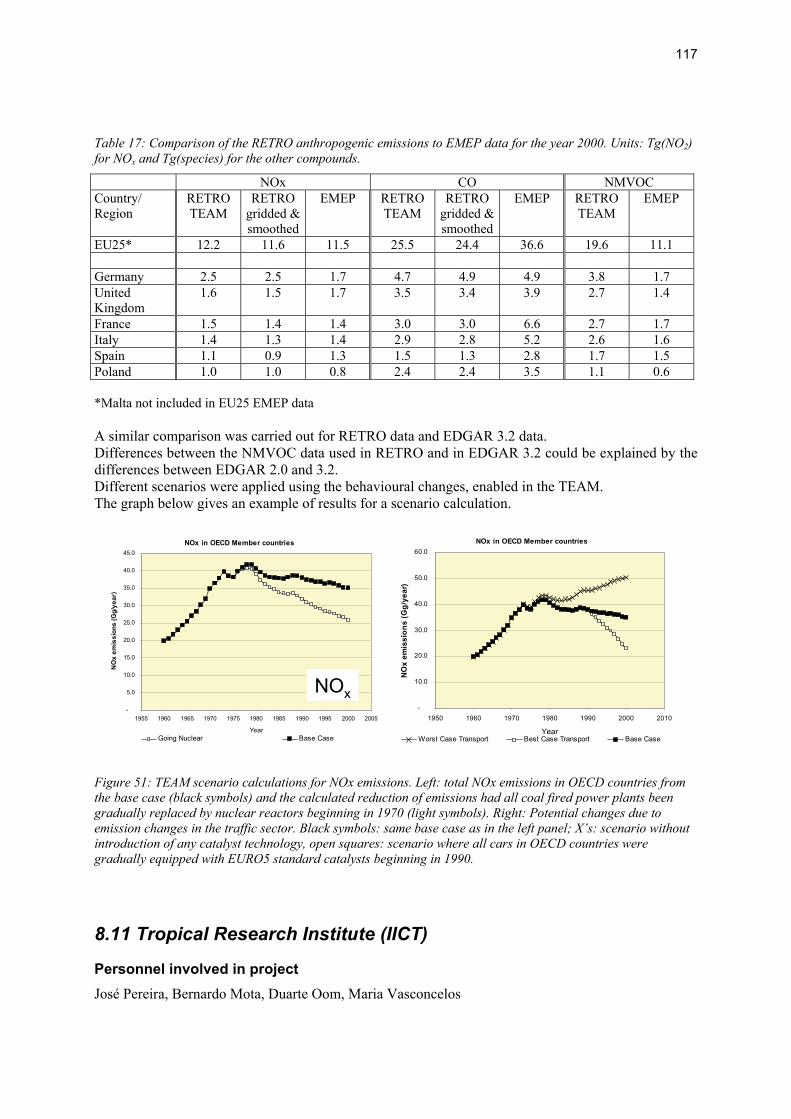
117
Table 17: Comparison of the RETRO anthropogenic emissions to EMEP data for the year 2000. Units: Tg(NO2) for NOx and Tg(species) for the other compounds.
NOx CO NMVOC Country/ Region
RETRO TEAM
RETRO gridded & smoothed
EMEP
RETRO TEAM
RETRO gridded & smoothed
EMEP
RETRO TEAM
EMEP
EU25* 12.2 11.6 11.5 25.5 24.4 36.6 19.6 11.1 Germany 2.5 2.5 1.7 4.7 4.9 4.9 3.8 1.7 United Kingdom
1.6 1.5 1.7 3.5 3.4 3.9 2.7 1.4
France 1.5 1.4 1.4 3.0 3.0 6.6 2.7 1.7 Italy 1.4 1.3 1.4 2.9 2.8 5.2 2.6 1.6 Spain 1.1 0.9 1.3 1.5 1.3 2.8 1.7 1.5 Poland 1.0 1.0 0.8 2.4 2.4 3.5 1.1 0.6 *Malta not included in EU25 EMEP data A similar comparison was carried out for RETRO data and EDGAR 3.2 data. Differences between the NMVOC data used in RETRO and in EDGAR 3.2 could be explained by the differences between EDGAR 2.0 and 3.2. Different scenarios were applied using the behavioural changes, enabled in the TEAM. The graph below gives an example of results for a scenario calculation.
NOx in OECD Member countries
-
5.0
10.0
15.0
20.0
25.0
30.0
35.0
40.0
45.0
1955 1960 1965 1970 1975 1980 1985 1990 1995 2000 2005
Year
NO
x em
issi
ons
(Gg/
year
)
Going Nuclear Base Case
NOx
NOx in OECD Member countries
-
5.0
10.0
15.0
20.0
25.0
30.0
35.0
40.0
45.0
1955 1960 1965 1970 1975 1980 1985 1990 1995 2000 2005
Year
NO
x em
issi
ons
(Gg/
year
)
Going Nuclear Base Case
NOx
NOx in OECD Member countries
-
10.0
20.0
30.0
40.0
50.0
60.0
1950 1960 1970 1980 1990 2000 2010
Year
NO
x em
issi
ons
(Gg/
year
)
Worst Case Transport Best Case Transport Base Case Figure 51: TEAM scenario calculations for NOx emissions. Left: total NOx emissions in OECD countries from the base case (black symbols) and the calculated reduction of emissions had all coal fired power plants been gradually replaced by nuclear reactors beginning in 1970 (light symbols). Right: Potential changes due to emission changes in the traffic sector. Black symbols: same base case as in the left panel; X’s: scenario without introduction of any catalyst technology, open squares: scenario where all cars in OECD countries were gradually equipped with EURO5 standard catalysts beginning in 1990.
8.11 Tropical Research Institute (IICT)
Personnel involved in project José Pereira, Bernardo Mota, Duarte Oom, Maria Vasconcelos
118
Project objectives
• Collection and statistical assessment of data sets of burned area and active fires • Analysis and evaluation of 1997 and 2000 satellite data for active fires and burnt area. • Recommendations for use of fire data for emission modelling
The analysis of satellite data for the retrieval of burnt area and active fires focused on the NOAA/AVHRR Pathfinder data set (spatial resolution 8 km, time period 1982-1999( and the ATSR nighttime active fire detection from ESA-ESRIN (spatial resolution 1 km, time period 1995-2003), because these are the only data sets with a multi-annual coverage before the year 2000.
Activity report
• Acquisition of Pathfinder AVHRR Land (PAL) daily satellite imagery database, from the NASA Goddard Space Flight Centre Distributed Active Archive.
• Application of a multitemporal image compositing procedure, to screen out clouds and to produce monthly image composites that preserve the burned area signal.
• Production of a dataset of derived variables, to support burned area classification: vegetation index, albedo, and surface temperature.
• Development of geographical masks to screen out non-combustible land surfaces, using the Global Land Cover 2000 map and the Ecoregions of the World map.
• Development of fire seasonality masks, based on World Fire Atlas active fires dataset, to define fire season for each 8km pixel.
• Literature survey, to identify regional fire statistics / fire maps data, to support in the acquisition of training and validation data for supervised image classification.
• Collection of training data, testing of alternative supervised image classification procedures, and identification of temporal inconsistency problems in the results.
• Characterisation of timeseries inhomogeneity problems, due to satellite inter-calibration inconsistencies, sensor degradation, and orbital drift. Decision to exclude year 1994 from analysis.
• Multiple attempts to develop satellite image classifiers robust vis-à-vis timeseries inhomogeneity, using classification trees incorporating time as a variable, and fuzzy rule-based classifiers.
• Multiple attempts to remove spurious trends from timeseries of NOAA/AVHRR satellite imagery, based on regression on solar zenith angle, stratified by land cover type.
• Multiple attempts to remove spurious trends from timeseries of NOAA/AVHRR satellite imagery, based on timeseries decomposition techniques, extracting trend and seasonality from the original signal.
Main results Given our lack of success in developing a timeseries of burned area maps from the NOAA/AVHRR data, our main result was the screening of the European Space Agency World Fire Atlas dataset. We screened the algorithm 2 (308K threshold) European Space Agency (ESA) World Fire Atlas (WFA), for the period 1996–2005, using ancillary land cover, nightlights and volcanic activity datasets, combined with statistical techniques to detect the occurrence of space-time clusters of anomalous observations. The WFA is built using night time data from the Along Track Scanning Radiometer (ATSR) onboard the Second European Remote-Sensing Satellite (ERS-2). The spatial resolution of the data is 1 km and the satellite revisiting period is 3 days at the equator. The WFA is the first and longest archive of global fire observations and has been used in numerous biomass burning studies. Known limitations of the WFA are the inclusion of warm surfaces, gas flares, and city lights, and an underestimation of actual global fire activity, due to the time of satellite overpass. Nevertheless, it has been considered that the WFA contains a relatively small proportion of observations that do not correspond to vegetation fires, which is not corroborated by our findings.
119
During the study period, the annual percentage of false alarms and non-vegetation fires varied from a minimum value of about 20% in 1997 to a maximum of almost 28% in 1998. Gas flares and hot bare soils are the major sources of false alarms and non-vegetation fires.
8.12 Max-Planck-Institute for Biogeochemistry, Jena (MPI-BGC)
Personnel involved in the project Allan Spessa, Kirsten Thonicke, Wolfgang Knorr
Project Objectives
• Assimilation of LAI into biosphere model • Simulated carbon allocation for 1997 and 2000 • Support for parameterisation of biogenic and soil emissions
Due to the availability of new personnel with expertise in fire emissions modelling (Spessa and Thonicke), it was decided early in the project to shift the work on biogenic and soil emissions and instead focus entirely on a contribution to the RETRO fire burnt area and emissions data base. Major activities were thus allocated to the parameterisation and reformularisation, of the regional fire model Reg-FIRM (Venevsky et al, 2002), which was then used to simulate monthly burnt area for the entire globe and for the whole RETRO time period 1960-2000 at 0.5 degrees resolution.
Activity report
Year 1 • contributed to organisation of a special RETRO workshop on fire emissions at PIK, Potsdam • developed a strategy for the further development of the prognostic regional fire model Reg-
FIRM • development of three new Reg-FIRM modules that i) simulate human-caused ignition rates as
a function of population density, ii) fire spread as a function of variable wind speed, and iii) fire-induced plant mortality (new parameterisations).
• Since Reg-FIRM is dynamically coupled to the Lund Potsdam Jena Dynamic Global Vegetation Model (LPJ DGVM) (Sitch et al 2003), but the original soil hydrology scheme in LPJ was completely overhauled (LPJ2) (Gerten et al 2004), considerable time and effort was spent in testing reg-FIRM output in response to the new soil moisture fields arising from LPJ2.
• Major difficulties were experienced in obtaining stable model output in Africa, where soil moisture fields exhibit extremely high spatio-temporal variability.
• These issues were eventually resolved.
Year 2 • first version of the re-engineered Reg-FIRM model ready, first multi-annual global
simulations of burnt area produced. • validation of new Reg-FIRM for Australian savannas, and western USA using AVHRR data
on burnt area for the former (Zwenzner 2004) and ground-based observations on burnt area for the latter (Vogel 2004).
Years 3/4 • further fine-tuning of Reg-FIRM against EO data on global fire activity (principally, GBA
2000). • produced a second 40-year record of global burnt area with improved Reg-FIRM model
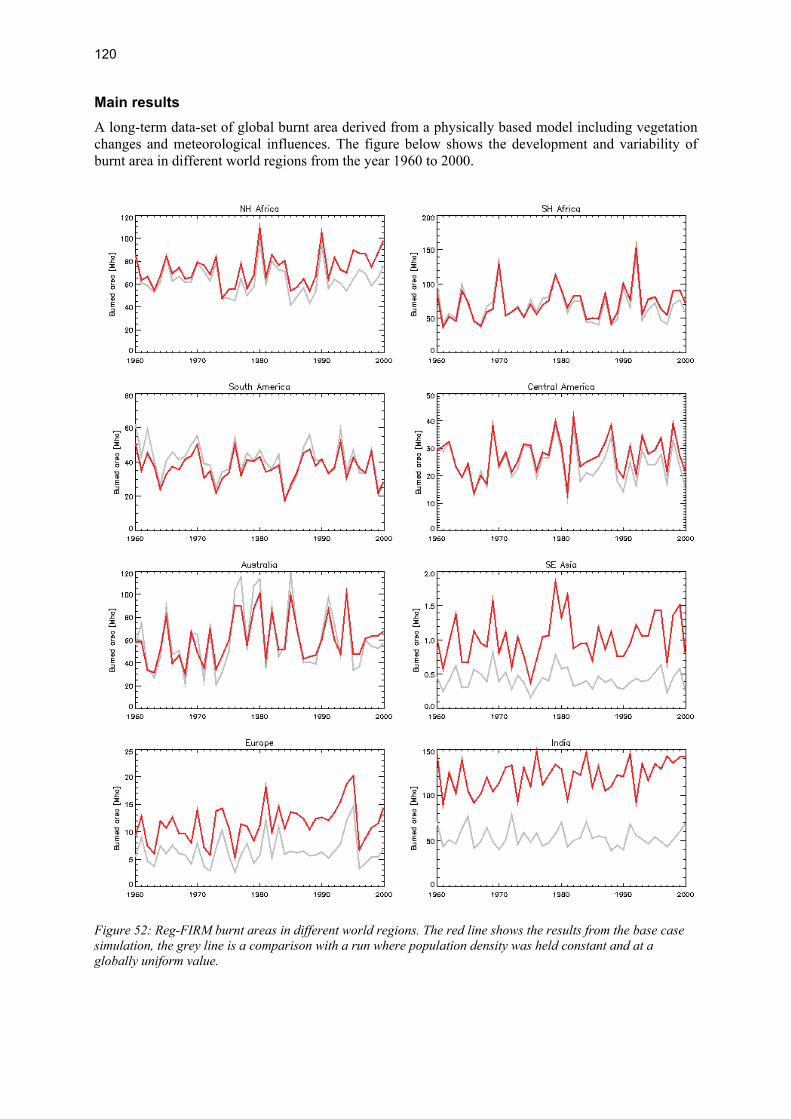
120
Main results A long-term data-set of global burnt area derived from a physically based model including vegetation changes and meteorological influences. The figure below shows the development and variability of burnt area in different world regions from the year 1960 to 2000.
Figure 52: Reg-FIRM burnt areas in different world regions. The red line shows the results from the base case simulation, the grey line is a comparison with a run where population density was held constant and at a globally uniform value.

121
9. RETRO Deliverables
All project deliverables are available on the RETRO ftp server (ftp://ftp.retro.enes.org/pub) or via the project web pages (http://retro.enes.org).
9.1 Project Reports Key documents are highlighted in bold face
Deliverable Title D1-1 Status report of emission data sets and layout of work strategy for construction
of new emission data D1-6 Report describing RETRO emission data sets and methodologies D2-2 Report on distributed data archive and recommendations for optimal use
of the data D2-3 Analysis of the evolution of tropospheric ozone D2-5 Recommendations for a future European measurement strategy D2-6 Report describing collection and use of observations in RETRO D3-2 Analysis of model performance for seasonal variations D3-3 Analysis of sensitivity of model trends and interannual variability to
emissions, chemistry and dynamics D3-4 Report on process studies D4-1 Detailed planning document for reanalysis simulations D4-4 Technical description of the reanalysis simulations and comparison with
observations including assessment of sector and region contributions D5-1 Estimated changes in surface UV over the last 4 decades D5-2 Estimated radiative forcing over the last four decades D5-3 Estimates for composition and impact changes for the European region D5-4 Recommendations to project participants for the design of specific sensitivity
and scenario experiments in order to be able to assess the policy response D5-5 Analysis of past and present policy response to trends in European air
pollution

122
9.2 Other deliverables
Deliverable Title Comments D1-2 Methodology for estimating
biomass burning emissions based on active fire statistics and meteorological data
See D1-6 and GBC manuscript by Schultz et al. (2007)
D1-3 Complete data sets of emissions for the 1990s
Available on RETRO ftp server ftp://ftp.retro.enes.org/pub/emissions
D1-4 Data sets of emissions for complete reanalysis period
Available on RETRO ftp server ftp://ftp.retro.enes.org/pub/emissions See also the TNO TEAM web site at http://www.air.sk/tno/retro_pictures/index.php
D1-5 Quantification of emissions that are computed interactively in the reanalysis simulations
See D1-6
D2-1 Distributed data base of observations including web access
Accessible through http://nadir.nilu.no/retro
D2-4 Multi-annual time series of GOME retrievals for tropospheric ozone, NO2 and CH2O
Accessible through http://nadir.nilu.no/retro
D3-1 Tools for regridding and visualisation of model results
Available on RETRO ftp server
D4-2 Processed model boundary data (stratosphere, emissions) and meteorological data from ERA-40
Available on request
D4-3 Reanalysis of tropospheric chemical composition from 1957-2000
Model results from 3 models (gridded monthly mean fields) available on RETRO ftp server ftp://ftp.retro.enes.org/pub/model_results Standardized plots (maps and zonal means) for selected species are available on the interactive web display at http://nansen.ipsl.jussieu.fr/cgi-bin/AEROCOM/retro/retro_annualrs.pl
The project web site (deliverable C-7) is maintained at http://retro.enes.org/


The RETRO project team thanks everyone who has contributed to the project by providing data sets,through scientific discussions or otherwise. The European Commission is acknowledged for fundingthis research activity.
http://retro.enes.org
View publication statsView publication stats
Copyright © 2022 FDOKUMEN