Using NASA Satellite and Reanalysis to Provide Climate Data ...
30
Using NASA Satellite and Reanalysis to Provide Climate Data Products for Energy Industry Applications April 24, 2011 1 Paul Stackhouse and Robert Charles NASA Langley Research Center (LaRC) LaRC Team Members: William Chandler, David Westberg, James Hoell and Taiping Zhang, SSAI Urban Zeigler and Gregory J. Leng RETScreen International CanmetENERGY/NRCan RETScreen Team Members: Nathalie Meloche, Kevin Bourque, Farah Sheriff, Tommy Anderson and Julien Poirier
-
Upload
khangminh22 -
Category
Documents
-
view
0 -
download
0
Transcript of Using NASA Satellite and Reanalysis to Provide Climate Data ...

Using NASA Satellite and Reanalysis to
Provide Climate Data Products for Energy Industry Applications
April 24, 2011 1
Paul Stackhouse and Robert Charles NASA Langley Research Center (LaRC) LaRC Team Members: William Chandler, David Westberg, James Hoell and Taiping Zhang, SSAI Urban Zeigler and Gregory J. Leng RETScreen International CanmetENERGY/NRCan RETScreen Team Members: Nathalie Meloche, Kevin Bourque, Farah Sheriff, Tommy Anderson and Julien Poirier

April 24, 2011 2
Why NASA?
• How is the global Earth system changing? • What are the primary forcings of the Earth
system? • How does the Earth system respond to
natural and human-induced changes? • What are the consequences of changes in
the Earth system for human civilization? • How well can we predict future changes to
the Earth system?
Water Cycle Energy Cycle
Researching Science Questions
Capabilities for Science Answers • New instrumentation on various observing
platforms • New/improved analysis techniques • Enhanced modeling and assimilation

Meteorological Data Sources
April 24, 2011 3
The GMAO (based at GSFC) develops and uses comprehensive models and assimilation systems that support NASA’s Earth science research enterprise and contribute to the nation’s capabilities in climate, weather and composition prediction. Global Weather and Climate Models + Observations = Assimilation Model
NASA’s Global Modeling & Assimilation Office (GMAO)

April 24, 2011 4
Example Global Parameters Temperature Information from GMAO GEOS-4

April 24, 2011 5
Relevant NASA Science Data Sets GEWEX Surface Radiation Budget: 24+ years of cloud
(from ISCCP), SW and LW fluxes at TOA and Surface
24 Year Annual Cycle Surface Solar Fluxes
(W m-2)
(Jan 1984 – Dec 2007)
GEWEX SRB SW v3.0
(ISCCP, GMAO)

6
Relevant NASA Science Data Sets FLASHFlux: Global TOA and Surface Fluxes within
1 week of observation from Terra and Aqua
Daily Average Solar Irradiance for Feb 2, 2012 (Wm-2)
CERES FLASHFlux (CERES/MODIS, GMAO)
April 24, 2011

April 24, 2011 7
NASA Applied Earth Science: POWER Project
POWER = Prediction of Worldwide (renewable) Energy Resource
Objective: Improve the Nation’s public and private
capability for integrating environmental data from NASA research to support energy production and increased energy efficiency.
Goals: Through partnerships derive/validate/provide
parameters relevant to industry needs; link to decision support, transition when possible.
Applied Sciences Goal: The Applied Sciences program extends NASA Earth Science research and observations for practical use in environmentally-related decision and policy making.
• Emphasizes partnerships in variety of application theme areas Climate & Energy
Key Theme

April 24, 2011 8
POWER Web Site http://power. larc.nasa.gov
Provides access to both Long-term and Near-Term Time Data Sets
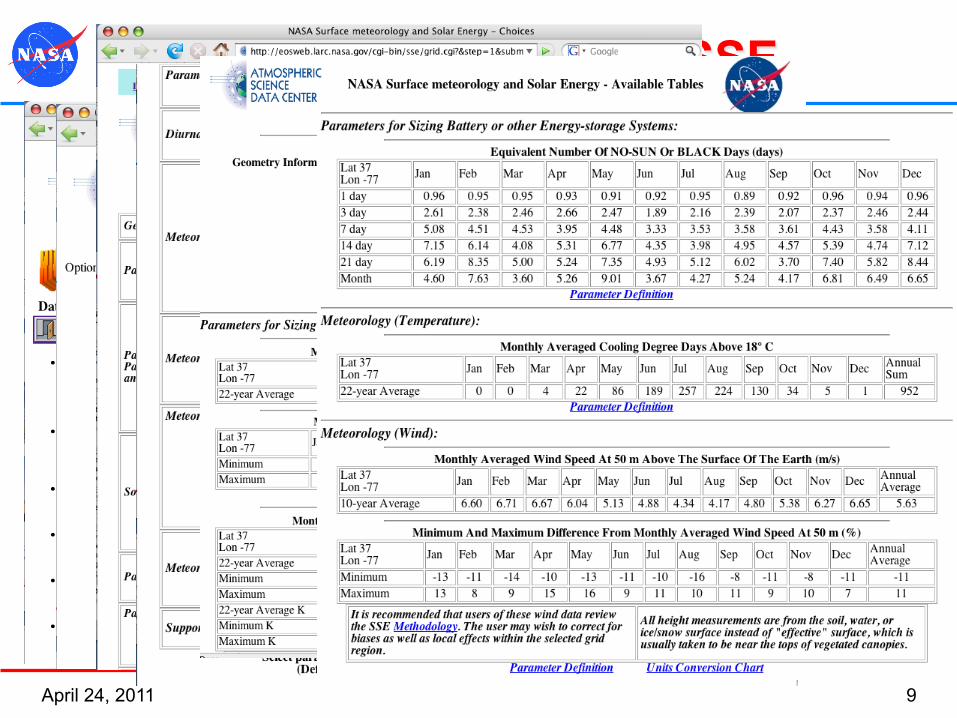
April 24, 2011 9
Obtaining Data From SSE

April 24, 2011 10
Parameter Validation: Key to Usage
Power validation significant, included in extensive methodology document

April 24, 2011 11
Decision Support: RETScreen
www.retscreen.net
• Clean Energy Project Analysis Tool • Aimed for both feasibility and detailed scenario analysis
• RETScreen 4 built on Excel; New RETScreen Plus stand-alone • Partners since 2000
• Over 330,000 users in 36 different languages

April 24, 2011 12
RETScreen’s Reliance on POWER Data • Built-in cities of world
• In situ used if present (red)
• If missing uses NASA (blue)
• If partial missing supplement with NASA (most)
• Direct query of SSE data through web
NASA data In Situ data
RETScreen Climate Database
Points represent world’s cities (~10,000). Red have in situ observations. Blue defer to NASA LaRC data sets (~5,000). Data for locations between points are found through a direct link to SSE.

April 24, 2011 13
Example Usage: RETScreen Clean Energy Projects
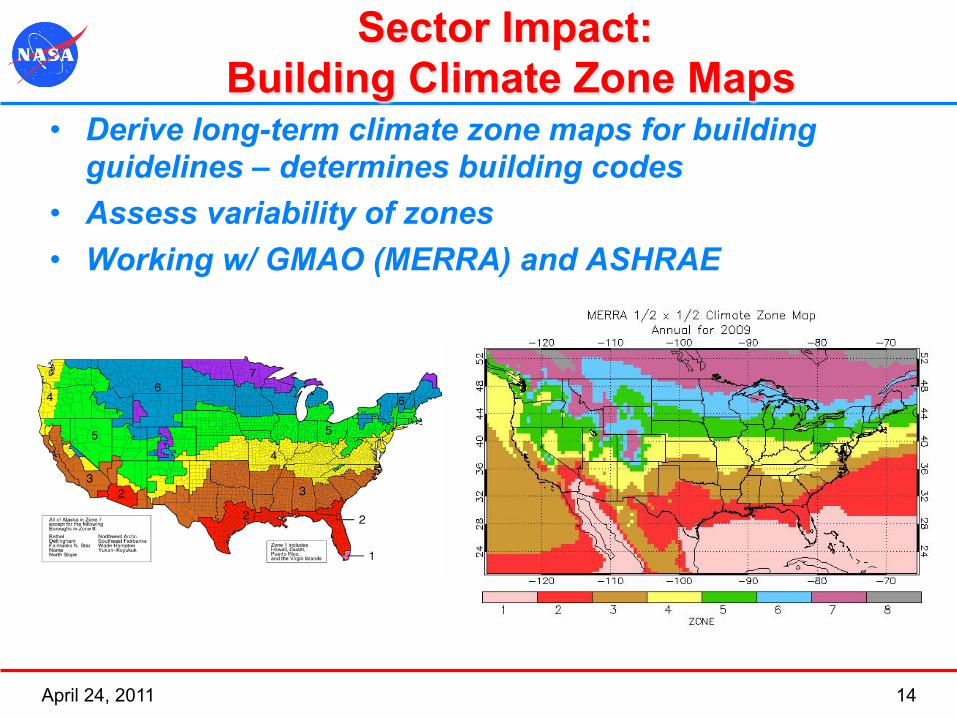
Sector Impact: Building Climate Zone Maps
• Derive long-term climate zone maps for building guidelines – determines building codes
• Assess variability of zones • Working w/ GMAO (MERRA) and ASHRAE
April 24, 2011 14

April 24, 2011 15
POWER Web Site http://power. larc.nasa.gov
Provides access to both Long-term and Near-Term Time Data Sets

swv_dwn Average Insolation Incident On A Horizontal Surface kWh/m^2/day lwv_dwn Average Downward Longwave Radiative Flux kWh/m^2/day toa_dwn Average Top-of-atmosphere Insolation kWh/m^2/day avg_kt Average Insolation Clearness Index 0 to 1.0 clr_sky Average Clear Sky Insolation On A Horizontal Surface kWh/m^2/day clr_kt Average Clear Sky Insolation Clearness Index 0 to 1.0 PS Average Atmospheric Pressure kPa
T2M Average Air Temperature At 2 m degrees C T2MN Minimum Air Temperature At 2 m degrees C T2MX Maximum Air Temperature At 2 m degrees C Q2M Average Humidity Ratio At 2 m
RH2M Relative Humidity At 2 m % DFP2M Dew/Frost Point Temperature At 2 m degrees C
TSKIN Average Earth Skin Temperature degrees C
WS10M Wind Speed At 10 m m/s
NASA’s Near Real-time Daily Averaged Data Time Series
Variable Parameter Units
Note: Precipitation will be included in future data products April 24, 2011 16
April 24, 2011 17
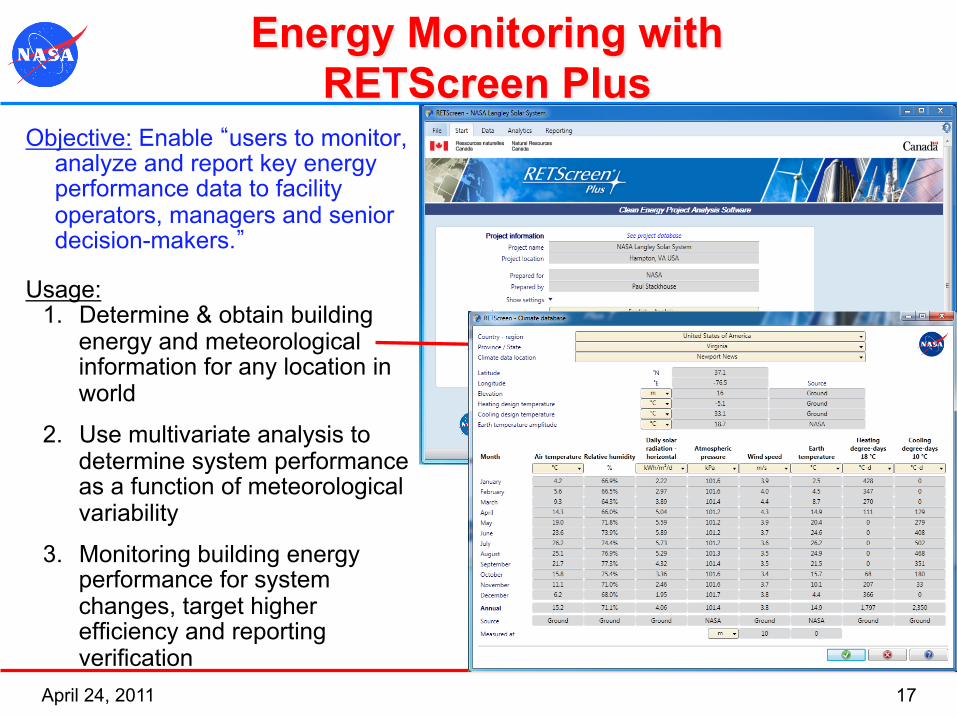
Energy Monitoring with RETScreen Plus
Objective: Enable “users to monitor, analyze and report key energy performance data to facility operators, managers and senior decision-makers.”
Usage:
1. Determine & obtain building energy and meteorological information for any location in world
2. Use multivariate analysis to determine system performance as a function of meteorological variability
3. Monitoring building energy performance for system changes, target higher efficiency and reporting verification

Monitoring and Targeting Case: NASA LaRC Badge and Pass Office
April 24, 2011 18

Step 3: Cumula-ve differences in output rela-ve to system func-on shows noise but performance steady.
Step 1: LaRC based CERES FLASHFlux project surface solar flux (blue) vs. Solar Panel Electrical Output (green) gives excellent correla-on.
RETScreen Plus Tool
Step 2: Regression rela-onship defines the system as a func-on of available solar energy
Total Energy = 59,000 kWhr, 18% greater than specified
Monitoring and Targeting Case 1: NASA LaRC Badge and Pass Office
19
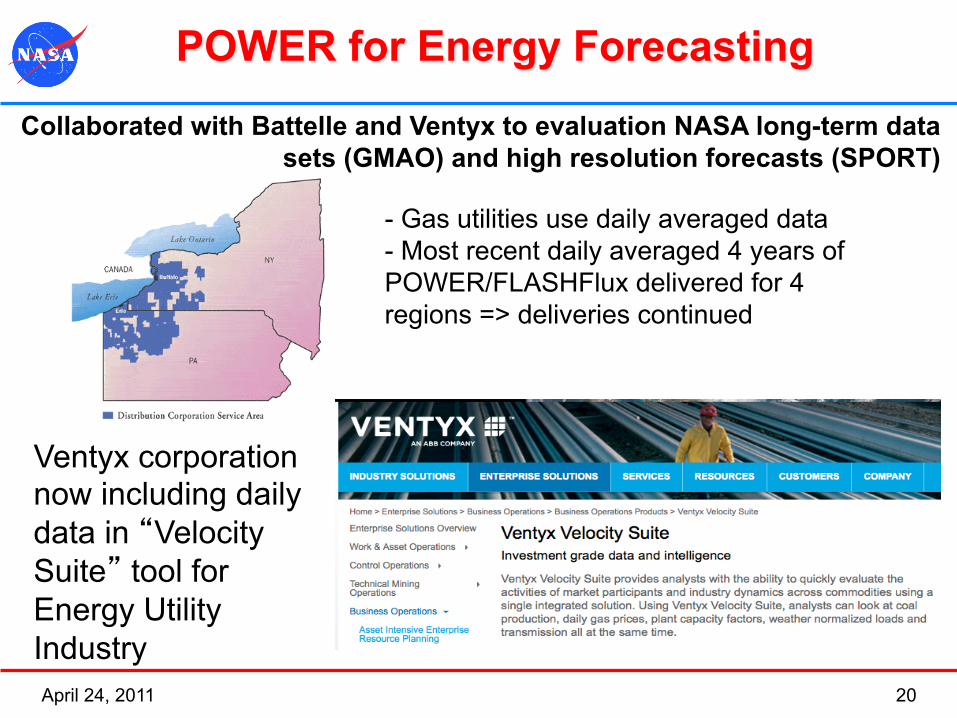
POWER for Energy Forecasting
Collaborated with Battelle and Ventyx to evaluation NASA long-term data sets (GMAO) and high resolution forecasts (SPORT)
- Gas utilities use daily averaged data - Most recent daily averaged 4 years of POWER/FLASHFlux delivered for 4 regions => deliveries continued
Ventyx corporation now including daily data in “Velocity Suite” tool for Energy Utility Industry April 24, 2011 20

April 24, 2011 21
Conclusions
• NASA long-term and near-term time data sets are tailored to energy industry data needs with partnerships such as with RETScreen and ASHRAE
• Current accuracies sufficient to determine statistics of meteorological and solar variability for project feasibility and climatological information (i.e., building climate zones)
• Time series data together with RETScreen Plus tool together provide a new capability to assess building energy system performance at any location in the world.
• The potential usefulness grows as these global data sets are improved in quality and in resolution, a byproduct of continuing research

Extras
April 24, 2011 22

Monitoring and Targeting Case 2: Apartment Building Cluster, Höganäs, Sweden
• Apartment building complex in Sweden
• Use RETScreen Plus & NASA temperature data to assess energy usage before and after energy efficiency upgrade
April 24, 2011 23
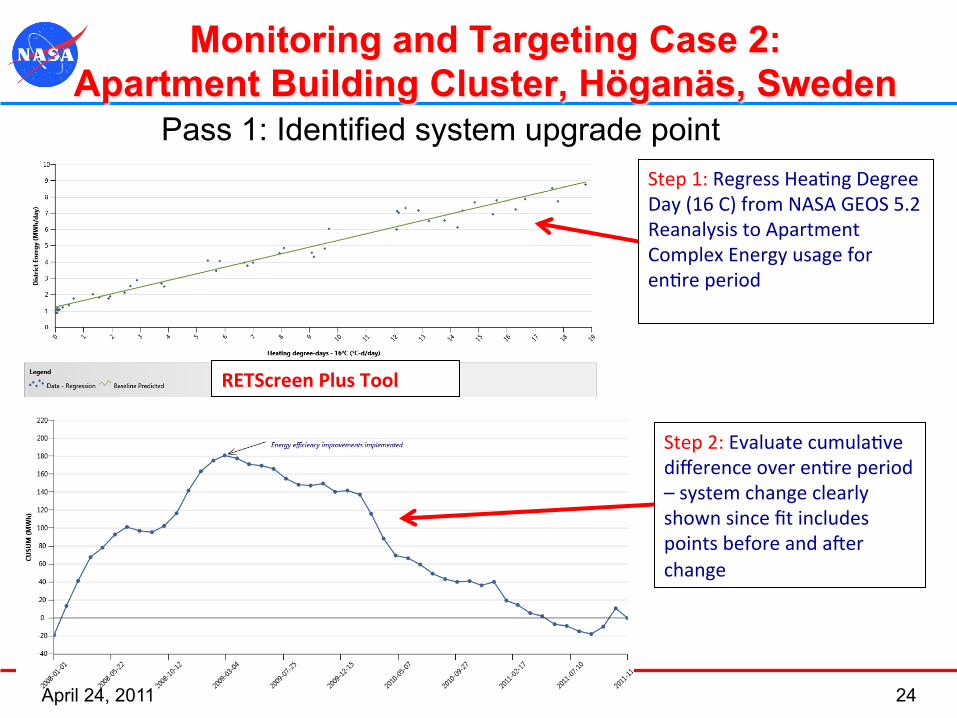
Step 2: Evaluate cumula-ve difference over en-re period – system change clearly shown since fit includes points before and aYer change
Monitoring and Targeting Case 2: Apartment Building Cluster, Höganäs, Sweden
RETScreen Plus Tool
Step 1: Regress Hea-ng Degree Day (16 C) from NASA GEOS 5.2 Reanalysis to Apartment Complex Energy usage for en-re period
Pass 1: Identified system upgrade point
April 24, 2011 24

Step 2: Evaluate cumula-ve difference over en-re period – system change clearly shown since fit includes points before and aYer change
Monitoring and Targeting Case 2: Apartment Building Cluster, Höganäs, Sweden
RETScreen Plus Tool
Step 1: Regress Hea-ng Degree Day (16 C) from NASA GEOS 5.2 Reanalysis to Apartment Complex Energy usage for period preceding change
Pass 2: Define system before change, assess impact
Energy Efficiency Upgrade
Savings 1st Year: 224 MWhr
Savings 2nd Year: 337 MWhr
Total 2 Year Savings ~ $50,000 US
April 24, 2011 25

Near Real-Time Data Access
April 24, 2011 26

Monitoring and Targeting Case 1: NASA LaRC Badge and Pass Office
• RETScreen Plus and NASA resolve system specification misunderstanding – Contractor provided climatological
specifications for system with constant 20 degree tilt, but system plans showed a 25 degree tilt.
– Original RETScreen Plus analysis using NASA surface irradiance produced a poor fit with unexplained behavior.
– Behavior was only explained by changing the tile angle of the panels in RETScreen Plus. Subsequent measurements verified that the system has a 26 degree tilt.
April 24, 2011 27

NASA GEOS 5.2 (1 x 1) vs NCDC Surface Obs
April 24, 2011 28
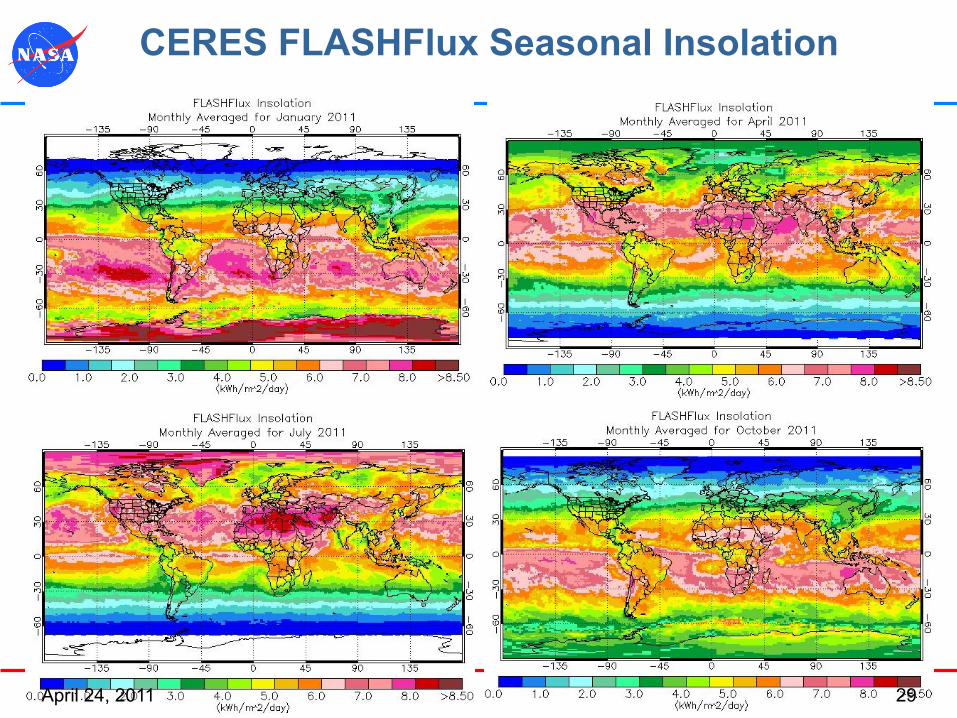
CERES FLASHFlux Seasonal Insolation
April 24, 2011 29

CERES FLASHFlux Solar Flux Validation vs SURFRAD
Daily Averaged Ensemble Differences:
Bias << 1% RMS < 16%
well within industry needs
April 24, 2011 30