
Up-conversion luminescence in Ho< sup> 3+ and Tm< sup> 3+ co-doped Y< sub> 2 O< sub> 3: Yb< sup> 3+
Hindawi Publishing CorporationJournal of NanomaterialsVolume 2007, Article ID 48247, 10 pagesdoi:10.1155/2007/48247
Research ArticleLuminescence, Energy Transfer, and UpconversionMechanisms of Y2O3 Nanomaterials Doped withEu3+, Tb3+, Tm3+, Er3+, and Yb3+ Ions
TranKim Anh,1 Paul Benalloul,2 Charles Barthou,2 Lam thiKieu Giang,1 Nguyen Vu,1 and LeQuoc Minh1, 3
1 Institute of Materials Science, Vietnamese Academy of Science and Technology, 18 Hoang Quoc Viet Road, Cau Giay,Hanoi, Vietnam
2 Institute des Nanosciences de Paris (INSP), UMR-CNRS 7588, Universites Pierre et Marie Curie et Denis Diderot,140 Rue de Lourmel, Paris 75015, France
3 College of Technology, Vietnam National University, 144 Xuan Thuy Street, Cau Giay District, Hanoi, Vietnam
Received 21 May 2007; Revised 16 December 2007; Accepted 31 December 2007
Recommended by Wieslaw Strek
Luminescence, energy transfer, and upconversion mechanisms of nanophosphors (Y2O3 : Eu3+, Tb3+, Y2O3 : Tm3+, Y2O3 : Er3+,Yb3+) both in particle and colloidal forms were studied. The structure, phase, and morphology of the nanopowders and nanocol-loidal media were determined by high-resolution TEM and X-ray diffraction. It was shown that the obtained nanoparticles havea round-spherical shape with average size in the range of 4 to 20 nm. Energy transfer was observed for Y2O3 : Eu3+, Tb3+ colloidaland powders, upconversion transitions were observed for both Y2O3 : Er3+ and Y2O3 : Er3+, Yb3+ nanophosphors. The dependenceof photoluminescence (PL) spectra and decay times on doping concentration has been investigated. The infrared to visible con-version of emission in Y2O3 : Er3+, Yb3+ system was analyzed and discussed aiming to be applied in the photonic technology.
Copyright © 2007 TranKim Anh et al. This is an open access article distributed under the Creative Commons Attribution License,which permits unrestricted use, distribution, and reproduction in any medium, provided the original work is properly cited.
1. INTRODUCTION
Luminescent nanomaterials in the form of nanoparticles,nanorods, nanowires, nanotubes, as well as colloidal or bulknanocrystals are of interest not only for basic research, butalso for interesting application [1–3]. High surface to vol-ume ratio, local phenomena such as absorption or changein the surface electronic state may contribute significantly tospecial properties. An understanding of luminescent proper-ties, energy transfer (ET), and upconversion could determinehow to tailor nanophores for a given application. Nanoma-terials have potential application as efficient display phos-phors, such as in new flat panel displays with low-energyexcitation source [2, 3]. Y2O3:Eu3+ phosphor, one of themost promising oxides-based red phosphors, was studied fora long time because of its efficient luminescence under ul-traviolet (UV) and cathode-ray excitation. Y2O3:Eu3+ withmicrometer size grains was used as the red component inthree chromatic lamps and projection color television [4–6].Numerous studies were focused on synthesis and opticalproperties of nanosized Y2O3:Eu3+ phosphors [7–10]. Size-dependence efficiency in Y2O3:Tb3+ [11] and effect of grain
size on wavelength of Y2O3:Eu3+ [12] were investigated. Dif-ferent methods were used to prepare Y2O3:RE3+ nanocrystals[13–19] such as chemical vapor synthesis [15], combustion[16, 17], sol-gel [18], and aerosol pyrolysis [19]. Relation-ship between optical properties and crystalline of nanome-ter Y2O3:Eu3+ phosphor has been investigated [20]. The newmethod of polyol-mediated synthesis of nanoscale materi-als was presented [21, 22] and the luminescence propertiesof nanocrystalline Y2O3:Eu3+ were investigated [23]. Anhet al. studied the ET between Tb3+ and Eu3+ in Y2O3 mi-crocrystals [4]. The role of the active center concentrationsin the ET of lanthanide ions was investigated not only forY2O3:Tb3+, Eu3+, but also for organic compound glutamicacid as well as LnP5O14 laser crystals [24]. ET and relaxationprocesses in Y2O3:Eu3+ were studied [25]. Preparation andoptical spectra of trivalent rare earth ions doped cubic Y2O3
nanocrystal have received our considerable attention over 10years [10, 16, 26–33]. Not only the Eu3+-Tb3+ couple, butalso the Er3+-Yb3+one are attractive for application in visibleemission by ET and upconversion processes. Among emis-sion properties of Y2O3 doped with rare earth ions, upcon-version is the most attractive phenomenon not only from

2 Journal of Nanomaterials
photophysic mechanism, but also for application. The en-hancement of the red emission via upconversion in bulk andnanocrystalline cubic Y2O3:Er3+ has been studied [34]. Red,green, and blue upconversion luminescences of trivalent rareearth ion doped Y2O3 nanocrystals were investigated [35].Effect of Yb3+codoping on the upconversion luminescenceproperties of Y2O3:Yb3+, Er3+ nanocrystallines and nanos-tructures have been studied [36–38]. The absorption andemission spectroscopy of Er3+-Yb3+ doped aluminum oxidewaveguides were reported [39].
The oxide lattice has proved to be an excellent host ma-terial for some of the most powerful laser built. Amongthem, Y2O3 is characterized by low-phonon frequencieswhich make inefficient nonradiative relaxation of the excitedstates. The Y2O3 host was chosen due to its high refrac-tory properties with a melting point of about 2450◦C, a veryhigh thermal conductivity of 33 W m−1 K−1, and a density of5.03 g cm3. Y2O3 is a suitable material for photonic waveg-uide due to its high-energy band gap of 5.8 eV, a high re-fractive index about 2, and a wide transmission region from280 nm to 8 micrometer. Eu3+ exhibits an atomic-like transi-tion in red region at 612 nm. Er3+ emissions lie in infraredaround 1530 nm as well as upconversion in visible rangesof green and red. The blue emission of Tm3+ ions is one ofthe three important basic colors of display. However, up tonow, few articles were devoted to Y2O3 doped with Tm3+ andcodoped with Tb3+, Eu3+ or Yb3+, Er3+ in both the nanopow-der or nanocolloidal forms.
In this work, we report on new synthesis of Y2O3
nanophosphor in the two forms of powders and colloidaldoped with Tb3+, Eu3+, Tm3+, Er3+, and Yb3+. The concen-tration dependence and the influence of size on the lumi-nescent properties will be discussed. The investigation of ETbetween Tb3+ and Eu3+, and the mechanism of upconversionin Y2O3:Er3+, Yb3+ nanosize are of the main points.
2. EXPERIMENT
The powder nanophosphors Y2O3:Eu3+ (1–10 mol%),Y2O3:Er3+ (1–15 mol%) and Y2O3:Er3+ (1 mol%), Yb3+
(5%), and Y2O3:Tm3+ (1–4 mol%) were prepared by com-bustion reaction. Europium oxide (99.995%, CERAC),Yttrium oxide (99.999%, ALFA), and nitric acid and urea(99%, SIGMA-ALDRICH) were used as starting raw mate-rials to prepare Y2O3:Eu3+. Y(NO3)3 and RE(NO3)3 stocksolutions were prepared by dissolving Y2O3, Er2O3, Yb2O3,and Eu2O3 in nitric acid and diluting with deionized water.The synthesis reaction is [28]
(2− 2x)Y(NO3)3 + 2x RE(NO3)3 + 5(NH2)2CO
−→ (Y1−xREx)2O3 + 5CO2 + 8N2 + 10 H2O.(1)
Nanocolloidal samples of Y2O3, Y2O3:Eu3+, Tb3+,Y2O3:Tm3+ with different Eu3+ concentrations of 1, 3,5, 7, and 10 mol%, Tb3+ concentration of 1.25 mol%, andTm3+ concentrations of 1–4 mol% were prepared by a directprecipitation route from high-boiling polyol solution [22].The starting materials were YCl3, EuCl3, TbCl3, TmCl3,NaOH, and diethylene glycol (DEG) with high purity grade.
The samples were checked by the X-ray diffractome-ter (D5000, Siemens). The morphology and particle sizesof Y2O3:RE3+ were observed by transmission electron mi-croscopy (TEM, H7600, Hitachi), high-resolution trans-mission electron microscopy HRTEM Philips CM200, 160KV, and FE-SEM (S4800, Hitachi). Photoluminescent mea-surements were performed using a Jobin Yvon HR 460monochromator and a multichannel CCD detector from in-struments SA model Spectraview-2D for the visible and nearinfrared range and a Triax 320 with a PDA multichannel 256pixels detector for the IR range. The decay time was ana-lyzed by a PM Hamamatsu R928 and Nicolet 490 scope witha time constant of the order of 7 nanoseconds. Kimmon He-Cd laser (325 nm excitation), Nitrogen laser (337.1 nm), andDiode laser or Ti-Sapphire laser were used as the excitationsources.
3. RESULTS AND DISCUSSION
3.1. Morphology and structure of nanopowdersand nanocolloidal media
Figure 1 shows TEM and HRTEM images of Y2O3 nanocol-loidal and electron diffraction of Y2O3 nanoparticles. Onecan notice that our samples are spherical shaped, small sized(5 nm), and with narrow distribution.
The synthesis of useful amounts of sub 5 nm sizelanthanide-doped oxides remains a challenge in optical ma-terial research. A few weeks ago, stable colloidal was pre-pared and has been reported in [22]. For the first time,nanocolloidal codoped Tb3+ and Eu3+ and oxide particlesuspension were prepared in our laboratory. The transpar-ent suspensions of particles dispersed in organic solventwere obtained with high stability for a year. The absorp-tion spectra of the colloids have been characterized witha strong and broad band for Y2O3, Y2O3:Eu3+, Y2O3:Tb3+,Y2O3:Tm3+, Y2O3:Eu3+, Tb3+ nanoparticles in the long rangefrom 230 nm to 380 nm with the maxima around 240–250 nm.
X-ray diffraction of Y2O3:RE3+ samples annealed at dif-ferent temperatures was studied. The pure polycrystallineY2O3 was used as standard sample for the correction ofthe instrumental line broadening. The profiles of diffract-ing peaks were fitted to the ps-voigt1 function. The grainsizes and size distribution have been determined by the WIN-CRYSIZE program packet [40]. The column length distri-bution can be obtained from double differentiation of theFourier transform of the line profile [41]. According to thismethod, the reflection intensity of the given set of latticeplanes is expressed in terms of a sum of the intensitiesfrom all columns of lattice cells perpendicular to the planes[42, 43].
Figure 2 exhibits X-ray diffraction (XRD) patterns ofY2O3:Eu3+ (5%) annealed at 500, 550, 600, 700, and 900◦C.The powder annealed at 500◦C is amorphous. The Y2O3 cu-bic phase appears when annealed above 550◦C.
The main diffraction peaks, in agreement with the JCPDS41-1105 reference, correspond to the [222], [400], [440], and[622] planes. However, the widths of the diffraction lines are

TranKim Anh et al. 3
50 nm
(a)
5 nm
(b) (c)
Figure 1: (a) TEM, (b) HRTEM images of Y2O3 nanocolloidal, and (c) the corresponding electron diffraction pattern of Y2O3 nanoparticles.
26 28 30 32 34 36 38 40 42 44 46 48 50 52 54 56 58
2θ (deg)
0
2000
(Cps
)
2θ-sacle SIEMENS D5000, X-ray lab., Hanoi 10-May-2006 15 : 58
abcde
222
400
411 332 431521
440
433 541
622
Figure 2: (a) XRD diffraction pattern of Y2O3:Eu3+ (5 mol%) pow-ders annealed at 500◦C, (b) 550◦C, (c) 600◦C, (d) 700◦C, and (e)900◦C.
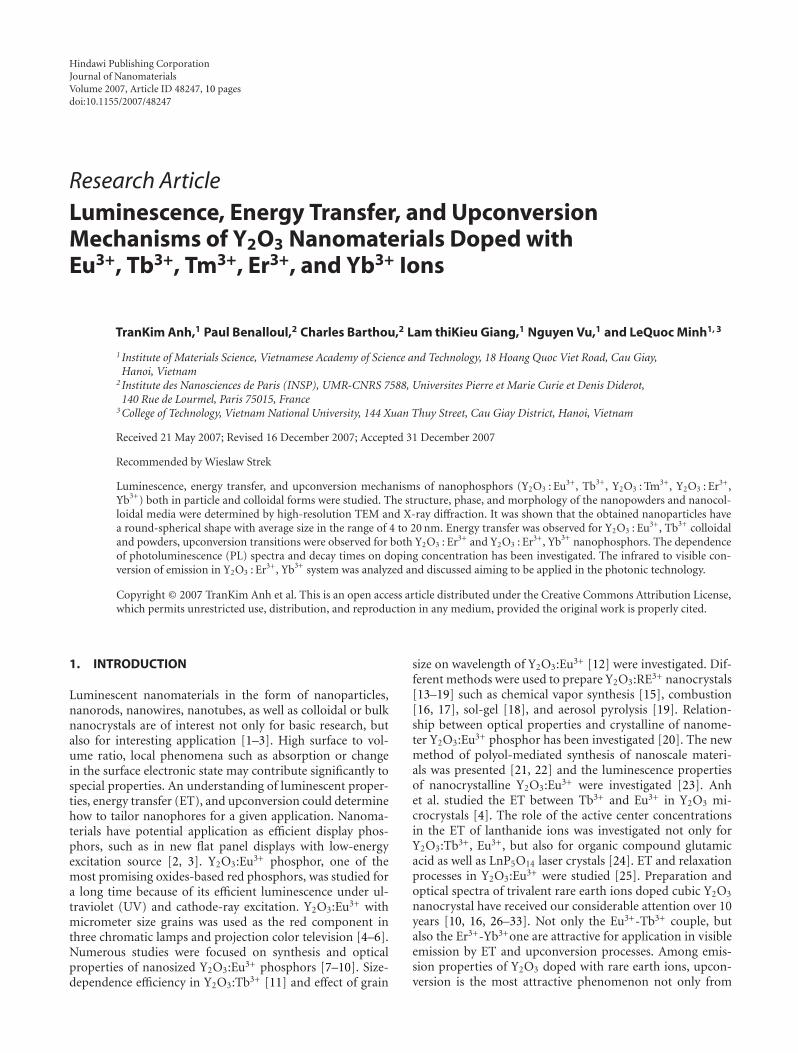
broadened because of the small size of the crystallites. Thenthey get narrower and narrower at higher temperatures. Thisprocess reflects the fact that the crystalline size is increasingwith temperature of annealing process. The peak profiles of[222] reflection (in Figure 2, at 2θ = 29.150) were used forstarting data of Warren-Averbach method [41]. This methodwas used to study nanocrystalline gold [42]. It was noted thatthe results of the average column length usually differ fromcrystallite sizes evaluated from Scherer equation [43]. Themain reason is due to the Warren-Averbach method whichprovides a volumetric average of the crystallite size. We cansee that the size distributions for small grains <10 nm haveasymmetrical shape with small FWHM (of the size distribu-tion), while for bigger grains they become more symmet-rical and their FWHM are larger. The size distribution ofY2O3:Eu3+ (5%) versus annealing temperature and time cal-culated by Warren-Averbach method is presented in Table 1and Figure 3.
The XRD of Y2O3:Er3+ 10 mol% nanomaterials (an-nealed at 600◦C for 30 minutes) also shows a cubic symmetrylike the Y2O3 reference powder. The FWHM of the diffrac-tion lines for nanomaterials is larger than that of the Y2O3
crystals. The sizes are about 7 nm and 23.4 nm, respectively,the FWHM of the size distribution for the nanopowder is11 nm and 20.1 nm for the sample annealed at 600◦C for 30
Table 1: Size and FWHM of Y2O3:Eu3+ particles versus annealingtemperature and time.
T (◦C) Time (min) d (nm) FWHM (nm)
550 60 4.4 7.3
600 30 5.6 6.9
700 30 15.2 9.3
900 30 46.1 20.6
900 60 72.2 22.6
minutes and at 800◦C for 30 minutes, respectively. These datawere also calculated by using the Warren-Averbach method.For the Y2O3:Tm3+ nanophores, the mean sizes of the parti-cle are 7.2, 7.4, and 7.7 nm, respectively, with Tm3+ concen-trations of 0.1, 1, and 4 mol%.
3.2. Luminescent spectra
Size-dependent efficiency was reported in Tb-doped Y2O3
nanocrystalline phosphor [11]. In Y2O3:Tb3+ nanocrys-talline, the efficiency varied as the square of the particle sizeranged from 100 to 40 A. It could be nonradiative contri-butions decrease with the decrease in particle size. On theother hand, effects of grain size from 43 nm to 71 nm onwavelength of Y2O3:Eu3+ emission spectra are investigatedin detail [12]. The blue shift effect of emission was observedvery small in Y2O3:Eu3+ nanophosphor. In contrast, we couldnot find any blue shift change in the luminescent spectra ofY2O3:Eu3+ prepared by combustion reaction.
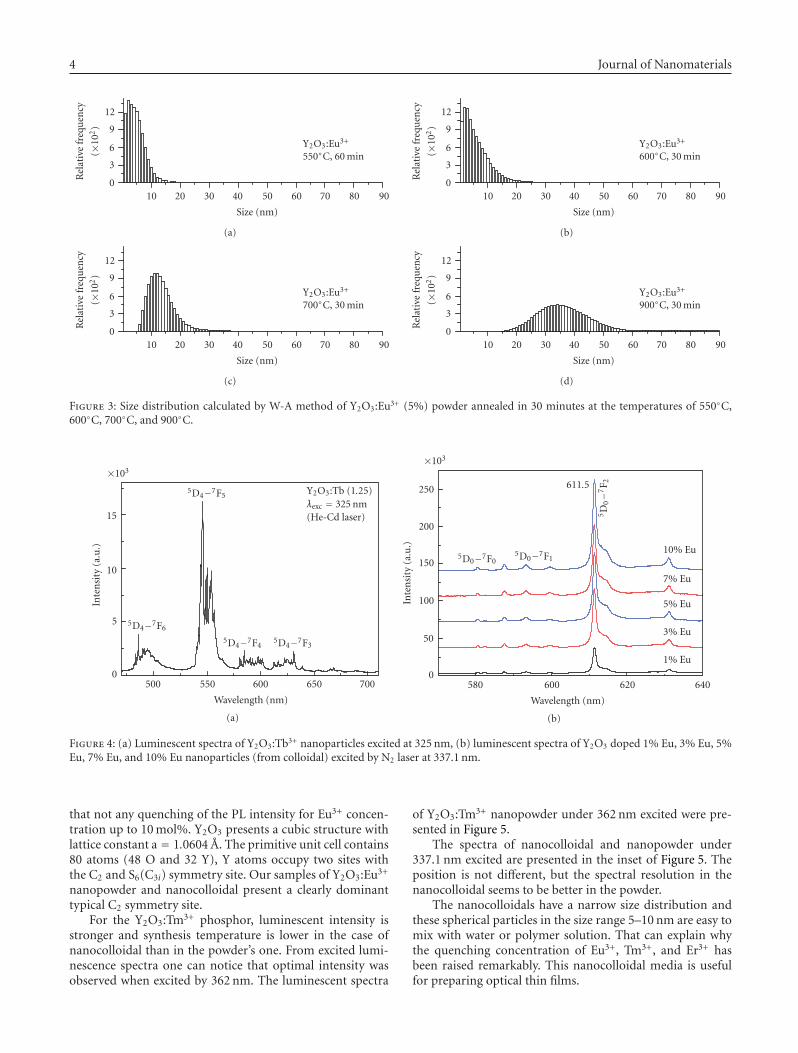
The photoluminescent (PL) spectra of Y2O3:Tb3+
nanocolloidal correspond to the 5D4-7FJ transitions accord-ing to the energy diagram and fluorescence processes of Tb3+
[5] (Figure 4(a)).The PL spectra of Y2O3:Eu3+ nanocolloidal with differ-
ent concentrations (from 1 to 10 mol%) under 337.1 nm N2
laser excitation show narrow emission peaks correspondingto the 5D0-7FJ (J = 0, 1, 2, 3, 4) transitions of Eu3+, with themost intense peak at 611 nm for the case of J = 2. Figure 4(b)presents the luminescent spectra of Y2O3-doped 1, 3, 5, 7,and 10% Eu3+ nanocolloidal under 337.1 nm N2 laser excita-tion. The PL spectra of Y2O3:Eu3+ nanocolloidal also indicate
4 Journal of Nanomaterials
10 20 30 40 50 60 70 80 90
Size (nm)
0
3
6
9
12
Rel
ativ
efr
equ
ency
(×10
2)
Y2O3:Eu3+
550◦C, 60 min
(a)
10 20 30 40 50 60 70 80 90
Size (nm)
0
3
6
9
12
Rel
ativ
efr
equ
ency
(×10
2)
Y2O3:Eu3+
600◦C, 30 min
(b)
10 20 30 40 50 60 70 80 90
Size (nm)
0
3
6
9
12
Rel
ativ
efr
equ
ency
(×10
2)
Y2O3:Eu3+
700◦C, 30 min
(c)
10 20 30 40 50 60 70 80 90
Size (nm)
0
3
6
9
12
Rel
ativ
efr
equ
ency
(×10
2)
Y2O3:Eu3+
900◦C, 30 min
(d)
Figure 3: Size distribution calculated by W-A method of Y2O3:Eu3+ (5%) powder annealed in 30 minutes at the temperatures of 550◦C,600◦C, 700◦C, and 900◦C.
0
5
10
15
×103
Inte
nsi
ty(a
.u.)
700650600550500
Wavelength (nm)
5D4−7F5
5D4−7F6
5D4−7F45D4−7F3
Y2O3:Tb (1.25)λexc = 325 nm(He-Cd laser)
(a)
0
50
100
150
200
250
×103
Inte
nsi
ty(a
.u.)
640620600580
Wavelength (nm)
611.5
5D
0−7
F 2
5D0−7F05D0−7F1
10% Eu
7% Eu
5% Eu
3% Eu
1% Eu
(b)
Figure 4: (a) Luminescent spectra of Y2O3:Tb3+ nanoparticles excited at 325 nm, (b) luminescent spectra of Y2O3 doped 1% Eu, 3% Eu, 5%Eu, 7% Eu, and 10% Eu nanoparticles (from colloidal) excited by N2 laser at 337.1 nm.
that not any quenching of the PL intensity for Eu3+ concen-tration up to 10 mol%. Y2O3 presents a cubic structure withlattice constant a = 1.0604 A. The primitive unit cell contains80 atoms (48 O and 32 Y), Y atoms occupy two sites withthe C2 and S6(C3i) symmetry site. Our samples of Y2O3:Eu3+
nanopowder and nanocolloidal present a clearly dominanttypical C2 symmetry site.
For the Y2O3:Tm3+ phosphor, luminescent intensity isstronger and synthesis temperature is lower in the case ofnanocolloidal than in the powder’s one. From excited lumi-nescence spectra one can notice that optimal intensity wasobserved when excited by 362 nm. The luminescent spectra
of Y2O3:Tm3+ nanopowder under 362 nm excited were pre-sented in Figure 5.
The spectra of nanocolloidal and nanopowder under337.1 nm excited are presented in the inset of Figure 5. Theposition is not different, but the spectral resolution in thenanocolloidal seems to be better in the powder.
The nanocolloidals have a narrow size distribution andthese spherical particles in the size range 5–10 nm are easy tomix with water or polymer solution. That can explain whythe quenching concentration of Eu3+, Tm3+, and Er3+ hasbeen raised remarkably. This nanocolloidal media is usefulfor preparing optical thin films.

TranKim Anh et al. 5
0
1
2
3
×105
Inte
nsi
ty(a
.u.)
600550500450400
Wavelength (nm)
1D2−3F4
452.5 nm
1G4−3H6
488 nm
459.5 nm
463 nm
λexc = 362 nmT = 300 K
450 460 470λ (nm)
0
2000
4000
6000
Inte
nsi
ty(a
.u.)
1
2
1% Tm2% Tm4% Tm
Figure 5: Luminescent spectra in dependence on Tm3+ concentra-tion in Y2O3:Tm3+ (1, 2, 4 mol%) nanopowder under 362 nm exci-tation. Inset: luminescent spectra of Y2O3:Tm3+ nanocolloidal (1)and nanopowder (2) under 337.1 nm excitation.
3.3. Energy transfer and upconversion mechanisms
The role of concentration, temperature, solvents as well asupconversion, and ET mechanism were investigated in de-tail for Y2O3 nanophores containing Eu3+, Tb3+, Er3+, andYb3+ rare earth ions [34]. ET between Tb3+ and Eu3+ innanopowder has been elucidated from the luminescent spec-tra of (Y0.95EuxTby)2O3 (with x/y = 8/2, 9/1, 7/3) by Anhet al. in our previous paper [28]. In Y2O3:Tb3+, Eu3+ sam-ple, the spectra exhibits the well-known 5D0-7FJ line emis-sions (J = 0, 1, 2, . . .) of the Eu3+ ion with the strongest linefor J = 2 at 612 nm in the red region. The peak at 546 nmassigned to the 5D4-7F5 transition of Tb3+ ions is also ob-served. But the intensity of this peak is much lower than thepeak corresponding to the 5D0-7F2 transition of Eu3+. Thepeak at 546 nm was also lower for the Eu3+ and Tb3+ codopedsample than the Tb3+ doped one. One can notice that theemission spectra of Tb3+ in Y2O3 nanocrystal are slightlyquenched by Eu3+ ions due to energy transfer from Tb3+ toEu3+. The luminescent spectra of Y2O3:Tb3+ (1.25%), Eu3+
(5%), and Y2O3:Tb3+ (1.25%) nanocolloidals are shown inFigure 6. The intensity of the Eu3+ emission based on energytransfer from Tb3+ was analyzed in previous papers [28, 32].
Under 980 nm irradiation, upconversion spectra in thevisible range from 500 nm–700 nm of Y2O3 : Er3+ (dashdot line) and Y2O3:Er3+, Yb3+ (solid line) are presented inFigure 7(a). The Er3+-Er3+ upconversion mechanism is ex-plained in accordance with the energy schema (Figure 7(b),right). There is a great interest in the use of upconversionmaterials for efficient conversion of infrared radiation tovisible light. This phenomenon has applications in several
0
20
40
60
×103
Inte
nsi
ty(a
.u.)
700650600550500
Wavelength (nm)
5D4−7F5
(Tb3+)
5D4−7F6
(Tb3+)
5D4−7F5
(Tb3+)5D0−7F0,1
(Eu3+)
5D0−7F2
(Eu3+)
5D0−7F3
(Eu3+)
5D0−7F4
(Eu3+)
λexc = 325 nm(He-Cd laser)
525 550 575
1
2
1
2
Figure 6: Luminescent spectra of Y2O3:1.25%Tb3+ (1) andY2O3:1.25%Tb3+, 5%Eu3+ (2) nanocolloidal excited by He-Cd laserat 325 nm, inset to compare intensity of Tb3+ in Y2O3:1.25%Tb3+
and Y2O3:1.25%Tb3+, 5%Eu3+.
areas, such as upconversion lasing, and two photons fluo-rescence imaging, cathodoluminescence, and other applica-tions. The Er3+ ion finds uses in laser materials and opti-cal amplifiers under ground- and excited-state transitionsnear 800 and 980 nm, where high-power diodes are available[5]. In Y2O3:Er3+ nanophosphor, the green and red fluores-cence lines are observed in our samples after 800 nm excita-tion, owing to the transitions (2H11/2,4 S3/2) → 4I15/2 (515–575 nm) and 4F9/2 → 4I15/2 (640–690 nm) [26, 34]. Under980 nm irradiation, the Er3+ ion is excited to the 4F7/2 statevia two successive energy transfers. An NIR photon from thepump beam will excite an Er+3 ion from the 4I15/2 groundstate to the 4I11/2 state. Another Er3+ ion also in the 4I11/2
state and in close proximity will transfer its energy to theinitial ion, thereby exciting it to the 4F7/2 state. The loweremitting levels are then populated via multiphonon relax-ation and green and red emissions are then observed.
Interactions between two Er3+ ions cannot be ignored.Following the addition of Yb3+ ions, this process is greatlydiminished due to the large absorption cross-section of theYb3+ ions. The Er3+ absorption cross-section at this 980 nmwavelength is not very high. By the addition of Yb3+, pump-ing promotes an electron from the 2F7/2 ground state to the2F7/2 manifold of Yb3+; the excited Yb3+ ion then transfers itsenergy to the Er3+ 4I11/2 level (Figure 7(b)).
Since the population of the 4I13/2 level was increased, thelifetime was also increased. Two deleterious processes canalso occur: via back energy transfer from Er3+ to Yb3+ ions,or double energy transfer, where a second excited Yb3+ iontransfers its energy to the Er3+ ion and promotes one electronfrom the 4I11/2 to the 4F7/2. When the Yb3+ concentration isenhanced, the Er3+ ions start to “see” Yb3+ ions and delete-rious Er3+↔Er3+ energy exchanges are progressively replacedby the beneficial Yb3+↔Er3+ transfers.

6 Journal of Nanomaterials
Inte
nsi
ty(a
.u.)
680640600560520
Wavelength (nm)
Y2O3:Er (1%)Y2O3:Er (1%), Yb (5%)
2H11/2, 4S3/2 → 4I15/2
4F9/2 → 4I15/2
(a)
0
5
10
15
20
E(×
103
cm−1
)
Er3+Yb3+
2F5/2
2F7/2 4I15/2
4I13/2
4I11/2
4I9/2
4F9/2
4S3/2
2H11/2
4F7/2
∼ 550 nm
∼ 650 nm
∼ 1550 nm
(b)
Figure 7: (a) Upconversion spectra in the visible range from 500 nm to 700 nm of Y2O3:Er3+ (dash doted line) Y2O3:Er3+, Yb3+ (solid line)following 980 nm irradiation, (b) energy schema presented the upconversion fluorescence interacted between Er-activator and Yb-sensitizer.
Comparing codoped Y2O3:Er3+, Yb3+ nanophosphorswith Er3+ concentration varying from 0.1 to 5 mol% and5 mol% Yb3+, the optimal content for the luminescent inten-sity at 1538 nm ( 4I13/2-4I15/2 transition) is 1 mol% Er3+. Theupconversion in the red region 640–675 nm presents also amaximum for 1 mol% Er3+. The effect of Er3+ concentrationon upconversion luminescence of Y2O3:Er3+, Yb3+ is com-plicated depending on the power of the excitation laser. Redupconversion luminescence is caused by a two-photon pro-cess, when excitation power is high enough, as to the sampleswith lower concentration of Er3+ the intensity of green lightis weaker than that of red light because more ions will non-radiatively decay from higher levels to 2H11/2 and 4S3/2 levels[30].
An advantage offered by our nanophosphors over thetwo-photon excitable organic dye is that the upconversionprocess in the Y2O3:Er3+, Yb3+ nanophosphor occurs by se-quential multistep absorption through real states and is thusconsiderably stronger. One can use a low-power continuouswave diode laser in the near infrared region to excite theupconverted emission. By contrast, the two photon absorp-tion in organic dyes that is directed (simultaneous) requiresa high-peak power pulse laser source for two-photon absorp-tion through a virtual state. Figure 8 shows the luminescentintensities of the band at 564 nm and 1538 nm versus the ex-citation power at 803.7 nm of a diode laser.
3.4. Study energy transfer based on thedecay times of fluorescence
The decay curves of Eu3+ and Tb3+ of Y2O3:Eu3+, Tb3+
nanopowders for Eu3+/Tb3+ = 9/1, 8/2, and 7/3, respectively,(for 5 mol% rare earth ions) are presented in Figure 9(a)(Eu3+ emission at 612 nm) and Figure 9(b) (Tb3+ emission
0.1
1
10
Inte
nsi
ty(a
.u.)
1000100
P (mW)
λanal = 564 nmλanal = 1538 nm
λexc = 803.7 nmT = 300 K
Figure 8: Luminescent intensities of the band at 564 nm and1538 nm versus the excitation power at 803.7 nm.
at 546 nm). The decay curves being nonexponential, we haveconsidered the normalized area SN under the decay curve.The lifetimes of Eu3+ are 940, 360, and 650 microseconds forthe case Eu3+/Tb3+ = 9/1, 8/2, and 7/3, respectively. The life-times of Tb3+ decreased from 400 microseconds to 175 mi-croseconds for the case Eu3+/Tb3+ = 9/1, 8/2, respectively, byET process.
The results have indicated that the ratio betweenEu3+/Tb3+ plays an important role in the ET process. Themost effective ET is clearly for the sample with Eu3+/Tb3+
ratio of 8/2. The ET between Tb3+ and Eu3+ has been alsoinvestigated in Y2O3 crystals [4] and in Tb1−xEuxP5O14 crys-tals [44]. Site-selective spectra and time-resolved spectra

TranKim Anh et al. 7
1E − 3
0.01
0.1
1
Inte
nsi
ty(n
orm
aliz
ed)
0 2 4 6 8
t (ms)
Eu/Tb
9/18/27/3
λexc = 337.1 nmλanal = 612 nm (Eu3+)
T = 300 K
Nanophosphors Y2O3:Tb, Eu (powders)
Anealed temperature = 600◦C
SN = 940 μs
SN = 650 μs
SN = 360 μs
(a)
1E − 3
0.01
0.1
1
Inte
nsi
ty(n
orm
aliz
ed)
0 2 4 6 8
t (ms)
Eu/Tb
9/18/27/3
λexc = 337.1 nmλanal = 545 nm (Tb3+)
T = 300 K
Nanophosphors Y2O3:Tb, Eu (powders)
Anealed temperature = 600◦C
SN = 400 μs
SN = 175 μs
(b)
Figure 9: Decay curves at wavelength of 611 nm for Eu3+ (a) and of 545 nm for Tb3+ (b) in Y2O3:Eu3+, Tb3+ (5%) nanophosphor, annealedat 600◦C, in 30 minutes.
0.01
0.1
1
Inte
nsi
ty(a
.u.)
0 0.002 0.004
Time (s)
7.5%5%
2.5%1%
λexc = 970 nmT = 300 K
Figure 10: Decay curves for the band at 1535 nm of Y2O3:Er3+
nanophosphor versus Er3+-concentration, under excitation at970 nm.
of Y2O3:Eu3+ nanocrystal were investigated [45]. Recently,Hongei Song studies the dependence of photoluminescentproperties of cubic Y2O3:Tb3+ nanocrystal on particles sizeand temperature [46]. Up to now, our group is the onlygroup which has studied energy transfer between Tb3+-Eu3+
in nanophosphors (powder and colloidal) of Y2O3 codopedwith Tb3+-Eu3+.
In studying the decay behavior of the infrared emissionof the 4I13/2-4I15/2, transitions of Er3+ at 1535 nm depend-ing on the Er-concentration from 1, 2.5, 5, 7, 5, 10, up to15 mol% have been measured for Y2O3:Er3+ phosphor andpresented in Figure 10. Under 970 nm excitation, the decay
times are not purely exponential. There are two kinds of life-times: the short lifetimes are 250, 150, 35, and 15 microsec-onds in the case of 1%, 2.5%, 7.5%, and 15% Er; the sec-ond long lifetime decreases from 1300, 620, and 110 mi-croseconds to 80 microseconds, respectively. The lifetime ofthe emission IR increases as the concentration decreases. Asfor luminescence, it would be interesting to obtain a seriesof samples prepared under the same conditions and hav-ing undergone more significant temperatures of annealing,one could then determine the temperature from which oneobserves effects extinction. Lastly, let us note that the re-sults of the spectra and the decays are coherent betweenthem.
3.5. Application potential
Flat panel displays (FPDs) are thinner, lighter, and con-sume less than the conventional cathode-ray tube (CRT)displays. The field emission displays (FEDs) are the mostpromising FPDs technology. Rare earth-yttrium oxide isone of the important materials for application not only forFEDs, but also for waveguide and laser host. Enhancementof cathodoluminescent and photoluminescent properties ofY2O3:Eu3+ luminescent films by vacuum cooling were ob-served [47], structural and optical properties of rare-earth-doped Y2O3 waveguides grown by pulsed-laser depositionwere studied [48]. Growth of rare earth (RE-) doped con-centration gradient crystal fibers and analysis of dynamicalprocesses of laser resonant transitions in RE-doped Y2O3
(RE = Yb3+, Er3+, Ho3+) were also studied [49]. Nanos-tructured ZnO/Y2O3:Eu3+ for use as in luminescent poly-mer electrolyte composites was presented [50]. Thin filmswere prepared [51, 52] in order to apply for FPDs. Theupconverting nanophores for bioimaging were presented indetail by Prasad [53]. The lifetimes of the nanophosphors

8 Journal of Nanomaterials
contained rare-earth ions in the range of millisecond andmicrosecond are compared to organic dye fluorescence witha lifetime typically in nanosecond. Specially, in our insti-tute infrared cards were successfully proposed by mixingY2O3:Er3+, Yb3+, or Y2O3:Er3+ with polymethylmethacry-late (PMMA) with active imaging area of 20×20 mm2. Thesecards allow to detect a diode laser emitting at 980 nm withpower of 7 mW/cm2. The red (655 nm–675 nm) or the green(520 nm–570 nm) emissions could be observed in depend-ing on the concentration of Er-Yb couple. They are stableunder 980 nm irradiation in the tropical conditions withhumidity near to 90%. The optical coding systems basedon the nanophosphors with ET luminescent and upconver-sion effect contained Eu3+-Tb3+ (excitedby UV light at 370,365, 337.1, and 325 nm) and Er3+-Yb3+ activators (excitedby diode laser at 800 nm, 980 nm) have been successfullydeveloped for examination of commercial products, ban-knote [28, 54, 55], nanobarcodes [53], or planar waveguide[56].
4. CONCLUSIONS
In this paper, we have presented two simple and efficientmethods to prepare highly luminescent Y2O3 nanophosphordoped with Eu3+, Tb3+, Tm3+, Er3+, and Yb3+. The averagesize and its distribution of the nanophosphor can be tailoredsharply in nanoscale.
The optical properties and photophysic process, espe-cially ET in Y2O3 host matrix, have been investigated andelucidated for improving the luminescence and upconver-sion processes.
Y2O3 nanophosphor in colloidal media with averagedsize of 5 nm, narrow distribution, and spherical shape wassuccessfully prepared. The colloidal are transparent and wellstable at the concentration of 10%. The luminescence wasstrong and energy transfer was observed in Y2O3:Tb3+,Eu3+. The upconversion emission from Y2O3:Er3+, Yb3+
nanophosphor is remarkable for developing an infrared dis-play card. Y2O3:Tm3+ together with both Y2O3:Tb3+, Eu3+
and Y2O3:Er3+, Yb3+ is good candidate for interesting appli-cation such as infrared cards and coding cards or biosensors.The transparent colloidal could be a promising approach forfabricating an optoelectronic thin film with higher opticalquality.
ACKNOWLEDGMENTS
The authors would like to thank Professor Nguyen VanHieu for his help, National Project for Advanced MaterialsScience and Technology, no. KC.02.14, National Nanopro-gram 810304, the Basis research state projects of CB20 andProgram for application of nanophosphors of VietnameseAcademy of Science and Technology 2007-2008 KHCN (fi-nancially supported this work). A part of the authors workwas done in the National Key Laboratory of Electronic Ma-terials and Devices, Institute of Materials Science, and Viet-namese Academy of Science and Technology.
REFERENCES
[1] C. Feldmann, T. Justel, C. R. Ronda, and P. J. Schmidt, “In-organic luminescent materials: 100 years of research and ap-plication,” Advanced Functional Materials, vol. 13, no. 7, pp.511–516, 2003.
[2] A. S. Edelstein and R. C. Cammarata, Eds., Nanomaterials:Synthesis, Properties and Applications, Taylor & Francis, Lon-don, UK, 1998.
[3] B. R. Ratna, A. D. Dinsmore, et al., “Nanophosphors: synthe-sis, properties and application,” in Proceedings of the 5th In-ternational Conference on the Science and Technology of Dis-play Phosphors (ICSTDP ’99), p. 295, San Diego, Calif, USA,November 1999.
[4] T. K. Anh, T. Ngoc, P. T. Nga, V. T. Bich, P. Long, and W.Strek, “Energy transfer between Tb3+ and Eu3+ in Y2O3 crys-tals,” Journal of Luminescence, vol. 39, no. 4, pp. 215–221, 1988.
[5] S. Shionoya and W. M. Yen, Phosphor Handbook, CRC Press,Boca Raton, Fla, USA, 1999.
[6] G. Blasse and B. C. Grabmaier, Luminescent Materials,Springer, Berlin, Germany, 1994.
[7] H. Eilers and B. M. Tissue, “Laser Spectroscopy of Nanocrys-tals Eu2O3 and Eu3+:Y2O3,” Chemical Physics Letters, vol. 251,no. 1-2, pp. 74–78, 1996.
[8] M. Kottaisamy, D. Jeyakumar, R. Jagannathan, and M. M. Rao,“Yttrium oxide: Eu3+ red phosphor by self-propagating hightemperature synthesis,” Materials Research Bulletin, vol. 31,no. 8, pp. 1013–1020, 1996.
[9] B. Bihari, H. Eilers, and B. M. Tissue, “Spectra and dynamicsof monoclinic Eu2O3 and Eu3+:Y2O3 nanocrystals,” Journal ofLuminescence, vol. 75, no. 1, pp. 1–10, 1997.
[10] T. Ye, Z. Guiwen, Z. Weiping, and X. Shangda, “Combustionsynthesis and photoluminescence of nanocrystalline Y2O3:Euphosphors,” Materials Research Bulletin, vol. 32, no. 5, pp. 501–506, 1997.
[11] E. T. Goldburt, B. Kulkarni, R. N. Bhargava, J. Taylor, andM. Libera, “Size dependent efficiency in Tb doped Y2O3
nanocrystalline phosphor,” Journal of Luminescence, vol. 72–74, pp. 190–192, 1997.
[12] Q. Li, L. Gao, and D. Yan, “Effects of grain size on wave-length of Y2O3:Eu3+ emission spectra,” Nanostructured Mate-rials, vol. 8, no. 7, pp. 825–831, 1997.
[13] J. A. Cooper, H. G. Paris, S. R. Stock, C. J. Summers, and D. N.Hill, “Investigation of the effect of process variables on prop-erties of europium-doped yttrium-oxide phosphor,” Journal ofthe Society for Information Display, vol. 6, no. 3, pp. 163–166,1998.
[14] D. K. Williams, B. Bihari, B. M. Tissue, and J. M. McHale,“Preparation and fluorescence spectroscopy of bulk mono-clinic Eu3+:Y2O3 and comparison to Eu3+:Y2O3 nanocrystals,”Journal of Physical Chemistry B, vol. 102, no. 6, pp. 916–920,1998.
[15] A. Konrad, T. Fries, A. Gahn, et al., “Chemical vapor syn-thesis and luminescence properties of nanocrystalline cubicY2O3:Eu,” Journal of Applied Physics, vol. 86, no. 6, pp. 3129–3133, 1999.
[16] T. K. Anh, N. Vu, P. T. M. Chau, L. Q. Minh, N. T. Oanh, andC. Barthou, “Preparation and optical properties of Y2O3:Eunanophosphors,” in Proceedings of the 3rd International Work-shop on the Materials Science, F. F. Bekker, N. D. Chien, J. J. M.Franse, T. D. Hien, N. T. Hien, and N. P. Thuy, Eds., Trendsin Materials and Technology, pp. 320–323, Hanoi, Vietnam,November 1999.

TranKim Anh et al. 9
[17] J. A. Capobianco, F. Vetron, T. D’Alesio, G. Tessari, A. Spegh-ini, and M. Bettinelli, “Optical spectroscopy of nanocrystallinecubic Y2O3:Er3+ obtained via combustion synthesis,” PhysicalChemistry Chemical Physics, vol. 2, pp. 3203–3207, 2000.
[18] J. Zhang, Z. Zhang, Z. Tang, Y. Lin, and Z. Zheng, “Lumines-cent properties of Y2O3:Eu synthesized by sol-gel processing,”Journal of Materials Processing Technology, vol. 121, no. 2-3, pp.265–268, 2002.
[19] G. Y. Hong, B. S. Jeon, Y. K. Yoo, and J. S. Yoo, “Photo-luminescence characteristics of spherical Y2O3:Eu phosphorsby aerosol pyrolysis,” Journal of the Electrochemical Society,vol. 148, no. 11, pp. H161–H166, 2001.
[20] T. Igarashi, M. Ihara, T. Kusunoki, K. Ohno, T. Isobe, andM. Senna, “Relationship between optical properties and crys-tallinity of nanometer Y2O3:Eu phosphor,” Applied Physics Let-ters, vol. 76, no. 12, pp. 1549–1551, 2000.
[21] C. Feldmann, “Polyol-mediated synthesis of nanoscale func-tional materials,” Advanced Functional Materials, vol. 13, no. 2,pp. 101–107, 2003.
[22] R. Bazzi, M. A. Flores-Gonzalez, C. Louis, et al., “Synthesisand luminescent properties of sub-5-nm lanthanide oxidesnanoparticles,” Journal of Luminescence, vol. 102-103, pp. 445–450, 2003.
[23] G. Wakefield, E. Holland, P. J. Dobson, and J. L. Hutchison,“Luminescence properties of nanocrystalline Y2O3:Eu,” Ad-vanced Materials, vol. 13, no. 20, pp. 1557–1560, 2001.
[24] T. K. Anh, “The role of active centre concentration in the phe-nomena of energy transfer in lanthanide compounds,” Doc-toral thesis, Wroclaw-Warsaw, Poland, 1987.
[25] D. R. Tallant, C. H. Seager, and R. L. Simpson, “Energy transferand relaxation in europium-activated Y2O3 after excitation byultraviolet photons,” Journal of Applied Physics, vol. 91, no. 7,pp. 4053–4064, 2002.
[26] N. Vu, T. K. Anh, L. Q. Minh, and C. Barthou, “Optical prop-erties of Er3+ doped Y2O3 nanophosphors,” Communication inPhysics, vol. 12, pp. 119–123, 2002.
[27] T.-L. Phan, M. H. Phan, N. Vu, T. K. Anh, and S.-C. Yu, “Lumi-nescent properties of Eu-doped Y2O3 nanophosphors,” Phys-ica Status Solidi (a), vol. 201, no. 9, pp. 2170–2174, 2004.
[28] T. K. Anh, L. Q. Minh, N. Vu, et al., “Nanomaterials contain-ing rare-earth ions Tb, Eu, Er and Yb: preparation, opticalproperties and application potential,” Journal of Luminescence,vol. 102-103, pp. 391–394, 2003.
[29] N. Vu, T. K. Anh, C. Barthou, and L. Q. Minh, “Preparation,optical properties and up conversion effect of the nanophos-phors doped with Er and Yb rare earth ions,” in Proceedingsof the 9th Asia Pacific Physics Conference (APPC ’04), pp. 579–580, Hanoi, Vietnam, October 2004.
[30] N. Vu, Preparation, optical properties of nanophosphorsY2O3:Eu, Tb, Er and Yb, Ph.D. thesis, Institute of Materials Sci-ence, Hanoi, Vietnam, 2007.
[31] N. Nguyen, M. H. Nam, T. K. Anh, L. Q. Minh, and E. Tan-guy, “Optical properties of Eu3+ doped Y2O3 nanophosphors,”Advances in Natural Sciences, vol. 6, pp. 119–123, 2006.
[32] T. K. Anh, L. T. K. Giang, N. Vu, et al., “Luminescence andenergy transfer of Y2O3 nanocolloidal containing rare earthions,” Journal on Science and Technology for Development,vol. 24, pp. 85–93, 2007.
[33] N. Vu, T. K. Anh, G.-C. Yi, and W. Strek, “Photoluminescenceand cathodoluminescence properties of Y2O3:Eu nanophos-phors prepared by combustion synthesis,” Journal of Lumines-cence, vol. 122-123, pp. 776–779, 2007.
[34] J. A. Capobianco, F. Vetrone, J. C. Boyer, A. Speghini, and M.Bettinelli, “Enhancement of red emission (4F9/2 → 4I15/2) viaupconversion in bulk and nanocrystalline cubic Y2O3:Er3+,”Journal of Physical Chemistry B, vol. 106, no. 6, pp. 1181–1187,2002.
[35] D. Matsuura, “Red, green, and blue upconversion lumines-cence of trivalent-rare-earth ion-doped Y2O3 nanocrystals,”Applied Physics Letters, vol. 81, no. 24, pp. 4526–4528, 2002.
[36] A. M. Pires, O. A. Serra, and M. R. Davolos, “Morphologicaland luminescent studies on nanosized Er, Yb-yttrium oxideup-converter prepared from different precursors,” Journal ofLuminescence, vol. 113, no. 3-4, pp. 174–182, 2005.
[37] F. Vetrone, J. C. Boyer, J. A. Capobianco, A. Speghini, and M.Bettinelli, “Effect of Yb3+ codoping on the up conversion emis-sion in nanocrystalline Y2O3:Er3+,” Journal of Physical Chem-istry B, vol. 107, no. 5, pp. 1107–1112, 2003.
[38] G. De, W. Qi, J. Zhang, et al., “Upconversion luminescenceproperties of Y2O3:Yb3+, Er3+ nanostructures,” Journal of Lu-minescence, vol. 119-120, pp. 258–263, 2006.
[39] C. Strohhofer and A. Polman, “Absorption and emission spec-troscopy in Er3+-Yb3+ doped aluminum oxide waveguides,”Optical Materials, vol. 21, no. 4, pp. 705–712, 2003.
[40] SIEMENS, Profile User’s Guide, 1994, Diffrac-AT, Version 3.2.
[41] SIEMENS Win-Crysize, 1998.
[42] T. Inami, M. Kobiyama, S. Okuda, H. Maeta, and H. Ohtsuka,“Grain size measurement of nanocrystalline gold by X-raydiffraction method,” Nanostructured Materials, vol. 12, no. 5–8, pp. 657–660, 1999.
[43] L. T. C. Tuong and P. V. Phuc, “Determination of nanocrystal-sizes and their distribution by X-ray diffraction method forY2O3:Eu nanophosphors,” in Proceedings of the InternationalWorkshop on Optics and Spectroscopy, pp. 501–504, Hanoi,Vietnam, March-April 2000.
[44] T. K. Anh and W. Strek, “Dynamics of energy transfer inTb1−xEuxP5O14 crystals,” Journal of Luminescence, vol. 42,no. 4, pp. 205–210, 1988.
[45] H. Song and J. Wang, “Dependence of photoluminescentproperties of cubic Y2O3:Tb3+ nanocrystals on particle sizeand temperature,” Journal of Luminescence, vol. 118, no. 2, pp.220–226, 2006.
[46] Z. Wei-Wei, X. Mei, Z. Wei-Ping, et al., “Site-selective spectraand time-resolved spectra of nanocrystalline Y2O3:Eu,” Chem-ical Physics Letters, vol. 376, no. 3-4, pp. 318–323, 2003.
[47] D. Kumar, J. Sankar, K. G. Cho, V. Craciun, and R. K. Singh,“Enhancement of cathodoluminescent and photoluminescentproperties of Eu:Y2O3 luminescent films by vacuum cooling,”Applied Physics Letters, vol. 77, no. 16, pp. 2518–2520, 2000.
[48] O. Pons-Y-Moll, J. Perriere, E. Millon, et al., “Structuraland optical properties of rare-earth-doped Y2O3 waveguidesgrown by pulsed-laser deposition,” Journal of Applied Physics,vol. 92, no. 9, pp. 4885–4890, 2002.
[49] L. Laversenne, C. Goutaudier, Y. Guyot, M. Th. Cohen-Adad,and G. Boulon, “Growth of rare earth (RE) doped concentra-tion gradient crystal fibers and analysis of dynamical processesof laser resonant transitions in RE-doped Y2O3 (RE=Yb3+,Er3+, Ho3+),” Journal of Alloys and Compounds, vol. 341, no. 1-2, pp. 214–219, 2002.
[50] M. Abdullah, C. Panatarani, T.-O Kim, and K. Okuyama,“Nanostructured ZnO/Y2O3:Eu for use as in luminescentpolymer electrolyte composites,” Journal of Alloys and Com-pounds, vol. 377, no. 1-2, pp. 298–305, 2004.

10 Journal of Nanomaterials
[51] N. Joffin, J. Dexpert-Ghys, M. Verelst, G. Baret, and A. Garcia,“The influence of microstructure on luminescent properties ofY2O3:Eu prepared by spray pyrolysis,” Journal of Luminescence,vol. 113, no. 3-4, pp. 249–257, 2005.
[52] S.-S. Yi, J. S. Bae, B. K. Moon, J. H. Jeong, J.-C. Park, and I.W. Kim, “Enhanced luminescence of pulsed-laser-depositedY2O3:Eu3+ thin-film phosphors by Li doping,” Applied PhysicsLetters, vol. 81, no. 18, pp. 3344–3346, 2002.
[53] P. N. Prasad, Nanophotonic, Wiley-Interscience, New York, NY,USA, 2004.
[54] T. K. Anh, N. Vu, T. T. Huong, and L. Q. Minh, “Nanoma-terials containing rare earth ions for infrared card and planarwaveguide applications,” in The 2nd International Workshop onNanophysics and Nanotechnology (IWONN ’04), pp. 161–164,Hanoi, Vietnam, October 2004.
[55] T. K. Anh, L. T. K. Giang, L. D. Tuyen, et al., “Oxide nanoparti-cles and colloidal, preparation, optical properties and applica-tion potential,” in Proceedings of the 1st International Workshopon Functional Materials and the 3rd International Workshop onNanophysics and Nanotechnology, pp. 424–427, Halong, Viet-nam, December 2006.
[56] T. T. Huong, T. K. Anh, M. H. Nam, C. Barthou, W. Strek,and L. Q. Minh, “Preparation and infrared emission of silica-zirconia-alumina doped with erbium for planar waveguide,”Journal of Luminescence, vol. 122-123, pp. 911–913, 2007.
Copyright © 2022 FDOKUMEN


![Electronic spectra of Yb[sup 2+]-doped SrCl[sub 2]](https://static.fdokumen.com/doc/165x107/633592f8b5f91cb18a0b76fc/electronic-spectra-of-ybsup-2-doped-srclsub-2.jpg)


