
Surfactant effect on the upconversion emission and decay time of ZrO 2:Yb-Er nanocrystals
7
Surfactant effect on the upconversion emission and decay time of ZrO 2 :Yb-Er nanocrystals D. Solı ´s a , T. Lo ´ pez-Luke a,b , E. De la Rosa a, , P. Salas c , C. Angeles-Chavez d a Centro de Investigaciones en O ´ ptica, A.P. 1-948, Leo ´n, Gto. 37160, Me ´xico b IIM, UMSNH, C.U., Morelia, Mich. 58060, Me´xico c Centro de Fı ´sica Aplicada y Tecnologı ´a Avanzada, Universidad Nacional Auto ´noma de Me´xico, A.P.1-1010, Quere ´taro, Qro. 76000, Me ´xico d Instituto Mexicano del Petro ´leo, Cd. Me ´xico, D.F. 07730, Me ´xico article info Article history: Received 31 July 2008 Received in revised form 7 November 2008 Accepted 18 November 2008 Available online 3 December 2008 PACS: 73.22.f 73.63.Bd 78.47.p 78.47.Cd 78.55.m 78.67.Bf Keywords: Decay time Up-conversion Nanocrystals Surfactant Pluronic-127 ZrO 2 Yb Er Luminescence abstract Luminescent properties of doped ZrO 2 :Er 3+ and codoped ZrO 2 :Yb 3+ –Er 3+ nanocrystals with average size 54 nm were analyzed as a function of non-ionic surfactant (Pluronic F-127) concentration. Surfactant and non-surfactant samples were prepared by the sol–gel micelle process with hydrothermal aging and annealed at 1000 1C for 5 h. The introduction of the surfactant reduces the presence of impurities such as OH and CO 2 on both samples, and increments the tetragonal phase for codoped nanocrystals. It induces an increment larger than 90% and 70% for doped and codoped, respectively, for an optimum molar ratio of 0.0082. The observed enlargement of fluorescence decay time is partly the result of the nanosize effect but is dominated by the reduction of impurities attached on the nanocrystalline surface. & 2008 Elsevier B.V. All rights reserved. 1. Introduction Recently, interest has been increased in the application of nanoparticles in the design of photonic systems because of their luminescent properties and crystallite size [1,2]. Special attention has been given to rare-earth-doped nanophosphors emitting in the visible range by the upconversion process. Upconversion (UPC) is the generation of visible or UV light by excitation with larger wavelengths, usually NIR, of trivalent rare-earth ions supported into a solid-state host. Several studies on the Er 3+ ion reveal high-efficiency emission around 550 and 650 nm under 780 and 980 nm excitations [3]. Co-doping rare-earth ions with Yb increase the efficiency of the UPC process and in some cases can induce upconversion whereas it is not possible in the single ion. In this case, the emission is the result of energy transfer from donors to acceptors [4] such as Tm, Ho and Er [5,6]. Perhaps the most studied system is Yb–Er. Upconversion of Er 3+ doped and sensitized with Yb 3+ has been widely studied in matrices such as GGG [7], NaLiF [8], ZrO 2 [9], LaF 3 [10,11],Y 2 O 3 [12] and YAG [13]. The excited state of the Yb 3+ ion (10,000 cm 1 ) has a broad absorption band between 800 and 1100nm and a much higher absorption cross-section than the 4 I 11/2 excited state of Er 3+ . The large spectral overlap between Yb 3+ emission ( 2 F 5/2 - 2 F 7/2 ) and Er 3+ absorption ( 4 I 15/2 - 4 I 11/2 ) results in an efficient resonant energy transfer (ET) from Yb 3+ to Er 3+ in Yb 3+ –Er 3+ -codoped systems. It is well-known that in the upconversion emission of rare-earth ions, the highest phonon frequencies of the host lattice are responsible for non-radiative relaxation, resulting in a ARTICLE IN PRESS Contents lists available at ScienceDirect journal homepage: www.elsevier.com/locate/jlumin Journal of Luminescence 0022-2313/$ - see front matter & 2008 Elsevier B.V. All rights reserved. doi:10.1016/j.jlumin.2008.11.015 Corresponding author. Tel.: +524774414200. E-mail addresses: [email protected], [email protected] (E. De la Rosa). Journal of Luminescence 129 (2009) 449–455
Transcript of Surfactant effect on the upconversion emission and decay time of ZrO 2:Yb-Er nanocrystals
ARTICLE IN PRESS
Journal of Luminescence 129 (2009) 449–455
Contents lists available at ScienceDirect
Journal of Luminescence
0022-23
doi:10.1
� Corr
E-m
journal homepage: www.elsevier.com/locate/jlumin
Surfactant effect on the upconversion emission and decay timeof ZrO2:Yb-Er nanocrystals
D. Solıs a, T. Lopez-Luke a,b, E. De la Rosa a,�, P. Salas c, C. Angeles-Chavez d
a Centro de Investigaciones en Optica, A.P. 1-948, Leon, Gto. 37160, Mexicob IIM, UMSNH, C.U., Morelia, Mich. 58060, Mexicoc Centro de Fısica Aplicada y Tecnologıa Avanzada, Universidad Nacional Autonoma de Mexico, A.P. 1-1010, Queretaro, Qro. 76000, Mexicod Instituto Mexicano del Petroleo, Cd. Mexico, D.F. 07730, Mexico
a r t i c l e i n f o
Article history:
Received 31 July 2008
Received in revised form
7 November 2008
Accepted 18 November 2008Available online 3 December 2008
PACS:
73.22.f
73.63.Bd
78.47.�p
78.47.Cd
78.55.�m
78.67.Bf
Keywords:
Decay time
Up-conversion
Nanocrystals
Surfactant
Pluronic-127
ZrO2
Yb
Er
Luminescence
13/$ - see front matter & 2008 Elsevier B.V. A
016/j.jlumin.2008.11.015
esponding author. Tel.: +524774414200.
ail addresses: [email protected], dsolismx@yahoo.
a b s t r a c t
Luminescent properties of doped ZrO2:Er3+ and codoped ZrO2:Yb3+–Er3+ nanocrystals with average size
�54 nm were analyzed as a function of non-ionic surfactant (Pluronic F-127) concentration. Surfactant
and non-surfactant samples were prepared by the sol–gel micelle process with hydrothermal aging and
annealed at 1000 1C for 5 h. The introduction of the surfactant reduces the presence of impurities such
as OH and CO2 on both samples, and increments the tetragonal phase for codoped nanocrystals. It
induces an increment larger than 90% and 70% for doped and codoped, respectively, for an optimum
molar ratio of 0.0082. The observed enlargement of fluorescence decay time is partly the result of the
nanosize effect but is dominated by the reduction of impurities attached on the nanocrystalline surface.
& 2008 Elsevier B.V. All rights reserved.
1. Introduction
Recently, interest has been increased in the application ofnanoparticles in the design of photonic systems because of theirluminescent properties and crystallite size [1,2]. Special attentionhas been given to rare-earth-doped nanophosphors emitting inthe visible range by the upconversion process. Upconversion(UPC) is the generation of visible or UV light by excitation withlarger wavelengths, usually NIR, of trivalent rare-earth ionssupported into a solid-state host. Several studies on the Er3+ ionreveal high-efficiency emission around 550 and 650 nm under 780and 980 nm excitations [3]. Co-doping rare-earth ions with Yb
ll rights reserved.
com.mx (E. De la Rosa).
increase the efficiency of the UPC process and in some cases caninduce upconversion whereas it is not possible in the single ion. Inthis case, the emission is the result of energy transfer from donorsto acceptors [4] such as Tm, Ho and Er [5,6]. Perhaps the moststudied system is Yb–Er. Upconversion of Er3+ doped andsensitized with Yb3+ has been widely studied in matrices suchas GGG [7], NaLiF [8], ZrO2 [9], LaF3 [10,11], Y2O3 [12] and YAG[13]. The excited state of the Yb3+ ion (10,000 cm�1) has a broadabsorption band between 800 and 1100 nm and a much higherabsorption cross-section than the 4I11/2 excited state of Er3+. Thelarge spectral overlap between Yb3+ emission (2F5/2-
2F7/2) andEr3+ absorption (4I15/2-
4I11/2) results in an efficient resonantenergy transfer (ET) from Yb3+ to Er3+ in Yb3+–Er3+-codopedsystems. It is well-known that in the upconversion emission ofrare-earth ions, the highest phonon frequencies of the host latticeare responsible for non-radiative relaxation, resulting in a
ARTICLE IN PRESS
D. Solıs et al. / Journal of Luminescence 129 (2009) 449–455450
reduction of quantum efficiency. Then, matrices with lowphonon energy are much more favorable in promoting theupconversion process.
Zirconium dioxide (ZrO2) is chemically and thermally stable[14–16] and has a low phonon energy of about 470 cm�1, which isvery small compared to that of other hosts such as YAG(850 cm�1)[17] or Y2O3 (597 cm�1) [18]. This low phonon energyopens up the possibility of higher efficient luminescence of activeions incorporated into the host [19]. Thus, combining the proper-ties of rare-earth ions, nanosize effect, and good qualities of ZrO2,the study of luminescence properties in zirconium oxide nano-crystals is worthy of attention. ZrO2 has been studied withdifferent rare-earth ions, such as Yb–Tm [20], Yb–Ho [21], Er3+
and Yb3+–Er3+ [3]. There, it has been shown that visible emissiondepends on the concentration of both ions. Furthermore, depen-dence of the luminescence efficiency on particle size, reduction ofthe organic remnants and the phonon energy of the host has beenreported [22–24]. However, to our knowledge no detailed analysisof decay time dependence has been reported. Electron confine-ment effect is not expected due to the localization of electrons inthe atomic orbitals of active ions. However, excitation dynamicscould be influenced by the nanoscopic interaction that can inducean enhancement of fluorescence emission.
In this work, ZrO2:Er3+ and ZrO2:Yb3+–Er3+ samples weresynthesized by a sol–gel micelle method. Both 0.2 mol% Er3+-doped and 2–1 mol% Yb3+–Er3+-codoped ZrO2 were studied inorder to determine a correlation between particle size, annealingtime and surfactant concentration on the emission intensity anddecay time of 562, 654, 1036 and 1526 nm emissions. The effect ofsensitizer, both structural and luminescence, was evaluated.
2. Experimental section
2.1. Sample Preparation
The synthesis of ZrO2 nanophosphors doped at 0.2 mol% Er3+
and 2–1 mol% Yb3+–Er3+ was carried out by the sol–gel micellemethod. All chemicals used were reactive grades and suppliedby Aldrich Inc. The samples were obtained using zirconiumn-propoxide (ZP), erbium nitrate (Er(NO3)3 �5H2O) and ytterbiumchloride (YbCl3 �6H2O) as precursors. All components were mixedin a solution of ethanol (40 mol), hydrochloric acid (0.3 mol) andnitric acid (0.9 mol), added at room temperature applyingvigorous stirring. In the micelle method, surfactant was addedat a molar ratio (Pluronic/ZrO2) of 0.0082, though 0.01 was alsoused for Er-doped samples (Mrp ¼ 0.0082, 0.01). After that,samples were stirred for 1 h and hydrothermally treated at 80 1Cfor 24 h. The autoclave allowed a natural cooling and the gel waswashed twice with absolute ethanol. All samples were annealed at1000 1C, some samples were removed from the furnace as soon asthe final temperature was reached (annealed 0 min (00)) and somesamples were kept there for 5 h. In all cases, the heating rate was5 1C/min and stayed at 300 and 500 1C for 2 h.
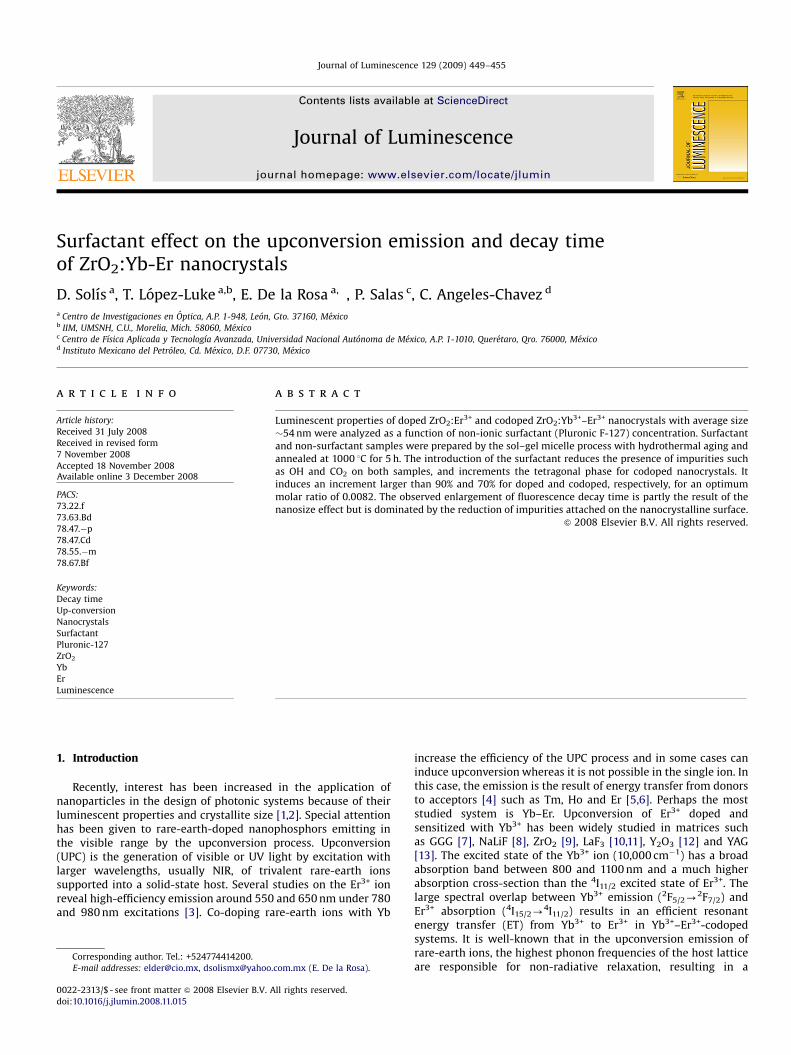
Fig. 1. X-ray diffractions patterns as a function of surfactant concentration for
samples (a) ZrO2:Yb–Er, Mrp ¼ 0.0082—5 h, (b) ZrO2:Yb–Er, Mrp ¼ 0—5 h (c)
ZrO2:Er, Mrp ¼ 0.0082—5 h and (d) ZrO2:Er Mrp ¼ 0.0082—0 min.
2.2. Structural characterization
The X-ray diffraction (XRD) patterns were obtained using aSIEMENS D-5005 equipment provided with a Cu tube with Karadiation at 1.5405 A, scanning in the 20–701 2y range withincrements of 0.021 and a sweep time of 2 s. Transmission electronmicroscopy (TEM) was performed in a Tecnai G2 F30 S-Twintransmission electron microscope operating at 300 kV. Themicroscope is equipped with a Schottky-type field emission gunand an S-Twin objective lens (Cs ¼ 1.2 mm; Cc ¼ 1.4 mm; point-
to-point resolution, 0.20 nm). The Fourier transform infrared(FTIR) spectra were obtained using a Spectrophotometer Spec-trum BX, FTIR system from Perkin-Elmer with a DTGS detector at4 cm�1 spectral resolution and Beer-Norton anodization. Measure-ments were performed in the attenuated total reflectance (ATR)mode using 100 mg of nanophosphor covering the whole activearea of the ATR device. The spectrum was obtained in themedium-infrared region from 1000 to 4000 cm�1 with 20 scansper spectra. Before measurements, the equipment was calibratedby verifying that the power energy was 80% and the spectralresponse was calibrated with a polystyrene film as a reference.
2.3. Photoluminescence characterization
For ZrO2:Er3+ and ZrO2:Yb3+–Er3+ samples, photoluminescence(PL) characterization was performed using a CW semiconductorlaser diode with a 350 mW pumping source centered at 970 nm.The fluorescence emission was analyzed with a SpectrographSpectraPro 2300i. The system was PC controlled with Spectra-Sense software. The fluorescence lifetimes for ZrO2:Er3+ sampleswere measured using a 10-ns pulsed tunable Optical ParametricOscillator (OPO from Spectra Physics) centered at 970 nm, alongwith the monochromator, a R955 Hamamatsu photomultiplierand a Le Croy Digital Oscilloscope. Fluorescence lifetimes forZrO2:Yb3+–Er3+ samples were performed using the laser diode, anSR540 chopper (Stanford) and a Tektronix TDS 3052B oscilloscope.All measurements were done at room temperature. Samples weresupported in 1 mm capillary tubes in order to guarantee the samequantity of excited material. Special care was taken to maintainthe alignment of the set-up in order to compare the intensity ofthe upconverted signal between different characterized samples.
3. Results and discussion
3.1. Structural characterization
The XRD patterns of ZrO2:Yb3+–Er3+ and ZrO2:Er3+ nanocrystalsannealed at 1000 1C are shown in Fig. 1. The phase composition

ARTICLE IN PRESS
D. Solıs et al. / Journal of Luminescence 129 (2009) 449–455 451
was estimated using the expression [25]:
Cm ¼Imð�1;1;1Þ þ Imð1;1;1Þ
Imð�1;1;1Þ þ Imð1;1;1Þ þ Itð1;0;1Þ
Ct ¼ 1� Cm (1)
where m and t stand for the monoclinic and tetragonal phase ofthe host and I stands for the integrated intensity of each peak. Thephase composition of both samples annealed for 5 h withoutthe surfactant is dominated by the tetragonal (60 wt%) and themonoclinic (96 wt%) crystalline phase, respectively. This confirmsthe influence of ion concentration on the stabilization of thetetragonal phase, as was reported previously [26]. Interestingly,the tetragonal phase was increased to 85 wt% after the addition ofPluronic F-127 on codoped samples, see Fig. 1a and b. However, inZrO2:Er3+ the surfactant concentration does not induce anyappreciable change on the phase composition. This differencesuggests an increment on particles dispersion arresting growingcrystallite size and then avoiding the conversion from tetragonal
Fig. 2. TEM micrographs of nanoparticles. (a) ZrO2:Yb–Er, Mrp ¼ 0.0082—5 h and (b) i
0 min.
Table 1Particle size and fluorescence decay time as function of Pluronic F-127 concentration a
Sample Annealing time Particle size (nm) Fast
Without surfactant 5 h 90 26
Mrp ¼ 0.0082 5 h 81 85
Mrp ¼ 0.0082 0 min 54 38
Mrp ¼ 0.01 5 h 62 81
to monoclinic. For low concentrations of dopant, the tetragonalcrystalline structure is dominated by annealing time since thecontent of this phase increases from 4.9% to 21.2% when the timeis reduced from 5 h to 0 min, as is shown on the XRD pattern ofFig. 1c and d.
The crystallite size was calculated by the Sherrer equation asfollows [27]:
D ¼0:9l
b cos y(2)
where l stands for the X-ray wavelength, b for the corrected half-width of the strongest diffraction peak and y denotes thediffraction angle. The crystallite size for samples prepared withthe surfactant, Mrp ¼ 0.0082, was 54 nm and 37 nm for samplesannealed 5 h and 0 min, respectively. The introduction of Pluronickeeps nanocrystals well dispersed even for a long annealing timeas is shown in Fig. 2. The average particle size of ZrO2:Yb3+–Er3+
and ZrO2:Er3+ nanophosphors synthesized with surfactant
ts particle size distribution. ZrO2:Er, Mrp ¼ 0.0082 annealed during (c) 5 h and (d)
nd annealing time.
decay time (ms) Slow decay time (ms) Effective decay time (ms)
– 26
115 84
48 39
107 85
ARTICLE IN PRESS
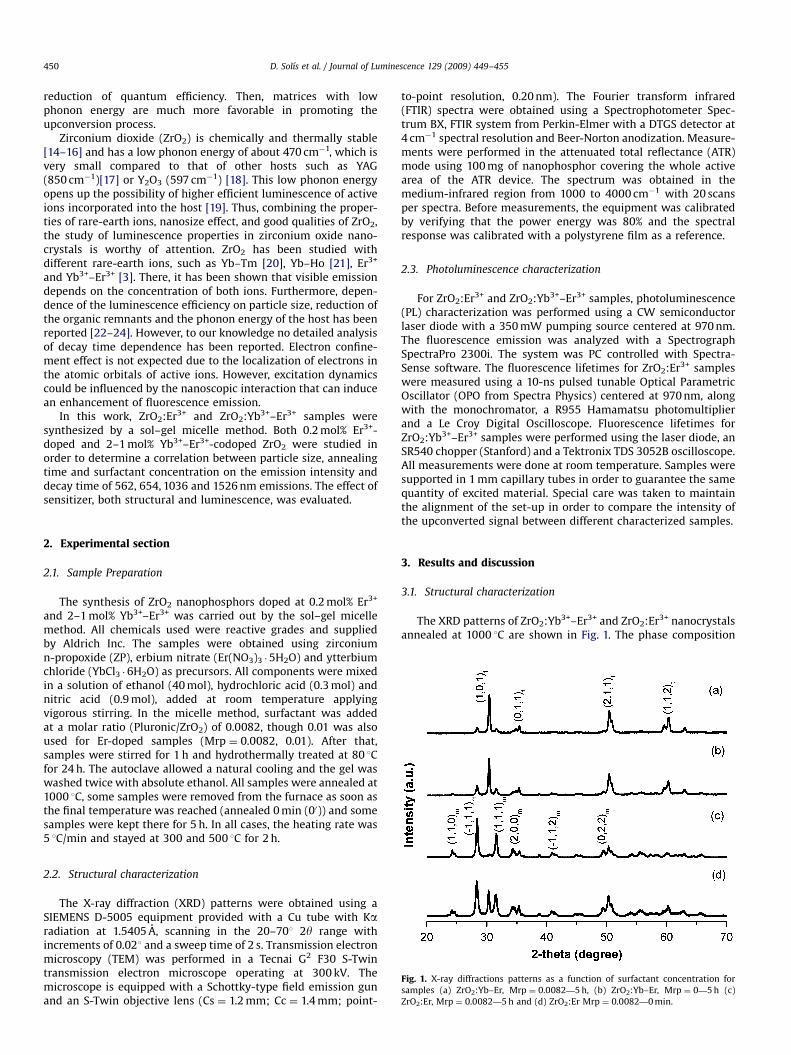
Fig. 3. FT-IR spectra for surfactant and non-surfactant samples of ZrO2:Yb-Er
(2–1 mol%). Attenuation of OH� groups could be observed.
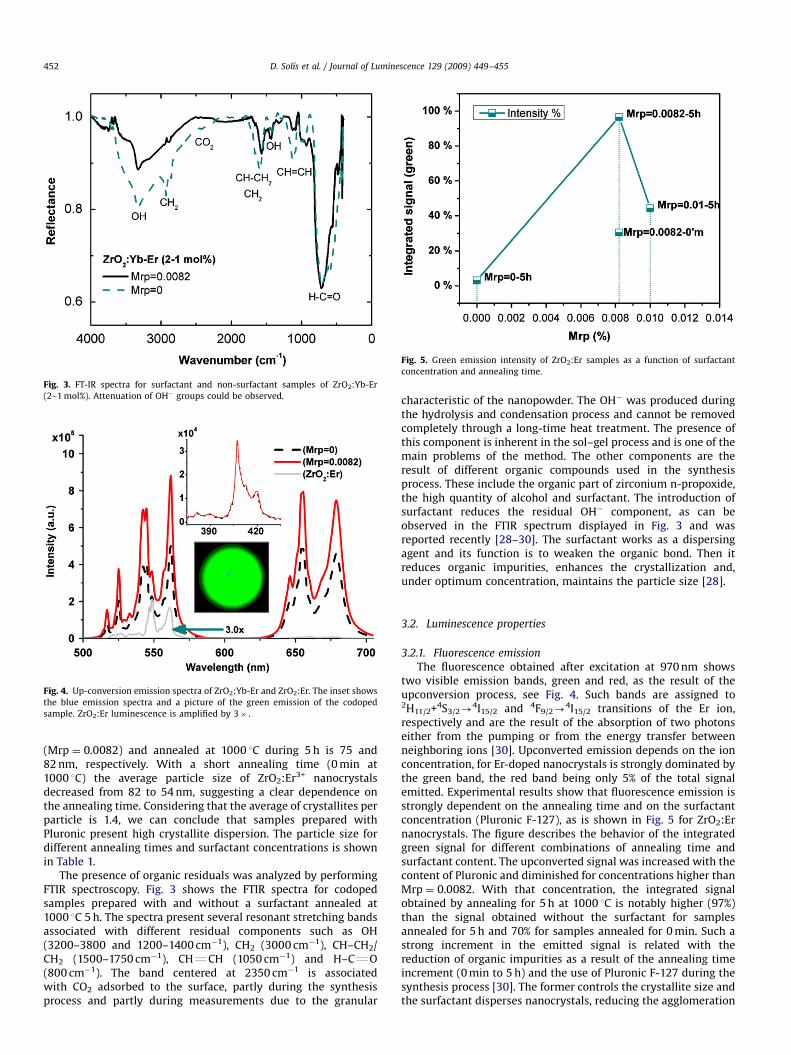
Fig. 4. Up-conversion emission spectra of ZrO2:Yb-Er and ZrO2:Er. The inset shows
the blue emission spectra and a picture of the green emission of the codoped
sample. ZrO2:Er luminescence is amplified by 3� .
Fig. 5. Green emission intensity of ZrO2:Er samples as a function of surfactant
concentration and annealing time.
D. Solıs et al. / Journal of Luminescence 129 (2009) 449–455452
(Mrp ¼ 0.0082) and annealed at 1000 1C during 5 h is 75 and82 nm, respectively. With a short annealing time (0 min at1000 1C) the average particle size of ZrO2:Er3+ nanocrystalsdecreased from 82 to 54 nm, suggesting a clear dependence onthe annealing time. Considering that the average of crystallites perparticle is 1.4, we can conclude that samples prepared withPluronic present high crystallite dispersion. The particle size fordifferent annealing times and surfactant concentrations is shownin Table 1.
The presence of organic residuals was analyzed by performingFTIR spectroscopy. Fig. 3 shows the FTIR spectra for codopedsamples prepared with and without a surfactant annealed at1000 1C 5 h. The spectra present several resonant stretching bandsassociated with different residual components such as OH(3200–3800 and 1200–1400 cm�1), CH2 (3000 cm�1), CH–CH2/CH2 (1500–1750 cm�1), CHQCH (1050 cm�1) and H–CQO(800 cm�1). The band centered at 2350 cm�1 is associatedwith CO2 adsorbed to the surface, partly during the synthesisprocess and partly during measurements due to the granular
characteristic of the nanopowder. The OH� was produced duringthe hydrolysis and condensation process and cannot be removedcompletely through a long-time heat treatment. The presence ofthis component is inherent in the sol–gel process and is one of themain problems of the method. The other components are theresult of different organic compounds used in the synthesisprocess. These include the organic part of zirconium n-propoxide,the high quantity of alcohol and surfactant. The introduction ofsurfactant reduces the residual OH� component, as can beobserved in the FTIR spectrum displayed in Fig. 3 and wasreported recently [28–30]. The surfactant works as a dispersingagent and its function is to weaken the organic bond. Then itreduces organic impurities, enhances the crystallization and,under optimum concentration, maintains the particle size [28].
3.2. Luminescence properties
3.2.1. Fluorescence emission
The fluorescence obtained after excitation at 970 nm showstwo visible emission bands, green and red, as the result of theupconversion process, see Fig. 4. Such bands are assigned to2H11/2+4S3/2-
4I15/2 and 4F9/2-4I15/2 transitions of the Er ion,
respectively and are the result of the absorption of two photonseither from the pumping or from the energy transfer betweenneighboring ions [30]. Upconverted emission depends on the ionconcentration, for Er-doped nanocrystals is strongly dominated bythe green band, the red band being only 5% of the total signalemitted. Experimental results show that fluorescence emission isstrongly dependent on the annealing time and on the surfactantconcentration (Pluronic F-127), as is shown in Fig. 5 for ZrO2:Ernanocrystals. The figure describes the behavior of the integratedgreen signal for different combinations of annealing time andsurfactant content. The upconverted signal was increased with thecontent of Pluronic and diminished for concentrations higher thanMrp ¼ 0.0082. With that concentration, the integrated signalobtained by annealing for 5 h at 1000 1C is notably higher (97%)than the signal obtained without the surfactant for samplesannealed for 5 h and 70% for samples annealed for 0 min. Such astrong increment in the emitted signal is related with thereduction of organic impurities as a result of the annealing timeincrement (0 min to 5 h) and the use of Pluronic F-127 during thesynthesis process [30]. The former controls the crystallite size andthe surfactant disperses nanocrystals, reducing the agglomeration

ARTICLE IN PRESS
Fig. 6. Energy-level diagram for the upconversion processes of ZrO2:Yb-Er
nanocrystals under 970 nm excitation.
Fig. 7. NIR emission spectra of ZrO2:Yb-Er-codoped samples. Eye-safe emission
centered at 1550 nm of Er ion and the inset shows the characteristic emission of Yb
centered at 1036 nm.
Fig. 8. Fluorescence decay times at 550 nm for ZrO2:Er samples: (a) Mrp ¼ 0 at
1000 1C—5 h, (b) Mrp ¼ 0.0082 at 1000 1C—0 min and (c) Mrp ¼ 0.0082 at
1000 1C—5 h.
D. Solıs et al. / Journal of Luminescence 129 (2009) 449–455 453
and absorption of impurities on the crystallite surface. Enhance-ment of visible emission has been reported; however, samplesprepared with Pluronic F-127 produce the highest signal emitted.
A strong enhancement of the green and red band emitted byYb3+–Er3+-codoped nanophosphor and a new band centered at410 nm (4G11/2-
4I15/2), see Fig. 4, has been observed with theintroduction of a sensitizer (Yb3+). This is the result of the largerabsorption cross-section of the sensitizer. The little difference inthe spectral profile structure for doped and codoped samples isproduced by the different phonon energy and crystalline fieldsurrounding the Er ion, as a result of different crystalline phases.The mechanism of the upconverted emission of Er3+ has been wellestablished in the literature. A typical energy-level diagram forthe upconverted emission from a sample codoped with Yb3+ andEr3+ ions under infrared excitation is shown in Fig. 6. The Er3+ ion(acceptor) is excited by the energy transfer (ET) from the Yb3+
(donor), which is excited directly (2F5/2-2F7/2) by the pumping
signal. Direct excitation of Er is also possible; however, energytransfer is most probably due to the larger absorption cross-section of Yb and the resonance between 2F5/2-
2F7/2 and4I15/2-
4I11/2 transitions of Yb and Er, respectively, as is shown inthe energy diagram in Fig. 6. Part of the 4I11/2 excited ions relaxesnon-radiatively to the 4I13/2 level and from there relaxes to theground state, producing the 1.532mm emission band (4I13/2-
4I15/2).And part of it was promoted to 4F7/2 by ET from the relaxationof another excited Yb or Er (4I11/2-
4I15/2) ion. The 4F7/2 leveldecays non-radiatively to 2H11/2+4S3/2 due to phonon energy. Fromhere, the population decays to the ground state, producing brightgreen emissions centered at 520 and 550 nm, respectively. Part ofit decays non-radiatively to 4F9/2 to finally decay to the groundstate, (4F9/2-
4I15/2) producing the red emission centered at670 nm. And part of it is promoted to 4G7/2 by ET from anotherexcited Yb or Er ion, relaxing non-radiatively to 4G11/2 from whereit decays radiatively to the ground state, producing the blueemission centered at 410 nm. The introduction of sensitizerchanges the ratio of green/red emission bands from 20 forEr-doped samples to 1.3 for Yb–Er-codoped samples. The strongenhancement of the red band is explained in terms of the cross-relaxation process (4S3/2+4I15/2)-(4I9/2+4I13/2) and the ET from anYb3+ ion to promote the population from 4I13/2-
4F9/2 (see Fig. 6).
Thus, the red enhancement depends on the concentration of bothions, Er due to the cross-relaxation process and Yb due to ET[3,31]. The overall signal intensity in the visible range increases65% with the optimum concentration of surfactant. Such en-hancement is the result of the reduction of impurities as wasdiscussed before. Interestingly, the enhancement is different foreach emission band. The intensity increased 75% and 60% forgreen and red bands, respectively. However, a slight increment of6% was observed for the blue emission. It has been reported thatOH� ions on the surface would result in an enhancement of thered band and a reduction of the green emission by phononcoupling of 4F7/2-
4F9/2 and 4I11/2-4I13/2 transitions [18]. Thus,
the larger enhancement of the green band suggests a reduction ofOH groups as was confirmed from FTIR spectra. However, anexcess of OH� groups produce high-energy vibrational modes(3200–3800 cm�1), which could strongly quench the excited 4I13/2
state of the Er3+ ion by multiphonon relaxation. This intermediatelevel is responsible for the green and red emissions, respectively.Then, such excess can produce a deleterious effect on the overall
ARTICLE IN PRESS
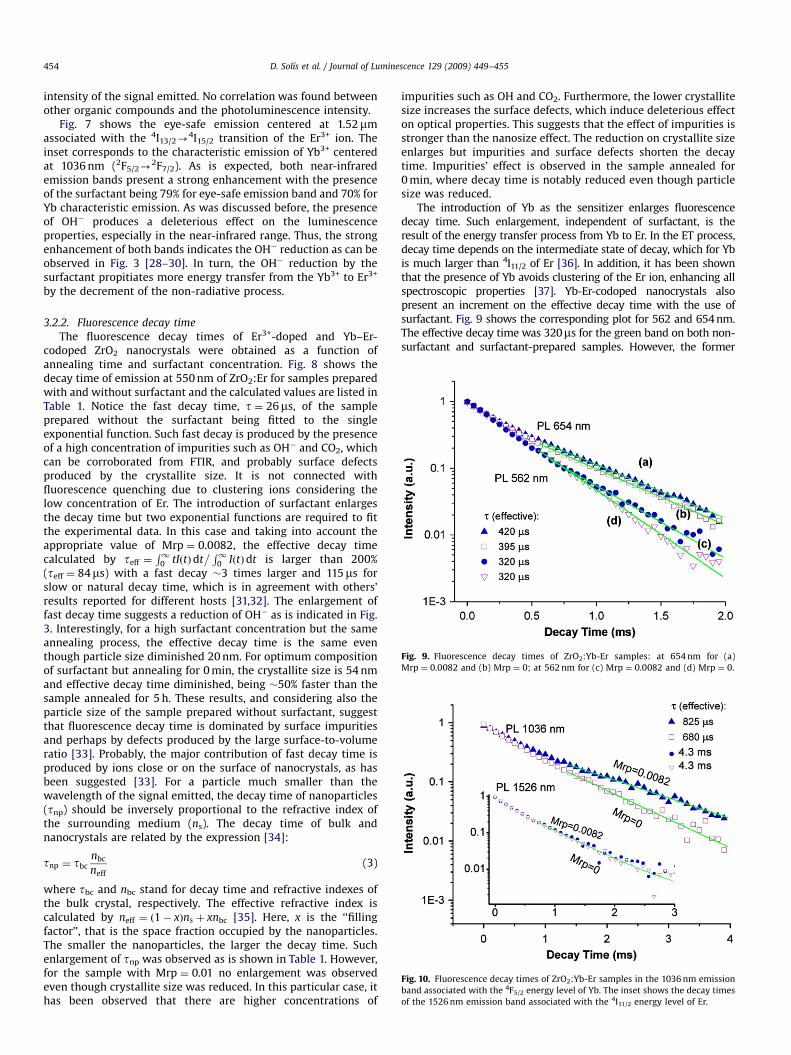
Fig. 9. Fluorescence decay times of ZrO2:Yb-Er samples: at 654 nm for (a)
Mrp ¼ 0.0082 and (b) Mrp ¼ 0; at 562 nm for (c) Mrp ¼ 0.0082 and (d) Mrp ¼ 0.
Fig. 10. Fluorescence decay times of ZrO2:Yb-Er samples in the 1036 nm emission
band associated with the 4F5/2 energy level of Yb. The inset shows the decay times
of the 1526 nm emission band associated with the 4I11/2 energy level of Er.
D. Solıs et al. / Journal of Luminescence 129 (2009) 449–455454
intensity of the signal emitted. No correlation was found betweenother organic compounds and the photoluminescence intensity.
Fig. 7 shows the eye-safe emission centered at 1.52mmassociated with the 4I13/2-
4I15/2 transition of the Er3+ ion. Theinset corresponds to the characteristic emission of Yb3+ centeredat 1036 nm (2F5/2-
2F7/2). As is expected, both near-infraredemission bands present a strong enhancement with the presenceof the surfactant being 79% for eye-safe emission band and 70% forYb characteristic emission. As was discussed before, the presenceof OH� produces a deleterious effect on the luminescenceproperties, especially in the near-infrared range. Thus, the strongenhancement of both bands indicates the OH� reduction as can beobserved in Fig. 3 [28–30]. In turn, the OH� reduction by thesurfactant propitiates more energy transfer from the Yb3+ to Er3+
by the decrement of the non-radiative process.
3.2.2. Fluorescence decay time
The fluorescence decay times of Er3+-doped and Yb–Er-codoped ZrO2 nanocrystals were obtained as a function ofannealing time and surfactant concentration. Fig. 8 shows thedecay time of emission at 550 nm of ZrO2:Er for samples preparedwith and without surfactant and the calculated values are listed inTable 1. Notice the fast decay time, t ¼ 26ms, of the sampleprepared without the surfactant being fitted to the singleexponential function. Such fast decay is produced by the presenceof a high concentration of impurities such as OH� and CO2, whichcan be corroborated from FTIR, and probably surface defectsproduced by the crystallite size. It is not connected withfluorescence quenching due to clustering ions considering thelow concentration of Er. The introduction of surfactant enlargesthe decay time but two exponential functions are required to fitthe experimental data. In this case and taking into account theappropriate value of Mrp ¼ 0.0082, the effective decay timecalculated by teff ¼
R10 tIðtÞdt
� R10 IðtÞdt is larger than 200%
(teff ¼ 84ms) with a fast decay �3 times larger and 115ms forslow or natural decay time, which is in agreement with others’results reported for different hosts [31,32]. The enlargement offast decay time suggests a reduction of OH� as is indicated in Fig.3. Interestingly, for a high surfactant concentration but the sameannealing process, the effective decay time is the same eventhough particle size diminished 20 nm. For optimum compositionof surfactant but annealing for 0 min, the crystallite size is 54 nmand effective decay time diminished, being �50% faster than thesample annealed for 5 h. These results, and considering also theparticle size of the sample prepared without surfactant, suggestthat fluorescence decay time is dominated by surface impuritiesand perhaps by defects produced by the large surface-to-volumeratio [33]. Probably, the major contribution of fast decay time isproduced by ions close or on the surface of nanocrystals, as hasbeen suggested [33]. For a particle much smaller than thewavelength of the signal emitted, the decay time of nanoparticles(tnp) should be inversely proportional to the refractive index ofthe surrounding medium (ns). The decay time of bulk andnanocrystals are related by the expression [34]:
tnp ¼ tbcnbc
neff(3)
where tbc and nbc stand for decay time and refractive indexes ofthe bulk crystal, respectively. The effective refractive index iscalculated by neff ¼ ð1� xÞns þ xnbc [35]. Here, x is the ‘‘fillingfactor’’, that is the space fraction occupied by the nanoparticles.The smaller the nanoparticles, the larger the decay time. Suchenlargement of tnp was observed as is shown in Table 1. However,for the sample with Mrp ¼ 0.01 no enlargement was observedeven though crystallite size was reduced. In this particular case, ithas been observed that there are higher concentrations of
impurities such as OH and CO2. Furthermore, the lower crystallitesize increases the surface defects, which induce deleterious effecton optical properties. This suggests that the effect of impurities isstronger than the nanosize effect. The reduction on crystallite sizeenlarges but impurities and surface defects shorten the decaytime. Impurities’ effect is observed in the sample annealed for0 min, where decay time is notably reduced even though particlesize was reduced.
The introduction of Yb as the sensitizer enlarges fluorescencedecay time. Such enlargement, independent of surfactant, is theresult of the energy transfer process from Yb to Er. In the ET process,decay time depends on the intermediate state of decay, which for Ybis much larger than 4I11/2 of Er [36]. In addition, it has been shownthat the presence of Yb avoids clustering of the Er ion, enhancing allspectroscopic properties [37]. Yb-Er-codoped nanocrystals alsopresent an increment on the effective decay time with the use ofsurfactant. Fig. 9 shows the corresponding plot for 562 and 654 nm.The effective decay time was 320ms for the green band on both non-surfactant and surfactant-prepared samples. However, the former
ARTICLE IN PRESS
D. Solıs et al. / Journal of Luminescence 129 (2009) 449–455 455
was fitted to single exponential and the second one presents a slowdecay time of 398ms, which means an increment of �22%. Theeffective decay time of the red band was 395 and 420ms, only anincrement of 5%. Notice the stronger difference between fast andslow decay times, �300ms for both prepared samples and �510 and�540ms for the non-surfactant and the surfactant, respectively.Fig. 10 shows the corresponding decay time plot for the NIR signalemitted. The enhancement of effective decay time (4.3 ms) for the1.5mm signal emitted is marginal, only 0.5%. However, an incrementof �8% and �4% was observed for fast and slow decay times,respectively. Interestingly, the effective decay time for Yb emission is825ms, which represents an increment of 21% compared to thesample prepared without surfactant. Notice the strong difference(40%) of slow decay time, 895ms and 1.26 ms, for non-surfactant andsurfactant-prepared samples. This longer decay time makes energytransfer more favorable, resulting in higher green and red lumines-cence. All these experimental results confirm the enhancement ofintensity and decay time of signal emitted induced by the use ofPluronic F-127 during the synthesis process. As discussed before, thesurfactant affects not only optical properties but also the phasecomposition and dispersion of nanoparticles. All together it improvesnanocrystals and increases the potential for different applications.
4. Conclusions
Doped and codoped ZrO2 with an average crystallite of 54 nmwas prepared. The use of surfactant Pluronic F-127 during thesynthesis process reduces impurities attached on the surface ofthe nanocrystal, stabilizes the tetragonal phase by arresting thegrowing crystallite size and increase particle dispersion. Both,intensity and decay time were strongly enhanced for an optimumconcentration of surfactant (Mrp ¼ 0.0082). The difference on theincrement of signal emitted in doped samples (�90%) comparedto that on codoped nanocrystals (�70%) is the result of remnantimpurities. At this stage it is not completely clear whether thepresence of Yb promotes strong bonding of impurities and moreexperiments are in progress to elucidate this point. Luminescenceproperties of nanocrystals are dominated by the presence ofimpurities and perhaps surface defects not the nanosize effectexpressed on the enlargement of decay time. Therefore, in theappropriate design of nanocrystals, the most important parameterto consider is surface passivation.
Acknowledgments
The financial support of CONACyT through Grant 43168F andscholarships for D. Solis and T. Lopez-Luke is acknowledged. Thecontribution of M. Olmos in the sample preparation is alsoacknowledged.
References
[1] J.A. Capobianco, F. Vetrone, J.C. Boyer, A. Speghini, M. Bettinelli, OpticalMaterials 19 (2002) 259–268.
[2] R. Kapoor, C.S. Friend, A. Biswas, P.N. Prasad, Optics Letters 25 (2000)338–340.
[3] G.Y. Chen, G. Somesfalean, Y. Liu, Z.G. Zhang, Q. Sun, F.P. Wang, PhysicalReview B 75 (2007).
[4] G.M. Salley, R. Valiente, H.U. Guedel, Journal of Luminescence 94 (2001)305–309.
[5] G.S. Yi, G.M. Chow, Journal of Materials Chemistry 15 (2005) 4460–4464.[6] C.T.M. Ribeiro, A.R. Zanatta, L.A.O. Nunes, Y. Messaddeq, M.A. Aegerter, Journal
of Applied Physics 83 (1998) 2256–2260.[7] F. Vetrone, J.C. Boyer, J.A. Capobianco, A. Speghini, M. Bettinelli, Journal of
Physical Chemistry B 107 (2003) 10747–10752.[8] H.S. Biao Dong, Hongquan Yu, Hui Zhang, Ruifei Qin, Xue Bai, Guohui Pan,
F.W. Shaozhe Lu, Libo Fan, Qilin Dai, Journal of Physical Chemistry C 112(2008) 1435–1440.
[9] A. Patra, P. Ghosh, P.S. Chowdhury, M. Alencar, B.W. Lozano, N. Rakov,G.S. Maciel, Journal of Physical Chemistry B 109 (2005) 10142–10146.
[10] C.H. Liu, D.P. Chen, Journal of Materials Chemistry 17 (2007) 3875–3880.[11] H.X. Mai, Y.W. Zhang, L.D. Sun, C.H. Yan, Journal of Physical Chemistry C 111
(2007) 13721–13729.[12] G.Y. Chen, Y. Liu, Z.G. Zhang, B. Aghahadi, G. Somesfalean, Q. Sun, F.P. Wang,
Chemical Physics Letters 448 (2007) 127–131.[13] S. Hinojosa, O. Barbosa-Garcia, M.A. Meneses-Nava, J.L. Maldonado, E. de la
Rosa-Cruz, G. Ramos-Ortiz, Optical Materials 27 (2005) 1839–1844.[14] W. Cordova-Martinez, E. De la Rosa-Cruz, L.A. Diaz-Torres, P. Salas,
A. Montoya, M. Avendano, R.A. Rodriguez, O. Barbosa-Garcia, OpticalMaterials 20 (2002) 263–271.
[15] E. De la Rosa-Cruz, L.A. Diaz-Torres, P. Salas, V.M. Castano, J.M. Hernandez,Journal of Physics D—Applied Physics 34 (2001) L83–L86.
[16] F. Ramos-Brito, M. Garcia-Hipolito, R. Martinez-Martinez, E. Martinez-Sanchez, C. Falcony, Journal of Physics D—Applied Physics 37 (2004)L13–L16.
[17] G. Qin, J. Lu, J.F. Bisson, Y. Feng, K. Ueda, H. Yagi, T. Yanagitani, Solid StateCommunications 132 (2004) 103–106.
[18] G. De, W. Qin, J. Zhang, J. Zhang, Y. Wang, C. Cao, Y. Cui, Journal ofLuminescence 119–120 (2006) 258–263.
[19] E. De la Rosa-Cruz, L.A. Diaz-Torres, R.A. Rodriguez-Rojas, M.A. Meneses-Nava,O. Barbosa-Garcia, P. Salas, Applied Physics Letters 83 (2003) 4903–4905.
[20] A. Patra, S. Saha, M. Alencar, N. Rakov, G.S. Maciel, Chemical Physics Letters407 (2005) 477–481.
[21] E. De la Rosa, P. Salas, H. Desirena, C. Angeles, R.A. Rodriguez, Applied PhysicsLetters 87 (2005).
[22] R.S. Meltzer, W.M. Yen, H.R. Zheng, S.P. Feofilov, M.J. Dejneka, B. Tissue,H.B. Yuan, Journal of Luminescence 94 (2001) 217–220.
[23] P.K. Sharma, M.H. Jilavi, R. Nass, H. Schmidt, Journal of Luminescence 82(1999) 187–193.
[24] B.C. Hwang, S.B. Jiang, T. Luo, J. Watson, G. Sorbello, N. Peyghambarian,Journal of the Optical Society of America B—Optical Physics 17 (2000)833–839.
[25] R.C. Garvie, P.S. Nicholson, Journal of the American Ceramic Society 55 (1972)152–157.
[26] D. Solis, Luminescence properties of ZrO2:Yb3+–Er3+ nanocrystals, MSc Thesis,Centro de Investigaciones en Optica, Leon, Gto, 2006, 106pp.
[27] B.D. Cullity (Ed.), Elements of X-ray Diffraction, Addison-Wesley PublishingCompany, Inc., Reading, MA, 1956.
[28] S.J. Hong, J.I. Han, Journal of Electroceramics 18 (2007) 67–71.[29] G. De, W. Qin, J. Zhang, J. Zhang, Y. Wang, C. Cao, Y. Cui, Solid State
Communications 137 (2006) 483–487.[30] T. Lopez-Luke, E. De la Rosa, P. Salas, C. Angeles-Chavez, L.A. Diaz-Torres,
S. Bribiesca, Journal of Physical Chemistry C 111 (2007) 17110–17117.[31] F. Vetrone, J.C. Boyer, J.A. Capobianco, A. Speghini, M. Bettinelli, Chemistry of
Materials 15 (2003) 2737–2743.[32] S. Shionoya (Ed.), Phosphor Handbook, CRC Press, Boca Raton, FL, 1999.[33] H. Guo, M. Yin, N. Dong, M. Xu, L. Lou, W. Zhang, Applied Surface Science 243
(2005) 245–250.[34] H.P. Christensen, D.R. Gabbe, H.P. Jenssen, Physical Review B 25 (3) (1982).[35] R.S. Meltzer, S.P. Feofilov, B. Tissue, H.B. Yuan, Physical Review B 60 (1999)
R14012–R14015.[36] D. Gamelin, H. Gudel, Upconversion processes in transition metal and rare
earth metal systems, in: D. Donges, D.R. Gamelin, H.U. Gudel, M.J. Riley,H. Yersin (Eds.), Transition Metal and Rare Earth Compounds, Springer, Berlin,2001, pp. 1–56.
[37] H. Desirena, E. De la Rosa, A. Shulzgen, S. Shabet, N. Peyghambarian, Journal ofPhysics D—Applied Physics 41 (2008) 7.