Printed peptide arrays identify prognostic TNC serumantibodies in glioblastoma patients
Upload
independentCategory
view
0download
0
Molecular Profiling Identifies Prognostic Subgroups ofPediatric Glioblastoma and Shows Increased YB-1Expression in TumorsDamien Faury, André Nantel, Sandra E. Dunn, Marie-Christine Guiot, Takrima Haque, Péter Hauser,Miklos Garami, Laszlo Bognar, Zoltan Hanzély, Pawel P. Liberski, Enrique Lopez-Aguilar, Elvis T. Valera,Luis G. Tone, Anne-Sophie Carret, Rolando F. Del Maestro, Martin Gleave, Jose-Luis Montes, Torsten Pietsch,Stephen Albrecht, and Nada Jabado
A B S T R A C T
PurposePediatric glioblastoma (pGBM) is a rare, but devastating brain tumor. In contrast to GBM in adults(aGBM), little is known about the mechanisms underlying its development. Our aim is to gaininsight into the molecular pathways of pGBM.
Materials and MethodsThirty-two pGBM and seven aGBM samples were investigated using biochemical and transcrip-tional profiling. Ras and Akt pathway activation was assessed through the phosphorylation ofdownstream effectors, and gene expression profiles were generated using the University HealthNetwork Human 19K cDNA arrays. Results were validated using real-time polymerase chainreaction and immunohistochemistry and compared with existing data sets on aGBM.
ResultsThere are at least two subsets of pGBM. One subset, associated with Ras and Akt pathwayactivation, has very poor prognosis and exhibits increased expression of genes related toproliferation and to a neural stem-cell phenotype, similar to findings in aggressive aGBM. Thissubset was still molecularly distinguishable from aGBM after unsupervised and supervisedanalysis of expression profiles. A second subset, with better prognosis, is not associated withactivation of Akt and Ras pathways, may originate from astroglial progenitors, and does notexpress gene signatures and markers shown to be associated with long-term survival in aGBM.Both subsets of pGBM show overexpression of Y-box-protein-1 that may help drive oncogenesisin this tumor.
ConclusionOur work, the first study of gene expression profiles in pGBM, provides valuable insight into activepathways and targets in a cancer with minimal survival, and suggests that these tumors cannot beunderstood exclusively through studies of aGBM.
J Clin Oncol 25:1196-1208. © 2007 by American Society of Clinical Oncology
INTRODUCTION
Brain tumors are the leading cause of cancer-related mortality in children. Pediatric grade IVastrocytomas (pediatric glioblastoma [pGBM]),non-neuronal tumors originating from the astro-cytic lineage,1-3 account for 15% of all pediatricbrain tumors and have a 3-year survival of lessthan 20% and high morbidity.4 Considerable in-formation is available on adult GBM (aGBM),where this tumor is frequent and deadly andthought to arise by at least two molecular path-ways. Secondary GBM occur in adults agedyounger than 40 years, evolve from low-grade
astrocytomas, and have a high frequency of p53mutations and a low frequency of epidermalgrowth factor receptor (EGFR) amplification. Pri-mary GBM targets older patients and exhibits gainof function mutations of EGFR. Both forms areindistinguishable to pathologists, and share ab-errations of the p53 and retinoblastoma (RB)pathways and similar prognosis.1-3,5 A numberof gene expression profiling analyses performedin aGBM helped to identify molecular eventsleading to oncogenesis and provided more ac-curate means for classification of subtypes andoutcomes.6-13 Fewer molecular data exist on themechanisms underlying the development and
From the Division of Hemato-Oncology,
Department of Pediatrics; Department of
Pathology, Montreal Children’s Hospital
Research Institute; Division of Neuro-
Surgery, Montreal Children’s Hospital; Divi-
sion of Neuro-Surgery and the Brain Tumor
Research Center, Montreal Neurological
Institute, McGill University Health Center;
Biotechnology Research Institute, National
Research Council of Canada, Montreal;
Laboratory for Oncogenomic Research,
Department of Pediatrics, British Columbia
Research Institute for Children’s and
Women’s Health; Department of Surgery,
Prostate Cancer Center, Jack Bell Research
Laboratories, Vancouver; Second Depart-
ment of Pediatrics, Semmelweis University;
Division of Neuro-surgery, Division of Pathol-
ogy, National Institute of Neurosurgery,
Budapest, Hungary; Department of Neuro-
pathology, Medical University of Lodz, Lodz,
Poland; Oncology Department, Pediatrics
Hospital, Centro Medico Nacional Siglo XXI,
Mexico City, Mexico; Department of Pediat-
rics, University Hospital, Faculdade de Medi-
cina de Ribeirao Preto, Universidade de Sao
Paulo, Ribeirao Preto, Sao Paulo, Brazil;
Institut of Neuropathology, University of
Bonn, Bonn, Germany.
Submitted June 16, 2006; accepted
January 2, 2007.
Supported by the Canadian Institute of
Health Research and the Penny Cole Foun-
dation (N.J.), an NRC Genome Health Initia-
tive grant (A.N.), the Hungarian Scientific
Research Fund (O.T.K.A.) Contract No.
T-04639, and the National Research and
Development Fund (N.K.F.P.) Contract No.
1A/002/2004 (P.H., M.G., L.B., Z.H.). N.J. is
the recipient of a Chercheur Boursier Award
from Fonds de la Recherche en Sante du
Quebec.
D.F. and A.N. contributed equally to this
article.
This is National Research Council publica-
tion No. 47482.
Terms in blue are defined in the glossary,
found at the end of this article and online
at www.jco.org.
Authors’ disclosures of potential conflicts
of interest and author contributions are
found at the end of this article.
Address reprint requests to Nada Jabado,
MD, PhD, Montreal Children’s Hospital
Research Institute, 4060 Ste Catherine
West, PT-239, Montreal, Quebec, Canada
H3Z 2Z3; e-mail: [email protected].
© 2007 by American Society of ClinicalOncology
0732-183X/07/2510-1196/$20.00
DOI: 10.1200/JCO.2006.07.8626
JOURNAL OF CLINICAL ONCOLOGY O R I G I N A L R E P O R T
VOLUME 25 � NUMBER 10 � APRIL 1 2007
1196Downloaded from jco.ascopubs.org on April 26, 2016. For personal use only. No other uses without permission.
Copyright © 2007 American Society of Clinical Oncology. All rights reserved.
progression of pGBM, mainly because of the relative lack offrozen samples.14,15 pGBMs are histologically indistinguishablefrom aGBM. Although they occur as de novo tumors, theyexhibit p53 mutations but only rarely EGFR amplification.16-18
Moreover, the few cytogenetic studies show that pediatric andadult astrocytomas have different chromosomal imbalanc-es,19,20 and published data study pGBM in conjunction withother grade and lineage gliomas (grade 3, mixed oligoastrocy-tomas).15,21 A better understanding of the molecular pathogen-esis of pGBM is required for the development of more effectivetherapies, particularly because most current treatments arebased on molecular knowledge gained from aGBM.
Compelling data from human studies and animal models ofGBM indicate a key role for the combined activation of the Ras andAkt pathways that control cell growth, differentiation, and surviv-al.1,3,5,22,23 Activity of Ras is aberrantly increased in most aGBMand aGBM cell lines, and Akt activation is observed in approxi-mately 70% of aGBM.10,24 Activation of these pathways in pGBMhas not been investigated.
To gain insight into the molecular pathways driving oncogen-esis in pGBM, we investigated 32 pGBM and, in parallel, sevenaGBM tumors.
MATERIALS AND METHODS
Characteristics of Samples and Central Pathologic Review
A neuropathologist independently blindly reviewed all samples to ensureconsistent classification based on contemporary guidelines from the WHO.21
Only grade 4 astrocytomas (GBM) were used. Clinical findings of all patientswith GBM and control brains are shown in Tables 1 and 2 and the Appendix(online only).
Cell Line, Protein Extraction, Sodium Dodecyl
Sulfate–Polyacrylamide Gel Electrophoresis, Immunoblot,
and Immunohistochemical Analysis
U87 was grown as described.25 Extracts were prepared from cell pellets orfrom human brain tissue and processed as previously described.10 Immuno-histochemical analyses for pErk, pAkt, glial fibrillary acidic protein (GFAP),
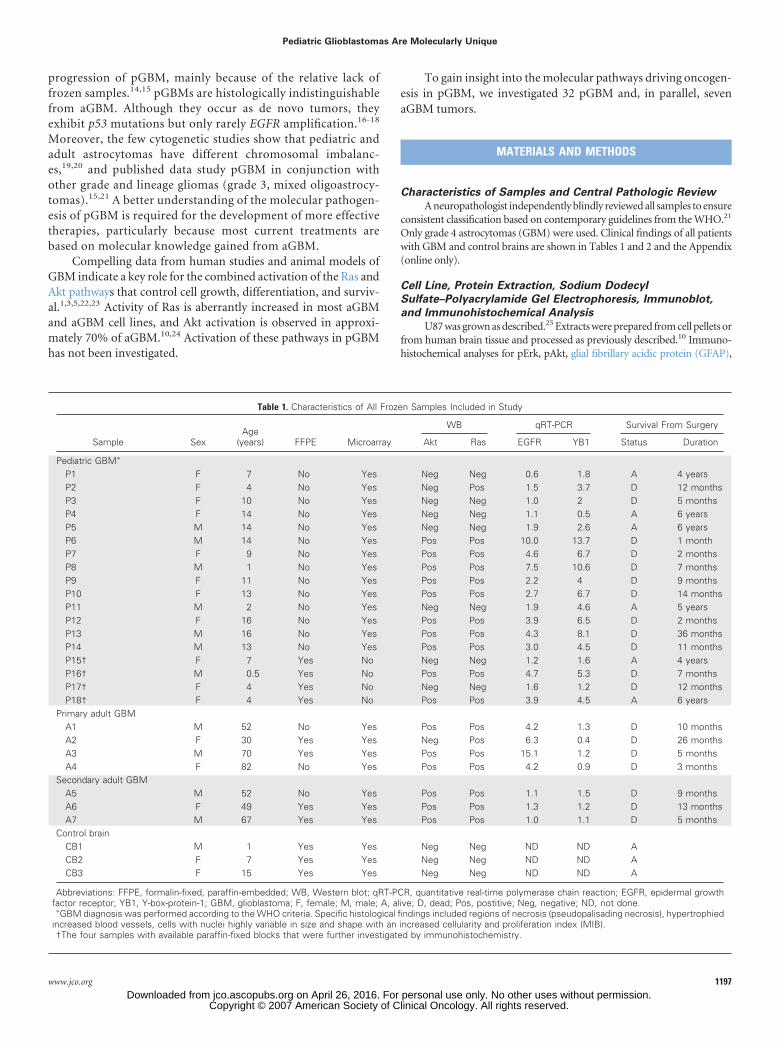
Table 1. Characteristics of All Frozen Samples Included in Study
Sample SexAge
(years) FFPE Microarray
WB qRT-PCR Survival From Surgery
Akt Ras EGFR YB1 Status Duration
Pediatric GBM�
P1 F 7 No Yes Neg Neg 0.6 1.8 A 4 yearsP2 F 4 No Yes Neg Pos 1.5 3.7 D 12 monthsP3 F 10 No Yes Neg Neg 1.0 2 D 5 monthsP4 F 14 No Yes Neg Neg 1.1 0.5 A 6 yearsP5 M 14 No Yes Neg Neg 1.9 2.6 A 6 yearsP6 M 14 No Yes Pos Pos 10.0 13.7 D 1 monthP7 F 9 No Yes Pos Pos 4.6 6.7 D 2 monthsP8 M 1 No Yes Pos Pos 7.5 10.6 D 7 monthsP9 F 11 No Yes Pos Pos 2.2 4 D 9 monthsP10 F 13 No Yes Pos Pos 2.7 6.7 D 14 monthsP11 M 2 No Yes Neg Neg 1.9 4.6 A 5 yearsP12 F 16 No Yes Pos Pos 3.9 6.5 D 2 monthsP13 M 16 No Yes Pos Pos 4.3 8.1 D 36 monthsP14 M 13 No Yes Pos Pos 3.0 4.5 D 11 monthsP15† F 7 Yes No Neg Neg 1.2 1.6 A 4 yearsP16† M 0.5 Yes No Pos Pos 4.7 5.3 D 7 monthsP17† F 4 Yes No Neg Neg 1.6 1.2 D 12 monthsP18† F 4 Yes No Pos Pos 3.9 4.5 A 6 years
Primary adult GBMA1 M 52 No Yes Pos Pos 4.2 1.3 D 10 monthsA2 F 30 Yes Yes Neg Pos 6.3 0.4 D 26 monthsA3 M 70 Yes Yes Pos Pos 15.1 1.2 D 5 monthsA4 F 82 No Yes Pos Pos 4.2 0.9 D 3 months
Secondary adult GBMA5 M 52 No Yes Pos Pos 1.1 1.5 D 9 monthsA6 F 49 Yes Yes Pos Pos 1.3 1.2 D 13 monthsA7 M 67 Yes Yes Pos Pos 1.0 1.1 D 5 months
Control brainCB1 M 1 Yes Yes Neg Neg ND ND ACB2 F 7 Yes Yes Neg Neg ND ND ACB3 F 15 Yes Yes Neg Neg ND ND A
Abbreviations: FFPE, formalin-fixed, paraffin-embedded; WB, Western blot; qRT-PCR, quantitative real-time polymerase chain reaction; EGFR, epidermal growthfactor receptor; YB1, Y-box-protein-1; GBM, glioblastoma; F, female; M, male; A, alive; D, dead; Pos, postitive; Neg, negative; ND, not done.
�GBM diagnosis was performed according to the WHO criteria. Specific histological findings included regions of necrosis (pseudopalisading necrosis), hypertrophiedincreased blood vessels, cells with nuclei highly variable in size and shape with an increased cellularity and proliferation index (MIB).†The four samples with available paraffin-fixed blocks that were further investigated by immunohistochemistry.
Pediatric Glioblastomas Are Molecularly Unique
www.jco.org 1197Downloaded from jco.ascopubs.org on April 26, 2016. For personal use only. No other uses without permission.
Copyright © 2007 American Society of Clinical Oncology. All rights reserved.

p53, and Y-Box-Protein-1 (YB1) were performed as described in the Appendix(online-only) and in Pollack et al21 and Sutherland et al.26
Laser Capture Microdissection RNA Extraction, and
Linear Amplification
Frozen sections were processed as described previously.27 The neu-ropathologist identified tumor cells for capture (Fig A1A, online only). Therest of the block was used for protein analysis. RNA was extracted fromall samples and subjected to two rounds of T7-RNA-polymerase ampli-fication. Fidelity and reproducibility of RNA amplification has beenshown28 and was further validated as described in the Appendix andFigures A1B and A1C (online-only).
Microarray Analyses
RNA from 14 pGBM and seven aGBM fresh-frozen (FF) samples wascompared with the same reference pooled RNA extracted from three healthybrains from children ages 1, 7, and 15 years. Cy3- or Cy5-labeled cDNA probesfrom samples and pooled controls were hybridized to Human 19K cDNAspotted arrays (19,008 genes/ESTs, University Health Network, http://www.microarrays.ca). Slides were scanned and intensity quantified using QuantArray(GSI Luminomics, Billerica, MA). Inversion of fluors in distinct cDNA probeswere performed (dye swap) to account for nonspecific dye-associated ef-fects on hybridization and signal detection. The LOWESS scatter-smoothing algorithm in the GeneSpring 7.0 software package (Agilent,Santa Clara, CA) normalized the raw fluorescence data. We analyzed 60
Table 2. Characteristics of All Formalin-Fixed Paraffin-Embedded Samples Included in Study
GBMAge
(years)
IHC Survival From Surgery
pAkt pErk EGFR YB1 Status Duration
P15 7 Neg Neg Neg Neg A 4 yearsP16 0.5 Pos Pos Pos C, N D 7 monthsP17 4 Neg Neg Neg Neg D 12 monthsP18 4 Pos Pos Pos C, N A 6 yearsP19 6 Neg Neg Neg Neg D 15 monthsP20 12 Pos Pos Pos C, N D 11 monthsP21 8 Pos Pos Pos C, N D 14 monthsP22 14 Pos Pos Pos C, N D 2.5 yearsP23 8 Pos Pos Pos C, N D 9 monthsP24 8 Pos Pos Pos C, N D 14 monthsP25 12 Pos Pos Pos C, N D 3 yearsP26 7 Pos Pos Pos C, N D 2 monthsP27 9 Pos Pos Pos C, N D 36 monthsP28 12 Neg Neg Neg Neg D 3 yearsP29 4 Neg Pos Neg C D 2 yearsP30 16 Neg Neg Neg C D 2 yearsP31 6 Neg Neg Neg Neg D 2 yearsP32 5 Neg Pos Neg C D 7 monthsSP1 10 Pos Pos Pos C, N D 6 monthsSP2 12 Pos Pos Pos C, N D 9 monthsSP3 4 Neg Neg Neg Neg A 3 yearsSP4 5 Neg Neg Neg Neg D 15 monthsSP5 6 Neg Neg Neg Neg A 5 yearsSP6 12 Pos Pos Pos C, N D 11 monthsSP7 8 Pos Pos Pos C, N D 4 monthsSP8 14 Pos Pos Pos C, N D 18 monthsSP9 8 Pos Pos Pos C, N D 9 monthsSP10 8 Pos Pos Pos Pos D 2 monthsSP11 12 Neg Pos Neg Neg D 1 yearSP12 7 Pos Pos Pos C, N D 5 monthsSP13 10 Pos Pos Pos C, N D 36 monthsSP14 12 Neg Neg Neg Neg D 2 yearsSP15 4 Neg Neg Neg Neg D 2 yearsSP16 5 Neg Neg Neg Neg A 4 yearsSP17 6 Neg Neg Neg Neg D 6 monthsSP18 9 Pos Pos Pos C, N D 7 monthsSP19 4 Pos Pos Pos C, N D 3 monthsSP20 7 Pos Pos Pos C, N D 10 monthsSP21 15 Pos Pos Pos C, N D 9 monthsCB1 1 Neg Neg Neg Neg ACB2 7 Neg Neg Neg Neg ACB3 15 Neg Neg Neg Neg A
NOTE. Ras and Akt pathways activation was investigated by immunohistochemistry for pErk and pAkt, respectively (Figs 1 and 2, and Appendix Fig A1B[online-only]). YB1 and EGFR expression were assessed by IHC.Abbreviations: IHC, immunohistochemistry; N, nuclear; C, cytoplasmic staining; P, pediatric glioblastoma; SP, samples from the independent data set of pediatric
glioblastoma; EGFR, epidermal growth factor receptor; YB1, Y-box protein-1; GBM, glioblastoma; A, alive; D, dead; Pos, positive; Neg, negative; CB, control brain.
Faury et al
1198 JOURNAL OF CLINICAL ONCOLOGY
Downloaded from jco.ascopubs.org on April 26, 2016. For personal use only. No other uses without permission.Copyright © 2007 American Society of Clinical Oncology. All rights reserved.

hybridizations consisting of dye-swap hybridizations of 30 biologic repli-cates for all 21 GBM samples (analysis of several samples was duplicated toassess for reproducibility from two different RNA extractions and ampli-fications; Fig A1B-A1C; Appendix). “Filter on Confidence” and analysis ofvariance (ANOVA) statistical tools in GeneSpring identified genes withreproducible changes in transcript abundance. GeneSpring was also usedto perform hierarchical clustering and principal components analy-sis (PCA). Quantitative real-time polymerase chain reaction (RT-PCR)was performed to validate relative gene expression (Appendix).
RESULTS
Activation of Ras and Akt Pathways Occurs in Only
a Subset of pGBM and Is Associated With
Poor Outcome
We investigated activation of the Ras and Akt pathways in 18 frozenpGBM tumors by Western blot analysis using phosphorylation-specificantibodies against known effectors of these pathways. U87 aGBMcell-line, and a pooled protein lysate from three pediatric controlbrains (1, 7, and 15 years) were used as positive and negative controlsrespectively. Slides from the same blocks were stained with hematox-ylin and eosin, confirming that only lysates from pGBM tumor pop-ulations were being analyzed. Phosphorylation of Raf, Mek1/2, andErk1/2 was seen in 12 of 18 pGBM samples and in the U87 cell line,indicating activation of the Ras pathway (Fig 1; data not shown).Phosphorylation of these downstream effectors of Ras was not ob-served in six of 18 pGBM samples. Phosphorylation of Akt and GSK3was observed in 10 samples (Fig 1; data not shown), all of which werealso active for Ras and had lower levels of phosphate and tensinhomolog (PTEN), the dual-activity phosphatase known to participatein inactivating the Akt pathway.29
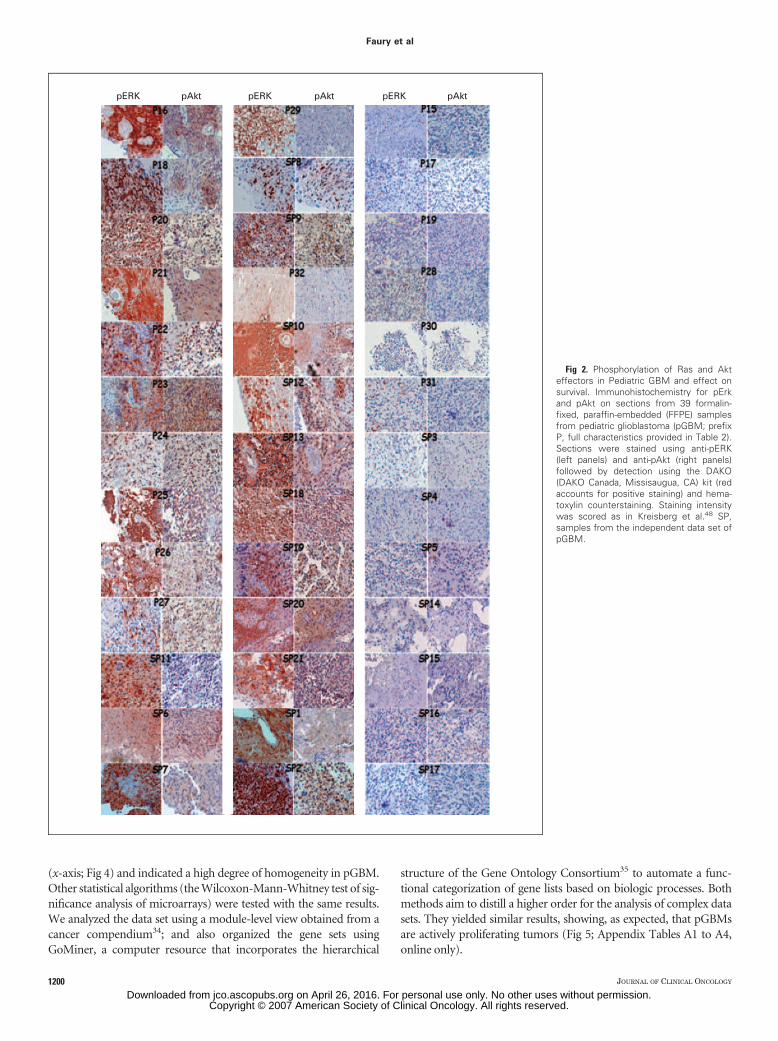
We validated results obtained by Western blot using an immu-nohistochemical approach on 18 formalin-fixed, paraffin-embedded(FFPE) pGBM samples that included four samples previously testedby Western blot on their frozen counterparts, and another new set of14 pGBM for which no frozen counterparts were available (Appen-dix). Sections from samples were tested for pErk (associated with Rasactivation), pAkt (associated with Akt activation), and glial fibrillaryacidic protein (GFAP; astrocytic marker) immunoreactivity. Fivesamples showed no staining for pErk, while showing normal stain-ing for GFAP of adjacent sections, excluding problems related totissue preservation (Fig A1D). The remaining samples showedstrong staining for pErk (Fig 2). pErk-positive regions containedspindle-like tumor cells showing atypical elongated nuclei and a fibrillarystaining typical of GBM and active Ras.30 pAkt was present in 13 of 18samples that were also positive for pErk (Fig 2). Where material for bothtechnical approaches was available, the same results were obtained.
When investigating putative prognostic factors, striking resultswere obtained for Ras activation. Children with active Ras (21 of 32)had poor survival with only one survivor, whereas five of 11 with noRas activation are alive and disease free, with a follow-up of at least 4years (log-rank P � .009). This result reflects Akt activation becausemost patients with active Ras also had active Akt (19 of 21). Sex,younger age, treatment, and p53 expression were not associated withbetter survival with the limitation of sample size.18 Availability offrozen tissue from pGBM is limited. To determine whether the dataobtained on Ras and Akt activation in pGBM has potential prognosticvalue, we performed the same immunohistochemical analysis on anindependent data set of 21 FFPE pGBM samples (Table 2; Appendix).pErk and pAkt were highly immunoreactive in 13 of 21 of thesesamples, whereas both stainings were negative in eight of 21 samples(Fig 2). Survival data further validated our data on the association ofRas and Akt activation with poor survival in pGBM (Table 2). Resultsfrom all patients suggest that there are at least two forms of pGBM: oneform with poor survival, with only one patient alive, associated with anactive Ras/Akt pathways (35 [66%] of 53 samples for Ras and31[58.5%] of 53 for Akt) and a second form with better prognosis(nine of 18 children alive and disease free), without Ras or Akt activa-tion (18 [34%] of 53; log-rank P � .0001; Fig 3; Tables 1 and 2).
Transcriptional Profiling Distinguishes Two Subsets of
pGBM on the Basis of Their Association With Ras/Akt
Activity and Reveals a Molecular Signature for pGBM
That Is Distinct From aGBM
To study gene expression changes, we selected an approach thatallows us to compare changes between tumor and nontumor brain aswell as changes between pGBM samples. RNA from 14 pGBM frozensamples was isolated and hybridized to Human 19K cDNA spottedarrays together with the same reference pooled RNA extracted fromthree control pediatric brains. Laser capture microdissection (LCM)was used to selectively capture malignant astrocytes. RNA was sub-jected to two rounds of T7 linear amplification (aRNA) to circumventthe limited amount of frozen material.31-33 GeneSpring’s Filter onConfidence tool identified 2,593 transcripts with statistically signifi-cant changes in abundance in the 14 pGBM samples compared withthe pooled control (Welsch t test P � .0001; multiple testing correc-tion, Benjamini and Hochsberg; false-discovery rate, 3.4%). Two-dimensional hierarchical clustering organized and visualized theprofiles of these transcripts (y-axis) from each of the 14 samples
pRaf1
P6 P7 P9 P1 P3 P4 P2 U87 CB
pMek1
pERK
ERK
GAPDH
pGSK3
PTEN
pAkt
Akt
Fig 1. Phosphorylation of Ras and Akt effectors in pediatric glioblastoma (GBM)and effect on survival. Total cell extracts of pooled control brains, the U87 cellline, and 18 pediatric GBM were immunoblotted using antibodies against GAPDHand signaling proteins representing Ras (ERK, MEK, Raf) and Akt (Akt, PTEN,GSK3) pathways. Control brain (CB) represents pooled lysates from threepediatric normal brains. Results from 7 pGBM, the U87 cell line and the pooledlysate from normal brains (negative control) are shown. Characteristics of thepGBM samples are detailed in Table 1. Phospho-specific antibodies are denotedwith the prefix “p.” Unphosphorylated proteins and GAPDH account forprotein loading.
Pediatric Glioblastomas Are Molecularly Unique
www.jco.org 1199Downloaded from jco.ascopubs.org on April 26, 2016. For personal use only. No other uses without permission.
Copyright © 2007 American Society of Clinical Oncology. All rights reserved.
(x-axis; Fig 4) and indicated a high degree of homogeneity in pGBM.Other statistical algorithms (the Wilcoxon-Mann-Whitney test of sig-nificance analysis of microarrays) were tested with the same results.We analyzed the data set using a module-level view obtained from acancer compendium34; and also organized the gene sets usingGoMiner, a computer resource that incorporates the hierarchical
structure of the Gene Ontology Consortium35 to automate a func-tional categorization of gene lists based on biologic processes. Bothmethods aim to distill a higher order for the analysis of complex datasets. They yielded similar results, showing, as expected, that pGBMsare actively proliferating tumors (Fig 5; Appendix Tables A1 to A4,online only).
pERK pAkt pAkt pAktpERK pERK
Fig 2. Phosphorylation of Ras and Akteffectors in Pediatric GBM and effect onsurvival. Immunohistochemistry for pErkand pAkt on sections from 39 formalin-fixed, paraffin-embedded (FFPE) samplesfrom pediatric glioblastoma (pGBM; prefixP, full characteristics provided in Table 2).Sections were stained using anti-pERK(left panels) and anti-pAkt (right panels)followed by detection using the DAKO(DAKO Canada, Missisaugua, CA) kit (redaccounts for positive staining) and hema-toxylin counterstaining. Staining intensitywas scored as in Kreisberg et al.48 SP,samples from the independent data set ofpGBM.
Faury et al
1200 JOURNAL OF CLINICAL ONCOLOGY
Downloaded from jco.ascopubs.org on April 26, 2016. For personal use only. No other uses without permission.Copyright © 2007 American Society of Clinical Oncology. All rights reserved.
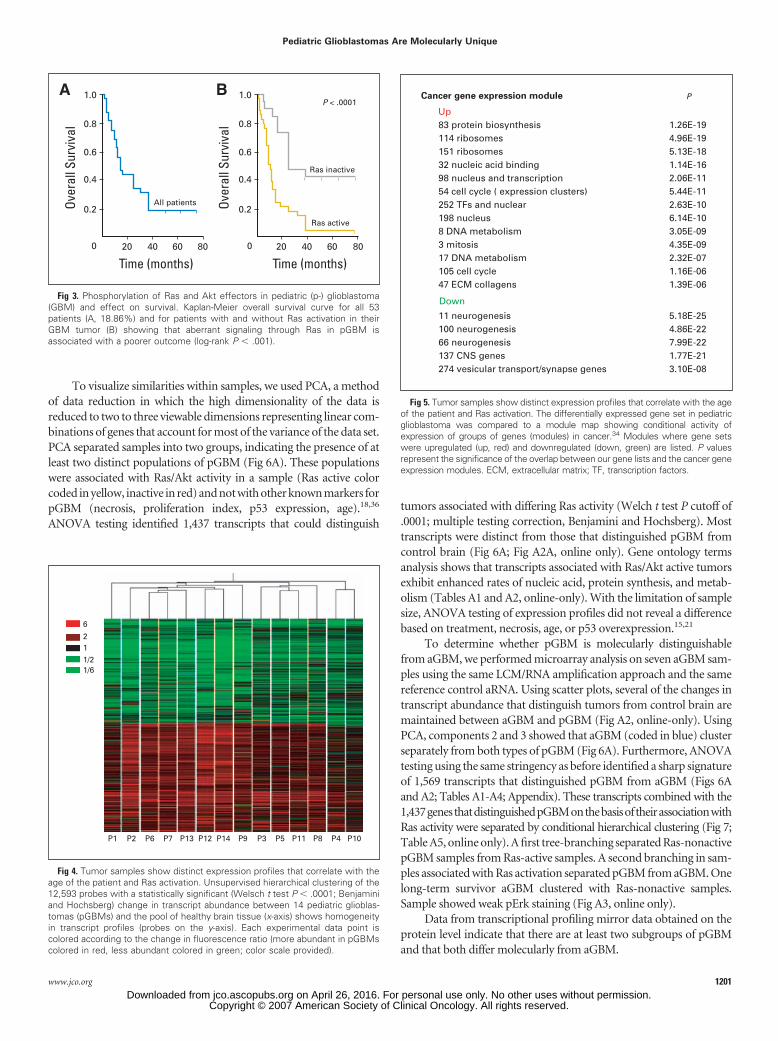
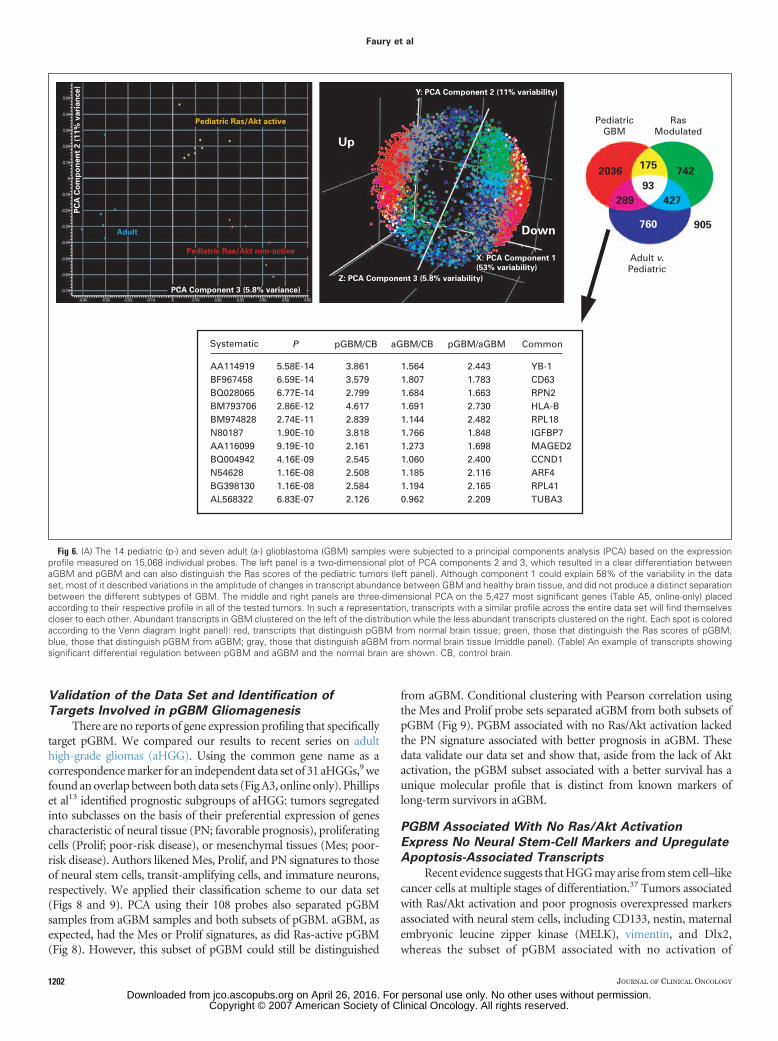
To visualize similarities within samples, we used PCA, a methodof data reduction in which the high dimensionality of the data isreduced to two to three viewable dimensions representing linear com-binations of genes that account for most of the variance of the data set.PCA separated samples into two groups, indicating the presence of atleast two distinct populations of pGBM (Fig 6A). These populationswere associated with Ras/Akt activity in a sample (Ras active colorcoded in yellow, inactive in red) and not with other known markers forpGBM (necrosis, proliferation index, p53 expression, age).18,36
ANOVA testing identified 1,437 transcripts that could distinguish
tumors associated with differing Ras activity (Welch t test P cutoff of.0001; multiple testing correction, Benjamini and Hochsberg). Mosttranscripts were distinct from those that distinguished pGBM fromcontrol brain (Fig 6A; Fig A2A, online only). Gene ontology termsanalysis shows that transcripts associated with Ras/Akt active tumorsexhibit enhanced rates of nucleic acid, protein synthesis, and metab-olism (Tables A1 and A2, online-only). With the limitation of samplesize, ANOVA testing of expression profiles did not reveal a differencebased on treatment, necrosis, age, or p53 overexpression.15,21
To determine whether pGBM is molecularly distinguishablefrom aGBM, we performed microarray analysis on seven aGBM sam-ples using the same LCM/RNA amplification approach and the samereference control aRNA. Using scatter plots, several of the changes intranscript abundance that distinguish tumors from control brain aremaintained between aGBM and pGBM (Fig A2, online-only). UsingPCA, components 2 and 3 showed that aGBM (coded in blue) clusterseparately from both types of pGBM (Fig 6A). Furthermore, ANOVAtesting using the same stringency as before identified a sharp signatureof 1,569 transcripts that distinguished pGBM from aGBM (Figs 6Aand A2; Tables A1-A4; Appendix). These transcripts combined with the1,437genesthatdistinguishedpGBMonthebasisoftheirassociationwithRas activity were separated by conditional hierarchical clustering (Fig 7;Table A5, online only). A first tree-branching separated Ras-nonactivepGBM samples from Ras-active samples. A second branching in sam-ples associated with Ras activation separated pGBM from aGBM. Onelong-term survivor aGBM clustered with Ras-nonactive samples.Sample showed weak pErk staining (Fig A3, online only).
Data from transcriptional profiling mirror data obtained on theprotein level indicate that there are at least two subgroups of pGBMand that both differ molecularly from aGBM.
Over
all S
urvi
val
Over
all S
urvi
val
Time (months) Time (months)
1.0
0.8
All patients
0.6
0.4
0.2
0 020 40 60 80
Ras inactive
Ras active
1.0
0.8
0.6
0.4
0.2
20 40 60 80
P < .0001A B
Fig 3. Phosphorylation of Ras and Akt effectors in pediatric (p-) glioblastoma(GBM) and effect on survival. Kaplan-Meier overall survival curve for all 53patients (A, 18.86%) and for patients with and without Ras activation in theirGBM tumor (B) showing that aberrant signaling through Ras in pGBM isassociated with a poorer outcome (log-rank P � .001).
P1
6
21
1/21/6
P2 P6 P8 P4P7 P13 P12 P14 P9 P3 P5 P11 P10
Fig 4. Tumor samples show distinct expression profiles that correlate with theage of the patient and Ras activation. Unsupervised hierarchical clustering of the12,593 probes with a statistically significant (Welsch t test P � .0001; Benjaminiand Hochsberg) change in transcript abundance between 14 pediatric glioblas-tomas (pGBMs) and the pool of healthy brain tissue (x-axis) shows homogeneityin transcript profiles (probes on the y-axis). Each experimental data point iscolored according to the change in fluorescence ratio (more abundant in pGBMscolored in red, less abundant colored in green; color scale provided).
Cancer gene expression module
83 protein biosynthesis114 ribosomes151 ribosomes32 nucleic acid binding98 nucleus and transcription54 cell cycle ( expression clusters)252 TFs and nuclear198 nucleus8 DNA metabolism3 mitosis17 DNA metabolism105 cell cycle47 ECM collagens
Up
11 neurogenesis100 neurogenesis66 neurogenesis137 CNS genes274 vesicular transport/synapse genes
1.26E-194.96E-195.13E-181.14E-162.06E-115.44E-112.63E-106.14E-103.05E-094.35E-092.32E-071.16E-061.39E-06
5.18E-254.86E-227.99E-221.77E-213.10E-08
Down
P
Fig 5. Tumor samples show distinct expression profiles that correlate with the ageof the patient and Ras activation. The differentially expressed gene set in pediatricglioblastoma was compared to a module map showing conditional activity ofexpression of groups of genes (modules) in cancer.34 Modules where gene setswere upregulated (up, red) and downregulated (down, green) are listed. P valuesrepresent the significance of the overlap between our gene lists and the cancer geneexpression modules. ECM, extracellular matrix; TF, transcription factors.
Pediatric Glioblastomas Are Molecularly Unique
www.jco.org 1201Downloaded from jco.ascopubs.org on April 26, 2016. For personal use only. No other uses without permission.
Copyright © 2007 American Society of Clinical Oncology. All rights reserved.
Validation of the Data Set and Identification of
Targets Involved in pGBM Gliomagenesis
There are no reports of gene expression profiling that specificallytarget pGBM. We compared our results to recent series on adulthigh-grade gliomas (aHGG). Using the common gene name as acorrespondence marker for an independent data set of 31 aHGGs,9 wefound an overlap between both data sets (Fig A3, online only). Phillipset al13 identified prognostic subgroups of aHGG: tumors segregatedinto subclasses on the basis of their preferential expression of genescharacteristic of neural tissue (PN; favorable prognosis), proliferatingcells (Prolif; poor-risk disease), or mesenchymal tissues (Mes; poor-risk disease). Authors likened Mes, Prolif, and PN signatures to thoseof neural stem cells, transit-amplifying cells, and immature neurons,respectively. We applied their classification scheme to our data set(Figs 8 and 9). PCA using their 108 probes also separated pGBMsamples from aGBM samples and both subsets of pGBM. aGBM, asexpected, had the Mes or Prolif signatures, as did Ras-active pGBM(Fig 8). However, this subset of pGBM could still be distinguished
from aGBM. Conditional clustering with Pearson correlation usingthe Mes and Prolif probe sets separated aGBM from both subsets ofpGBM (Fig 9). PGBM associated with no Ras/Akt activation lackedthe PN signature associated with better prognosis in aGBM. Thesedata validate our data set and show that, aside from the lack of Aktactivation, the pGBM subset associated with a better survival has aunique molecular profile that is distinct from known markers oflong-term survivors in aGBM.
PGBM Associated With No Ras/Akt Activation
Express No Neural Stem-Cell Markers and Upregulate
Apoptosis-Associated Transcripts
Recent evidence suggests that HGG may arise from stem cell–likecancer cells at multiple stages of differentiation.37 Tumors associatedwith Ras/Akt activation and poor prognosis overexpressed markersassociated with neural stem cells, including CD133, nestin, maternalembryonic leucine zipper kinase (MELK), vimentin, and Dlx2,whereas the subset of pGBM associated with no activation of
PediatricGBM
Up
Y: PCA Component 2 (11% variability)
Pediatric Ras/Akt active
Pediatric Ras/Akt non-active
Adult
Z: PCA Component 3 (5.8% variability)
PCA Component 3 (5.8% variance)
PC
A C
om
po
nen
t 2 (
11%
vari
an
ce)
X: PCA Component 1
(53% variability)
Down
RasModulated
Adult v.Pediatric
175
93
760
427289
742
905
2036
Systematic
AA114919BF967458BQ028065BM793706BM974828N80187AA116099BQ004942N54628BG398130AL568322
5.58E-146.59E-146.77E-142.86E-122.74E-111.90E-109.19E-104.16E-091.16E-081.16E-086.83E-07
3.8613.5792.7994.6172.8393.8182.1612.5452.5082.5842.126
1.5641.8071.6841.6911.1441.7661.2731.0601.1851.1940.962
2.4431.7831.6632.7302.4821.8481.6982.4002.1162.1652.209
YB-1CD63RPN2HLA-BRPL18IGFBP7MAGED2CCND1ARF4RPL41TUBA3
P pGBM/CB pGBM/aGBM CommonaGBM/CB
Fig 6. (A) The 14 pediatric (p-) and seven adult (a-) glioblastoma (GBM) samples were subjected to a principal components analysis (PCA) based on the expressionprofile measured on 15,068 individual probes. The left panel is a two-dimensional plot of PCA components 2 and 3, which resulted in a clear differentiation betweenaGBM and pGBM and can also distinguish the Ras scores of the pediatric tumors (left panel). Although component 1 could explain 58% of the variability in the dataset, most of it described variations in the amplitude of changes in transcript abundance between GBM and healthy brain tissue, and did not produce a distinct separationbetween the different subtypes of GBM. The middle and right panels are three-dimensional PCA on the 5,427 most significant genes (Table A5, online-only) placedaccording to their respective profile in all of the tested tumors. In such a representation, transcripts with a similar profile across the entire data set will find themselvescloser to each other. Abundant transcripts in GBM clustered on the left of the distribution while the less abundant transcripts clustered on the right. Each spot is coloredaccording to the Venn diagram (right panel): red, transcripts that distinguish pGBM from normal brain tissue; green, those that distinguish the Ras scores of pGBM;blue, those that distinguish pGBM from aGBM; gray, those that distinguish aGBM from normal brain tissue (middle panel). (Table) An example of transcripts showingsignificant differential regulation between pGBM and aGBM and the normal brain are shown. CB, control brain.
Faury et al
1202 JOURNAL OF CLINICAL ONCOLOGY
Downloaded from jco.ascopubs.org on April 26, 2016. For personal use only. No other uses without permission.Copyright © 2007 American Society of Clinical Oncology. All rights reserved.

Ras/Akt and better outcome only showed increased vimentin ex-pression (Fig 10).13,37,38 Expression levels were validated byquantitative RT-PCR (qRT-PCR) for all of these transcripts (datanot shown). Using GoMiner, differentially modulated transcriptsassociated with Ras-nonactive pGBM showed overexpression ofgene sets involved in apoptosis. Conversely, aGBM and pGBMassociated with a Ras-active pathway showed overexpression ofgene sets involved in protein synthesis, translation, transcription,DNA repair, and synthesis (Tables A1 to A4, online-only).
YB1 Is Overexpressed in pGBM and May Increase
EGFR Expression in Akt-Active Samples
YB1 showed increased expression (3.8-fold compared withhealthy brain) in 12 of 14 pGBM samples, but not in aGBM (Fig 6B).YB1 was further investigated because it is involved in brain embryo-genesis and contributes to oncogenesis in a range of epithelial cancers,potentially through Akt mediated phosphorylation.26,39-41 We vali-dated expression of YB1 by qRT-PCR and by immunohistochemistry(Figs 11 and 12; Tables 1 and 2). YB1 was overexpressed in 26 of 32samples with mostly nuclear localization in samples with activeAkt, and was cytoplasmic in samples with no active Akt. Thesedata were corroborated by results obtained on the independentdata set of 21 pGBM samples: 12 of 21 positive with nuclearstaining for YB1 in Akt-active samples (Table 2). Nuclear YB1increases expression of several genes including EGFR.42 We foundEGFR overexpression by qRT-PCR and immunohistochemistrymainly in Akt-active samples (Tables 1 and 2).
DISCUSSION
This study is one of the first reports of gene expression profiling inpGBM that focuses exclusively on pGBM. Protein analysis andtranscriptional profiling suggest that there are at least two subtypes
of pGBM, one associated with Ras/Akt-activation and poor prog-nosis and the other with no obvious Ras/Akt activity and a betteroutcome (Fig 1). This is in contrast to aGBM, in which Ras pathway isactivated in most tumors.10,24 Even though they share, as expected,common gene sets that are mainly related to the general tumori-genic process, both subtypes of pGBM exhibit distinct profilesfrom those of aGBM (Figs 1 to 12).
Previous studies on pHGG reported that patients olderthan 3 years had increased p53 expression in tumors and thatboth parameters correlated with worse outcome.18,21,36 p53overexpression in this study was not associated with differencesin survival or in gene expression patterns, probably because ofthe sample size and the limited number of infants we tested.Established markers of better outcome in aHGG includeyounger age, grade 3, absence of necrosis on histology, no Aktactivation, and, more recently, molecular signatures associatedwith NOTCH signaling and proneural markers.7,11-13 In thisstudy on grade 4 tumors, we found Akt activation, expression ofmarkers of neural stem cells (nestin, dlx2, CD133, vimentin,and ELK), and a proliferative and, to a lesser extent, a mesen-chymal signature to be common prognostic factors betweenpGBM associated with Ras/Akt activation and aGBM. However,despite these similarities, we could still distinguish both subsetsusing unsupervised and supervised analysis (Figs 4 to 9). Thesubset of pGBM showing a better outcome did not have neuronallineage markers as were seen in long-term aHGG survivors,13 whereaswe observed upregulation of genes associated with apoptosis and aphenotype consistent with immature astroglial cells.
YB1 was overexpressed in 38 (72%) of 53 of pGBM (Figs 10 to12; Tables 1 and 2). This RNA-binding protein/transcription factoris involved in brain development,40 and its nuclear localization isassociated with poorer outcome, increased MDR expression, and
6
21
1/21/6
pG
BM
Ras
/Akt
+p
GB
MR
as/A
kt–
Sam
ple
P3
P1
P5
P11
P4
P10
A2
P2
P12
P14
P6
P13
P8
P7
P9
A1
A4
A6
A5
A3
A7
–
–
–
–
–
–
+
+
+
+
+
+
+
+
+
+
+
+
+
+
+
Y
N
Y
Y
Y
N
N*
N
N
N
N
N
N
N
N
N
N
N
N
N
N
Ras
Su
rviv
al
aGB
M
Fig 7. Profiling of transcripts that distin-guish patient age and Ras scores. Two-dimensional hierarchical clustering of 2,486probes that exhibit a statistically significantchange in transcript abundance betweensample pairs from Ras� pediatric (p-) glio-blastoma (GBM), Ras� pGBM, or from adult(a-) GBM (Table A1). Each sample is furtherclassified according to age, Ras activation,and patient survival.
Pediatric Glioblastomas Are Molecularly Unique
www.jco.org 1203Downloaded from jco.ascopubs.org on April 26, 2016. For personal use only. No other uses without permission.
Copyright © 2007 American Society of Clinical Oncology. All rights reserved.

tumor progression in several cancers that did not previously in-clude CNS tumors.43 YB1 was mainly expressed in the cytoplasm ofpGBM samples with no Ras/Akt activation, and may have contrib-uted to general transcriptional repression through its binding topro-mRNAs (Figs 10 to 12; Table 2).41 In breast cancer cell lines,Akt-mediated YB1 phosphorylation leads to nuclear translocationpromoting increased expression of EGFR, a known oncogene inprimary aGBM.42,44 In this study, YB1 was mainly nuclear inpGBM associated with Ras/Akt activation (Tables 1 and 2). These
samples showed increased EGFR and increased expression of tran-scripts associated with cell proliferation (Tables 1 and 2). Many ofthe YB1-associated messages encode stress- and growth-relatedproteins, raising the possibility that Akt-mediated YB1 phosphor-ylation increases the production of proteins regulating cell prolif-eration and oncogenic transformation. Moreover, nuclear YB1interacts with p53 and inhibits this tumor suppressor’s ability tocause cell death and to transactivate cell-death genes.45 We hypoth-esize that YB1 may be one target of active Akt contributing togliomagenesis in pGBM by relieving the translational repression ofYB126,41 on numerous pro-mRNAs, increasing EGFR levels andRas activity, and interfering with p53 function.
Ras and Akt cooperate in tumorigenesis and increase translationefficiency in tumor cells10,23,24,46,47 as also shown in this study (Figs 4to 9; Tables A1 to A4, online-only), which may also account fordifferences in survival we see between both subgroups of pGBM.
Our work suggests that pGBM cannot be understood exclusivelythrough studies of aGBM. We have strong leads for mechanisticevents, including YB1 expression, that warrant additional work andprovide insight into molecular profiles in a pediatric cancer wheresurvival is minimal.
All genes
Proliferative
MesenchymalPC#2
PC#1PC#3
aGBM pGBMRas/Akt– pGBMRas/Akt+
Fig 8. Profiling of transcripts that distinguish patient age and Ras scores. Weused supervised analysis and principal components analysis (PCA) on the 108probe sets that identified the prognostic subgroups established by Phillips et al13:three-dimensional PCA—the upper panel shows all 108 probes and the middlepanel shows probes associated with a proliferation signature (Proliferative). Bothprobe sets differentiate samples based on age and Ras activity as in our data set;the lower panel shows that the signature probes associated with a Mesenchymalsignature are partly shared by both subsets of pediatric glioblastoma (pGBM).aGBM, adult glioblastoma.
A1 A6 A5 A4 A3 A2 P3
aGBM pGBMRas/Akt– pGBMRas/Akt+
P4 P5 P10 P11 P1 P8P2P6P9P12P13P7P14A7
Fig 9. Profiling of transcripts that distinguish patient age and Ras scores.Conditional hierarchical clustering with Pearson correlation on probes associatedwith a mesenchymal (Mes) or proliferative (Pro) signature separate adult glioblas-toma (aGBM) samples, pediatric glioblastoma (pGBM) associated with no Ras/Akt activation, and pGBM associated with Ras/Akt activation. Expression levelsare color-coded (upregulated transcripts are in red, downregulated transcripts arein green). The same aGBM patient that clustered with the Ras nonactive samples(Fig 7) clustered similarly using this gene set. Samples are arbitrarily color codedfor clarity reasons: blue, aGBM; yellow pGBM associated with Ras/Akt activation(Ras/Akt�); red pGBM not associated with Ras/Akt active pathways (Ras/Akt�).
Faury et al
1204 JOURNAL OF CLINICAL ONCOLOGY
Downloaded from jco.ascopubs.org on April 26, 2016. For personal use only. No other uses without permission.Copyright © 2007 American Society of Clinical Oncology. All rights reserved.

Nor
mal
ized
Inte
nsity
(log
sca
le)
A
Nor
mal
ized
Inte
nsity
(log
sca
le)
B
Nor
mal
ized
Inte
nsity
(log
sca
le)
C
Nor
mal
ized
Inte
nsity
(log
sca
le)
D
Nor
mal
ized
Inte
nsity
(log
sca
le)
E
1
10
1
10
1
10
1
10
1
100
10
aGBM pGBMRas/Akt+ pGBMRas/Akt–
aGBM pGBMRas/Akt+ pGBMRas/Akt–
aGBM pGBMRas/Akt+ pGBMRas/Akt–
aGBM pGBMRas/Akt+ pGBMRas/Akt–
aGBM pGBMRas/Akt+ pGBMRas/Akt–
Fig 10. Glioblastoma (GBM) subclasses aredistinguished by markers of neural stemcells. Relative to pediatric GBM (pGBM) withnegative Akt/Ras scores, adult GBM (aGBM)and pGBM with active Ras/Akt show strongexpression (validated by quantitative reversetranscriptase polymerase chain reaction) ofthe neural stem cells and transit-amplifyingmarkers CD133, dlx2, nestin, and maternalembryonic leucine zipper kinase (MELK). Vi-mentin, a marker of transit amplifying andastroglial progenitors, is overexpressed in allsamples, with a mean 3.74 pGBM/aGBMfold expression ratio.
Pediatric Glioblastomas Are Molecularly Unique
www.jco.org 1205Downloaded from jco.ascopubs.org on April 26, 2016. For personal use only. No other uses without permission.
Copyright © 2007 American Society of Clinical Oncology. All rights reserved.

A B
C D
Fig 12. Pattern of Y-box-protein-1(YB1)expression in pGBM and normal brain.Immunohistochemical staining for YB1was performed on pediatric glioblastoma(pGBM; A-C) and healthy brain (D). Anti-YB1 C-terminus antibody and staining andscoring of slides were performed as previ-ously described.26 Representative, nuclear(A), cytoplasmic (B), and negative (C)staining are shown; inset shows a mag-nification of cells positive for nuclear orcytoplasmic staining.
GBM
P1P2P3P4P5P6P7P8P9P10P11P12P13P14
1.653.223.071.543.617.374.045.281.764.482.623.24.53.68
1.8+/–0.223.7+/–0.392+/–0.310.5+/0.132.6+/–0.16
13.7+/–0.626.7+/–0.15
10.6+/–0.324+/–0.31
4.6+/–1.016.7+/–0.496.5+/–0.498.1+/–0.214.5+/–0.31
YB1
GeneSpring qRT-PCR GeneSpring qRT-PCR
Arha
1.251.891.750.951.311.941.162.352.180.911.193.24
32.98
1.5+/–0.361.6+/–0.522.6+/–0.720.3+/–0.070.7+/–0.343.3+/–1.100.6+/–0.194.2+/–1.343.1+/–1.320.8+/–0.101.1+/–0.243.1+/–1.736.4+/–1.503+/–1.23
Fig 11. Validation of Y-box-protein-1(YB1) overexpression in pediatricglioblastoma (pGBM). Quantitative reverse transcriptase polymerase chainreaction done for YB1 and Arha on pGBM samples validating data obtainedby microarray analysis. qRT-PCR, quantitative real-time polymerase chainreaction.
Faury et al
1206 JOURNAL OF CLINICAL ONCOLOGY
Downloaded from jco.ascopubs.org on April 26, 2016. For personal use only. No other uses without permission.Copyright © 2007 American Society of Clinical Oncology. All rights reserved.

AUTHORS’ DISCLOSURES OF POTENTIAL CONFLICTSOF INTEREST
The authors indicated no potential conflicts of interest.
AUTHOR CONTRIBUTIONS
Conception and design: Damien Faury, André Nantel, Steffen Albrecht,Nada JabadoFinancial support: Nada JabadoAdministrative support: Nada JabadoProvision of study materials or patients: André Nantel, Sandra E.Dunn, Péter Hauser, Miklos Garami, Laszlo Bognar, Zoltan Hanzély,
Pawel P. Liberski, Enrique Lopez-Aguilar, Elvis Valera, Luis G. Tone,Rolando Del Maestro, Martin Gleave, Jose-Luis Montes, Torsten PietschCollection and assembly of data: Damien Faury, André Nantel, SandraE. Dunn, Marie-Christine Guiot, Takrima Haque, Torsten Pietsch,Steffen Albrecht, Nada JabadoData analysis and interpretation: Damien Faury, Marie-Christine Guiot,Takrima Haque, Anne-Sophie Carret, Steffen Albrecht, Nada JabadoManuscript writing: Damien Faury, André Nantel, Sandra E. Dunn,Miklos Garami, Rolando Del Maestro, Jose-Luis Montes, Nada JabadoFinal approval of manuscript: Damien Faury, André Nantel, Sandra E.Dunn, Marie-Christine Guiot, Takrima Haque, Péter Hauser, MiklosGarami, Laszlo Bognar, Zoltan Hanzély, Pawel P. Liberski, EnriqueLopez-Aguilar, Elvis Valera, Luis G. Tone, Anne-Sophie Carret, RolandoDel Maestro, Martin Gleave, Jose-Luis Montes, Steffen Albrecht,Nada Jabado
REFERENCES
1. Maher EA, Furnari FB, Bachoo RM, et al:Malignant glioma: Genetics and biology of a gravematter. Genes Dev 15:1311-1333, 2001
2. Holland EC: Gliomagenesis: Genetic alter-ations and mouse models. Nat Rev Genet 2:120-129, 2001
3. Zhu Y, Parada LF: The molecular and geneticbasis of neurological tumours. Nat Rev Cancer2:616-626, 2002
4. Packer RJ: Primary central nervous systemtumors in children. Curr Treat Options Neurol 1:395-408, 1999
5. Louis DN, Holland EC, Cairncross JG: Gliomaclassification: A molecular reappraisal. Am J Pathol159:779-786, 2001
6. Mischel PS, Shai R, Shi T, et al: Identificationof molecular subtypes of glioblastoma by geneexpression profiling. Oncogene 22:2361-2373, 2003
7. Mischel PS, Nelson SF, Cloughesy TF: Molec-ular analysis of glioblastoma: Pathway profiling andits implications for patient therapy. Cancer Biol Ther2:242-247, 2003
8. Nigro JM, Misra A, Zhang L, et al: Integratedarray-comparative genomic hybridization and ex-pression array profiles identify clinically relevantmolecular subtypes of glioblastoma. Cancer Res65:1678-1686, 2005
9. Liang Y, Diehn M, Watson N, et al: Geneexpression profiling reveals molecularly and clini-cally distinct subtypes of glioblastoma multiforme.Proc Natl Acad Sci U S A 102:5814-5819, 2005
10. Rajasekhar VK, Viale A, Socci ND, et al: Onco-genic Ras and Akt signaling contribute to glioblas-toma formation by differential recruitment ofexisting mRNAs to polysomes. Mol Cell 12:889-901,2003
11. Nutt CL, Mani DR, Betensky RA, et al: Geneexpression-based classification of malignant glio-mas correlates better with survival than histologicalclassification. Cancer Res 63:1602-1607, 2003
12. Rich JN, Hans C, Jones B, et al: Gene expres-sion profiling and genetic markers in glioblastomasurvival. Cancer Res 65:4051-4058, 2005
13. Phillips HS, Kharbanda S, Chen R, et al: Mo-lecular subclasses of high-grade glioma predict prog-nosis, delineate a pattern of disease progression,and resemble stages in neurogenesis. Cancer Cell9:157-173, 2006
14. Pollack IF, Hamilton RL, Finkelstein SD, et al:Molecular abnormalities and correlations with tumorresponse and outcome in glioma patients. Neuroim-aging Clin N Am 12:627-639, 2002
15. Rood BR, Macdonald TJ: Pediatric high-gradeglioma: Molecular genetic clues for innovative ther-apeutic approaches. J Neurooncol 75:267-72, 2005
16. Raffel C, Frederick L, O’Fallon JR, et al: Anal-ysis of oncogene and tumor suppressor gene alter-ations in pediatric malignant astrocytomas revealsreduced survival for patients with PTEN mutations.Clin Cancer Res 5:4085-4090, 1999
17. Bredel M, Pollack IF, Hamilton RL, et al:Epidermal growth factor receptor expression andgene amplification in high-grade non-brainstem glio-mas of childhood. Clin Cancer Res 5:1786-1792,1999
18. Pollack IF, Finkelstein SD, Burnham J, et al:Age and TP53 mutation frequency in childhoodmalignant gliomas: Results in a multi-institutionalcohort. Cancer Res 61:7404-7407, 2001
19. Orr LC, Fleitz J, McGavran L, et al: Cytogenet-ics in pediatric low-grade astrocytomas. Med PediatrOncol 38:173-177, 2002
20. Rickert CH, Strater R, Kaatsch P, et al: Pedi-atric high-grade astrocytomas show chromosomalimbalances distinct from adult cases. Am J Pathol158:1525-1532, 2001
21. Pollack IF, Finkelstein SD, Woods J, et al:Expression of p53 and prognosis in children withmalignant gliomas. N Engl J Med 346:420-427, 2002
22. Holland EC, Sonenberg N, Pandolfi PP, et al:Signaling control of mRNA translation in cancerpathogenesis. Oncogene 23:3138-3144, 2004
23. Holland EC, Celestino J, Dai C, et al: Com-bined activation of Ras and Akt in neural progenitorsinduces glioblastoma formation in mice. Nat Genet25:55-57, 2000
24. Guha A, Feldkamp MM, Lau N, et al: Prolifer-ation of human malignant astrocytomas is depen-dent on Ras activation. Oncogene 15:2755-2765,1997
25. Shi Q, Bao S, Maxwell JA, et al: Secretedprotein acidic, rich in cysteine (SPARC), mediatescellular survival of gliomas through AKT activation.J Biol Chem 279:52200-52209, 2004
26. Sutherland BW, Kucab J, Wu J, et al: Aktphosphorylates the Y-box binding protein 1 atSer102 located in the cold shock domain and affectsthe anchorage-independent growth of breast cancercells. Oncogene 24:4281-4292, 2005
27. Mariani L, McDonough WS, Hoelzinger DB, etal: Identification and validation of P311 as a glioblas-toma invasion gene using laser capture microdissec-tion. Cancer Res 61:4190-4196, 2001
28. Yim SH, Ward JM, Dragan Y, et al: Microarrayanalysis using amplified mRNA from laser capturemicrodissection of microscopic hepatocellular pre-cancerous lesions and frozen hepatocellular carcino-
mas reveals unique and consistent gene expressionprofiles. Toxicol Pathol 31:295-303, 2003
29. Choe G, Horvath S, Cloughesy TF, et al:Analysis of the phosphatidylinositol 3�-kinase signal-ing pathway in glioblastoma patients in vivo. CancerRes 63:2742-2746, 2003
30. Hu X, Pandolfi PP, Li Y, et al: MTOR promotessurvival and astrocytic characteristics induced byPten/AKT signaling in glioblastoma. Neoplasia 7:356-368, 2005
31. Watanabe H, Tanaka F, Doyu M, et al: Differ-ential somatic CAG repeat instability in variable braincell lineage in dentatorubral pallidoluysian atrophy(DRPLA): a laser-captured microdissection (LCM)-based analysis. Hum Genet 107:452-457, 2000
32. Emmert-Buck MR, Bonner RF, Smith PD, etal: Laser capture microdissection. Science 274:998-1001, 1996
33. Bonaventure P, Guo H, Tian B, et al: Nucleiand subnuclei gene expression profiling in mamma-lian brain. Brain Res 943:38-47, 2002
34. Segal E, Friedman N, Koller D, et al: Amodule map showing conditional activity of ex-pression modules in cancer. Nat Genet 36:1090-1098, 2004
35. Zeeberg BR, Feng W, Wang G, et al: GoMiner:A resource for biological interpretation of genomicand proteomic data. Genome Biol 4:R28, 2003
36. Pollack IF, Hamilton RL, Finkelstein SD, et al:The relationship between TP53 mutations and over-expression of p53 and prognosis in malignant glio-mas of childhood. Cancer Res 57:304-309, 1997
37. Sanai N, Alvarez-Buylla A, Berger MS: Neuralstem cells and the origin of gliomas. N Engl J Med353:811-822, 2005
38. Singh SK, Clarke ID, Terasaki M, et al: Identi-fication of a cancer stem cell in human brain tumors.Cancer Res 63:5821-5828, 2003
39. Kohno K, Izumi H, Uchiumi T, et al: Thepleiotropic functions of the Y-box-binding protein,YB-1. Bioessays 25:691-698, 2003
40. Lu ZH, Books JT, Ley TJ: YB-1 is important forlate-stage embryonic development, optimal cellularstress responses, and the prevention of prematuresenescence. Mol Cell Biol 25:4625-4637, 2005
41. Evdokimova V, Ruzanov P, Anglesio MS, et al:Akt-mediated YB-1 phosphorylation activates trans-lation of silent mRNA species. Mol Cell Biol 26:277-292, 2006
42. Wu J, Lee C, Yokom D, et al: Disruption of theY-box binding protein-1 results in suppression of theepidermal growth factor receptor and HER-2. Can-cer Res 66:4872-4879, 2006
43. Kuwano M, Uchiumi T, Hayakawa H, et al: Thebasic and clinical implications of ABC transporters,
Pediatric Glioblastomas Are Molecularly Unique
www.jco.org 1207Downloaded from jco.ascopubs.org on April 26, 2016. For personal use only. No other uses without permission.
Copyright © 2007 American Society of Clinical Oncology. All rights reserved.

Y-box-binding protein-1 (YB-1) and angiogenesis-related factors in human malignancies. Cancer Sci94:9-14, 2003
44. Berquin IM, Pang B, Dziubinski ML, et al:Y-box-binding protein 1 confers EGF independenceto human mammary epithelial cells. Oncogene 24:3177-3186, 2005
45. Homer C, Knight DA, Hananeia L, et al: Y-boxfactor YB1 controls p53 apoptotic function. Onco-gene 24:8314-8325, 2005
46. Bredel M, Pollack IF, Freund JM, et al: Inhibi-tion of Ras and related G-proteins as a therapeuticstrategy for blocking malignant glioma growth. Neu-rosurgery 43:124-132, 1998
47. Parsa AT, Holland EC: Cooperative transla-tional control of gene expression by Ras and Akt incancer. Trends Mol Med 10:607-613, 2004
48. Kreisberg JI, Malik SN, Prihoda TJ, et al:Phosphorylation of Akt (Ser473) is an excellent pre-dictor of poor clinical outcome in prostate cancer.Cancer Res 64:5232-5236, 2004
■ ■ ■
Acknowledgment
We thank Rima Rozen, PhD, and Philippe Gros, PhD, for critical reading of the manuscript.
Appendix
The Appendix is included in the full-text version of this article, available online at www.jco.org. It is not included in the PDF version(via Adobe® Reader®).
GLOSSARY
aGBM (adult glioblastoma): A highly malignant astrocy-toma that occurs in adults and belongs to the family of highgrade gliomas.
aHGG (adult high-grade gliomas): aHGG are highlyvascular tumors that often invade other tissues. They have exten-sive areas of necrosis and hypoxia and tumor growth often causesa breakdown of the blood-brain barrier.
Akt pathway: A signal transduction pathway involving the sig-naling molecules phosphatidylinositol-3 kinase (PI3K) and Akt,where PI3K generates phosphorylated inositides at the cell mem-brane which are required for the recruitment and activation of Akt, atransforming serine-threonine kinase involved in cell survival.
GFAP (glial fibrillary acidic protein): GFAP is a mem-ber of the intermediate filament family that provides support andstrength to cells. Several molecules of GFAP protein bind together toform the main intermediate filament found in astrocytes.
pGBM (pediatric glioblastoma): A highly malignant astrocy-toma that occurs in children and young adolescents. In contrast toaGBM, which is a common type of brain tumor in adulthood, pGM is arare type of brain tumor in children.
Ras pathway: Signal transduction pathways involving the signalingmolecules Ras, Raf, and ERK, where activated Ras activates Raf, whichthen activates MEK (MAPK/ERK kinase) and thereby ERK. Generally,the involvement of these molecules results in enhanced cell survivaland/or proliferation. Activating mutations of Raf have been discov-ered in some human tumors such as melanoma and non–small-celllung cancer.
Vimentin: Vimentin is a flexible intermediate filament in the cyto-plasm that maintains cell integrity and structure.
Y-Box-Protein-1: The Y-Box-Protein-1 has many biological func-tions, including transcriptional and translational control, DNA repair,drug resistance, and cell proliferation.
Faury et al
1208 JOURNAL OF CLINICAL ONCOLOGY
Downloaded from jco.ascopubs.org on April 26, 2016. For personal use only. No other uses without permission.Copyright © 2007 American Society of Clinical Oncology. All rights reserved.
Copyright © 2022 FDOKUMEN


![Electronic spectra of Yb[sup 2+]-doped SrCl[sub 2]](https://static.fdokumen.com/doc/165x107/633592f8b5f91cb18a0b76fc/electronic-spectra-of-ybsup-2-doped-srclsub-2.jpg)