yb-2015.pdf - Agriculture Today
201
-
Upload
khangminh22 -
Category
Documents
-
view
0 -
download
0
Transcript of yb-2015.pdf - Agriculture Today

1www.agriculturetoday.in Agriculture Year Book 2015
Dear Readers,
It is again that time of the year, while keeping with our tradition; we present to you the latest edition of the Agriculture Today Year Book. The eighth edition of the year book is the result of the unfaltering support, constant encouragement and faith reposed on us by our loyal readers. Our readers have been the reason for the unopposed presence of the magazine, Agriculture Today, in the Indian scene for more than a decade. The magazine, over the years, has become the platform to discuss and debate topics of agricultural relevance.
Agriculture Today Year Book of 2015 features articles penned by the some of the most eminent personalities in Indian agriculture. These ar-ticles represent different facets of Indian agriculture, introduce many new concepts and initiatives and also have identified several areas of concern in Indian farming. The year book 2015, has tried to strike a right balance with combination of data, analysis and information.
I would like to thank all the eminent writers for their valuable contribu-tions for the Year Book 2015. Their timely and appropriate contributions were influential in making this year book a reality. I trust that the Year Book will serve as a useful guide and reference to all those related to the agriculture sector, including government officials, policy makers, scientists, agribusiness companies, NGOs, institutions, agri researchers, professionals, planners, students etc. We have lent our best of efforts to create this year book. Nonetheless, there is further scope for improve-ment which we promise to refine in the next edition of 2016. I request all our esteemed readers to impart their valuable support by sending in comments and suggestions.
I take this opportunity to express our gratitude to Prof. MS Swaminathan, Chairman and all the members of the organizing committee of the Agri-culture Leadership Summit 2015 for their valuable guidance. I am also thankful to my colleagues specifically Ms. Anjana Nair, Pinaki Ranjan Dey and Abdul Rehman for their untiring efforts in compiling and editing the Agriculture Year Book 2015.
Dr. MJ Khan
Editorial Note

2 Agriculture Year Book 2015
www.agriculturetoday.in
Chief Editor’s Corner 1
Agriculture- International Scenario1. Global Agricultural Production 82. Agriculture Made in Austria: Sustainability and Quality as a
Recipe for Success 14 – Austrian Federal Ministry of Agriculture, Forestry, Environment and Water
Management3. Dutch Partnership with Indian Agriculture 18 – Mr. Alphonsus Stoelinga4. Brazil in Bio-economy 20 – Maurício Antônio Lopes5. New Zealand’s journey to becoming a world-class, global
food producer 22 – HE Grahame Morton
Food Security - Issues and Strategies1. Achieving the Zero Hunger Target 28 – Prof. M S Swaminathan2. Microbial Technologies for Sustainable Agriculture
Development and Food Security 34 – Dr. K. RAMASAMY3. Quality Seeds : Harbinger for Second Green Revolution in
India 40 – Dr. S. Rajendra Prasad and Dr. Dinesh K. Agarwal
Climate Change and Sustainable Agriculture1. Climate Change and Agriculture 482. Organic Farming 543. ICT-Based Pest Management for Sustainable Agriculture 58 – Dr. N. Singh Scientist, Dr. A. Birah, Sr. Scientist and Dr. C. Chattopadhyay4. Food Intervention Programmes And Policies For Food
Security In India 64 – Anjani Kumar and P K Joshi5. Horticulture for Food and Nutritional Sustenance and
Livelihood Security 68 – S.K. Malhotra6. Diversification – The Need for Agricultural Sustainability in
Punjab 74 – Dr. B.S. Dhillon
Crops in Focus1. Overview 802. Horticulture Crop Production in India 853. Managing Risk in Wheat Production Against Weather
Anomalies 90 – Dr. Sendhil R, Dr. Karnam Venkatesh and Dr. Indu Sharma4. Indian Cumin Cultivation – Prospects and Challenges 94 – R K Solanki, Y K Sharma ,P N Dubey and Dr. Balraj Singh, Director
5. Towards Achieving Self Sufficiency in Pulses 98 – Dr. Aditya Pratap and Dr. N.P. Singh6. Sectoral strengths, issues and coping up strategies of
coconut, arecanut and cocoa in India 104 – Dr. V. Krishnakumar, Dr.S.Jayasekhar and Dr.P. Chowdappa
Animal Husbandry, Dairy and Fisheries1. Overview 1122. Indian Livestock: An Asset under Smallholder Production
System 116 – Dr. R S Gandhi
Agriculture and Indian Economy1. Overview 1242. NIFTEM’s Model of Rural Development 128 – Dr. Ajit Kumar3. Strengthening Family Farms - Policy Changes 134 – Prof. S.K. Patil4. Five Events that Transformed Rural India 140 – Pawan Malik5. Rural development through Agricultural co-operatives 146 – Sudhanshu JANGIR and Vikram Yogi 6. Futuristic Frontline Extension for Transforming Indian
Agriculture 150 – Dr. K. Singh, Dr. P Adhiguru and Dr. R R Burman7. Status of Soil Health in India and its Management 156 – Ashok K Patra and Sanjay Srivastava8. Extension for Agriculture and Farmers’ Welfare 160 – Rita Sharma
Rural Credit1. Overview 1642. ANDHRA BANK - Triumphant on Strategies 170 – Sri D Durga Prasad
Industry1. Agri Inputs and Agri Industry - Overview 1742. Micro Irrigation - Overview 1783. Automation in Plant Nurseries for progressive Horticulture
and Floriculture 182 – Amit Shukla4. Acclerated Transfer of Agriculture Technology – Some
Dhanuka’s Initiatives 184 – R. G. Agarwal
Latest and Major Agriculture R&D Breakthroughs in The World 189Status of Commercial GM Crops- World and India 193Different Strokes 198
CONTENTSAGRICULTURE YEAR BOOK 2015
3www.agriculturetoday.in Agriculture Year Book 2015


Agriculture - internAtionAl
ScenArio

8 Agriculture Year Book 2015
www.agriculturetoday.in
According to latest re-port from the Food and Agriculture Or-ganisation, released on 9th July, 2015, the
forecast for global cereal production in 2015-16 is 2526.5 million tonnes. This is a marginal 1% lower than the level of estimated cereal production in 2014-15. As shown in Fig 1, from 2011-12 to 2015-16 (forecast figures), the global cereal production has in-creased by 7.5%, from 2349.6 million tonnes in 2011-12 to 2526.5 million tonnes in 2014-15. During the same period, total utilisation of cereals in-creased by 9.5%, from 2313.9 million tonnes in 2011-12 to 2534.2. The total supply of cereals globally in 2011-12 and the projected figures of 2015 in-creased by almost 10%, from 2887.3 million tonnes in 2011-12 to projected 3171.5 million tonnes in 2015-16. The total estimated production of global cereals in 2014-15 increased signifi-cantly because of exceptionally high levels achieved by the EU and the Russian Federation. The projected increase in utilisation of cereals from 2014-15 to 2015-16 is based on the expected increased use of maize as feed, especially in Brazil, China and United States.
Global Agricultural Production
Global Wheat ProductionThe global area under wheat cultiva-tion from 2010 to 2014 witnessed in-ter-year fluctuations and on an overall basis, increased marginally by 2.2%, from 217.9 million hectares in 2010 to 222.9 million hectares in 2014. As seen in Fig 2, amongst the ma-jor wheat producing countries in the world, the highest increase in area un-der wheat cultivation was witnessed in Russia. It increased by 13.3% from 21.8 million ha in 2010 to 24.7 mil-lion ha in 2014. EU and Australia witnessed a marginal increase in area under wheat cultivation between 2010 and 2014, by 2.3% and 2.2% respec-
tively. Wheat was cultivated in the EU in 2010 over an area of 25.9 million ha which increased to 26.5 million ha in 2014 while in Australia, it increased from 13.5 million ha in 2010 to 13.8 million ha in 2014. All the other ma-jor wheat producing countries in the world experienced marginal decrease in area between 2010 and 2014.
Globally, yield of wheat increased by 6.6% during the period between 2010 and 2014. In 2010, the global average yield of wheat was 3 tonnes per hectare (t/ha) which increased to 3.2 t/ha in 2014. The highest increase in yield during this period was wit-nessed by Kazakhstan, where the

9www.agriculturetoday.in Agriculture Year Book 2015
yield increased by a significant 43%, from 0.7 t/ha in 2010 to 1 t/ha in 2014. Consequently, Kazakhstan has also the lowest yield of wheat amongst all the major wheat growing countries in the world, as seen in Fig 3. Russia and China witnessed an increase in wheat yield by 26.3% and 12.7% respective-ly between 2010 and 2014. Australia as a country witnessed a significant decline in wheat yield in the recent years. In 2010, the yield of wheat in Australia was 2 t/ha which decreased by 15% to 1.7 t/ha in 2014.
World production of wheat in 2014 was 717.6 million tonnes in 2014. This is an increase of about 10% when compared to the production figures of 2010 at 652.9 million tonnes (Fig 4). Wheat production in Russia increased phenomenally by 44.5% from 41.5 million tonnes in 2010 to 60 million tonnes in 2014. Production in the EU increased by 12.6% from 136.8 mil-lion tonnes in 2010 to 143.1 million tonnes in 2014. Wheat production in China in 2014 was 125.3 million tonnes, which is an increase by 8.7% when compared to the production fig-ure of 2010 (115.2 million tonnes). European Union has emerged as the largest producer of wheat globally fol-lowed by China and Russia in 2014.
Global Maize ProductionThe global area under maize produc-tion in 2014 was 173.4 million hect-ares which is an increase by 6% when
hectares in 2010. Area under maize in the EU region witnessed an increase of 20% between 2010 and 2014 (8 million hectare in 2010 and 9.6 mil-lion hectares in 2014). In 2014, area under maize cultivation in Brazil and the USA was 15 million ha and 33.7 million ha respectively (Fig 5).
Globally, the average yield of
compared to 163.6 million hectares in 2010. However, the area under maize cultivation decreased from 177.1 mil-lion hectares in 2013 to what it was in 2014. Maize area in China has in-creased consistently over the past few years and in 2014 it was 36.7 million hectares, an increase of about 13% when compared to the 32.5 million
10 Agriculture Year Book 2015
www.agriculturetoday.in
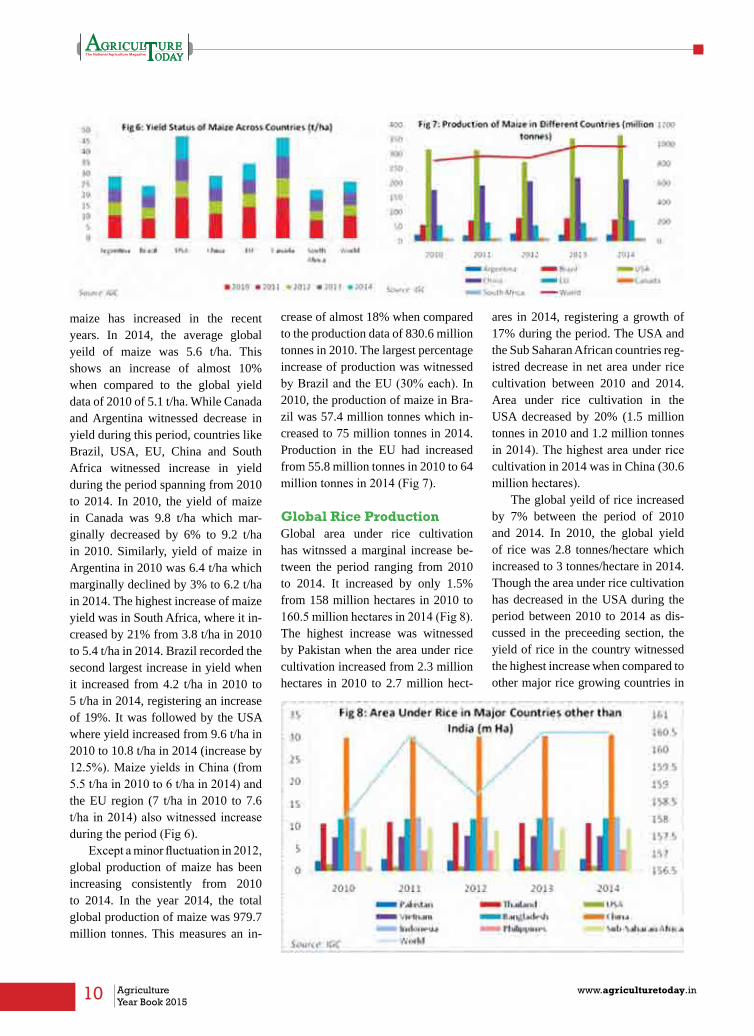
maize has increased in the recent years. In 2014, the average global yeild of maize was 5.6 t/ha. This shows an increase of almost 10% when compared to the global yield data of 2010 of 5.1 t/ha. While Canada and Argentina witnessed decrease in yield during this period, countries like Brazil, USA, EU, China and South Africa witnessed increase in yield during the period spanning from 2010 to 2014. In 2010, the yield of maize in Canada was 9.8 t/ha which mar-ginally decreased by 6% to 9.2 t/ha in 2010. Similarly, yield of maize in Argentina in 2010 was 6.4 t/ha which marginally declined by 3% to 6.2 t/ha in 2014. The highest increase of maize yield was in South Africa, where it in-creased by 21% from 3.8 t/ha in 2010 to 5.4 t/ha in 2014. Brazil recorded the second largest increase in yield when it increased from 4.2 t/ha in 2010 to 5 t/ha in 2014, registering an increase of 19%. It was followed by the USA where yield increased from 9.6 t/ha in 2010 to 10.8 t/ha in 2014 (increase by 12.5%). Maize yields in China (from 5.5 t/ha in 2010 to 6 t/ha in 2014) and the EU region (7 t/ha in 2010 to 7.6 t/ha in 2014) also witnessed increase during the period (Fig 6).
Except a minor fluctuation in 2012, global production of maize has been increasing consistently from 2010 to 2014. In the year 2014, the total global production of maize was 979.7 million tonnes. This measures an in-
crease of almost 18% when compared to the production data of 830.6 million tonnes in 2010. The largest percentage increase of production was witnessed by Brazil and the EU (30% each). In 2010, the production of maize in Bra-zil was 57.4 million tonnes which in-creased to 75 million tonnes in 2014. Production in the EU had increased from 55.8 million tonnes in 2010 to 64 million tonnes in 2014 (Fig 7).
Global Rice ProductionGlobal area under rice cultivation has witnssed a marginal increase be-tween the period ranging from 2010 to 2014. It increased by only 1.5% from 158 million hectares in 2010 to 160.5 million hectares in 2014 (Fig 8). The highest increase was witnessed by Pakistan when the area under rice cultivation increased from 2.3 million hectares in 2010 to 2.7 million hect-
ares in 2014, registering a growth of 17% during the period. The USA and the Sub Saharan African countries reg-istred decrease in net area under rice cultivation between 2010 and 2014. Area under rice cultivation in the USA decreased by 20% (1.5 million tonnes in 2010 and 1.2 million tonnes in 2014). The highest area under rice cultivation in 2014 was in China (30.6 million hectares).
The global yeild of rice increased by 7% between the period of 2010 and 2014. In 2010, the global yield of rice was 2.8 tonnes/hectare which increased to 3 tonnes/hectare in 2014. Though the area under rice cultivation has decreased in the USA during the period between 2010 to 2014 as dis-cussed in the preceeding section, the yield of rice in the country witnessed the highest increase when compared to other major rice growing countries in

11www.agriculturetoday.in Agriculture Year Book 2015
the world. In 2010, the yield of rice in the USA was 5.2 tonnes/hectare which increased by 15.3% to 6 tonnes/hect-are in 2014. USA has also emerged as the country with highest yield in all the years from 2010 to 2014. Bangladesh and Vietnam recorded a steady yield of 2.9 tonnes/hectare and 2.5 tonnes/hectare during most of the years be-tween 2010 and 2014 (Fig 9).
While the area under global rice production increased by just 1.5% in the period between 2010 and 2014, the total global production of rice witnessed an increase of almost 6% during the same period (Fig 10). In 2010, the global rice production was 449.1 million tonnes. This increased to 475.8 million tonnes in 2014. Most of this increase in production was driven by countries like Pakistan, Bangladesh and Philipines. Pakistan
recorded the highest percentage in-crease in rice production globally, increasing by 35.4% from 4.8 million tonnes in 2010 to 6.5 million tonnes in 2014. Philippines was the second largest country in terms of percentage increase in yield (10.5 million tonnes
in 2010 to 12 million tonnes in 2014 with 14.2% net increase) while Ban-gladesh was the third largest country in terms of percentage yield increase (31.7 million tonnes in 2010 to 34.6 million tonnes in 2014 with 9.1% net increase). China has been the highest rice producing country globally during all the years between 2010 and 2014, and in 2014, the total rice production in China was 143.5 million tonnes.
Global Soyabean ProductionArea under global soyabean cultivation has been increasing consistently in the past years. In 2010, the total area under soyabean across the world was 105.1 million hectares which increased to 120.9 million hectares in 2014, registering an increase by 15% during this period. The increase in area under soyabean was mostly driven

12 Agriculture Year Book 2015
www.agriculturetoday.in
by countries like Canada and Barzil. In 2010, the area under soyabean in Canada and Brazil were respectively 1.5 million hectares and 24.2 million hectares which increased to 2.2 and 31.5 million hectares respectively in 2014, registering an increase of 46.6% and 30.1% respectively during the period. Globally, the USA over the years is the largest in terms of area under soyabean and in 2014, the country had 33.8 million hectares of area under the cultivation of this crop (Fig 11).
The average global yield of soya-bean is more or less consistent at 2.5 t/ha during the period from 2010 to 2014, except for the minor fluctua-tions in 2011 and 2012 (Fig 12). The specific country data of the major soy-abean growing countries of the world also reveals a similar trend with coun-tries like China and Brazil (from 2012 to 2014) maintaining an yield level of 1.8 t/ha and 2.9 t/ha respectively. The highest increase in yield was experi-enced by the USA when it increased by 10.3% from 2.9 t/ha in 2010 to 3.2 t/ha in 2014. Yield figures compared between 2010 and 2014 for Brazil and Canada indicates a decrease of 6.4% and 6.8% respectively. In 2010, the yield of soyabean in Brazil was 3.1 t/ha which decreased to 2.9 t/ha in 2014 and in Canada, the yield de-creased from 2.9 t/ha (2010) to 2.7 t/ha (2014).
While the global yeild of soyabean
remained relatively constant at 2.5 t/ha, the total soyabean production globally posted an increase of 15% between the period ranging from 2010 to 2014, mostly owing to growth in area un-der the crop globally. The total global yield of soyabean in 2014 was calcu-lated at 307.4 million tonnes, increas-ing from 266.5 million tonnes in 2010. Though the yield in Canada and Bra-zil decreased during 2010 and 2014, owing to the substantial icnrease in area under soyabean cultivation, these countries increased their net produc-tion figures from 4.3 million tonnes and 75.3 million tonnes respectively in 2010 to 6 million tonnes and 91 million tonnes respectively in 2014. This marked an increase of 39.5% and 20.8% respectively for Canada and Brazil during the said period.
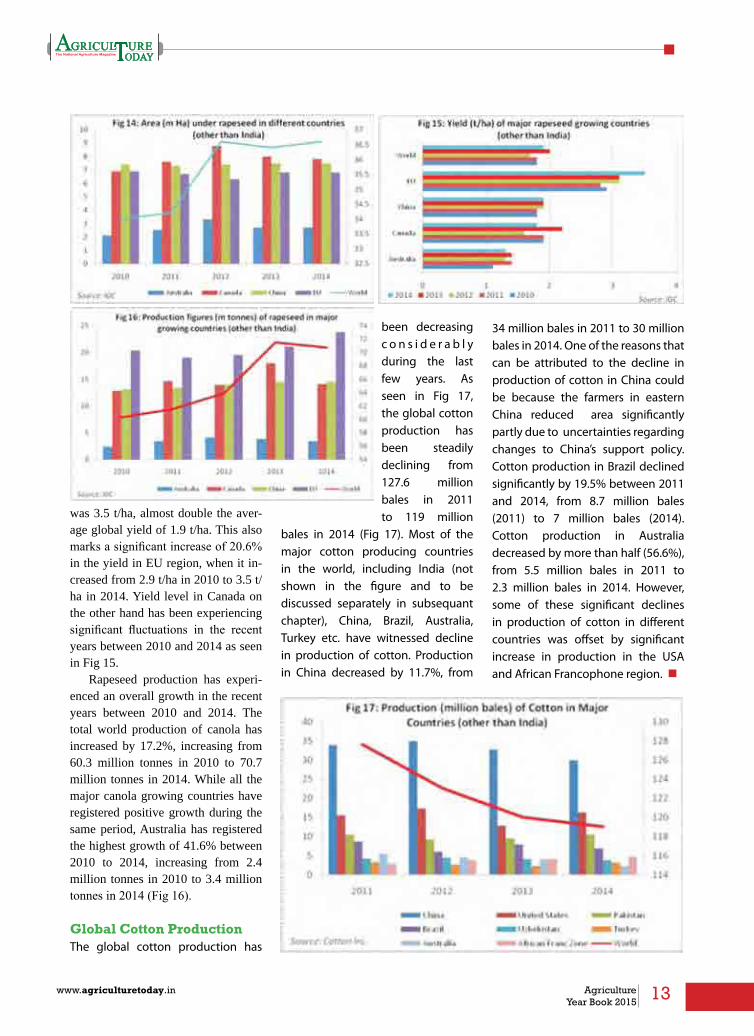
Global Rapeseed ProductionRapeseed or Canola is an important oilseed crop grown across the world in various countries. The total global area under rapeseed cultivation in 2014 was 36.6 million hectares. This represents an increase of 7.6% when compared to the total area under the crop of 34 million hectares in 2010. Amongst the major rapeseed growing countries, Canada had the highest area under cultivation with 7.8 million hectares in 2014. It is important to note that it reached its peak at 8.8 million hectares in 2012 from 6.9 million hectares in
2010. However, the area declined in the subsequent years till 2014. This could be because of the intention of Canadian farmers to grow more wheat, oats and barley during the years in concern. China was closely following Canada in terms of total area under rapeseed and in 2014, the total area under the crop was 7.5 million hectares. European Union cultivated rapeseed in a total area of 6.8 million hectares in 2014. Australia as a country experienced the largest increase in rapeseed cultivation and between 2010 and 2014, the total area under its cultivation increased by 28.5% from 2.1 million hectares in 2010 to 2.7 million hectares in 2014.
European Union has been expe-riencing higher rapeseed yield in the recent years and has been consider-ably higher than the world average yield. In 2014, rapeseed yield in EU
13www.agriculturetoday.in Agriculture Year Book 2015
was 3.5 t/ha, almost double the aver-age global yield of 1.9 t/ha. This also marks a significant increase of 20.6% in the yield in EU region, when it in-creased from 2.9 t/ha in 2010 to 3.5 t/ha in 2014. Yield level in Canada on the other hand has been experiencing significant fluctuations in the recent years between 2010 and 2014 as seen in Fig 15.
Rapeseed production has experi-enced an overall growth in the recent years between 2010 and 2014. The total world production of canola has increased by 17.2%, increasing from 60.3 million tonnes in 2010 to 70.7 million tonnes in 2014. While all the major canola growing countries have registered positive growth during the same period, Australia has registered the highest growth of 41.6% between 2010 to 2014, increasing from 2.4 million tonnes in 2010 to 3.4 million tonnes in 2014 (Fig 16).
Global Cotton ProductionThe global cotton production has
been decreasing c o n s i d e r a b l y during the last few years. As seen in Fig 17, the global cotton production has been steadily declining from 127.6 million bales in 2011 to 119 million
bales in 2014 (Fig 17). Most of the major cotton producing countries in the world, including India (not shown in the figure and to be discussed separately in subsequant chapter), China, Brazil, Australia, Turkey etc. have witnessed decline in production of cotton. Production in China decreased by 11.7%, from
34 million bales in 2011 to 30 million bales in 2014. One of the reasons that can be attributed to the decline in production of cotton in China could be because the farmers in eastern China reduced area significantly partly due to uncertainties regarding changes to China’s support policy. Cotton production in Brazil declined significantly by 19.5% between 2011 and 2014, from 8.7 million bales (2011) to 7 million bales (2014). Cotton production in Australia decreased by more than half (56.6%), from 5.5 million bales in 2011 to 2.3 million bales in 2014. However, some of these significant declines in production of cotton in different countries was offset by significant increase in production in the USA and African Francophone region. n

14 Agriculture Year Book 2015
www.agriculturetoday.in
Agriculture Made in Austria: Sustainability and Quality as a Recipe for Success
Austria’s rural areas simultaneously act as spaces for living, economic activity, work, nature, culture and relaxation. They are the key to success in tourism and in
commerce, but also in global challenges such as climate change or food security. In 2013, Andrä Rupprechter took up the office of Federal Minister for Agriculture and Forestry, Environment and Water Management (BMLFUW). He committed himself to modern and sustainable area-wide rural agriculture. The goal is to further develop and strengthen rural areas through intelligent, sustainable and balanced growth.
Overcoming ChallengesThe unstable situation of the global market and adverse weather conditions currently present difficult challenges to Austrian agriculture.
The tense situation in important markets recently caused a dip in prices for grain, oil and root crops as well as for apples. Due to wet weather conditions, the grape harvest was very low in yield. However, the Common Agricultural Policy of the EU provides the necessary instruments to counteract fluctuations of the market or shortfalls of exports. With the new direct payment system and the Rural Development Program, which is already underway and runs until 2020, a stable framework has been secured.
According to the Agricultural Structure Survey, 166,317 agricultural and silvicultural businesses existed in Austria in 2013. Thus, the
number of businesses decreased by four per cent compared to the last census in 2010. The decline in business is a continuing trend, but has slowed down somewhat. Agricultural and silvicultural businesses cultivated a total of 2,728,558 hectares of agriculturally utilized land in 2013. Of this, 1,297,110 hectares were permanent pastures and 1,364,057 hectares were farmland. Vineyards accounted for 45,320 hectares and orchards for 15,197 hectares. The total area used for forestry amounted to 3,427,510 hectares.
Predominantly Family BusinessesAgricultural and silvicultural businesses are predominantly family businesses. They amount to nearly 92 percent of all businesses. Austria’s agricultural sector is generally small-scale and rural in character. Nevertheless, the trend to ever bigger businesses continues: While an average total area of 17.8 hectares was cultivated by a business in 1951, this figure was already at 44.2 hectares in 2013. The development in utilized agricultural area is similar (farmland, kitchen gardens, permanent crops, permanent pastures); here, an increase from 9.4 hectares to 18.8 hectares was recorded.
This trend is also visible in the area of animal husbandry: While in 1995 an agricultural and silvicultural business kept an average of 20 heads of cattle, the herd size has since then continually increased to 29 heads of cattle per business. The porcine sector demonstrates an even more fast-paced development; here, the average stock has almost tripled since 1995, rising from 35 to 103 animals. In sheep and goat farming there has also
Austrian Federal Ministry of
Agriculture, Forestry,
Environment and Water
Management
15www.agriculturetoday.in Agriculture Year Book 2015
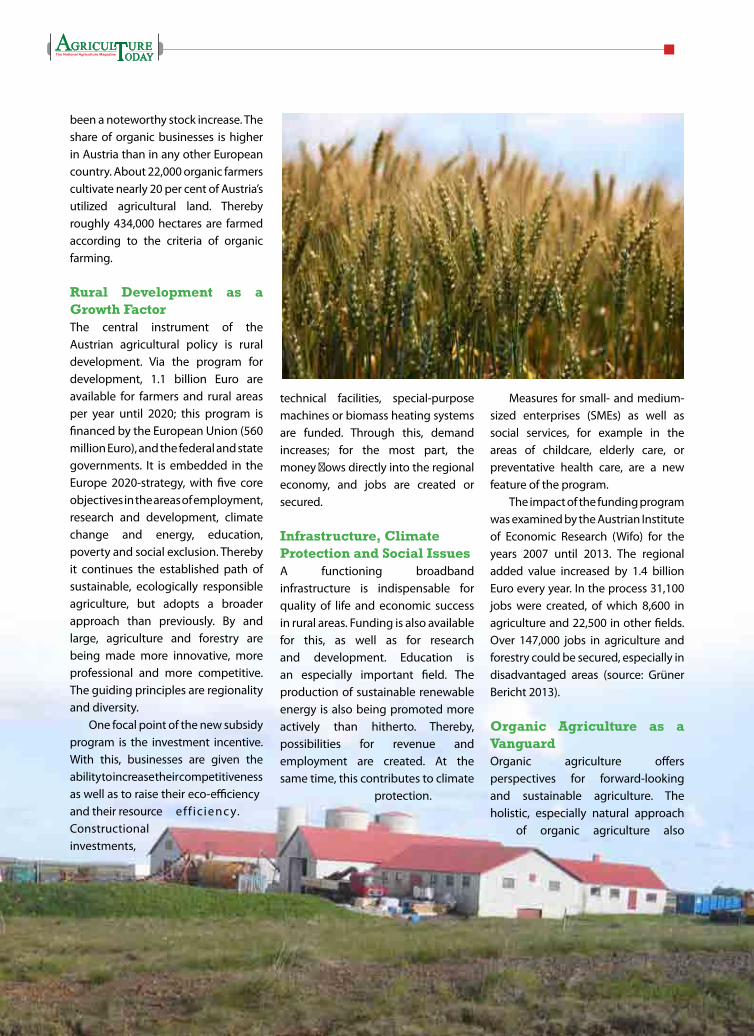
been a noteworthy stock increase. The share of organic businesses is higher in Austria than in any other European country. About 22,000 organic farmers cultivate nearly 20 per cent of Austria’s utilized agricultural land. Thereby roughly 434,000 hectares are farmed according to the criteria of organic farming.
Rural Development as a Growth FactorThe central instrument of the Austrian agricultural policy is rural development. Via the program for development, 1.1 billion Euro are available for farmers and rural areas per year until 2020; this program is financed by the European Union (560 million Euro), and the federal and state governments. It is embedded in the Europe 2020-strategy, with five core objectives in the areas of employment, research and development, climate change and energy, education, poverty and social exclusion. Thereby it continues the established path of sustainable, ecologically responsible agriculture, but adopts a broader approach than previously. By and large, agriculture and forestry are being made more innovative, more professional and more competitive. The guiding principles are regionality and diversity.
One focal point of the new subsidy program is the investment incentive. With this, businesses are given the ability to increase their competitiveness as well as to raise their eco-efficiency and their resource eff ic ienc y. Constructional investments,
technical facilities, special-purpose machines or biomass heating systems are funded. Through this, demand increases; for the most part, the money flows directly into the regional economy, and jobs are created or secured.
Infrastructure, Climate Protection and Social Issues A functioning broadband infrastructure is indispensable for quality of life and economic success in rural areas. Funding is also available for this, as well as for research and development. Education is an especially important field. The production of sustainable renewable energy is also being promoted more actively than hitherto. Thereby, possibilities for revenue and employment are created. At the same time, this contributes to climate
protection.
Measures for small- and medium-sized enterprises (SMEs) as well as social services, for example in the areas of childcare, elderly care, or preventative health care, are a new feature of the program.
The impact of the funding program was examined by the Austrian Institute of Economic Research (Wifo) for the years 2007 until 2013. The regional added value increased by 1.4 billion Euro every year. In the process 31,100 jobs were created, of which 8,600 in agriculture and 22,500 in other fields. Over 147,000 jobs in agriculture and forestry could be secured, especially in disadvantaged areas (source: Grüner Bericht 2013).
Organic Agriculture as a VanguardOrganic agriculture offers perspectives for forward-looking and sustainable agriculture. The holistic, especially natural approach
of organic agriculture also
16 Agriculture Year Book 2015
www.agriculturetoday.in
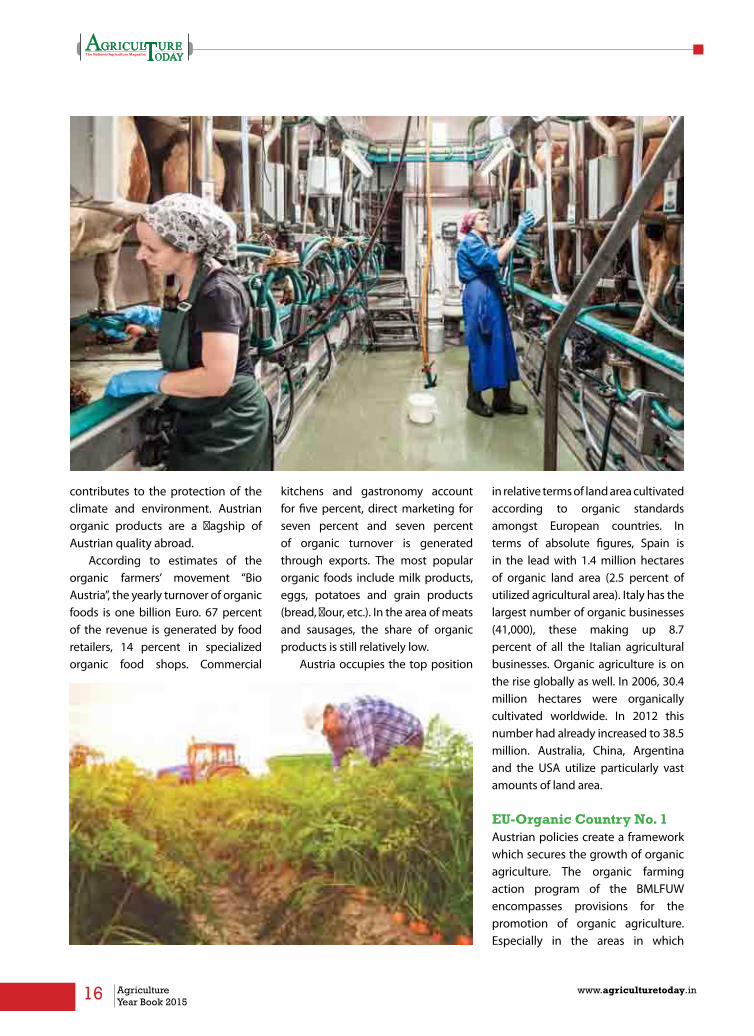
contributes to the protection of the climate and environment. Austrian organic products are a flagship of Austrian quality abroad.
According to estimates of the organic farmers’ movement “Bio Austria”, the yearly turnover of organic foods is one billion Euro. 67 percent of the revenue is generated by food retailers, 14 percent in specialized organic food shops. Commercial
kitchens and gastronomy account for five percent, direct marketing for seven percent and seven percent of organic turnover is generated through exports. The most popular organic foods include milk products, eggs, potatoes and grain products (bread, flour, etc.). In the area of meats and sausages, the share of organic products is still relatively low.
Austria occupies the top position
in relative terms of land area cultivated according to organic standards amongst European countries. In terms of absolute figures, Spain is in the lead with 1.4 million hectares of organic land area (2.5 percent of utilized agricultural area). Italy has the largest number of organic businesses (41,000), these making up 8.7 percent of all the Italian agricultural businesses. Organic agriculture is on the rise globally as well. In 2006, 30.4 million hectares were organically cultivated worldwide. In 2012 this number had already increased to 38.5 million. Australia, China, Argentina and the USA utilize particularly vast amounts of land area.
EU-Organic Country No. 1Austrian policies create a framework which secures the growth of organic agriculture. The organic farming action program of the BMLFUW encompasses provisions for the promotion of organic agriculture. Especially in the areas in which

17www.agriculturetoday.in Agriculture Year Book 2015
organic options are less sought after (meats, sausages), the aim is to further enlarge the market share of organic produce.
A larger necessary work effort and additional costs for the feed and housing of animals in combination with lower yields make the production of organic produce expensive. It is important to compensate for these additional costs and lower revenues through funding. This is primarily implemented via the agri-environment program ÖPUL. However, public relations and marketing, consulting and education, and teaching and research play an important role. This is why it is one of the goals of the organic farm action program, to better communicate to the public the environmental performance of organic agriculture (protection of climate, water, and soil, furtherance of biodiversity, etc.). In agricultural schools, more knowledge should be conveyed on the subject of organic agriculture. Through this, Austria should remain the no. 1 organic country of the EU.
Pact for Fairness on a Broad BaseThe quality of foodstuff is an important component of Austrian identity. To continue to be able to guarantee high standards in future, the BMLFUW has been putting versatile and sustainable measures in place. Recently, a broad-based pact for fairness between farmers, processors and trade was initiated. In this agreement, guidelines for responsible and successful cooperation along the entire grocery chain should be defined. This strong partnership guarantees that family-based farm businesses can operate profitably even in
times of economic instability.
New Concept for Export BegunAs a reaction to export shortfalls due to the international trade embargo of Russia, Minister for Agriculture and Environment Andrä Rupprechter started an “export offensive” for foodstuff, agricultural products and environmental technology. Exports are a guarantor of growth and jobs for Austria. Particularly in the area of environmental technology there was until recently a high growth rate (plus 11 percent per year from 2007 until 2011). There was also a steady growth in the export of agricultural wares, foodstuff and drinks – up to a record value of 9.5 billion Euro in 2013. The weak global economic situation and political crisis have lead to a mitigation of these developments. The areas of agricultural products and foodstuff are particularly affected by the Russian crisis.
With the export initiative the
ministry wants to counteract this. The goal is to position exports more broadly and thus safeguard them against crisis. The BMLFUW is basing its efforts on the cooperation with the Ministries for Economic Affairs, Foreign Affairs and Health as well as with commercial partners. At the start of the initiative, East Asian markets were the main focus. The export initiative also intends for an intensification of efforts in the vicinity of Austria. Germany remains the most important trade partner. Trade with Switzerland, the western Balkans and Turkey is considered to be expandable. The high quality of Austrian products and most notably the high proportion of organic products are the best prerequisites for successes.
With the success of the Rural Development Program until 2020 and the new export initiative an optimal framework could be created to be able to consistently continue the adopted course: sustainability and quality as a recipe for success. n

18 Agriculture Year Book 2015
www.agriculturetoday.in
Dutch partnership with Indian agriculture
The Indian agricultural sector can be seen as a success story. It has performed remarkably well in terms of output growth, despite irregularities in weather and
prices. In terms of agricultural products, India is largely self-sufficient. It is the world’s largest producer of milk,potatoes and fruits and a leading producer of vegetables, spices and plantation crops as well as livestock, fisheries and poultry. Yet, India currently finds itself at a crossroad, as reforms are urgently required to achieve greater efficiency and productivity.
The share of agriculture in India’s overall economy has declined to less than 15% due to the high growth rates of the country’s industrial and services sectors. This indicator, however, does not properly reflect the importance of the agricultural sector, since more than half of India’s population depends on income from agriculture. The majority of India’s poor are found in rural areas. Furthermore, India’s food security largely depends on producing cereal crops, as well as increasing the production of fruits, vegetables and milk to meet the demands of a growing population with rising incomes.
The challenge for the agriculture sector
and policy makers is to produce enough food to feed the population, while at the same time meeting the fast growing consumer demand for a world class variety of food products. They will have to overcome supply barriers and ensure seamless end-to-end linkages to meet an increasing demand.Every year, India sees nearly one-third of its produce go to waste because of deficient cold chain infrastructure and technology. For this reason, India is set on improving skills and infrastructure in the agriculture sector.
India realizes the urgent need for modern technology and know-how to improve the productivity of farmers, in order to face the challenges that lie ahead. By 2028, India is likely to have surpassed China as the world’s most populous nation, with a population of around 1.45 billion putting huge pressure on the agriculture sector.
The agricultural sector is also a key pillar of the Dutch economy and a central point of international cooperation. The Netherlands is the world’s second largest exporter of agricultural and food products and its productivity five times higher than the European average. Close cooperation between knowledge institutions,
H.E. Mr. Alphonsus StoelingaAmbassador,
Embassy of the Kingdom of the Netherlands
19www.agriculturetoday.in Agriculture Year Book 2015
agricultural producers and government is the basis of the success of the Dutch agricultural sector.
During the Dutch economic mission to India in June, our minister for agriculture, Ms. Sharon Dijksma, met with the Indian minister of agriculture Mr. Radha Mohan Singh to discuss ongoing cooperation and opportunities to further strengthen the trade relationship between The Netherlands and India. Both ministers agreed to help each other on various aspects of trade matters, such as improved market access and technical cooperation in the field of agriculture. In the coming years, Dutch agricultural experts will cooperate intensively with their Indian counterparts. To encourage both private and PPP collaboration, the Dutch government has initiated the establishment of agricultural consortiums. In these consortiums, companies represent various areas of agriculture sector, such as horticulture, potato,dairy, cold chain, animal husbandry, food processing and so on.The goal is to integrate Dutch knowledge and expertise locally with available resources in India.
As part of the Indo-Dutch action plan
it was agreed between the Government of India and government of Netherlands to establish a total of 10 Indo-Dutch Centres of Excellence (CoE’s) in different states. In the Centres of Excellence, training is imparted and production methods and techniques are demonstrated by companies. Thus, Dutch companies can help in increasing food production in India by improving production methods, enhancing logistics and food safety. The 10 approved CoE’s focus on horticulture, dairy, potato and meat chains. Dutch technology and know-how will be adapted to the Indian circumstances. The first centers will be established in Maharashtra, Karnataka, Kerala and Punjab as a pilot project. Gradually, more Centres of Excellence will be opened throughout India.
All in all, we strongly believe that the Indian agriculture sector has an immense growth potential, but a holistic approach is required to increase productivity by improving knowledge, skills and technology. Responsibility lies with the Indian agricultural sector itself, but the Netherlands is fully committed to support India in reaching these goals. n

20 Agriculture Year Book 2015
www.agriculturetoday.in
Brazil in Bio-economy
Sustainability is now a permanent item on society’s agenda. A significant example is in how “corporate sustainability” has gained importance in recent years. Initially a
vague concept, it has now become imperative for the success of companies that increasingly need to deliver value, and not just goods, to society. Sustainability, though intangible, with no physical existence, is now an essential value, one which becomes an asset and a competitive advantage in the business world.
“Corporate sustainability” requires business based on good governance practices and social and environmental benefits, with influence in economic gains, competitiveness and success of organizations. The number of companies issuing sustainability reports increased from less than 30 in the early 1990s to more than 7,000 in 2014. In operating this way, companies increase their
ability to compete in increasingly demanding and challenging markets. Additionally, they also extend their own durability, due to the strengthening of their brand, reputation and credibility.
Interest in sustainability is strengthened to the extent that society realizes the limits of a development model dependent on non-renewable resources, in a context of gradual change in the aspirations of society, in the search for energy security and in new production possibilities. As the population grows in number and consumption capacity, so does the desire for the economy to use more bio-based resources, recyclable and renewable, and, thus, more sustainable - this is the basis of bio-economy.
The sophisticated technical foundations of modern biotechnology has already enabled the creation of a vast range of new products
Maurício Antônio Lopes
President of EMBRAPA
21www.agriculturetoday.in Agriculture Year Book 2015
and processes, such as renewable energy, functional and bio-fortified foods, biopolymers, new materials, pharmaceuticals, and cosmetics. This gives Brazil the opportunity to participate meaningfully in this challenge, ensuring competitive space for innovative products and bio-based processes in vital sectors such as agriculture and health, as well as the chemical, materials, and energy industries.
Biodiversity is essential for the future of bio-industry, and Brazil has the largest biological diversity on the planet, with many assets of great commercial and economic interest. Through bio-economy, real opportunities emerge for the sustainable use of such biodiversity, which involves challenges in various fields – biological, economic, political, and cultural – all necessary to understand and anticipate plausible scenarios for the development of this new economic initiative.
A key step in building a national strategy for the integration of bio-economy was the entry into effect of Act No. 13123, of May 20, 2015, in Brazil, which streamlines and regulates access to the genetic heritage of the country and to associated traditional
knowledge for research purposes and technological development. The Act also determines the sharing of benefits with the holders of these resources, be it from economic exploitation or the development of reproductive material originated from such access, be they plants, animals or microorganisms.
Other steps must still be taken, such as the definition of a strategic agenda aiming at priority areas for bio-industrial development with high potential impact, an area in which Brazil may have major comparative advantages. Such an agenda will allow the country to direct investments and guide the expansion of its scientific and technological base, including the modernization of research and innovation infrastructure and incentives to entrepreneurship and public-private interactions.
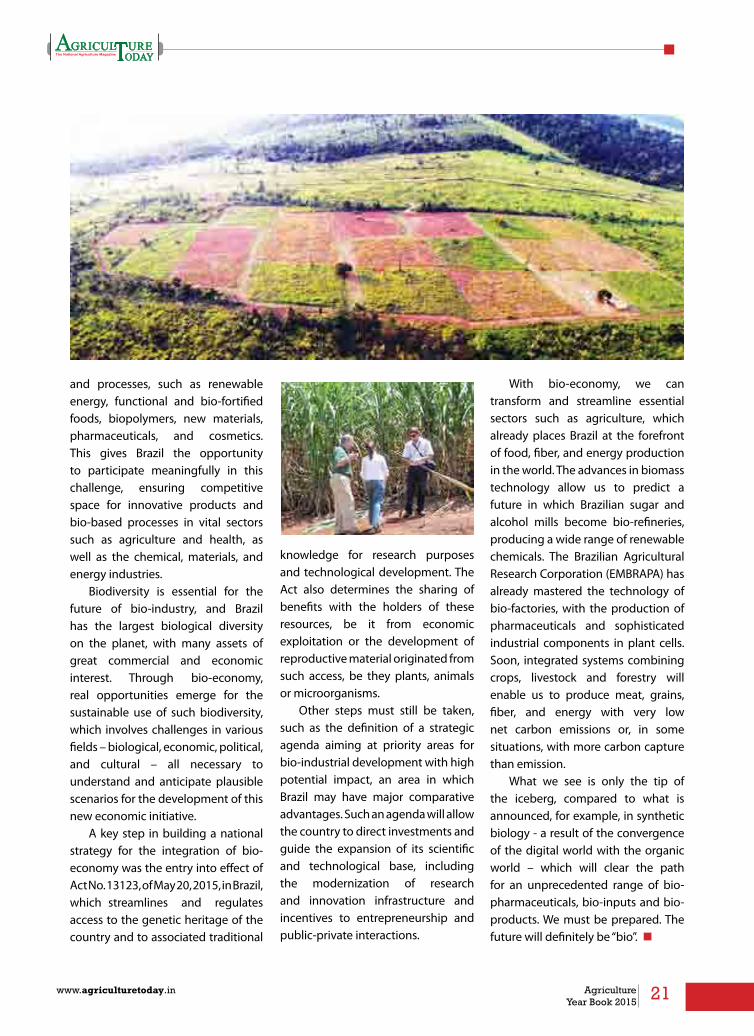
With bio-economy, we can transform and streamline essential sectors such as agriculture, which already places Brazil at the forefront of food, fiber, and energy production in the world. The advances in biomass technology allow us to predict a future in which Brazilian sugar and alcohol mills become bio-refineries, producing a wide range of renewable chemicals. The Brazilian Agricultural Research Corporation (EMBRAPA) has already mastered the technology of bio-factories, with the production of pharmaceuticals and sophisticated industrial components in plant cells. Soon, integrated systems combining crops, livestock and forestry will enable us to produce meat, grains, fiber, and energy with very low net carbon emissions or, in some situations, with more carbon capture than emission.
What we see is only the tip of the iceberg, compared to what is announced, for example, in synthetic biology - a result of the convergence of the digital world with the organic world – which will clear the path for an unprecedented range of bio-pharmaceuticals, bio-inputs and bio-products. We must be prepared. The future will definitely be “bio”. n
22 Agriculture Year Book 2015
www.agriculturetoday.in
New Zealand’s Journey to Becoming a World-Class, Global Food Producer
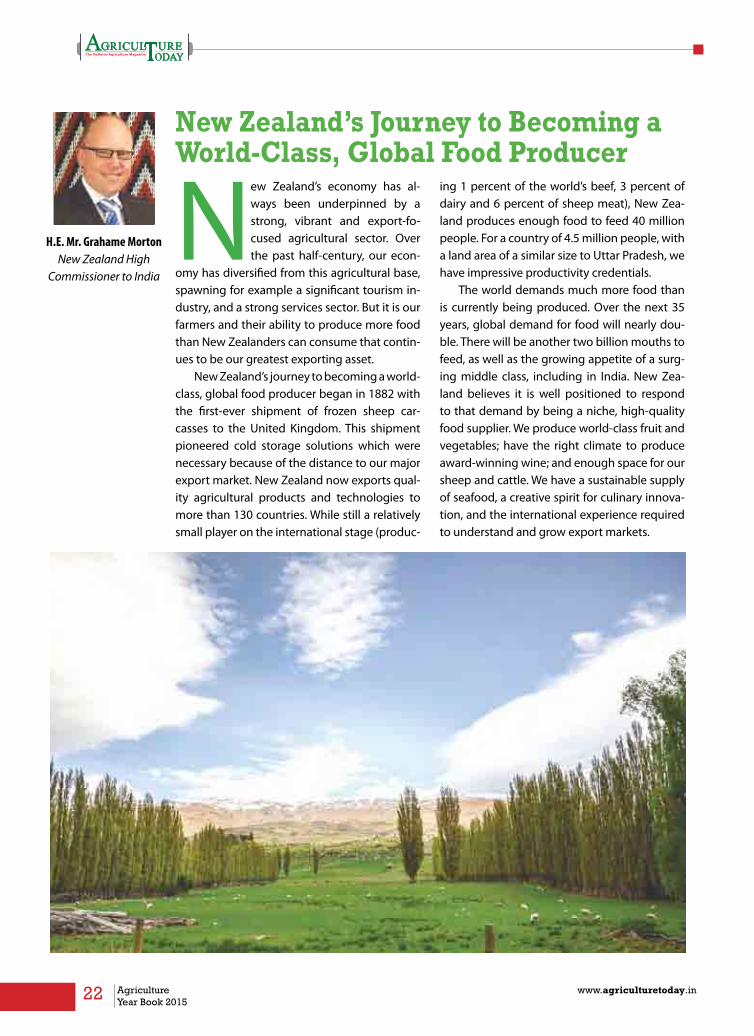
New Zealand’s economy has al-ways been underpinned by a strong, vibrant and export-fo-cused agricultural sector. Over the past half-century, our econ-
omy has diversified from this agricultural base, spawning for example a significant tourism in-dustry, and a strong services sector. But it is our farmers and their ability to produce more food than New Zealanders can consume that contin-ues to be our greatest exporting asset.
New Zealand’s journey to becoming a world-class, global food producer began in 1882 with the first-ever shipment of frozen sheep car-casses to the United Kingdom. This shipment pioneered cold storage solutions which were necessary because of the distance to our major export market. New Zealand now exports qual-ity agricultural products and technologies to more than 130 countries. While still a relatively small player on the international stage (produc-
ing 1 percent of the world’s beef, 3 percent of dairy and 6 percent of sheep meat), New Zea-land produces enough food to feed 40 million people. For a country of 4.5 million people, with a land area of a similar size to Uttar Pradesh, we have impressive productivity credentials.
The world demands much more food than is currently being produced. Over the next 35 years, global demand for food will nearly dou-ble. There will be another two billion mouths to feed, as well as the growing appetite of a surg-ing middle class, including in India. New Zea-land believes it is well positioned to respond to that demand by being a niche, high-quality food supplier. We produce world-class fruit and vegetables; have the right climate to produce award-winning wine; and enough space for our sheep and cattle. We have a sustainable supply of seafood, a creative spirit for culinary innova-tion, and the international experience required to understand and grow export markets.
H.E. Mr. Grahame MortonNew Zealand High
Commissioner to India
23www.agriculturetoday.in Agriculture Year Book 2015
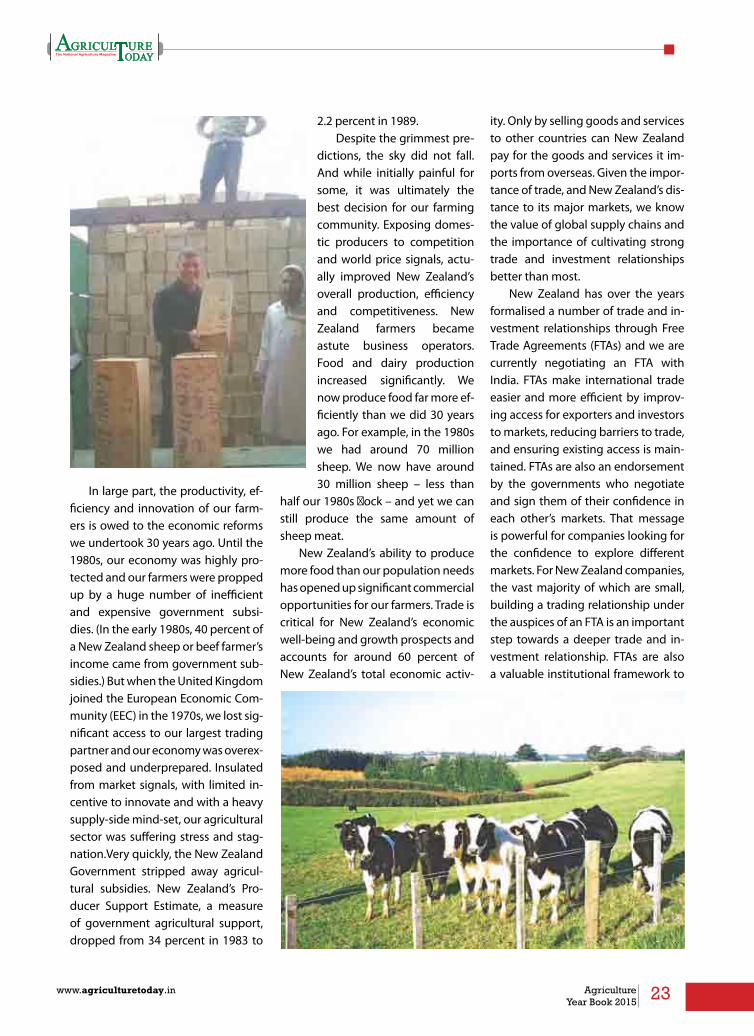
In large part, the productivity, ef-ficiency and innovation of our farm-ers is owed to the economic reforms we undertook 30 years ago. Until the 1980s, our economy was highly pro-tected and our farmers were propped up by a huge number of inefficient and expensive government subsi-dies. (In the early 1980s, 40 percent of a New Zealand sheep or beef farmer’s income came from government sub-sidies.) But when the United Kingdom joined the European Economic Com-munity (EEC) in the 1970s, we lost sig-nificant access to our largest trading partner and our economy was overex-posed and underprepared. Insulated from market signals, with limited in-centive to innovate and with a heavy supply-side mind-set, our agricultural sector was suffering stress and stag-nation.Very quickly, the New Zealand Government stripped away agricul-tural subsidies. New Zealand’s Pro-ducer Support Estimate, a measure of government agricultural support, dropped from 34 percent in 1983 to
2.2 percent in 1989.Despite the grimmest pre-
dictions, the sky did not fall. And while initially painful for some, it was ultimately the best decision for our farming community. Exposing domes-tic producers to competition and world price signals, actu-ally improved New Zealand’s overall production, efficiency and competitiveness. New Zealand farmers became astute business operators. Food and dairy production increased significantly. We now produce food far more ef-ficiently than we did 30 years ago. For example, in the 1980s we had around 70 million sheep. We now have around 30 million sheep – less than
half our 1980s flock – and yet we can still produce the same amount of sheep meat.
New Zealand’s ability to produce more food than our population needs has opened up significant commercial opportunities for our farmers. Trade is critical for New Zealand’s economic well-being and growth prospects and accounts for around 60 percent of New Zealand’s total economic activ-
ity. Only by selling goods and services to other countries can New Zealand pay for the goods and services it im-ports from overseas. Given the impor-tance of trade, and New Zealand’s dis-tance to its major markets, we know the value of global supply chains and the importance of cultivating strong trade and investment relationships better than most.
New Zealand has over the years formalised a number of trade and in-vestment relationships through Free Trade Agreements (FTAs) and we are currently negotiating an FTA with India. FTAs make international trade easier and more efficient by improv-ing access for exporters and investors to markets, reducing barriers to trade, and ensuring existing access is main-tained. FTAs are also an endorsement by the governments who negotiate and sign them of their confidence in each other’s markets. That message is powerful for companies looking for the confidence to explore different markets. For New Zealand companies, the vast majority of which are small, building a trading relationship under the auspices of an FTA is an important step towards a deeper trade and in-vestment relationship. FTAs are also a valuable institutional framework to
24 Agriculture Year Book 2015
www.agriculturetoday.in
underpin greater and broader coop-eration in areas of mutual benefit.
New Zealand has seen this in action with a number of our FTA partners.A significant success story has been our relationship with China after signing our FTA in 2008. China is now New Zealand’s number two trading partner, after Australia. Be-tween 2008 and 2014, two-way trade more than doubled from less than $9 billion to over $18 billion and imports from China have increased almost 40% in the same period. New Zealand’s investment in China is also steadily increasing, with our invest-ment stock in China worth $541 mil-lion. This compares to $36 billion in Australia, still our largest investment partner. But the depth of the relation-ship has matured over the last seven years and China is also now New Zea-land’s largest education market, with more than 30,000 Chinese students coming to study in New Zealand each year. Additionally, Chinese tourists to New Zealand number more than 313,000 each year, making China our
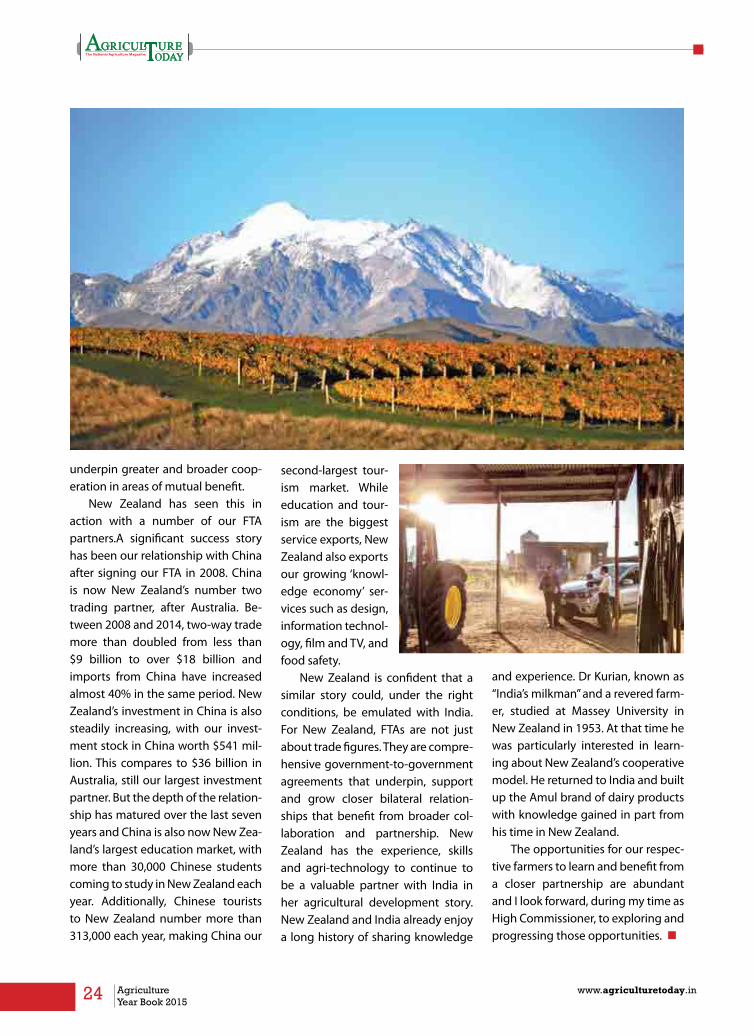
second-largest tour-ism market. While education and tour-ism are the biggest service exports, New Zealand also exports our growing ‘knowl-edge economy’ ser-vices such as design, information technol-ogy, film and TV, and food safety.
New Zealand is confident that a similar story could, under the right conditions, be emulated with India. For New Zealand, FTAs are not just about trade figures. They are compre-hensive government-to-government agreements that underpin, support and grow closer bilateral relation-ships that benefit from broader col-laboration and partnership. New Zealand has the experience, skills and agri-technology to continue to be a valuable partner with India in her agricultural development story. New Zealand and India already enjoy a long history of sharing knowledge
and experience. Dr Kurian, known as “India’s milkman” and a revered farm-er, studied at Massey University in New Zealand in 1953. At that time he was particularly interested in learn-ing about New Zealand’s cooperative model. He returned to India and built up the Amul brand of dairy products with knowledge gained in part from his time in New Zealand.
The opportunities for our respec-tive farmers to learn and benefit from a closer partnership are abundant and I look forward, during my time as High Commissioner, to exploring and progressing those opportunities. n

25www.agriculturetoday.in Agriculture Year Book 2015


Food Security - iSSueS AndStrAtegieS

28 Agriculture Year Book 2015
www.agriculturetoday.in
Achieving the Zero Hunger Target
The Zero Hunger Challenge outlined by the UN Secretary General has the following five components:
o 100% access to adequate food all year round
o Zero stunted children less than 2 years of age
o All food systems are sustainableo 100% increase in smallholder productivity &
incomeo Zero loss or waste of food
Bridging the Gap between scientific know-how and field level do-howI would like to indicate some priorities in the context of our goal for a hunger free India.
(1) Lab to lab: This involves collaboration among all the institutions working on a particular problem like the development of new varieties of wheat, and rice, among others. This kind of beneficial partnership is being achieved through the All India Coordinated Research Projects of the ICAR. Such coordinated projects help to bring together scientists working in agriculture universities, ICAR institutes and often the private sector for undertaking the evaluation of new varieties not only from the point of view of yield, but also from the point of
view of resistance to pests and diseases as well as to drought, floods and other abiotic stresses. The rapid progress which could be made in the early years of the green revolution in the 1960s was only because we could mobilise the power of partnership among scientists working under different agro-climatic and socio-economic conditions. This method of mobilising all the relevant institutions for undertaking joint varietal evaluation and release is one of the important factors responsible for our rapid progress in improving food production.
(2) Lab to land: The lab to land programme took the form of national demonstrations as well as the establishment of farm science centres, known as Krishi Vigyan Kendras (KVKs). There are now several hundred KVKs spread all over the country. These are attached to agriculture universities and research institutions which generate new technologies. The first KVK was established at Puducherry in the seventies. These institutions, which impart location specific knowledge, have become powerful instruments for the knowledge and skill empowerment of small farm families. Special attention is given to women farmers as well as to women in farming. As a result of such farmer-scientist collaboration, farmers converted a small government programme into a mass movement, leading to the green revolution.
(3) Land to lab: It is clear that there is considerable amount of traditional knowledge and wisdom available with farm families. Such knowledge and ecological prudence arise from practical experience. It is said that “one ounce of practice is worth tonnes of theory”. Therefore, we should pay attention to farmers’ own traditional practices and varieties. Fortunately, the Protection of Plant Variety and Farmers’ Rights Authority (PPVFRA) has instituted genome saviour awards for recognising and rewarding the invaluable contributions of rural and tribal people to genetic resources conservation and enhancement. A good database is also being maintained on traditional knowledge and
PRoF. M.S. SWAMInATHAn
29www.agriculturetoday.in Agriculture Year Book 2015
technologies at the Indian Institute of Management, Ahmedabad, under the guidance of professor Anil Gupta.
PPVFRA recognizes the multiple roles of farmers. They are cultivators and guardians of the food security of the country not only because they are the ones who produce the food, but they also play an important intellectual role in agrobiodiversity, plant selection, plant hybridisation and so on. In fact, in China, it was the farmers of Hainan Island who identified the male sterile plants which provided the basis for hybrid rice. However, farmers’ intellectual role in the evolution of new varieties and new technologies is usually unrecognised. This is why in the FAO forum, we asked for farmers’ rights, not only breeders’ rights. The Union for the Protection of New Varieties of Crops (UPOV), located in Geneva, along with the World Intellectual Property Rights Organisation (WIPO), recognises the intellectual property rights of plant breeders. I have been suggesting that they should recognise the rights of both breeders and farmers, but this has not yet happened. I am confident that someday UPOV will become the International Union for the Protection of Breeders and Farmers’ Rights. In India, we have decided to emphasise farmers’ rights alongside breeders’ rights in the formulation of the Protection of Plant Varieties and Farmers’ Rights Act, 2001. This is the only legislation in the world which recognises concurrently farmers’ and breeders’ rights.
(4) Land to land: This involves farmer to farmer learning. The National Commission of Farmers (NCF) had laid particular stress on promoting farmer to farmer learning through farm schools. Fortunately, industrial houses and financial institutions are promoting the establishment of
farm schools under their corporate social responsibility programme. For example, the M S Swaminathan Research Foundation has established seven farm schools with financial support from the Indian Overseas Bank. Farmer to farmer learning is an effective method of technology transfer due to the sound economics which guides farmers’ decision making.
Land is a shrinking resource for agriculture and we have no option except to produce more from diminishing per capita land and water resources. It is in this context that bridging the know-how-do-how gap becomes both urgent and essential. Our Prime Minister has done a great service by emphasising the need for agricultural research institutions and farm universities to intensifying lab to land and other associated scientist-farmer technology sharing programmes.
The target date for achieving the UN Millennium Development Goals ends this year. The first goal is reducing poverty and hunger by half. The latest report indicates that India has halved the incidence of extreme poverty, from 49.4% in 1994 to 24.7% in 2011. However, our country still has
25% of the world’s undernourished people and 33% of the global food insecure. Over one third of the world’s underweight children are also in India. We should therefore review our past strategies for social protection against hunger and introduce community centered approaches for getting out of the hunger and malnutrition trap.
Among the community centric safety nets, the following five action points are important • Trainingonewomanandonemale
member of every Elected Body as Community Hunger Fighters
• Mainstreaming nutrition infarming systems through the Farming System for Nutrition methodology (FSN)
• Promotion of nutrition literacythrough Village Knowledge Centres.
• Attentiontofoodsafetyandcleandrinking water
• Establishmentofnutritiongardenswith biofortified plants which can provide the needed protein and micronutrients. The nutrition garden will help to select plants for FSN.From the experience of MSSRF,
Community Hunger Fighters are very effective in promoting the adoption
30 Agriculture Year Book 2015
www.agriculturetoday.in
of agricultural remedies to the nutritional maladies prevailing in the village and to dealing with hunger in a socially effective manner.
Children for HappinessMarquis de Condorcet, a contemporary of Thomas Malthus wrote that population will stabilise itself if children are born for happiness. Unfortunately, according to a recent survey conducted by UNICEF, only Tamil Nadu, West Bengal, Uttarakhand and Tripura have been able to reduce the proportion of underweight adolescent girls. Some states have made good progress in overcoming child malnourishment while others, are stagnating. This is unfortunate since child malnutrition, particularly during the first thousand days in a child’s life can have several adverse consequences in later life including impaired cognitive abilities. I had warned in as early as 1964, that malnutrition of the child both in mother’s womb, as reflected in low birth weights, as well as during the
first two years of the child’s life could lead to intellectual dwarfism. This is neither fair to the child nor good for the nation. Balanced nutrition is essential for the full development of the physical and mental potential of the child.
Overcoming child and malnutrition by introducing a lifecycle approach to nutrition with particular reference to the first thousand days in a child’s life should receive the highest priority. This is mentioned in the National Food Security Act 2013, but needs to be operationalised at the ground level. This can be a very important part of our programme for achieving the zero hunger challenge.
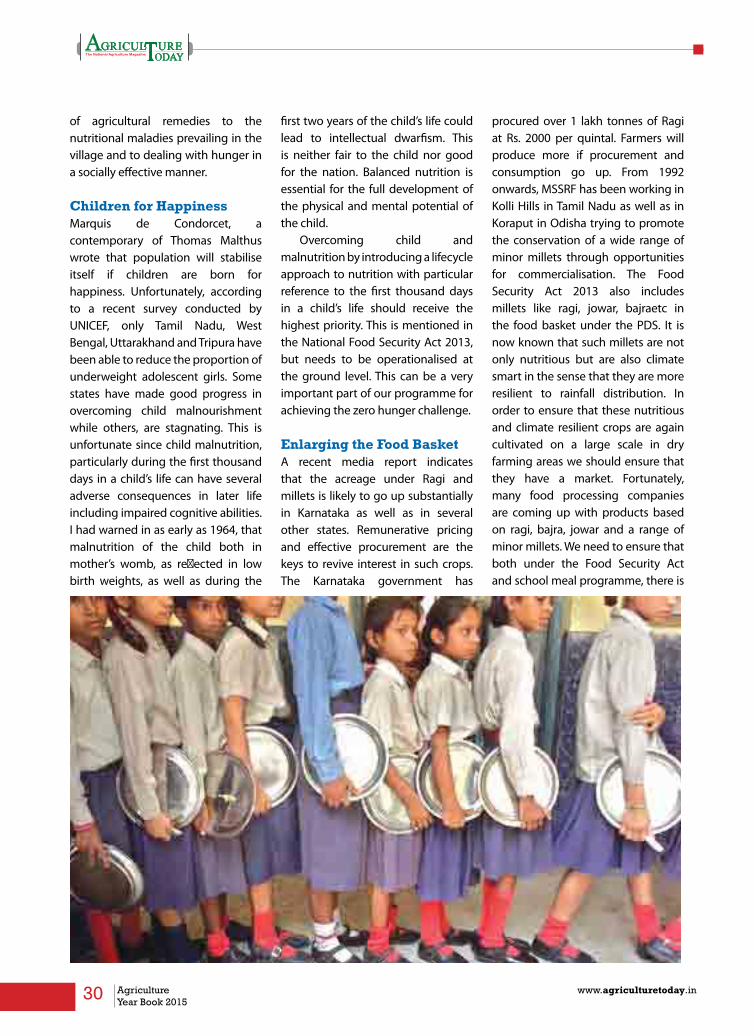
Enlarging the Food BasketA recent media report indicates that the acreage under Ragi and millets is likely to go up substantially in Karnataka as well as in several other states. Remunerative pricing and effective procurement are the keys to revive interest in such crops. The Karnataka government has
procured over 1 lakh tonnes of Ragi at Rs. 2000 per quintal. Farmers will produce more if procurement and consumption go up. From 1992 onwards, MSSRF has been working in Kolli Hills in Tamil Nadu as well as in Koraput in Odisha trying to promote the conservation of a wide range of minor millets through opportunities for commercialisation. The Food Security Act 2013 also includes millets like ragi, jowar, bajraetc in the food basket under the PDS. It is now known that such millets are not only nutritious but are also climate smart in the sense that they are more resilient to rainfall distribution. In order to ensure that these nutritious and climate resilient crops are again cultivated on a large scale in dry farming areas we should ensure that they have a market. Fortunately, many food processing companies are coming up with products based on ragi, bajra, jowar and a range of minor millets. We need to ensure that both under the Food Security Act and school meal programme, there is

31www.agriculturetoday.in Agriculture Year Book 2015
sufficient off take of nutritious millets. Also, government should change the practice of referring to such crops as “coarse grains”. They should be referred to as “climate smart nutri-millets”. Also we should propose to the United Nations to declare one year of this decade as International Year of Underutilised and Biofortified Crops. Next year is the International Year of Pulses, and pulses are also climate smart and protein rich. Through suitable policy support for the cultivation and consumption of such crops, it should be possible to erase the image of our country as one with the largest number of malnourished children and women.
Another urgent requirement is greater investment in research on these “orphan crops”, so that the yield potential is substantially enhanced. Both higher yield and assured marketing will increase the attractiveness of these crops to small farmers.
Water SecurityOur Prime Minister has been placing considerable emphasis on the augmentation of irrigation facilities and water harvesting. The World Water Week held in August in Stockholm, Sweden, where one of our eminent water harvesting experts, Shri Rajendra Singh, was honoured with the prestigious Stockholm Water Prize. I have personally seen the work of Rajendra Singh in Rajasthan where he has tried to motivate local communities in saving all the rain water and using it economically and effectively. I hope this global recognition to one of our water security experts will stimulate state governments to make
rainwater harvesting mandatory both in farms and homes. This will help to strengthen our water and food security system very considerably.
Another aspect which needs attention is the working together of the World Water Partnership and the World Soil Partnership, which was established by FAO a few years ago on my suggestion. Land use decisions are also water use decisions and hence the management of land and water should be handled in a symbiotic manner. We will then be able to ensure sustainable water and food security.
Population StabilisationThe data released on the occasion of the World Population Day revealed that India is likely to become the most populated nation in the world by 2050. At the moment, our population is above 127 crore which is 17.25% of the global population. Our population was only 30 crore in the 1940s when the freedom poet Subramania Bharathi sang that even one among the 30 crore population of that time should not go to bed hungry. Unfortunately, widespread hunger and malnutrition still persists, inspite of the progress in agricultural production. Fortunately, our farmers have not allowed the Malthusian prediction of human numbers
overtaking the human capacity to produce food to become a reality.
Although we are making progress in stabilizing population size, which is now growing at the rate of 1.6% per year, we have still a long way to go to improve the quality of the population in terms of education, healthcare, nutrition and sustainable livelihoods. In 1994, the report of the Population Committee set up by the Government of India under my Chairmanship recommended the involvement of village panchayats and schools in the preparation of a socio-demographic charter for their respective villages.
Such a charter is essentially intended to promote education and social mobilisation in areas such as, the study of the population supporting capacity of the ecosystem in terms of food, water and jobs, the ecological footprint per capita, the weight of children at birth (so as to measure the incidence of low birth weight babies), male – female sex ratio and the average lifespan. A purely
technocratic approach to population stabilisation will not take us to the desired goal. We need a combination of easy access to acceptable and affordable contraceptives and at the same time, follow Marquis de Condorcet’s principle that population will stabilise itself if children are born for happiness and not for mere existence.
July 14th is being observed as US Ecological Deficit Day. The aim of this programme is to create awareness of the need to strike a balance between the growing per capita human needs for food, water, land and jobs and the capacity of ecosystem services to meet them. The Global Footprint Network is publishing reports on the demand

32 Agriculture Year Book 2015
www.agriculturetoday.in
we are making on ecosystem services through lifestyles which enlarge our footprint and thereby create an imbalance between the health of the ecosystem and its population supporting capacity.
It would be useful for our country also to organise an ecological deficit day. This can be organised at the level of each Panchayat so that there is an appreciation at the local level of the need to ensure that our footprint remains small and is within environmentally sustainable levels. Village schools and urban colleges in particular can play an important role in spreading the concept of ecological footprint thereby reminding each one of us from childhood that we should not make unsustainable demands on ecosystem services like soil, water, biodiversity, foodsecurity, livelihoods and income based on the exploitation of natural resources. May be the Ministries of Panchayati Raj, Human Resource Development and Environment, Forest and Climate Change could jointly organise a programme every year to highlight
the ecological deficit we are creating in different parts of the country. At the same time, the Day should draw attention to communities which are creating ecological surplus, so that ecological despair is replaced with ecological hope and pride.
World Youth Skills Day Prime Minister launched the “Skill India” Movement on the occasion of World Youth Skills Day. In this connection I would like to share some experience in imparting new skills which can strengthen the quality of life as well as livelihoods of rural and tribal families. Our programme follows the principle laid out by Mahatma Gandhi that we should combine brain and brawn or intellect and labour while developing skills programmes for rural communities. Unfortunately, this principle is often forgotten in Government programmes like MGNREGA. For example NRGEA will confer immense benefits both to the individual and to the nation, if skills are imparted in the areas such as child care, maintenance of
crèches, rain water harvesting, water shed management, drip irrigation, green house cultivation, biodiversity conservation and converting biodiversity hotspots into happy spots through the conservation, sustainable use and equitable sharing of benefits.
MSSRF designed in 1992 the Biovillage model of human centered development in the Union Territory of Puducherry. This programme aims to impart new skills to both - those who possess land or livestock, as well as those who are classified as landless labour, especially for women. Special attention was given to women, since they are usually the most hard worked and least paid. Thus asset less women will grow mushrooms in a small space in their hut and this has now become a substantial income generating activity. If one goes to a village and ask the men and women what they are doing, the answers will be somewhat under the following lines
“I am a plant doctor; I am an academician of the National Virtual
33www.agriculturetoday.in Agriculture Year Book 2015
Academy; I am a Climate Risk Manager; I am a Community Hunger Fighter; I am a Biodiversity Conserver; I am a Soil Health Manager etc.”
Thus the men and women who acquire new skills are very proud of their capability in areas relevant to both rural life and employment. Majority of our people are young, and hence imparting skills to economically underprivileged young women and men should receive priority under the Skill India programme. If Skill India is properly developed, it will not only enhance income, but also the self-esteem of rural families. We will be able to retain youth in farming only if they find farm occupations intellectually stimulating and economically rewarding. Thus, “Skill India” can confer multiple benefits.
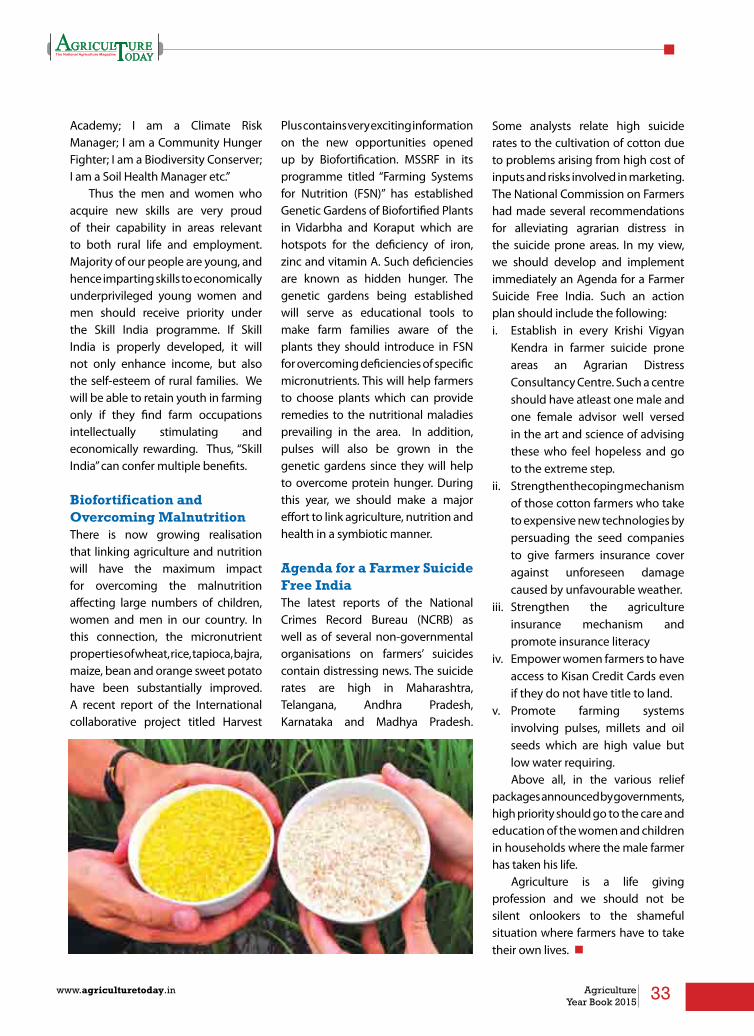
Biofortification and Overcoming MalnutritionThere is now growing realisation that linking agriculture and nutrition will have the maximum impact for overcoming the malnutrition affecting large numbers of children, women and men in our country. In this connection, the micronutrient properties of wheat, rice, tapioca, bajra, maize, bean and orange sweet potato have been substantially improved. A recent report of the International collaborative project titled Harvest
Plus contains very exciting information on the new opportunities opened up by Biofortification. MSSRF in its programme titled “Farming Systems for Nutrition (FSN)” has established Genetic Gardens of Biofortified Plants in Vidarbha and Koraput which are hotspots for the deficiency of iron, zinc and vitamin A. Such deficiencies are known as hidden hunger. The genetic gardens being established will serve as educational tools to make farm families aware of the plants they should introduce in FSN for overcoming deficiencies of specific micronutrients. This will help farmers to choose plants which can provide remedies to the nutritional maladies prevailing in the area. In addition, pulses will also be grown in the genetic gardens since they will help to overcome protein hunger. During this year, we should make a major effort to link agriculture, nutrition and health in a symbiotic manner.
Agenda for a Farmer Suicide Free IndiaThe latest reports of the National Crimes Record Bureau (NCRB) as well as of several non-governmental organisations on farmers’ suicides contain distressing news. The suicide rates are high in Maharashtra, Telangana, Andhra Pradesh, Karnataka and Madhya Pradesh.
Some analysts relate high suicide rates to the cultivation of cotton due to problems arising from high cost of inputs and risks involved in marketing. The National Commission on Farmers had made several recommendations for alleviating agrarian distress in the suicide prone areas. In my view, we should develop and implement immediately an Agenda for a Farmer Suicide Free India. Such an action plan should include the following:i. Establish in every Krishi Vigyan
Kendra in farmer suicide prone areas an Agrarian Distress Consultancy Centre. Such a centre should have atleast one male and one female advisor well versed in the art and science of advising these who feel hopeless and go to the extreme step.
ii. Strengthen the coping mechanism of those cotton farmers who take to expensive new technologies by persuading the seed companies to give farmers insurance cover against unforeseen damage caused by unfavourable weather.
iii. Strengthen the agriculture insurance mechanism and promote insurance literacy
iv. Empower women farmers to have access to Kisan Credit Cards even if they do not have title to land.
v. Promote farming systems involving pulses, millets and oil seeds which are high value but low water requiring.Above all, in the various relief
packages announced by governments, high priority should go to the care and education of the women and children in households where the male farmer has taken his life.
Agriculture is a life giving profession and we should not be silent onlookers to the shameful situation where farmers have to take their own lives. n

34 Agriculture Year Book 2015
www.agriculturetoday.in
Microbial technologies for sustainable agriculture development and food security
Agricultural productivity needs to be increased by 70-100% to feed the estimated population of 1.5 billion by the year 2050. In this endeavour, sustainable
development should meet the needs of the present without compromising the ability of future generations to meet their own needs. The link between sustainable agriculture and sustainable development relies on maintaining soil fertility, protecting groundwater, developing renewable energies and finding solutions to adapt farming systems to climate change, recycling agricultural wastes and urban sewage sludge and promoting rural employment. Hence, there is an enormous pressure built in to the agricultural soils to be resilient and deliver.
Challenges aheadIndian agriculture currently faces the challenge of having to produce more farm commodities to meet the needs of the growing human and animal populations under conditions of diminishing per capita arable land and irrigation water resources, and expanding [environmental] stress. To achieve these,
India’s nearly 110 million rural families – mostly peasant farmers owning up to two hectares of land – will have to be provided with the best available technologies including precision farming technologies and scientific organic farming methods to raise productivity, Increase income and manage natural resources and environment
MICROBES - SUSTAINABlE FOOD PRODUCTION – ClEAN ENVIRONMENT TECHNOlOGIES
Microbes for food productionMicrobes are the natural resources and essential partners in all aspects of plant life, but human efforts to improve plant productivity have focused solely on the plant. Recent AAM report (2012), suggests that improved understanding of plant-microbe interactions has the potential to increase crop productivity by 20% while reducing fertilizer and pesticide requirements by around 25% within 20 years. Hence, microbes and plants are intimate partners in virtually every life process.
Microbes for soil healthMicroorganisms can supplement inorganic fertilizers and chemicals in crop production and protection. At present, however, the yield of many crops has reached a plateau. Moreover, the negative effects of heavy applications of chemical inputs are becoming apparent, in terms of both production and the environment. These occur due to physiological disturbance of plant metabolism due to the accumulation of excess plant nutrients in the soil. Pollution of underground and surface water by nitrates is sometimes reported from intensive crop producing areas. Quality deterioration due to decrease in the content of vitamins and sugars, is becoming a subject of concern. All these point to the need for utilization of microorganisms as a way of repairing the damage from the overuse of chemical inputs.
Dr. K. RamasamyVice-Chancellor,
Tamil Nadu Agricultural University
35www.agriculturetoday.in Agriculture Year Book 2015
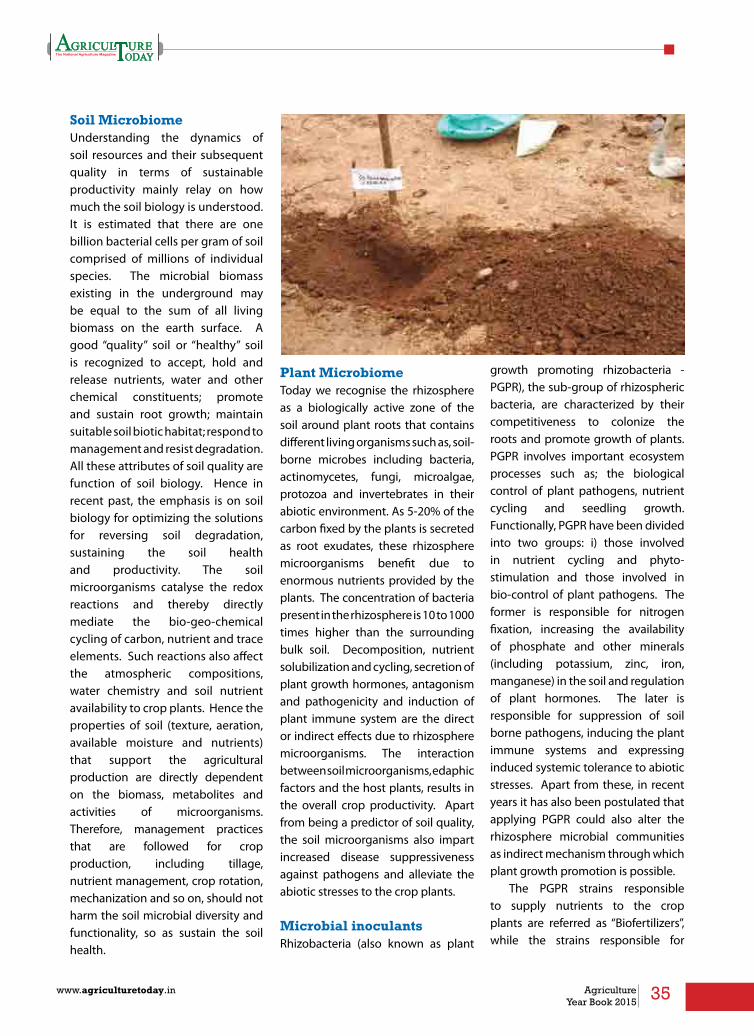
Soil MicrobiomeUnderstanding the dynamics of soil resources and their subsequent quality in terms of sustainable productivity mainly relay on how much the soil biology is understood. It is estimated that there are one billion bacterial cells per gram of soil comprised of millions of individual species. The microbial biomass existing in the underground may be equal to the sum of all living biomass on the earth surface. A good “quality” soil or “healthy” soil is recognized to accept, hold and release nutrients, water and other chemical constituents; promote and sustain root growth; maintain suitable soil biotic habitat; respond to management and resist degradation. All these attributes of soil quality are function of soil biology. Hence in recent past, the emphasis is on soil biology for optimizing the solutions for reversing soil degradation, sustaining the soil health and productivity. The soil microorganisms catalyse the redox reactions and thereby directly mediate the bio-geo-chemical cycling of carbon, nutrient and trace elements. Such reactions also affect the atmospheric compositions, water chemistry and soil nutrient availability to crop plants. Hence the properties of soil (texture, aeration, available moisture and nutrients) that support the agricultural production are directly dependent on the biomass, metabolites and activities of microorganisms. Therefore, management practices that are followed for crop production, including tillage, nutrient management, crop rotation, mechanization and so on, should not harm the soil microbial diversity and functionality, so as sustain the soil health.
Plant MicrobiomeToday we recognise the rhizosphere as a biologically active zone of the soil around plant roots that contains different living organisms such as, soil-borne microbes including bacteria, actinomycetes, fungi, microalgae, protozoa and invertebrates in their abiotic environment. As 5-20% of the carbon fixed by the plants is secreted as root exudates, these rhizosphere microorganisms benefit due to enormous nutrients provided by the plants. The concentration of bacteria present in the rhizosphere is 10 to 1000 times higher than the surrounding bulk soil. Decomposition, nutrient solubilization and cycling, secretion of plant growth hormones, antagonism and pathogenicity and induction of plant immune system are the direct or indirect effects due to rhizosphere microorganisms. The interaction between soil microorganisms, edaphic factors and the host plants, results in the overall crop productivity. Apart from being a predictor of soil quality, the soil microorganisms also impart increased disease suppressiveness against pathogens and alleviate the abiotic stresses to the crop plants.
Microbial inoculantsRhizobacteria (also known as plant
growth promoting rhizobacteria - PGPR), the sub-group of rhizospheric bacteria, are characterized by their competitiveness to colonize the roots and promote growth of plants. PGPR involves important ecosystem processes such as; the biological control of plant pathogens, nutrient cycling and seedling growth. Functionally, PGPR have been divided into two groups: i) those involved in nutrient cycling and phyto-stimulation and those involved in bio-control of plant pathogens. The former is responsible for nitrogen fixation, increasing the availability of phosphate and other minerals (including potassium, zinc, iron, manganese) in the soil and regulation of plant hormones. The later is responsible for suppression of soil borne pathogens, inducing the plant immune systems and expressing induced systemic tolerance to abiotic stresses. Apart from these, in recent years it has also been postulated that applying PGPR could also alter the rhizosphere microbial communities as indirect mechanism through which plant growth promotion is possible.
The PGPR strains responsible to supply nutrients to the crop plants are referred as “Biofertilizers”, while the strains responsible for

36 Agriculture Year Book 2015
www.agriculturetoday.in
controlling insect pests and diseases are called as “Biocontrol agents” and both together technically referred as “Inoculants”. Bacterial genera including species of Rhizobium, Bradyrhizobium, Pseudomonas, Azospirillum, Azotobacter, Bacillus, Klebsiella, Enterobacter, Serratia and many others, have been shown to facilitate plant growth by various mechanisms. These inoculants play a major role in sustainable agriculture because they not only ensure the agronomical yield increase but also reduce the use of inorganic fertilizer inputs (nearly 25% of recommended dose), thereby reducing the risks to the environmental safety. Apart from these, continuous use of the microbial inoculants, also improve the soil health by improving soil biochemical processes. The global market for inoculants is growing at the rate of 10% per annum (Berg, 2009), had a value of $440 million in 2012 and is expected to reach about $1295 million by 2020. The Asian counties like India and China are promoting the use of inoculants through tax incentives and exemptions, grants to support the manufacture and distribution of bio-inoculants.
Nutrient substitution and yield increase by biofertilizersIn India, the use of biofertilizers has been in practice since 1950s, which started with the use of Azotobacter and Phosphobacteria imported from Russia. Later, significant progress has been made to use indigenous strains. Rhizobium inoculation of legumes helps in increasing the yield by 15-30% with an absolute yield increase of 50-200 kg per ha and in
some crops even up to 300 kg per ha. Due to rhizobial inoculation, plant N uptake can be enhanced by 10-15 kg per ha in legumes. Similarly, the inoculation of Azotobacter or Azospirillum in rice and wheat can increase yield by 8-10% and by 10-20% in millets and sunflower. These responses are equivalent to addition of 10-30 kg of fertilizer N per ha. The soil-based cyanobacterial inoculation to wetland rice can contribute 10-25 kg of N per ha with yield increase of 150 kg per ha. All these inoculant applications can substitute the chemical fertilizer (N) to the tune
of 25%. Similarly, inoculation with phosphorus solubilizing bacteria and or arbuscular mycorrhiza (AM) can save 8-10 kg of chemical P per ha with an additional yield benefit of 10-15%.
Biofertilizers with organic manuresThe biofertilizers along with organic manures work well for arid dryland legume crops. Use of Rhizobium and AM along with four tonnes of farmyard manure per ha for dryland legumes (redgram, clusterbean) can ensure the yield as well as soil enrichment. The results of long-term experiments confirm that continuous use (7 years in Vertisol soil) of Rhizobium for soybean and
Azospirillum for wheat can add soil nitrogen to a tune of 50 and 18 kg per ha per year, respectively. Similarly, the symbiotic nitrogen fixing potential in rice ecosystem (either by Sesbania or Azolla) ranged from 57-167 kg of N per ha per year.
When the biofertilizers were used as enrichment of organic amendments, particularly Azotobacter and Phosphobacteria, the enriched compost increased the yield by 8-21 % in most of the irrigated vegetables. When biofertilizers are included in the integrated nutrient management, the fertilizer use efficiency has been
improved in most of the crops inoculated. When Azospirillum or Azotobacter along with phosphobacteria were used along with chemical fertilizers, the fertilizer use efficiency improved by 12-36% for N, 18-28% for P, 9-15% for K and 16-18% for S. The biofertilizer usage can also improve the quality of the produce or the principal
active compounds present in the crops. For example, the antioxidant lycopene increased by 13% in tomato, vitamin C by 27% in tomato and curcumin by 10% in turmeric due to biofertilizer application.
Disease control by biocontrol agents With reference to biocontrol agents, Pseudomonas fluorescens is the key player in terms of suppression of broad-spectrum of soil borne diseases of various crops. It was first demonstrated to control Take-all disease of wheat. Further, the fluorescent Pseduomonads are effective against seedling blight, foot rot and head blight diseases caused by Fusarium culmorum in its early

37www.agriculturetoday.in Agriculture Year Book 2015
stage. Application of Pseudomonas can reduce the blast incidence to the tune of 25 – 80% in rice. The incidence of rice sheath blight can also be reduced by Pseudomonads. The damping off diseases caused by various soil fungi in corn, barley, soybean, chickpea, cotton, sugar beet, tomato, cucumber can be effectively controlled by fluorescent Pseudomonads. Red-rot of sugarcane, root-knot nematode infection in tomato, black rot of tobacco, Fusarium wilt of cucumber and bunchy top of banana are the other diseases that can also be controlled using inoculation of Pseudomonas. The use of Pseudomonas was found to ensure yield increase of wheat (46-75%), rice (25-75%), maize (15-25%), tomato (18%), cucumber (18%) and potato tubers (14-33%).
Secondly, Bacillus subtilis has been successfully commercialized against Rhizoctonia solani, Fusarium spp., Alternaria spp. and Aspergillus spp. that attack roots, powdery mildew, downy mildew, Cercospora leaf spot, early blight, late blight, brown rot, fire blight diseases of various crops including cotton, groundnut, soybean, cucumber, grapes, and many vegetable crops. Important fungal bioinoculants that directly parasitize plant pathogens include; Trichoderma spp., Paecelomyces lilacinus, and Pochoniachlamydosporia. Among these fungal agents, Trichoderma sp. were highly explored for disease management of various crops. The species such as, T. viride, T. harzianum, T. polysporum have been commercially formulated and available as potential biocontrol agents against various diseases. The use of Trichoderma inoculant can control most of the soil borne diseases and some foliar diseases irrespective of crops. Seed treatment with T. harzianum
decreased incidence and severity of Fusarium wilt in chickpea by 30% and 60%, respectively. Likewise, Trichoderma application can control collar rot in mint by 67–100%, wilts of tomato by 75-100%, grape diseases by 48% and citrus canker by 48%. All these inoculants are now available as either powder or liquid formulations.
Microbes as rhizosphere engineersWhen the inoculant is continuously used in an agricultural system, the soil health can be improved. As the inoculant changes the microbial community compositions, the tropic competition and synergistic or antagonistic interaction between them, the change of disease suppressiveness will be increased in due course of time. When mycorrhization is adopted for agro-forestry, in afforestation programmes, fruit trees and so on, the carbon sequestering capability can be improved in those soils, as the glomalin production by mycorrhiza increases the total carbon pool. Thus, microbial inoculants serve as ‘Engineers’ of rhizosphere for creating favourable environment for better nutrient acquisition, root growth and respiration and thereby the increase in grain yield.
Microbes for drought tolerance Some PGPR possess certain unique abiotic stress alleviation traits. These strains enable plants to overcome the ill-effects of drought. The term Induced Systemic Tolerance (IST) has been coined to accommodate the microbial-induced physical and chemical changes in plants which result in enhanced tolerance to abiotic stresses. When inoculated with PGPR Pseudomonas mendocina
and AMF, high activity of antioxidant catalase in lettuce plants under severe drought conditions imports the tolerance. The bacterized plants were found to tolerate stress better. The rhizobacterial strain Pseudomonas putida GAP-P45 improves the plant biomass, relative water content, leaf water potential, proline sugars, and free amino acids of maize plants exposed to drought stress. Methylobacterium commonly referred as PPFM are able to induce the systemic tolerance to drought. Spraying this bacteria induced short-term drought tolerance in rice, to avoid the complete yield loss due to monsoon failure in 2011-12 in Tamil Nadu’s Cauvery delta zone. These findings provide a new dimension in inoculant technology for sustainable development in agriculture. Exploring these bacteria could be an efficient sustainable approach for future agricultural sustainability by drought proofing.
Microbes for bio-based economyThe potential scope for industries based on the kinds of bio-transformations at which microbes excel is enormous, but two obstacles stand in the way of an explosion of this sector. First, relatively few scientifically inclined students are aware that microbe-powered industry is a potential career choice. Second, even if this awareness were greater, there are currently few academic programs aimed at educating the workforce that will be needed for this sector to thrive. Hence efforts should be made to bridge these gaps. Bio-based (Microbe) industries could help address all challenges in ways that are both environmentally and economically sound. At present, microbes are used commercially to

38 Agriculture Year Book 2015
www.agriculturetoday.in
make products as diverse as vitamins, food components, fuels, plastics and many more. Such microbes can be highly efficient, versatile, and sophisticated manufacturing tools, and have the potential to serve as the backbone for a vibrant economic sector, especially in rural areas.
Biopower from wasteWhile anaerobic digestion is the traditional method of treatment for sewage sludge and solid wastes, microorganisms can also produce power directly via an electron generating process called electrogenesis in a reactor called a microbial fuel cell (MFC). This direct electricity production uses microbes to cleave organic materials under anaerobic conditions and uses electrodes as final electron acceptors. Additionally, a by-product of biofuel manufacture can power MFC to generate electricity cheaply and efficiently, enabling the direct conversion of chemical energy into electrical energy.
Sustainable Biofuel ProductionEconomic, environmental and energy security concerns resulting from ex-
cessive reliance on petroleum and its negative impact on the environment, particularly greenhouse gas emis-sions, has put pressure on society to find renewable fuel alternatives such as biofuels mostly derived from crop produces. But, a growing population means that more food is required, and inexpensive energy sources are essential for continued economic growth. Consequently, society faces a number of large, complex, and interconnected challenges. At the same time, destruction of forests to provide more agricultural land, use of cropland and other resources to grow biofuel stocks rather than food, and the urgent need to curb fossil fuel use to slow climate change, all, make it exceptionally challenging to meet the goals of more food and more fuel without unacceptable en-vironmental costs.
In such circumstances, using microbes to break down complex carbohydrates such as; cellulose and hemi-cellulose into the simple sugars that microbes can ferment allows a great variety of agricultural and forestry products and wastes to be converted to ethanol. Second generation biofuels such as butanol, butanediol, and propanol; fatty
acids; isoprenoids; and alkanes may ultimately be better than ethanol. Both the research to develop these new approaches and the eventual implementation of lignocellulose-based bio-alcohol production will require a workforce with microbiology expertise.
In addition to the above products, a by-product of biofuel manufacture or any bio -waste can power MFC to generate electricity cheaply and efficiently, enabling the direct conversion of chemical energy into electrical energy.
A greater investment in research, taking up one or more grand challenges such as characterization of the complete microbiome of one important crop plant, and the establishment of a formal process for moving scientific discoveries from the lab to the field will be ideal as a sustainable means of future development. Manipulation of plant microbiome, specifically through formulation using proteins and small molecules has the potential to reduce the incidence of plant disease, increase agricultural production, reduce chemical inputs and reduce emission of greenhouse gases, resulting in more sustainable agricultural practices
Essential contributions of microbes to human and animal health, environmental resilience, and agricultural productivity are only now becoming more widely recognized. More importantly, the scientific understanding and technological capacity to put microbes to work continue to advance at an impressive pace. What is needed now is an effort to coordinate appropriately; prepared, basic and applied microbiologists, engineers, computational scientists, and modelers for sustainable growth of agriculture and bio-industries. n
39www.agriculturetoday.in Agriculture Year Book 2015
40 Agriculture Year Book 2015
www.agriculturetoday.in
Quality Seeds : Harbinger for Second Green Revolution in India
We are nearing completion of nearly five decades of the wonderful phenomenon called green revolution to have happened, and the
changed demographic, climatic and geo-po-litical scenario has been demanding a second green revolution for quite some time. Agricul-tural scientists need to intensify their efforts to expeditiously usher in Second Green revolution in the country. There are number of factors that, if addressed jointly, can make this long coveted dream of second green revolution benefitting the small and marginal resource poor farmers come true.
Adverse effects of climate change are looming large over vast tracts of the country as evident from recent trends of droughts and torrential floods. Time is ripe, when farmers of these regions are to be re-introduced to more resilient, nutrition rich conventional crops of bygone era such as millets. Pro-
pelling agricultural productivity to next higher level requires urgent efforts to narrow the Yield Gap. NARS has been successful in developing a large number of region and situation specific crop varieties but the Varietal (VRR) and Seed Replacement Rates (SRR) still remain dismal. Adoption of improved cultivars and quality seeds can immediately provide a productivity boost of 15-20 %. Enhanced role of women in critical farm activities and decision making such as ensuring quality seeds for next crop cycle, engaging them in alternative livelihoods inter-woven with farming would not only improve agricultural productivity but also enhance the
Dr. S. Rajendra Prasad, Project Director and
Dr. Dinesh K. AgarwalPrincipal Scientist (Plant Breeding)
ICAR-Directorate of Seed Research, Mau
Increased Productivity Through Quality Seed Intiative• Climate resilient seed production technology .
• Enhancement in Seed Replacement Rate (SRR) &Varietal Replacement Rate (VRR)
• Exploitation of genomics and proteomicsapproaches in seed research
• Employing community based seed models fordifferent agro -ecosystems .
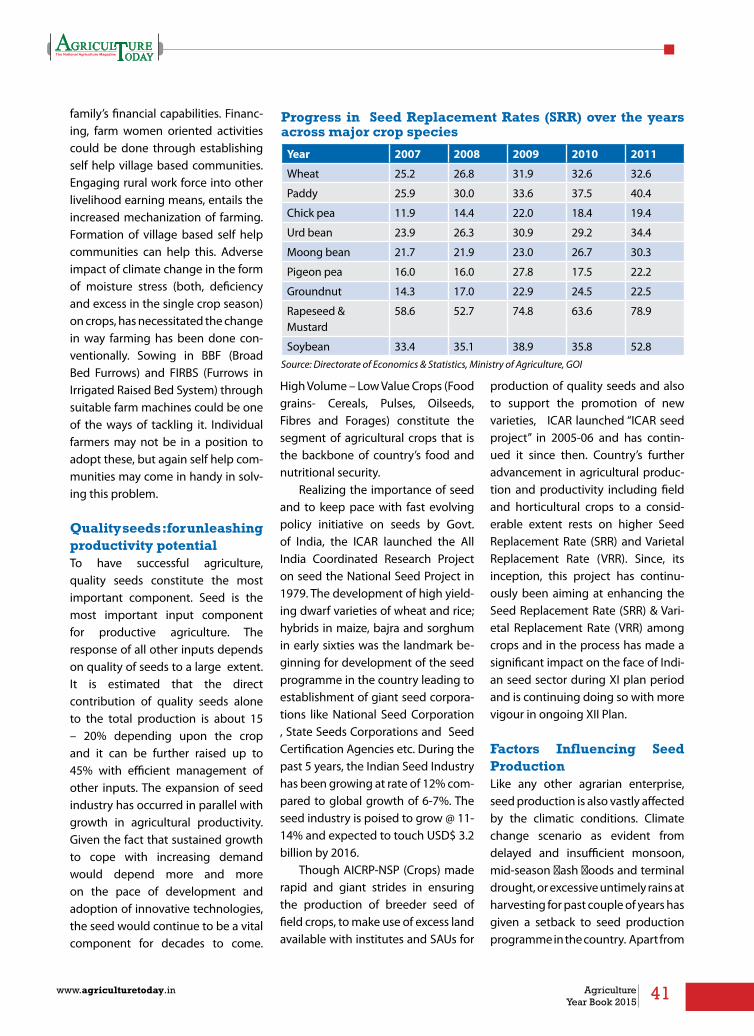
41www.agriculturetoday.in Agriculture Year Book 2015
family’s financial capabilities. Financ-ing, farm women oriented activities could be done through establishing self help village based communities. Engaging rural work force into other livelihood earning means, entails the increased mechanization of farming. Formation of village based self help communities can help this. Adverse impact of climate change in the form of moisture stress (both, deficiency and excess in the single crop season) on crops, has necessitated the change in way farming has been done con-ventionally. Sowing in BBF (Broad Bed Furrows) and FIRBS (Furrows in Irrigated Raised Bed System) through suitable farm machines could be one of the ways of tackling it. Individual farmers may not be in a position to adopt these, but again self help com-munities may come in handy in solv-ing this problem.
Quality seeds : for unleashing productivity potentialTo have successful agriculture, quality seeds constitute the most important component. Seed is the most important input component for productive agriculture. The response of all other inputs depends on quality of seeds to a large extent. It is estimated that the direct contribution of quality seeds alone to the total production is about 15 – 20% depending upon the crop and it can be further raised up to 45% with efficient management of other inputs. The expansion of seed industry has occurred in parallel with growth in agricultural productivity. Given the fact that sustained growth to cope with increasing demand would depend more and more on the pace of development and adoption of innovative technologies, the seed would continue to be a vital component for decades to come.
High Volume – Low Value Crops (Food grains- Cereals, Pulses, Oilseeds, Fibres and Forages) constitute the segment of agricultural crops that is the backbone of country’s food and nutritional security.
Realizing the importance of seed and to keep pace with fast evolving policy initiative on seeds by Govt. of India, the ICAR launched the All India Coordinated Research Project on seed the National Seed Project in 1979. The development of high yield-ing dwarf varieties of wheat and rice; hybrids in maize, bajra and sorghum in early sixties was the landmark be-ginning for development of the seed programme in the country leading to establishment of giant seed corpora-tions like National Seed Corporation , State Seeds Corporations and Seed Certification Agencies etc. During the past 5 years, the Indian Seed Industry has been growing at rate of 12% com-pared to global growth of 6-7%. The seed industry is poised to grow @ 11-14% and expected to touch USD$ 3.2 billion by 2016.
Though AICRP-NSP (Crops) made rapid and giant strides in ensuring the production of breeder seed of field crops, to make use of excess land available with institutes and SAUs for
production of quality seeds and also to support the promotion of new varieties, ICAR launched ‘‘ICAR seed project’’ in 2005-06 and has contin-ued it since then. Country’s further advancement in agricultural produc-tion and productivity including field and horticultural crops to a consid-erable extent rests on higher Seed Replacement Rate (SRR) and Varietal Replacement Rate (VRR). Since, its inception, this project has continu-ously been aiming at enhancing the Seed Replacement Rate (SRR) & Vari-etal Replacement Rate (VRR) among crops and in the process has made a significant impact on the face of Indi-an seed sector during XI plan period and is continuing doing so with more vigour in ongoing XII Plan.
Factors Influencing Seed ProductionLike any other agrarian enterprise, seed production is also vastly affected by the climatic conditions. Climate change scenario as evident from delayed and insufficient monsoon, mid-season flash floods and terminal drought, or excessive untimely rains at harvesting for past couple of years has given a setback to seed production programme in the country. Apart from
Year 2007 2008 2009 2010 2011
Wheat 25.2 26.8 31.9 32.6 32.6
Paddy 25.9 30.0 33.6 37.5 40.4
Chick pea 11.9 14.4 22.0 18.4 19.4
Urd bean 23.9 26.3 30.9 29.2 34.4
Moong bean 21.7 21.9 23.0 26.7 30.3
Pigeon pea 16.0 16.0 27.8 17.5 22.2
Groundnut 14.3 17.0 22.9 24.5 22.5
Rapeseed & Mustard
58.6 52.7 74.8 63.6 78.9
Soybean 33.4 35.1 38.9 35.8 52.8Source: Directorate of Economics & Statistics, Ministry of Agriculture, GOI
Progress in Seed Replacement Rates (SRR) over the years across major crop species

42 Agriculture Year Book 2015
www.agriculturetoday.in
climate dependent agriculture, there are a number of other factors that determine the demand and supply of breeder seed in the country. Some of these are the inherent features of a crop species (Seed rate & Seed Multiplication Ratio) and, hence, cannot be altered beyond a certain point without a superior technolo-gical advancement; while other factors such as varietal preferences (Varietal Replacement Rate) and use of quality seeds (Seed Replacement Rate) may be manoeuvred favourably with strong and focussed efforts by various central and state governmental agencies.
Quality Seed Requirement of the country Improved Seed Replacement Rate (SRR) in major field crops holds the key to improved agricultural productivity.
There has been some improvement during the past one decade as is evident from improvement in SRRs among various crops, still making the quality seed available to every farmer at reasonable price and time is a distant dream.
During the last two seasons, breeder seed indent for various rea-sons, without any doubt, has de-clined but the question that needs to be asked is actually how much quantity of breeder seed is truly re-quired in the country? Already, every year there are numerous complaints from ICAR institutes and SAUs re-garding non-lifting of breeder seed. It would only be appropriate, if the actual requirement for breeder seed is worked out considering the follow-ing multiplication chain.
From the table given above, it is evident that actual breeder seed
requirement is not very far from the quantity already being produced. The above said requirement is grossly over-estimated on account of two as-sumptions i.e. the seed replacement rate would be 100 % and the entire area under a given crop is planted with improved varieties of existing seed chain. Both of these require-ments are neither practical nor de-sired. Planting entire crop area with improved varieties of seed chain re-placing land races, traditional culti-vars and farmers’ varieties would lead to irreparable loss of genetic variabil-ity. The scenario painted above also ignores the ground reality of qual-ity seed supply in the form of seed sale and exchange by local farming community and farmers themselves. Hence, as per the logic and informa-tion given in Table above, one may deduce with some certainty that the
Crops Gross cultivated
area (M.ha)
Seed Rate (Kg/ha)
Total certified seed requirement
(in 000 tonnes)
SMR (ratio)
Foundation seed
requirement(in 000 tonnes)
Breeder seedRequirement
(in tonnes)
Breeder seed
production 2013-14
(in tonnes)
Rice 45.60 50 2280.00 100 22.80 228.00 1937.48
Wheat 27.20 125 3400.00 20 170.00 8500.00 3051.67
Sorghum 7.70 15 115.50 160 0.72 4.51 36.88
Pearl millet 8.70 5 43.50 200 0.22 1.09 6.68
Maize 8.00 20 160.00 80 2.00 25.00 57.25
Pigeon pea 3.40 15 51.00 100 0.51 5.10 72.00
Chickpea 8.20 80 656.00 10 65.60 6560.00 597.57
Groundnut@ 6.20 100 620.00 8 9.68 1210.93 1600.35
R&M 6.30 5 31.50 200 0.16 0.79
Soybean 8.90 75 667.50 16 41.72 2607.42 954.16
Sunflower 1.90 10 19.00 50 0.38 7.60 8.57
Cotton 9.50 12 114.00 50 2.28 45.60 14.61
Jute 0.80 5 4.00 100 0.04 0.40 2.35
Total 142.40 8162.00 316.11 19196.44 8339.60@: Groundnut foundation seed requirement is calculated on basis of two stage c/s production
Quality seed requirement of major crops in the country (Assumption 100% SRR)

43www.agriculturetoday.in Agriculture Year Book 2015
actual requirement of breeder seed is already being produced in the coun-try.
The contribution of public and private sector in making the quality seed available in 2012-13 was 49.05 & 50.94 %, respectively. Public sector is mostly taking care of High Volume-Low Value crops (Food Grains), which are the backbone of country’s food and nutritional security; while private sector is mostly involved with profit rich Low Volume-High Value crops.
Poor varietal adoption rates : a reason of concernAnother major problem due to which there is a significant lag in bridging the Yield Gap among major food crop is the poor Varietal Replacement Rate (VRR). Even though more than 4500 varieties have been notified and are available, indents for basic seed and its further multiplication is restricted to few varieties. Many improved varieties, which are location specific, resistant to biotic and abiotic stresses do not find a place in active seed chain. The problem may be with below par extension activities either in NARS system or abysmal outreach activities by agencies of agricultural departments but the truth that remains is the that farmers
are deprived of fruits of agricultural research (improved varieties). Hence special focus needs to be given on improvement of VRR, which will certainly pave the way for improved productivity levels manifested in the form of increased production. By addressing the mentioned challenges (SRR & VRR) broader goals of increasing agricultural productivity and food security can be attained.
There are a good number of vari-eties in seed chain both in paddy as well as in wheat. Average age of top
10 indented varieties in wheat is 7 years which is a good sign and shows a high varietal replacement rate. While, the latest variety to be able to make place among top 10 in paddy and wheat are of years 2011 and 2014, respectively. Both, paddy and wheat still have varieties as old as 1985 and 1982 among the top 10 in terms of demand. In, paddy and barley, there is less varietal diversification as top 10 varieties constitute only 61.87 % & 76.27 % of indent;, while in wheat top 10 varieties cover up almost the
Year KHARIF RABI TOTAL
Demand Production/Availability
Demand Production/Availability
Demand Production/Availability
Surplus Status
2008-09 96.04 105.53 111.23 144.80 207.28 250.34 43.06
2009-10 110.96 126.51 138.15 153.21 249.12 279.72 30.60
2010-11 123.11 141.93 167.64 179.42 290.75 321.35 30.60
2011-12 139.33 151.29 191.07 202.33 330.40 353.62 23.21
2012-13 129.64 141.81 185.53 186.77 315.18 328.58 13.40
2013-14 139.87 153.94 195.38 193.37 335.26 347.31 12.05
2014-15 145.66 149.46 197.89 202.30 343.55 351.76 8.21 ( Source : compiled by Seeds Division of DAC)
Production / availability of certified / quality seeds (q) in the country
Fig. 1 : Progress of Breeder Seed Production among field crops from 1981-82 to 2013-14
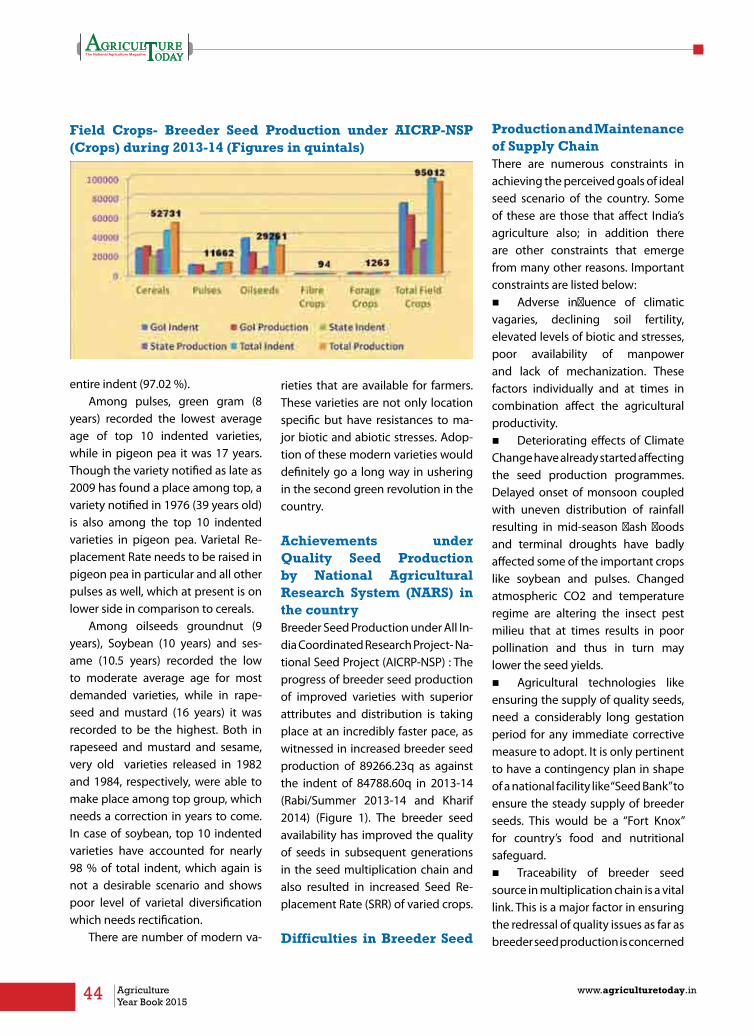
44 Agriculture Year Book 2015
www.agriculturetoday.in
entire indent (97.02 %).Among pulses, green gram (8
years) recorded the lowest average age of top 10 indented varieties, while in pigeon pea it was 17 years. Though the variety notified as late as 2009 has found a place among top, a variety notified in 1976 (39 years old) is also among the top 10 indented varieties in pigeon pea. Varietal Re-placement Rate needs to be raised in pigeon pea in particular and all other pulses as well, which at present is on lower side in comparison to cereals.
Among oilseeds groundnut (9 years), Soybean (10 years) and ses-ame (10.5 years) recorded the low to moderate average age for most demanded varieties, while in rape-seed and mustard (16 years) it was recorded to be the highest. Both in rapeseed and mustard and sesame, very old varieties released in 1982 and 1984, respectively, were able to make place among top group, which needs a correction in years to come. In case of soybean, top 10 indented varieties have accounted for nearly 98 % of total indent, which again is not a desirable scenario and shows poor level of varietal diversification which needs rectification.
There are number of modern va-
rieties that are available for farmers. These varieties are not only location specific but have resistances to ma-jor biotic and abiotic stresses. Adop-tion of these modern varieties would definitely go a long way in ushering in the second green revolution in the country.
Achievements under Quality Seed Production by National Agricultural Research System (NARS) in the countryBreeder Seed Production under All In-dia Coordinated Research Project- Na-tional Seed Project (AICRP-NSP) : The progress of breeder seed production of improved varieties with superior attributes and distribution is taking place at an incredibly faster pace, as witnessed in increased breeder seed production of 89266.23q as against the indent of 84788.60q in 2013-14 (Rabi/Summer 2013-14 and Kharif 2014) (Figure 1). The breeder seed availability has improved the quality of seeds in subsequent generations in the seed multiplication chain and also resulted in increased Seed Re-placement Rate (SRR) of varied crops.
Difficulties in Breeder Seed
Production and Maintenance of Supply ChainThere are numerous constraints in achieving the perceived goals of ideal seed scenario of the country. Some of these are those that affect India’s agriculture also; in addition there are other constraints that emerge from many other reasons. Important constraints are listed below:n Adverse influence of climatic vagaries, declining soil fertility, elevated levels of biotic and stresses, poor availability of manpower and lack of mechanization. These factors individually and at times in combination affect the agricultural productivity. n Deteriorating effects of Climate Change have already started affecting the seed production programmes. Delayed onset of monsoon coupled with uneven distribution of rainfall resulting in mid-season flash floods and terminal droughts have badly affected some of the important crops like soybean and pulses. Changed atmospheric CO2 and temperature regime are altering the insect pest milieu that at times results in poor pollination and thus in turn may lower the seed yields.n Agricultural technologies like ensuring the supply of quality seeds, need a considerably long gestation period for any immediate corrective measure to adopt. It is only pertinent to have a contingency plan in shape of a national facility like “Seed Bank” to ensure the steady supply of breeder seeds. This would be a “Fort Knox” for country’s food and nutritional safeguard. n Traceability of breeder seed source in multiplication chain is a vital link. This is a major factor in ensuring the redressal of quality issues as far as breeder seed production is concerned
Field Crops- Breeder Seed Production under AICRP-NSP (Crops) during 2013-14 (Figures in quintals)
45www.agriculturetoday.in Agriculture Year Book 2015
and warrants an early settlement.n Development of DNA based rapid detection protocol would save a lot of energy and time factor that goes into lengthy grow out tests.n Issue of non-lifting of breeder seed from production centres is another serious management issue. Though recently a mechanism in form of monetary penalty for defaulters has been introduced, but still a complete solution to the problem is yet to be worked out.n There has to be a strict uniformity in adoption of norms across the states in the country especially in terms of Uniformity in colour and size of breeder seed lables.n At times indent for breeder seed received by DoAC from various State Governments are unrealistic for some of the varieties due to various reasons and do not truly represent the demand for these varieties. This often results in non-lifting of seeds and also hampers the process of achieving goals of enhancing the VRR and SRR.n Any sudden upsurge in demand for a particular variety, for the reasons stated above, has many road blocks and constraints in fulfilling it in the
ensuing season.
Quality Seed Production under ICAR Seed ProjectDuring the year 2013-14, total production of quality seed including all classes was 648325 quintals against the target of 475179 quintals. Production comprises 94953 quintals of breeder seed, 144369 quintals of foundation seed, 163465 quintals of certified seeds, 172351 quintals of truthfully labelled seed and 73185 quintals of planting material of field crops. In addition, 155.59 lakhs planting material and 5.60 lakh tissue culture plantlets of field crops were produced against the targets of 94.80 and 2.07 lakhs.
Impact of Quality Seed Production ProgrammeAICRP-NSP (Crops) in tandem with ICAR Seed Project has been instrumental in ameliorating the crop productivity of the country by enhancing SRR and VRR. It’s impact on agricultural scenario could be summarised by following points :n Surplus availability of breeder
seed with appropriate research backdrop
n Availability and spread of quality seed to farmers has been enabled
n In enhancing area coverage under high yielding varieties.
n In enhancing crop productivity n In raising availability and access
of food grains and providing food and nutritional security through seed security
OECD Varietal Certification in IndiaThe Organization for Economic Co-operation and Development (OECD) is an inter-governmental organiza-tion established in 1958 and is having its secretariat at Paris. OECD offers a multilateral forum to discuss, develop and reform economic and social poli-cies. The OECD Seed Schemes pro-vide an international framework for the certification of agriculture seed moving in international trade. Fifty eight countries Including India, from Europe, North and South America, the Middle-East, Asia and Oceania are currently the members of OECD Seed Schemes. India’s participation in OECD Seed Schemes would fur-ther bolster the seed industry in the country.
Keeping in view the food and nutritional security of the country in the future, ensuring the supply of quality seeds of highest standards is the most critical input of agrarian en-terprise. Though we produce 100 % of GoI indent of breeder seed, there are limitations to breeder seed pro-duction and maintenance of supply chain but efforts are on to mitigate these and find a way forward to move ahead with increased vigour and enhanced efficiency. Hence, the National Seed Project has worked out certain key areas for further bolster-ing the seed scenario. n

46 Agriculture Year Book 2015
www.agriculturetoday.in

47www.agriculturetoday.in Agriculture Year Book 2015
climAte chAnge And
SuStAinAble Agriculture
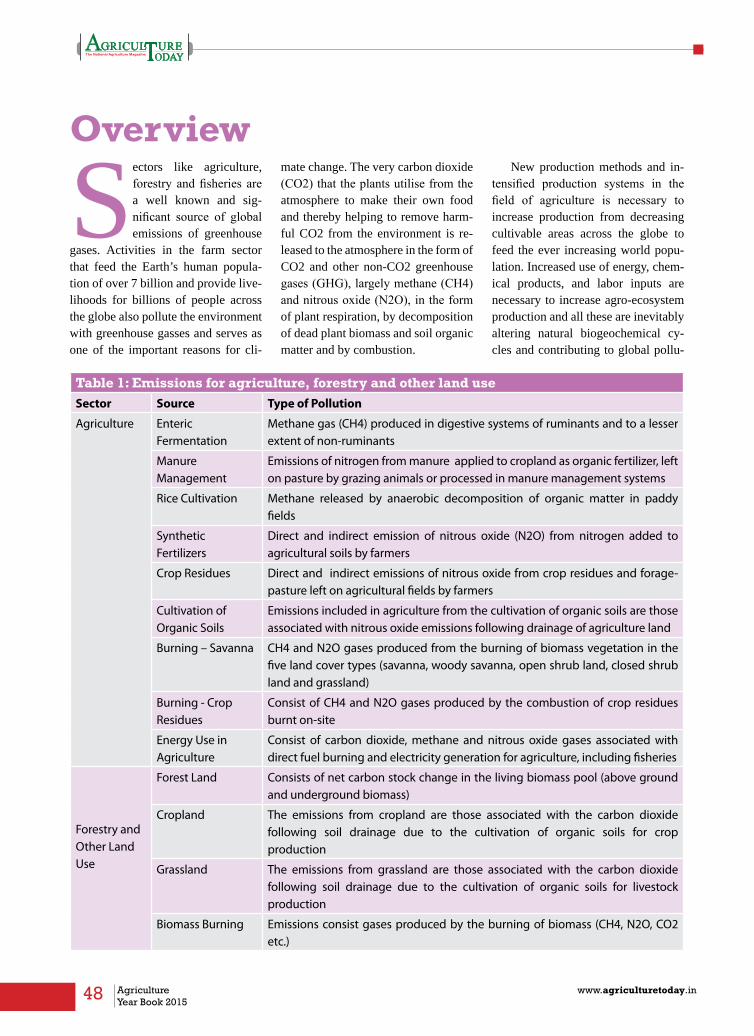
48 Agriculture Year Book 2015
www.agriculturetoday.in
Overview
Sectors like agriculture, forestry and fisheries are a well known and sig-nificant source of global emissions of greenhouse
gases. Activities in the farm sector that feed the Earth’s human popula-tion of over 7 billion and provide live-lihoods for billions of people across the globe also pollute the environment with greenhouse gasses and serves as one of the important reasons for cli-
mate change. The very carbon dioxide (CO2) that the plants utilise from the atmosphere to make their own food and thereby helping to remove harm-ful CO2 from the environment is re-leased to the atmosphere in the form of CO2 and other non-CO2 greenhouse gases (GHG), largely methane (CH4) and nitrous oxide (N2O), in the form of plant respiration, by decomposition of dead plant biomass and soil organic matter and by combustion.
New production methods and in-tensified production systems in the field of agriculture is necessary to increase production from decreasing cultivable areas across the globe to feed the ever increasing world popu-lation. Increased use of energy, chem-ical products, and labor inputs are necessary to increase agro-ecosystem production and all these are inevitably altering natural biogeochemical cy-cles and contributing to global pollu-
Table 1: Emissions for agriculture, forestry and other land useSector Source Type of Pollution
Agriculture Enteric Fermentation
Methane gas (CH4) produced in digestive systems of ruminants and to a lesser extent of non-ruminants
Manure Management
Emissions of nitrogen from manure applied to cropland as organic fertilizer, left on pasture by grazing animals or processed in manure management systems
Rice Cultivation Methane released by anaerobic decomposition of organic matter in paddy fields
Synthetic Fertilizers
Direct and indirect emission of nitrous oxide (N2O) from nitrogen added to agricultural soils by farmers
Crop Residues Direct and indirect emissions of nitrous oxide from crop residues and forage-pasture left on agricultural fields by farmers
Cultivation of Organic Soils
Emissions included in agriculture from the cultivation of organic soils are those associated with nitrous oxide emissions following drainage of agriculture land
Burning – Savanna CH4 and N2O gases produced from the burning of biomass vegetation in the five land cover types (savanna, woody savanna, open shrub land, closed shrub land and grassland)
Burning - Crop Residues
Consist of CH4 and N2O gases produced by the combustion of crop residues burnt on-site
Energy Use in Agriculture
Consist of carbon dioxide, methane and nitrous oxide gases associated with direct fuel burning and electricity generation for agriculture, including fisheries
Forestry and Other Land Use
Forest Land Consists of net carbon stock change in the living biomass pool (above ground and underground biomass)
Cropland The emissions from cropland are those associated with the carbon dioxide following soil drainage due to the cultivation of organic soils for crop production
Grassland The emissions from grassland are those associated with the carbon dioxide following soil drainage due to the cultivation of organic soils for livestock production
Biomass Burning Emissions consist gases produced by the burning of biomass (CH4, N2O, CO2 etc.)
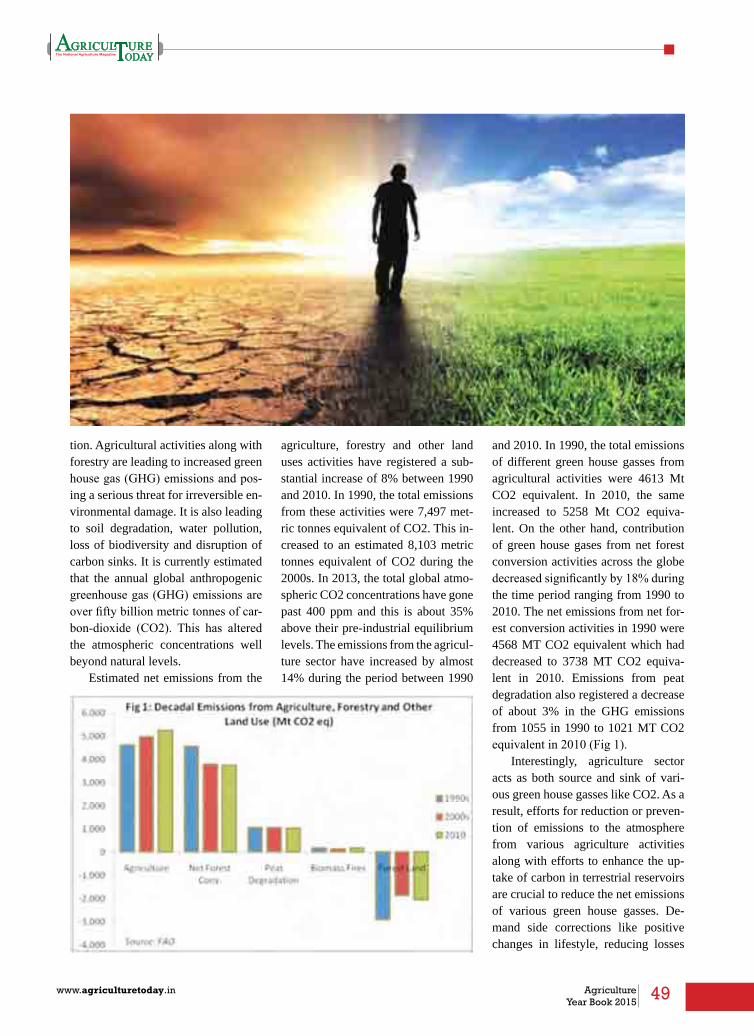
49www.agriculturetoday.in Agriculture Year Book 2015
tion. Agricultural activities along with forestry are leading to increased green house gas (GHG) emissions and pos-ing a serious threat for irreversible en-vironmental damage. It is also leading to soil degradation, water pollution, loss of biodiversity and disruption of carbon sinks. It is currently estimated that the annual global anthropogenic greenhouse gas (GHG) emissions are over fifty billion metric tonnes of car-bon-dioxide (CO2). This has altered the atmospheric concentrations well beyond natural levels.
Estimated net emissions from the
agriculture, forestry and other land uses activities have registered a sub-stantial increase of 8% between 1990 and 2010. In 1990, the total emissions from these activities were 7,497 met-ric tonnes equivalent of CO2. This in-creased to an estimated 8,103 metric tonnes equivalent of CO2 during the 2000s. In 2013, the total global atmo-spheric CO2 concentrations have gone past 400 ppm and this is about 35% above their pre-industrial equilibrium levels. The emissions from the agricul-ture sector have increased by almost 14% during the period between 1990
and 2010. In 1990, the total emissions of different green house gasses from agricultural activities were 4613 Mt CO2 equivalent. In 2010, the same increased to 5258 Mt CO2 equiva-lent. On the other hand, contribution of green house gases from net forest conversion activities across the globe decreased significantly by 18% during the time period ranging from 1990 to 2010. The net emissions from net for-est conversion activities in 1990 were 4568 MT CO2 equivalent which had decreased to 3738 MT CO2 equiva-lent in 2010. Emissions from peat degradation also registered a decrease of about 3% in the GHG emissions from 1055 in 1990 to 1021 MT CO2 equivalent in 2010 (Fig 1).
Interestingly, agriculture sector acts as both source and sink of vari-ous green house gasses like CO2. As a result, efforts for reduction or preven-tion of emissions to the atmosphere from various agriculture activities along with efforts to enhance the up-take of carbon in terrestrial reservoirs are crucial to reduce the net emissions of various green house gasses. De-mand side corrections like positive changes in lifestyle, reducing losses
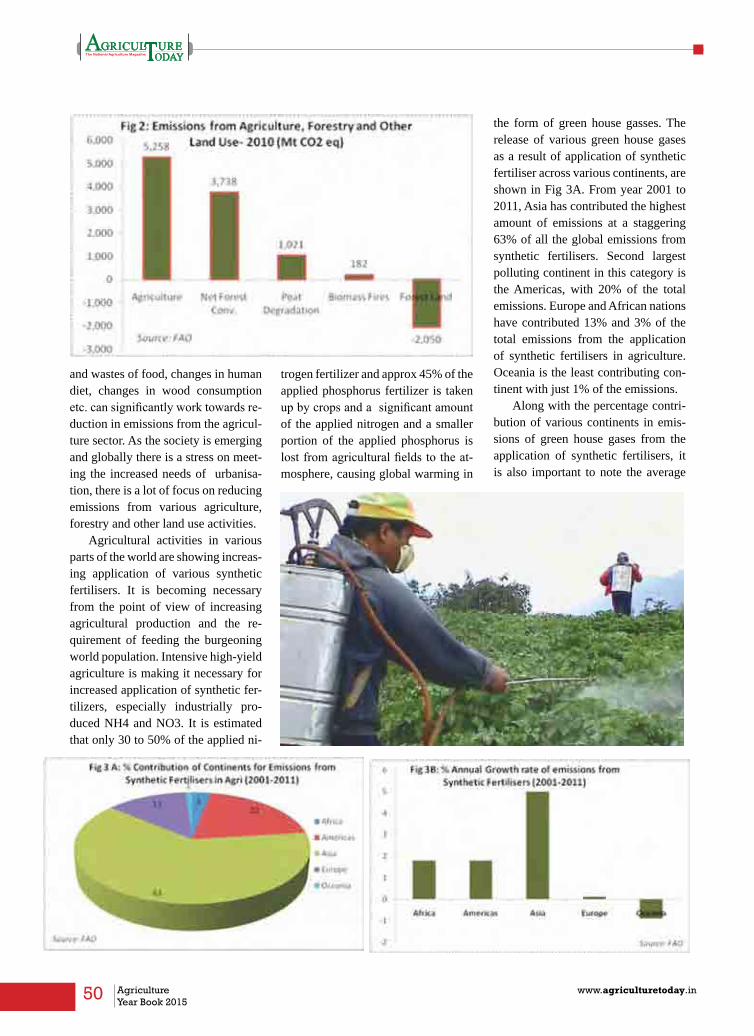
50 Agriculture Year Book 2015
www.agriculturetoday.in
and wastes of food, changes in human diet, changes in wood consumption etc. can significantly work towards re-duction in emissions from the agricul-ture sector. As the society is emerging and globally there is a stress on meet-ing the increased needs of urbanisa-tion, there is a lot of focus on reducing emissions from various agriculture, forestry and other land use activities.
Agricultural activities in various parts of the world are showing increas-ing application of various synthetic fertilisers. It is becoming necessary from the point of view of increasing agricultural production and the re-quirement of feeding the burgeoning world population. Intensive high-yield agriculture is making it necessary for increased application of synthetic fer-tilizers, especially industrially pro-duced NH4 and NO3. It is estimated that only 30 to 50% of the applied ni-
trogen fertilizer and approx 45% of the applied phosphorus fertilizer is taken up by crops and a significant amount of the applied nitrogen and a smaller portion of the applied phosphorus is lost from agricultural fields to the at-mosphere, causing global warming in
the form of green house gasses. The release of various green house gases as a result of application of synthetic fertiliser across various continents, are shown in Fig 3A. From year 2001 to 2011, Asia has contributed the highest amount of emissions at a staggering 63% of all the global emissions from synthetic fertilisers. Second largest polluting continent in this category is the Americas, with 20% of the total emissions. Europe and African nations have contributed 13% and 3% of the total emissions from the application of synthetic fertilisers in agriculture. Oceania is the least contributing con-tinent with just 1% of the emissions.
Along with the percentage contri-bution of various continents in emis-sions of green house gases from the application of synthetic fertilisers, it is also important to note the average

51www.agriculturetoday.in Agriculture Year Book 2015
annual growth rate of emissions in these continents as a result of the use of synthetic fertilisers. Fig 3B shows that Asia along with the fact that it is the highest contributor of GHG from synthetic fertilisers, is also the fast-est growing continent in terms of the
rate of increase of emissions. It has grown at an annual average rate of 5% between the years 2001 and 2011. Af-rica and Americas have respectively witnessed a growth rate of 1.8% each per year (Fig 3B). It is clear that Asian countries, apart from contributing the
maximum amount of emissions from synthetic fertilisers, is also exhibiting higher growth rate and is can only be mitigated with efficient and judicious application of chemical fertilisers. While Europe has shown negligible growth rate, Oceania has registered a negative growth rate of 0.9% annually between 2001 and 2011.
It is not just synthetic fertiliser that is contributing to the global emissions from the agriculture sector. Emissions from manure applied to the soil are also a significant contributor of GHG globally. According to estimates, Asian region contributed 45% of the total emissions of GHG globally from manure applied to the soil followed by the European region at 28% and the Americas at 22%. Africa and Oceania contribute 4% and 1% respectively. However, African continent has the highest growth rate with 3.7% an-nually between 2001 and 2011. Asia follows as the second highest growth rate in this sector of global emissions from agriculture with 2.5% growth per year during the same period. Europe showed a negative growth of 0.9% per year.
It is important to study the rate of growth of growth of emissions across different regions along with contribu-tion from regions. Fig 4 shows that while Europe and the Oceania region has registered a negative growth in terms of emissions from agriculture sector, Africa, Americas and the
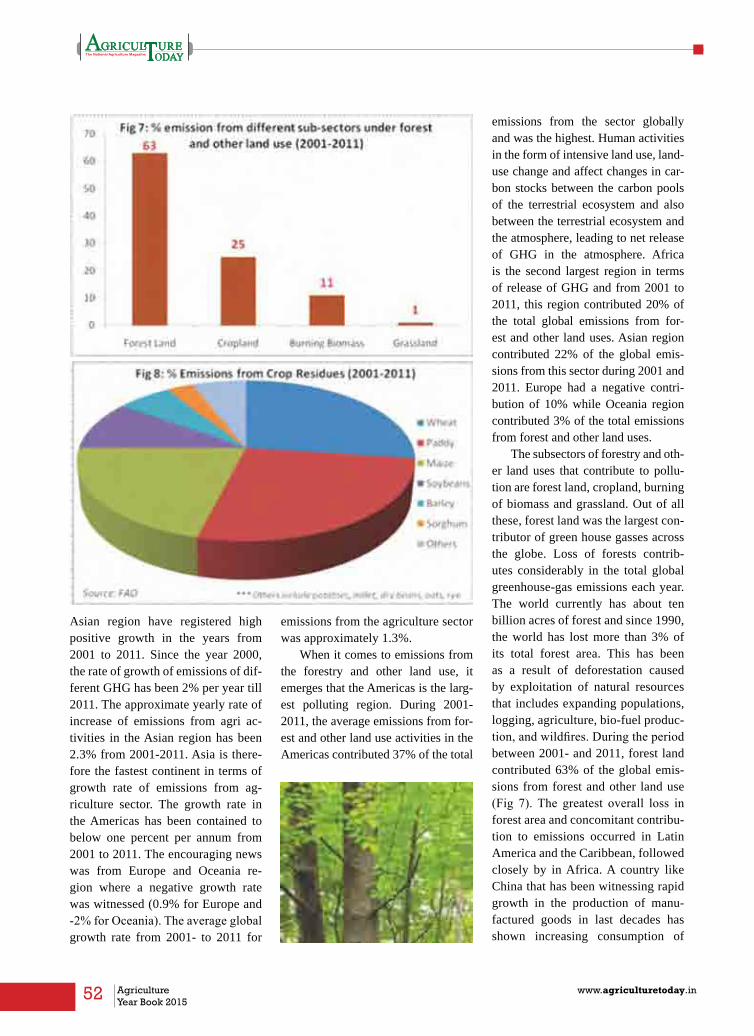
52 Agriculture Year Book 2015
www.agriculturetoday.in
Asian region have registered high positive growth in the years from 2001 to 2011. Since the year 2000, the rate of growth of emissions of dif-ferent GHG has been 2% per year till 2011. The approximate yearly rate of increase of emissions from agri ac-tivities in the Asian region has been 2.3% from 2001-2011. Asia is there-fore the fastest continent in terms of growth rate of emissions from ag-riculture sector. The growth rate in the Americas has been contained to below one percent per annum from 2001 to 2011. The encouraging news was from Europe and Oceania re-gion where a negative growth rate was witnessed (0.9% for Europe and -2% for Oceania). The average global growth rate from 2001- to 2011 for
emissions from the agriculture sector was approximately 1.3%.
When it comes to emissions from the forestry and other land use, it emerges that the Americas is the larg-est polluting region. During 2001-2011, the average emissions from for-est and other land use activities in the Americas contributed 37% of the total
emissions from the sector globally and was the highest. Human activities in the form of intensive land use, land-use change and affect changes in car-bon stocks between the carbon pools of the terrestrial ecosystem and also between the terrestrial ecosystem and the atmosphere, leading to net release of GHG in the atmosphere. Africa is the second largest region in terms of release of GHG and from 2001 to 2011, this region contributed 20% of the total global emissions from for-est and other land uses. Asian region contributed 22% of the global emis-sions from this sector during 2001 and 2011. Europe had a negative contri-bution of 10% while Oceania region contributed 3% of the total emissions from forest and other land uses.
The subsectors of forestry and oth-er land uses that contribute to pollu-tion are forest land, cropland, burning of biomass and grassland. Out of all these, forest land was the largest con-tributor of green house gasses across the globe. Loss of forests contrib-utes considerably in the total global greenhouse-gas emissions each year. The world currently has about ten billion acres of forest and since 1990, the world has lost more than 3% of its total forest area. This has been as a result of deforestation caused by exploitation of natural resources that includes expanding populations, logging, agriculture, bio-fuel produc-tion, and wildfires. During the period between 2001- and 2011, forest land contributed 63% of the global emis-sions from forest and other land use (Fig 7). The greatest overall loss in forest area and concomitant contribu-tion to emissions occurred in Latin America and the Caribbean, followed closely by in Africa. A country like China that has been witnessing rapid growth in the production of manu-factured goods in last decades has shown increasing consumption of
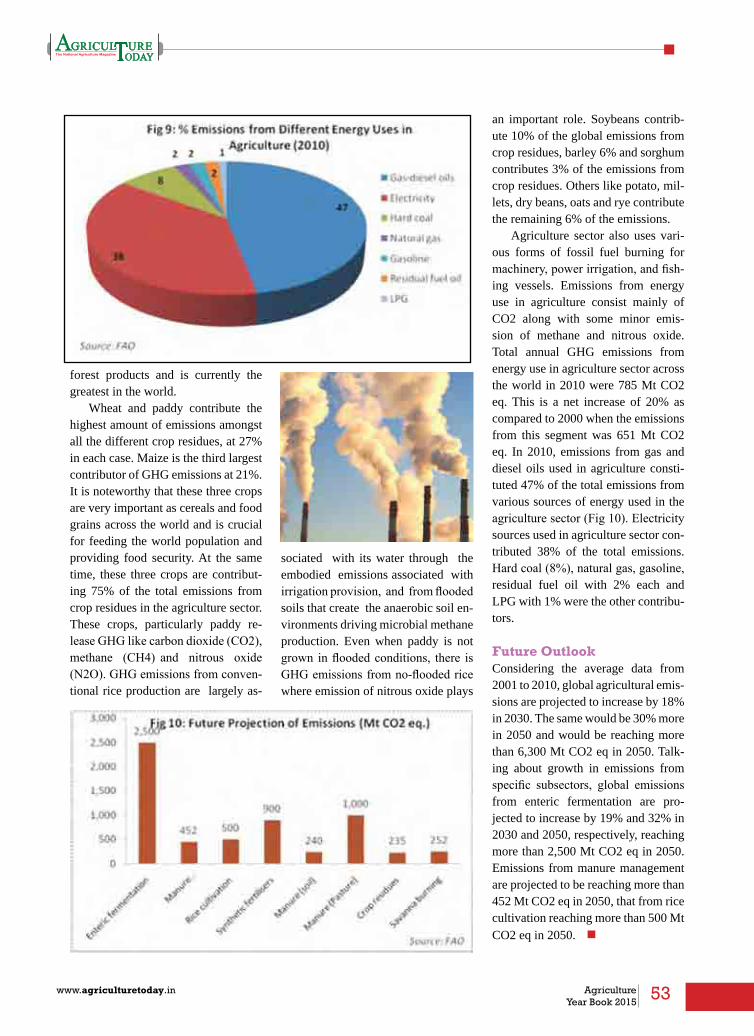
53www.agriculturetoday.in Agriculture Year Book 2015
forest products and is currently the greatest in the world.
Wheat and paddy contribute the highest amount of emissions amongst all the different crop residues, at 27% in each case. Maize is the third largest contributor of GHG emissions at 21%. It is noteworthy that these three crops are very important as cereals and food grains across the world and is crucial for feeding the world population and providing food security. At the same time, these three crops are contribut-ing 75% of the total emissions from crop residues in the agriculture sector. These crops, particularly paddy re-lease GHG like carbon dioxide (CO2), methane (CH4) and nitrous oxide (N2O). GHG emissions from conven-tional rice production are largely as-
sociated with its water through the embodied emissions associated with irrigation provision, and from flooded soils that create the anaerobic soil en-vironments driving microbial methane production. Even when paddy is not grown in flooded conditions, there is GHG emissions from no-flooded rice where emission of nitrous oxide plays
an important role. Soybeans contrib-ute 10% of the global emissions from crop residues, barley 6% and sorghum contributes 3% of the emissions from crop residues. Others like potato, mil-lets, dry beans, oats and rye contribute the remaining 6% of the emissions.
Agriculture sector also uses vari-ous forms of fossil fuel burning for machinery, power irrigation, and fish-ing vessels. Emissions from energy use in agriculture consist mainly of CO2 along with some minor emis-sion of methane and nitrous oxide. Total annual GHG emissions from energy use in agriculture sector across the world in 2010 were 785 Mt CO2 eq. This is a net increase of 20% as compared to 2000 when the emissions from this segment was 651 Mt CO2 eq. In 2010, emissions from gas and diesel oils used in agriculture consti-tuted 47% of the total emissions from various sources of energy used in the agriculture sector (Fig 10). Electricity sources used in agriculture sector con-tributed 38% of the total emissions. Hard coal (8%), natural gas, gasoline, residual fuel oil with 2% each and LPG with 1% were the other contribu-tors.
Future OutlookConsidering the average data from 2001 to 2010, global agricultural emis-sions are projected to increase by 18% in 2030. The same would be 30% more in 2050 and would be reaching more than 6,300 Mt CO2 eq in 2050. Talk-ing about growth in emissions from specific subsectors, global emissions from enteric fermentation are pro-jected to increase by 19% and 32% in 2030 and 2050, respectively, reaching more than 2,500 Mt CO2 eq in 2050. Emissions from manure management are projected to be reaching more than 452 Mt CO2 eq in 2050, that from rice cultivation reaching more than 500 Mt CO2 eq in 2050. n

54 Agriculture Year Book 2015
www.agriculturetoday.in
Organic Farming
Organic Agriculture has assumed an increased momentum across the world. In 2013, total value of organic
products sold globally was USD 72 billion, maintaining a growth rate of over 10 percent annually. In the cur-rent global scenario of climate change, rapid loss of biodiversity and the huge challenges on sustainable agriculture, the philosophy of organic food pro-duction assumes a great deal of sig-nificance. Essentially, organic farming maintains the principles of biodiver-sity, ecological balance, sustainability, natural plant fertilization, natural pest management and soil integrity. All these principles are indispensible in today’s world where human existence is being challenged by irresponsible and unsustainable practices related to environment and agriculture.
Globally, land under organic farm-ing in 2013 was 43.1 million hect-ares. Australia is leading the organic farming movement in the world and till 2013, it had 17 million hectares of land under organic farming. This is 39% of the total global area under organic farming and is way ahead of the second largest country Argentina in terms of area under organic cultiva-tion. In 2013, Argentina had 3 million hectares of land under organic culti-
vation. USA and China are the other major organic farming countries with about 2 million hectares each under its cultivation. India is fast emerging as an important country in the global map of organic cultivation and in 2013, the country had about 0.7 mil-lion hectares of land under organic cultivation. When compared to 2012, the global area under organic cultiva-tion has increased by almost 6 million hectares which was largely as a result of a huge increase of about 6 million hectares between 2012 and 2013 in Australia.
In terms of different geogra-phies, Oceania region has the largest share with 40% of the total global organic farming in 2013, largely due to the huge acreage in Australia (Fig 2). Oceania region had 17.3 million hectares of land under organic farm-ing in the year under consideration. European region had a share of 27% of the organic area in the world with 11.5 million hectares of land under its cultivation in 2013. Latin American countries together had a share of 15% of the global organic cultivation with 6.6 million hectares of land. Asia and

55www.agriculturetoday.in Agriculture Year Book 2015
Northern America shared 8% and 7% of the total global area under organic farming in 2013. While Asia had 3.4 million hectares of land under its cul-tivation, Northern American countries together shared 3 million hectares. In terms of share of the total agricultural land under organic farming, currently about one percent of the total agricul-tural land is under organic farming on a global scale. The highest share of or-ganic farming area with respect to the total agricultural land is in Oceania with 4.1% share. Europe has 2.4% of the total agricultural land available in this region under organic cultivation. However, there is a large disparity within the European region amongst various countries in terms of percent-
age share of organic area out of the total agricultural area. While some of the European countries have low-
er percentage of area, countries like Falkland Islands (36.3% of total ag-ricultural area under organic), Liech-tenstein (31% of total agricultural area under organic), Austria (19.5% of total agricultural area under organic) etc. have considerable area under organic cultivation with respect to the total area under farming in these countries.
Fig 3 provides a status of area under organic cultivation in some of the major organic growing states in India. Madhya Pradesh is the largest organic state in the country with 233 thousand hectares of land under cer-tified organic cultivation in 2013-14. This is 33% of the total area under organic cultivation in the country in 2013-14. Maharashtra emerged as the second largest organic farming state in the country with 85 thousand hectares. 66 thousand hectares and 61 thousand hectares of land were under organic farming in the states of Rajasthan and Sikkim respectively. Sikkim has drawn up elaborate plans and schemes for promoting organic agriculture in the state in the recent years. The other important organic farming states are Gujarat (47000 ha), Karnataka (31000 ha), Odisha (50000 ha), Uttar Pradesh (45000 ha) and Uttaranchal (25000 ha).

56 Agriculture Year Book 2015
www.agriculturetoday.in
Many farmers in India are shifting to organic farming sensing the grow-ing opportunity in domestic and in-ternational demand for organic food. Moreover, stringent standards for non-organic food in European and US markets along with rejection of many Indian food consignments in the recent past is motivating many farmers to shift to organic farm-ing and take advantage of a better alternative to chemical farming. In 2013, India had the highest number of organic producers in the world with about 650000 farmers practic-ing organic farming. However, the future would expect proportionate increase in area under organic farm-ing in the country. At a time when rampant use of chemical fertilisers and inorganic pesticides is making the soil weaker and adversely im-pacting the environment apart from causing direct health issues for hu-man beings, more and more farm-ers turning to organic cultivation is a welcome sign. There has been a lot of focus from the government for encouraging organic cultivation in India and the results are encour-aging. On one hand, government is promoting organic farming from a market perspective and on the other hand, by encouraging natural farm-ing techniques, government is try-ing to reverse the effects of decades of unrestrictive and erratic use of pesticides and chemical fertilizers in water and soil.Government is promoting organic farming through various schemes/ programmes under National Mission for Sustainable Agriculture (NMSA)/ Paramapragat Krishi Vikas Yojana (PKVY), Rash-triya Krishi Vikas Yojana (RKVY), Mission for Integrated Development of Horticulture (MIDH), National Mission on Oilseeds & Oil Palm (NMOOP), Network Project on Or-ganic Farming of ICAR.
Table 1: list of Major Crops Coming under Organic Cultivation in Different States
State Major crops under organic farming
Arunachal Pradesh Maize/sorghum, Pulses, oilseeds, tea/coffee, herbal/medicinal plants
Andhra Pradesh Cotton, maize, pulses, oilseeds, fruits and vegetables
Assam Tea/coffee, fruits and vegetables
Chhattisgarh Rice, wheat, vegetables
Delhi Wheat, vegetables
Goa Fruits, vegetables
Gujarat Cotton, pulses, oilseeds, vegetables
Haryana Basmati rice, wheat, maize, vegetables
Himachal Pradesh Wheat, fruits, vegetables
Jammu and Kashmir Spices, fruits and vegetables
Karnataka Cotton, rainfed wheat, maize, sorghum, pulses, oilseeds, vegetables
Kerala Spices, vegetables, herbals
Manipur Spices, vegetables, herbals
Maharashtra Cotton, rice, wheat, pulses, oilseeds, spices, vegetables
Madhya Pradesh Soybean, wheat, vegetables
Meghalaya Spices, vegetables
Punjab Basmati rice, wheat, vegetables
Sikkim Maize, sorghum, vegetables, spices, herbs
Rajasthan Cotton, wheat, seed spices, vegetables
Tamil Nadu Tea, herbs, spices
Uttar Pradesh Rice, wheat, maize, vegetables
Uttarakhand Basmati rice, vegetables, maize, sorghum, herbs, spices
West Bengal Tea and vegetables
Special Focus on North East India for Organic CultivationVery recently, Government of India through the Ministry for Development of North Eastern Region has embarked upon an ambitious plan worth Rs 125 crore to convert the region into a hub of organic farming in India. States like Sikkim and Mizoram are emerging as the prominent states in the country in organic farming. Other north eastern states like Meghalaya is gradually do-ing away with chemical fertilisers and pesticides and providing free bio-pes-
ticides and bio-agents to farmers. The advantage with north eastern region in terms of organic farming is that this region has been naturally organic for ages and it’s only in the recent years that chemical fertilisers and pesticides have found their way into the farming system of the region. States like Sik-kim were traditionally organic, and adopting organic farming in the state would benefit not only the 62,000 farming families of the state who own an average of 1.9 hectares of farm-land, but also maintain the quality of environment of the state. n
57www.agriculturetoday.in Agriculture Year Book 2015

58 Agriculture Year Book 2015
www.agriculturetoday.in
ICT - BASED PEST MANAGEMENT FOR SUSTAINABlE AGRICUlTURE
Integrated Pest Management is knowl-edge intensive, requires holistic approach, expert advice, well-timed decision making and fast track actions. Prevention of envi-ronmental toxicity due to pesticides and
development of resistance in pests are the prime reasons behind IPM adoption. Globally IPM has been acknowledged as a desirable approach for pest control even if it has not been adopted so widely. Reason being, IPM is an information-intensive, site-specific, multi-tactic approach to pest control. Rates and levels of adoption of IPM are determined by the resultant interplay of re-gional players, their experience, influenced by promotional efforts of the agrochemical indus-try, moderated by public educational, outreach efforts and availability of extension support. In contrast to the rapid adoption of chemical pesticide technology worldwide, adoption of a newly developed IPM approach or technology has already taken enough years. Due to differ-ences in climate, pests, soil, variety and other factors, a well-developed IPM programme for a crop in a particular location may not neces-sarily work well in another situation. Farmers need site-specific information. Generally, they
have to work with local IPM information provid-ers (research and extension specialists, NGO’s, private consultants) to acquire the information and knowledge necessary for developing an IPM program suited to their needs. Today farm-ers need variety of information for pest man-agement from the research, public and private institutions. Thus, IPM is a diffuse technology not amenable to generalized prescriptions. De-cisions must be made at the local, or at best, at the regional level.
Modern agriculture witnesses pressures of both increased need of productivity as well as higher stresses caused by plant pests under changing climate. Information and Communi-cation Technology (ICT) can act as an accelerat-ing force behind the productivity of agriculture. Knowledge is a useful resource and if backed by adequate technological infrastructure and appropriate strategies, it can become a trans-formational factor for overall development of agriculture. Agricultural extension is an essen-tial mechanism for delivery of knowledge and advice as an input for modern farming. The need is to shift focus from delivery of technol-ogy to transfer of knowledge and information.
C. Chattopadhyay,Director;
n. Singh, Scientist; and A. Birah Sr. Scientist
ICAR - National Research Centre
for Integrated Pest Management, Pusa
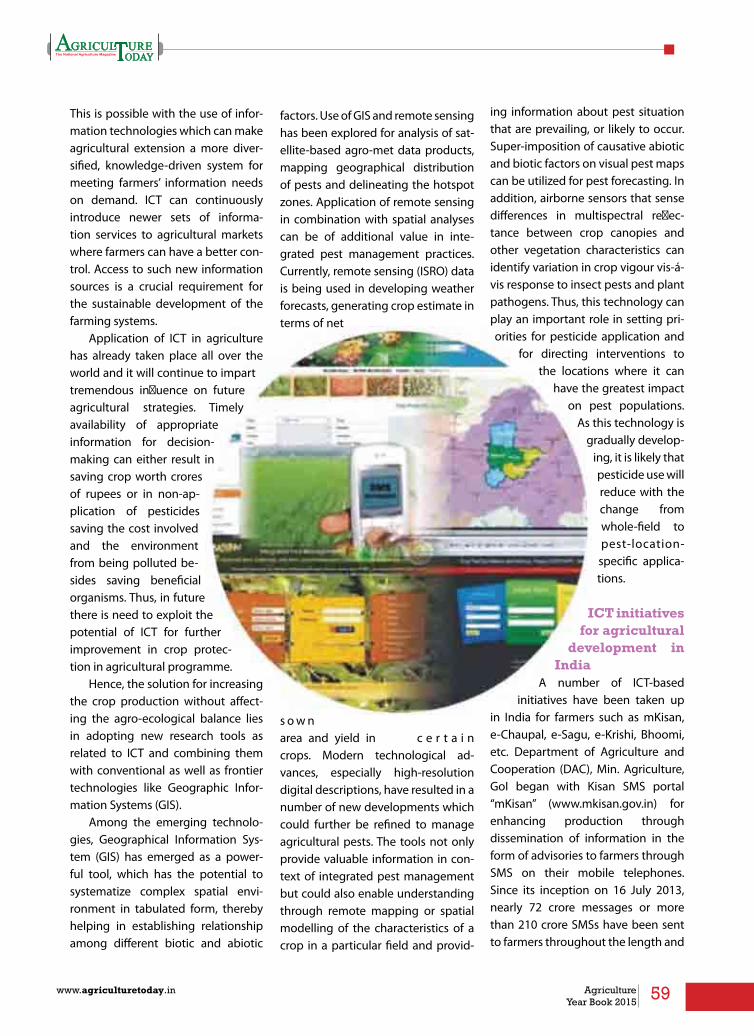
59www.agriculturetoday.in Agriculture Year Book 2015
This is possible with the use of infor-mation technologies which can make agricultural extension a more diver-sified, knowledge-driven system for meeting farmers’ information needs on demand. ICT can continuously introduce newer sets of informa-tion services to agricultural markets where farmers can have a better con-trol. Access to such new information sources is a crucial requirement for the sustainable development of the farming systems.
Application of ICT in agriculture has already taken place all over the world and it will continue to impart tremendous influence on future agricultural strategies. Timely availability of appropriate information for decision-making can either result in saving crop worth crores of rupees or in non-ap-plication of pesticides saving the cost involved and the environment from being polluted be-sides saving beneficial organisms. Thus, in future there is need to exploit the potential of ICT for further improvement in crop protec-tion in agricultural programme.
Hence, the solution for increasing the crop production without affect-ing the agro-ecological balance lies in adopting new research tools as related to ICT and combining them with conventional as well as frontier technologies like Geographic Infor-mation Systems (GIS).
Among the emerging technolo-gies, Geographical Information Sys-tem (GIS) has emerged as a power-ful tool, which has the potential to systematize complex spatial envi-ronment in tabulated form, thereby helping in establishing relationship among different biotic and abiotic
factors. Use of GIS and remote sensing has been explored for analysis of sat-ellite-based agro-met data products, mapping geographical distribution of pests and delineating the hotspot zones. Application of remote sensing in combination with spatial analyses can be of additional value in inte-grated pest management practices. Currently, remote sensing (ISRO) data is being used in developing weather forecasts, generating crop estimate in terms of net
s o w n area and yield in c e r t a i n crops. Modern technological ad-vances, especially high-resolution digital descriptions, have resulted in a number of new developments which could further be refined to manage agricultural pests. The tools not only provide valuable information in con-text of integrated pest management but could also enable understanding through remote mapping or spatial modelling of the characteristics of a crop in a particular field and provid-
ing information about pest situation that are prevailing, or likely to occur. Super-imposition of causative abiotic and biotic factors on visual pest maps can be utilized for pest forecasting. In addition, airborne sensors that sense differences in multispectral reflec-tance between crop canopies and other vegetation characteristics can identify variation in crop vigour vis-á-vis response to insect pests and plant pathogens. Thus, this technology can play an important role in setting pri-orities for pesticide application and
for directing interventions to the locations where it can
have the greatest impact on pest populations.
As this technology is gradually develop-
ing, it is likely that pesticide use will reduce with the change from whole-field to pest-location-specific applica-tions.
ICT initiatives for agricultural
development in India
A number of ICT-based initiatives have been taken up
in India for farmers such as mKisan, e-Chaupal, e-Sagu, e-Krishi, Bhoomi, etc. Department of Agriculture and Cooperation (DAC), Min. Agriculture, GoI began with Kisan SMS portal “mKisan” (www.mkisan.gov.in) for enhancing production through dissemination of information in the form of advisories to farmers through SMS on their mobile telephones. Since its inception on 16 July 2013, nearly 72 crore messages or more than 210 crore SMSs have been sent to farmers throughout the length and
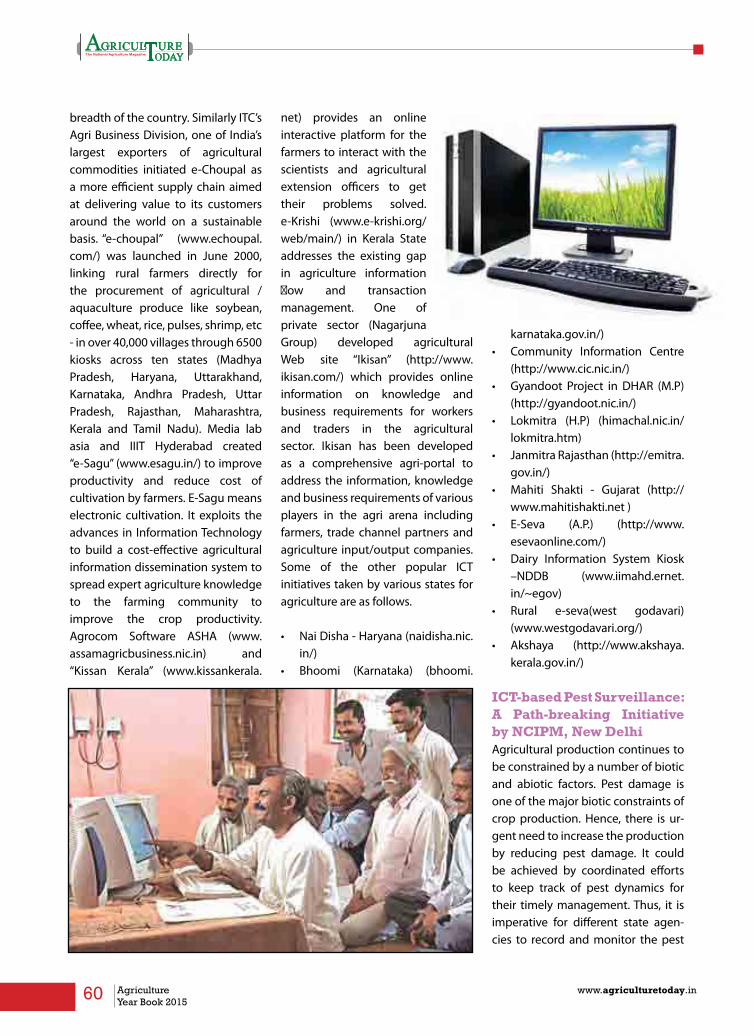
60 Agriculture Year Book 2015
www.agriculturetoday.in
breadth of the country. Similarly ITC’s Agri Business Division, one of India’s largest exporters of agricultural commodities initiated e-Choupal as a more efficient supply chain aimed at delivering value to its customers around the world on a sustainable basis. “e-choupal” (www.echoupal.com/) was launched in June 2000, linking rural farmers directly for the procurement of agricultural / aquaculture produce like soybean, coffee, wheat, rice, pulses, shrimp, etc - in over 40,000 villages through 6500 kiosks across ten states (Madhya Pradesh, Haryana, Uttarakhand, Karnataka, Andhra Pradesh, Uttar Pradesh, Rajasthan, Maharashtra, Kerala and Tamil Nadu). Media lab asia and IIIT Hyderabad created “e-Sagu” (www.esagu.in/) to improve productivity and reduce cost of cultivation by farmers. E-Sagu means electronic cultivation. It exploits the advances in Information Technology to build a cost-effective agricultural information dissemination system to spread expert agriculture knowledge to the farming community to improve the crop productivity. Agrocom Software ASHA (www.assamagricbusiness.nic.in) and “Kissan Kerala” (www.kissankerala.
net) provides an online interactive platform for the farmers to interact with the scientists and agricultural extension officers to get their problems solved. e-Krishi (www.e-krishi.org/web/main/) in Kerala State addresses the existing gap in agriculture information flow and transaction management. One of private sector (Nagarjuna Group) developed agricultural Web site “Ikisan” (http://www.ikisan.com/) which provides online information on knowledge and business requirements for workers and traders in the agricultural sector. Ikisan has been developed as a comprehensive agri-portal to address the information, knowledge and business requirements of various players in the agri arena including farmers, trade channel partners and agriculture input/output companies. Some of the other popular ICT initiatives taken by various states for agriculture are as follows.
• NaiDisha-Haryana(naidisha.nic.in/)
• Bhoomi (Karnataka) (bhoomi.
karnataka.gov.in/)• Community Information Centre
(http://www.cic.nic.in/)• Gyandoot Project in DHAR (M.P)
(http://gyandoot.nic.in/)• Lokmitra (H.P) (himachal.nic.in/
lokmitra.htm)• JanmitraRajasthan(http://emitra.
gov.in/) • Mahiti Shakti - Gujarat (http://
www.mahitishakti.net )• E-Seva (A.P.) (http://www.
esevaonline.com/) • Dairy Information System Kiosk
–NDDB (www.iimahd.ernet.in/~egov)
• Rural e-seva(west godavari)(www.westgodavari.org/)
• Akshaya (http://www.akshaya.kerala.gov.in/)
ICT-based Pest Surveillance: A Path-breaking Initiative by NCIPM, New DelhiAgricultural production continues to be constrained by a number of biotic and abiotic factors. Pest damage is one of the major biotic constraints of crop production. Hence, there is ur-gent need to increase the production by reducing pest damage. It could be achieved by coordinated efforts to keep track of pest dynamics for their timely management. Thus, it is imperative for different state agen-cies to record and monitor the pest
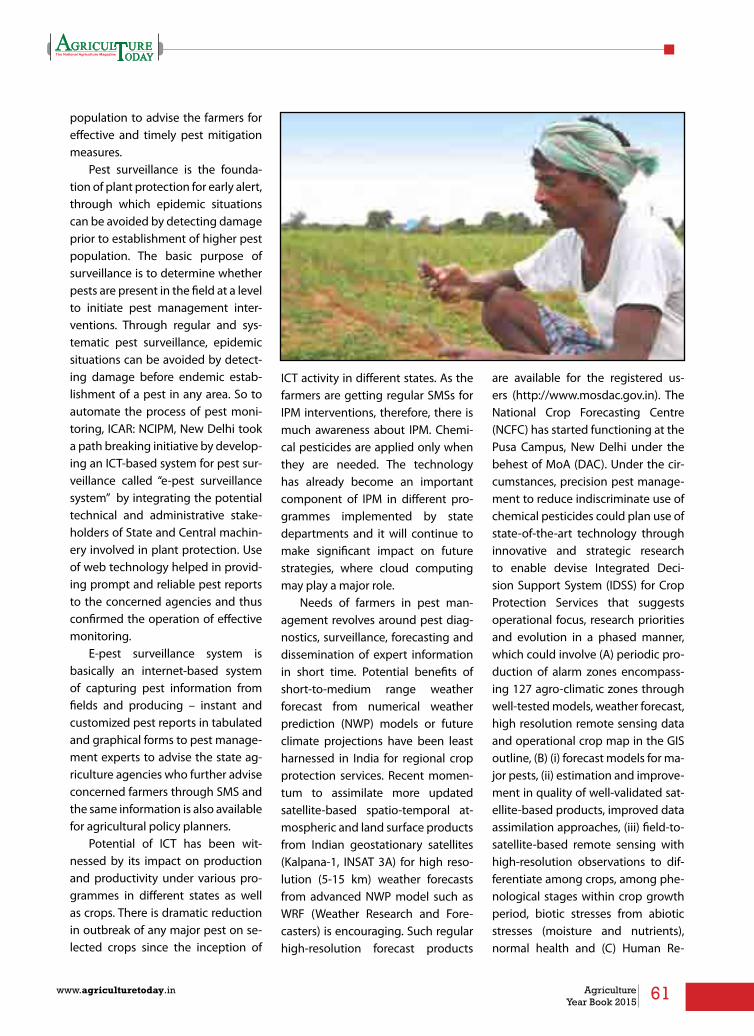
61www.agriculturetoday.in Agriculture Year Book 2015
population to advise the farmers for effective and timely pest mitigation measures.
Pest surveillance is the founda-tion of plant protection for early alert, through which epidemic situations can be avoided by detecting damage prior to establishment of higher pest population. The basic purpose of surveillance is to determine whether pests are present in the field at a level to initiate pest management inter-ventions. Through regular and sys-tematic pest surveillance, epidemic situations can be avoided by detect-ing damage before endemic estab-lishment of a pest in any area. So to automate the process of pest moni-toring, ICAR: NCIPM, New Delhi took a path breaking initiative by develop-ing an ICT-based system for pest sur-veillance called “e-pest surveillance system” by integrating the potential technical and administrative stake-holders of State and Central machin-ery involved in plant protection. Use of web technology helped in provid-ing prompt and reliable pest reports to the concerned agencies and thus confirmed the operation of effective monitoring.
E-pest surveillance system is basically an internet-based system of capturing pest information from fields and producing – instant and customized pest reports in tabulated and graphical forms to pest manage-ment experts to advise the state ag-riculture agencies who further advise concerned farmers through SMS and the same information is also available for agricultural policy planners.
Potential of ICT has been wit-nessed by its impact on production and productivity under various pro-grammes in different states as well as crops. There is dramatic reduction in outbreak of any major pest on se-lected crops since the inception of
ICT activity in different states. As the farmers are getting regular SMSs for IPM interventions, therefore, there is much awareness about IPM. Chemi-cal pesticides are applied only when they are needed. The technology has already become an important component of IPM in different pro-grammes implemented by state departments and it will continue to make significant impact on future strategies, where cloud computing may play a major role.
Needs of farmers in pest man-agement revolves around pest diag-nostics, surveillance, forecasting and dissemination of expert information in short time. Potential benefits of short-to-medium range weather forecast from numerical weather prediction (NWP) models or future climate projections have been least harnessed in India for regional crop protection services. Recent momen-tum to assimilate more updated satellite-based spatio-temporal at-mospheric and land surface products from Indian geostationary satellites (Kalpana-1, INSAT 3A) for high reso-lution (5-15 km) weather forecasts from advanced NWP model such as WRF (Weather Research and Fore-casters) is encouraging. Such regular high-resolution forecast products
are available for the registered us-ers (http://www.mosdac.gov.in). The National Crop Forecasting Centre (NCFC) has started functioning at the Pusa Campus, New Delhi under the behest of MoA (DAC). Under the cir-cumstances, precision pest manage-ment to reduce indiscriminate use of chemical pesticides could plan use of state-of-the-art technology through innovative and strategic research to enable devise Integrated Deci-sion Support System (IDSS) for Crop Protection Services that suggests operational focus, research priorities and evolution in a phased manner, which could involve (A) periodic pro-duction of alarm zones encompass-ing 127 agro-climatic zones through well-tested models, weather forecast, high resolution remote sensing data and operational crop map in the GIS outline, (B) (i) forecast models for ma-jor pests, (ii) estimation and improve-ment in quality of well-validated sat-ellite-based products, improved data assimilation approaches, (iii) field-to-satellite-based remote sensing with high-resolution observations to dif-ferentiate among crops, among phe-nological stages within crop growth period, biotic stresses from abiotic stresses (moisture and nutrients), normal health and (C) Human Re-
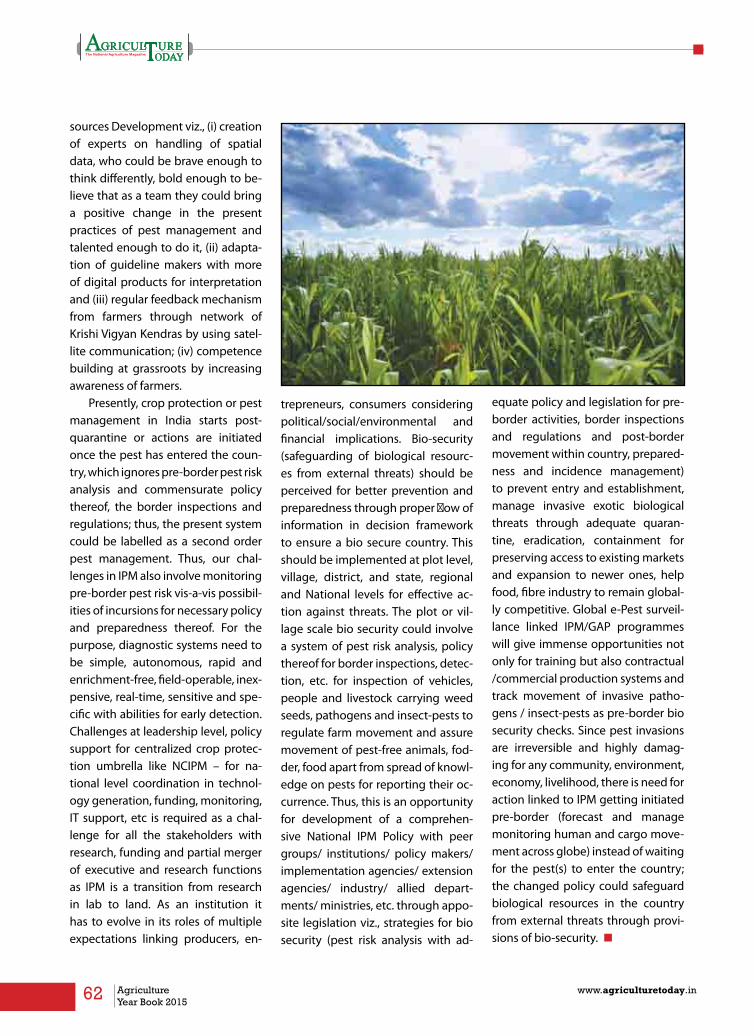
62 Agriculture Year Book 2015
www.agriculturetoday.in
sources Development viz., (i) creation of experts on handling of spatial data, who could be brave enough to think differently, bold enough to be-lieve that as a team they could bring a positive change in the present practices of pest management and talented enough to do it, (ii) adapta-tion of guideline makers with more of digital products for interpretation and (iii) regular feedback mechanism from farmers through network of Krishi Vigyan Kendras by using satel-lite communication; (iv) competence building at grassroots by increasing awareness of farmers.
Presently, crop protection or pest management in India starts post-quarantine or actions are initiated once the pest has entered the coun-try, which ignores pre-border pest risk analysis and commensurate policy thereof, the border inspections and regulations; thus, the present system could be labelled as a second order pest management. Thus, our chal-lenges in IPM also involve monitoring pre-border pest risk vis-a-vis possibil-ities of incursions for necessary policy and preparedness thereof. For the purpose, diagnostic systems need to be simple, autonomous, rapid and enrichment-free, field-operable, inex-pensive, real-time, sensitive and spe-cific with abilities for early detection. Challenges at leadership level, policy support for centralized crop protec-tion umbrella like NCIPM – for na-tional level coordination in technol-ogy generation, funding, monitoring, IT support, etc is required as a chal-lenge for all the stakeholders with research, funding and partial merger of executive and research functions as IPM is a transition from research in lab to land. As an institution it has to evolve in its roles of multiple expectations linking producers, en-
trepreneurs, consumers considering political/social/environmental and financial implications. Bio-security (safeguarding of biological resourc-es from external threats) should be perceived for better prevention and preparedness through proper flow of information in decision framework to ensure a bio secure country. This should be implemented at plot level, village, district, and state, regional and National levels for effective ac-tion against threats. The plot or vil-lage scale bio security could involve a system of pest risk analysis, policy thereof for border inspections, detec-tion, etc. for inspection of vehicles, people and livestock carrying weed seeds, pathogens and insect-pests to regulate farm movement and assure movement of pest-free animals, fod-der, food apart from spread of knowl-edge on pests for reporting their oc-currence. Thus, this is an opportunity for development of a comprehen-sive National IPM Policy with peer groups/ institutions/ policy makers/ implementation agencies/ extension agencies/ industry/ allied depart-ments/ ministries, etc. through appo-site legislation viz., strategies for bio security (pest risk analysis with ad-
equate policy and legislation for pre-border activities, border inspections and regulations and post-border movement within country, prepared-ness and incidence management) to prevent entry and establishment, manage invasive exotic biological threats through adequate quaran-tine, eradication, containment for preserving access to existing markets and expansion to newer ones, help food, fibre industry to remain global-ly competitive. Global e-Pest surveil-lance linked IPM/GAP programmes will give immense opportunities not only for training but also contractual /commercial production systems and track movement of invasive patho-gens / insect-pests as pre-border bio security checks. Since pest invasions are irreversible and highly damag-ing for any community, environment, economy, livelihood, there is need for action linked to IPM getting initiated pre-border (forecast and manage monitoring human and cargo move-ment across globe) instead of waiting for the pest(s) to enter the country; the changed policy could safeguard biological resources in the country from external threats through provi-sions of bio-security. n

63www.agriculturetoday.in Agriculture Year Book 2015
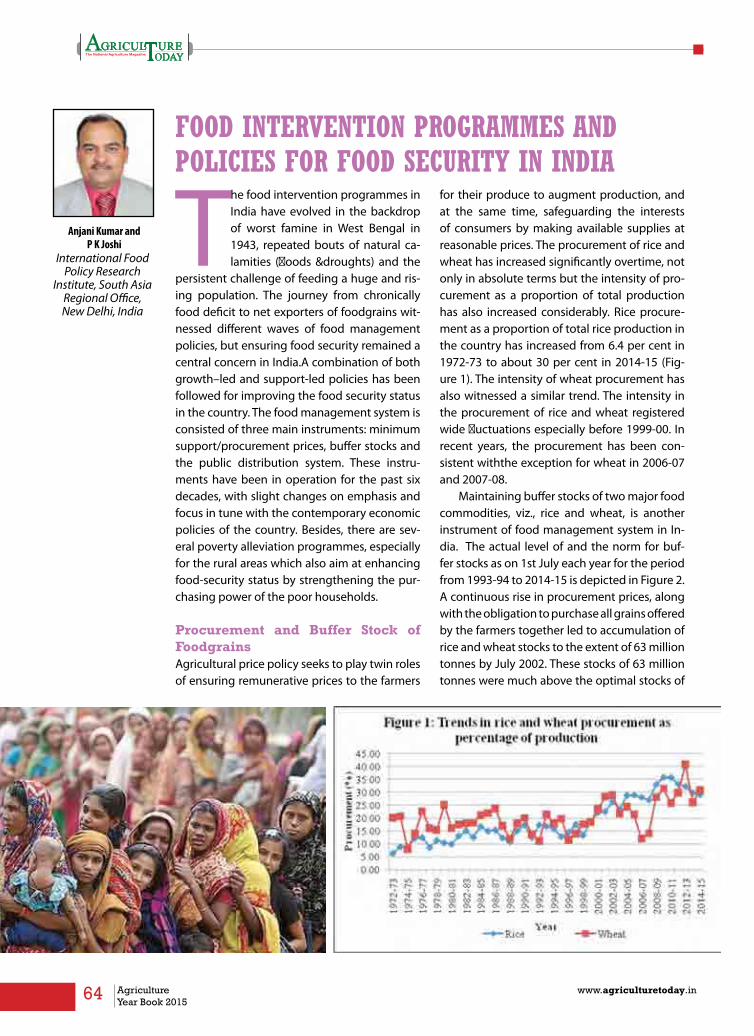
64 Agriculture Year Book 2015
www.agriculturetoday.in
FOOD INTERVENTION PROGRAMMES AND POLICIES FOR FOOD SECURITY IN INDIA
The food intervention programmes in India have evolved in the backdrop of worst famine in West Bengal in 1943, repeated bouts of natural ca-lamities (floods &droughts) and the
persistent challenge of feeding a huge and ris-ing population. The journey from chronically food deficit to net exporters of foodgrains wit-nessed different waves of food management policies, but ensuring food security remained a central concern in India.A combination of both growth–led and support-led policies has been followed for improving the food security status in the country. The food management system is consisted of three main instruments: minimum support/procurement prices, buffer stocks and the public distribution system. These instru-ments have been in operation for the past six decades, with slight changes on emphasis and focus in tune with the contemporary economic policies of the country. Besides, there are sev-eral poverty alleviation programmes, especially for the rural areas which also aim at enhancing food-security status by strengthening the pur-chasing power of the poor households.
Procurement and Buffer Stock of FoodgrainsAgricultural price policy seeks to play twin roles of ensuring remunerative prices to the farmers
for their produce to augment production, and at the same time, safeguarding the interests of consumers by making available supplies at reasonable prices. The procurement of rice and wheat has increased significantly overtime, not only in absolute terms but the intensity of pro-curement as a proportion of total production has also increased considerably. Rice procure-ment as a proportion of total rice production in the country has increased from 6.4 per cent in 1972-73 to about 30 per cent in 2014-15 (Fig-ure 1). The intensity of wheat procurement has also witnessed a similar trend. The intensity in the procurement of rice and wheat registered wide fluctuations especially before 1999-00. In recent years, the procurement has been con-sistent withthe exception for wheat in 2006-07 and 2007-08.
Maintaining buffer stocks of two major food commodities, viz., rice and wheat, is another instrument of food management system in In-dia. The actual level of and the norm for buf-fer stocks as on 1st July each year for the period from 1993-94 to 2014-15 is depicted in Figure 2. A continuous rise in procurement prices, along with the obligation to purchase all grains offered by the farmers together led to accumulation of rice and wheat stocks to the extent of 63 million tonnes by July 2002. These stocks of 63 million tonnes were much above the optimal stocks of
Anjani Kumar and P K Joshi
International Food Policy Research
Institute, South Asia Regional Office,New Delhi, India

65www.agriculturetoday.in Agriculture Year Book 2015
24.3 million tonnes. The drought in 2003 caused a reduction in the food stocks which continued to decline till 2006. In fact, the actual buffer stocks in 2006 and 2007 were below the norm and the country had to import wheat during 2006-08. However, the foodgrain stocks accumulated once again in 2008 and 2009 and became higher than the norm. Presently, the government has more than 63mil-lion tonnes of foodgrains in its stock, which is much in excess of the norm, and pose high economic costs. Man-agement of such huge stocks and avoiding wastage is a big challenge before the government. Burgeoning food subsidies has put a question mark on the rationality of maintaining such a huge stock. However, in view of the proposed enactment of Na-tional Food Security Act (NFSA), the higher stocks of foodgrains will have to be maintained and management strategies will have to be evolved to reduce the economic cost.
Functioning of Minimum Support PricesMinimum support price is the basic pillar for food management policies in India. Minimum support prices are announced for a number of agricul-tural commodities (24) and the MSP intends to give signal to farmers for
allocation of their resources for cul-tivation. However, the procurement at MSP is confined mainly to rice and wheat among foodgrains and sugarcane and cotton among cash crops. The increasing MSP is often criticized to fuel food inflation in the country. However, the farming com-munity always complains about the
inadequacy of MSP to cover its cost of production. The trends in real MSP reveal that the increase in MSP has been modest in real terms with vary-ing trends during 1980s, 1990s and 2000s (Figure 2 and Table 1).
Public Distribution SystemPublic distribution system (PDS)is the most important intervention made by the Government of India towards ensuring food security. Although objectives and working of PDS un-derwent significant changes since its inceptions; it essentially continues to remain a food intervention pro-gramme. The Food Corporation of India procures foodgrains from the farmers at an administered price at harvest time and then ensures avail-ability of these commodities to con-sumers at subsidized prices by allo-cating foodgrains to different states, who in turn manage their respective
PDS. The proportion of foodgrains accessed through PDS in the total household consumption provides a snapshot of the role and effectiveness of PDS in ensuring food security in the country. The role of PDS in meet-ing the consumption re-quirement of households

66 Agriculture Year Book 2015
www.agriculturetoday.in
has increased over time. Outreach of PDS increased from 27.3 per cent in 1993-94 to 44.8 per cent in 2011-12 (Table 3). Similarly, the share of PDS in cereal con-sumption wentup from 8.5 per cent in 1993-94 to 19.7 per cent in 2011-12. Though the contribution of PDS in cereal consumption increased in most of the states, the share of PDS in the cereal depicts wide inter-state variations.The PDS contributes one third or more to cereal consumption in Chhattisgarh, Mizoram, Sikkim, Tamil Nadu, Tripura, Himachal Pradesh, Jammu & Kash-mir and Kerala.While, one fourth or more share of PDS in cereal consumption is there in Andhra Pradesh, Ar-unachal Pradesh, Goa, Karnataka, Meghalaya, Odisha and Uttarakhand.
The impressive improvement in beneficiaries’ ac-cess to PDS foodgrains can be attributed to several factors. However, consistent fall in the diversion of PDS foodgrains and the widening divergence between market price and PDS price of foodgrains stand out to be the major factors for expanding the PDS outreach.The divergence between market and PDS prices of rice and wheat has widened and therefore PDS grains have become more lucrative for the people.
Time-period Annual growth rate (%)
Paddy Wheat
1980-81 to 1990-91 0.3 -0.1
1990-91 to 2000-01 0.2 1.2
2000-01 to 2014-15 1.3 0.8
Table 1: Compound Annual Growth Rate of MSP of Paddy and Wheat (real price)
Table 2: Awareness about MSP across states in India, 2013 (%)
Source: Authors’ estimates based on unit level data from NSS
State Paddy Wheat
Andhra Pradesh 11.79 0.00
Arunachal Pradesh 18.49 0.44
Assam 5.15 0.02
Bihar 23.44 22.21
Chhattisgarh 58.00 0.25
Goa 7.20 0.00
Gujarat 0.71 1.19
Haryana 17.84 32.53
Himachal Pradesh 1.20 2.98
Jammu & Kashmir 5.54 7.64
Jharkhand 8.18 1.93
Karnataka 7.69 0.32
Kerala 7.99 0.00
Madhya Pradesh 7.15 38.32
Maharashtra 1.30 0.85
Manipur 0.30 0.00
Meghalaya 1.25 0.00
Mizoram 0.13 0.00
Nagaland 20.81 0.00
Odisha 41.07 0.00
Pondicherry 21.70 0.00
Punjab 39.81 48.51
Rajasthan 0.11 10.11
Tamil Nadu 11.37 0.00
Telangana 26.83 0.00
Tripura 19.60 0.00
Uttar Pradesh 14.11 18.24
Uttaranchal 7.78 9.95
West Bengal 34.48 1.24
All India 15.10 10.16
Summing upThe food management policies and instruments in India have stood the test of time. Functioning of these instru-ments have also improved overtime. However, the time has come to revisit these instruments to make them broad-based. Also, the alternative methods like direct transfer of benefits instead of PDS, involvement of private sector in procurement of foodgrains etc. need to be tried. n

67www.agriculturetoday.in Agriculture Year Book 2015
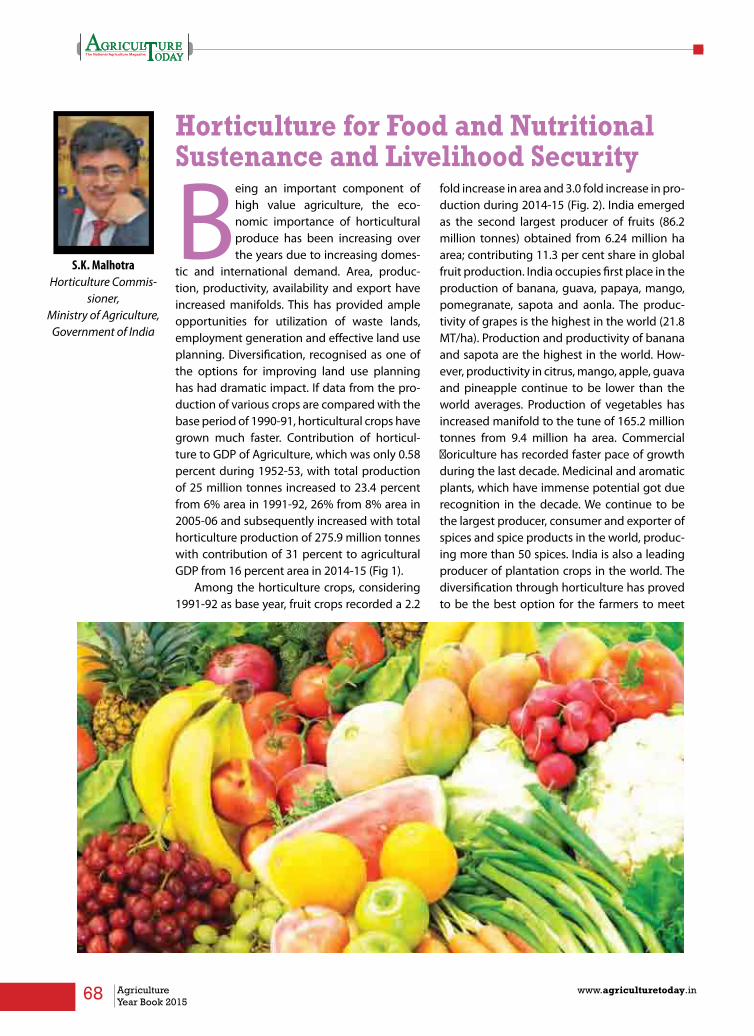
68 Agriculture Year Book 2015
www.agriculturetoday.in
Horticulture for Food and Nutritional Sustenance and livelihood Security
Being an important component of high value agriculture, the eco-nomic importance of horticultural produce has been increasing over the years due to increasing domes-
tic and international demand. Area, produc-tion, productivity, availability and export have increased manifolds. This has provided ample opportunities for utilization of waste lands, employment generation and effective land use planning. Diversification, recognised as one of the options for improving land use planning has had dramatic impact. If data from the pro-duction of various crops are compared with the base period of 1990-91, horticultural crops have grown much faster. Contribution of horticul-ture to GDP of Agriculture, which was only 0.58 percent during 1952-53, with total production of 25 million tonnes increased to 23.4 percent from 6% area in 1991-92, 26% from 8% area in 2005-06 and subsequently increased with total horticulture production of 275.9 million tonnes with contribution of 31 percent to agricultural GDP from 16 percent area in 2014-15 (Fig 1).
Among the horticulture crops, considering 1991-92 as base year, fruit crops recorded a 2.2
fold increase in area and 3.0 fold increase in pro-duction during 2014-15 (Fig. 2). India emerged as the second largest producer of fruits (86.2 million tonnes) obtained from 6.24 million ha area; contributing 11.3 per cent share in global fruit production. India occupies first place in the production of banana, guava, papaya, mango, pomegranate, sapota and aonla. The produc-tivity of grapes is the highest in the world (21.8 MT/ha). Production and productivity of banana and sapota are the highest in the world. How-ever, productivity in citrus, mango, apple, guava and pineapple continue to be lower than the world averages. Production of vegetables has increased manifold to the tune of 165.2 million tonnes from 9.4 million ha area. Commercial floriculture has recorded faster pace of growth during the last decade. Medicinal and aromatic plants, which have immense potential got due recognition in the decade. We continue to be the largest producer, consumer and exporter of spices and spice products in the world, produc-ing more than 50 spices. India is also a leading producer of plantation crops in the world. The diversification through horticulture has proved to be the best option for the farmers to meet
S.K. MalhotraHorticulture Commis-
sioner, Ministry of Agriculture,
Government of India

69www.agriculturetoday.in Agriculture Year Book 2015
the need for food, nutrition, health care besides providing better returns on farm land and employment. Re-sultantly, horticulture has been iden-tified for inclusive growth of agricul-ture sector in the country.
Horticulture for nutrition and health care Health care of people, at large, has been through modern medicine but still in Asia more than 80 percent people depend on herbs. Many of doctors now feel that modern medi-cines brings illness rather than well-ness, and subscribe for balanced diet which protect against many diseases by enhancing self protec-tive mechanism through many im-munological advantages. The fruits (Indian goosberry, bael, jamun, pa-paya), vegetables (carrot, cauliflower, onion, garlic, leafy vegetables), spic-es (ginger, turmeric, black pepper, fenugreek, ajowan) and ornamental plants (ashoka, ficus, catharanthus) protects against various kinds of dis-eases. The spices like turmeric, chil-lies and cumin in the diet have been recognized to protect against cancer. Noni (Morinda citrifolia) with unique characteristics is recognized as best for health care, as it provides protec-tion against various diseases includ-ing HIV. Virgin coconut oil protects from HIV and coconut water provides all nutrients to child apparently. Hor-ticultural crops thus provide ample opportunities for health care. Fruits and vegetable provide wider option for meeting the energy requirement for the human system. Cereals are the main staple food which lacks various minerals and vitamins but to sustain and lead a healthy life, the food we eat should contain a wide range of nutrients in proper proportion i.e. it should be a well balanced diet. The nutrients include proteins, fat, carbo-hydrates, vitamins, fibre and minerals. Each nutrient has a definite function.
No single fruit or vegetable can nour-ish the body with all the vital ingredi-ents it requires. Hence it is important to consume a variety of fruits, vegeta-bles, spices and condiments to derive required nutrition. Horticultural crops meet all the essential requirements for which these crops are rich sources of energy, proteins, vitamins, minerals antioxidants etc.
Food and Nutrition based health protectionWhile fruits and vegetables do not make a significant contribution to macronutrient intake, they make an important contribution to vitamins, minerals and dietary fibre. The le-gumes, especially the seed legumes,
are of major nutritional significance, particularly in the developing world as they are the main source of pro-teins. Rising income levels in devel-oping countries like China, India and Brazil coupled with increase in pro-duction of many foods of plant and animal origin have made food more accessible and affordable.
The philosophy that food can be health promoting beyond its nutri-tional value is gaining acceptance within both the public arena and the scientific community. A balanced diet rich in fresh fruits and vegetables, is the single ‘Mantra’ being propagated world over for healthy living. Fruits yield larger quantities of food per hectare compared to cereals. For ex-
Fig. 1. Trend of horticulture production in India
Fig. 2. Trends in fruits and vegetables production in India
70 Agriculture Year Book 2015
www.agriculturetoday.in
ample paddy yield (max.) is 3 tonnes/ ha whereas it is 22 tonnes/ha in case of banana; 45 tonnes/ha in case of pineapple and 40 tonnes /ha in case of grapes. Much less area is required to obtain the calorific requirement per adult per year (11,00,000 kcal) from growing banana (0.03 hectare) or mango (0.16 hectare) than from growing wheat (0.44 hectare). Hor-ticultural crops in general are poor sources of protein as they contain less than 2% protein. Fruits are a rich source of organic acids like citric acid in citrus fruits and tartaric acid in grapes, which stimulate appetite and help digestion. Papaya contains protein digesting enzymes. Many fruits and vegetables possess laxa-tive property due to the presence of dietary fibre and pectin, which stimu-late intestinal activity.
Due to poverty, micronutrient malnutrition, is posing a threat to vulnerable sections in Asia and the Pacific regions. This is manifested in the form of vitamin A deficiency, iron deficiency anemia and iodine defi-ciency disorders. The first two could be minimized through horticulture intervention and awareness drive. Vegetables and fruits appear to be playing a prominent role in preven-tion of several chronic diseases such as heart disease, cancer, cataract, osteoporosis, diabetes, etc. The ac-tive constituents responsible for this property have been shown to be a number of nutrients, phyto-chemicals and f i b r e . A p a r t from
micronutrient related function, the bioactive phyto-chemicals prevent degenerative processes by antioxi-dant activity. In order to have protec-tive effect, it is necessary to consume 400-600 g of fruits and vegetables ev-ery day. But, the consumption level of fruits is low and widely variable from region to region in India. Fruit consumption level is as low as 1 g/day/person in the states of Manipur and Nagaland to 70 g/day/person in the Union territory of Chandigarh. An increase in the intake of fruits along with vegetables will meet the required daily allowance (RDA) of many nutrients. India with more than 84 million tonnes of fruits and 162 million tonnes of vegetables is the second largest producer of fruits and vegetables in the world. However, per capita consumption of fruits and vegetables in India is only around 80 g and 280 g against a minimum of about 92 g and 300 g respectively recommended by Indian Council of Medical Research and National In-stitute of Nutrition, Hyderabad. With the present level of population, the annual requirement of horticulture
produce will be 320 million tonnes by 2016-17 as against the present level of production 275.9 million tonnes during 2014-15.
Horticultural crops - bioreactors One of the most significant con-tributions of biotechnology is the improvements of nutritional status of horticultural crops. Several nutri-tional traits such as, carbohydrates, proteins, oils, fats, vitamins and ami-no acids constitute the main target of plant biotechnology. A new ap-proach is to increase active compo-nents such as caroteinoids from to-matoes, glucosinolates from Brassica vegetables, phytoestrogenes from soybean and phenolics and anti-oxidants from various plants protect and prevent numerous disease such as cancer and cardiovascular disease. These antioxidants are also associ-ated with slowing the ageing process and improving overall health. Phy-toestrogens from Dioscorea species such as wild yam (Dioscorea villosa) also possess numerous physiological benefits. Some sweet potato variet-ies have anti-diabetic potential. Most of these bioactive components are plant secondary metabolites.
Highly productive crops such as potato, cassava and yams are
easy to grow and can generate considerable
biomass within a short period.
With these features
r e -

71www.agriculturetoday.in Agriculture Year Book 2015
search has been carried out to deter-mine whether transgenic plants of these crops can be exploited for the production of commercial proteins and biochemicals and recombinant biopharmaceuticals such as cytok-ines, hormones, monoclonal anit-bodies, enzymes and vaccines.
Advancement in horticulture production and consumption systemDiversification, market orientation and commercialization are the most important changes noticed in the recent past and have happened by introduction of new crops and variet-ies, increased share of horticulture in the cropping pattern, diversion into processing and export oriented pro-duction of a large number of crops. Several technological innovations have been advanced in the complete value chain involving technology for orchard establishment, availability of true to type planting material, plant architecture engineering and man-agement, mulching, fruit thinning, integrated nutrient management, water management, integrated pest and disease management, post har-vest technology, processing and marketing. The positive changes in horticulture sector have occurred because it has received importance from all the stakeholders, public sec-tor, private sector and farmers during the last decade. This is primarily the result of realization that diversifica-tion to horticultural crops is now the major option to improve livelihood security and health care. Keeping in view the dynamic needs of diverse stakeholders under the National Ag-riculture Research System, the R&D on horticulture has been undertaken by 23 horticulture research institutes/directorates and NRCs, AICRPs and SAUs in several multi-crop and multi-disciplinary institutes and the several
technologies have emerged. Value addition through dehydra-
tion of fruits and vegetables includ-ing freeze drying, dried and pro-cessed fruits, vegetables and spices and fermented products have been developed. Development of new products like juice punches, banana chips and fingers, mango nectar and fruit kernel derived cocoa substi-tute, essential oils from citrus, fruit wines, dehydrated products from grape, pomegranate, mango, apricot and coconut, grape and fruit wines, value-added coconut products like snowball tender coconut, coconut milk powder and pouched tender coconut water (Cocojal) etc. are get-ting popular day by day. Improved blending/ packaging of tea and cof-fee have opened new markets. New products such as tetra pack filled fruit juices are now house hold items.
As food consumption patterns are changing towards more conve-nient foods, the demand for products like pre-packed salads, packed mush-rooms and baby corn frozen vegeta-bles etc. are increasing and are sold in shopping malls. Consumer friendly products like frozen green peas, ready to use salad mixes, vegetable sprouts, ready-to-cook fresh cut vegetables are major retail items, which have already started peeping out of retail
windows. In order to reduce depen-dence on refrigerated storage, low cost eco-friendly cool chamber for on farm storage of fruits and vegetables has been developed. For preventing the post harvest losses proper stor-age, cold preservation, packaging and transport methods with Hazard analysis Critical Control Point norms have to be given more thrust. Stan-dardization of Modified Atmosphere Packaging and Storage systems with greater emphasis on safety (pesticide free), nutrition and quality is getting emphasis.
Mission schemes for food, nutrition and livelihood securityMission for Integrated Develop-ment of Horticulture (MIDH), a Cen-trally Sponsored Scheme has been launched for the holistic growth of the horticulture sector covering fruits, vegetables, root & tuber crops, mushrooms, spices, flowers, aromatic plants, coconut, cashew, cocoa and bamboo. The scheme, which has taken off from 2014-15, integrates the ongoing schemes of National Horticulture Mission (launched 2005-06), Technology Mission for North East (TMNE) (launched 2001-02) later renamed as Horticulture Mis-sion for North East and Himalayan
72 Agriculture Year Book 2015
www.agriculturetoday.in
states (HMNEH) with addition of Hi-malayan states (launched 2002-03) and National Bamboo Mission (NBM) (launched 2006-07). The Central Sec-tor Schemes included in MIDH are National Horticulture Board (NHB), Coconut Development Board (CDB) and Central Institute for Horticulture (CIH), Nagaland. MIDH also works closely with National Mission on Sus-tainable Agriculture (NMSA) towards development of Micro-Irrigation for all horticulture crops and protected cultivation on farmers’ field. MIDH also provides technical advice and administrative support to State Gov-ernments/ State Horticulture Mis-sions (SHMs) for the Saffron Mission and other horticulture related activi-ties like Vegetable Initiative for Urban Clusters (VIUC), funded by Rashtriya Krishi Vikas Yojana (RKVY). Pradhan Mantri Krishi Sinchai Yojna (PMKSY) and Parampragat Krishi Vikas Yojna (PKVY) are the two new schemes being implemented for promotion of agriculture including horticulture
(2015). The Mission (MIDH) is functioning to ad-
dress each seg-ment based on demand and
need based approach for sustenance of food and nutritional security. Tech-nologies such as Information Com-munication Technology (ICT), Remote Sensing and Geographic Informa-tion System are effectively used for planning and monitoring purposes including identification of sites for creating infrastructure facilities for post harvest management, markets and production forecasts. The inter-ventions envisaged for achieving de-sired goals are varied and regionally differentiated with focus on potential crops to be developed in clusters by deploying modern and hi-tech in-terventions, duly ensuring backward and forward linkages.
Ensuring nutritional and livelihood securityEnsuring adequate food and nutri-tion supply, employment and income generation are some of the important facets of horticulture. New produc-tion techniques and their adoption are needed for sustainable livelihood. Horticultural crops, as opposed to other food crops, have a consider-able yield potential and can provide more income per unit area. The aver-age size of holding has shrunk from 2.3 ha to 1.10 ha between 1970 and 2013 reflecting the poor economic viability of the smaller holdings, but
horticulture being high value crops has proved as best means for small farmers. Adoption of horticulture by small farmers gives them efficient production choices. Besides, horticulture based in-tegrated farming system holds the key for ensuring income, em-
ployment, livelihood and nutri-tional security in a sustainable mode for small and marginal farmers who have 44% of total operational area.The nutritional status of the popula-tion can be improved through creat-ing an environment in which house-
holds have sufficient access to fruits and vegetables at affordable prices throughout the year and the neces-sary knowledge and skills to prepare and consume foods to complement their diet, specifically targeting the poor women farmers and children. In this endeavour, there is need to enhance the level of food security and nutrition by improving the ef-ficiency of the horticultural produc-tion system and associated support services through the application of modern technologies and diversified cropping patterns, that will promote the production and productivity, and provide higher incomes to the small and marginal farming communities in a sustainable manner. It is impor-tant to develop sustainable capabil-ity among low income communities in increasing productivity and year round production of horticultural crops (fruits, vegetables and spices) through the introduction of superior quality planting materials and seeds and the promotion of production skills. Also there is need to minimize post-harvest losses, improve post-harvest handling and maximize pri-mary producer’s profit and income through promotion of on-farm and community-based produce handling methods as well as to enhance mar-keting support services. Promotion of income-generating activities, in-cluding agro-processing, to enable the optimum utilization of horticul-tural produce to supplement fam-ily incomes, with additional support form micro-credit and food assis-tance programs, especially for poor and disadvantaged group. Increasing the nutritional awareness among the beneficiaries and developing a com-prehensive food-based nutrition pro-gram to reduce malnutrition in the target groups comprising all groups of population with major focus on women and children is requisite. n

73www.agriculturetoday.in Agriculture Year Book 2015
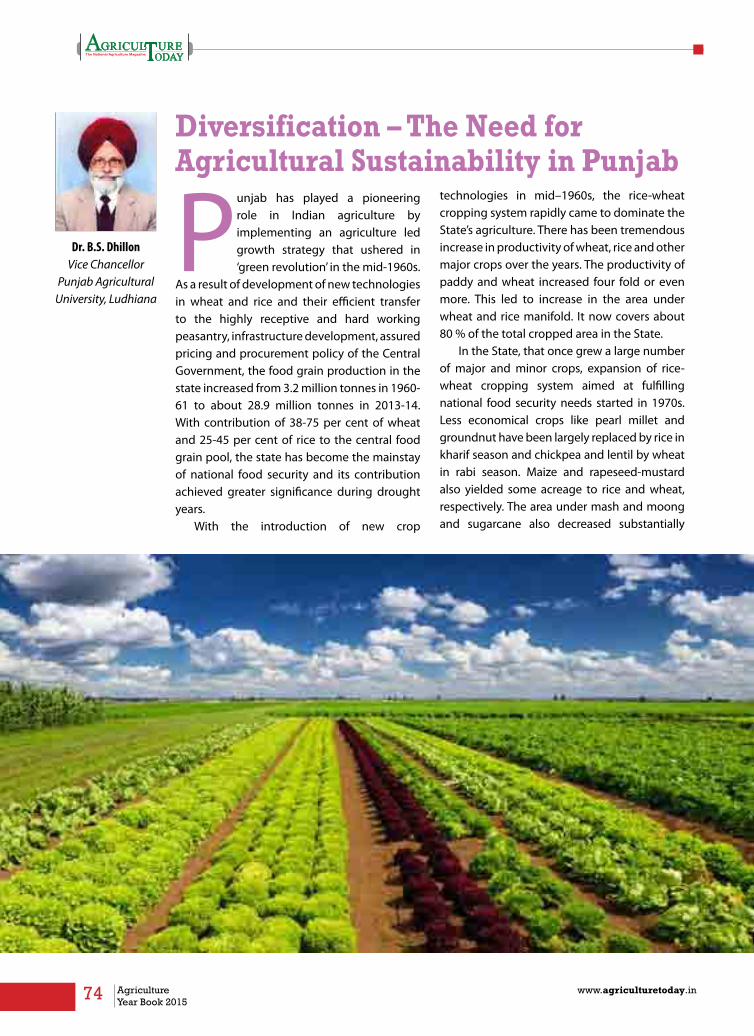
74 Agriculture Year Book 2015
www.agriculturetoday.in
Diversification – The Need for Agricultural Sustainability in Punjab
Punjab has played a pioneering role in Indian agriculture by implementing an agriculture led growth strategy that ushered in ‘green revolution’ in the mid-1960s.
As a result of development of new technologies in wheat and rice and their efficient transfer to the highly receptive and hard working peasantry, infrastructure development, assured pricing and procurement policy of the Central Government, the food grain production in the state increased from 3.2 million tonnes in 1960-61 to about 28.9 million tonnes in 2013-14. With contribution of 38-75 per cent of wheat and 25-45 per cent of rice to the central food grain pool, the state has become the mainstay of national food security and its contribution achieved greater significance during drought years.
With the introduction of new crop
technologies in mid–1960s, the rice-wheat cropping system rapidly came to dominate the State’s agriculture. There has been tremendous increase in productivity of wheat, rice and other major crops over the years. The productivity of paddy and wheat increased four fold or even more. This led to increase in the area under wheat and rice manifold. It now covers about 80 % of the total cropped area in the State.
In the State, that once grew a large number of major and minor crops, expansion of rice-wheat cropping system aimed at fulfilling national food security needs started in 1970s. Less economical crops like pearl millet and groundnut have been largely replaced by rice in kharif season and chickpea and lentil by wheat in rabi season. Maize and rapeseed-mustard also yielded some acreage to rice and wheat, respectively. The area under mash and moong and sugarcane also decreased substantially
Dr. B.S. DhillonVice Chancellor
Punjab Agricultural University, Ludhiana

75www.agriculturetoday.in Agriculture Year Book 2015
over time. There has been dramatic increase in area and production in rice. The area under rice in Punjab, which was just 2.3 lakh ha in 1960-61, increased to 28.9 lakh ha in 2014-15 and its production increased to more than 50 times.
Challenges in agriculture The productivity enhancing technologies that were instrumental in boosting cereal production started displaying expected ‘slow down trend’ in the late 1980s. By 1990’s, the crop productivity had gone up and its further increase expectedly slowed down, thereby, the net farm income started stagnating. Agricultural growth in Punjab slowed down from 4.6 per cent in 1980s to 2.5 per cent in 1990s and further to 2.3 per cent in 2000s. Rice-wheat cropping system, being highly productive and hence input intensive, has adversely affected water resources (both in terms of quantity and quality), soil health and environment.
Punjab has developed its agriculture to the stage where it has the largest proportion of irrigated area (99%), the highest cropping intensity (191%) and the most intensive use of chemical fertilizers (250 kg/ha) as compared to 45%, 141% and 128 kg/ha, respectively, at the national level. Expansion of area under rice cultivation turned out to be an ecologically unsound practice as intensive cropping of rice affected the natural resources and soil health, and excessive drawl of good quality water resulted in the depletion of ground water and formation of hard pan in about 70 per cent area of the State. Earlier there were array of local varieties. As the scientists developed improved
varieties, these were adopted by the farmers due to their higher yields and effective extension system, but their narrow genetic base led to the attack of diseases and pests. Environmental pollution due to excessive use of chemical fertilizers and pesticides and burning of crop residues has become a great cause of concern.
Need for crop diversificationFor sustainable management of natural resources of Punjab in particular and North-Western regions in general, the diversification from rice to other less water requiring crops is of utmost necessity. As the other states progress in agriculture, they may encounter similar problems. For ensuring shift to alternative crops, foremost challenge is giving price as remunerative as paddy. For achieving diversification targets, technology back-up, policy development, and strong extension system are required.
Crops suitable for diversificationMaize is a viable option for diversifying some area under rice and single cross hybrids are available to obtain higher yields. Likewise, pulses and summer oilseeds are other options for diverting some area away from rice. Bt cotton is another alternative in the south-western districts. However, their procurement and marketing has to be ensured. Other crops suitable for diversification are mentioned in the diversification plan (Table 2).
Horticulture and agro-forestry can play an important role in agriculture diversification in the State. The net-house technology for production of vegetables and flowers has proved highly remunerative for the small farmers and has much scope for further expansion. Beyond crops, diversification toward dairy farming, poultry, piggery and fish farming are extremely important. Supplemental subsidiary occupations such as mushroom production and bee-
Crop Cropped area (000’ ha)
Maximum area (Year) Area during 2013-14
KHARIF CROPS
Maize 577 (1975-76) 130
Cotton 742 (1995-96) 446
Sugarcane 174 (1996-97) 89
Pearl millet 213 (1969-70) 3
Kharif pulses 903 (1960-61) 76
Groundnut 222 (1967-68) 3
RABI CROPS
Gram 852 (1961-62) 1.8
Rapeseed - Mustard 178 (1987-88) 30
Barley 189 (1974-75) 12.4
Lentil 31 (1962-63) 1.0
Other crops* 882 562
Table 1. Change in area under important crops in Punjab overtime
* including fodder crops:

76 Agriculture Year Book 2015
www.agriculturetoday.in
keeping can also play an important role in agriculture diversification and provide livelihood security to the small farmers on sustainable basis.
Diversification plan for agriculture in PunjabBased on the report of the committee on crop diversification headed by Dr. G.S. Kalkat, Chairman of Punjab State Farmers Commission, the State Government submitted a plan to the Ministry of Agriculture, Govt. of India in 2012 outlining that the area under rice will be brought down from 28 to 16 lakh ha in phased manner over a period of five years. The key shift would be toward maize, cotton, sugarcane, fodder, pulses, fruits, vegetables and agro-forestry.
Key issues requiring attention in diversification programmeFor achieving diversification targets, technology back-up, good governance, policy development, and strong extension system are required. Diversification would require fundamental changes in incentives, institutions and
investments; however, these changes should not be at the cost of farmers’ income. l Policies equally favourable for
alternative crops viz., minimum support price (MSP) and assured marketing are required. For ensuring shift to alternative crops, foremost challenge is giving price above or at least as remunerative as paddy. Farmers will opt for alternate crops if these are as remunerative as paddy.l For enhancing area under maize, there is need to augment its use as feed in poultry and dairy farming. l For cotton, the state has proposed that the Cotton Corporation of India be asked to carry out MSP operations in all cotton markets in the state. Support of textile industries is also required for enhancing cotton production. l For sugarcane, the crushing season of at least 180 days for sugar mills needs to be ensured through developing early maturing varieties
Crop Area during 2012-13 (lakh/ha)
Potential area (lakh/
ha)
Districts
Maize 1.3 5.5 Traditional areas
Cotton 4.8 7.0 South-western districts
Sugarcane 0.7 2.6 Majha and Doaba regions
Guar Negligible 0.3 South-western districts
Kharif fodder 4.0 5.5 Throughout the State
Arhar Negligible 0.6 Central districts
Mung bean 0.2 0.6 Central districts
Kinnow 0.4 0.8 Traditional areas
Guava, Pear 0.07 0.2 Hoshiarpur, Ferozepur and Amritsar
Agro-forestry 1.3 3.0 Kandi belt and central districts (Poplar); South-western districts (Eucalyptus)
Groundnut Negligible 0.2 Hoshiarpur and S.B.S. Nagar
Turmeric. Chilli, Tomato, Garlic, Capsicum, kharif onion
0.2 0.05 Hoshiarpur, Kapurthala, Jalandhar, Amritsar
Table 2. Diversification plan for Punjab’s agriculture up to the year 2017

77www.agriculturetoday.in Agriculture Year Book 2015
and reviewing sick cooperative sugar mills. l Earlier, research in rice and wheat received greater attention than other crops from the Indian Council of Agricultural Research (ICAR) and State Agricultural Universities (SAUs). There is need to strength technology development programmes for other alternative crops. l Machines for alternative crops such as maize grain driers, cotton pickers, sugarcane harvesters, sugarcane trench planter, oilseed drill, vegetable pickers, garlic planter, potato planter, etc. would be required for acceleration of the diversification process.l Collection centers/pack houses should be set up with facilities like washing, cooling, grading and packaging for marketing of fruits and vegetables. Punjab also requires infrastructure for export of perishables. l The subsidies should be targeted on land development, underground water channels, improved implements, adoption of modern technologies, installation of tube wells for marginal farmers, infrastructure for export of vegeta-bles, flowers, fruits, farmer training, etc.l Niches need to be created to exploit specific adaptation, provide technical input and manage marketing and thereby enhancing profit of crops like basmati rice, groundnut, barley, chickpea, pea, muskmelon, watermelon, celery, kinnow, litchi, flowers, etc. The potential of Kandi area of the state for organic production of various crops needs to be exploited. Another alternative option is promoting vegetable cultivation under net houses and in peri-urban areas.
l Processing of fruits and vegetables, post-harvest storage and establishing cold chains is essential to ease out glut situation. Investment in agro-processing, market information, market development needs to be stepped up in a big way. l There is need to provide adequate subsidy to overcome financial constraint, especially in case of small farmers. l To expand area under agro-forestry, technology and infrastructure in the form of modern wood markets having facility of high-tech saw mills and seasoning plants and wood industries making laminated wood from poplar and eucalyptus are required. l Beyond crops, diversification to-wards dairy farming, poultry, pig-gery and fish farming are extremely important. There has to be a more focused research on fodder crops for developing improved varieties and their production technology. Supple-mental subsidiary occupations such as mushroom production and bee-keeping can also play an important role in agriculture diversification and provide livelihood security to the ru-ral populations on sustainable basis.
These diversification options will pro-vide regular income and are, there-fore, more attractive for marginal and small farmers.
ConclusionIn view of the present scenario of underground water in Punjab, crop diversification away from rice-wheat cropping system particularly from rice is necessary. Once implemented on full scale, it would help to sustainably manage natural resources, especially ground water. The marketing issues will have to be thoroughly probed so as to make diversification a successful programme. It has to be ensured at the government level that the economic returns from the alternative crops are equal or higher to the crop being replaced (rice) and only then the farmers will get motivated to adopt these crops. Thus, the cultivation of the alternative crops needs to be incentivized. It is high time that the farmers, government departments, marketing agencies and even consumers understand the ground reality of depleting water table in the state and help it out from being converted into a barren desert land. n

cropSin FocuS

80 Agriculture Year Book 2015
www.agriculturetoday.in
Overview
Share of agriculture in the GDP of India has been on a decline during the last several years. This is a natural consequence
when a country starts its growth jour-ney with structural changes towards industrialisation and economic reori-entation. Even then, agriculture still holds a formidable position in the In-dian economy, ensuring employment for a large section of the population and ensuring food security to the huge population. According to data avail-able till 2010-11, out of the total geo-graphical area of 328.7 million hect-ares, 141.6 million hectares is the net sown area. The gross cropped area is 198.9 million hectares with a cropping intensity of 140.5%. The net irrigated area is 63.6 million hectares. Every year, amount of crop production in the country holds a crucial importance to the economic growth and stability of the country.
Cereals Production Scenario in IndiaRice is an important crop grown in India and it is the largest country in the world in terms of area under rice cultivation and the second largest
country in terms of production. In 2013-14, rice was cultivated in the country over an area of 43.5 million hectares. Between 2010-11 and 2013-14, the total kharif rice production in the country increased by 13.4%, from 80.65 million tonnes to 91.5 million tonnes. Rabi rice production declined marginally from 15.33 million tonnes in 2010-11 to 15.15 million tonnes in 2013-14. The total rice production in the country increased marginally by 1.2% from 2010-11 (105.3 million tonnes) to 2013-14 (106.65 million tonnes). According to the third ad-vance estimate released by the depart-ment of agriculture and cooperation,
the total rice production in 2014-15 is 102.54 million tonnes, with kharif rice at 89.62 million tonnes and rabi rice at 12.91 million tonnes.
In is the largest country in the world in terms of area under wheat. In 2013-14, India cultivated about 31.5 million hectares of land with wheat. In 2010-11, India produced 86.87 million tonnes of wheat. This has been more or less on the increasing growth trend since then and in 2013-14, the total production of wheat in the country was 95.85 million tonnes, an increase by 10.3% when compared to the pro-duction figures of 2010-11. India is the third largest producer of wheat globally, behind China (125.3 mil-lion tonnes) and the European Union (154.1 million tonnes). According to the third advance estimate from the department of agriculture and cooper-ation, the total production of wheat for 2014-15 has been estimated at 90.78 million tonnes.
Total production of all cereals in the country has increased by almost 9% in between the period from 2010-11 and 2013-14, from 226.25 million tonnes (2010-11) to 245.74 million tonnes (2013-14). Rabi cereals in-creased by 9.3%, from 112.52 million
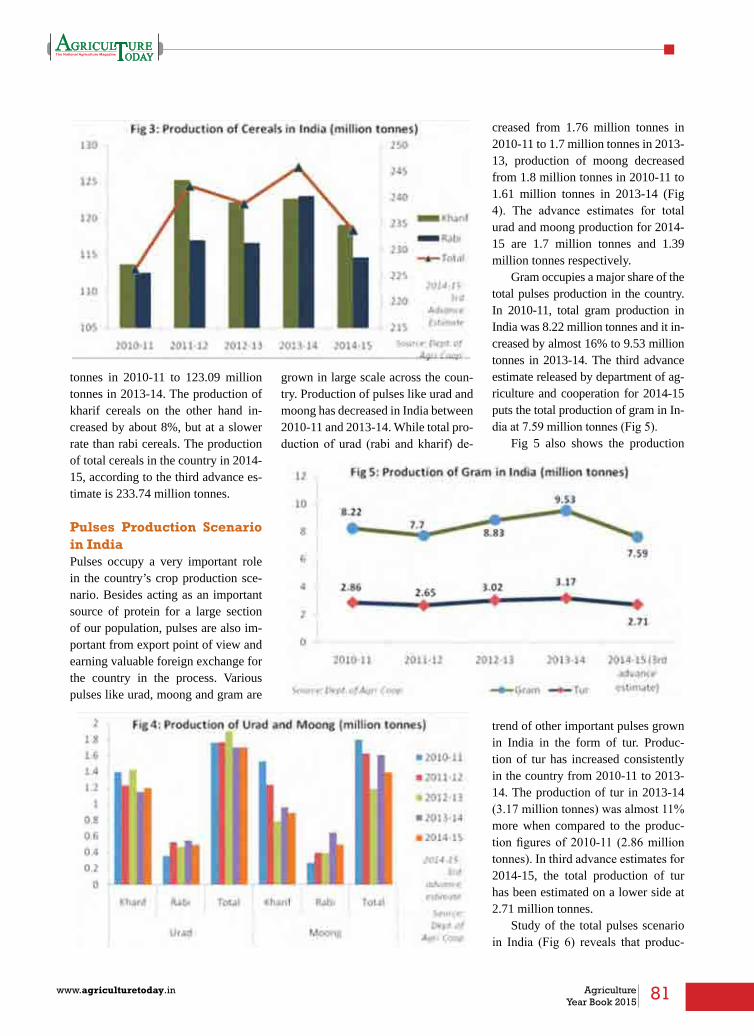
81www.agriculturetoday.in Agriculture Year Book 2015
tonnes in 2010-11 to 123.09 million tonnes in 2013-14. The production of kharif cereals on the other hand in-creased by about 8%, but at a slower rate than rabi cereals. The production of total cereals in the country in 2014-15, according to the third advance es-timate is 233.74 million tonnes.
Pulses Production Scenario in IndiaPulses occupy a very important role in the country’s crop production sce-nario. Besides acting as an important source of protein for a large section of our population, pulses are also im-portant from export point of view and earning valuable foreign exchange for the country in the process. Various pulses like urad, moong and gram are
grown in large scale across the coun-try. Production of pulses like urad and moong has decreased in India between 2010-11 and 2013-14. While total pro-duction of urad (rabi and kharif) de-
creased from 1.76 million tonnes in 2010-11 to 1.7 million tonnes in 2013-13, production of moong decreased from 1.8 million tonnes in 2010-11 to 1.61 million tonnes in 2013-14 (Fig 4). The advance estimates for total urad and moong production for 2014-15 are 1.7 million tonnes and 1.39 million tonnes respectively.
Gram occupies a major share of the total pulses production in the country. In 2010-11, total gram production in India was 8.22 million tonnes and it in-creased by almost 16% to 9.53 million tonnes in 2013-14. The third advance estimate released by department of ag-riculture and cooperation for 2014-15 puts the total production of gram in In-dia at 7.59 million tonnes (Fig 5).
Fig 5 also shows the production
trend of other important pulses grown in India in the form of tur. Produc-tion of tur has increased consistently in the country from 2010-11 to 2013-14. The production of tur in 2013-14 (3.17 million tonnes) was almost 11% more when compared to the produc-tion figures of 2010-11 (2.86 million tonnes). In third advance estimates for 2014-15, the total production of tur has been estimated on a lower side at 2.71 million tonnes.
Study of the total pulses scenario in India (Fig 6) reveals that produc-

82 Agriculture Year Book 2015
www.agriculturetoday.in
tion of kharif pulses decreased from 7.12 million tonnes in 2010-11 to 5.99 million tonnes in 2013-14. This represents a decrease by almost 16% between the period from 2010-11 and 2013-14. However, the total rabi puls-es production increased in the country from 11.12 million tonnes in 2010-11 to 13.25 million tonnes in 2013-14, representing an increase of 19%. The third advance estimates for both rabi and kharif pulses depict a lower pro-duction scenario for the year 2014-15, at 5.52 million tonnes and 11.87 mil-lion tonnes respectively.
The total production of pulses in the country increased by 5.5% in-creasing from 18.24 million tonnes in 2010-11 to 19.25 million tonnes in 2013-14. The third advance esti-mate about production of pulses in the country is 17.38 million tonnes.
Gram is the largest constituent
amongst all the pulses grown in India in terms of production. In 2013-14, gram production was 49.5% of the total pulses production in the country. Tur constituted 16 percent of the to-tal pulses production in the country in the same year. Moong, Urad and Len-til constituted respectively 8%, 9%, 6% of the total production. All other pulses which are grown on a minor scale across the country shared the remaining 11.5% of the total pulses production.
Fig 8 depicts the production sce-nario of total cereals in the country from 2010-11 to 2013-14. Various cereals, coarse cereals and pulses are included in the food grains category. The trend during this period reveals that both kharif and rabi food grains have increased and in 2010-11, the production of kharif and rabi food gr ains was 120.85 million tonnes and
123.64 million tonnes respectively. The same increased to 128.69 mil-lion tonnes (kharif) and 136.35 mil-lion tonnes (rabi) in 2013-14. The highest increase in production of rabi food grains was 131.27 million tonnes in 2011-12 before decreasing in the subsequent years.during the period in discussion. Rabi food grains in the country however showed a continuous growth trend during this period. Total production of pulses in the country in 2010-11 was 244.49 million tonnes which increased by about 3% to 265.04 million tonnes in 2013-14. Ac-cording to third advance estimates, the pulses production is set to decrease in 2014-15 at 251.12 million tonnes.
Oilseeds Production Scenario in IndiaCompared to various countries glob-ally like Malaysia, Italy etc., India’s production of oilseeds are not encour-aging and the country has to depend heavily on import of essential edible oil. The country imported around 11.8 million tonnes of edible oil from Oc-tober 2013 to November 2014. This indicates that there is huge gap be-tween production and requirement of oilseeds in the country. Fig 9 shows the status of production of various oil-seeds in India from 2010-11 to 2014-15. Groundnuts has shown encourag-ing growth in production during this period. In 2010-11, the total produc-tion of groundnut in the country was

83www.agriculturetoday.in Agriculture Year Book 2015
82.65 million tonnes. Kharif and rabi groundnut production in this year was respectively 66.43 million tonnes and 16.22 million tonnes. The total pro-duction increased by 17.5% to 97.14 million tonnes in 2013-14. The kharif and rabi groundnut production in 2013-14 was respectively 80.85 mil-lion tonnes and 16.56 million tonnes. Thus, kharif ground nut exhibited sub-stantial growth of 21% between 2010-11 and 2013-14.
Unlike groundnut, soyabeans production in the country as seen in Fig 9 has shown inconsistent pro-duction trend in the recent years.
The production of soyabeans in the country in 2010 was 127.36 million tonnes which increased substantially to 146.66 million tonnes in 2012-13. However, the production witnessed a huge decline in the following year of 2013-14 when the total production of soyabeans was 118.81 million tonnes. Soyabean being a kharif crop seems to have borne the vagaries of uncertain monsoon in these different years. The third advance estimate for soyabeans production in 2014-15 is 107.05 mil-lion tonnes, further lower than that of the previous year production figures.
Like soyabeans, mustard and rape-seed have also witnessed fluctuating production in the country during the
period between 2010-11 and 2014-15. Production of these two oilseeds to-gether in 2010-11 was 81.79 million tonnes which dropped significantly in the following year to 66.04 mil-lion tonnes. However, the production picked up in 2012-13 and the total production of rapeseed and mustard in this year was 80.29 million tonnes. Production in 2013-14 was lower at 78.77 million tonnes and according is estimated to be further lowering down to 67.57 million tonnes in 2014-15 as per the third advance estimate from the department of agriculture.
Total oilseed production in India

84 Agriculture Year Book 2015
www.agriculturetoday.in
is witnessing a fluctuating trend in the recent years, as shown in Fig 10. While the total kharif oilseed pro-duction in the country increased mar-ginally by 3% between 2010-11 and 2014-15, the rabi decreased about 4% during this period. In 2010-11, the production of rabi and kharif oilseed was respectively 219.22 million tonnes and 105.57 million tonnes. In 2013-14, kharif and rabi oilseed production was respectively 226.12 million tonnes and 101.37 million tonnes. El Nino effect in the recent years had impacted the sow-ing of Rabi oilseeds adversely and it drastically decreased. Total produc-tion of oilseeds in India increased marginally from 324.79 million tonnes in 2010-11 to 327.49 million tonnes. Third advance estimate for total oilseed production in the coun-try for 2014-15 shows a poor pro-duction scenario and its estimated to be 273.8 million tonnes, which is a substantial decrease by 16% when compared to 2013-14.
Commercial Crops Produc-tion Scenario in IndiaIndia has emerged as the highest pro-ducer of cotton in the world. In 2013-14, it surpassed China with about 36 million bales of cotton production. The production has been increasing
from 2010-11 to 2014-15 except for a marginal decrease in production in 2012-13. When compared to the pro-duction of cotton in India in 2010-11 with 33 million bales, production in-
creased by almost 9%. This has been possible largely because of increased area in acerage of Bt cotton in the recent years in the important cotton growing states of the country. Produc-tion of cotton in 2014-15 is estimated at 35.3 million bales.
Jute is another important and tra-ditional fibre crop grown in the coun-try. The total production of jute in the country in 2010-11 was 10 million bales. This has increased marginally to 11 million bales in 2013-14 and the same production is estimated in 2014-15 also.
Fig 12 shows the production trend of the other important commercial crop, sugarcane in India. It has wit-nessed a fluctuating production trend during the period between 2010-11 and 2014-15. In 2010-11, the produc-tion of sugarcane was 3423.82 million tonnes which showed a substantial in-crease in production in following year of 2011-12 at 3610.37 million tonnes. However, in the following year of 2012-13, production of sugarcane in the country suffered a huge decline to 3412 million tonnes. It recovered in 2013-14 and the production increased to 3521.42 million tonnes. Sugarcane production in 2014-15 is estimated at 3565.61 million tonnes. n

85www.agriculturetoday.in Agriculture Year Book 2015
Horticulture Crop Production in India
India is endowed with a re-markably heterogeneous area characterized by a great di-versity of agro climatic zones. This provides a congenial
condition for production of a variety of horticultural crops. A wide range of fruits, vegetables, flowers, spices, plantation crops, root and tuber crops, medicinal and aromatic crops are cul-tivated across various places in In-dia. Horticulture accounts for almost 30% of the total GDP of the country. The sector has also importance from export point of view and the country exports a wide range of horticultural produce that include fruits, onion, mango pulp, fresh mangoes, dried walnuts, fresh grapes and others. India is a leading exporter of horticultural produce in the entire South Asian and
Middle East Countries. Recognising the growing importance of the sector in India and to tap maximum potential of the sector, government of India has initiated National Horticulture Mis-sion (NHM) and Horticulture Mission for North East and Himalayan States (HMNEH). While HMNEH is focused on the development of horticulture sector in the Himalayan and the north-eastern states, NHM is operational in 344 districts out of 476 districts of 18 States and UTs, Andaman & Nicobar Islands, Lakshadweep.
With focussed government inter-ventions through various schemes and programmes, the horticulture sector of the country has been on a growth path in the recent years. When compared to 2009-10, the area under horticultural crops in the country has increased by
more than 24 percent in 2013-14. Area in 2013-14 was 24.1 million hectares as compared to that of 19.4 million hectares in 2009-10 (Fig 1). The larg-est increase in area under horticultural crops was between 2010-11 and 2011-12 when the area increased from 20.2 million hectares to 23.2 million hect-ares. Production of various horticul-tural crops has also registered an in-crease of 24% between 2009-10 (223 million tonnes) and 2013-14 (277 mil-lion tonnes).
Figure 2 provides an overview of the year-on-year increase of area and production of various horticultural crops. When compared to 2010-11, area under fruit cultivation in the country increased by 5%. The rate of increase decreased in the next two years to 4.1% and 3.3% respectively

86 Agriculture Year Book 2015
www.agriculturetoday.in
in 2012-13 and 2013-14. However, the production figures posted a continuously increasing trend. When compared to 2010-11, the production of horticultural crops had increased by 2.1% in 2011-12. In the next two years of 2012-13 and 2013-14, the growth was 6.4% and 9.5% respectively. The vegetable crop production in the country has not been showing consistent growth rate both in terms of area and production. The area under vegetables posted a growth of 5.8% in 2011-12 when compared to the previous year, but the growth decreased substantially in the following two years at 2.4% and 2.1% respectively in 2012-13 and 2013-14. Production of veg-
etables in India has increased by 6.7% in 2011-12 when compared to 2010-11. However, the growth rate decreased in the subsequent two years at 3.7% in 2012-13 and only 0.4% in 2013-14.
In the Indian horticulture production scenario, the dominant share is of vegetables, followed by fruits and plantation crops. In 2013-14, vegetables occupied 59% of the total horticulture crops in the country, fruits had a share of 32% and plantation crops has a share of 6%. Flowers (both cut and loose) and spices shared 1% and 2% respectively (Fig3).
Amongst various plantation crops, coconut had the largest share of production in 2013-14 at 91.47%. The major coconut growing states in the country are Kerala, Karnataka, Tamil Nadu, Andhra Pradesh, West Bengal, Goa, Andaman Nicobar Islands, Ma-harashtra, Gujarat, Assam and Bihar. These eleven states together produce almost 99% of the total co-conut of the country. Other than coconut, cashewnut and arecanut shares respectively 4.62% and 3.83% of the total plantation crop production in the country while a meagre 0.09% is shared by cocoa.
India is the largest producer, consumer and ex-porter of spices in the world. India exports a wide variety of spices to various parts of the world. Spices like pepper, chilli, turmeric, ginger, cardamom, cori-ander, cumin, fennel, fenugreek, celery, nutmeg and garlic, tamarind, vanilla etc. are produced in India. A large number of countries across the world like USA, China, Vietnam, the UAE, Malaysia, Saudi Arabia, the UK, Germany, Singapore and Sri Lanka import spices from India. As shown in Fig 5, chil-lies occupy the largest share of spices grown in the country. In 2013-14, chillies had a share of 25% in the total spices production followed by garlic (21%),
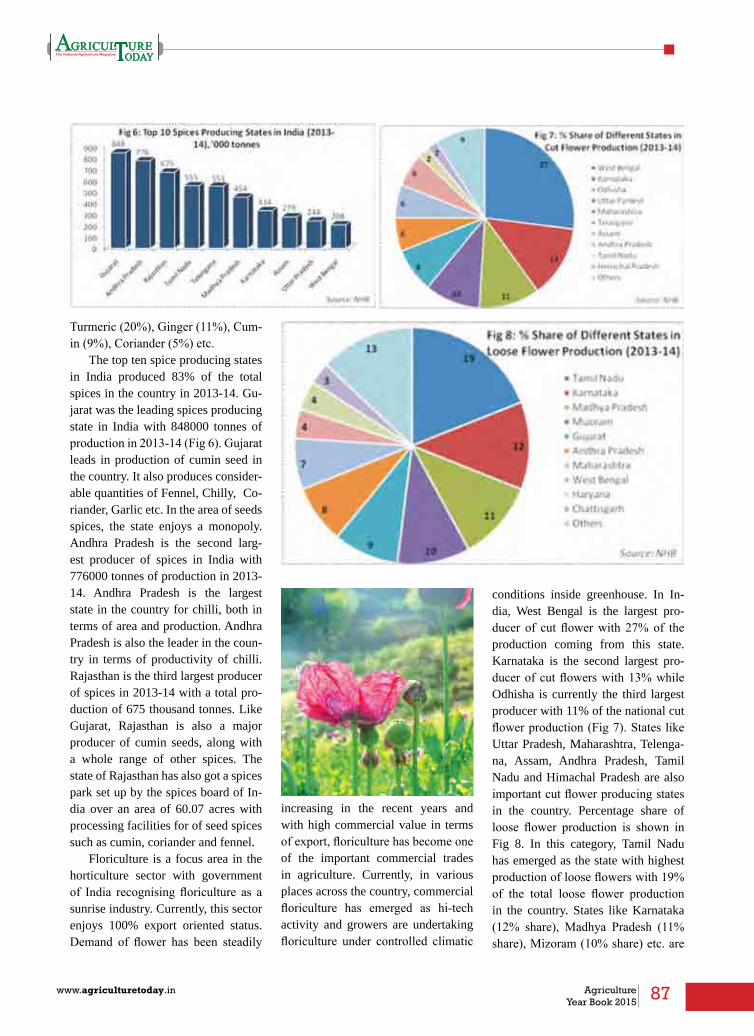
87www.agriculturetoday.in Agriculture Year Book 2015
Turmeric (20%), Ginger (11%), Cum-in (9%), Coriander (5%) etc.
The top ten spice producing states in India produced 83% of the total spices in the country in 2013-14. Gu-jarat was the leading spices producing state in India with 848000 tonnes of production in 2013-14 (Fig 6). Gujarat leads in production of cumin seed in the country. It also produces consider-able quantities of Fennel, Chilly, Co-riander, Garlic etc. In the area of seeds spices, the state enjoys a monopoly. Andhra Pradesh is the second larg-est producer of spices in India with 776000 tonnes of production in 2013-14. Andhra Pradesh is the largest state in the country for chilli, both in terms of area and production. Andhra Pradesh is also the leader in the coun-try in terms of productivity of chilli. Rajasthan is the third largest producer of spices in 2013-14 with a total pro-duction of 675 thousand tonnes. Like Gujarat, Rajasthan is also a major producer of cumin seeds, along with a whole range of other spices. The state of Rajasthan has also got a spices park set up by the spices board of In-dia over an area of 60.07 acres with processing facilities for of seed spices such as cumin, coriander and fennel.
Floriculture is a focus area in the horticulture sector with government of India recognising floriculture as a sunrise industry. Currently, this sector enjoys 100% export oriented status. Demand of flower has been steadily
increasing in the recent years and with high commercial value in terms of export, floriculture has become one of the important commercial trades in agriculture. Currently, in various places across the country, commercial floriculture has emerged as hi-tech activity and growers are undertaking floriculture under controlled climatic
conditions inside greenhouse. In In-dia, West Bengal is the largest pro-ducer of cut flower with 27% of the production coming from this state. Karnataka is the second largest pro-ducer of cut flowers with 13% while Odhisha is currently the third largest producer with 11% of the national cut flower production (Fig 7). States like Uttar Pradesh, Maharashtra, Telenga-na, Assam, Andhra Pradesh, Tamil Nadu and Himachal Pradesh are also important cut flower producing states in the country. Percentage share of loose flower production is shown in Fig 8. In this category, Tamil Nadu has emerged as the state with highest production of loose flowers with 19% of the total loose flower production in the country. States like Karnataka (12% share), Madhya Pradesh (11% share), Mizoram (10% share) etc. are

88 Agriculture Year Book 2015
www.agriculturetoday.in
the other major producers of loose flowers in the country.
The discussion on horticulture crop production is incomplete without discussing the importance of the sec-tor in terms of export. A wide range of horticultural products ranging from flowers, mangoes, fresh and processed vegetables, grapes etc. is exported ev-ery year to various parts of the world. Fresh onions had the largest share in the export of different horticultural products in 2013-14 (Fig 9). Onions constituted 22% of the total share of exports. Fresh vegetables occupied 16% in export in 2013-14. Grapes oc-cupied the third position with 12%.
Figure 10 shows the value derived from the export of some important fruits and vegetables by India. Ex-port of grapes has witnessed unprec-edented growth between 2011-12 and
2013-14. Export of grapes in 2013-14 was Rs 14370.7 million, which was a massive 178% increase from the ex-port figure of grapes in 2011-12 of Rs 5167.6 million. India has been export-ing increasing quantities of banana. When compared to the export figure
of Rs 915.5 million, it increased by 71% in 2013-14 and the export value in this year for banana was Rs 1568.3 million. Among the major fruits being exported, orange witnessed a decline by 34% in export value. In 2011-12 the total export value of orange was Rs 849.3 million which increased to Rs 555.8 million in 2013-14. Export of onion increased substantially by about 84% between 2011-12 (Rs 17230 mil-lion) and 2013-14 (Rs 31696.1 mil-lion).
Export of flowers in India in-creased from Rs 3653.2 million in 2011-12 to Rs 4559.1 million in 2013-14, signifying an increase by about 25% during this period. Fresh veg-etables and preserved vegetables wit-nessed substantial growth during the period in concern, growing at 43% and 41% respectively (Fig11). The value of fresh vegetables exported from In-dia in 2011-12 was Rs 2877.6 million
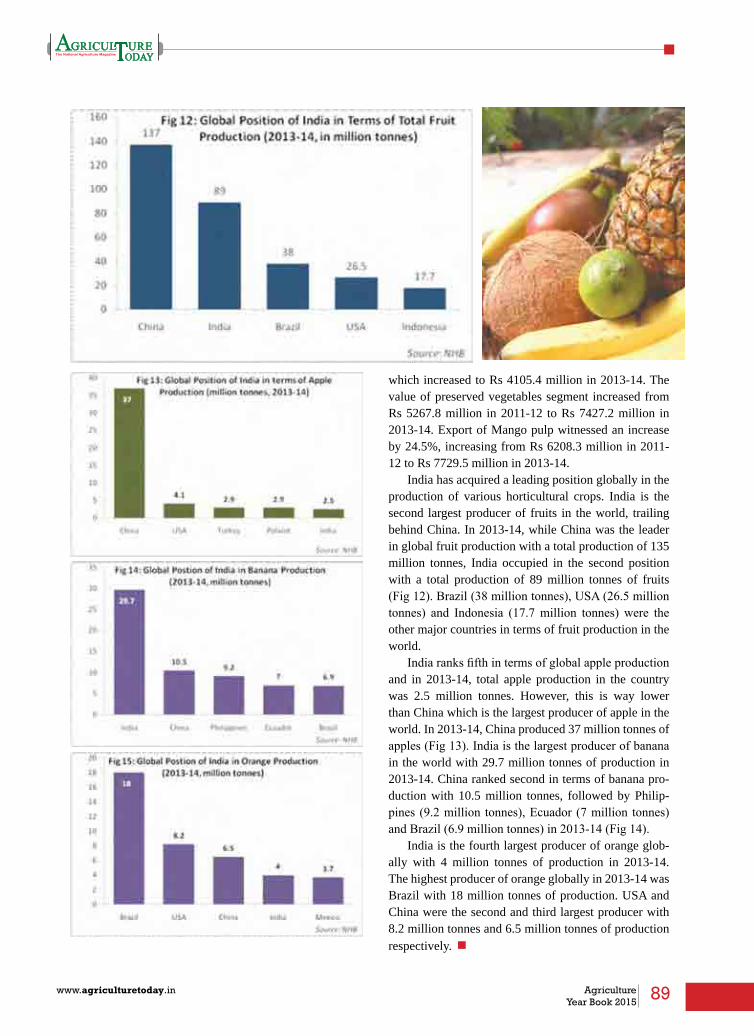
89www.agriculturetoday.in Agriculture Year Book 2015
which increased to Rs 4105.4 million in 2013-14. The value of preserved vegetables segment increased from Rs 5267.8 million in 2011-12 to Rs 7427.2 million in 2013-14. Export of Mango pulp witnessed an increase by 24.5%, increasing from Rs 6208.3 million in 2011-12 to Rs 7729.5 million in 2013-14.
India has acquired a leading position globally in the production of various horticultural crops. India is the second largest producer of fruits in the world, trailing behind China. In 2013-14, while China was the leader in global fruit production with a total production of 135 million tonnes, India occupied in the second position with a total production of 89 million tonnes of fruits (Fig 12). Brazil (38 million tonnes), USA (26.5 million tonnes) and Indonesia (17.7 million tonnes) were the other major countries in terms of fruit production in the world.
India ranks fifth in terms of global apple production and in 2013-14, total apple production in the country was 2.5 million tonnes. However, this is way lower than China which is the largest producer of apple in the world. In 2013-14, China produced 37 million tonnes of apples (Fig 13). India is the largest producer of banana in the world with 29.7 million tonnes of production in 2013-14. China ranked second in terms of banana pro-duction with 10.5 million tonnes, followed by Philip-pines (9.2 million tonnes), Ecuador (7 million tonnes) and Brazil (6.9 million tonnes) in 2013-14 (Fig 14).
India is the fourth largest producer of orange glob-ally with 4 million tonnes of production in 2013-14. The highest producer of orange globally in 2013-14 was Brazil with 18 million tonnes of production. USA and China were the second and third largest producer with 8.2 million tonnes and 6.5 million tonnes of production respectively. n
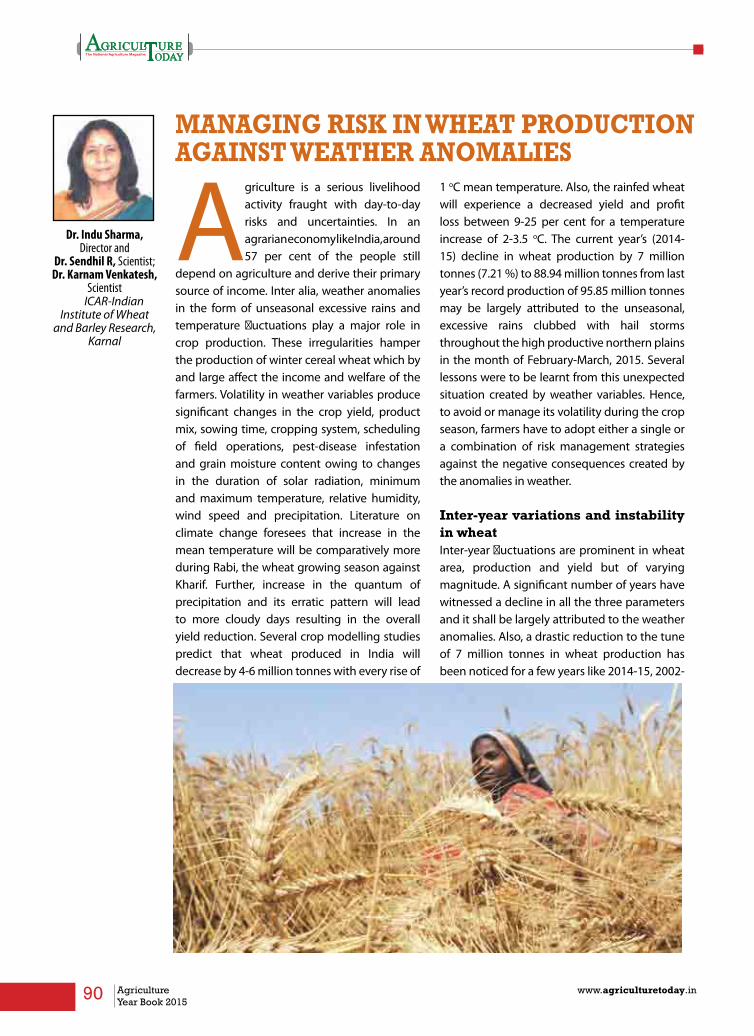
90 Agriculture Year Book 2015
www.agriculturetoday.in
MANAGING RISK IN WHEAT PRODUCTION AGAINST WEATHER ANOMAlIES
Agriculture is a serious livelihood activity fraught with day-to-day risks and uncertainties. In an agrarian economy like India, around 57 per cent of the people still
depend on agriculture and derive their primary source of income. Inter alia, weather anomalies in the form of unseasonal excessive rains and temperature fluctuations play a major role in crop production. These irregularities hamper the production of winter cereal wheat which by and large affect the income and welfare of the farmers. Volatility in weather variables produce significant changes in the crop yield, product mix, sowing time, cropping system, scheduling of field operations, pest-disease infestation and grain moisture content owing to changes in the duration of solar radiation, minimum and maximum temperature, relative humidity, wind speed and precipitation. Literature on climate change foresees that increase in the mean temperature will be comparatively more during Rabi, the wheat growing season against Kharif. Further, increase in the quantum of precipitation and its erratic pattern will lead to more cloudy days resulting in the overall yield reduction. Several crop modelling studies predict that wheat produced in India will decrease by 4-6 million tonnes with every rise of
1 oC mean temperature. Also, the rainfed wheat will experience a decreased yield and profit loss between 9-25 per cent for a temperature increase of 2-3.5 oC. The current year’s (2014-15) decline in wheat production by 7 million tonnes (7.21 %) to 88.94 million tonnes from last year’s record production of 95.85 million tonnes may be largely attributed to the unseasonal, excessive rains clubbed with hail storms throughout the high productive northern plains in the month of February-March, 2015. Several lessons were to be learnt from this unexpected situation created by weather variables. Hence, to avoid or manage its volatility during the crop season, farmers have to adopt either a single or a combination of risk management strategies against the negative consequences created by the anomalies in weather.
Inter-year variations and instability in wheat Inter-year fluctuations are prominent in wheat area, production and yield but of varying magnitude. A significant number of years have witnessed a decline in all the three parameters and it shall be largely attributed to the weather anomalies. Also, a drastic reduction to the tune of 7 million tonnes in wheat production has been noticed for a few years like 2014-15, 2002-
Dr. Indu Sharma, Director and
Dr. Sendhil R, Scientist; Dr. Karnam Venkatesh,
ScientistICAR-Indian
Institute of Wheat and Barley Research,
Karnal

91www.agriculturetoday.in Agriculture Year Book 2015
03 and 2000-01.Production decline in the
abnormal years is largely due to yield decline followed by fall in the crop acreage. It is one of the indications that variations in wheat yield should be countered by adopting one or more of risk management strategies. Supported by the instability measure (coefficient of variation in per cent), random variations in wheat production for all the decades between 1955-56 to 1964-65 and 2005-06 to 2014-15 is attributed to instability in yield followed by crop area (Table2) that suggests for suitable and relevant risk management strategies at micro level for stabilizing wheat yield and thereby production.
Risk Management StrategiesStrategically, there exists a bunch of risk management tools to counter the uncertainty in market prices during harvest. However, only a few strategies prevail to manage the negative impact of weather variability on crop production (Figure 1). Growing resistant genotypes, climate smart farming practices, crop diversification and insurance are the most widely followed strategies against weather aberrations during the crop season.
Resistant Genotypes: The most widely used as well as easy to adopt is growing resistant varieties against a host of biotic and abiotic stress resulting from climate change. Resistant genotypes that are tolerant to terminal stress, variations in diurnal temperature, lodging, pests and diseases infestation, weeds, drought, submergence, extreme cold, salinity and alkalinity have to be developed by the breeders utilizing the resistant stocks. However, development and
adoption of resistant varieties is region-specific and hence the role of wheat breeding assumes greater significance.
Breeding strategies for management of risks associated with the weather anomalies: 1. Development of wheat varieties
tolerant to weather anomalies such as increased temperature, heat, less and excessive rainfall.
2. Breeding programmes must aim to develop wheat varieties that fit into eco-system based practices like conservation agriculture and
zero tillage.3. Widening the genetic base of
breeding material by frequent and routine use of wild relatives, land races, and other non-adapted genetic materials for development of varieties suited to withstand weather anomalies.
4. Adaptation of modern concepts of precise phenotyping clubbed with tools of biotechnology such as high throughput genotyping, marker assisted selection, and transgenics which have been proved useful in quickly achieving the plant breeding goals in many crops.Diversification: Crop diversifica-
tion is another measure to manage the production risk. Farmers have to take more than one crop/livestock enterprise so that there will be a trade-off against revenue loss due to natural calamities. For instance, wheat crop sown between poplar trees, intercropping with pulses/oil-seeds, allocation of considerable area to other competing crops are sug-gested for minimising the revenue loss in one or other enterprise.
Adaptation Practices: Climate smart farming practices and
Period Coefficient of Variation (%)
Area Production Yield
1955-56 to 1964-65 4.86 13.22 10.40
1965-66 to 1974-75 15.07 28.07 15.78
1975-76 to 1984-85 5.75 16.89 11.50
1985-86 to 1994-95 3.94 12.54 9.06
1995-96 to 2004-05 3.24 5.83 3.97
2005-06 to 2014-15 4.87 10.52 6.45
Table 1. Instability in wheat area, production and yield
Figure 1: Risk management strategies
ResistantGenotypes Diversification Adaptation
PracticesInsurance
Risk Management Strategies
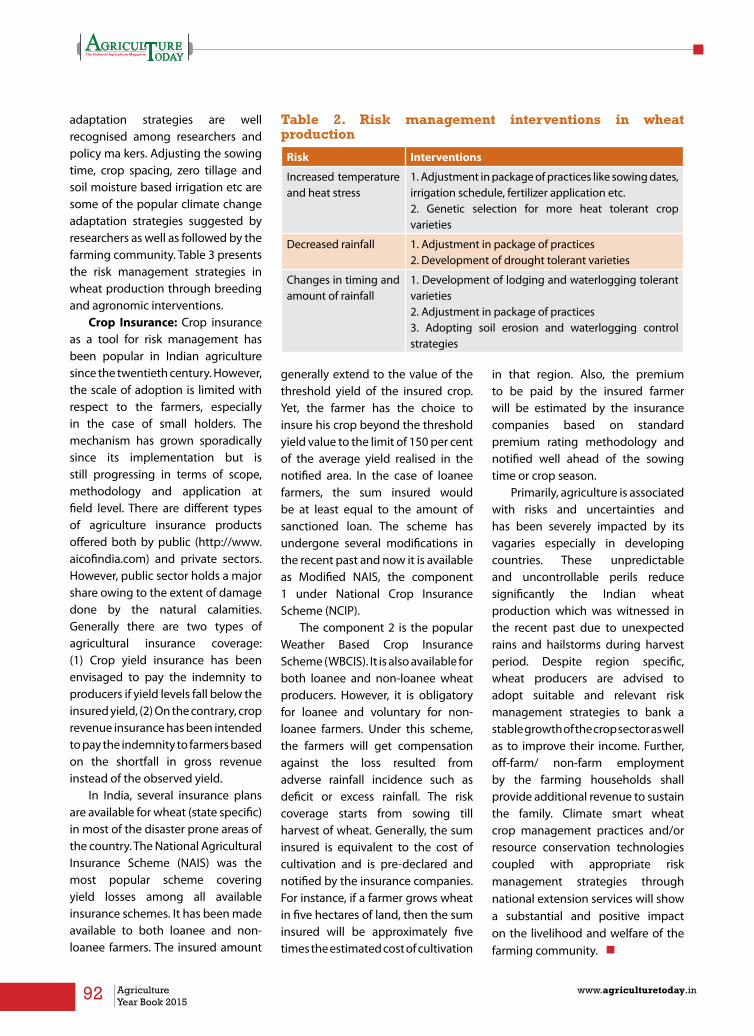
92 Agriculture Year Book 2015
www.agriculturetoday.in
adaptation strategies are well recognised among researchers and policy ma kers. Adjusting the sowing time, crop spacing, zero tillage and soil moisture based irrigation etc are some of the popular climate change adaptation strategies suggested by researchers as well as followed by the farming community. Table 3 presents the risk management strategies in wheat production through breeding and agronomic interventions.
Crop Insurance: Crop insurance as a tool for risk management has been popular in Indian agriculture since the twentieth century. However, the scale of adoption is limited with respect to the farmers, especially in the case of small holders. The mechanism has grown sporadically since its implementation but is still progressing in terms of scope, methodology and application at field level. There are different types of agriculture insurance products offered both by public (http://www.aicofindia.com) and private sectors. However, public sector holds a major share owing to the extent of damage done by the natural calamities. Generally there are two types of agricultural insurance coverage: (1) Crop yield insurance has been envisaged to pay the indemnity to producers if yield levels fall below the insured yield, (2) On the contrary, crop revenue insurance has been intended to pay the indemnity to farmers based on the shortfall in gross revenue instead of the observed yield.
In India, several insurance plans are available for wheat (state specific) in most of the disaster prone areas of the country. The National Agricultural Insurance Scheme (NAIS) was the most popular scheme covering yield losses among all available insurance schemes. It has been made available to both loanee and non-loanee farmers. The insured amount
generally extend to the value of the threshold yield of the insured crop. Yet, the farmer has the choice to insure his crop beyond the threshold yield value to the limit of 150 per cent of the average yield realised in the notified area. In the case of loanee farmers, the sum insured would be at least equal to the amount of sanctioned loan. The scheme has undergone several modifications in the recent past and now it is available as Modified NAIS, the component 1 under National Crop Insurance Scheme (NCIP).
The component 2 is the popular Weather Based Crop Insurance Scheme (WBCIS). It is also available for both loanee and non-loanee wheat producers. However, it is obligatory for loanee and voluntary for non-loanee farmers. Under this scheme, the farmers will get compensation against the loss resulted from adverse rainfall incidence such as deficit or excess rainfall. The risk coverage starts from sowing till harvest of wheat. Generally, the sum insured is equivalent to the cost of cultivation and is pre-declared and notified by the insurance companies. For instance, if a farmer grows wheat in five hectares of land, then the sum insured will be approximately five times the estimated cost of cultivation
in that region. Also, the premium to be paid by the insured farmer will be estimated by the insurance companies based on standard premium rating methodology and notified well ahead of the sowing time or crop season.
Primarily, agriculture is associated with risks and uncertainties and has been severely impacted by its vagaries especially in developing countries. These unpredictable and uncontrollable perils reduce significantly the Indian wheat production which was witnessed in the recent past due to unexpected rains and hailstorms during harvest period. Despite region specific, wheat producers are advised to adopt suitable and relevant risk management strategies to bank a stable growth of the crop sector as well as to improve their income. Further, off-farm/ non-farm employment by the farming households shall provide additional revenue to sustain the family. Climate smart wheat crop management practices and/or resource conservation technologies coupled with appropriate risk management strategies through national extension services will show a substantial and positive impact on the livelihood and welfare of the farming community. n
Risk Interventions
Increased temperature and heat stress
1. Adjustment in package of practices like sowing dates, irrigation schedule, fertilizer application etc.2. Genetic selection for more heat tolerant crop varieties
Decreased rainfall 1. Adjustment in package of practices2. Development of drought tolerant varieties
Changes in timing and amount of rainfall
1. Development of lodging and waterlogging tolerant varieties2. Adjustment in package of practices3. Adopting soil erosion and waterlogging control strategies
Table 2. Risk management interventions in wheat production

93www.agriculturetoday.in Agriculture Year Book 2015

94 Agriculture Year Book 2015
www.agriculturetoday.in
INDIAN CUMIN CUlTIVATION – PROSPECTS AND CHAllENGES
Cumin one of the most important seed spices earns a good deal of export income, at the same time is plagued with huge challenges in cultivation and marketing. The crop
is highly sensitive to biotic and abiotic problems and to manage the biotic problems considering the issue of pesticide residue is creating problems in trading with developed nations. Although, in the recent years cumin export has reached to a tune of Rs.1838 corers (2014-15) from Rs.396 corers (2010-11) bouncing nearly 364 percent, but simultaneously the problems of pesticide residue has also hampered export to western world.
Looking at the International demand potential, cumin crop, can be designated as ‘Golden crop of Sands’, as it is cultivated in the arid and semi arid regions of the country covering States of Rajasthan and Gujarat. To add upon, the best quality of cumin is produced in the deserts of Rajasthan due to cool and dry weather where the farmers are deprived of natural resources throughout the year. The sensitivity of the crop asks for high attention
to manage the problems for sustaining the incremental demand world over.
Inherent ChallengesThe inherent challenges which limit the potential to breed new varieties are too high in cumin. Cumin belongs to genus Cuminum with only two species cyminum and setifolium. The former species is the cultivated one where as the latter is the wild type identified a few years back bearing hairs on seed. In general, cumin plant is of short stature with limited biomass; gene pool diversity is very limited and narrow, trait variability is observed high for quantitative traits like number of branches, number of umbels, seeds per umbel but the genus does not possess diverse characteristic differences for introgression in cultivar. Small flower size restricts manual emasculation and pollination, hence no successful reports are available deciphering the genetic architecture of the crop. Cumin has been exploited for genetic improvement in economic traits like seed yield only by performing selection in natural available population or in few instances by mutation
R. K. Solanki, Scientist cum
Cumin breeder; Y K Sharma, Prin-cipal Scientist; P
N Dubey, Senior Sci-entist and Dr. Balraj Singh, Director, ICAR
-National Research Centre on Seed Spices, Ajmer
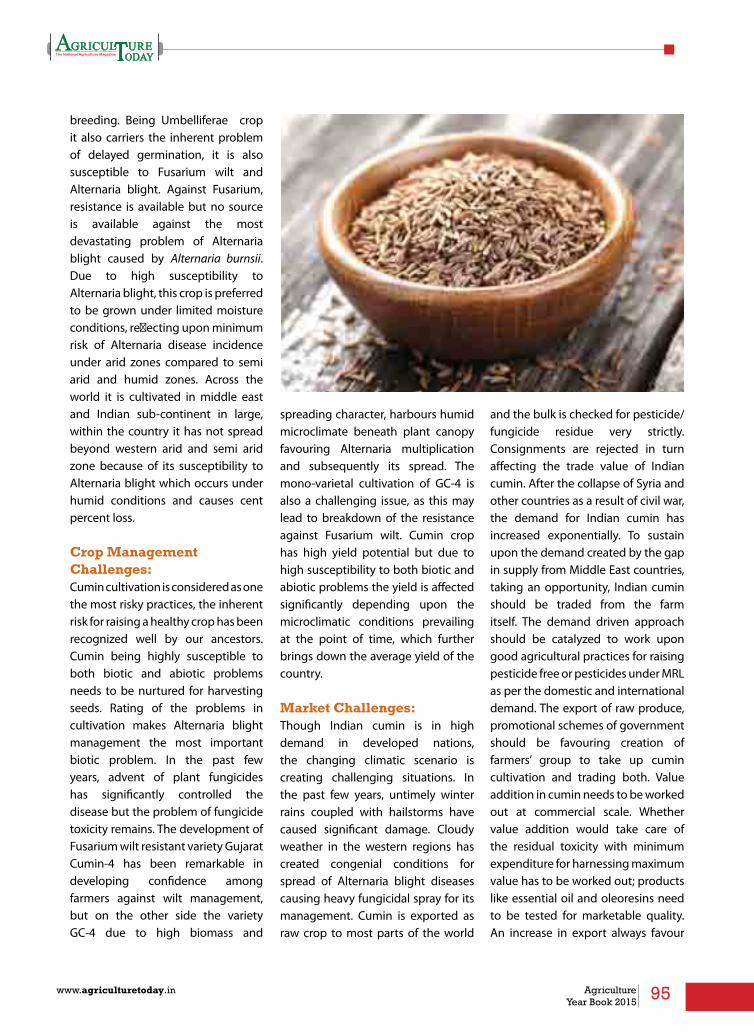
95www.agriculturetoday.in Agriculture Year Book 2015
breeding. Being Umbelliferae crop it also carriers the inherent problem of delayed germination, it is also susceptible to Fusarium wilt and Alternaria blight. Against Fusarium, resistance is available but no source is available against the most devastating problem of Alternaria blight caused by Alternaria burnsii. Due to high susceptibility to Alternaria blight, this crop is preferred to be grown under limited moisture conditions, reflecting upon minimum risk of Alternaria disease incidence under arid zones compared to semi arid and humid zones. Across the world it is cultivated in middle east and Indian sub-continent in large, within the country it has not spread beyond western arid and semi arid zone because of its susceptibility to Alternaria blight which occurs under humid conditions and causes cent percent loss.
Crop Management Challenges: Cumin cultivation is considered as one the most risky practices, the inherent risk for raising a healthy crop has been recognized well by our ancestors. Cumin being highly susceptible to both biotic and abiotic problems needs to be nurtured for harvesting seeds. Rating of the problems in cultivation makes Alternaria blight management the most important biotic problem. In the past few years, advent of plant fungicides has significantly controlled the disease but the problem of fungicide toxicity remains. The development of Fusarium wilt resistant variety Gujarat Cumin-4 has been remarkable in developing confidence among farmers against wilt management, but on the other side the variety GC-4 due to high biomass and
spreading character, harbours humid microclimate beneath plant canopy favouring Alternaria multiplication and subsequently its spread. The mono-varietal cultivation of GC-4 is also a challenging issue, as this may lead to breakdown of the resistance against Fusarium wilt. Cumin crop has high yield potential but due to high susceptibility to both biotic and abiotic problems the yield is affected significantly depending upon the microclimatic conditions prevailing at the point of time, which further brings down the average yield of the country.
Market Challenges: Though Indian cumin is in high demand in developed nations, the changing climatic scenario is creating challenging situations. In the past few years, untimely winter rains coupled with hailstorms have caused significant damage. Cloudy weather in the western regions has created congenial conditions for spread of Alternaria blight diseases causing heavy fungicidal spray for its management. Cumin is exported as raw crop to most parts of the world
and the bulk is checked for pesticide/fungicide residue very strictly. Consignments are rejected in turn affecting the trade value of Indian cumin. After the collapse of Syria and other countries as a result of civil war, the demand for Indian cumin has increased exponentially. To sustain upon the demand created by the gap in supply from Middle East countries, taking an opportunity, Indian cumin should be traded from the farm itself. The demand driven approach should be catalyzed to work upon good agricultural practices for raising pesticide free or pesticides under MRL as per the domestic and international demand. The export of raw produce, promotional schemes of government should be favouring creation of farmers’ group to take up cumin cultivation and trading both. Value addition in cumin needs to be worked out at commercial scale. Whether value addition would take care of the residual toxicity with minimum expenditure for harnessing maximum value has to be worked out; products like essential oil and oleoresins need to be tested for marketable quality. An increase in export always favour

96 Agriculture Year Book 2015
www.agriculturetoday.in
much to traders, farmers should be benefited simultaneously.
Climatic Challenges: It may sound good that the arid regions of the country are slowly converting into semi-arid due to increase in the average rainfall and vegetation over the past few years as per the recent report published by NBSSLU&P, Nagpur. This situation is healthy for the farmers of western India, but in turn it’s a challenge for the crop like cumin. Humid conditions are most dis-favoured by the crop, the crop has to be managed tactfully against Alternaria Blight and frost. There is need to identify new areas which can provide cool dry weather favourable for cumin cultivation.
Strategies to workup: Looking at the present situation and future of the cumin crop, strategies should be worked out for systematic approach for enhancing the benefits from the crop. There are few key points which need major attention, the issue relates to research, development and other managerial aspects. • Development of integrated
protection modules including biocontrol mechanisms for effective and chemical residual free Alternaria blight management.
• Identification of new or novelmolecules of fungicides which are systematic and can be more effective against Alternaria blight
• Large scale farmers awarenessprogramme need to be conducted for making farmers aware of judicious use of pesticides/insecticides
• Alternaria blight is a seedbornedisease, hence large scale seed production programme should
be taken up for healthy seed production free from Alternaria blight
• To think beyond boundaries,transgenics approach for developing varieties against Alternaria blight may be a futuristic approach, it will all depend upon the acceptability of transgenic in food crops within Indian and other countries of the world
• Identification of new and non-traditional areas for increasing the area under cumin should be taken up with the help of GIS, the areas should be cool dry and frost free
• Thesiteswhichareverymuchdryand cool offering unfavourable climate for Alternaria blight spread and favourable for cumin cultivation should be considered for converting them into export oriented zones
• Trade value of cumin can beincreased by establishing correlation between the microclimate of the region and quality of cumin harvested
from the region, this may help in endorsing GI’s for cumin for trading and value addition
• Seed village concept andcooperative societies should be encouraged for cumin crop
• Cumin isexportedas raw,henceprimary level processing is sufficient enough to grade the seeds for trading, hence small equipments or small processing units can be promoted at farm level by training farmers self-help groups for seed processing, packaging and trading
• Most of the cumin is exportedas raw seed, huge opportunity lies in converting the raw seed into value added products like essential oil, oleoresins etc., which is be exported at high price to western world
• As India is the world leader incumin and to sustain upon, strong linkages are required between research, developmental and marketing agencies to work out models for promotion of cumin production, value additions and marketing. n

97www.agriculturetoday.in Agriculture Year Book 2015

98 Agriculture Year Book 2015
www.agriculturetoday.in
Towards Achieving Self Sufficiency in Pulses
Pulses constitute a very important dietary constituent for humans and animals because of their richness with proteins (ranging from 15 to 34%, depending upon the crop
species) and other essential minerals, vitamins and dietary fibres. The protein content of grain legumes is approximately double the protein content of wheat and three times that of rice. They are also high in iron and consequently help in alleviating iron-deficiency anemia. Such a wide range of attributes make grain food le-gumes an essential ingredient in predominantly vegetarian diets of vast majority of people in In-dia and other countries of south-east Asia. Grain legumes are also used in Europe and America for gluten-free products, ready-to-eat baked goods, mixes, soups, sauces, and other foods with pulses as one of the ingredients. Howev-er, these are mostly consumed as natural food products in form of whole grains or dehulled or split grains in most of the world and hence, size
and shape of the seeds, seed
coat appearance, cotyledon size and color, and uniformity are important for markets.
In India, over a dozen pulse crops including chickpea, pigeonpea, cowpea, mungbean, urd-bean, lentil, French bean, horse gram, field pea, moth bean, lathyrus, etc. are grown in one or the other part of the country. However, the most important pulse crops grown here are chickpea (41%) followed by pigeonpea (15%), urdbean (10%), mungbean (9%), cowpea (7%) lentil (5%) and fieldpea (5%).The production of pulses in the country has witnessed an upward trend during the last few years and it has consistently remained at about >18 million tonnes since 2010. The production of 19.78 million tonnes of pulse grains for the year 2013-14 was an all time high. This was really encouraging for the pulses researchers as well as farmers and was a land-mark year for the country towards achieving self sufficiency in pulses production. Not look-ing far beyond, the scenario was entirely differ-ent during the first decade of this century when the total production of pulses was continuously
stagnating at around 14-15 million tonnes, and was always short by 2-3 mt of the
national demand. The deficit was mainly compensated by import of pulses from other countries
Dr. n.P. Singh, Director and
Dr. Aditya Pratap, Senior Scientist,ICAR-Indian
Institute of Pulses Research, Kanpur

99www.agriculturetoday.in Agriculture Year Book 2015
casting a heavy burden on the public exchequer. However, encouraged by the accomplishment of last few years and tremendous opportunities avail-able for vertical and horizontal expan-sion of pulses, the future seems to be promising towards achieving self suf-ficiency in pulses.
Area, Production and ProductivityIndia stands out as a leader in production as well as consumption of pulses in the world. During 2012-13, the total pulse production in India was 18.34 million tonnes (up by 7.31% over the previous year) which further increased by another 7.85% in 2013-14 with a production of 19.78 million tonnes, touching an all-time high record (Table 1).However, during 2014-15, the production is estimated to receive slight setback due to hostile weather conditions and consequently the production is predicted to tally at 17.20 million tonnes as per the fourth advanced estimates of Department of Agriculture and Cooperation. However, this appears to be a
momentary phase and is likely to be compensated by better production figures next year. The positive trend in production scenario has sustained since last four years. Looking retrospectively at the growth rate of area, production, yield and other important aspects of pulses, a positive and significant growth (1.17%) has been observed in area after 2000-01 although it was not significant for the overall period of three decades between 1970 to 2000. Similarly, the growth in case of production as well as for productivity during 2000 to 2012
was also positive and higher than that of the preceding three decades. Interestingly, the growth rate in pulse production (2.61%) during this decade has been even higher than the growth rate of rice (1.59%), wheat (1.89%) and all cereals together (1.88%). Among different pulses, the highest growth rate was observed in chickpea production (5.89%) followed by pigeonpea (2.61%). There are a number of factors which contributed together in significant rise of production in these crops including technology generation and its
Year Area (m. ha)
Production (m. ton)
Yield (Kg/ha)
2007-08 23.63 14.76 625
2008-09 22.09 14.57 659
2009-10 23.28 14.66 630
2010-11 26.28 18.24 694
2011-12 24.78 17.09 690
2012-13 23.26 18.34 789
2013-14 25.21 19.78 785
2014-15 * 23.37 17.20 743
*As per 3rd advance estimates by Department of Agriculture and Cooperation, Ministry of Agriculture, Government of India

100 Agriculture Year Book 2015
www.agriculturetoday.in
dissemination due to the concerted efforts of researchers,policy initiative by the government and pro-active involvement of various government agencies and policy makers, adoption of technology by the farmers and favorable environmental conditions. More than 560 improved varieties in different pulses, availability of their quality seed, improved pulse production and protection technologies, active government involvement and policy support, led to an upward growth in pulses production in India.
Geographical shift During the past three decades, the cultivation of pulses has witnessed an unprecedented geographical shift, catalyzed mainly by assured irrigation facilities being available in the Indo Gangetic plains, which once used to be the pulse basket of the country till the 1970s. The area under pulses in IGP was largely replaced by wheat, rice and maize due to assured irrigation facilities. However, reduction in area under pulses in IGP was compensated by an increase in central and southern parts of India, Andhra Pradesh
becoming the leader in total pulse production with an average increase in the yield of two of major pulses, chickpea and pigeonpea by about 81-100 % during the last two decades (1991-2010). Consequently, the total pulses area in central and south India increased from 11.34 million hectares to 15.01 million hectares. The short duration chickpea varieties developed by ICAR-SAU played a key role in expanding the area and productivity of chickpea in southern India. Similarly, while the area of lentil
increased significantly in Madhya Pradesh, and pigeonpea in Andhra Pradesh and Karnataka, development and adoption of appropriate varieties led to increase in area, production and yield of lentil in Jharkhand and Rajasthan. An increasing trend was also observed in the area under mungbean and urdbean in north India which increased to almost double alongwith a significant increase in productivity.
During the XI Plan period alone, significant improvement in produc-tion and productivity of total pulses was observed in Jharkhand, Guja-rat and Andhra Pradesh. In chick-pea, there was a positive growth in area, production and productivity in Andhra Pradesh, Gujarat, and Maha-rashtra. Production of pigeonpea was enhanced by about 2.53 lakh tonnes in Karnataka, 1.26 lakh tonnes in Gu-jarat and 1.13 lakh tonnes in Andhra Pradesh. Similarly, significant area expansion of pigeonpea by 1.13 lakh ha was noticed in Karnataka, and 0.74 lakh ha in Andhra Pradesh. With the development of short-duration vari-eties, there was expansion of mung-bean in summer season under rice-wheat system in north India. Similarly, in peas also, there was a significant increase in area and production in Ut-tar Pradesh (1.17 lakh ha and 1.8 lakh tonnes).
Constraints in increasing pulses productionThe average productivity of pulse crops in India (780 kg/ha) still remains low as compared to their potential harvestable yields (1.2-2.0 t). This is mainly because of their cultivation on poor soils with minimum inputs and the confounding effects of various biotic and abiotic stresses. While minor pests and diseases may
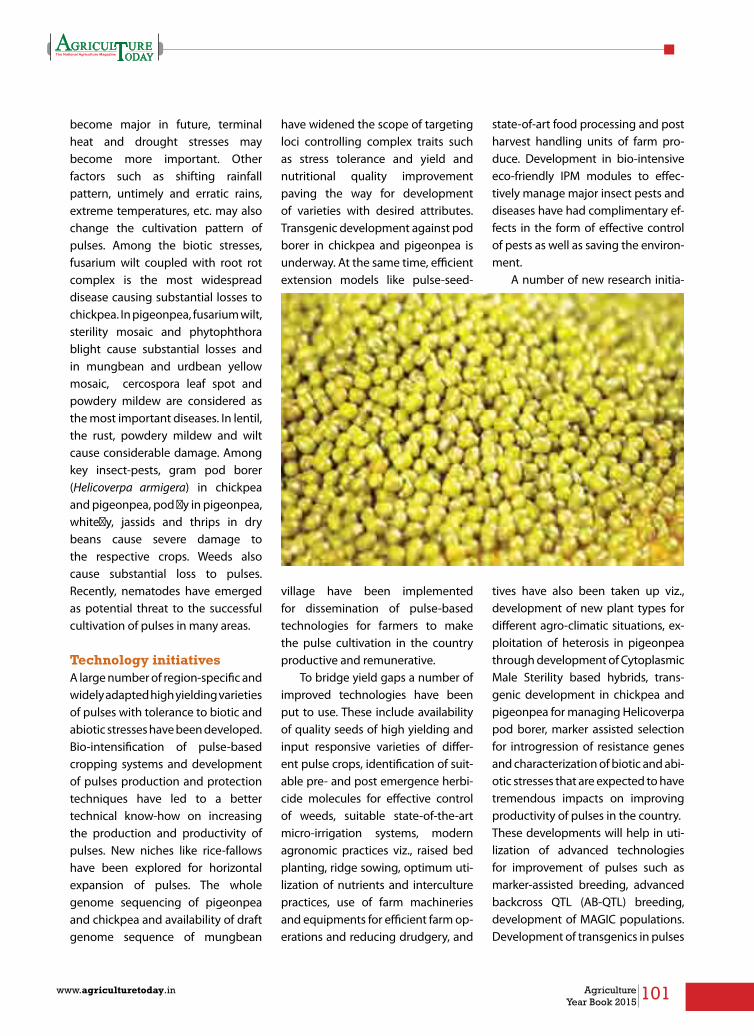
101www.agriculturetoday.in Agriculture Year Book 2015
become major in future, terminal heat and drought stresses may become more important. Other factors such as shifting rainfall pattern, untimely and erratic rains, extreme temperatures, etc. may also change the cultivation pattern of pulses. Among the biotic stresses, fusarium wilt coupled with root rot complex is the most widespread disease causing substantial losses to chickpea. In pigeonpea, fusarium wilt, sterility mosaic and phytophthora blight cause substantial losses and in mungbean and urdbean yellow mosaic, cercospora leaf spot and powdery mildew are considered as the most important diseases. In lentil, the rust, powdery mildew and wilt cause considerable damage. Among key insect-pests, gram pod borer (Helicoverpa armigera) in chickpea and pigeonpea, pod fly in pigeonpea, whitefly, jassids and thrips in dry beans cause severe damage to the respective crops. Weeds also cause substantial loss to pulses. Recently, nematodes have emerged as potential threat to the successful cultivation of pulses in many areas.
Technology initiativesA large number of region-specific and widely adapted high yielding varieties of pulses with tolerance to biotic and abiotic stresses have been developed. Bio-intensification of pulse-based cropping systems and development of pulses production and protection techniques have led to a better technical know-how on increasing the production and productivity of pulses. New niches like rice-fallows have been explored for horizontal expansion of pulses. The whole genome sequencing of pigeonpea and chickpea and availability of draft genome sequence of mungbean
have widened the scope of targeting loci controlling complex traits such as stress tolerance and yield and nutritional quality improvement paving the way for development of varieties with desired attributes. Transgenic development against pod borer in chickpea and pigeonpea is underway. At the same time, efficient extension models like pulse-seed-
village have been implemented for dissemination of pulse-based technologies for farmers to make the pulse cultivation in the country productive and remunerative.
To bridge yield gaps a number of improved technologies have been put to use. These include availability of quality seeds of high yielding and input responsive varieties of differ-ent pulse crops, identification of suit-able pre- and post emergence herbi-cide molecules for effective control of weeds, suitable state-of-the-art micro-irrigation systems, modern agronomic practices viz., raised bed planting, ridge sowing, optimum uti-lization of nutrients and interculture practices, use of farm machineries and equipments for efficient farm op-erations and reducing drudgery, and
state-of-art food processing and post harvest handling units of farm pro-duce. Development in bio-intensive eco-friendly IPM modules to effec-tively manage major insect pests and diseases have had complimentary ef-fects in the form of effective control of pests as well as saving the environ-ment.
A number of new research initia-
tives have also been taken up viz., development of new plant types for different agro-climatic situations, ex-ploitation of heterosis in pigeonpea through development of Cytoplasmic Male Sterility based hybrids, trans-genic development in chickpea and pigeonpea for managing Helicoverpa pod borer, marker assisted selection for introgression of resistance genes and characterization of biotic and abi-otic stresses that are expected to have tremendous impacts on improving productivity of pulses in the country. These developments will help in uti-lization of advanced technologies for improvement of pulses such as marker-assisted breeding, advanced backcross QTL (AB-QTL) breeding, development of MAGIC populations. Development of transgenics in pulses

102 Agriculture Year Book 2015
www.agriculturetoday.in
for resistance to pod borer and toler-ance to drought will have a long last-ing impact on increasing production and productivity of pigeonpea and chickpea.
Futuristic technologiesWith the development of efficient genetic transformation systems, it has now become possible to transfer desirable genes form alien sources into cultivated backgrounds. Realizing the potential of this technology, efforts have been initiated at IIPR to develop transgenics for pod borer resistance in chickpea. Over the year considerable progress has been made on this aspect. This technology is envisaged to play a major role in future for development of biotic and abiotic stress resistant cultivars in different food legumes. In case of transgenics, the transferred gene is usually derived from an alien species that is neither the recipient species nor a close, sexually compatible relative. This raises skepticism among a group of consumers as well as growers about the development and use of transgenics. With the aim of meeting these reservations and at the same
time ensuring an environmentally sound and efficient plant production, the two transformation concepts, intragenesis and cisgenesis, were developed as alternatives to transgenic crop development. In cisgenesis, the gene on interest, together with its promoter is taken from the species itself or a sexually compatible relative. Cisgenic plants have no extra risks as compared to plants from conventional breeding or mutation breeding. In the times to come the intragenesis and cisgenesis options will be the techniques of choice in case of legume species also and will be tremendously useful in transferring gene from wild relatives.
Information technology will un-derpin future progress and prosper-ity. Efforts must be made to strength-en the informatics in agriculture by developing databases, linking data-bases with international databases and adding value to information to facilitate decision making at various levels. Development of production models for various agro ecological regimes to forecast the production potential should assume greater im-portance. Using the remote sensing
and GIS technologies, natural and other agricultural resource should be mapped at micro and macro lev-els and effectively used for land and water use planning as well as agricul-tural forecasting, market intelligence and e business, contingency plan-ning¬ and prediction of disease and pest incidences.
Genomic tools provide com-prehensive information on genes involved in biochemical pathways leading upto nutritional com-pounds and can be used to un-derstand the genetics of traits of interest and consequently, helping in marker assisted breeding. Dur-ing the last two decades powerful genetic and genomic tools such as establishment of genetic and-physical maps, expressed sequence tags, bioinformatic tools, genome-widesequence data, genomic and metabolomic platforms, etc. have been developed for many legume species. These efforts have led to development of large scale molecu-lar markers, identification of various marker trait associations, construc-tion of genetic and linkage maps, expressed sequence tags database, partial or whole genome sequences, physical and molecular maps, DNA chips and bacterial artificial chro-mosome (BAC) libraries. Genome sequence information is available in important pulses like pigeonpea and chickpea and this information can be tremendously useful in har-nessing genomic resources for the improvement of not only these two crops, but also all other pulses.
Use of the conventional research methodologies, supplemented by the above-mentioned modern research tools will definitely go a long way in solving the problem of food and nu-tritional security to the mankind.

103www.agriculturetoday.in Agriculture Year Book 2015
Policy support for increasing pulses productionRealizing the yield gaps due to poor seed replacement rate and inadequ-ate dissemination of pulses cultivation technologies, several programmes viz., National Food Security Mission (NFSM) – Pulses, Accelerated Pulses Production Programme (A3P), Rashtriya Krishi Vikas Yojna (RKVY), 60,000 Pulses Villages, etc. were launched during the XI Plan period to boost pulses production in the country with technological back up and interventions of National Agricultural Research System and well planned financial support of Planning Commission and Ministry of Agriculture, Govt. of India. Region-specific, cost effective and system-based technological know-how and packages of pulses were disseminated among the farmers through farmers’ participatory research and extension, on–farm demonstrations, front line demonstrations, and skill based training to bridge the gap between potential and realized yield in pulses. Inclusion and adoption of improved varieties of different pulse crops under different farming systems also helped in increasing productivity per unit area. The policy initiatives such as increasing the minimum support price by the Government also encouraged the farmers to take up pulse cultivation as a profitable venture.
Quality seed acts as a prime input to realize the potential of all other inputs. However, non-availability of quality seeds remains one of the greatest impediments in improv-ing productivity. Under the National Food Security Mission, breeder seed production was doubled. Involve-ment of private seed agencies, NGOs
and farmers associations besides farmers’ participatory seed produc-tion programme had been encour-aged besides firming up public sector seed production.
DirectionsAlthough the production of pulses in the country has tremendously improved during the last 4-5 years, it is still not sufficient to meet the present domestic requirement of about 22 million tonnes. Further, since major pulses are largely cultivated under rainfed and monsoon dependent areas where soil moisture is the critical factor determining the productivity, the production trends keep fluctuating every year depending upon rainfall. Assuming a moderate requirement of 35g pulses per capita per day with 10% additional need for seeds, feed, wastage, etc., the projected pulse requirement by the year 2050 will be about 39 million tonnes. This necessitates an annual growth rate of 2.14 %. For achieving this goal, the average pulse productivity needs to be enhanced to about 1200 kg/ha and about 4-5 million hectare additional area has to be brought under pulses, besides ensuring a drastic reduction in post-harvest losses.
This requires a paradigm shift in research and technology generation, its dissemination as well as commer-cialization along with capacity build-ing in frontier areas of research.Pres-ently, chickpea alone shares about 45% of the total pulses production of the country followed by pigeonpea, mungbean, urdbean and other puls-es. However, irrigated pulses com-prising of greengram, blackgram and fieldpea can largely compensate the projected yield gap. Recently short duration varieties of pulses enabled
extensive cultivation of chickpea in central and south India, and summer mungbean in Rajasthan. The geo-graphical shift in pulses area and pro-duction is an indication of potentiali-ties of pulses to adapt under diverse climatic conditions and possible fu-ture expansion in new niches. High production of pulses during the last few years could be possible primar-ily due to availability of quality seeds and proven technological back up.
There is potential for expanding pulse cultivation in irrigated and rainfed regions through cropping system manipulation, crop intensi-fication and new niches. At present, approximately 10.5 m ha area under rice-wheat system offers scope for introduction of pulses to sustain the system productivity. Likewise, rice fallows of eastern India and coastal regions can be efficiently utilized by utera (paira) cropping of lentil, urdbean and mungbean. There is scope to grow pulses in inter-row space of crops like sugarcane, pearl millets, and sorghum. It is expected that at least 2.5 million ha area can be brought under horizontal expan-sion through appropriate cropping systems.
The production of cereals has al-most doubled since 1970. However, in case of pulses, the improvement is comparatively slow. With rising demand of vegetarian food due to ever-increasing population and di-versification of food habits, demand of pulses is increasing at a fast pace. This will be further challenged by changing climate. Post-harvest losses of food legumes still remain a matter of great concern. Accordingly, pulses researchers have to remain prepared with a wide range of pulse genotypes which may adapt themselves across changing climates. n

104 Agriculture Year Book 2015
www.agriculturetoday.in
Sectoral strengths, issues and coping up strategies of coconut, arecanut and cocoa in India
Plantation crops in India are consid-ered to be the major segment of the horticulture crops and the main-stay of agrarian economies in many States and Union Territories (UTs)
of the country. They contribute a significant amount to the national exchequer and coun-try’s exports by way of excise and export earn-ings. The major plantation crops in India include coconut, arecanut, oil palm, cashew, tea, coffee, rubber and cocoa. India is the largest producer and consumer of cashew nut and arecanut. Tea and coffee are the main and oldest industries in the country, which provide ample employment opportunities to the people and hold immense potential for export. But, in India, plantation crops have been continuously facing the prob-lem of lack of investment and depressed yields, and are in great need of modernization. Their total coverage is comparatively less and they are mostly confined to small holdings.
National production scenario The area under coconut has been estimated to be 2.14 million ha (2013) and India stands third and first among the coconut growing countries in area and production, respectively. The estimated production of coconut in 2012-13 was 23 billion nuts, registering an increase of about 4.48% over the previous year. Out of the total production of 23 billion nuts of coconut in India, four states of Andhra Pradesh, Karnataka, Kerala and Tamil Nadu together account for 91.30 per cent of the total production in the country. In terms of area, they contribute to 89.11 per cent.
In India, arecanut is cultivated in an area of 453,000 hectares with an annual production of 632,000 tonnes. The states of Karnataka, Kerala, Assam, West Bengal and Meghalaya are the ma-jor producers and account for more than 94% of the area and production.
In India, cocoa is cultivated mainly in the
states of Tamil Nadu, Andhra Pradesh, Kerala, and Karnataka. At present, demand for cocoa beans is higher than the domestic production, necessitating large scale imports to meet the national requirement. India produced 15,133 tonnes of cocoa from an area of 71,245 hectares. Tamil Nadu has the highest area under cocoa (33.6%), followed by Andhra Pradesh (31.1%), and while in the case of cocoa production, Kerala has the major share (41.8%) followed by Andhra Pradesh (37.0%). Indian productivity is 236 kg/ha whereas the world productivity is 504 kg/ha.
Trade aspects of coconut, arecanut and cocoaThe export of coconut and coconut products from India recorded an increase of 13.5 per cent during 2014- 15, compared to the previous year. The earnings from the export of coconut products, excluding coir and coir products was Rs 1312.38 crore during the period compared to Rs 1156.12 crore in 2013-14. The share of activated carbon in the total exports was Rs 558 crore during the year, slightly lower than in the preceding year, mainly due to the drop in coconut production. The export declined also due to the higher domestic price of shell charcoal, the raw material used for the production of activated carbon, affecting the competitiveness of the product in the International market. The export of virgin coconut oil increased in both quantity and value (from Rs 4.81 crore in 2013-14 to Rs 24.72 crore during 2014-15). As regards coir and coir products, their exports touched a record high valued at Rs. 1476 crores during 2013-14.
Major destinations of arecanut export are Vietnam, Indonesia, Malaysia, UAE, Maldives, UK and Singapore. Supari/scented supari and pan masala are two major value added products of arecanut having sizeable quantity of export. From 1999 onwards, import of arecanut to India registered a significant increase due to change in global scenario in the context of trade liberaliza-
Dr. V. Krishnakumar, Head, CPCRI,
Kayamkulam ; Dr. S. Jayasekhar,
Scientist, CPCRI, Kasargod and
Dr. P. Chowdappa, Director, Central Plantation Crops
Research Institute, Kasragod

105www.agriculturetoday.in Agriculture Year Book 2015
tion. Total imports were about 97316 tonnes of arecanut, which was valued at Rs 58979 lakhs during 2012-13.
Sectoral strengthIn India, coconut research is vested with the ICAR-Central Plantation Crops Research Institute under the administrative control of Indian Council of Agricultural Research (ICAR). The All India Coordinated Research Centers on Palms (AICRP on Palms) managed by Agricultural/Horticultural Universities of different states also conducts research for the development of location-specific technologies for coconut. The developmental activities on coconut are taken up by the Coconut Development Board (CDB), Ministry of Agriculture, Government of
India. Advancements in Research & Development in coconut sector in India are rated as number one among the coconut growing countries.
India has made significant progress in developing technology for crop improvement, crop production and crop protection. The country is also in the forefront of nations having large collection of coconut germplasm. Huge untapped domestic market, attractive domestic price, emergence of three tier farmer producer organization (FPO), high domestic demand for value added products, availability of indigenous processing technologies are the strengths of the Indian coconut sector.
The average national productivity of coconuts in India is around 63 nuts per palm per year. In contrast, certain elite coconut palms are reported to yield more than 400 coconuts per palm per year. With a focus to im-prove productivity and overall profit-ability to the farmers, research efforts have been focussed on development of high yielding coconut varieties and large number of high yielding variet-ies and hybrids have been evolved and released. The other technologi-cal advancements include standard-ization of various location-specific agronomic management packages including nursery techniques; input
Chandra sankara, high yielding hybrid coconut variety
Coconut based high density cropping system for empowering for small and marginal farmers

106 Agriculture Year Book 2015
www.agriculturetoday.in
management techniques like inte-grated nutrition management, water management; plant health manage-ment techniques for pest and diseas-es); inter cropping,/mixed cropping/multiple cropping/integrated farming in coconut based farming system etc. for increasing resource use efficiency and higher income and employment generation, which are being adopted by the coconut farmers across the country.
With respect to arecanut, many varieties have been released by differ-ent agencies like ICAR institutes and State Agricultural Universities. In the recent period, availability of skilled labourers has become a problem for operations like spraying fungicides and harvesting and hence, dwarf va-rieties/hybrids offer great potential. The protocol developed by ICAR-
CPCRI for somatic embryogenesis and plantlet regeneration could be exploited for mass multiplication of dwarf hybrids and identifying yellow leaf disease (YLD) field tolerant palms in endemic areas.
CPCRI has developed high yield-ing elite clones and hybrids, with yield range up to 2.5 kg dry bean /tree and with varying processing qualities suit-able to arecanut, coconut and oilpalm gardens as an ideal inter crop
Mechanization, value addition and product diversificationMechanization of farm operations is the immediate requirement to reduce the cost of production, especially in the context of high labour wages and their non availability for timely farm operations. The chemberi model climbing machine became an effective solution since it could be operated even by women with some training. The safety attachment, later incorporated by ICAR-CPCRI gives much required confidence to the climbers especially the beginners. Apart from this, manually and power operated coconut husking machines; coconut splitting device; de-shelling machine; tender coconut punch and cutter; coconut dryers of varying capacities and using different fuel sources; testa remover; coconut slicing machine and VCO cooker etc. are the other major contributions from the institute. Mechanization of unit operations in coir production has also played an important role in coir industry. India is the largest coir producer in the world accounting for more than 80 per cent of the total world production of coir fibre. The coir sector in India is very diverse and involves households, co-operatives, NGOs, manufacturers and exporters. Coconut processing and allied industries provides continuous employment to nearly 8 lakhs workers of which 80 per cent are women folk.
There exists a huge scope for co-conut based agri-business in India in
High yielding forastro cocoa variety suitable to palm based cropping systems

107www.agriculturetoday.in Agriculture Year Book 2015
order to increase the present 8% level of value addition to 25%, thereby val-ue added products becoming a de-ciding factor in the price movement of coconut to ensure fair, reasonable and steady price to coconut farmers. In an effort towards value addition, ICAR-CPCRI has developed complete package of practices for the produc-tion of virgin coconut oil (hot and fermentation process), coconut chips, coconut honey, jaggery and sugar. The estimated annual monetary ben-efits in hot process VCO, fermenta-tion process VCO and coconut chips are Rs.13,70,000, Rs.8,12,500 and Rs.47,35,800 respectively. CPCRI has developed a technology for collect-ing coconut inflorescence sap by us-ing a device. The sap thus collected is called Kalparasa. Kalparasa can be pre-served up to 45 days under cold con-dition (in refrigerator) without adding any preservatives and additives with the bottling technology. It has been demonstrated that a farmer tap-ping 15 coconut palms for Kalparasa
could earn on an average Rs. 45,000 a month, while a tapper can earn about Rs. 20,000 per month. Several value added technologies are available for arecanut by-product utilization such as making of eco-friendly dis-posable plates and bowls from areca leaf sheath, leaf sheath fodder, oyster mushroom production from leaf and bunch wastes and vermicomposting. Skill development/capacity building for women SHGs and rural youth for efficient by-product utilization in are-canut by various means is necessary to ensure value addition and income generation.
Challenges confronted by the sectorThe fact that the plantation crops sector in the country is dominated by millions of small and marginal farmers and mainly confined to the economically and ecologically vulnerable regions, plays a crucial role as far as the issue of sustainability is concerned. In order to address
the challenges and convert the weaknesses to opportunities, concerted efforts from all stake holders is very much essential. In India, most of the coconut plantations are old and senile. While world consumption of coconut products is growing more than 10% a year, production is increasing by only 2%. To maximize the productivity from such coconut gardens, care should be taken to replant with quality planting materials. Considering the replanting needs of old and senile coconut plantations, replacing the diseased palms in traditional coconut growing areas and expanding the cultivation in non-traditional areas, about 22 million seedlings per year would be required for the country. The present annual production of seedlings is estimated to be around 20 million, resulting in a likely annual deficit to the tune of 2 million seedlings. Further, the present quantum of production of planting material from the governmental sector works out to about six million seedlings, and accounts for only 25% of the total planting material requirement in the country.
Monocropping of coconut very often fails to produce maximum re-turns from unit area and results in poor resource use efficiency. In order to increase the total farm produc-tivity, coconut based inter/mixed, multi-storied multi-species cropping as well as mixed farming systems by integrating livestock components for different agro ecological zones are to be adopted by the farmers.
The spread of root (wilt) disease, outbreak of Phytophthora and Gano-derma wilt or basal stem rot disease are the major concerns in the coconut sector. Some minor diseases like leaf spot or leaf blight and stem bleeding
Value added products of coconut

108 Agriculture Year Book 2015
www.agriculturetoday.in
are also becoming severe, probably with changing climate and difficulty in adopting the management strate-gies in time due to various socio-eco-nomic reasons.
Considering the growing threat to coconut production and productivity from alien invasive species, there is an urgent need to formulate and estab-lish an efficient ‘Biosecurity System’ to regularly monitor quarantine and contain the invasive pests in porous borders. Non-availability of skilled climbers for application of the biocon-trol agents or chemicals to the crown regions of the tall coconut palm is the main reason for non-adoption of many of the crop protection tech-nologies.
Fruit rot caused by Phytophthora and Yellow Leaf Disease (YLD) caused by phytoplasma are currently the most important yield limiting factors in arecanut. The increasing incidence of other diseases like inflorescence dieback and basal stem rot are other major concerns.
Even though the area under cocoa cultivation in India, when compared to other countries, is limited, many efforts are being initiated by the Di-rectorate of Cocoa and Cashew, Govt. of India for area expansion and other production related aspects. It is nec-essary to develop and refine minimal
cocoa bean processing techniques on priority basis to facilitate the small farmers.
Coping up strategiesIt is of paramount importance to develop an exclusive policy by each state for production and supply of elite planting materials for the area expansion and rejuvenation programmes. Considering the requirement of planting material in the coming decades, there is urgent need for doubling the planting material production capability of governmental agencies viz., ICAR-CPCRI, Coconut Development Board, State Agricultural Universities and Department of Agriculture/Horticulture in different states. In order to make available quality seedlings for the farmers, it is necessary to develop coconut seed gardens in a Private Public Partnership (PPP) mode and this could be assigned to Coconut Producers Societies, accredited Coconut Nurseries and NGO’s, through a decentralized seedling production programmes. Imparting appropriate training on hybridization technique to the technical personnel involved in the planting material production programme also becomes necessary. It is also essential to develop a system of mandatory accreditation of all
coconut nurseries to ensure that supply of quality seedlings alone takes place. Ensuring the quality of planting material also envisages the development of variety-specific standards and implementation of suitable certification process.
Considering the limitations in meeting the demand for elite plant-ing material of improved varieties through conventional techniques, application of in vitro techniques, as-sumes importance as a plausible tech-nique to produce large number of genetically uniform plantlets. Hence, research organizations in the country should focus on development of reli-able and robust protocols for rapid multiplication of elite high yielding and disease resistant coconut palms and hybrids.
To counter the outbreaks of minor pests like scale insects, mealy bugs, inflorescence caterpillar and slug cat-erpillar, the surveillance mechanisms as well as forecasting and forewarn-ing systems for pests and diseases of coconut are to be strengthened. Development of an effective and easy way of delivery of biocontrol agents or chemicals with machineries for the management of the diseases like bud rot, leaf rot, leaf blight or basal stem rot, is to be given top most priority to achieve success in plant health man-
Utilization of arecanut leaf sheaths for production of eco-friendly plates and cups.

109www.agriculturetoday.in Agriculture Year Book 2015
agement in the scenario of labour constraints in the agricultural sector.
Further, value added products from coconut inflorescence sap, en-dosperm and tender nut water need to be refined and popularized to tap the market for health foods and nu-traceuticals and improve profitability of the sector. At the same time, con-version of coconut shells into char-coal and subsequent conversion of the charcoal thus produced into acti-vated carbon opens up an avenue for community level processing for value addition of these by-products.
Streamlining of extension ap-proaches is to be undertaken to suit the fragmented small and marginal holdings. Partici-patory research, involving farmer groups for refining and fine tuning of technol-ogies for higher efficiency of the sector is to be given greater emphasis. Farmer organizations are to be facilitated for meaningful partnership in technology generation and transfer and for achieving efficiency in commodity value chain. Integrat-ing youth/women farmers organiza-tions with other main stream groups in agriculture with leadership roles and mainstreaming functions should be supported with policy prioritiz-ing, for empowerment of the target groups and sustained development of the coconut sector.
Any further area expansion of are-canut, both in traditional and non-tra-ditional areas is to be strictly prohib-ited and simultaneously the arecanut based cropping systems should be encouraged in the existing arecanut plantations in the country. We need to have a futuristic vision to evolve integrated and scientifically planned
areca based cropping models in the country which include livestock, fish-ery component, and staple food/nu-tritional components. Evolving region specific arecanut-based sustainable cropping system models and pro-moting multi-species cropping sys-tem in collaboration with Directorate of Arecanut and Spices Development should be given emphasis.
About 23 lakh ha area is available in India under coconut and arecanut plantations for cultivation of cocoa plants as intercrop and around 35% of this land is under irrigation. Avail-ability of such areas in Kerala, Karna-taka, Tamil Nadu, Andhra Pradesh and
Orissa, therefore, offers ample scope for newer area expansion of cocoa. At present the area of cocoa is around 71 thousand ha and it could be pos-sible to introduce an additional 40 thousand ha into cocoa plantation by 2020. Meanwhile the productivity should be increased to 700 kg/ha, and if 60% of the newly introduced area will give full potential yield, it could produce 46 thousand tonnes of cocoa beans by the year 2020.
It is of utmost importance to es-tablish village level primary process-ing units and capacity building for fer-mentation and drying of cocoa beans with the formation of strong farmer aggregates, women SHG’s and rural
youth. Development of exclusive mar-ket yards and assembling places for cocoa beans along with the adoption of high quality food safety standards would be a pro-active step for better realization of bean prices. Assured buy-back systems developed in the frame of contract farming facilitated by leading chocolate manufacturers under the stake of government can also help the growth of the sector.
Plantation sector in India, rep-resented by crops such as coconut, arecanut and cocoa, has inherent strength of varied agro-climatic con-ditions, huge domestic demand, comparatively higher productivity,
strong R&D support, and tech-nology delivery systems. In spite of these positive aspects, concerted efforts are deficient to effectively utilize the possi-ble linkage between them for increasing the production and marketing efficiencies. Sustain-able economy of these crops could be achieved through in-tegrated development of cul-tivation and industry coupled with a stable market. The new
initiatives such as formation of farm-ers’ collectives, for group activities, collaborative research for production of high yielding and hybrid seedlings, skill up gradation of farming commu-nity and creating more skilled labour-ers for farming, harvesting and pro-cessing operations aimed at enhanc-ing production, processing and value addition, etc. will definitely place Indi-an coconut, arecanut and cocoa sec-tors at forefront in the world. Above all, as food safety standards are be-coming more stringent in the world, to be competitive in the trade, one should give adequate importance to the Good Management Practices (GMP) in the plantation sector. n


AnimAl huSbAndry,dAiry And FiSherieS
AnimAl huSbAndry,dAiry And FiSherieS
AnimAl huSbAndry,dAiry And FiSherieS
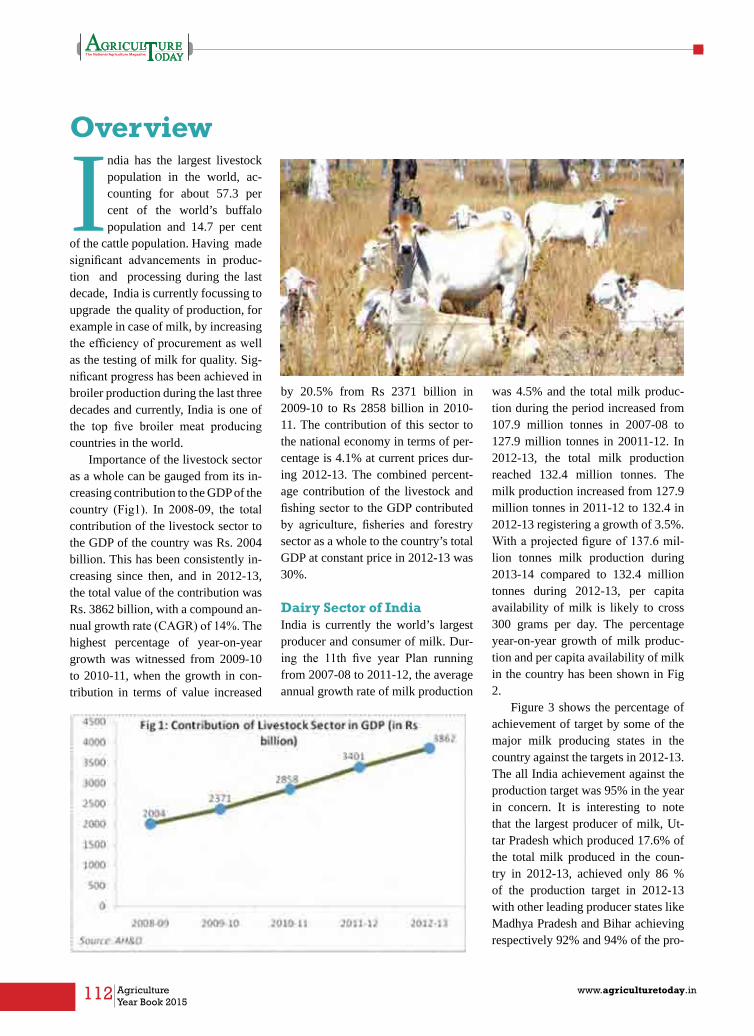
112 Agriculture Year Book 2015
www.agriculturetoday.in
Overview
India has the largest livestock population in the world, ac-counting for about 57.3 per cent of the world’s buffalo population and 14.7 per cent
of the cattle population. Having made significant advancements in produc-tion and processing during the last decade, India is currently focussing to upgrade the quality of production, for example in case of milk, by increasing the efficiency of procurement as well as the testing of milk for quality. Sig-nificant progress has been achieved in broiler production during the last three decades and currently, India is one of the top five broiler meat producing countries in the world.
Importance of the livestock sector as a whole can be gauged from its in-creasing contribution to the GDP of the country (Fig1). In 2008-09, the total contribution of the livestock sector to the GDP of the country was Rs. 2004 billion. This has been consistently in-creasing since then, and in 2012-13, the total value of the contribution was Rs. 3862 billion, with a compound an-nual growth rate (CAGR) of 14%. The highest percentage of year-on-year growth was witnessed from 2009-10 to 2010-11, when the growth in con-tribution in terms of value increased
by 20.5% from Rs 2371 billion in 2009-10 to Rs 2858 billion in 2010-11. The contribution of this sector to the national economy in terms of per-centage is 4.1% at current prices dur-ing 2012-13. The combined percent-age contribution of the livestock and fishing sector to the GDP contributed by agriculture, fisheries and forestry sector as a whole to the country’s total GDP at constant price in 2012-13 was 30%.
Dairy Sector of IndiaIndia is currently the world’s largest producer and consumer of milk. Dur-ing the 11th five year Plan running from 2007-08 to 2011-12, the average annual growth rate of milk production
was 4.5% and the total milk produc-tion during the period increased from 107.9 million tonnes in 2007-08 to 127.9 million tonnes in 20011-12. In 2012-13, the total milk production reached 132.4 million tonnes. The milk production increased from 127.9 million tonnes in 2011-12 to 132.4 in 2012-13 registering a growth of 3.5%. With a projected figure of 137.6 mil-lion tonnes milk production during 2013-14 compared to 132.4 million tonnes during 2012-13, per capita availability of milk is likely to cross 300 grams per day. The percentage year-on-year growth of milk produc-tion and per capita availability of milk in the country has been shown in Fig 2.
Figure 3 shows the percentage of achievement of target by some of the major milk producing states in the country against the targets in 2012-13. The all India achievement against the production target was 95% in the year in concern. It is interesting to note that the largest producer of milk, Ut-tar Pradesh which produced 17.6% of the total milk produced in the coun-try in 2012-13, achieved only 86 % of the production target in 2012-13 with other leading producer states like Madhya Pradesh and Bihar achieving respectively 92% and 94% of the pro-

113www.agriculturetoday.in Agriculture Year Book 2015
duction target in this year. States like Punjab, Haryana, Andhra Pradesh and J&K achieved 100% of the production targets while Rajasthan achieved 99% of the production target in 2012-13. Karnataka, Maharashtra and Himachal each achieved 98% of the target.
According to Fig 4, production of fresh dairy products in India in 2014 was 162 million tonnes. This repre-sents an increase by almost 25% when compared to the production figure of 130 million tonnes in 2010. India is currently the world’s largest producer
and consumer of milk and the dairy sector is providing a fillip to the entrepreneurial activities of various people into the dairy business. Various cor-porate entities are also entering the sector and increasing their presence. Through a concerted effort and through agencies like National Dairy Devel-opment Board, efforts are on to increase the production of dairy to meet the rapidly grow-ing demand.
Amongst various milk products, butter holds an important position with various
enterprises operating in the sector. In 2014, total production of butter in the country was 3.7 million tonnes, increasing from 3.4 million tonnes in 2010. The sector is dominated by brands like Amul from Gujarat Co-operative Milk Marketing Federation (GCMMF) along with other major players like the Mother Dairy. As in-come levels are increasing, more Indi-ans are purchasing less grain and more higher-value, nutritious products like butter to supplement the family nutri-tion requirements. This in turn is lead-
ing to an increased demand for safe, higher quality dairy products which in turn is acting as a growth driver for the formal dairy sector to expand.
Indian Meat Sector The total meat production in the coun-try for the year 2012-13 was almost 6 million tonnes. During the period between 2008-09 and 2012-13, meat production experienced an average annual growth rate of 8.2%. Currently, India ranks fifth in the world in beef production while in terms of domestic consumption, it ranks seventh. India is also the leader in terms of export of beef meat. Production of beef and veal meat in the country in 2010 was 2.6 million tonnes which has increased to 3 million tonnes in 2014. The poultry meat production in 2010 was 2.2 mil-lion tonnes which has increased mar-ginally to 2.6 million tonnes in 2014 (Fig 6).
Pig and goat/sheep meat are also important contributors to the total meat production scenario of the coun-try. As seen in Fig 7, pig meat produc-tion in the country was 332 thousand tonnes and during the period between 2010 and 2014, its production has witnessed fluctuating trend. In 2014, the total production of pig meat in the country was 327 thousand tonnes. However, the production of sheep and goat meat has maintained a consis-tently increasing trend. The total pro-
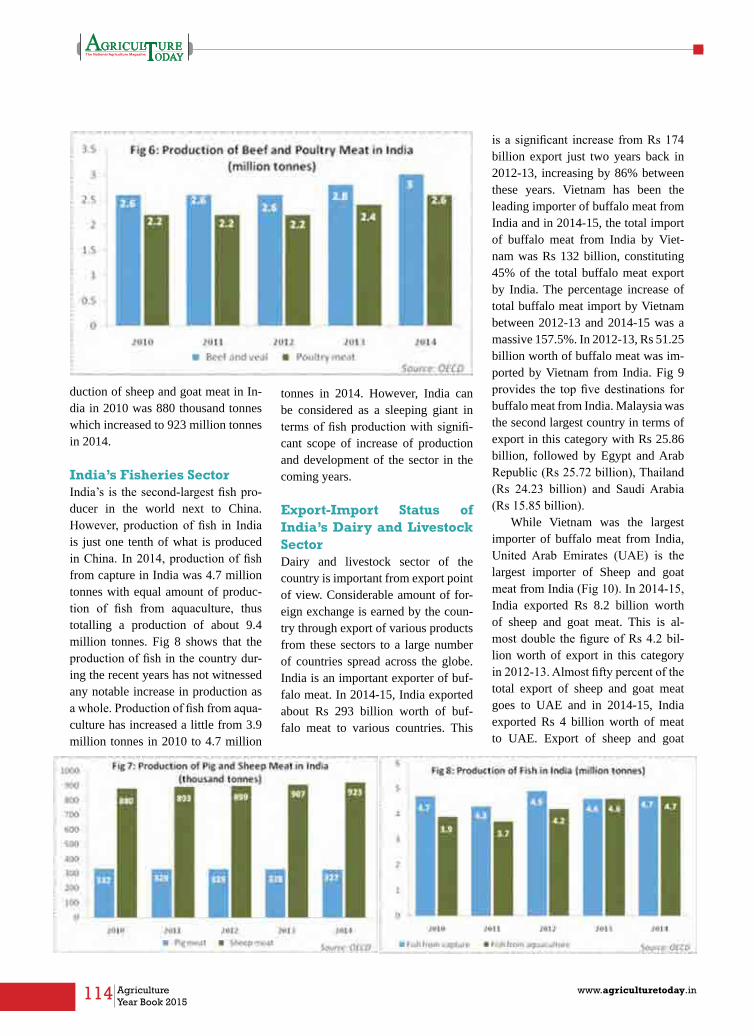
114 Agriculture Year Book 2015
www.agriculturetoday.in
duction of sheep and goat meat in In-dia in 2010 was 880 thousand tonnes which increased to 923 million tonnes in 2014.
India’s Fisheries SectorIndia’s is the second-largest fish pro-ducer in the world next to China. However, production of fish in India is just one tenth of what is produced in China. In 2014, production of fish from capture in India was 4.7 million tonnes with equal amount of produc-tion of fish from aquaculture, thus totalling a production of about 9.4 million tonnes. Fig 8 shows that the production of fish in the country dur-ing the recent years has not witnessed any notable increase in production as a whole. Production of fish from aqua-culture has increased a little from 3.9 million tonnes in 2010 to 4.7 million
is a significant increase from Rs 174 billion export just two years back in 2012-13, increasing by 86% between these years. Vietnam has been the leading importer of buffalo meat from India and in 2014-15, the total import of buffalo meat from India by Viet-nam was Rs 132 billion, constituting 45% of the total buffalo meat export by India. The percentage increase of total buffalo meat import by Vietnam between 2012-13 and 2014-15 was a massive 157.5%. In 2012-13, Rs 51.25 billion worth of buffalo meat was im-ported by Vietnam from India. Fig 9 provides the top five destinations for buffalo meat from India. Malaysia was the second largest country in terms of export in this category with Rs 25.86 billion, followed by Egypt and Arab Republic (Rs 25.72 billion), Thailand (Rs 24.23 billion) and Saudi Arabia (Rs 15.85 billion).
While Vietnam was the largest importer of buffalo meat from India, United Arab Emirates (UAE) is the largest importer of Sheep and goat meat from India (Fig 10). In 2014-15, India exported Rs 8.2 billion worth of sheep and goat meat. This is al-most double the figure of Rs 4.2 bil-lion worth of export in this category in 2012-13. Almost fifty percent of the total export of sheep and goat meat goes to UAE and in 2014-15, India exported Rs 4 billion worth of meat to UAE. Export of sheep and goat
tonnes in 2014. However, India can be considered as a sleeping giant in terms of fish production with signifi-cant scope of increase of production and development of the sector in the coming years.
Export-Import Status of India’s Dairy and livestock SectorDairy and livestock sector of the country is important from export point of view. Considerable amount of for-eign exchange is earned by the coun-try through export of various products from these sectors to a large number of countries spread across the globe. India is an important exporter of buf-falo meat. In 2014-15, India exported about Rs 293 billion worth of buf-falo meat to various countries. This
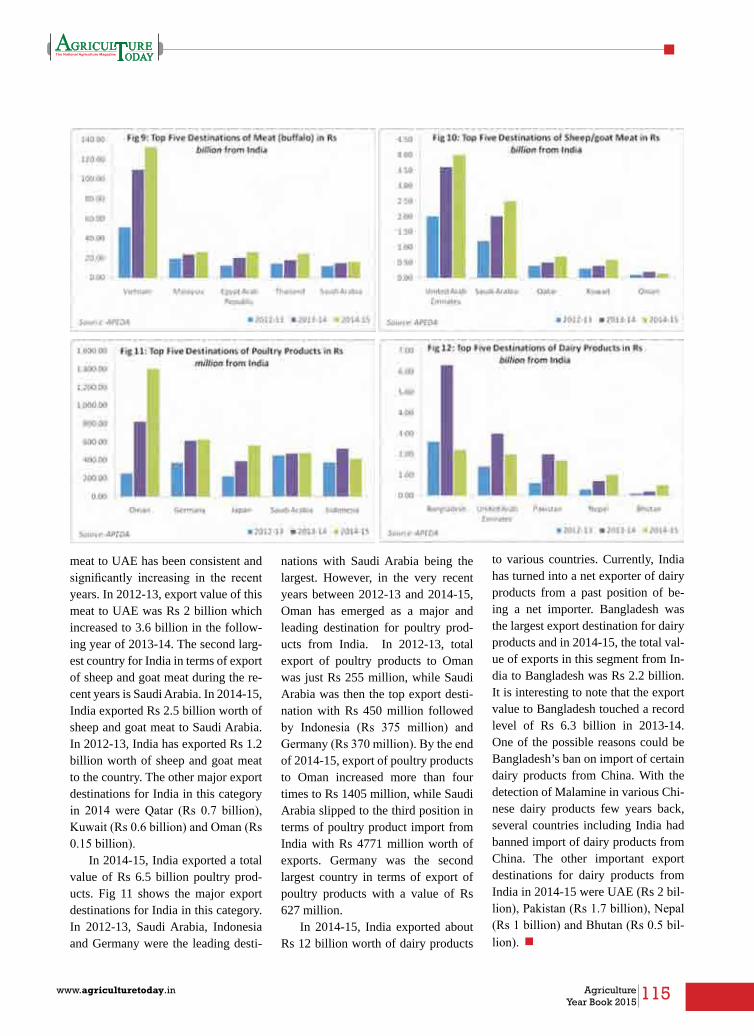
115www.agriculturetoday.in Agriculture Year Book 2015
meat to UAE has been consistent and significantly increasing in the recent years. In 2012-13, export value of this meat to UAE was Rs 2 billion which increased to 3.6 billion in the follow-ing year of 2013-14. The second larg-est country for India in terms of export of sheep and goat meat during the re-cent years is Saudi Arabia. In 2014-15, India exported Rs 2.5 billion worth of sheep and goat meat to Saudi Arabia. In 2012-13, India has exported Rs 1.2 billion worth of sheep and goat meat to the country. The other major export destinations for India in this category in 2014 were Qatar (Rs 0.7 billion), Kuwait (Rs 0.6 billion) and Oman (Rs 0.15 billion).
In 2014-15, India exported a total value of Rs 6.5 billion poultry prod-ucts. Fig 11 shows the major export destinations for India in this category. In 2012-13, Saudi Arabia, Indonesia and Germany were the leading desti-
nations with Saudi Arabia being the largest. However, in the very recent years between 2012-13 and 2014-15, Oman has emerged as a major and leading destination for poultry prod-ucts from India. In 2012-13, total export of poultry products to Oman was just Rs 255 million, while Saudi Arabia was then the top export desti-nation with Rs 450 million followed by Indonesia (Rs 375 million) and Germany (Rs 370 million). By the end of 2014-15, export of poultry products to Oman increased more than four times to Rs 1405 million, while Saudi Arabia slipped to the third position in terms of poultry product import from India with Rs 4771 million worth of exports. Germany was the second largest country in terms of export of poultry products with a value of Rs 627 million.
In 2014-15, India exported about Rs 12 billion worth of dairy products
to various countries. Currently, India has turned into a net exporter of dairy products from a past position of be-ing a net importer. Bangladesh was the largest export destination for dairy products and in 2014-15, the total val-ue of exports in this segment from In-dia to Bangladesh was Rs 2.2 billion. It is interesting to note that the export value to Bangladesh touched a record level of Rs 6.3 billion in 2013-14. One of the possible reasons could be Bangladesh’s ban on import of certain dairy products from China. With the detection of Malamine in various Chi-nese dairy products few years back, several countries including India had banned import of dairy products from China. The other important export destinations for dairy products from India in 2014-15 were UAE (Rs 2 bil-lion), Pakistan (Rs 1.7 billion), Nepal (Rs 1 billion) and Bhutan (Rs 0.5 bil-lion). n
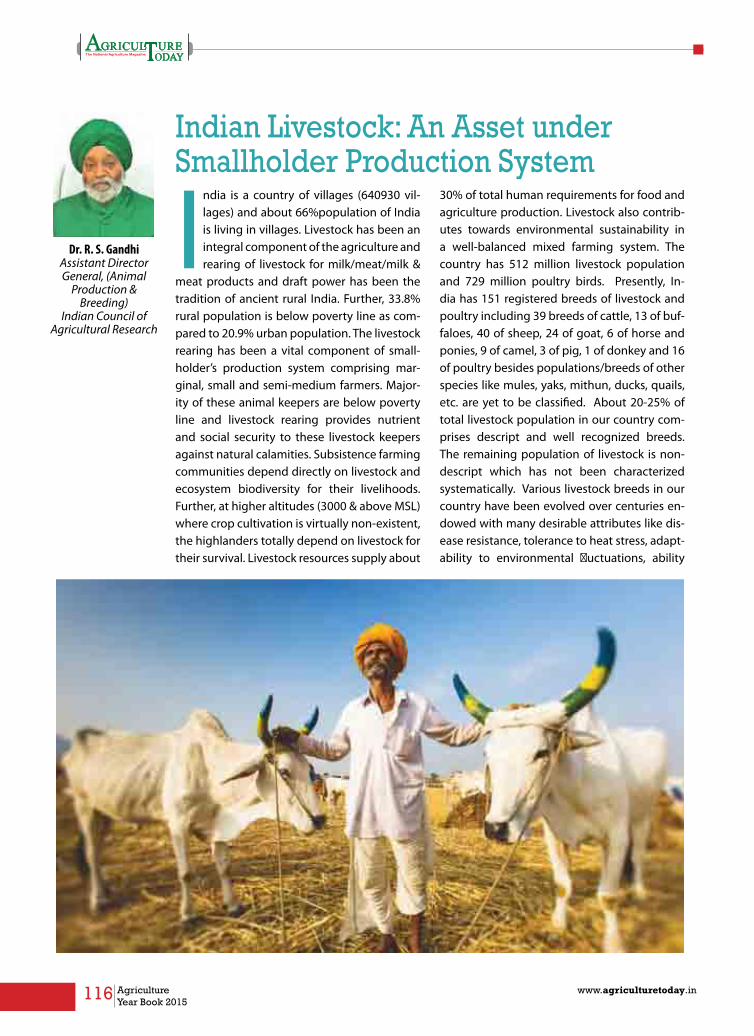
116 Agriculture Year Book 2015
www.agriculturetoday.in
Indian Livestock: An Asset under Smallholder Production System
India is a country of villages (640930 vil-lages) and about 66%population of India is living in villages. Livestock has been an integral component of the agriculture and rearing of livestock for milk/meat/milk &
meat products and draft power has been the tradition of ancient rural India. Further, 33.8% rural population is below poverty line as com-pared to 20.9% urban population. The livestock rearing has been a vital component of small-holder’s production system comprising mar-ginal, small and semi-medium farmers. Major-ity of these animal keepers are below poverty line and livestock rearing provides nutrient and social security to these livestock keepers against natural calamities. Subsistence farming communities depend directly on livestock and ecosystem biodiversity for their livelihoods. Further, at higher altitudes (3000 & above MSL) where crop cultivation is virtually non-existent, the highlanders totally depend on livestock for their survival. Livestock resources supply about
30% of total human requirements for food and agriculture production. Livestock also contrib-utes towards environmental sustainability in a well-balanced mixed farming system. The country has 512 million livestock population and 729 million poultry birds. Presently, In-dia has 151 registered breeds of livestock and poultry including 39 breeds of cattle, 13 of buf-faloes, 40 of sheep, 24 of goat, 6 of horse and ponies, 9 of camel, 3 of pig, 1 of donkey and 16 of poultry besides populations/breeds of other species like mules, yaks, mithun, ducks, quails, etc. are yet to be classified. About 20-25% of total livestock population in our country com-prises descript and well recognized breeds. The remaining population of livestock is non-descript which has not been characterized systematically. Various livestock breeds in our country have been evolved over centuries en-dowed with many desirable attributes like dis-ease resistance, tolerance to heat stress, adapt-ability to environmental fluctuations, ability
Dr. R. S. GandhiAssistant Director General, (Animal
Production & Breeding)
Indian Council of Agricultural Research

117www.agriculturetoday.in Agriculture Year Book 2015
to utilize coarse fibres and crop resi-dues. The biomolecules produced by Indian livestock are considered of paramount importance in terms of therapeutic and nutriceutical value.
Smallholder Production System The rearing of livestock has been the source of sustainable livelihood se-curity for rural masses having small holdings. The farming and livestock have been the main source of liveli-hood for landless and smallholders -mostly landless, marginal, small and semi-medium farmers - living under poverty and not having ac-cess to quality inputs for agriculture and livestock rearing, attributed to scarcity of funds and other resources. The lack of awareness about the im-proved resources, technologies and other inputs due to lower literacy adds further to the woes of this stra-tum of the rural population. When-ever the crops have failed miserably due to natural calamities, the live-stock has emerged as the saviour of farmers providing livelihood security in rural India.
The marginal, small and semi-me-dium farmers are rearing 88% of total livestock. This is a well-established fact that livestock is the best insur-ance against starvation and acute malnutrition in adverse climatic con-ditions to small holders.The number of holdings owned by these farmers constitutes 95% of total holdings, while they have only 68% of total op-erational area. The distribution of dif-ferent species of livestock amongst the various categories of animal keepers reveal that marginal, small and semi-medium farmers on an av-erage has about 89% of cattle, 85% buffaloes, 87% sheep, 89% goats, 92% pig and 94% poultry.It indicates
that compared with distribution of land, the livestock resources are more equitably distributed. Hence, live-stock plays pivotal role for livelihood and nutritional security of smallhold-er farmers. It is obvious that these smallholders are playing significant role in the animal production scenar-io of the country and contributing to the national gross domestic product.
Production Scenario: A Paradigm Shift from Deficiency to SufficiencyMilk, eggs, meat and wool have been the major livestock products in our country.Milk tops in contribution to total livestock output as per the current prices during 2011-12 (Rs.305484 crores, 66.55% of total livestock output). The contribution of meat to the total livestock output was 18.22% followed by dung (6.94%) and eggs (3.88%). The milk production in the country has increased from 17 million tonnes during 1950-51 to 132 million tonnes during 2011-12. The corresponding increases in egg and wool production are 1832 to 66450 million eggs and 27.5 to 44.7 million kg wool, respectively. The
meat production has increased from 1.9 million totonnes during 2000-01 to 5.5 million tonnes during 2011-12. The compound decadal growth rates during the last seven decades in milk, eggs and wool indicated that milk production increased drastically from 1.15% (1960-61 to 1973-74) to 4.51% (1973-74 to 1980-81) attributed to ‘Operation Flood’.It is a matter of satisfaction that milk production sustained this growth and subsequently increased at a rate of 4-5% during the last five decades. Similarly, the decadal growth rate of egg production in the country has been encouraging, ranging from 4.63% (1950-51 to 1960-61) to 7.91% (1960-61 to 1973-74). However, the compound decadal growth rate in wool production has not been so encouraging in the past.
livestock Boom: An Instrument for Higher ProductivityThe higher number of livestock (512 million) and poultry (729 million) has been the strength of the country to cater to the needs of livestock produce and products of about

118 Agriculture Year Book 2015
www.agriculturetoday.in
1.27 billion population of India. It is a matter of rejoice that India is number one in milk production, third in egg production and fifth in poultry meat production. The livestock production system in India has shown a paradigm shift from low productivity to higher productivity, sustainability to profitability, low input system to higher input system, extensive to intensive and routine chores to commercial venture. Majority of major livestock species have shown increased trend over the years from 1951 onwards. The highest increase of 892.12% has been witnessed in poultry (73.5 million in 1951 versus 729.21 million in 2014). The corresponding increase in other livestock species were 222.92% in cattle, 150.46% in buffaloes, 66.41% in sheep, 186.37% in goats and 133.86% in pigs. The comparison of population of different species of livestock of 19th (2012) versus 18th Livestock Census (2007) revealed negative compound annual growth rates in cattle (-4.10%), sheep (-9.07%), goat (-3.82%), and pig (-7.54%),The compound annual growth rate in poultry during the period 2003-07 has been highest (12.39%) followed by buffaloes (3.19%).
The share of livestock to the total GDP has increased from 59 billion ru-pees during 1980-81 to 3278 billion rupees during 2011-12 at current prices. It ranged from 3.92% (2011-12) to 6.45% (1990-91) of total GDP. On the other hand, the share of agri-culture and allied sectors to the total GDP has decreased from 34.72% dur-ing 1980-81 to 15.18% during 2011-12. Over the decades, the contribu-tion of livestock to the total GDP has fluctuated least as compared to ag-riculture and allied sectors providing higher degree of livelihood and so-
cial security to the livestock keepers in comparison to farmers depending on agriculture alone. It is a matter of delight that the share of livestock sector to the agriculture sector has increased from 13.88% during 1980-81 to 25.85% during 2011-12, while on the contrary, share of agriculture and allied sectors to the GDP has de-creased over the years.
Endurance of Indigenous livestock to Thermal Stress Indian livestock has special adaptive mechanisms to deal with extra thermal stress of tropics. The mechanisms that facilitate easy dissipation of heat from body without much loss of moisture are unique in tropical livestock species in addition to mechanisms that conserve energy for body maintenance at high temperatures. Adaptive mechanisms to deal with heat gain/loss include coat color, length of hair, skin pigmentation, number of sweat glands and its secretion. The small body size with low energy requirement for maintenance and capacity to use poor quality feeds and fodders make Indian livestock superior to many breeds of livestock in feed conversion efficiency. The water recycling and economy in these animals is more efficient giving
them higher capacity to dehydrate and withstand higher thermal stress. Body appendages and higher body surface area per unit of weight help them in heat dissipation. Some of the zebu breeds (Rathi, Tharparkar, Ongole, Nagori and Sahiwal) well adapted to hot dry conditions are able to minimize their metabolic requirements and conserve energy for production (milk and/or work) without extra energy expenditure.Indian breeds from Rajasthan and Gujarat have the innate potential to tolerate desert conditions and temperature up to 50°C. About 6-9 months (60-75% of days) in a year are either stressful or not congenial for optimum productivity of livestock in most of the parts of the country. Further, the THI ranges from 75-85% during noon (2:00 PM) at more than 85% places in India during summer months (April – June) resulting in overall productivity of the livestock.
Assets for livestock Production:l Higher rate of contribution of
livestock sector to agriculture sector during the last several years (25.85% during 2011-12).
l Enhanced spending power of urban and rural consumers.
l Enhanced literacy rate of rural population over the years.
l Higher demand and consumption of animal produce and value added milk, meat and egg products.
l Mega livestock biodiversity encompassing almost all major domesticated farm animal species.
l Large number of breeds of almost all livestock species well-adapted to the specific agro-climatic conditions.

119www.agriculturetoday.in Agriculture Year Book 2015
l Diversified draft, milch and dual purpose cattle breeds contributing to milk and draft power besides providing bio-fuel and bio-fertilizer.
l Potential to adapt to diverse changing climatic conditions of hot arid, humid tropical and temperate climates and better resistance to internal and external parasites and diseases.
l Higher innate potential to survive and produce on coarse, poor quality feed and fodder resources under zero input system.
l Availability of best breeds of buffaloes, a multipurpose farm animal species.
l Gigantic network of Research Institutes, State Agricultural/Animal Science/Veterinary Universities, State Animal Husbandry Departments, Livestock Development Boards and NGOs engaged in livestock development.
l Vast infrastructure in terms of livestock farms of various species (161 cattle, 33 buffaloes, 63 goat, 82 sheep, 127 pigs, 5772 poultry), 4355 gaushalas, 54 semen production centers, 191 frozen semen banks, 77765 AI centers, 10217 veterinary hospitals/polyclinics, 22713 veterinary dispensaries, 24794 veterinary aid centers and 464 hatcheries.
l Availability of large amount of ITKs with livestock keepers/pastoralists for rearing and management of different species of livestock.
l Seasonal migration of nomadic pastoralists to overcome adverse climatic conditions during winter and rainy seasons to sustain and multiply the breed population of their choice.
Futuristic Approach:l Treat livestock sector as a main
sector and allocate budget to livestock sector proportional to its contribution to agriculture sector/GDP.
l Allocate community funds for pastoralists and micro financing facilities for smallholders to promote livestock production.
l Creation/provision of national fund for conservation of animal genetic resources.
l Allocate more funds for infrastructure development, livestock policy reforms and IPR issues.
l Develop a roadmap for breeding and conservation of indigenous livestock including characterization, sustainable use & development, conservation and formulating framework for policies, legislation, institutions and capacity building.
l Conduct breed-wise livestock census.
l Establish and/or strengthen nucleus farms in the breeding tract for each breed to produce genetically superior germplasm for genetic improvement and conservation. The available Govt.
and private farms of various livestock species should be used effectively for this purpose.
l Effective use of more than 20 lakh cows maintained in 4355 gaushalas. Some of gaushalas having good number of indigenous cattle should be used for in-situ conservation of these cattle.
l Declare all the livestock farms of state/central govt. as in-situ conservation and breeding centers for indigenous breeds.
l Registration of livestock keepers and identification of farmers having elite livestock.
l Provide economic advantage to animal keepers for conservation and multiplication of indigenous livestock.
l Unravel the unique genes and bio-prospecting the special utility traits, biomolecules, products etc. of indigenous livestock for enhanced net economic worth using emerging biotechnological tools.
l Developing branded animal products from indigenous livestock available with pastoralists and smallholders and creation of niche markets for these products.
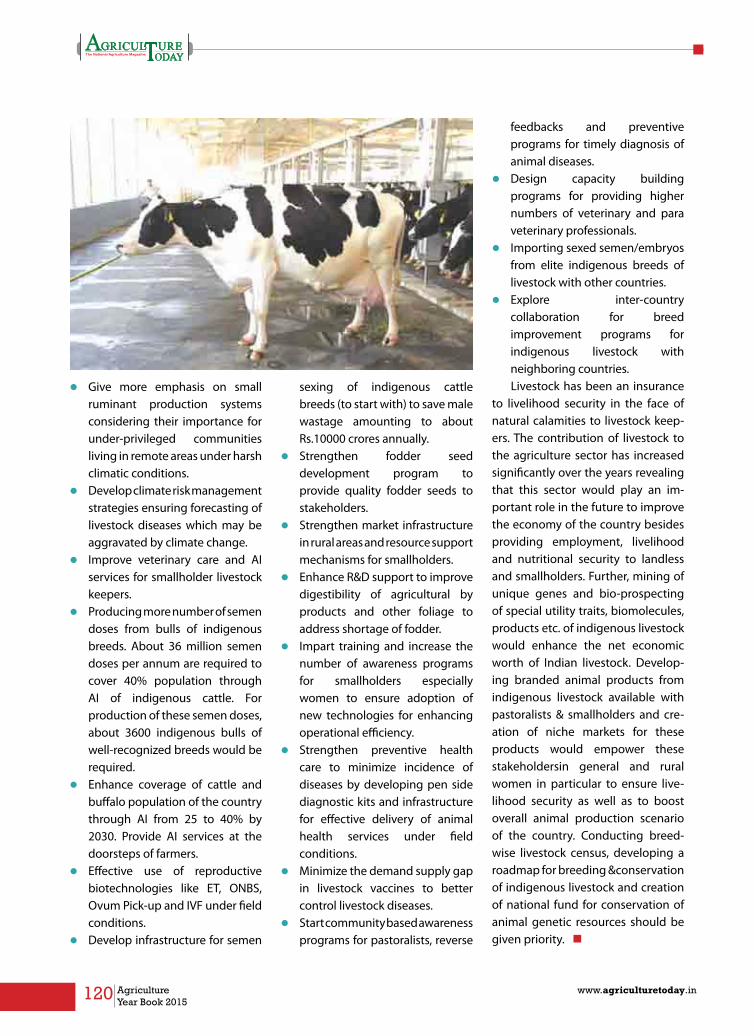
120 Agriculture Year Book 2015
www.agriculturetoday.in
l Give more emphasis on small ruminant production systems considering their importance for under-privileged communities living in remote areas under harsh climatic conditions.
l Develop climate risk management strategies ensuring forecasting of livestock diseases which may be aggravated by climate change.
l Improve veterinary care and AI services for smallholder livestock keepers.
l Producing more number of semen doses from bulls of indigenous breeds. About 36 million semen doses per annum are required to cover 40% population through AI of indigenous cattle. For production of these semen doses, about 3600 indigenous bulls of well-recognized breeds would be required.
l Enhance coverage of cattle and buffalo population of the country through AI from 25 to 40% by 2030. Provide AI services at the doorsteps of farmers.
l Effective use of reproductive biotechnologies like ET, ONBS, Ovum Pick-up and IVF under field conditions.
l Develop infrastructure for semen
sexing of indigenous cattle breeds (to start with) to save male wastage amounting to about Rs.10000 crores annually.
l Strengthen fodder seed development program to provide quality fodder seeds to stakeholders.
l Strengthen market infrastructure in rural areas and resource support mechanisms for smallholders.
l Enhance R&D support to improve digestibility of agricultural by products and other foliage to address shortage of fodder.
l Impart training and increase the number of awareness programs for smallholders especially women to ensure adoption of new technologies for enhancing operational efficiency.
l Strengthen preventive health care to minimize incidence of diseases by developing pen side diagnostic kits and infrastructure for effective delivery of animal health services under field conditions.
l Minimize the demand supply gap in livestock vaccines to better control livestock diseases.
l Start community based awareness programs for pastoralists, reverse
feedbacks and preventive programs for timely diagnosis of animal diseases.
l Design capacity building programs for providing higher numbers of veterinary and para veterinary professionals.
l Importing sexed semen/embryos from elite indigenous breeds of livestock with other countries.
l Explore inter-country collaboration for breed improvement programs for indigenous livestock with neighboring countries. Livestock has been an insurance
to livelihood security in the face of natural calamities to livestock keep-ers. The contribution of livestock to the agriculture sector has increased significantly over the years revealing that this sector would play an im-portant role in the future to improve the economy of the country besides providing employment, livelihood and nutritional security to landless and smallholders. Further, mining of unique genes and bio-prospecting of special utility traits, biomolecules, products etc. of indigenous livestock would enhance the net economic worth of Indian livestock. Develop-ing branded animal products from indigenous livestock available with pastoralists & smallholders and cre-ation of niche markets for these products would empower these stakeholdersin general and rural women in particular to ensure live-lihood security as well as to boost overall animal production scenario of the country. Conducting breed-wise livestock census, developing a roadmap for breeding &conservation of indigenous livestock and creation of national fund for conservation of animal genetic resources should be given priority. n
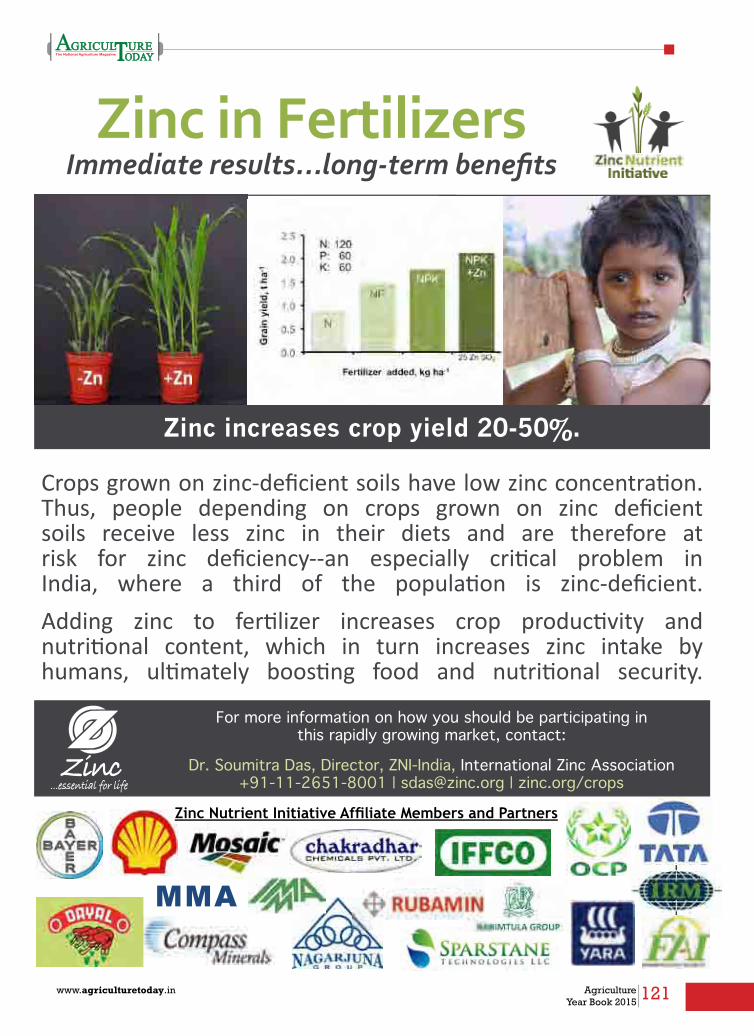
121www.agriculturetoday.in Agriculture Year Book 2015
Zinc in Fertilizers
For more information on how you should be participating in this rapidly growing market, contact:
Dr. Soumitra Das, Director, ZNI-India, International Zinc Association+91-11-2651-8001 | [email protected] | zinc.org/crops
Zinc increases crop yield 20-50%.
MMA

122 Agriculture Year Book 2015
www.agriculturetoday.in
123www.agriculturetoday.in Agriculture Year Book 2015
AgricultureAnd
indiAn economy
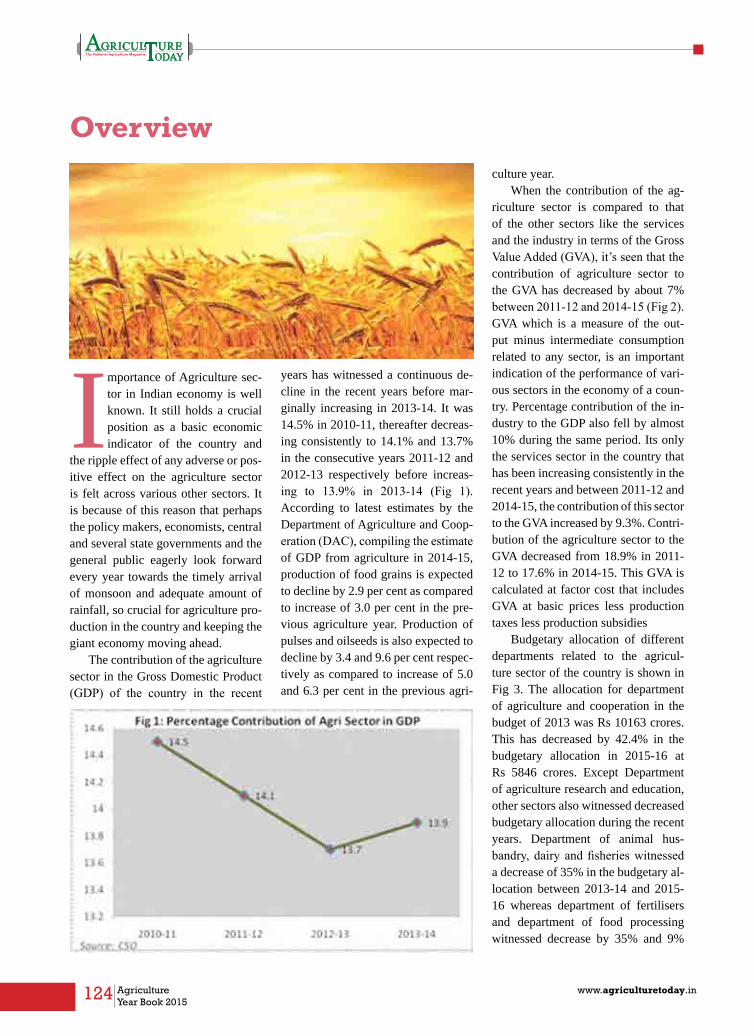
124 Agriculture Year Book 2015
www.agriculturetoday.in
Overview
Importance of Agriculture sec-tor in Indian economy is well known. It still holds a crucial position as a basic economic indicator of the country and
the ripple effect of any adverse or pos-itive effect on the agriculture sector is felt across various other sectors. It is because of this reason that perhaps the policy makers, economists, central and several state governments and the general public eagerly look forward every year towards the timely arrival of monsoon and adequate amount of rainfall, so crucial for agriculture pro-duction in the country and keeping the giant economy moving ahead.
The contribution of the agriculture sector in the Gross Domestic Product (GDP) of the country in the recent
years has witnessed a continuous de-cline in the recent years before mar-ginally increasing in 2013-14. It was 14.5% in 2010-11, thereafter decreas-ing consistently to 14.1% and 13.7% in the consecutive years 2011-12 and 2012-13 respectively before increas-ing to 13.9% in 2013-14 (Fig 1). According to latest estimates by the Department of Agriculture and Coop-eration (DAC), compiling the estimate of GDP from agriculture in 2014-15, production of food grains is expected to decline by 2.9 per cent as compared to increase of 3.0 per cent in the pre-vious agriculture year. Production of pulses and oilseeds is also expected to decline by 3.4 and 9.6 per cent respec-tively as compared to increase of 5.0 and 6.3 per cent in the previous agri-
culture year.When the contribution of the ag-
riculture sector is compared to that of the other sectors like the services and the industry in terms of the Gross Value Added (GVA), it’s seen that the contribution of agriculture sector to the GVA has decreased by about 7% between 2011-12 and 2014-15 (Fig 2). GVA which is a measure of the out-put minus intermediate consumption related to any sector, is an important indication of the performance of vari-ous sectors in the economy of a coun-try. Percentage contribution of the in-dustry to the GDP also fell by almost 10% during the same period. Its only the services sector in the country that has been increasing consistently in the recent years and between 2011-12 and 2014-15, the contribution of this sector to the GVA increased by 9.3%. Contri-bution of the agriculture sector to the GVA decreased from 18.9% in 2011-12 to 17.6% in 2014-15. This GVA is calculated at factor cost that includes GVA at basic prices less production taxes less production subsidies
Budgetary allocation of different departments related to the agricul-ture sector of the country is shown in Fig 3. The allocation for department of agriculture and cooperation in the budget of 2013 was Rs 10163 crores. This has decreased by 42.4% in the budgetary allocation in 2015-16 at Rs 5846 crores. Except Department of agriculture research and education, other sectors also witnessed decreased budgetary allocation during the recent years. Department of animal hus-bandry, dairy and fisheries witnessed a decrease of 35% in the budgetary al-location between 2013-14 and 2015-16 whereas department of fertilisers and department of food processing witnessed decrease by 35% and 9%

125www.agriculturetoday.in Agriculture Year Book 2015
respectively during the same period. Department of agriculture research and education witnessed a substantial increase of 50.5% in the budgetary al-location between 2013-14 and 2015-16, when it increased from Rs 2451 crores in 2013-14 to Rs 3691 crores in 2015-16.
Table 1 provides the allocation in different budgets of the country to various departments related to the ag-riculture sector in terms of percentage of the total allocation to all the sectors combined.
Out of the various agri and al-lied sectors, dairy sector has been the largest contributing sector in terms of budgetary receipts. The receipts from dairy along with fisheries sectors in-creased from Rs 326.5 crores in the actual budget statement of 2013-14 to Rs 557 crores in 2015-16 budget forecast. This marks an increase of 70.5%. Cropping husbandry in the country increased by 11.2% in terms of total receipts when it increased
from Rs 175.4 crores in 2013-14 to Rs 195 crores in 2015-16 budget forecast . The sub-sector within agri and allied sectors that has been not performing well in terms of receipts was animal husbandry which witnessed a signifi-cant net decline of 43% between the year 2013-14 and 2015-16 (budget forecast). In 2013-14, receipt from animal husbandry was Rs 50.55 crores which declined to Rs 28.75 crores in
2015-16 budget forecast.Agriculture sector is crucial for In-
dian economy from the point of view of exports and foreign exchange earn-ings. In 2013, the contribution of the agriculture sector in the total exports of the country was a significant 13% which is just behind the export fig-ure of petroleum products which was 19.4%. The overall exports of agricul-ture and processed food products have reached USD 11,023.79 million in the period ranging from April to Sep-tember 2014. Exports of fruits and vegetables, both processed and fresh, have touched USD 1,153.81 million, while animal products registered USD 2,570.82 million of exports in the same period of 2014.
Every year, Agriculture sector like many other sectors, receives substantial amount of subsidies every year that is having crucial
Table 1: Allocation to different departments related to the agriculture sector as percentage of total annual budgetary allocation
2013-2014 2014-2015 2014-2015 2015-2016
Dept of Agri & Coop 1.7 1.2 1.2 1
Dept of Agri Res & Edu 0.4 0.8 0.05 0.06
Dept of Animal Hus, Dairy and Fisheries
0.2 0.2 0.02 0.02
Dept of Fertilizers 0.01 0.01 0.01 0.01
Min of Food Processing 0.01 0.01 0.01 0.01
Source: Min. of Finance

126 Agriculture Year Book 2015
www.agriculturetoday.in
overbearing on the national economy of the country. Areas like fertilizers, crops like paddy, wheat, pulses etc. and sugarcane along with the sugar mills receives subsidies every year through budgetary allocations. Dur-ing the financial year 2012-13, the total subsidy going out to the fertiliser sector was Rs 73, 790 crores. Sub-sidies for crops like paddy go in the form of Minimum Support Price (MSP) and also towards subsiding rice through the public distri-bution system (PDS). The total subsidies incurred by the government of India on these accounts for rice was Rs 129000 crores. Sugar-cane MSP along with subsi-dies given to the sugar mills across the country accounted for Rs 33000 crores.
The importance of the agriculture sector in the national economy can be guaged by its huge contribu-tion to employment genera-tion for the vast pool of em-ployable population in the country. In 2012, the country had a total workforce of 467
million. Out of that, 228.3 million was employed in the agriculture sector which is 49 percent of the total work-force (Fig 7). The secondary and the tertiary sectors respectively employed 110.7 million and 127.8 million. In terms of percentage of employable force, the secondary and the tertiary sector employed 23.7% and 27.3% of the employable force.
Although agriculture sector is still the largest employer in the nation, its trend in terms of employment as percentage of total employable force in the country has been continuously declining in the past decades. In 1999-00, agriculture sector employed 60% of the total employable workforce. Over the subsequent years it declined and in 2004-05, agriculture was em-ploying 57% of the employable force in the country. This further declined to 53% and 40% respectively in 2009-10 and 2011-12 (Fig 8). The decline can be attributed to various factors some of which are migration of rural people dependent on agriculture as profession migrating to urban areas and taking up jobs in the secondary and tertiary sec-tors.
When some of the states are stud-ied individually in terms of employ-ment by the agriculture sector as per-centage of total employable force, in 2012, Maharashtra came first state in terms of people working in the agricul-ture sector at 49%. Uttar Pradesh was employing 35% whereas other major states like Karnataka, West Bengal, Bihar and Rajasthan were employ-ing 13%, 12%, 18% and 14% respec-tively. It is to be noted that states like Maharastra and Uttar Pradesh have witnessed a substantial decline in the number of people employed with the agriculture sector between 2004-05 and 2011-12. In Uttar Pradesh the per-centage came down from 43% (2004-05) the present level whereas in Ma-harastra, it was 56% in 2011-12. n
127www.agriculturetoday.in Agriculture Year Book 2015

128 Agriculture Year Book 2015
www.agriculturetoday.in
NIFTEM’s MODEl OF RURAl DEVElOPMENT
Village adoption is a unique program conceptualized and being implemented by NIFTEM for its students since 2012, with a view to sensitize and educate them on
the problems and practices of the farmers at the grass root level. The aim is to help the Indian Food Processing sector accomplish its objective of all- inclusive growth and facilitate the process of integrating the underprivileged sections of our population with the main stream economy.
The Framework of Village Adoption Programme:Under this programme, B. Tech (Food Technology & Management) and M. Tech students are divided into groups of 10 to 12 students at the time of joining NIFTEM. Each group is led by a Faculty member (Mentor) and adopts a village anywhere in India and nurses it during the entire programme of study. The Groups go and stay in the village twice a year: 10 to 12 days each time in every semester. It is a symbiotic process leading to exchange
of Knowledge. While villagers gain scientific and technical knowledge through students who explore future possibilities of food processing among them, students obtain first hand experience on Indian rural scenario and understand traditional processing technologies adopted by the villagers. Students gain general awareness on the village life and facilitate the process of integrating the underprivileged sections of our population with the main stream. Students thus learn to contribute towards “Nation Building”.
Steps in the Village Adoption Process• Thestudentsshallhavetoidentifyavillage
and establish a work plan at the beginning of the first semester and work during the semester for 10-12 days at the village site
• The students will work in a group underthe guidance of a mentor faculty and will develop realistic village development plan for four years including identification of local resources and avenues for promoting
Dr. Ajit Kumar, Ph.D. IIT-D,IAS (Retd.)
Vice Chancellor, National Institute
of Food Technology Entrepreneurship & Management
(NIFTEM)
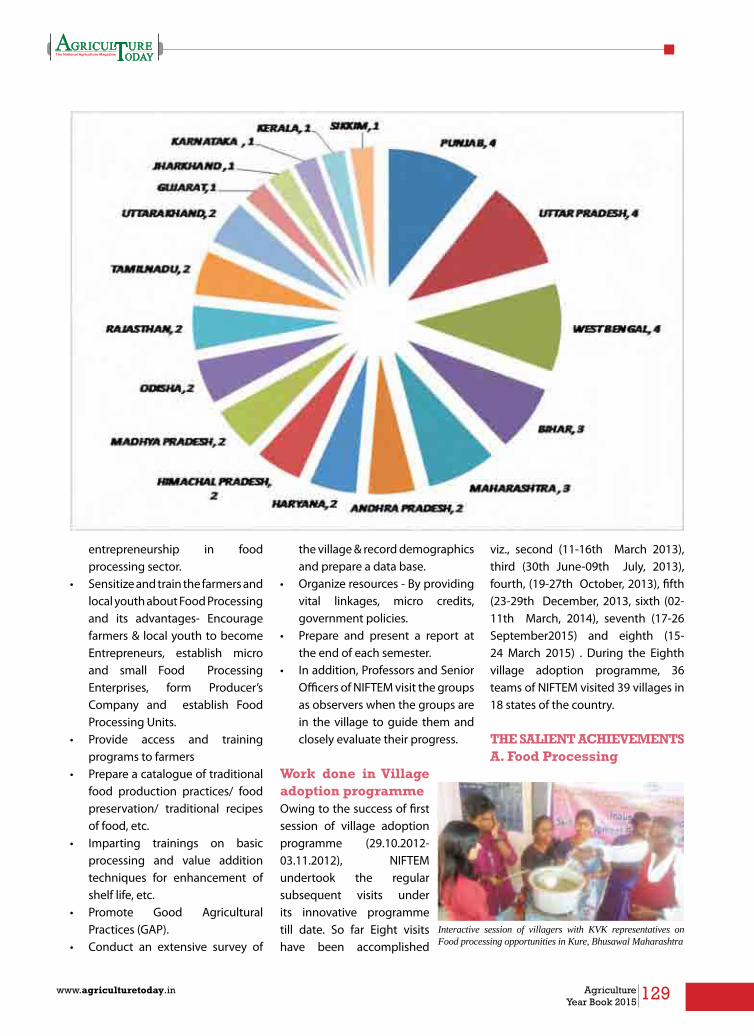
129www.agriculturetoday.in Agriculture Year Book 2015
entrepreneurship in food processing sector.
• Sensitizeandtrainthefarmersandlocal youth about Food Processing and its advantages- Encourage farmers & local youth to become Entrepreneurs, establish micro and small Food Processing Enterprises, form Producer’s Company and establish Food Processing Units.
• Provide access and trainingprograms to farmers
• Prepareacatalogueoftraditionalfood production practices/ food preservation/ traditional recipes of food, etc.
• Imparting trainings on basicprocessing and value addition techniques for enhancement of shelf life, etc.
• Promote Good AgriculturalPractices (GAP).
• Conduct an extensive survey of
the village & record demographics and prepare a data base.
• Organizeresources-Byprovidingvital linkages, micro credits, government policies.
• Prepare and present a report atthe end of each semester.
• Inaddition,ProfessorsandSeniorOfficers of NIFTEM visit the groups as observers when the groups are in the village to guide them and closely evaluate their progress.
Work done in Village adoption programmeOwing to the success of first session of village adoption programme (29.10.2012-03.11.2012), NIFTEM undertook the regular subsequent visits under its innovative programme till date. So far Eight visits have been accomplished
viz., second (11-16th March 2013), third (30th June-09th July, 2013), fourth, (19-27th October, 2013), fifth (23-29th December, 2013, sixth (02-11th March, 2014), seventh (17-26 September2015) and eighth (15-24 March 2015) . During the Eighth village adoption programme, 36 teams of NIFTEM visited 39 villages in 18 states of the country.
THE SAlIENT ACHIEVEMENTSA. Food Processing
Interactive session of villagers with KVK representatives on Food processing opportunities in Kure, Bhusawal Maharashtra

130 Agriculture Year Book 2015
www.agriculturetoday.in
promotional Initiatives About 500 programmes including Trainings and Expert Lectures, Awareness Camps in food processing and value addition, postharvest management, product development, entrepreneurship development etc. have been conducted.
B. Entrepreneurship Devel-opment (Identification of Entrepreneurs)In phase I, more than 125 potential entrepreneurs were associated with different teams and in processes of finalizing their ventures in agro food processing and few have already initiated the work. In Phase II, VAP teams identified about 50 prospective entrepreneurs in their respective village and adjoining areas
who will be further given training to establish ventures in agro-food processing (Total about 1546). They will be imparted one week training programme and the selected ones will be taken up for one month EDP programme in regional centers followed by three months of industrial training programme. During VAP 8, about 250 such entrepreneurs were
trained in selected pilot locations by imparting one week training programme.
C. Preparation of project reports NIFTEM VAP Teams are continuously working very closely on different micro and medium level
projects with selected potential entrepreneurs to guide and share the relevant information. The teams have shared with them customized project reports for initiating and supporting their ventures in domain of agro food processing and value addition.
D. Product Development processesStudents along with their mentors have carried out about 150 Product Development Training Programmes at village level in different villages and practically demonstrated preparations of jams, jellies, pickles, fruit based beverages like mango panna, products like banana chips, dried banana flakes, bakery products like biscuits, cakes, fried snacks like bread pakora, bread rolls etc. and also shared one to two page leaflets indicating the process flow charts and estimated expenses.
Lecture on Food Processing opportunities in Seoni, Madhya Pradesh
Demonstration of Tomato cocktail preparation in mobile processing van arranged by Team NIFTEM , Kalupatti, Tamilnadu
Demonstration of Bakery product preparation during a training session in the village in Madhya Pradesh
Members of team NIFTEM working closely with rural women in the village on Papad Making Initiative, Jhalarpatan, Rajasthan
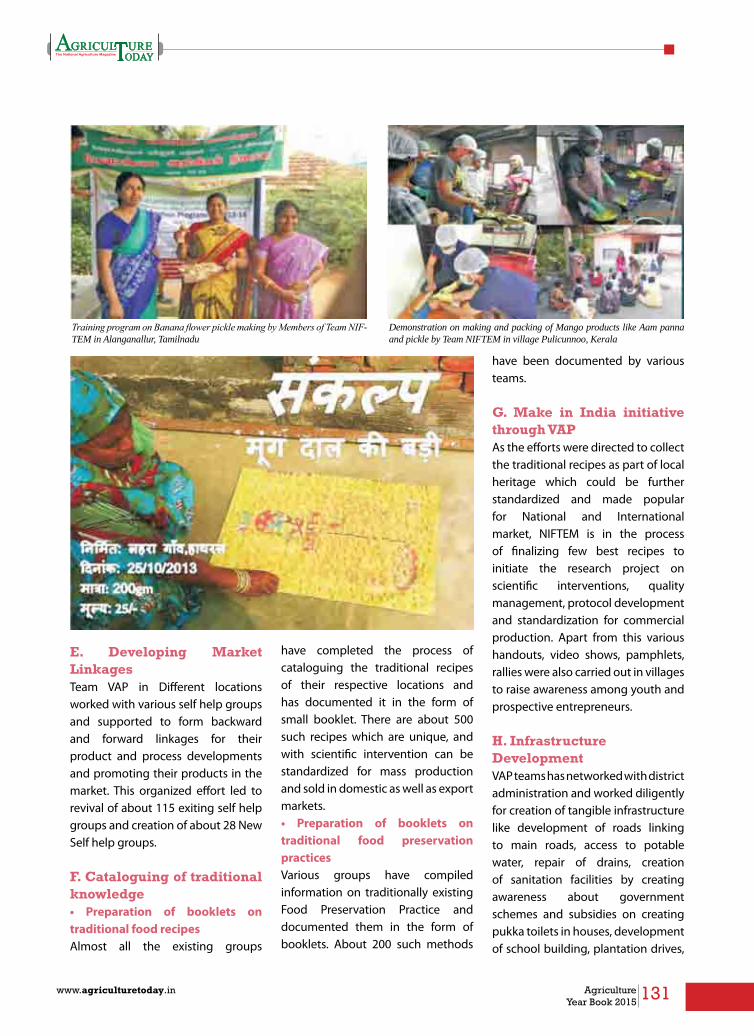
131www.agriculturetoday.in Agriculture Year Book 2015
E. Developing Market linkagesTeam VAP in Different locations worked with various self help groups and supported to form backward and forward linkages for their product and process developments and promoting their products in the market. This organized effort led to revival of about 115 exiting self help groups and creation of about 28 New Self help groups.
F. Cataloguing of traditional knowledge• Preparation of booklets on traditional food recipes Almost all the existing groups
have completed the process of cataloguing the traditional recipes of their respective locations and has documented it in the form of small booklet. There are about 500 such recipes which are unique, and with scientific intervention can be standardized for mass production and sold in domestic as well as export markets.• Preparation of booklets on traditional food preservation practices Various groups have compiled information on traditionally existing Food Preservation Practice and documented them in the form of booklets. About 200 such methods
have been documented by various teams.
G. Make in India initiative through VAPAs the efforts were directed to collect the traditional recipes as part of local heritage which could be further standardized and made popular for National and International market, NIFTEM is in the process of finalizing few best recipes to initiate the research project on scientific interventions, quality management, protocol development and standardization for commercial production. Apart from this various handouts, video shows, pamphlets, rallies were also carried out in villages to raise awareness among youth and prospective entrepreneurs.
H. Infrastructure DevelopmentVAP teams has networked with district administration and worked diligently for creation of tangible infrastructure like development of roads linking to main roads, access to potable water, repair of drains, creation of sanitation facilities by creating awareness about government schemes and subsidies on creating pukka toilets in houses, development of school building, plantation drives,
Training program on Banana flower pickle making by Members of Team NIF-TEM in Alanganallur, Tamilnadu
Demonstration on making and packing of Mango products like Aam panna and pickle by Team NIFTEM in village Pulicunnoo, Kerala
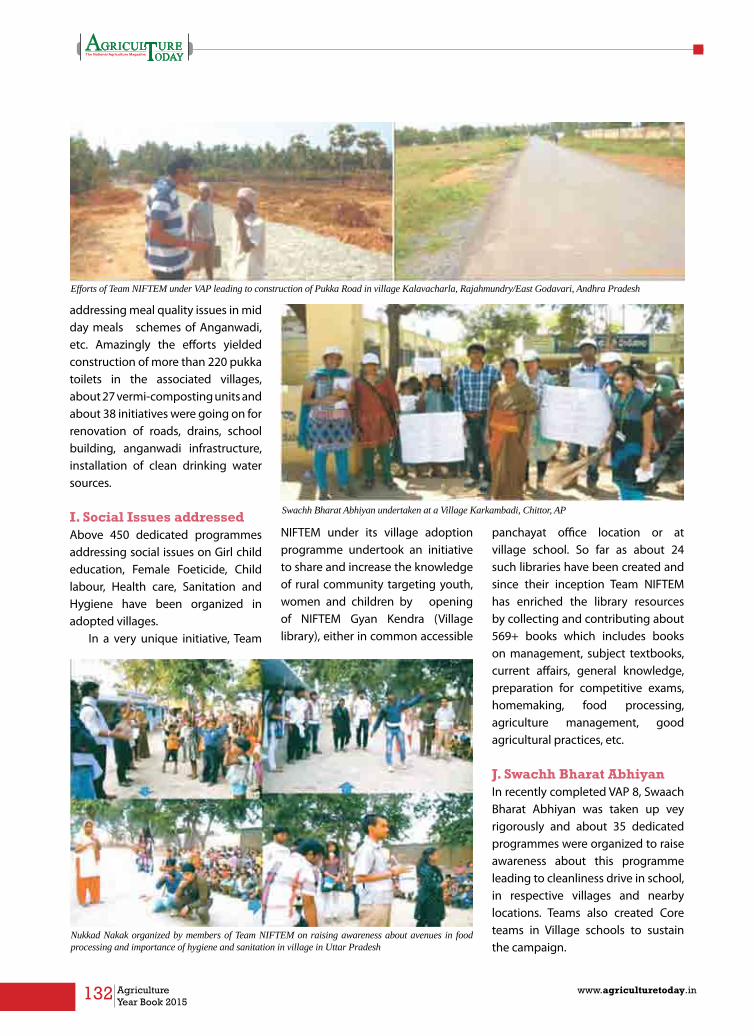
132 Agriculture Year Book 2015
www.agriculturetoday.in
addressing meal quality issues in mid day meals schemes of Anganwadi, etc. Amazingly the efforts yielded construction of more than 220 pukka toilets in the associated villages, about 27 vermi-composting units and about 38 initiatives were going on for renovation of roads, drains, school building, anganwadi infrastructure, installation of clean drinking water sources.
I. Social Issues addressedAbove 450 dedicated programmes addressing social issues on Girl child education, Female Foeticide, Child labour, Health care, Sanitation and Hygiene have been organized in adopted villages.
In a very unique initiative, Team
NIFTEM under its village adoption programme undertook an initiative to share and increase the knowledge of rural community targeting youth, women and children by opening of NIFTEM Gyan Kendra (Village library), either in common accessible
panchayat office location or at village school. So far as about 24 such libraries have been created and since their inception Team NIFTEM has enriched the library resources by collecting and contributing about 569+ books which includes books on management, subject textbooks, current affairs, general knowledge, preparation for competitive exams, homemaking, food processing, agriculture management, good agricultural practices, etc.
J. Swachh Bharat AbhiyanIn recently completed VAP 8, Swaach Bharat Abhiyan was taken up vey rigorously and about 35 dedicated programmes were organized to raise awareness about this programme leading to cleanliness drive in school, in respective villages and nearby locations. Teams also created Core teams in Village schools to sustain the campaign.
Efforts of Team NIFTEM under VAP leading to construction of Pukka Road in village Kalavacharla, Rajahmundry/East Godavari, Andhra Pradesh
Nukkad Nakak organized by members of Team NIFTEM on raising awareness about avenues in food processing and importance of hygiene and sanitation in village in Uttar Pradesh
Swachh Bharat Abhiyan undertaken at a Village Karkambadi, Chittor, AP

133www.agriculturetoday.in Agriculture Year Book 2015
K. Initiatives on promotion of Renewable energy utilizationVAP teams laid due emphasis on promotion of renewable sources of energy like Solar lighting, solar cells and contacted energy department of each state to send representative in the village and educate farmers about using solar lights. Sarpanchs and Panchayats were made aware about subsidies available for them to take solar lighting project for the village.
Success has been achieved in installing Solar Panels for heating water and solar lamps in houses as well as Solar Street lights. The effort yielded about 100 dedicated lectures on promotion of renewable energy, about 99 awareness campaigns and installation of about 110 solar street lights/ solar lamps in different locations under VAP. Few biogas plants (25 in numbers) were also established in different locations.
Future ProgrammesNow we are in the process of planning the launch of a programme
for skill development for the entrepreneurs by starting five days training programme in the village location itself followed by a follow up in advanced training of four weeks on entrepreneurship development for the selected entrepreneurs so as to take them to the logical end of establishing micro enterprise. This programme would be followed by a six months “Hand Holding Phase” so that the trained entrepreneur
is assisted in all the activities viz. preparing DPR, taking loan from the bank, procurement of equipment and machinery, marketing tie ups, etc.
Our efforts will be directed towards establishing Primary Processing cum Pre-Cooling ce ntres in the village, which could become the hub for hands-on training of farmers and rural youth in food processing and also provide limited CA storage to the farmers for their perishable fruits and vegetables, etc. Attempts are being made to develop a Hybrid Energy System (Solar+ Biomass+ Grid Electricity) to run theses primary processing centres. n
Awareness raising efforts of Team NIFTEM on renewable sources of energy leading to installation of Solar Lights in the Village Jhalarpatan, Ju-nakheda, Rajasthan
Installation of Solar lights in Hariharpur, Bihar
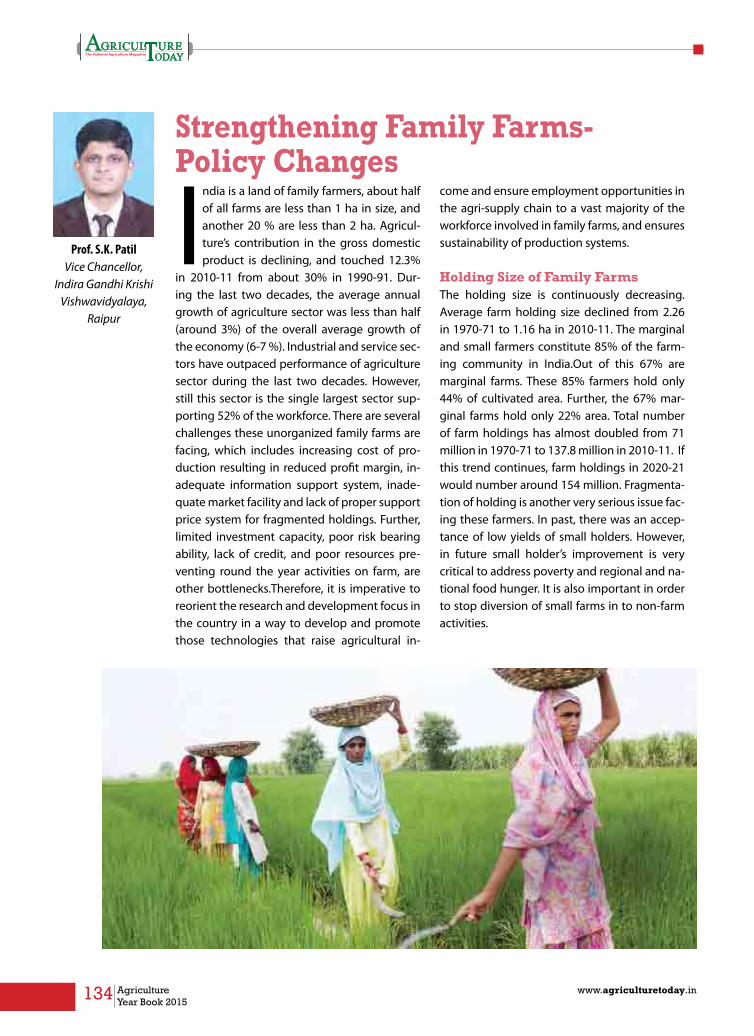
134 Agriculture Year Book 2015
www.agriculturetoday.in
Strengthening Family Farms- Policy Changes
India is a land of family farmers, about half of all farms are less than 1 ha in size, and another 20 % are less than 2 ha. Agricul-ture’s contribution in the gross domestic product is declining, and touched 12.3%
in 2010-11 from about 30% in 1990-91. Dur-ing the last two decades, the average annual growth of agriculture sector was less than half (around 3%) of the overall average growth of the economy (6-7 %). Industrial and service sec-tors have outpaced performance of agriculture sector during the last two decades. However, still this sector is the single largest sector sup-porting 52% of the workforce. There are several challenges these unorganized family farms are facing, which includes increasing cost of pro-duction resulting in reduced profit margin, in-adequate information support system, inade-quate market facility and lack of proper support price system for fragmented holdings. Further, limited investment capacity, poor risk bearing ability, lack of credit, and poor resources pre-venting round the year activities on farm, are other bottlenecks.Therefore, it is imperative to reorient the research and development focus in the country in a way to develop and promote those technologies that raise agricultural in-
come and ensure employment opportunities in the agri-supply chain to a vast majority of the workforce involved in family farms, and ensures sustainability of production systems.
Holding Size of Family FarmsThe holding size is continuously decreasing. Average farm holding size declined from 2.26 in 1970-71 to 1.16 ha in 2010-11. The marginal and small farmers constitute 85% of the farm-ing community in India.Out of this 67% are marginal farms. These 85% farmers hold only 44% of cultivated area. Further, the 67% mar-ginal farms hold only 22% area. Total number of farm holdings has almost doubled from 71 million in 1970-71 to 137.8 million in 2010-11. If this trend continues, farm holdings in 2020-21 would number around 154 million. Fragmenta-tion of holding is another very serious issue fac-ing these farmers. In past, there was an accep-tance of low yields of small holders. However, in future small holder’s improvement is very critical to address poverty and regional and na-tional food hunger. It is also important in order to stop diversion of small farms in to non-farm activities.
Prof. S.K. PatilVice Chancellor,
Indira Gandhi Krishi Vishwavidyalaya,
Raipur
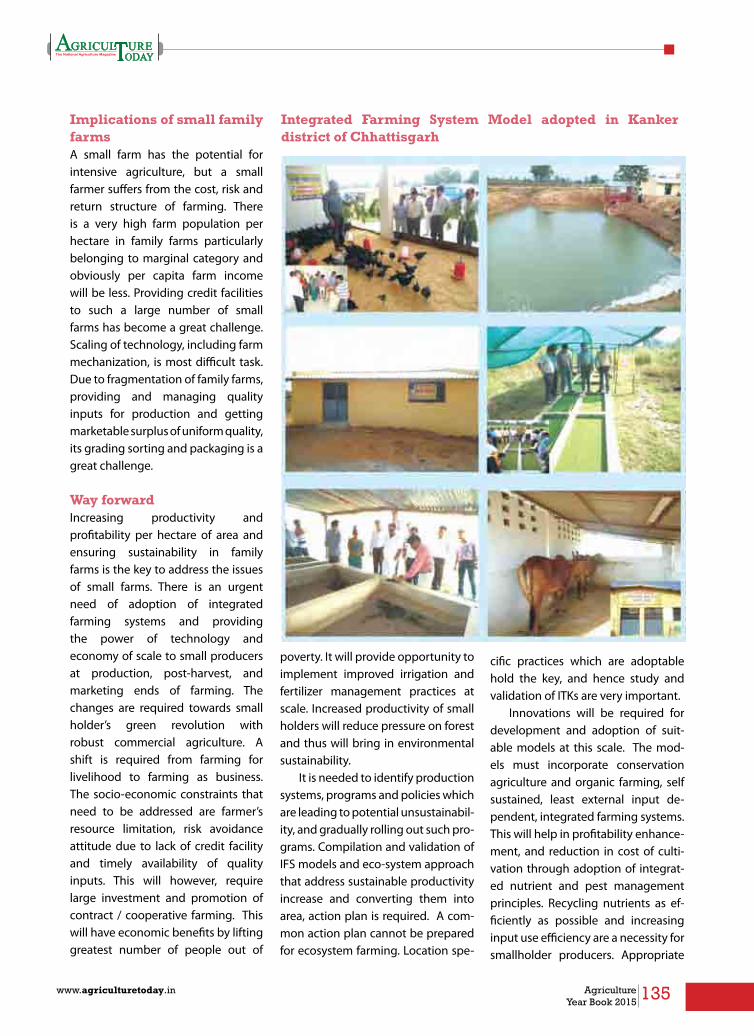
135www.agriculturetoday.in Agriculture Year Book 2015
Implications of small family farmsA small farm has the potential for intensive agriculture, but a small farmer suffers from the cost, risk and return structure of farming. There is a very high farm population per hectare in family farms particularly belonging to marginal category and obviously per capita farm income will be less. Providing credit facilities to such a large number of small farms has become a great challenge. Scaling of technology, including farm mechanization, is most difficult task. Due to fragmentation of family farms, providing and managing quality inputs for production and getting marketable surplus of uniform quality, its grading sorting and packaging is a great challenge.
Way forwardIncreasing productivity and profitability per hectare of area and ensuring sustainability in family farms is the key to address the issues of small farms. There is an urgent need of adoption of integrated farming systems and providing the power of technology and economy of scale to small producers at production, post-harvest, and marketing ends of farming. The changes are required towards small holder’s green revolution with robust commercial agriculture. A shift is required from farming for livelihood to farming as business. The socio-economic constraints that need to be addressed are farmer’s resource limitation, risk avoidance attitude due to lack of credit facility and timely availability of quality inputs. This will however, require large investment and promotion of contract / cooperative farming. This will have economic benefits by lifting greatest number of people out of
poverty. It will provide opportunity to implement improved irrigation and fertilizer management practices at scale. Increased productivity of small holders will reduce pressure on forest and thus will bring in environmental sustainability.
It is needed to identify production systems, programs and policies which are leading to potential unsustainabil-ity, and gradually rolling out such pro-grams. Compilation and validation of IFS models and eco-system approach that address sustainable productivity increase and converting them into area, action plan is required. A com-mon action plan cannot be prepared for ecosystem farming. Location spe-
cific practices which are adoptable hold the key, and hence study and validation of ITKs are very important.
Innovations will be required for development and adoption of suit-able models at this scale. The mod-els must incorporate conservation agriculture and organic farming, self sustained, least external input de-pendent, integrated farming systems. This will help in profitability enhance-ment, and reduction in cost of culti-vation through adoption of integrat-ed nutrient and pest management principles. Recycling nutrients as ef-ficiently as possible and increasing input use efficiency are a necessity for smallholder producers. Appropriate
Integrated Farming System Model adopted in Kanker district of Chhattisgarh
136 Agriculture Year Book 2015
www.agriculturetoday.in
models for increasing resource use efficiencies through water harvest-ing models, precision farming tools and approaches, and small farmer’s mechanization needs to be worked out. In order to generate economic opportunities and provide additional income,post harvest processing and value addition, and development of suitable models with allied enterpris-es (horticulture, floriculture, sericul-ture, pisci-culture, poultry farming, mushroom cultivation, bee and lac cultivation and dairy, piggery, goat-ery)will be of immense importance.
Small size of family farms is one of the most important hindrances in the adoption of modern tools and machines. Even if a small farmer in-vests in machinery, he is unable to use it round the year, and it remains idle for most of the time due to lim-ited operations for a limited period of time. Therefore, it is required to pro-mote new type of farming involving community, contract, cooperative, and concept of producer compa-nies. The role of traditional village organizations like Panchayats need revitalization in agriculture and allied sectors.Social engineering will be re-quired to a great extent in order to consolidate holdings for community/ contract farming, farmer’s compa-nies, self-help groups, development of infrastructure, and sharing of re-sources. This will help in efficient use of natural resources and production of marketable surplus of selected commodities. This will also help in addressing issues related to input ar-rangements and marketing. One of the very important areas is linkage of family farms with market by adop-tion of proper post harvest and value addition. Community custom hir-ing centres, post harvest processing, grading, sorting, packaging facilities at village level at the door step of
farmers need to be developed. The country is passing through
a phase of knowledge and technol-ogy based agricultural revolution. An innovative dynamic extension network that facilitates and pro-motes widespread dissemination of agricultural practices, implements and technology particularly suitable for small farms is essential for agri-cultural growth and prosperity. Fur-ther, how quickly and effectively this knowledge reaches large number of farmers can bring in the major break-throughs in agricultural productiv-ity. Use of ICT is very much desired for development of new knowledge management system.
The technological solutions to address these issues are available which can be used for risk reduction, reduction in cost of production and increased input use efficiency. There is need forlarge investments on small farms for mechanization, fencing, ir-rigation system development, elec-tricity and land development. It is also important to create avenues of investment in this area.
Capacity building of small farms by making available biotic and abiot-ic stress tolerant improved crop vari-eties with seed banks and NRM tech-nologies is required. Organization and consolidation of the fragmented family farms need immediate atten-tion. Making farming high tech to at-tract youth in farming and providing special support to educated youth for infrastructure development on their farms like green houses, nurs-eries, high tech orchards is required. This will help in attracting youth in agriculture.
Farming systems Sustainable high crop yields are possible in small family farms by the adoption of farming system
approach. It offers a range of products and productivity, socio-economic and environmental benefits. It involves conservation agriculture practices, scientific natural resource management, using quality seeds of high-yielding biotic and abiotic stress tolerant varieties, integrated pest and nutrient management, efficient water management, and the integration of agriculture, horticulture, forestry and livestock. The farming system offers a wide range of options to farmers according to their farming situations and according to their local conditions and constraints. The adoption of IFS is knowledge-intensive and often requires in-situ production of inputs and specialized tools. Policies are required to build capacity through new extension approaches such as farmer field schools, and facilitate local production of specialized farm inputs.
Concepts and procedures in farming systemIn rainfed farming development program, consideration of regional variability at micro level is very important. Thus, one requires identifying and grouping similar situations as target unit. It can effectively be done through identification and delineation of specific farming situations in a particular village or developmental block. A farming situation is a group of farm holdings which has similar strengths and weaknesses. After identification of farming situations integrated farming systems need to be adopted according to the capabilities of the land and requirement of the farm family. The different enterprises may be agriculture, horticulture, animal husbandry and aquaculture. It is an innovative approach to agricultural
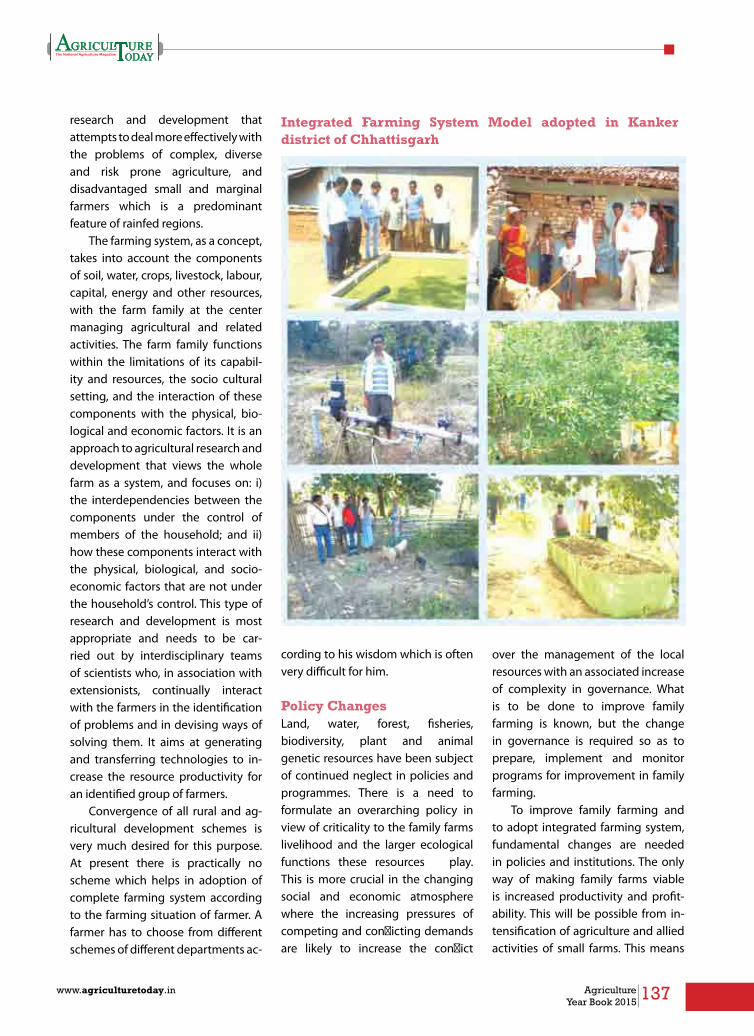
137www.agriculturetoday.in Agriculture Year Book 2015
research and development that attempts to deal more effectively with the problems of complex, diverse and risk prone agriculture, and disadvantaged small and marginal farmers which is a predominant feature of rainfed regions.
The farming system, as a concept, takes into account the components of soil, water, crops, livestock, labour, capital, energy and other resources, with the farm family at the center managing agricultural and related activities. The farm family functions within the limitations of its capabil-ity and resources, the socio cultural setting, and the interaction of these components with the physical, bio-logical and economic factors. It is an approach to agricultural research and development that views the whole farm as a system, and focuses on: i) the interdependencies between the components under the control of members of the household; and ii) how these components interact with the physical, biological, and socio-economic factors that are not under the household’s control. This type of research and development is most appropriate and needs to be car-ried out by interdisciplinary teams of scientists who, in association with extensionists, continually interact with the farmers in the identification of problems and in devising ways of solving them. It aims at generating and transferring technologies to in-crease the resource productivity for an identified group of farmers.
Convergence of all rural and ag-ricultural development schemes is very much desired for this purpose. At present there is practically no scheme which helps in adoption of complete farming system according to the farming situation of farmer. A farmer has to choose from different schemes of different departments ac-
cording to his wisdom which is often very difficult for him.
Policy ChangesLand, water, forest, fisheries, biodiversity, plant and animal genetic resources have been subject of continued neglect in policies and programmes. There is a need to formulate an overarching policy in view of criticality to the family farms livelihood and the larger ecological functions these resources play. This is more crucial in the changing social and economic atmosphere where the increasing pressures of competing and conflicting demands are likely to increase the conflict
over the management of the local resources with an associated increase of complexity in governance. What is to be done to improve family farming is known, but the change in governance is required so as to prepare, implement and monitor programs for improvement in family farming.
To improve family farming and to adopt integrated farming system, fundamental changes are needed in policies and institutions. The only way of making family farms viable is increased productivity and profit-ability. This will be possible from in-tensification of agriculture and allied activities of small farms. This means
Integrated Farming System Model adopted in Kanker district of Chhattisgarh
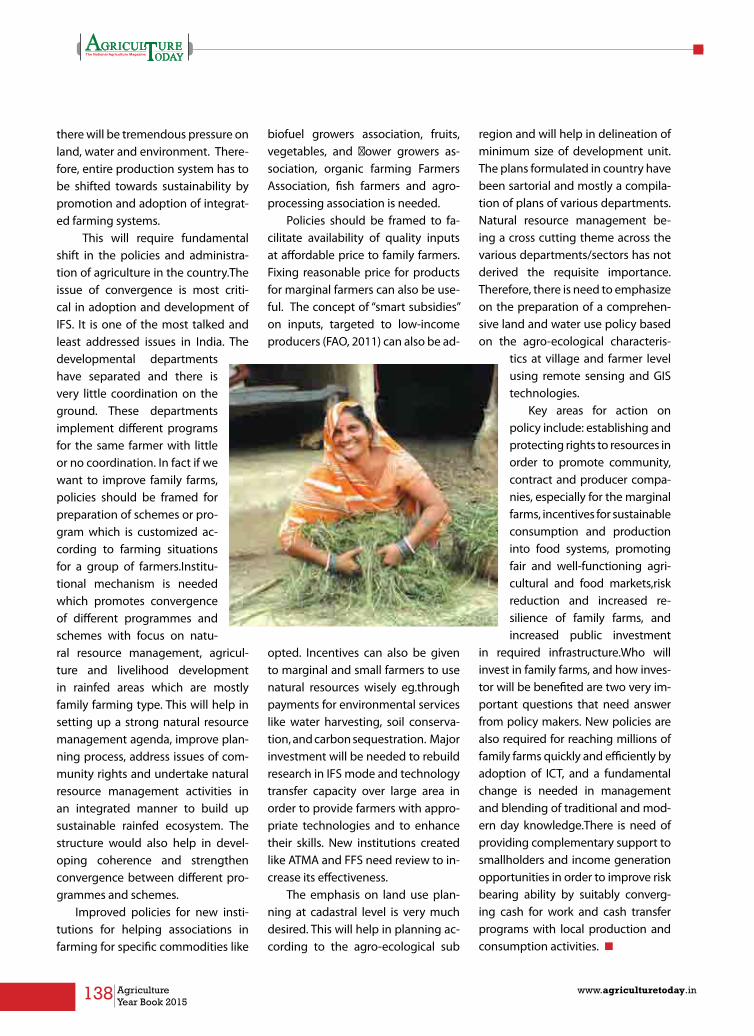
138 Agriculture Year Book 2015
www.agriculturetoday.in
there will be tremendous pressure on land, water and environment. There-fore, entire production system has to be shifted towards sustainability by promotion and adoption of integrat-ed farming systems.
This will require fundamental shift in the policies and administra-tion of agriculture in the country.The issue of convergence is most criti-cal in adoption and development of IFS. It is one of the most talked and least addressed issues in India. The developmental departments have separated and there is very little coordination on the ground. These departments implement different programs for the same farmer with little or no coordination. In fact if we want to improve family farms, policies should be framed for preparation of schemes or pro-gram which is customized ac-cording to farming situations for a group of farmers.Institu-tional mechanism is needed which promotes convergence of different programmes and schemes with focus on natu-ral resource management, agricul-ture and livelihood development in rainfed areas which are mostly family farming type. This will help in setting up a strong natural resource management agenda, improve plan-ning process, address issues of com-munity rights and undertake natural resource management activities in an integrated manner to build up sustainable rainfed ecosystem. The structure would also help in devel-oping coherence and strengthen convergence between different pro-grammes and schemes.
Improved policies for new insti-tutions for helping associations in farming for specific commodities like
biofuel growers association, fruits, vegetables, and flower growers as-sociation, organic farming Farmers Association, fish farmers and agro-processing association is needed.
Policies should be framed to fa-cilitate availability of quality inputs at affordable price to family farmers. Fixing reasonable price for products for marginal farmers can also be use-ful. The concept of “smart subsidies” on inputs, targeted to low-income producers (FAO, 2011) can also be ad-
opted. Incentives can also be given to marginal and small farmers to use natural resources wisely eg.through payments for environmental services like water harvesting, soil conserva-tion, and carbon sequestration. Major investment will be needed to rebuild research in IFS mode and technology transfer capacity over large area in order to provide farmers with appro-priate technologies and to enhance their skills. New institutions created like ATMA and FFS need review to in-crease its effectiveness.
The emphasis on land use plan-ning at cadastral level is very much desired. This will help in planning ac-cording to the agro-ecological sub
region and will help in delineation of minimum size of development unit. The plans formulated in country have been sartorial and mostly a compila-tion of plans of various departments. Natural resource management be-ing a cross cutting theme across the various departments/sectors has not derived the requisite importance. Therefore, there is need to emphasize on the preparation of a comprehen-sive land and water use policy based on the agro-ecological characteris-
tics at village and farmer level using remote sensing and GIS technologies.
Key areas for action on policy include: establishing and protecting rights to resources in order to promote community, contract and producer compa-nies, especially for the marginal farms, incentives for sustainable consumption and production into food systems, promoting fair and well-functioning agri-cultural and food markets,risk reduction and increased re-silience of family farms, and increased public investment
in required infrastructure.Who will invest in family farms, and how inves-tor will be benefited are two very im-portant questions that need answer from policy makers. New policies are also required for reaching millions of family farms quickly and efficiently by adoption of ICT, and a fundamental change is needed in management and blending of traditional and mod-ern day knowledge.There is need of providing complementary support to smallholders and income generation opportunities in order to improve risk bearing ability by suitably converg-ing cash for work and cash transfer programs with local production and consumption activities. n
139www.agriculturetoday.in Agriculture Year Book 2015

140 Agriculture Year Book 2015
www.agriculturetoday.in
Five Events that Transformed Rural India
Rural India is on the move- it has woken up from centuries of slumber. During the last four decades, there has been a dramatic transformation in the size, nature
and characteristics of this market. Today rural India accounts for almost half of the total Indian economy. The two Trillion $ Indian economy has two distinct halves – one Trillion $ in the urban space, built around the 400 million emerging middle class and one Trillion $ in the rural space, built around 850 million aspiring Indians.
In this article, I will attempt to look back at the last 35 years and identify some of the key events that helped catapult rural India into a new orbit of growth. I feel privileged that I have had the opportunity of seeing this awakening from very close quarters, and may be in some small way have also made my humble contribution in this process.
1: 1980s THE WINDOW OPENSThe decade of the 1980s is when the window of rural India opened to the first rays of a new dawn. Two sporting events one in Delhi and the other in London set the ball rolling –Nov 1982 Asian Games, Delhi and June 1983 India’s unexpected win of the World Cup of Cricket, Lords London. The first bringing colour television to India and the second getting millions of viewers glued to this medium.It was the vision of Rajiv Gandhi and the passion of Kapil Dev’s daredevils, that kick started this revolution. The proud moment when Kapil Dev kissed the World Cup is etched in our memory. This opened the flood gates to the expansion of the TV network in the country, first with Doordarshan’s expansion of their terrestrial network and thereafter with the entry of cable television, from programming in English & Hindi to regional languages – 1992 entry of Sun TV, Star TV and Enaadu TV, from drab news
Pawan MalikAgribusiness Consultant,
former President, Fertilisers & Agribusiness,
Aditya Birla Nuvo
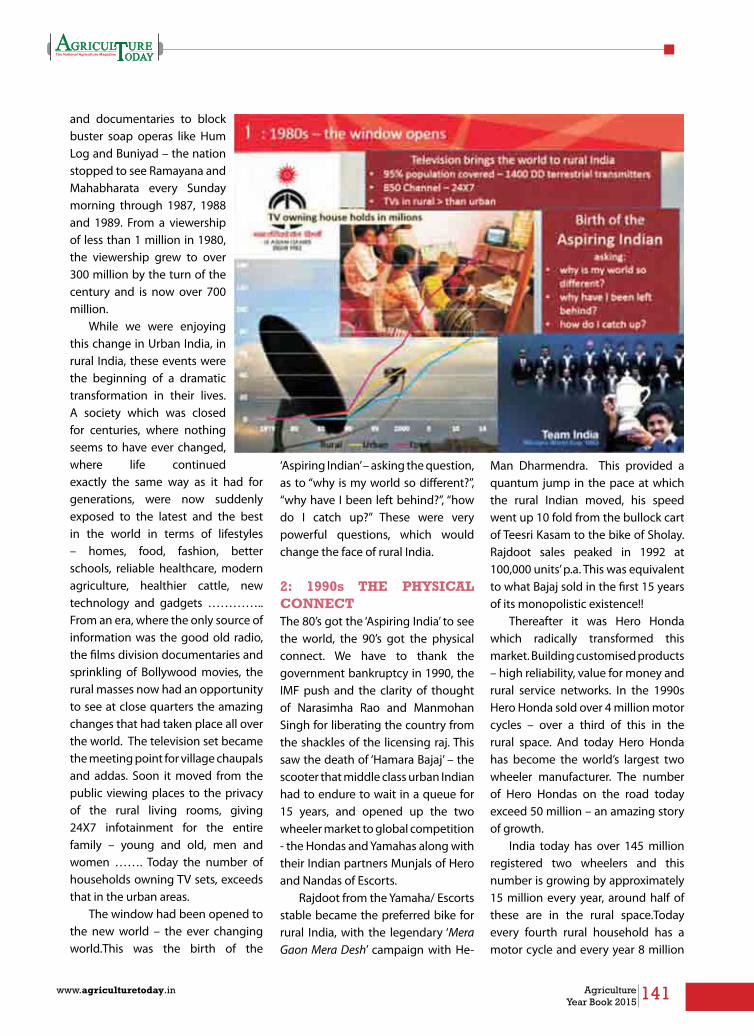
141www.agriculturetoday.in Agriculture Year Book 2015
and documentaries to block buster soap operas like Hum Log and Buniyad – the nation stopped to see Ramayana and Mahabharata every Sunday morning through 1987, 1988 and 1989. From a viewership of less than 1 million in 1980, the viewership grew to over 300 million by the turn of the century and is now over 700 million.
While we were enjoying this change in Urban India, in rural India, these events were the beginning of a dramatic transformation in their lives. A society which was closed for centuries, where nothing seems to have ever changed, where life continued exactly the same way as it had for generations, were now suddenly exposed to the latest and the best in the world in terms of lifestyles – homes, food, fashion, better schools, reliable healthcare, modern agriculture, healthier cattle, new technology and gadgets ………….. From an era, where the only source of information was the good old radio, the films division documentaries and sprinkling of Bollywood movies, the rural masses now had an opportunity to see at close quarters the amazing changes that had taken place all over the world. The television set became the meeting point for village chaupals and addas. Soon it moved from the public viewing places to the privacy of the rural living rooms, giving 24X7 infotainment for the entire family – young and old, men and women ……. Today the number of households owning TV sets, exceeds that in the urban areas.
The window had been opened to the new world – the ever changing world.This was the birth of the
‘Aspiring Indian’ – asking the question, as to “why is my world so different?”, “why have I been left behind?”, “how do I catch up?” These were very powerful questions, which would change the face of rural India.
2: 1990s THE PHYSICAl CONNECTThe 80’s got the ‘Aspiring India’ to see the world, the 90’s got the physical connect. We have to thank the government bankruptcy in 1990, the IMF push and the clarity of thought of Narasimha Rao and Manmohan Singh for liberating the country from the shackles of the licensing raj. This saw the death of ‘Hamara Bajaj’ – the scooter that middle class urban Indian had to endure to wait in a queue for 15 years, and opened up the two wheeler market to global competition - the Hondas and Yamahas along with their Indian partners Munjals of Hero and Nandas of Escorts.
Rajdoot from the Yamaha/ Escorts stable became the preferred bike for rural India, with the legendary ‘Mera Gaon Mera Desh’ campaign with He-
Man Dharmendra. This provided a quantum jump in the pace at which the rural Indian moved, his speed went up 10 fold from the bullock cart of Teesri Kasam to the bike of Sholay. Rajdoot sales peaked in 1992 at 100,000 units’ p.a. This was equivalent to what Bajaj sold in the first 15 years of its monopolistic existence!!
Thereafter it was Hero Honda which radically transformed this market. Building customised products – high reliability, value for money and rural service networks. In the 1990s Hero Honda sold over 4 million motor cycles – over a third of this in the rural space. And today Hero Honda has become the world’s largest two wheeler manufacturer. The number of Hero Hondas on the road today exceed 50 million – an amazing story of growth.
India today has over 145 million registered two wheelers and this number is growing by approximately 15 million every year, around half of these are in the rural space.Today every fourth rural household has a motor cycle and every year 8 million

142 Agriculture Year Book 2015
www.agriculturetoday.in
more household are getting mobility. In rural India, the bicycle has been replaced by the motor bike, the bullock cart by the tractor trolley.
With an average family size of 5, the two wheelers have provided mobility to over 700 million Indian.
1990s also saw a tremendous thrust in improving road connectivity in India. Atal Bihari Vajpayee’s dream of connecting India through the golden quadrilateral and the thrust on building rural roads through the Pradhan Mantri Gram Sadak Yojna, the schemes has helped more than double the length of rural road from 13 lakh km to 28 lakh km, during this decade.
The two wheeler revolution and the rural roads have enabled the ‘aspiring Indian’ to move out of his
villages and provided the ‘physical connect’ to the District headquarters to the Tier 2 and 3 town. This is what caused the boom in FMCG market in Tier 2 and 3 town in the 1990s. This is when marketers suddenly realised the huge business possibilities of rural India.
The party had just begun, this was only the tip of the iceberg……
3: 2000s WORlD IS ONEThe turn of the century saw the mobile communication technology changing the world. While the bikes took rural Indian to the District HQ, the cell phone opened up the whole world to the aspiring Indian. The rural Indian, could now move out to the unknown world, while always remaining connected. Distances
meant nothing, the fear of the world outside was gone, and everyone was available 24X7 at the press of a button. This has totally changed the mind sets and enabled the ‘argumentative Indian’ to channelize his energies to exploiting opportunities far and wide.
This has meant, that men were seizing opportunities much beyond their village, district, state and even the country; women felt more confident to leave the safety of their homes and are able to join hands to add to the families income streams, and for the children a whole new world of learning and fun possibilities has opened up.
The pace at which rural India has taken to cellular technology is a reflection of the huge difference it

143www.agriculturetoday.in Agriculture Year Book 2015
has made in their lives. Today over three fourth of the rural males have cell phones. The overall rural tele-density has grown from under one per cent in 2000 to almost 50 per cent now. There are over 400 million cell phone subscribers in rural India – 42 per cent of the total subscribers.
States like Punjab, Tamilandu, Kerala, Karnataka, Maharashtra, Gujarat and HP have a more than 90 per cent tele-density, with 50 per cent of the households having internet access. Other states are catching up.
It’s been an amazing journey from ignorance to enlightenment, never before seen in the history of mankind.
4: 2010s FINANCIAl INClUSIONThe Prime Minister’s Pradhan Mantri Jan DhanYojna has given a huge boost to the process of financial inclusion. By the end of July 2015, over 17 Cr new bank accounts have been opened, with a balance of more than Rs 20,000 Cr and 15 Cr Rupay Debit cards have been issued with an overdraft facility. A mammoth
achievement.This process started in 2005,
through the UPA Government’s much maligned rural unemployment guarantee scheme MNREGA, when the payments were directly credited to the person’s bank account. Over 5 Cr bank accounts were opened and approximately Rs 30,000 Cr transferred to these accounts.
Today there are more Kisan Credit Cards than the total number of cards issued by commercial banks in the urban space. Over 10 Cr Kisan Credit cards have been issued and around Rs 70,000 Cr credit has been made available to the farmers.
The linkage of all these Jan Dhan accounts to Aaadhar and the government programme of direct transfer of subsidy to the individual’s bank account will bring a focused approach to the poverty alleviation efforts and lot more transparency into the system.
Universal banking has bought all the rural Indian into the mainstream of banking and business – opening the doors to the next revolution of e-commerce.
5: THE AGRI BOOMThese changes in the rural environment have come at a perfect time of a global boom in agricultural commodities.
The demand for agricultural products has been growing as we move towards better food – from cereals and pulses to fruits and vegetables and animal products. Agriculture has moved from merely being a provider of food to fibre (cotton) and now even fuel (biofuels).
New technology in agriculture is beginning to change the rural landscape. In the late 60s and 70s we saw the dwarf high yielding varieties bringing the green revolution in wheat. Now the second green revolution is happening - GM cotton led the tripling of India’s cotton production in last ten years and has transformed us from an importer to the world’s largest exporter of cotton. Single cross hybrid corn seeds have catapulted North Bihar’s yields to match the best in the world. Area under fruits and vegetables cultivation has doubled in the last 10 years, transforming the economy of areas in close proximity to the urban consuming centres. The clear shift toward cash crops has improved the farmers’ cash flows.
Micro irrigation – drips and sprinklers - have opened up new possibilities in rain starved areas for dry land farming. Development of appropriate farm mechanisation – harvester/combines, small tractors, etc. are changing the face of Indian agriculture. Over a third of the farmers have now supplementary incomes from animal husbandry, dairying, poultry, fisheries, etc. Rural spending is now less dependent on

144 Agriculture Year Book 2015
www.agriculturetoday.in
farm income, which is now less than 50 per cent of the total income. The wheels of change are chugging fast and these pockets of innovation are spreading and transforming the face of rural India.
We need to credit the government for pushing this process, dramatically increasing the Minimum support prices for all the agricultural products. During the eight year period from
2005-06 to 2013-14, the MSP of wheat, rice, sugarcane, cotton, pulses, etc. have all doubled to tripled. This has made a huge contribution in increasing the farmers’ income over this period.
The rain Gods too have been kind and the old days of drought and famine are almost forgotten.
With increasing urbanisation and industrialisation, the land available
for agriculture is shrinking. This has opened up new opportunities for agri economies like India and Brazil.
The opportunities in the agri space are huge. India has the potential to become a major supplier of agricultural products to the world. This is possible with the right government interventions, appropriate technology and an enabling environment.
SHRINKING RURAl – URBAN DIVIDEWith increased rural incomes the ‘aspiring rural Indian’ is bridging the gap with the urban customers.In 1951 the literacy rate in rural India was barely 12%, a third of that in urban India which was at 35%. The 2011 census shows that rural India has now almost caught with a literacy rate of 69%, as against 85% in urban areas. Over 95% of the 640,000 villages have electricity and two third of the households have access to power, 50% have television sets, a third have refrigerators, a fourth have motor cycles,……..During the last 15 years since 2000, the GDP of rural India has grown at a CAGR of 6.2%, as against 4.7% in Urban India. During the last five years, for the first time the rural consumption growth has outpaced urban consumption growth.Economist forecast that these trend will continue and as a result the size of the rural economy would soon be bigger than the urban economy!!
The developments of the last three decades have been truly historic and we have seen 850 million rural India break their centuries old bondage and are poised to realise their true potential. Therein lies the Dream of a prosperous Bharat. n

145www.agriculturetoday.in Agriculture Year Book 2015
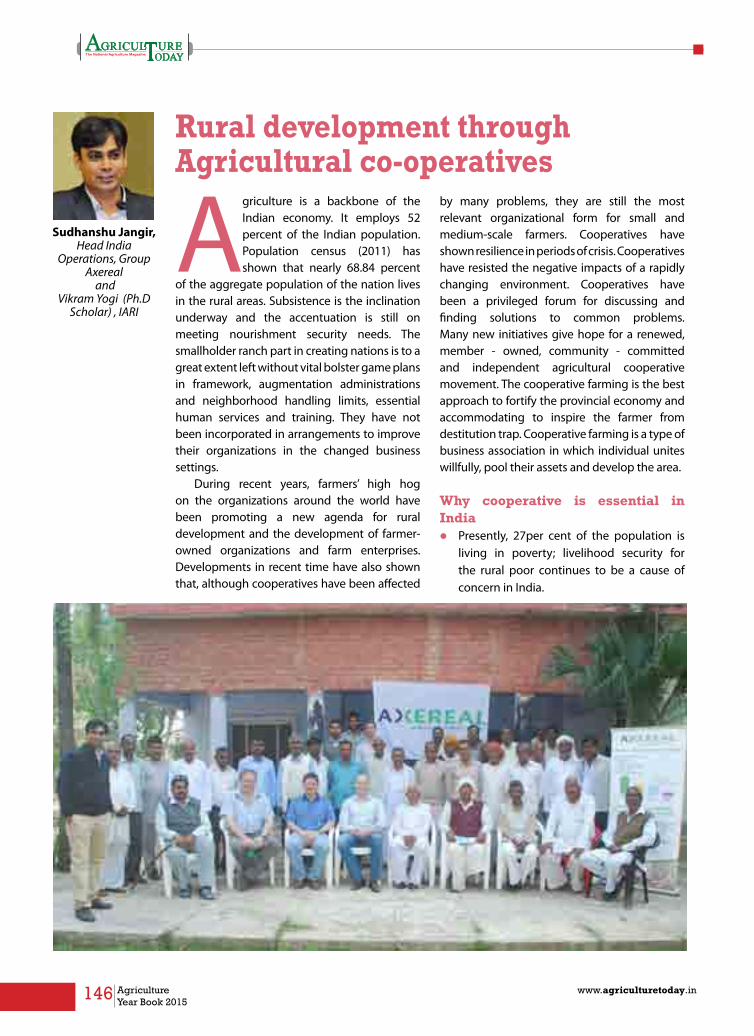
146 Agriculture Year Book 2015
www.agriculturetoday.in
Rural development through Agricultural co-operatives
Agriculture is a backbone of the Indian economy. It employs 52 percent of the Indian population. Population census (2011) has shown that nearly 68.84 percent
of the aggregate population of the nation lives in the rural areas. Subsistence is the inclination underway and the accentuation is still on meeting nourishment security needs. The smallholder ranch part in creating nations is to a great extent left without vital bolster game plans in framework, augmentation administrations and neighborhood handling limits, essential human services and training. They have not been incorporated in arrangements to improve their organizations in the changed business settings.
During recent years, farmers’ high hog on the organizations around the world have been promoting a new agenda for rural development and the development of farmer-owned organizations and farm enterprises. Developments in recent time have also shown that, although cooperatives have been affected
by many problems, they are still the most relevant organizational form for small and medium-scale farmers. Cooperatives have shown resilience in periods of crisis. Cooperatives have resisted the negative impacts of a rapidly changing environment. Cooperatives have been a privileged forum for discussing and finding solutions to common problems. Many new initiatives give hope for a renewed, member - owned, community - committed and independent agricultural cooperative movement. The cooperative farming is the best approach to fortify the provincial economy and accommodating to inspire the farmer from destitution trap. Cooperative farming is a type of business association in which individual unites willfully, pool their assets and develop the area.
Why cooperative is essential in Indial Presently, 27per cent of the population is
living in poverty; livelihood security for the rural poor continues to be a cause of concern in India.
Sudhanshu Jangir, Head India
Operations, Group Axereal
and Vikram Yogi (Ph.D
Scholar) , IARI

147www.agriculturetoday.in Agriculture Year Book 2015
l Poor access of the farmers to good roads, market infrastructure, refrigerated transportation of goods.
l Better negotiation with Industry, government and real estate business for land prices at time of acquisition and sales of land. Unity tends to decrease harassment by land mafia or industry.
Under the circumstances, there is a need for resurgence of cooperatives as important instruments. “In terms of the decent work paradigm, cooperatives could lead the way by demonstrating what we really mean by freedom, equity, security and human dignity. Thus cooperatives by being true to their basic principles provide locally-based answers to globalization. Therefore, contrary to the belief that globalization impedes the growth of cooperatives; cooperatives are the vital agencies to face the challenges posed by globalization.
Cooperatives, in all spheres, today cover approximately 97% of Indian villages and 71% of total rural households in the country. Their contribution to the national economy may be seen from the following table
The Co-operative societies operating in India can be categorised into four major categories:
• Production Cooperatives which deal with agricultural and industrial production, such as Farming Cooperatives, Industrial Cooperatives and Processing Cooperatives.
• Marketing Cooperatives which are engaged in marketing of agricultural produce, such as Agricultural Marketing Societies and Consumer Cooperatives.
• Service Cooperatives which provide services necessary for their members, such as Cooperative Credit Societies and Cooperative Banks and also Housing Cooperatives,
• Allied Service Cooperatives which are dealing with activities necessary for daily life and business of the agriculturists, artisans, etc
Axereal: one of the most successful French coopera-tive of Europe; dealing from Farm to ForkAxereal cooperative is a French cooperative group which includes 13,000 member farmers, based at Orleans in center France. Group Axereal is active in integrated supply chain from agriculture to agro industry. Axereal is grain industry expert in France and abroad. Group Axereal is dealing in seed selling, contract
l The last four decades have witnessed a sharp decline in the average size of operational land holdings in India. The average size of operational land holdings has reduced by half from 2.28 ha in 1970-71 to 1.16 ha in 2010-11. Land holdings in the marginal category (less than one ha.) constitute 67 per cent of the operational holdings in the country (2010-11). Small and marginal holdings together, constitute 85 per cent in terms of number of operational holdings and 44 per cent of the operated area in the country. This is reflective of the immense population pressure on the limited land resource available for cultivation.
l Due to small land holding and labour shortage farm mechanization is difficult for individual farmer.
l Due to smaller quantity of produce farmers are unable to bargain for his product
l Due to small holding and less quantity of production by farmer, lack of will power to become farm entrepreneur
l Dependence on the monsoon, which make farm business as highly risky enterprises.
l Cartels or predetermined market sharing by private enterprises can be harmful for free and fair trade. Cooperatives by their very presence would help to maintain the balance in terms of price and quality. For this reason cooperatives need to enter all those areas where full domination by the private corporate might eventually spell bad news to the consumers.
l Inadequate availability of electricity, fertilizers, irrigation and pesticides
Rural network covered 97 %
Agriculture credit disturbed by cooperative 19%
Fertilizer distributed by cooperative 36%
Fisherman in coopeartive 23%
Milk procurement to total production 8.19%
Handlooms in cooperative 54%
Self employment generated 15.47 million
Direct employment generated 1.22 million
# data collected from NCUI
Share of Cooperatives in National Economy

148 Agriculture Year Book 2015
www.agriculturetoday.in
farming, cereal storage, commodity trading and first transformation process. Group also produces wheat flour (420000 tonnes production in Europe, 4th largest in France), malt (1.1 million ton in Europe, 5th largest in the world), vegetable oil and cattle feed. In year 2013 Group collected 4.5 million tonnes of cereals in 373 silos owned by the group itself. Group also has marketed 8 to 9 million tonnes of cereals. It is actively working in France, UK, Ireland, Belgium and central European countries (Serbia, Croatia, Hungary, and Romania), Algeria and India with total turnover of 3.4 Billion Euro in 2012.In these countries, this operates on cooperative contract farming model.
Axereal business model in IndiaAxereal Operations in India, which commenced on August 2010, included, Malting barley production, research program, varieties trial (barley , corn, fodder beet), Agronomy trial, consulting activities, Testing of European farm equipments for suitability in Indian condition and modifying them according to farmers’ needs, testing of sprayers, testing of
agrochemicals, India practice research to make farm economy as viable and profitable.
Axereal co-operative Fran-chise model- Step towards agri entrepreneurshipAxereal group has developed an entrepreneurship model for Indian farmer, to make farming as a profitable entrepreneur.
Agri entrepreneurship for the farmers, by the Farmers Axereal is working on above model in India. The main motto of Axereal is, to develop entrepreneurship in farmer and make farming business a viable activity.
Government initiation for development of commu-nity or cooperative based enterprises in India. ‘Small Farmers’ Agribusiness Con-sortium (SFAC) and Farmers
Producer organizationSmall Farmers’ Agribusiness Consortium (SFAC) is society promoted by Department of Agriculture and Cooperation, Ministry of Agriculture, Govt. of India. The main aim of society is to promote agri-business by encouraging institutional and private sector investments and linkages to ensure the empowerment of all farmers in the country. The mission of SFAC is to link small farmers to technology as well as to the markets in association with private, corporate or cooperative sector and if necessary, by providing backward and forward linkages.
Farmers will be organized in small neighborhood informal groups which would be supported under the programme to form associations/organizations relevant to their context including confederating them into FPOs for improved input and output market access and negotiating power. Different case studies on FPO have shown that FAO has been successful

149www.agriculturetoday.in Agriculture Year Book 2015
in achieving their objective. Although FPO has succeeded but there are some challenges which are of major concern. The main loopholes of the Farmer producers company (FPC) is shortage of working capital- bank does not give loan to the Producer committee as it demands three year balance sheet, legal formalities like making Permanent Account Number (PAN) card of the member farmers who don’t have proper date of birth proof, no proper awareness about the FPCs among the government departments who consider them as private firms. Also, farmers feel that the PC only purchases seed from selected member farmers in every season. Farmers want to sell their grain through the PC but due to shortage of capital, FPC can’t buy.Lack of centralized storage facility is also another problem, due to which they have to sell their produce at the prevailing price and can’t wait for better price.
Problems in cooperative sector in India l The role of Governments in the
cooperatives is so dominant that the members consider the societies not their own, but as a
player of the State. To them the cooperatives appear as a source from which they can borrow Government funds.
l The impact of politics upon the cooperatives seems to be getting heavier and more direct day by day. In several states the leadership of the cooperatives is heavily sprinkled with active politicians. So, politician use cooperative societies for their own benefit.
l A very large number of cooperative societies are, in effect, owned exclusively by influential families with a bogus membership of some outsiders to give them the appearance of cooperative bodies. This reduces the credibility of these societies.
l Inability to ensure active membership, speedy exit of non-user members, lack of member communication and awareness building measures are the major problems of the society.
l Serious inadequacies in governance including that related to Boards’ roles and responsibilities.
l A general lack of recognition
of cooperatives as economic institutions both amongst the policy makers and public.
l Lack of cost competitiveness arising out of issues such as overstaffing a general top-down approach in forming cooperatives including the tiered structure Politicization and excessive role of the government chiefly arising out of the loopholes and restrictive provisions in the Cooperative Acts
l In addition to the above, there is also a serious problem of a large number of cooperatives that are sick/non viable.
Way aheadCooperatives have a significant role to play in the future setting of our economy. It is the cooperatives again who are equipped to work as pressure groups to voice peoples’ views in the market. Apart from employment generation, they create a conducive business environment private entrepreneurship and investment in the development of value chains, in the provision of infrastructure and services and participation in sector-specific policy-making processes. Cooperatives are the exceptional channels to keep the poise of communism and democracy afloat. Delivering profitable governance is another critical requirement that can insure a harmonious trickling of benefits to the targeted beneficiaries.For the development of cooperative farming or cooperative organization government should provide adequate source of strength facilities to these institutions. Government should provide monetary and technical support to these institutions.Government should cut back the long formalities for this type of institution. n
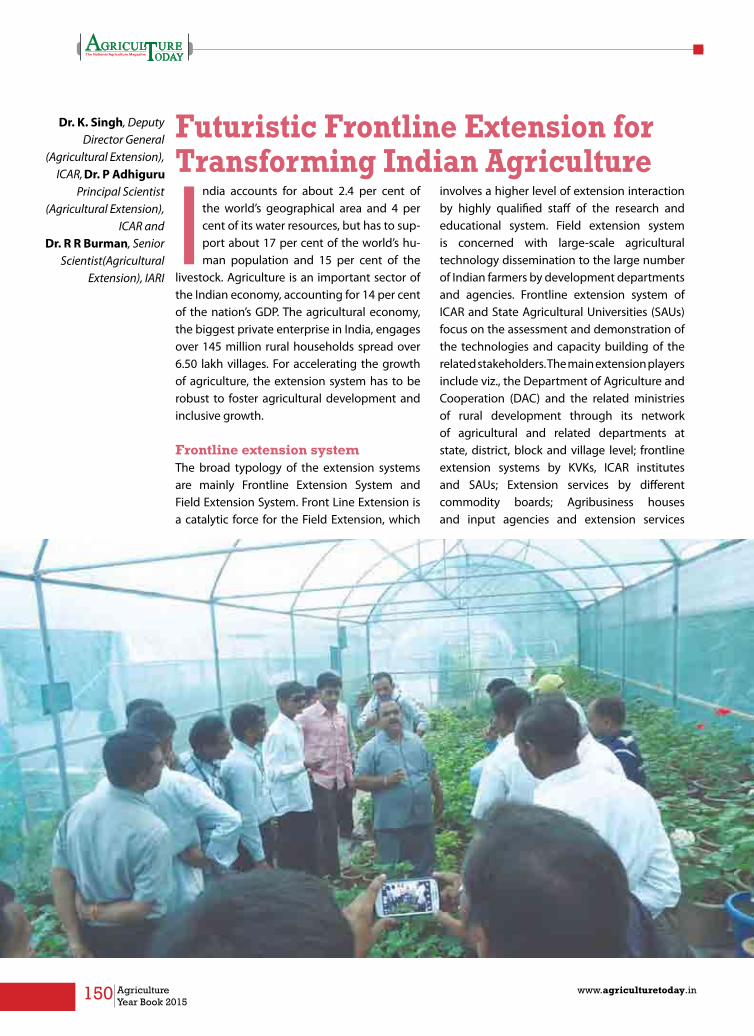
150 Agriculture Year Book 2015
www.agriculturetoday.in
Futuristic Frontline Extension for Transforming Indian Agriculture
India accounts for about 2.4 per cent of the world’s geographical area and 4 per cent of its water resources, but has to sup-port about 17 per cent of the world’s hu-man population and 15 per cent of the
livestock. Agriculture is an important sector of the Indian economy, accounting for 14 per cent of the nation’s GDP. The agricultural economy, the biggest private enterprise in India, engages over 145 million rural households spread over 6.50 lakh villages. For accelerating the growth of agriculture, the extension system has to be robust to foster agricultural development and inclusive growth.
Frontline extension system The broad typology of the extension systems are mainly Frontline Extension System and Field Extension System. Front Line Extension is a catalytic force for the Field Extension, which
involves a higher level of extension interaction by highly qualified staff of the research and educational system. Field extension system is concerned with large-scale agricultural technology dissemination to the large number of Indian farmers by development departments and agencies. Frontline extension system of ICAR and State Agricultural Universities (SAUs) focus on the assessment and demonstration of the technologies and capacity building of the related stakeholders. The main extension players include viz., the Department of Agriculture and Cooperation (DAC) and the related ministries of rural development through its network of agricultural and related departments at state, district, block and village level; frontline extension systems by KVKs, ICAR institutes and SAUs; Extension services by different commodity boards; Agribusiness houses and input agencies and extension services
Dr. K. Singh, Deputy Director General
(Agricultural Extension), ICAR,
Principal Scientist (Agricultural Extension),
ICAR and Dr. R R Burman, Senior
Scientist(Agricultural Extension), IARI
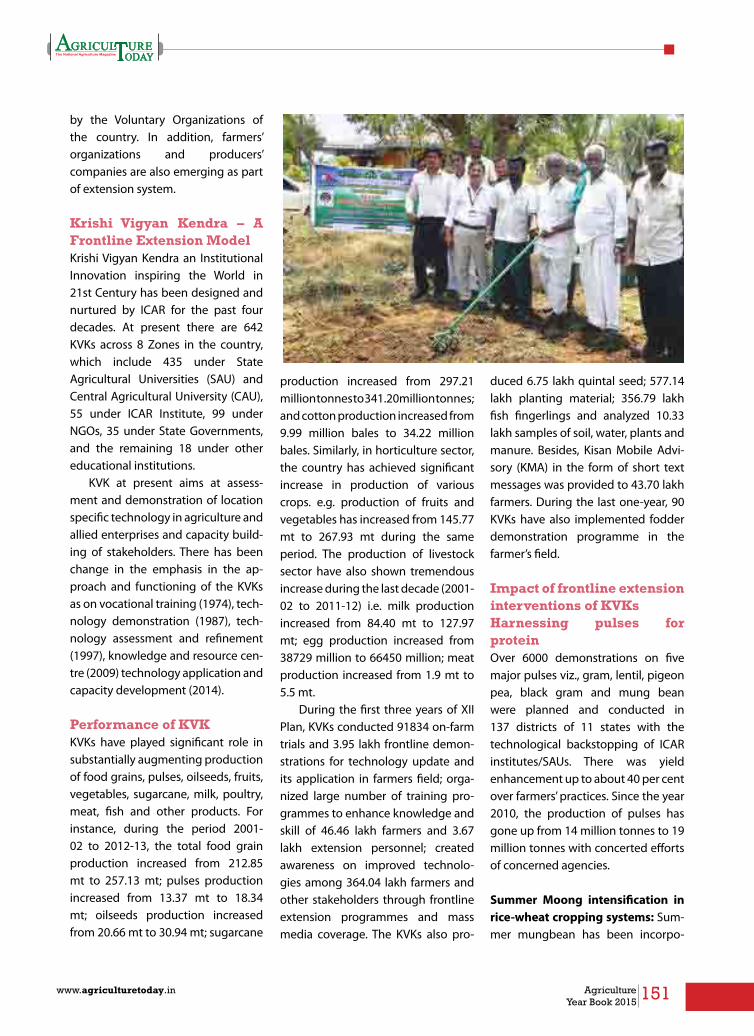
151www.agriculturetoday.in Agriculture Year Book 2015
by the Voluntary Organizations of the country. In addition, farmers’ organizations and producers’ companies are also emerging as part of extension system.
Krishi Vigyan Kendra – A Frontline Extension ModelKrishi Vigyan Kendra an Institutional Innovation inspiring the World in 21st Century has been designed and nurtured by ICAR for the past four decades. At present there are 642 KVKs across 8 Zones in the country, which include 435 under State Agricultural Universities (SAU) and Central Agricultural University (CAU), 55 under ICAR Institute, 99 under NGOs, 35 under State Governments, and the remaining 18 under other educational institutions.
KVK at present aims at assess-ment and demonstration of location specific technology in agriculture and allied enterprises and capacity build-ing of stakeholders. There has been change in the emphasis in the ap-proach and functioning of the KVKs as on vocational training (1974), tech-nology demonstration (1987), tech-nology assessment and refinement (1997), knowledge and resource cen-tre (2009) technology application and capacity development (2014).
Performance of KVKKVKs have played significant role in substantially augmenting production of food grains, pulses, oilseeds, fruits, vegetables, sugarcane, milk, poultry, meat, fish and other products. For instance, during the period 2001-02 to 2012-13, the total food grain production increased from 212.85 mt to 257.13 mt; pulses production increased from 13.37 mt to 18.34 mt; oilseeds production increased from 20.66 mt to 30.94 mt; sugarcane
production increased from 297.21 million tonnes to 341.20million tonnes; and cotton production increased from 9.99 million bales to 34.22 million bales. Similarly, in horticulture sector, the country has achieved significant increase in production of various crops. e.g. production of fruits and vegetables has increased from 145.77 mt to 267.93 mt during the same period. The production of livestock sector have also shown tremendous increase during the last decade (2001-02 to 2011-12) i.e. milk production increased from 84.40 mt to 127.97 mt; egg production increased from 38729 million to 66450 million; meat production increased from 1.9 mt to 5.5 mt.
During the first three years of XII Plan, KVKs conducted 91834 on-farm trials and 3.95 lakh frontline demon-strations for technology update and its application in farmers field; orga-nized large number of training pro-grammes to enhance knowledge and skill of 46.46 lakh farmers and 3.67 lakh extension personnel; created awareness on improved technolo-gies among 364.04 lakh farmers and other stakeholders through frontline extension programmes and mass media coverage. The KVKs also pro-
duced 6.75 lakh quintal seed; 577.14 lakh planting material; 356.79 lakh fish fingerlings and analyzed 10.33 lakh samples of soil, water, plants and manure. Besides, Kisan Mobile Advi-sory (KMA) in the form of short text messages was provided to 43.70 lakh farmers. During the last one-year, 90 KVKs have also implemented fodder demonstration programme in the farmer’s field.
Impact of frontline extension interventions of KVKsHarnessing pulses for proteinOver 6000 demonstrations on five major pulses viz., gram, lentil, pigeon pea, black gram and mung bean were planned and conducted in 137 districts of 11 states with the technological backstopping of ICAR institutes/SAUs. There was yield enhancement up to about 40 per cent over farmers’ practices. Since the year 2010, the production of pulses has gone up from 14 million tonnes to 19 million tonnes with concerted efforts of concerned agencies.
Summer Moong intensification in rice-wheat cropping systems: Sum-mer mungbean has been incorpo-

152 Agriculture Year Book 2015
www.agriculturetoday.in
rated as additional crop in rice-wheat system in Haryana, Punjab, and Uttar Pradesh and economic gains of Rs25, 000 to 30,000 per ha are being real-ized by the farmers.
Upscaling of Malviya-13 variety of Pigeonpea: KVK Munger, Bihar has been able to upscale Malviya-13 va-riety in 13 districts of Bihar in more than 1000 ha with the involvement of 13670 farmers. The variety has re-corded 83 per cent more yield and 111 per cent more net return.
Summer Groundnut Introduction: KVK-Mainpuri, Uttar Pradesh experi-mented on summer groundnut with average yield of 26.15 q/ha, gross return of Rs. 53500/ha & net return of Rs. 31500/ha. The technology has spread to 16 districts and about 2.00 lakh ha area in Uttar Pradesh.
Reducing pesticide spray on Cot-ton: Integrated Pest Management technology has spread in more than 75 villages of district-Jalna, Maha-rashtra and adopted on more than 10,000 ha by 5000 farmers in the district. Cost on plant protection re-duced by 42 per cent and average yield increased by 35 per cent.
Climate Resilient Agriculture100 KVKs worked on resilient technologies with focus on suitable crops, varieties, natural resource management, farm mechanization and custom hiring services, and also sensitized stakeholders on drought, flood, frost, soil related issues and ground water depletion. KVKs have developed climate smart villages which are weather smart, water smart, carbon smart, nutrient smart, energy smart, and knowledge smart.
Resource Conservation: The tech-nologies have been introduced in Haryana and Punjab, Uttar Pradesh, Bihar, Jharkhand, Madhya Pradesh, Chhattisgarh and Andhra Pradesh. In Chandauli, Uttar Pradesh, 60,000 ha area has been brought under zero tillage wheat cultivation. Rainwater harvesting through land shaping: To overcome the three ma-jor constraints of Sundarbans such as low lying mono cropped area, soil sa-linity and impeded drainage system, the KVK, Nimpith has developed the sustainable technology.Water Conservation in drought prone areas: Water conservation measures were promoted in district Gadag, Karnataka through trainings and demonstrations in 11 villages covering 1660 farmers, in an area of 1331 ha. The major impact were in-creased area under irrigated rice, in-creased groundwater table, increase in yield of pulses and oilseeds.
Effective ConvergenceATMA, Department of Agriculture, Horticulture and other line departments, National Horticulture Mission, RKVY all are running at the district level with the technical support of KVKs.
District plan: KVKs assisted in preparation of Comprehensive Dis-
trict Agriculture Plan(CDAP) of 615 districts.
Convergence platform: A con-vergence platform of 12 different departments/ organizations under the leadership of KVKs in the state of Madhya Pradesh involved 5000 farmers from each district. The Govt. of Madhya Pradesh has appreciated the efforts of KVKs and recognized the role of KVKs by conferring Krishi Kramana Award.
Institutional innovations: Ten KVKs in Madhya Pradesh in collabora-tion with state Government support Krishi Tirth Yojana for technology showcasing, Krishi Mohotsava in 46 districts have been organized at Naya Panchayat level covering 20,000 vil-lages in 310 blocks.
Convergence through focused production program-Maize: 150 KVKs implemented a special program on single cross hybrids with techno-logical backstopping of ICAR-Direc-torate of Maize Research.
Convergence through focused production program-Wheat: In col-laboration with ICAR-Directorate of Wheat Research (DWR), 67 KVKs are working on assessment, and dem-onstration of wheat varieties and re-lated technologies.
Convergence through Inte-grated Pest Management (IPM):

153www.agriculturetoday.in Agriculture Year Book 2015
With the technology backstopping by ICAR-National Centre for IPM, New Delhi, 141 KVKs are working for skill development in Integrated Pest Man-agement.
ICT mediated approach: Most of the KVKs are providing farm advisory to the farmers and around 22, 62,913 farmers are being reached through Farmer Portal.
Empowering tribal farmersAbout 125 KVKs are working in Tribal districts facilitating technology sup-port and related inputs to the tribal farmers and about 7.28 lakh tribal farmers benefited.
Institutional Innovation for Farm Mechanization Women Working Group: With the sup-port and supervision of KVK Malap-puram, 11 women formed the group named Krishi Sahayi during 2007-08 which deal with mat nursery prepara-tion, transplanting paddy etc.
Paddy Task Force: There are 12 Paddy Task Force functioning in Kan-nur district; Kerala and they cover 17-grampanchyats in the district and facilitating scientific rice production .
KVK system has played a key role in transfer of modern technologies in agriculture and allied sectors leading to increase in production and pro-ductivity, development of high value agriculture like horticulture, livestock and fisheries, introduction of newer varieties for pulses and oilseeds lead-ing to increase in income of farmers and promotion of farm-based enter-prises.
Way forward in strengthening of KVKsStrengthening is proposed in XII Plan for existing KVKs and there is provision for new KVKs in remaining and newly
created districts; one additional KVKs in larger districts; establishment of Integrated Farming System Module; Technology Information Unit; Mini Seed Processing Facility; Rain Water Harvesting Units; Soil and Water Testing Laboratories Micro Nutrient Analysis Facilities; Minimal Processing Facility; Portable Carp Hatchery; operation of e-Extension; e-FARMERS; Specialized KVKs; ICT in Agriculture including mobile and web platform, Farm Innovation and managing unforeseen calamities; infrastructure strengthening like boundary wall, power support and farm equipment.
New initiatives in frontline extension
FIRSTThe new proposed project – ‘Farmer FIRST’ is an ICAR initiative to move beyond the production and productivity and the focus is on farmer’s farm, innovations, resources, science and technology (FIRST). ‘Farmer FIRST’ aims at enhancing farmers-scientists interface for technology development and
application. The objectives are to take up technology development based on feedback with the participation of farmers; to build a network of linkages with different entities around the farm house holds; to find out the technical, socio-economic and environmental impact of the project to develop a database on performance of NARS technologies; to identify and integrate economically viable and socially acceptable entrepreneurial activities as models; to initiate special modules for farm women to enhance their participation in agricultural activities for higher earnings and livelihood security and to utilize the strength of the technology institution (partners) to develop commodity specific contents for knowledge sharing. This project is to be implemented in research mode by 100 ICAR Institutes/ Agricultural Universities. Each Institute will identify 4-5 villages. The project will cover about one lakh farm households during the project implementation.
Krishi DakIndian Institute of Agricultural

154 Agriculture Year Book 2015
www.agriculturetoday.in
Research, New Delhi has provided quality seeds of various crop varieties to the farmers of different remote areas in the country through Post Offices and Postman. Under the Scheme, rural Postman and farmers have been trained on improved agricultural practices by the regional KVKs. These Postmen/farmers demonstrated improved Pusa varieties in their field which became the source of practical training for other farmers.
The initial trial of this model was carried out in Sitapur district of Uttar Pradesh through seven rural Post Offices. Thereafter, its valida-tion was done with the help of 20 rural post offices. By adopting this practice and easy availability of high quality seeds and crop pro-duction skill, 11 to 30 % increase in productivity was observed in the projected areas. It is proposed that this model should be extended to 100 districts of 14 states (Jammu & Kashmir, Punjab, Himachal Pradesh, Haryana, Uttrakhand, Uttar Pradesh, Bihar, Jharkhand, West Bengal, Orissa, Chhatisgarh, Madhya Pradesh, Raj-asthan and Gujrat) during the 12th plan.
Mera Gaon Mera GauravThe objective of “Mera gaon Mera Gaurav” is to provide farmers with required information, knowledge and advisories on regular basis. Under this scheme, scientists will select a village as per their convenience and will remain in touch with that village and provide information to farmers on technical and other related aspects in a time frame through personal visits or on telephone. In this way, 20,000 scientists of National Agricultural Research and Education System (NARES) can work by selecting
villages as “Sampark Gaon”. Under this initiative, it is required that groups of 3-4 scientists each consisting of different disciplines at every Institute/University should adopt one village. Quarterly performance report and Benchmark survey report of the village will be generated.
Attracting and Retaining Youth in Agriculture (ARYA)The objectives of “Attracting and Retaining Youth in Agriculture (ARYA) project are to attract and empower the Youth in Rural Areas to take up various Agriculture, allied and service sector enterprises for sustainable income and gainful employment in selected districts; to enable the Farm Youth to establish network groups to take up resource and capital intensive activities like processing, value addition and marketing; and to demonstrate functional linkage with different institutions and stakeholders for convergence of opportunities available under various schemes/ program for sustainable development of youth. ARYA project will be implemented in 25 States through KVKs, one district from each State. In one district, 200-300 rural youths will be identified for their skill development in entrepreneurial activities and establishment of related micro-enterprise units in the area of
Apiary, Mushroom, Seed Processing, Soil testing, Poultry, Dairy, Goatry, Carp-hatchery, Vermi-compost etc., At KVKs also one or two enterprise units will be established so that they serve as entrepreneurial training units for farmers. The trained youth groups will function as role model for other youths and will demonstrate
the potentiality of the agri-based enterprises and also give training to other farmers.
ConclusionFrontline extension in India has evolved itself over the years as vibrant system to provide technical backstopping to field extension. KVK as light house of agricultural technology at district level, effectively links
research and extension, and is playing crucial role in showcasing the appropriate technologies, capacity development of stakeholders, making available critical technological information, planting materials and seeds, assessing technologies to suit different agro-climatic conditions. Notable impact of KVKs is evident in agriculture and allied sectors in terms of augmenting production, productivity, ensuring nutritional security by increasing protein availability through pulses, cost - effective resource conservation and enhancing income through value addition and skilling the farmers to be successful entrepreneurs. XII plan new initiatives in front line viz., Farmer FIRST, Krishi Dak, Mera Gaon Mera Gaurav, Attracting and Retaining Youth in Agriculture (ARYA) will substantially strengthen the front line extension system to be futuristic and transform Indian Agriculture to ensure food and nutritional security while ensuring Farmers welfare. n

155www.agriculturetoday.in Agriculture Year Book 2015
156 Agriculture Year Book 2015
www.agriculturetoday.in
Status of Soil Health in India and its Management
Soil health is critically important to sustainable agricultural productivity and environmental wellbeing. Healthy Soils provide a range of environmental services including
water infiltration, habitat provision and profitable and sustainable agriculture. Despite significant growth in agriculture during the last five decades, most of our important soil based production systems are now showing signs of fatigue. Non judicious use of chemical fertilizers over the years has resulted in multi-nutrients deficiencies, decline in soil organic matter, and pollution of water bodies which has led to not only decline in soil productivity but also in the development of human and animal health disorders. It is suggested that promoting Integrated Plant Nutrition System (IPNS), and soil test based fertilizer nutrients additions would reverse the decline in soil productivity and restore the soil health.
In India, the conservative estimates showed that the demand for food grains would increase from 257 million tonnes in 2012-13 to 355 million tonnes in 2030. Contrary to increasing food demands, the factor productivity and rate of response of crops to applied fertilizers under intensive cropping systems are declining year
after year. The current status of nutrient use efficiency is quite low in case of N (30-50%), P (15-20%), S (8-12%), Zn (2-5%), Fe (1-2%) and Cu (1-2%) due to deterioration in physical, chemical and biological health of soils. The major reasons for soil health deterioration are: wide nutrient gap between nutrient demand and supply, high nutrient turnover in soil-plant system coupled with low and imbalanced fertilizer use, emerging deficiencies of secondary and micronutrients in soil, soil acidity, nutrient leaching in sandy soils, nutrient fixation in red, lateritic and clayey soils, impeded drainage in swell-shrink soils, soil salinization and sodification, etc. Soil test based fertilizer recommendation can provide a plausible solution to the problem. In India, a considerable portion of soils is suffering from poor soil health. The deterioration in soil health can be caused by nature or it may be anthropogenic. The soil health degradation is of many kinds. Physical degradation is due to water erosion (82.57 m ha), wind erosion (12.40 m ha), compaction, crusting and water logging. Chemical degradation is due to process of salinization and alkalization (6.74 m ha), acidification (17.94 m ha) and nutrient depletion. Biological degradation is caused by the reduction of soil biota and organic
Ashok K Patra, Director and
Sanjay SrivastavaICAR-Indian
Institute of Soil Science, Bhopal

157www.agriculturetoday.in Agriculture Year Book 2015
matter, degradation of vegetation and impairment of activities of micro-flora and fauna. Even though all forms of soil degradation are important and need to be addressed, it is the chemical soil degradation that is agriculturally most important. Chemical soil degradation which emerges as a result of indiscriminate fertilizer additions and poor nutrient management practices, not only affects the crop yields but also impacts biological soil health besides inducing environmental pollution. Hence, one of the most important reasons of assessing the health of a particular soil/field is to have a fair idea about its future management, most importantly the fertilizer/manure management. This aspect is especially important for India because a huge amount of foreign exchange is spent every year on import of fertilizers. Potassic fertilizers are entirely imported and almost 90% of the phosphatic fertilizers are also imported either as finished product or in the form of raw materials like rock phosphate, phosphoric acid, and sulphur. Though urea is manufactured in India, still a large part of it is imported. Fertilizers, on account of high import cost, have
to be subsidized. The total fertilizer subsidy in India in 2013-14 was around Rs. 68 thousand crore. Hence, soil fertility management and soil test based balanced fertilizer applications are most important aspects in the assessment of soil health.
IMPACT OF IMBAlANCED FERTIlIZER APPlICATION ON SOIl HEAlTH
Multinutrient deficienciesImproper nutrient management has led to multi-nutrient deficiencies in Indian soils. In the early sixties, when fertilizer responsive varieties were introduced in India, optimum yields could be obtained with the application of nitrogenous fertilizers alone. However, intensive cropping with bumper harvests soon depleted other nutrients. With nutrient application/additions hardly keeping pace with their removals by crops, the fertility status of Indian soils has been declining fast under intensive agriculture and are now showing signs of fatigue. The partial factor productivity has gone down, necessitating additional inputs to obtain similar crop yields. The inadequate and imbalanced nutrient
use coupled with neglect of organic manures has caused multi-nutrient deficiencies in many areas with time.
Declining soil organic matter Soil organic matter plays a key role in soil health sustenance. Organic matter (OM) is the source of energy for soil biota. Because of limited supply of OM and imbalanced fertilization, organic carbon (C) in soil is often less than 0.5%, and a major constraint for soil fertility and productivity. Thus, assessing soil organic carbon (SOC) accretions/sequestration under intensive cropping with different management practices plays an important role in long-term maintenance of soil quality. The carbon sequestration research is gaining credence worldwide in the context of sustainable management of land and soil resources and arresting the deterioration of the environment. The future research should take lead in modeling carbon sequestration potential of different soils and land use systems and establishing benchmarks and standards for carbon trading.
Human and animal health disordersInadequate use of micronutrient fertilizers is aggravating trace element deficiencies in soils in many areas. The crops grown on these soils are, generally, deficient in micronutrients. These deficiencies are linked with malnutrition and health disorders in humans and animals. The problem is more serious in young children, women of child bearing age and livestock. The Zn deficiency has become a big public health issue in India and is second in importance to Fe. It is assumed that around 25 % of Indian population is under risk of Zn deficiency related problems. The dietary intake of 0.2 - 0.3 mg
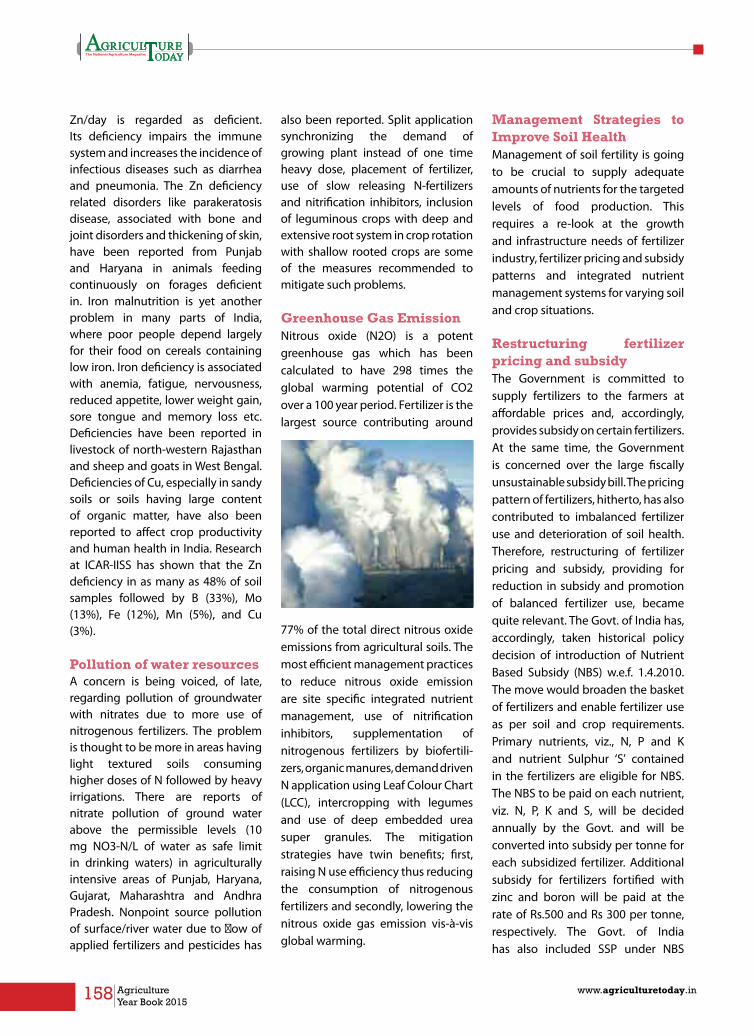
158 Agriculture Year Book 2015
www.agriculturetoday.in
Zn/day is regarded as deficient. Its deficiency impairs the immune system and increases the incidence of infectious diseases such as diarrhea and pneumonia. The Zn deficiency related disorders like parakeratosis disease, associated with bone and joint disorders and thickening of skin, have been reported from Punjab and Haryana in animals feeding continuously on forages deficient in. Iron malnutrition is yet another problem in many parts of India, where poor people depend largely for their food on cereals containing low iron. Iron deficiency is associated with anemia, fatigue, nervousness, reduced appetite, lower weight gain, sore tongue and memory loss etc. Deficiencies have been reported in livestock of north-western Rajasthan and sheep and goats in West Bengal. Deficiencies of Cu, especially in sandy soils or soils having large content of organic matter, have also been reported to affect crop productivity and human health in India. Research at ICAR-IISS has shown that the Zn deficiency in as many as 48% of soil samples followed by B (33%), Mo (13%), Fe (12%), Mn (5%), and Cu (3%).
Pollution of water resourcesA concern is being voiced, of late, regarding pollution of groundwater with nitrates due to more use of nitrogenous fertilizers. The problem is thought to be more in areas having light textured soils consuming higher doses of N followed by heavy irrigations. There are reports of nitrate pollution of ground water above the permissible levels (10 mg NO3-N/L of water as safe limit in drinking waters) in agriculturally intensive areas of Punjab, Haryana, Gujarat, Maharashtra and Andhra Pradesh. Nonpoint source pollution of surface/river water due to flow of applied fertilizers and pesticides has
also been reported. Split application synchronizing the demand of growing plant instead of one time heavy dose, placement of fertilizer, use of slow releasing N-fertilizers and nitrification inhibitors, inclusion of leguminous crops with deep and extensive root system in crop rotation with shallow rooted crops are some of the measures recommended to mitigate such problems.
Greenhouse Gas EmissionNitrous oxide (N2O) is a potent greenhouse gas which has been calculated to have 298 times the global warming potential of CO2 over a 100 year period. Fertilizer is the largest source contributing around
77% of the total direct nitrous oxide emissions from agricultural soils. The most efficient management practices to reduce nitrous oxide emission are site specific integrated nutrient management, use of nitrification inhibitors, supplementation of nitrogenous fertilizers by biofertili-zers, organic manures, demand driven N application using Leaf Colour Chart (LCC), intercropping with legumes and use of deep embedded urea super granules. The mitigation strategies have twin benefits; first, raising N use efficiency thus reducing the consumption of nitrogenous fertilizers and secondly, lowering the nitrous oxide gas emission vis-à-vis global warming.
Management Strategies to Improve Soil HealthManagement of soil fertility is going to be crucial to supply adequate amounts of nutrients for the targeted levels of food production. This requires a re-look at the growth and infrastructure needs of fertilizer industry, fertilizer pricing and subsidy patterns and integrated nutrient management systems for varying soil and crop situations.
Restructuring fertilizer pricing and subsidyThe Government is committed to supply fertilizers to the farmers at affordable prices and, accordingly, provides subsidy on certain fertilizers. At the same time, the Government is concerned over the large fiscally unsustainable subsidy bill. The pricing pattern of fertilizers, hitherto, has also contributed to imbalanced fertilizer use and deterioration of soil health. Therefore, restructuring of fertilizer pricing and subsidy, providing for reduction in subsidy and promotion of balanced fertilizer use, became quite relevant. The Govt. of India has, accordingly, taken historical policy decision of introduction of Nutrient Based Subsidy (NBS) w.e.f. 1.4.2010. The move would broaden the basket of fertilizers and enable fertilizer use as per soil and crop requirements. Primary nutrients, viz., N, P and K and nutrient Sulphur ‘S’ contained in the fertilizers are eligible for NBS. The NBS to be paid on each nutrient, viz. N, P, K and S, will be decided annually by the Govt. and will be converted into subsidy per tonne for each subsidized fertilizer. Additional subsidy for fertilizers fortified with zinc and boron will be paid at the rate of Rs.500 and Rs 300 per tonne, respectively. The Govt. of India has also included SSP under NBS

159www.agriculturetoday.in Agriculture Year Book 2015
w.e.f. 1.5.2010 to promote its use. The Government is also promoting customized fertilizers based on area and crop specificities.
In spite of these measures, the major objective of NBS policy of balanced fertilization is yet to be achieved. Exclusion of urea from NBS and decontrol of P & K fertilizers has also led to imbalanced application of nitrogen vis-à-vis phosphatic and potassic fertilizers (NPK consumption ratio: 8.2:3.2:1 and 6.9:2.4:1 in 2012-13 and 2013-14 respectively).
Integrated nutrient management systemIntegrated nutrient management (INM) encompassing conjunctive use of chemical fertilizers including secondary and micronutrients, organic manures, composts/vermicomposts, biofertilizers and green manures demands adoption on a large scale. The Long Term Fertilizer Experiments in vogue for the last 42 years, under the aegis of All India Coordinated Project on Long term fertilizer experiment, have indicated very clearly that the response to the fertilizers could be raised significantly with balanced application of fertilizer nutrients along with organic manures. The system enhances nutrient-use efficiency (which is low for majority of nutrients), maintains soil health and enhances crop yields and farmers’ profitability. The ICAR-Indian Institute of Soil Science, Bhopal has made significant contributions towards promotion of INM in the country by running many All India Coordinated Projects throughout the country. The Council has so far generated GIS based soil fertility maps in respect of macro, secondary and micro nutrients for 172 districts. These geo-referenced maps can be useful in monitoring soil fertility, fertilizer recommendations
for balanced nutrient application in various parts of the country. The institute has also generated integrated nutrient management packages for major cropping systems of the country and the information has been passed on to different states through Department of Agriculture and Cooperation of the Ministry of Agriculture.
Following soil test crop response based fertilizer nutrient applicationIt is important to promote soil test crop response based fertilizer nutrient applications for maintaining a good soil health. Recently, GOI has initiated a mammoth programme of preparing and distributing soil health cards to about 14 crore farmers in the country. These soil health cards will contain the information about soil fertility and soil test based fertilizer nutrient recommendation. The programme is expected to be executed in three years and will be recurring in nature. However, the existing infrastructure of around 1206 soil testing laboratories is not sufficient if field of every land holding is to be analyzed. Obviously, new technologies of faster analysis of soil health parameters with outreach to last mile are required. In this direction, ICAR-IISS has developed a mini laboratory “Mridaparikshak” that can estimate all the essential soil parameters. This is a digital quantitative soil test mini lab which can provide soil testing service at farmers’ doorstep. It also provides the fertilizer nutrient recommendations that are crop and soil specific. ICAR-IISS has also developed a user-friendly software which can be used by the soil testing laboratories to have fertilizer recommendations online.
Enhancing biota for soil
fertility and efficient bio-culturesPhysical disturbance of the soil caused by tillage and residue management is a crucial factor in determining soil biotic activity and species diversity. The activity of soil microbes influences nutrient availability directly and indirectly. A direct effect is the breakdown of organic matter and subsequent release of nutrients not used in cell building and maintenance processes. These ‘extra’ nutrients are available to plants. Also, since the microbial biomass itself is a relatively labile fraction of the soil organic matter, nutrients in biomass become available as dead microbial cells and are attacked by other microbes. Indirect effects result from the interaction of microbial by-products with soil constituents and nutrients.Systems that increase below-ground inputs of C and N through inclusion of legumes and/or fibrous rooted crops in rotations often increase microbial populations and activity to greater extent than conventional systems using commercial fertilizers. It is well-recognized that microbial inoculants constitute an important component of integrated nutrient management that leads to sustainable agriculture.
Conclusions and future thrustsIntegrated Plant Nutrition System (IPNS) needs to be promoted by pooling all the available organic resources in the country. Maps of essential elements including trace elements deficiency and toxicity need to be produced to create awareness among people, planners and policy makers. It is also important to calibrate and promote the low cost rapid mini laboratories of soil fertility evaluation and management. n
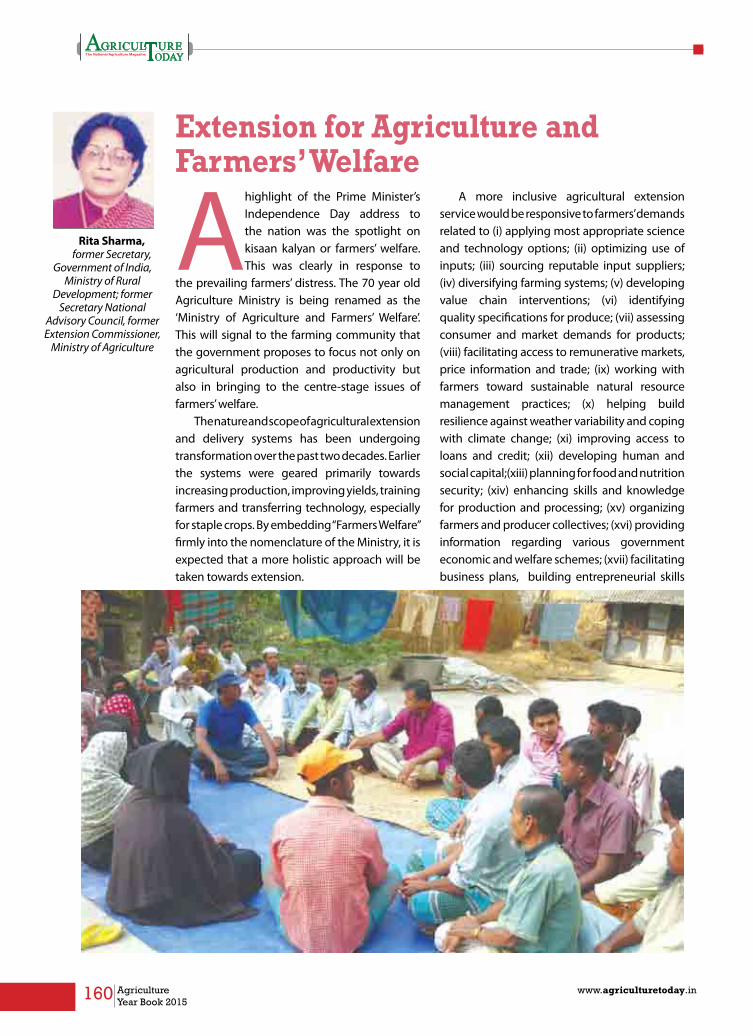
160 Agriculture Year Book 2015
www.agriculturetoday.in
Extension for Agriculture and Farmers’ Welfare
A highlight of the Prime Minister’s Independence Day address to the nation was the spotlight on kisaan kalyan or farmers’ welfare. This was clearly in response to
the prevailing farmers’ distress. The 70 year old Agriculture Ministry is being renamed as the ‘Ministry of Agriculture and Farmers’ Welfare’. This will signal to the farming community that the government proposes to focus not only on agricultural production and productivity but also in bringing to the centre-stage issues of farmers’ welfare.
The nature and scope of agricultural extension and delivery systems has been undergoing transformation over the past two decades. Earlier the systems were geared primarily towards increasing production, improving yields, training farmers and transferring technology, especially for staple crops. By embedding “Farmers Welfare” firmly into the nomenclature of the Ministry, it is expected that a more holistic approach will be taken towards extension.
A more inclusive agricultural extension service would be responsive to farmers’ demands related to (i) applying most appropriate science and technology options; (ii) optimizing use of inputs; (iii) sourcing reputable input suppliers; (iv) diversifying farming systems; (v) developing value chain interventions; (vi) identifying quality specifications for produce; (vii) assessing consumer and market demands for products; (viii) facilitating access to remunerative markets, price information and trade; (ix) working with farmers toward sustainable natural resource management practices; (x) helping build resilience against weather variability and coping with climate change; (xi) improving access to loans and credit; (xii) developing human and social capital;(xiii) planning for food and nutrition security; (xiv) enhancing skills and knowledge for production and processing; (xv) organizing farmers and producer collectives; (xvi) providing information regarding various government economic and welfare schemes; (xvii) facilitating business plans, building entrepreneurial skills
Rita Sharma, former Secretary,
Government of India, Ministry of Rural
Development; former Secretary National
Advisory Council, former Extension Commissioner,
Ministry of Agriculture

161www.agriculturetoday.in Agriculture Year Book 2015
and exploring off-farm employment options; (xviii) assisting in insurance coverage; (xix) providing social security, safety nets, pension; (xx) dealing with natural disasters (xxi) obtaining a fair compensation in the event of land acquisition; (xxii) receiving entitlements under the National Food Security Act, and such others.
It is clear that in this expanded role, the canvas of information that agricultural extension needs to cater to — through provision and facilitating access and sharing—is much wider. The question is, where will we find such a single super-extension service to effectively perform these multiple roles, which not only addresses issues of enhancing production but is also responsive to the welfare needs of farmers?
The answer lies in recognizing and coordinating the multi-agency extension service providers existing today, each with their own expertise, strengths and niche areas of operation. As the nature and scope of agricultural extension undergoes fundamental changes, and financial constraints force governments to shrink their state extension bureaucracies, agro-service delivery is reforming from a primarily public sector monopoly to a pluralistic system comprising of a mix of public and private sector actors, as well as public-private partnerships. A parallel explosion in information and communication technologies has provided a potent tool for leap-frogging over the old, inter-personal mode of imparting information and knowledge.
Technology transfer and provision of other agri-services to farmers is occurring increasingly through five categories of service providers besides the well-established public sector, namely, (i) farmer collectives,
member-based agencies, e.g., farmers’ organizations, cooperative societies, self-help groups (SHGs), water users’ associations, farmer producer companies (FPCs), etc.; (ii) private for-profit firms, e.g., corporate sector, input suppliers, agri-businesses, small agri- startups, contract farming arrangements; (iii) private not-for-profit agencies such as community based organizations, NGOs, foundations and trusts (iv) public-private partnerships, e.g. progressive farmers as extensionists, para-extension workers; (v) mass media and ICT, e.g. radio, television, mobile telephony, internet, kisan call centres, information and extension portals, e-chaupals, print media etc. The latest is the 24x7 dedicated Kisan Channel on Doordarshan.
Farmer collectives have burgeoned into a major player. Cooperative societies have played and continue to play a significant role in the delivery of agricultural inputs as well as in the marketing of farm produce. Cooperative milk procurement and marketing is an old and successful example. There are some 6 lakh cooperative societies with a 25 crore membership. Some 25 lakh SHGs under the National Rural
Livelihoods Mission and NABARD are involved in skill development, capacity building and management of micro-finance to small producers for both on-farm and off-farm activities. The Water User Associations under the Integrated Watershed Management Programme are practicing conservation agriculture. About one lakh mitra kisans or “farmer friends” under the Agriculture Technology Management Agencies (ATMAs) are undertaking farmer-to-farmer extension which is found to be very effective. Government proposes to mobilize a further 6 lakh “farmer friends” in the next 2-3 years. The latest entrants are FPCs, supported by the Small Farmers Agribusiness Consortium (SFAC) and NABARD to provide comprehensive extension services to their members, making forays into the latest in organic farming and labeling of produce. Presently there are about 1000 registered FPCs. NABARD is facilitating another 2000. The Panchayati Raj Institutions empowered under the National Rural Employment Guarantee Scheme (NREGA) are creating employment for the rural poor and also facilitating creation of rural assets through rejuvenation of the natural resource
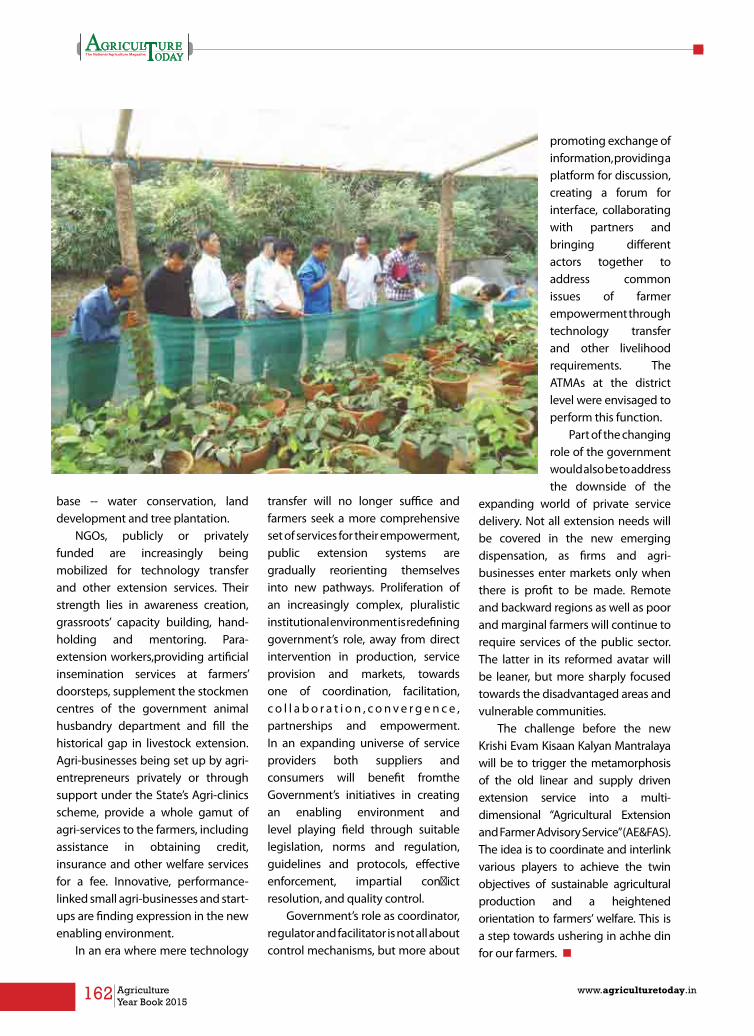
162 Agriculture Year Book 2015
www.agriculturetoday.in
base -- water conservation, land development and tree plantation.
NGOs, publicly or privately funded are increasingly being mobilized for technology transfer and other extension services. Their strength lies in awareness creation, grassroots’ capacity building, hand-holding and mentoring. Para-extension workers,providing artificial insemination services at farmers’ doorsteps, supplement the stockmen centres of the government animal husbandry department and fill the historical gap in livestock extension. Agri-businesses being set up by agri-entrepreneurs privately or through support under the State’s Agri-clinics scheme, provide a whole gamut of agri-services to the farmers, including assistance in obtaining credit, insurance and other welfare services for a fee. Innovative, performance-linked small agri-businesses and start-ups are finding expression in the new enabling environment.
In an era where mere technology
transfer will no longer suffice and farmers seek a more comprehensive set of services for their empowerment, public extension systems are gradually reorienting themselves into new pathways. Proliferation of an increasingly complex, pluralistic institutional environment is redefining government’s role, away from direct intervention in production, service provision and markets, towards one of coordination, facilitation, c o l l a b o r a t i o n , c o n v e r g e n c e , partnerships and empowerment. In an expanding universe of service providers both suppliers and consumers will benefit fromthe Government’s initiatives in creating an enabling environment and level playing field through suitable legislation, norms and regulation, guidelines and protocols, effective enforcement, impartial conflict resolution, and quality control.
Government’s role as coordinator, regulator and facilitator is not all about control mechanisms, but more about
promoting exchange of information, providing a platform for discussion, creating a forum for interface, collaborating with partners and bringing different actors together to address common issues of farmer empowerment through technology transfer and other livelihood requirements. The ATMAs at the district level were envisaged to perform this function.
Part of the changing role of the government would also be to address the downside of the
expanding world of private service delivery. Not all extension needs will be covered in the new emerging dispensation, as firms and agri-businesses enter markets only when there is profit to be made. Remote and backward regions as well as poor and marginal farmers will continue to require services of the public sector. The latter in its reformed avatar will be leaner, but more sharply focused towards the disadvantaged areas and vulnerable communities.
The challenge before the new Krishi Evam Kisaan Kalyan Mantralaya will be to trigger the metamorphosis of the old linear and supply driven extension service into a multi-dimensional “Agricultural Extension and Farmer Advisory Service” (AE&FAS). The idea is to coordinate and interlink various players to achieve the twin objectives of sustainable agricultural production and a heightened orientation to farmers’ welfare. This is a step towards ushering in achhe din for our farmers. n
163www.agriculturetoday.in Agriculture Year Book 2015
rurAlcredit

164 Agriculture Year Book 2015
www.agriculturetoday.in
Overview
In the recent years, India has undertaken several initiatives to expand the reach of formal banking facilities to all and most importantly, the under-
served sections of the society. Elabo-rate roadmap has been designed to provide banking outlets in unbanked villages with less than 2,000 popula-tion.
Agriculture credit is one of the major drivers fostering agricultural production and equitable growth in the country. Government has been fixing targets for flow of credit to ag-riculture by the banking sector every year and the basic objective is to mak-ing credit easily available to farmers. The priority sector comprises of a vast section of the population engaged in sectors such as agriculture, medium and small enterprises (MSEs), educa-tion and housing. Public sector banks have been traditionally the most im-portant vehicle of providing credit to the priority sector. In 2013, the total
loan disbursed by public sector banks was Rs 12822 billion whereas in 2014, lending increased to Rs 16190 billion. The figure for private sector Indian banks for the two years, (2013 and
2014) was Rs 3274 billion and 4645 billion respectively.
Credit to the agriculture sector has been higher than targets in recent years. In 2010-11, the total target of
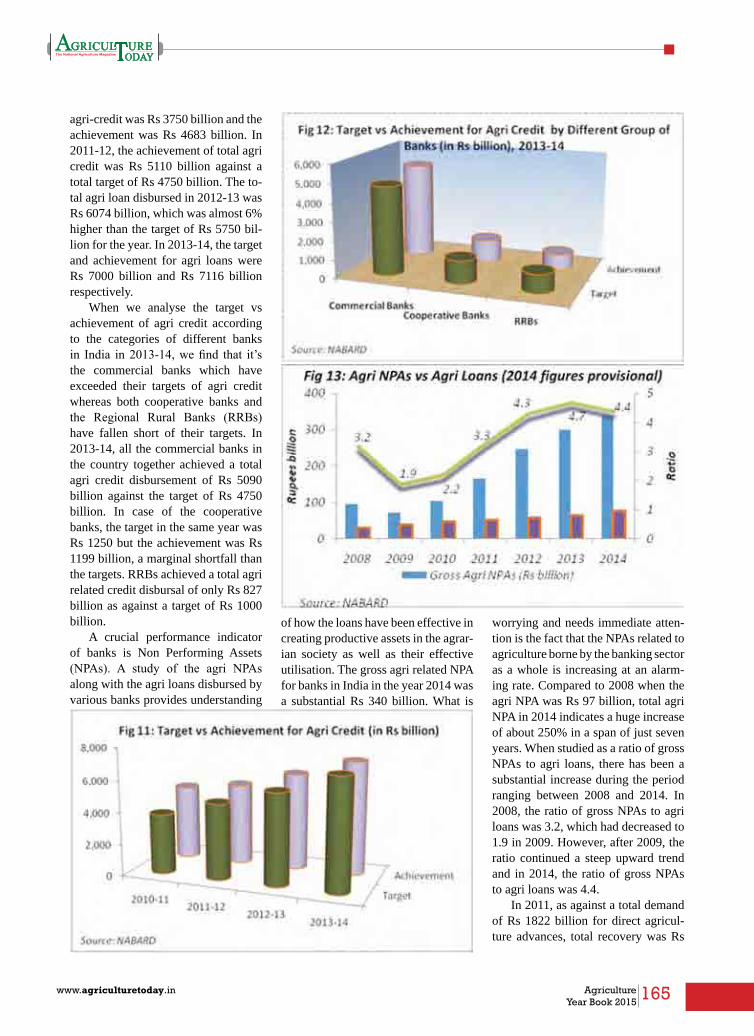
165www.agriculturetoday.in Agriculture Year Book 2015
agri-credit was Rs 3750 billion and the achievement was Rs 4683 billion. In 2011-12, the achievement of total agri credit was Rs 5110 billion against a total target of Rs 4750 billion. The to-tal agri loan disbursed in 2012-13 was Rs 6074 billion, which was almost 6% higher than the target of Rs 5750 bil-lion for the year. In 2013-14, the target and achievement for agri loans were Rs 7000 billion and Rs 7116 billion respectively.
When we analyse the target vs achievement of agri credit according to the categories of different banks in India in 2013-14, we find that it’s the commercial banks which have exceeded their targets of agri credit whereas both cooperative banks and the Regional Rural Banks (RRBs) have fallen short of their targets. In 2013-14, all the commercial banks in the country together achieved a total agri credit disbursement of Rs 5090 billion against the target of Rs 4750 billion. In case of the cooperative banks, the target in the same year was Rs 1250 but the achievement was Rs 1199 billion, a marginal shortfall than the targets. RRBs achieved a total agri related credit disbursal of only Rs 827 billion as against a target of Rs 1000 billion.
A crucial performance indicator of banks is Non Performing Assets (NPAs). A study of the agri NPAs along with the agri loans disbursed by various banks provides understanding
of how the loans have been effective in creating productive assets in the agrar-ian society as well as their effective utilisation. The gross agri related NPA for banks in India in the year 2014 was a substantial Rs 340 billion. What is
worrying and needs immediate atten-tion is the fact that the NPAs related to agriculture borne by the banking sector as a whole is increasing at an alarm-ing rate. Compared to 2008 when the agri NPA was Rs 97 billion, total agri NPA in 2014 indicates a huge increase of about 250% in a span of just seven years. When studied as a ratio of gross NPAs to agri loans, there has been a substantial increase during the period ranging between 2008 and 2014. In 2008, the ratio of gross NPAs to agri loans was 3.2, which had decreased to 1.9 in 2009. However, after 2009, the ratio continued a steep upward trend and in 2014, the ratio of gross NPAs to agri loans was 4.4.
In 2011, as against a total demand of Rs 1822 billion for direct agricul-ture advances, total recovery was Rs
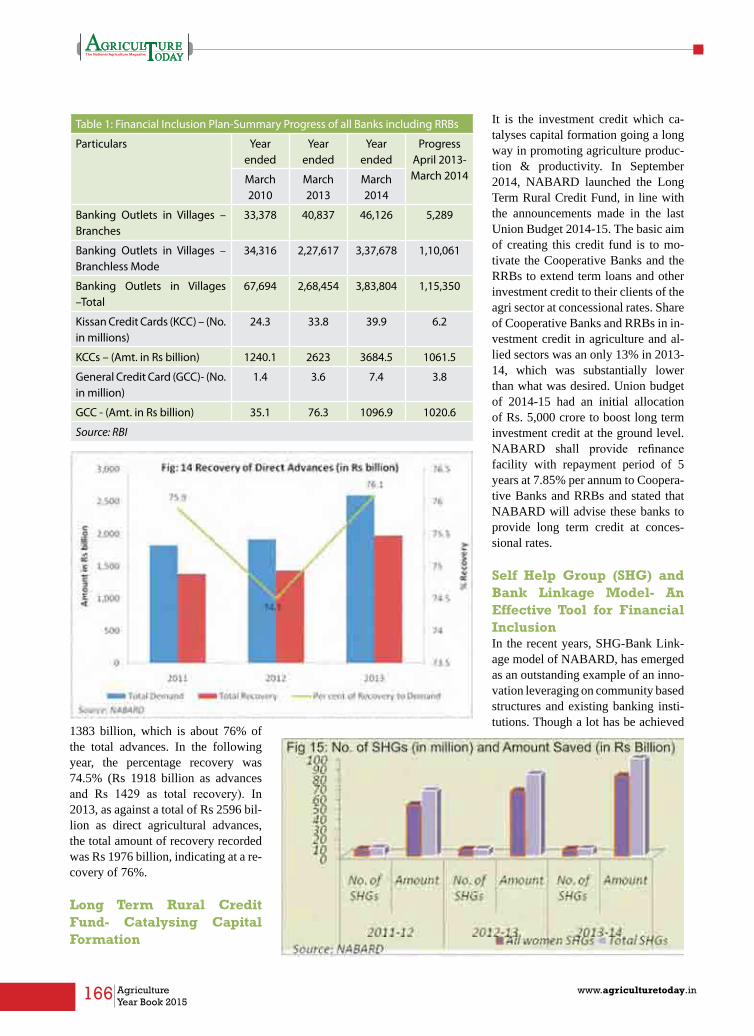
166 Agriculture Year Book 2015
www.agriculturetoday.in
1383 billion, which is about 76% of the total advances. In the following year, the percentage recovery was 74.5% (Rs 1918 billion as advances and Rs 1429 as total recovery). In 2013, as against a total of Rs 2596 bil-lion as direct agricultural advances, the total amount of recovery recorded was Rs 1976 billion, indicating at a re-covery of 76%.
long Term Rural Credit Fund- Catalysing Capital Formation
Table 1: Financial Inclusion Plan-Summary Progress of all Banks including RRBs
Particulars Year ended
Year ended
Year ended
Progress April 2013-March 2014March
2010March 2013
March 2014
Banking Outlets in Villages – Branches
33,378 40,837 46,126 5,289
Banking Outlets in Villages – Branchless Mode
34,316 2,27,617 3,37,678 1,10,061
Banking Outlets in Villages –Total
67,694 2,68,454 3,83,804 1,15,350
Kissan Credit Cards (KCC) – (No. in millions)
24.3 33.8 39.9 6.2
KCCs – (Amt. in Rs billion) 1240.1 2623 3684.5 1061.5
General Credit Card (GCC)- (No. in million)
1.4 3.6 7.4 3.8
GCC - (Amt. in Rs billion) 35.1 76.3 1096.9 1020.6
Source: RBI
It is the investment credit which ca-talyses capital formation going a long way in promoting agriculture produc-tion & productivity. In September 2014, NABARD launched the Long Term Rural Credit Fund, in line with the announcements made in the last Union Budget 2014-15. The basic aim of creating this credit fund is to mo-tivate the Cooperative Banks and the RRBs to extend term loans and other investment credit to their clients of the agri sector at concessional rates. Share of Cooperative Banks and RRBs in in-vestment credit in agriculture and al-lied sectors was an only 13% in 2013-14, which was substantially lower than what was desired. Union budget of 2014-15 had an initial allocation of Rs. 5,000 crore to boost long term investment credit at the ground level. NABARD shall provide refinance facility with repayment period of 5 years at 7.85% per annum to Coopera-tive Banks and RRBs and stated that NABARD will advise these banks to provide long term credit at conces-sional rates.
Self Help Group (SHG) and Bank linkage Model- An Effective Tool for Financial InclusionIn the recent years, SHG-Bank Link-age model of NABARD, has emerged as an outstanding example of an inno-vation leveraging on community based structures and existing banking insti-tutions. Though a lot has be achieved
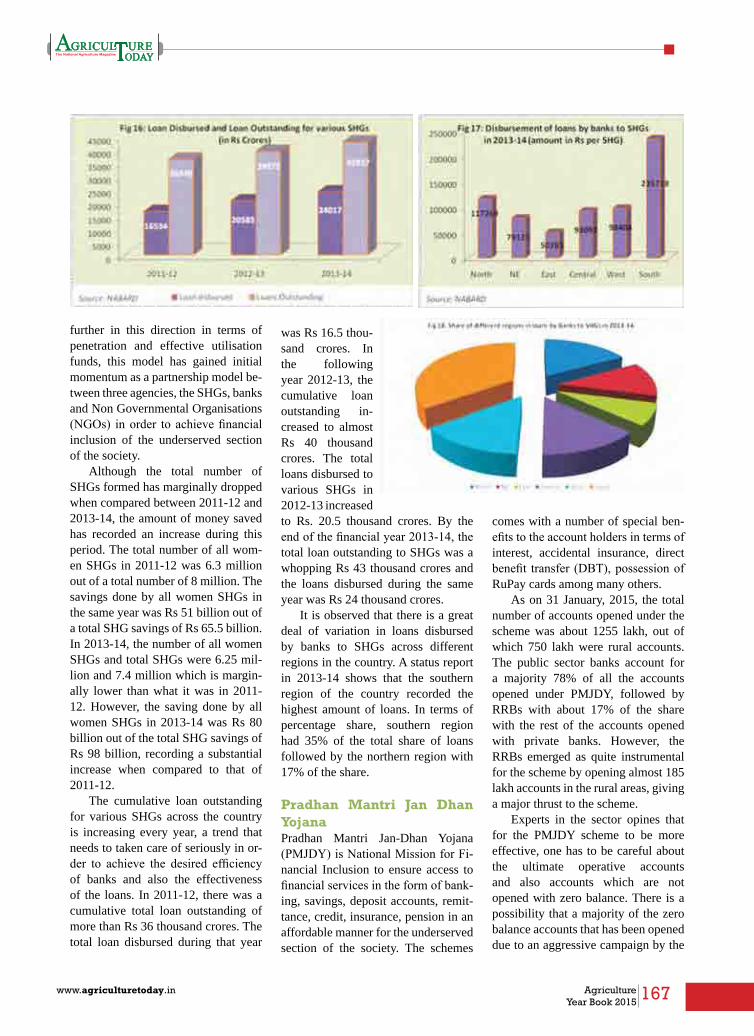
167www.agriculturetoday.in Agriculture Year Book 2015
further in this direction in terms of penetration and effective utilisation funds, this model has gained initial momentum as a partnership model be-tween three agencies, the SHGs, banks and Non Governmental Organisations (NGOs) in order to achieve financial inclusion of the underserved section of the society.
Although the total number of SHGs formed has marginally dropped when compared between 2011-12 and 2013-14, the amount of money saved has recorded an increase during this period. The total number of all wom-en SHGs in 2011-12 was 6.3 million out of a total number of 8 million. The savings done by all women SHGs in the same year was Rs 51 billion out of a total SHG savings of Rs 65.5 billion. In 2013-14, the number of all women SHGs and total SHGs were 6.25 mil-lion and 7.4 million which is margin-ally lower than what it was in 2011-12. However, the saving done by all women SHGs in 2013-14 was Rs 80 billion out of the total SHG savings of Rs 98 billion, recording a substantial increase when compared to that of 2011-12.
The cumulative loan outstanding for various SHGs across the country is increasing every year, a trend that needs to taken care of seriously in or-der to achieve the desired efficiency of banks and also the effectiveness of the loans. In 2011-12, there was a cumulative total loan outstanding of more than Rs 36 thousand crores. The total loan disbursed during that year
was Rs 16.5 thou-sand crores. In the following year 2012-13, the cumulative loan outstanding in-creased to almost Rs 40 thousand crores. The total loans disbursed to various SHGs in 2012-13 increased to Rs. 20.5 thousand crores. By the end of the financial year 2013-14, the total loan outstanding to SHGs was a whopping Rs 43 thousand crores and the loans disbursed during the same year was Rs 24 thousand crores.
It is observed that there is a great deal of variation in loans disbursed by banks to SHGs across different regions in the country. A status report in 2013-14 shows that the southern region of the country recorded the highest amount of loans. In terms of percentage share, southern region had 35% of the total share of loans followed by the northern region with 17% of the share.
Pradhan Mantri Jan Dhan YojanaPradhan Mantri Jan-Dhan Yojana (PMJDY) is National Mission for Fi-nancial Inclusion to ensure access to financial services in the form of bank-ing, savings, deposit accounts, remit-tance, credit, insurance, pension in an affordable manner for the underserved section of the society. The schemes
comes with a number of special ben-efits to the account holders in terms of interest, accidental insurance, direct benefit transfer (DBT), possession of RuPay cards among many others.
As on 31 January, 2015, the total number of accounts opened under the scheme was about 1255 lakh, out of which 750 lakh were rural accounts. The public sector banks account for a majority 78% of all the accounts opened under PMJDY, followed by RRBs with about 17% of the share with the rest of the accounts opened with private banks. However, the RRBs emerged as quite instrumental for the scheme by opening almost 185 lakh accounts in the rural areas, giving a major thrust to the scheme.
Experts in the sector opines that for the PMJDY scheme to be more effective, one has to be careful about the ultimate operative accounts and also accounts which are not opened with zero balance. There is a possibility that a majority of the zero balance accounts that has been opened due to an aggressive campaign by the

168 Agriculture Year Book 2015
www.agriculturetoday.in
banks are under the PMDJY scheme are with zero balance whereas 73% of the accounts opened by the RRBs are with zero balance.
It is essential that the country achieves an equitable growth by bringing all sections of the society and that no part of the country is left behind while marching towards the goal of making India a socially and economically strong nation within the paradigm of a vibrant democracy. Various Government initiatives are directed towards this goal and in the past, through various Five Year plans and the yearly budgets, this has been articulated. Availability of rural credit, allocation of budgetary support to the agriculture sector, efficient disburse-
ment of loans, timely recovery of loans, fi-nancial inclusion and financial literacy of the underserved sec-tions of the society are important for an all round and equi-table development of the country. Experi-ence with SHGs and bank credit linkages has shown that the “poor are bankable”. Poor, when organised under platforms like that of SHGs,
are ready and willing to partner with mainstream financial institutions and banks to achieve financial inclusion and financial literacy. Through easy availability of rural credit, budgetary initiatives and various schemes, poor should be encouraged to save in a variety of ways and the creative har-nessing of such savings shall emerge as a key success factor over a period of time.
It is also to be noted from various learnings in the past in the areas of rural credit, support to the agriculture sector and budgetary allocations is that we do not always need to introduce new institutional set-up or new regulatory or legal framework for effective delivery of rural credit, financial inclusion of the underserved and the overall development of the agriculture sector. Programme can be built on existing structures, leveraging all strengths from the convergence of various sectors, schemes and policies. With the present Union government enjoying a clear mandate of the nation, it would be interesting to note the manner in which efficiency and effectiveness of rural credit delivery is increased, budgetary support for the agriculture sector is enhanced judiciously and the aim of financial inclusion and asset creation in the rural sector is achieved in the years to follow. n
government machineries become idle and non-operative in the long run, and in the process not helping the scheme to reach its ultimate objective. Almost 66% of the total accounts opened by the public sector
Special Benefits under PMJDY
• Nominimumbalancerequired• Interestondeposit• Accidental insurance cover of
Rs.1.00 lakh • Life insurance cover of
Rs.30,000/- • Easy Transfer of money across
India • Beneficiaries of Government
Schemes will get Direct Benefit Transfer in these accounts.
• Aftersatisfactoryoperationoftheaccount for 6 months, an overdraft facility will be permitted
• Access to Pension, insuranceproducts
• Accidental Insurance Cover,RuPay Debit Card must be used at least once in 45 days
• OverdraftfacilityuptoRs.5000/-isavailable in only one account per household, preferably lady of the household
Source: Dept of Financial Services, Min. of Finance

169www.agriculturetoday.in Agriculture Year Book 2015
(construction, purchase& repair of
Rural Godown)
Food Processing(conservation of
nutrition for a rainy day)
Surya Shakthi(ignitining non-conventional energy)
Toll Free No: 1800 425 1515
heralding arevolution inAgriculture
towards the Goal of nurturing Humanity
Kisan Samraksha
www.andhrabank.in

170 Agriculture Year Book 2015
www.agriculturetoday.in
Andhra Bank is one of the fastest growing public Sector Banks in the country with its major base in Andhra Pradesh, Telangana, a larger part of Odisha and now
agriculturally expanding to reach other parts of the country. Now the bank is fast expanding its presence Pan-India, as it has already opened 8 circle offices at Hyderabad, Bangalore, Warangal, Vijayawada, Vizag, Bhubaneswar, Mumbai and New Delhi and 4 new zonal offices were created. Currently the bank has presence in 26 states and 3 union territories through nearly 5600 delivery channels which comprise of 2600+ branches, 4 extension counters, 3000+ ATMs and 34 satellite offices. This year bank is planning to open another 300+ branches to cater to the needs of larger clientele in the country for reaching un-reached.
At the end of the first quarter of the current FY the bank’s total business stood at
Rs 2.79 trillion and the period ahead it expected to see further improvement. We have a proactive attitude towards serving the people at the bottom of the pyramid.
As the bank is moving closer to farmers by virtue of opening more branches in rural areas, we have a deep concern about the needs of farming community and their credit requirements. Our bank constantly interact with the farmers, members of Self Help groups and their organizations etc., and extend credit requirement for enabling them to improve their standard of living the rural community.
The priority sector advances rose further to Rs 49,077 Crore at the end of June,2015 constituting a growth of 15.62% on year-on- year basis.
The volume of the credit in the agricultural segment so disbursed, which has been on a consistent growth trajectory, speaks of Bank’s care and concern of farming community.
Establishment of Rural Self Employment Training Institutes by the bank is another mile stone in empowerment of rural unemployed youth. Bank has set up 11 Rural Self Employment Training Institutes (RSETIs) at various centres (in the states of Andhra Pradesh, Odisha and Kerala) and is imparting need based training for capacity building/entrepreneurial development
Sri D Durga PrasadGeneral Manager
(Priority Sector)
ANDHRA BANK - Triumphant on Strategies

171www.agriculturetoday.in Agriculture Year Book 2015
and dissemination of knowledge to farmers, SHG women , Rural unemployed youth and artisans.
In the field of empowering the rural youth in imparting vocational training, Bank secured First prize in the All India Competition for the year 2013-14 under Small Banks category as recognition of excellence in the RSETI movement in the country. Bank was honoured at a function” RSETI DIWAS” organized by MoRD, Government of India in New Delhi on 15.07.2015.
Since their inception, RSETIs have trained 141101 candidates through 4746 programs by the Institutes and around 79% of the trained candidates have been engaged in gainful ventures. During the last quarter, these institutes imparted training to 2329 candidates through 109 programs.
Financial Inclusion enables the banks to channelize the savings of the unbanked population of the country and offers new business avenues for lending this group. In the priority banking segment, the bank took lot of initiatives in consonance with guidelines of GoI for effective implementation of Financial Inclusion. With the objective of inclusive growth and systematic development among the masses, Andhra Bank’s ecosystem comprises of technology, BCs’ products and manpower to deliver the banking products at the doorstep of the excluded. The bank delivers deposit, loan and other financial services by engaging BCs who use hand – held mobile devices and issue Smart Cards to the customers.
Bank has submitted financial inclusion plan for 2013-2016 to RBI on the lines suggested. The focus areas include coverage of all the allotted areas in less than 2000 population
segment with BC agents, opening of brick & mortar branches in these habitations, ensuring BC agent viability through improvement in the number of transactions, rollout of products to suit to the FI customers, Financial literacy drives with an ultimate aim of business development through growth in CASA of Bank from these outlets. We have followed a planned and structured approach to address the twin issues of demand and supply under Financial Inclusion. Regulations have been formulated with an objective of providing banking services to six lakh plus villages and to create an enabling environment for banks to do so. We are furthering financial inclusion in a mission mode through a combination of strategies ranging from relaxation of regulatory guidelines, provision of new products and supportive measures to achieve sustainable and scalable Financial Inclusion.
Bank is in the forefront in implementing social security Schemes announced by the Government of India in its ambitious initiative in “Making India Insured” in a big way. Bank’s brilliant performance in the PMJDY (Pradhan Mantri Jan-
Dhan Yojana) initiative last year yielded our Bank a pride of place in the Government’s apex Strategic Committee on Pradhan Mantri Jan Dhan Yojana. Also we have secured a respectable place in the Payment Architecture Committee for DBTL.
Steps initiated by our Bank under the ambitious national ‘Pradhan Mantri Jan-Dhan Yojana’ on Financial Inclusion: l Deployed Business
Correspondents in all our allocated villages to extend door step banking.
l Customers can transact most of their banking transactions through PoS machine provided to BCAs.
l All transactions are online and with biometric authentication.
l Account opening is made simple with simplified KYC norms.
l Issue of Rupay card to each of account holder.
l The customer can conduct transaction at Branch, ATM, Micro-ATM with BCAs, PoS with merchant establishment. The Rupay card is provided with free accidental insurance coverage of Rs. 1 lakh. n


induSty
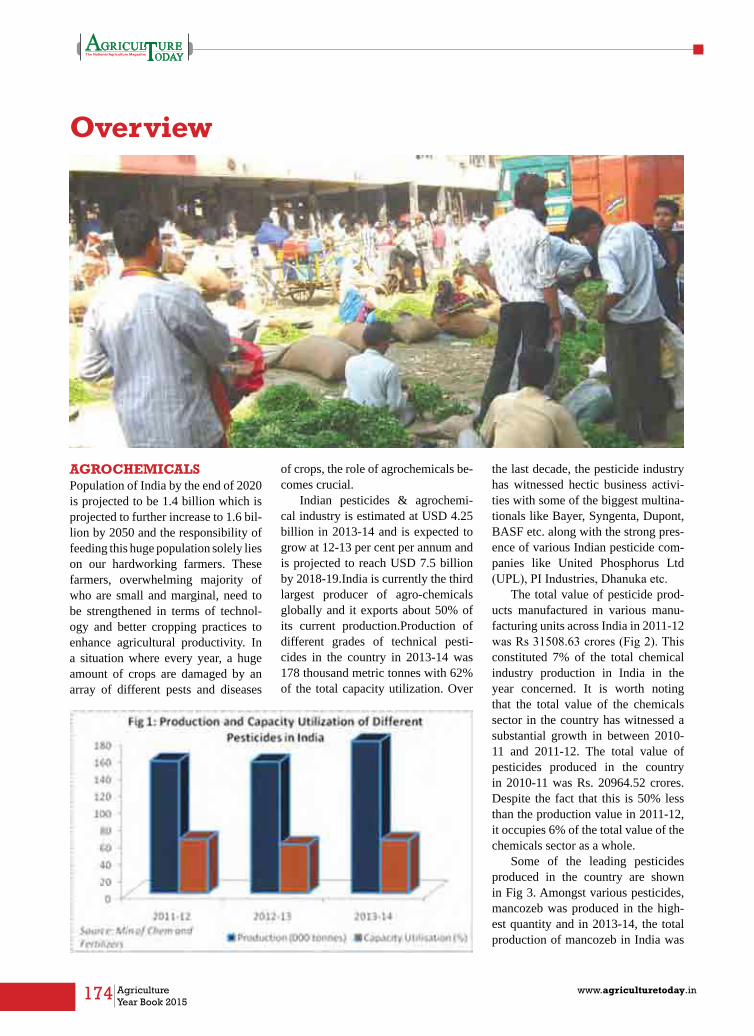
174 Agriculture Year Book 2015
www.agriculturetoday.in
Overview
AGROCHEMICAlSPopulation of India by the end of 2020 is projected to be 1.4 billion which is projected to further increase to 1.6 bil-lion by 2050 and the responsibility of feeding this huge population solely lies on our hardworking farmers. These farmers, overwhelming majority of who are small and marginal, need to be strengthened in terms of technol-ogy and better cropping practices to enhance agricultural productivity. In a situation where every year, a huge amount of crops are damaged by an array of different pests and diseases
of crops, the role of agrochemicals be-comes crucial.
Indian pesticides & agrochemi-cal industry is estimated at USD 4.25 billion in 2013-14 and is expected to grow at 12-13 per cent per annum and is projected to reach USD 7.5 billion by 2018-19.India is currently the third largest producer of agro-chemicals globally and it exports about 50% of its current production.Production of different grades of technical pesti-cides in the country in 2013-14 was 178 thousand metric tonnes with 62% of the total capacity utilization. Over
the last decade, the pesticide industry has witnessed hectic business activi-ties with some of the biggest multina-tionals like Bayer, Syngenta, Dupont, BASF etc. along with the strong pres-ence of various Indian pesticide com-panies like United Phosphorus Ltd (UPL), PI Industries, Dhanuka etc.
The total value of pesticide prod-ucts manufactured in various manu-facturing units across India in 2011-12 was Rs 31508.63 crores (Fig 2). This constituted 7% of the total chemical industry production in India in the year concerned. It is worth noting that the total value of the chemicals sector in the country has witnessed a substantial growth in between 2010-11 and 2011-12. The total value of pesticides produced in the country in 2010-11 was Rs. 20964.52 crores. Despite the fact that this is 50% less than the production value in 2011-12, it occupies 6% of the total value of the chemicals sector as a whole.
Some of the leading pesticides produced in the country are shown in Fig 3. Amongst various pesticides, mancozeb was produced in the high-est quantity and in 2013-14, the total production of mancozeb in India was
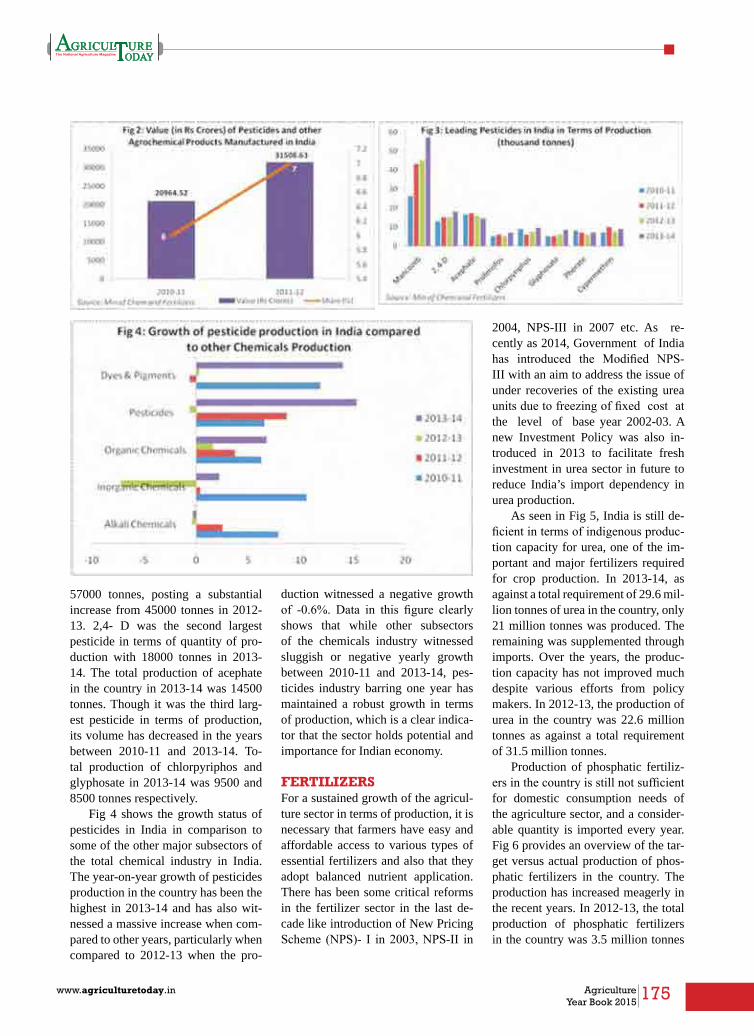
175www.agriculturetoday.in Agriculture Year Book 2015
57000 tonnes, posting a substantial increase from 45000 tonnes in 2012-13. 2,4- D was the second largest pesticide in terms of quantity of pro-duction with 18000 tonnes in 2013-14. The total production of acephate in the country in 2013-14 was 14500 tonnes. Though it was the third larg-est pesticide in terms of production, its volume has decreased in the years between 2010-11 and 2013-14. To-tal production of chlorpyriphos and glyphosate in 2013-14 was 9500 and 8500 tonnes respectively.
Fig 4 shows the growth status of pesticides in India in comparison to some of the other major subsectors of the total chemical industry in India. The year-on-year growth of pesticides production in the country has been the highest in 2013-14 and has also wit-nessed a massive increase when com-pared to other years, particularly when compared to 2012-13 when the pro-
duction witnessed a negative growth of -0.6%. Data in this figure clearly shows that while other subsectors of the chemicals industry witnessed sluggish or negative yearly growth between 2010-11 and 2013-14, pes-ticides industry barring one year has maintained a robust growth in terms of production, which is a clear indica-tor that the sector holds potential and importance for Indian economy.
FERTIlIZERSFor a sustained growth of the agricul-ture sector in terms of production, it is necessary that farmers have easy and affordable access to various types of essential fertilizers and also that they adopt balanced nutrient application. There has been some critical reforms in the fertilizer sector in the last de-cade like introduction of New Pricing Scheme (NPS)- I in 2003, NPS-II in
2004, NPS-III in 2007 etc. As re-cently as 2014, Government of India has introduced the Modified NPS-III with an aim to address the issue of under recoveries of the existing urea units due to freezing of fixed cost at the level of base year 2002-03. A new Investment Policy was also in-troduced in 2013 to facilitate fresh investment in urea sector in future to reduce India’s import dependency in urea production.
As seen in Fig 5, India is still de-ficient in terms of indigenous produc-tion capacity for urea, one of the im-portant and major fertilizers required for crop production. In 2013-14, as against a total requirement of 29.6 mil-lion tonnes of urea in the country, only 21 million tonnes was produced. The remaining was supplemented through imports. Over the years, the produc-tion capacity has not improved much despite various efforts from policy makers. In 2012-13, the production of urea in the country was 22.6 million tonnes as against a total requirement of 31.5 million tonnes.
Production of phosphatic fertiliz-ers in the country is still not sufficient for domestic consumption needs of the agriculture sector, and a consider-able quantity is imported every year. Fig 6 provides an overview of the tar-get versus actual production of phos-phatic fertilizers in the country. The production has increased meagerly in the recent years. In 2012-13, the total production of phosphatic fertilizers in the country was 3.5 million tonnes
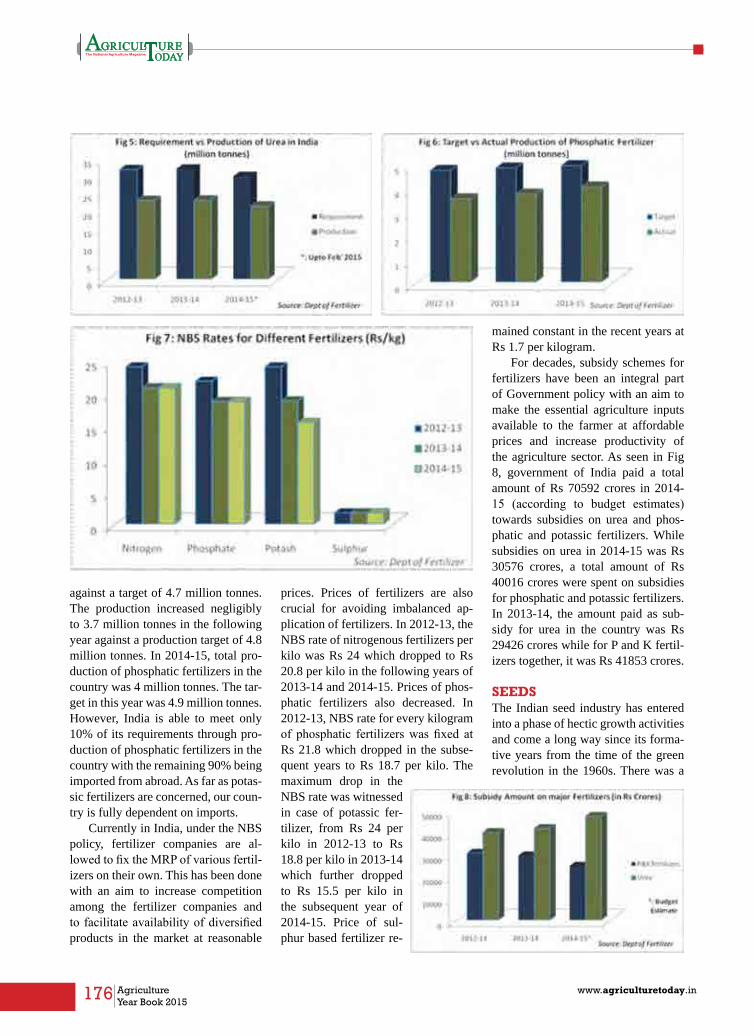
176 Agriculture Year Book 2015
www.agriculturetoday.in
against a target of 4.7 million tonnes. The production increased negligibly to 3.7 million tonnes in the following year against a production target of 4.8 million tonnes. In 2014-15, total pro-duction of phosphatic fertilizers in the country was 4 million tonnes. The tar-get in this year was 4.9 million tonnes. However, India is able to meet only 10% of its requirements through pro-duction of phosphatic fertilizers in the country with the remaining 90% being imported from abroad. As far as potas-sic fertilizers are concerned, our coun-try is fully dependent on imports.
Currently in India, under the NBS policy, fertilizer companies are al-lowed to fix the MRP of various fertil-izers on their own. This has been done with an aim to increase competition among the fertilizer companies and to facilitate availability of diversified products in the market at reasonable
prices. Prices of fertilizers are also crucial for avoiding imbalanced ap-plication of fertilizers. In 2012-13, the NBS rate of nitrogenous fertilizers per kilo was Rs 24 which dropped to Rs 20.8 per kilo in the following years of 2013-14 and 2014-15. Prices of phos-phatic fertilizers also decreased. In 2012-13, NBS rate for every kilogram of phosphatic fertilizers was fixed at Rs 21.8 which dropped in the subse-quent years to Rs 18.7 per kilo. The maximum drop in the NBS rate was witnessed in case of potassic fer-tilizer, from Rs 24 per kilo in 2012-13 to Rs 18.8 per kilo in 2013-14 which further dropped to Rs 15.5 per kilo in the subsequent year of 2014-15. Price of sul-phur based fertilizer re-
mained constant in the recent years at Rs 1.7 per kilogram.
For decades, subsidy schemes for fertilizers have been an integral part of Government policy with an aim to make the essential agriculture inputs available to the farmer at affordable prices and increase productivity of the agriculture sector. As seen in Fig 8, government of India paid a total amount of Rs 70592 crores in 2014-15 (according to budget estimates) towards subsidies on urea and phos-phatic and potassic fertilizers. While subsidies on urea in 2014-15 was Rs 30576 crores, a total amount of Rs 40016 crores were spent on subsidies for phosphatic and potassic fertilizers. In 2013-14, the amount paid as sub-sidy for urea in the country was Rs 29426 crores while for P and K fertil-izers together, it was Rs 41853 crores.
SEEDSThe Indian seed industry has entered into a phase of hectic growth activities and come a long way since its forma-tive years from the time of the green revolution in the 1960s. There was a
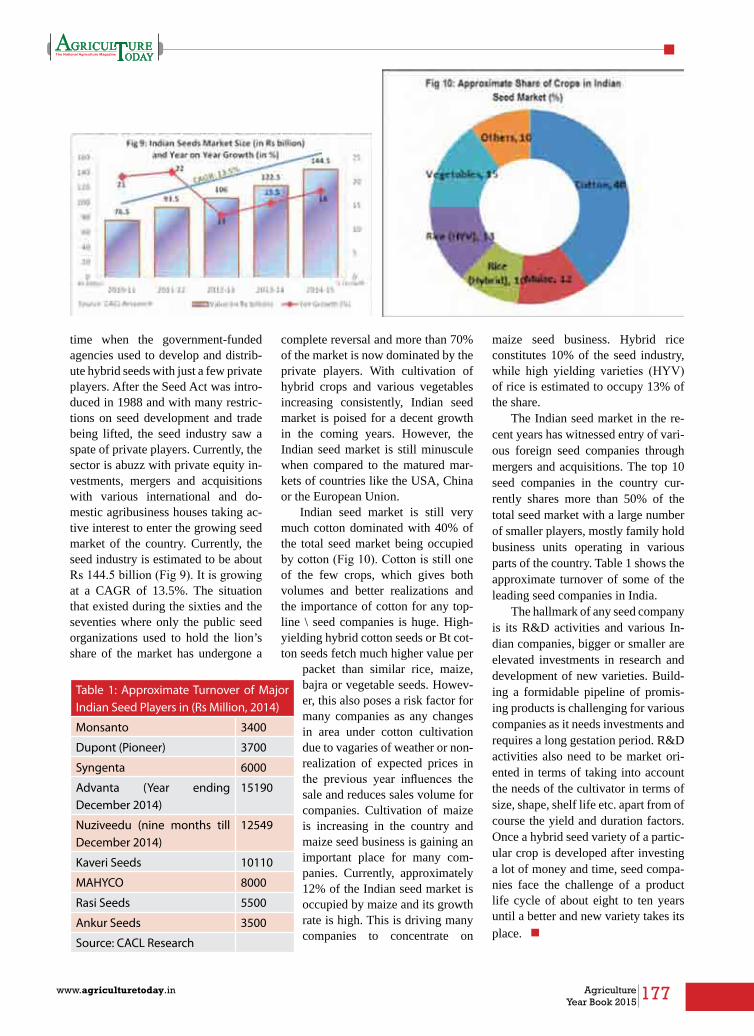
177www.agriculturetoday.in Agriculture Year Book 2015
time when the government-funded agencies used to develop and distrib-ute hybrid seeds with just a few private players. After the Seed Act was intro-duced in 1988 and with many restric-tions on seed development and trade being lifted, the seed industry saw a spate of private players. Currently, the sector is abuzz with private equity in-vestments, mergers and acquisitions with various international and do-mestic agribusiness houses taking ac-tive interest to enter the growing seed market of the country. Currently, the seed industry is estimated to be about Rs 144.5 billion (Fig 9). It is growing at a CAGR of 13.5%. The situation that existed during the sixties and the seventies where only the public seed organizations used to hold the lion’s share of the market has undergone a
complete reversal and more than 70% of the market is now dominated by the private players. With cultivation of hybrid crops and various vegetables increasing consistently, Indian seed market is poised for a decent growth in the coming years. However, the Indian seed market is still minuscule when compared to the matured mar-kets of countries like the USA, China or the European Union.
Indian seed market is still very much cotton dominated with 40% of the total seed market being occupied by cotton (Fig 10). Cotton is still one of the few crops, which gives both volumes and better realizations and the importance of cotton for any top-line \ seed companies is huge. High-yielding hybrid cotton seeds or Bt cot-ton seeds fetch much higher value per
packet than similar rice, maize, bajra or vegetable seeds. Howev-er, this also poses a risk factor for many companies as any changes in area under cotton cultivation due to vagaries of weather or non-realization of expected prices in the previous year influences the sale and reduces sales volume for companies. Cultivation of maize is increasing in the country and maize seed business is gaining an important place for many com-panies. Currently, approximately 12% of the Indian seed market is occupied by maize and its growth rate is high. This is driving many companies to concentrate on
maize seed business. Hybrid rice constitutes 10% of the seed industry, while high yielding varieties (HYV) of rice is estimated to occupy 13% of the share.
The Indian seed market in the re-cent years has witnessed entry of vari-ous foreign seed companies through mergers and acquisitions. The top 10 seed companies in the country cur-rently shares more than 50% of the total seed market with a large number of smaller players, mostly family hold business units operating in various parts of the country. Table 1 shows the approximate turnover of some of the leading seed companies in India.
The hallmark of any seed company is its R&D activities and various In-dian companies, bigger or smaller are elevated investments in research and development of new varieties. Build-ing a formidable pipeline of promis-ing products is challenging for various companies as it needs investments and requires a long gestation period. R&D activities also need to be market ori-ented in terms of taking into account the needs of the cultivator in terms of size, shape, shelf life etc. apart from of course the yield and duration factors. Once a hybrid seed variety of a partic-ular crop is developed after investing a lot of money and time, seed compa-nies face the challenge of a product life cycle of about eight to ten years until a better and new variety takes its place. n
Table 1: Approximate Turnover of Major Indian Seed Players in (Rs Million, 2014)
Monsanto 3400
Dupont (Pioneer) 3700
Syngenta 6000
Advanta (Year ending December 2014)
15190
Nuziveedu (nine months till December 2014)
12549
Kaveri Seeds 10110
MAHYCO 8000
Rasi Seeds 5500
Ankur Seeds 3500
Source: CACL Research

178 Agriculture Year Book 2015
www.agriculturetoday.in
Micro Irrigation
It is increasingly recognised by experts and researchers across the globe that water scarcity will be a major threat to hu-man society in the twenty-first
century. Rate of water use has been growing at more than twice the rate of population increase in the last century. Despite the fact that there is no im-mediate global water scarcity as such, increasing number of regions are be-coming chronically short of usable water. Water is consumed by humans in all major spheres of activities, with agriculture activities consuming the maximum percentage of water glob-ally, at 70% (Fig 1). 20% and 10% of water is used for industry and domes-tic purposes respectively. Currently, according to the report from United
Nations Department of Economic and Social Affairs (UNDESA), around 1.2 billion people, who constitute almost 20 percent of the world’s population, live in areas of physical water scar-city with another 500 million people approaching a situation of water scarcity.1.6 billion people or 25% of the world’s population face economic
water shortage resulting from the lack of necessary infrastructure to take wa-ter from rivers and aquifers.
Water scarcity that human race is currently facing is the result of both a natural and a human-made phenom-enon. It is a fact that there is enough freshwater on the planet for seven bil-lion people but scarcity arises due to its uneven distribution across different places on the earth and most impor-tantly, due to mindless wastage of wa-ter by human beings..
Agriculture sector is the biggest user of water in the world, while be-ing engaged continuously in feeding the huge population of the world. Ag-riculture consumes large quantities of water for irrigation and of good qual-ity for various production processes, ranging from a variety of food crops to producing a diverse range of non-food crops such as cotton, rubber and industrial oils. As a result, an immedi-ate need is felt towards judicious and economical ways of water usage in the agriculture sector and Micro Irriga-tion (MI) is an indispensable tool for achieving this objective.
“Over the coming decades, feeding a growing global population and ensuring food and nutrition security for all will depend on increasing food production. This, in turn, means ensuring the sustainable use of our most critical finite source water” Ban Ki-moon, UN Secretary General
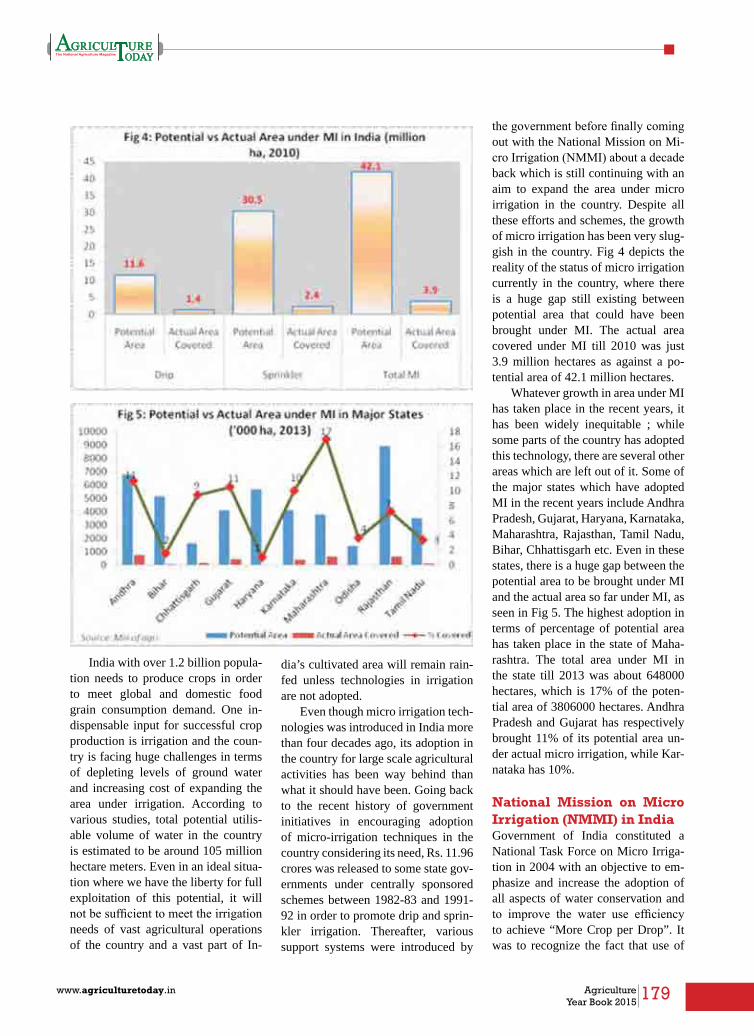
179www.agriculturetoday.in Agriculture Year Book 2015
India with over 1.2 billion popula-tion needs to produce crops in order to meet global and domestic food grain consumption demand. One in-dispensable input for successful crop production is irrigation and the coun-try is facing huge challenges in terms of depleting levels of ground water and increasing cost of expanding the area under irrigation. According to various studies, total potential utilis-able volume of water in the country is estimated to be around 105 million hectare meters. Even in an ideal situa-tion where we have the liberty for full exploitation of this potential, it will not be sufficient to meet the irrigation needs of vast agricultural operations of the country and a vast part of In-
dia’s cultivated area will remain rain-fed unless technologies in irrigation are not adopted.
Even though micro irrigation tech-nologies was introduced in India more than four decades ago, its adoption in the country for large scale agricultural activities has been way behind than what it should have been. Going back to the recent history of government initiatives in encouraging adoption of micro-irrigation techniques in the country considering its need, Rs. 11.96 crores was released to some state gov-ernments under centrally sponsored schemes between 1982-83 and 1991-92 in order to promote drip and sprin-kler irrigation. Thereafter, various support systems were introduced by
the government before finally coming out with the National Mission on Mi-cro Irrigation (NMMI) about a decade back which is still continuing with an aim to expand the area under micro irrigation in the country. Despite all these efforts and schemes, the growth of micro irrigation has been very slug-gish in the country. Fig 4 depicts the reality of the status of micro irrigation currently in the country, where there is a huge gap still existing between potential area that could have been brought under MI. The actual area covered under MI till 2010 was just 3.9 million hectares as against a po-tential area of 42.1 million hectares.
Whatever growth in area under MI has taken place in the recent years, it has been widely inequitable ; while some parts of the country has adopted this technology, there are several other areas which are left out of it. Some of the major states which have adopted MI in the recent years include Andhra Pradesh, Gujarat, Haryana, Karnataka, Maharashtra, Rajasthan, Tamil Nadu, Bihar, Chhattisgarh etc. Even in these states, there is a huge gap between the potential area to be brought under MI and the actual area so far under MI, as seen in Fig 5. The highest adoption in terms of percentage of potential area has taken place in the state of Maha-rashtra. The total area under MI in the state till 2013 was about 648000 hectares, which is 17% of the poten-tial area of 3806000 hectares. Andhra Pradesh and Gujarat has respectively brought 11% of its potential area un-der actual micro irrigation, while Kar-nataka has 10%.
National Mission on Micro Irrigation (NMMI) in IndiaGovernment of India constituted a National Task Force on Micro Irriga-tion in 2004 with an objective to em-phasize and increase the adoption of all aspects of water conservation and to improve the water use efficiency to achieve “More Crop per Drop”. It was to recognize the fact that use of

180 Agriculture Year Book 2015
www.agriculturetoday.in
modern irrigation methods like drip and sprinkler irrigation is the only al-ternative for efficient use of surface as well as ground water resources. Fol-lowing this, National Mission on Mi-cro Irrigation was introduced. Under this centrally sponsored scheme, 40% cost of the total cost of installing MI by any beneficiary will be borne by the Central Government, 10% by the State Government and the remaining 50% will be borne by the beneficiary. However, the beneficiary can invest either through his or her own resourc-es or through soft loan from various financial institutions.
Since the inception of the NMMI scheme, there has been an increase in the adoption of MI in some parts of the country, though the speed has been much slower than expected. The total area under MI in the country has increased to 1119 thousand hectares
till 2012-13, from 16 thousand hect-ares in 2005-06, the initial year of the scheme. NMMI scheme provides sub-sidies to all categories of farmers lim-ited to a maximum area of five ha per beneficiary. Both drip and sprinkler irrigation for wide spaced as well as close spaced crops are included in this scheme assistance with a condition that assistance for sprinkler irrigation will be available only for those crops where drip irrigation is uneconomical. People engaged with protected culti-vation including greenhouses, poly-houses and shade-net structures are also eligible for financial assistance. The total subsidy advance increased from Rs 16 crores in 2005-06 to Rs 526 crores in 2012-13.
Some of the states who have taken advantage of the NMMI scheme are Andhra Pradesh, Maharashtra, Guja-rat, Karnataka, Rajasthan, Tamil Nadu
and Chhattisgarh. Andhra Pradesh was the leading state in terms of area brought under MI since the launch of the scheme in 2005-06. Till 2012-13, a total area of 772 thousand hectares has been brought under MI in the state and the total subsidy gone to the ben-eficiaries is Rs 1352 crores. Maha-rashtra was the second highest state in terms of area brought under MI since the inception of the scheme and till 2012-13, 696 thousand hectares of land was irrigated with micro irriga-tion techniques. Rajasthan (663000 ha), Karnataka (537000 ha), Gujarat (432000 ha), Tamil Nadu (112000 ha) and Chattisgarh (126000 ha) were the other major states (Fig 7).
However, except few states, most of the other states where the scheme has gained some popularity are trail-ing behind the respective targets. Amongst the major states taking ben-efit of the scheme, only Rajasthan and Karnataka have exceeded their targets. As against a target of 576 thousand hectares, Rajasthan had a total area of 663 thousand hectares till 2012-13 under micro irrigation while in case of Karnataka, the total area under MI was 537 thousand hectares, exceeding the target of 511 thousand hectares (Fig 8). Lack of awareness regarding subsidies, lack of technical knowledge, high capital cost, inef-ficient implementation and follow up action of officials on applications etc. are some of the major impediments to-wards the faster adoption of MI under the scheme. n
181www.agriculturetoday.in Agriculture Year Book 2015

182 Agriculture Year Book 2015
www.agriculturetoday.in
Automation in Plant Nurseries for progressive Horticulture and Floriculture
Nursery management is indispensable for progressive development of floriculture and horticulture in India. The success of a nursery depends upon the
effective management of agro climatic inputs such as temperature, ventilation, light, watering and feeding. In India, most of the nurseries are still labour intensive. Although, some processes have been mechanized, others are not. But, for all seedlings to give similar results in terms of quality and quantity, it is imperative to control the above stated agro climatic factors through automation precisely.
While temperature, ventilation and light can be adjusted as per the crop requirement by growing the nursery under protected conditions in greenhouse or shade net, other factors like watering and feeding should be accurately managed based on the crop requirement by adopting automation.
When we talk about automation of
irrigation in Plant and flower nurseries, we need to first look at the drivers responsible for it. There are two prime reasons because of which horticulturists/ floriculturists should rapidly move towards automating the operations in the nurseries.
Automation in Micro Irrigation offers multiple advantages viz., Improved Water Use Efficiency as water is supplied directly to the root zone of the crops in the required quantity
MR. AMIT SHuKLA(VP, Marketing) and
nIVEDITA SHARMA(Manager, Marketing and Communication)
Harvel Agua India Pvt Ltd.

183www.agriculturetoday.in Agriculture Year Book 2015
at the desired time; Uniformity of discharge results in better quality of the crop (better size and morphological characteristics of the raised seedlings); Improved Fertilizer Use Efficiency (as fertilizer is supplied along with the water to the root zone and not broadcasted) resulting in a healthier crop; Irrigation and Fertigation is also possible on land with elevation difference; Reduced Incidence of Weeds, Reduced incidence of diseases and Reduced dependency on labour.
An Automated Irrigation System consists of the following main components:a) Pumpb) Sensors (Temperature, Moisture,
pH, Ecetc)c) Irrigation Controllersd) Solenoid Valvee) Fertigation Systemf) Standard Components of a Drip
Irrigation system (ARV, Pressure Gauge, Disc Filter, Main Line , Sub Main Line, Laterals (with inline Drippers)
Working of an Automated Irrigation SystemTemperature and Moisture sensors detect and guide the controllers about the ambient Temperature and Moisture requirement. The irrigation and temperature sensors detect the ET (Evapo-Transpiration Level) and thus indicate when the ET falls so that irrigation can be planned based on that. So, the sensors raise an alarm for the controllers to signal the irrigation which in turn help to calibrate the entire irrigation schedule through the solenoid valves. Through solenoid valves, Main line, Sub main line and laterals water is then delivered to the individual plants by drippers in the appropriate quantities in which
it is needed by the plants. By way of this, water can also be delivered to the plants at night when it is not practically possible by manual means. In addition to this, these controllers followed by solenoid valves can also give us the liberty to automate the irrigation and Fertigation for longer periods of time like a week/ 10 days etc.
For the purpose of Fertigation (delivering the fertilizers to the plants along with water), controllers are also available which monitor and adjust EC and pH of water as per the crop requirementand help floriculturists deliver multiple fertilizers to crops at a given point of time.
ConclusionTherefore, all of the above Automation means combined with a good planning can yield the desired results for floriculture and horticulture. Automation is a boon for remunerative nursery management and horticulture/ floriculture under protected conditions but it has to managed well to yield good results. A few limitations of this technique are listed below:
a) Requires high initial investment.
b) Technical expertise of the technician who operates the system is the heart of the system. Even the best automation will not work if not handled by a person who has technical knowledge and skills on the subject.
c) There is no incentive from the govt. to adopt this advanced technology. Till date, in India the subsidy is available only on basic Micro Irrigation components.
If all the above limitations are addressed well, by public- private partnerships in the country we can transform horticulture and floriculture into the most profitable venture for a country where agriculture contributes a majority share in the national economy. n
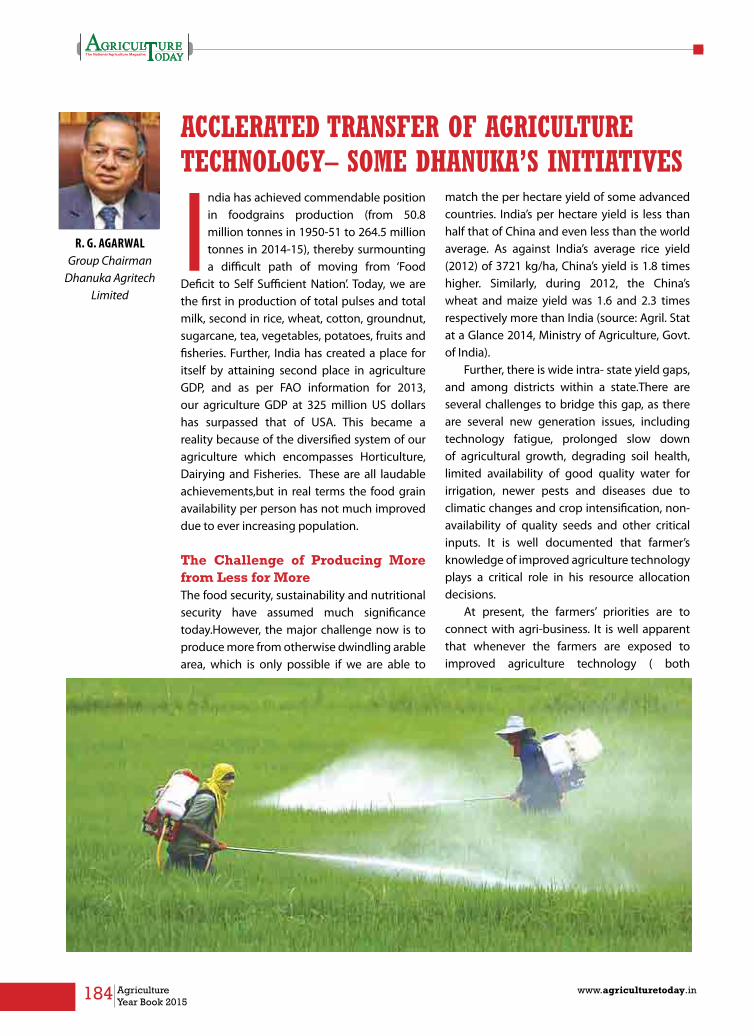
184 Agriculture Year Book 2015
www.agriculturetoday.in
ACCLERATED TRANSFER OF AGRICULTURE TECHNOLOGY– SOME DHANUKA’S INITIATIVES
India has achieved commendable position in foodgrains production (from 50.8 million tonnes in 1950-51 to 264.5 million tonnes in 2014-15), thereby surmounting a difficult path of moving from ‘Food
Deficit to Self Sufficient Nation’. Today, we are the first in production of total pulses and total milk, second in rice, wheat, cotton, groundnut, sugarcane, tea, vegetables, potatoes, fruits and fisheries. Further, India has created a place for itself by attaining second place in agriculture GDP, and as per FAO information for 2013, our agriculture GDP at 325 million US dollars has surpassed that of USA. This became a reality because of the diversified system of our agriculture which encompasses Horticulture, Dairying and Fisheries. These are all laudable achievements,but in real terms the food grain availability per person has not much improved due to ever increasing population.
The Challenge of Producing More from less for MoreThe food security, sustainability and nutritional security have assumed much significance today.However, the major challenge now is to produce more from otherwise dwindling arable area, which is only possible if we are able to
match the per hectare yield of some advanced countries. India’s per hectare yield is less than half that of China and even less than the world average. As against India’s average rice yield (2012) of 3721 kg/ha, China’s yield is 1.8 times higher. Similarly, during 2012, the China’s wheat and maize yield was 1.6 and 2.3 times respectively more than India (source: Agril. Stat at a Glance 2014, Ministry of Agriculture, Govt. of India).
Further, there is wide intra- state yield gaps, and among districts within a state.There are several challenges to bridge this gap, as there are several new generation issues, including technology fatigue, prolonged slow down of agricultural growth, degrading soil health, limited availability of good quality water for irrigation, newer pests and diseases due to climatic changes and crop intensification, non-availability of quality seeds and other critical inputs. It is well documented that farmer’s knowledge of improved agriculture technology plays a critical role in his resource allocation decisions.
At present, the farmers’ priorities are to connect with agri-business. It is well apparent that whenever the farmers are exposed to improved agriculture technology ( both
R. G. AGARWALGroup Chairman
Dhanuka Agritech Limited

185www.agriculturetoday.in Agriculture Year Book 2015
by public and private extension services), they go in for good crop management practices along with rational allocation of land, capital, labour and knowledge, thereby their enhancing crop productivity and income is much more than to those who were less exposed. Therefore, knowledge empowerment is becoming more and more important for optimum returns.
State of Public Extension ServicesAs per the 2005 Report of All India study by the National Sample Survey Organization, only 40.4 per cent farmers are accessing different sources for obtaining information on various aspects of crop production. Out of those who accessed different sources, 5.7 per cent had received information from extension worker, while 13.1 per cent from Agri-input dealers (Table 1). Further, out of those who sought information, 59.6, 49.4, and 24.0 per cent wanted information on improved seed/variety, fertilizer application, and plant protection respectively. This very well demonstrates that the public transfer of technology system in the country is not able to fulfill the fast increasing information demands of the farmers. The major constraints pertain to the inability of the public extension to reach all the farmers, all the time; lack of educational and professional expertise to disseminate
knowledge on all aspects of agriculture in a systems perspective; and no technology backstopping mechanism.
The Union Finance Minister in his speech in Parliament while presenting Union Budget 2007 said that ‘Sadly, the extension system seems to have collapsed’. Therefore, Ministry of Agriculture is advocating multi-agency dispensation of agricultural extension services through greater public-private partnership for easy availability of improved technology at the door steps of the farmers.Reaching all the farmers in the country with technology, focusing on Good Crop Management practices, relevant to the location specificity and in line with the resource endowments, can only be achieved if farmer’s capacity building is undertaken on a priority basis.
INDISPENSABlE ROlE OF AGRI-INPUT DEAlERSThere is a large network of agri-Input dealers in the country, estimated to be around 3 lakh, who are an important source of “Farm Information” to the farming community. The paradoxical situation however, is that an overwhelming majority of them do not have any formal agricultural education. They also don’t have any exposure to the Acts governing storage, handling and sale of agri-inputs especially fertilizers, and pesticides. On the other-hand, being basically businessmen, they are well conversant with different market forces.
Dhanuka joins hands in Public-Private Partnership The origin of a skill up-gradation of
Major source of Information
Per cent of farmers accessed
Major source of Information Per cent of farmers accessed
Other progressive farmers 16.7 Primary cooperative society 3.6
Input dealer 13.1 Out-put buyers/food processor 2.3
Radio 13.0 Participation in training 0.9
Television 9.3 KrishiVigyan Kendra 0.7
Newspaper 7.0 Para technician / private agency/NGO 0.6
Table 1: Farmers access to different sources for modern technology for farming
(source: NSSO Report,2005)
Felicitation Function of Agri-Input Dealers organized in partnership between MANAGE & Dhanuka GroupVIPS from L-R : Shri T.Nandaiah, Joint Director of Agriculture, Govt. of AP; Shri AbhishekDhanuka, Director, DAL; Shri K.V. Satyanarayana , IAS, DG, MANAGE; Shri R.G.Agarwal, Group Chairman, DAL; Dr M. N. Reddy, Director, MANAGE; and DrSatyanarayana Reddy, Principal Scientist, Dr N. G. Ranga Agricultural University
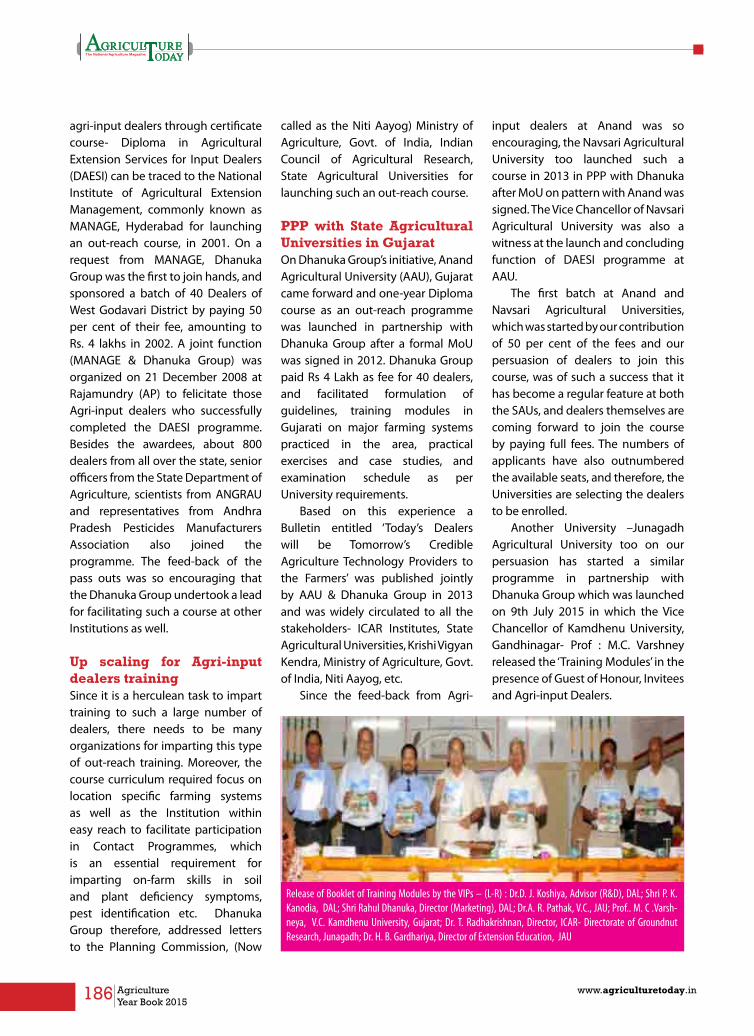
186 Agriculture Year Book 2015
www.agriculturetoday.in
agri-input dealers through certificate course- Diploma in Agricultural Extension Services for Input Dealers (DAESI) can be traced to the National Institute of Agricultural Extension Management, commonly known as MANAGE, Hyderabad for launching an out-reach course, in 2001. On a request from MANAGE, Dhanuka Group was the first to join hands, and sponsored a batch of 40 Dealers of West Godavari District by paying 50 per cent of their fee, amounting to Rs. 4 lakhs in 2002. A joint function (MANAGE & Dhanuka Group) was organized on 21 December 2008 at Rajamundry (AP) to felicitate those Agri-input dealers who successfully completed the DAESI programme. Besides the awardees, about 800 dealers from all over the state, senior officers from the State Department of Agriculture, scientists from ANGRAU and representatives from Andhra Pradesh Pesticides Manufacturers Association also joined the programme. The feed-back of the pass outs was so encouraging that the Dhanuka Group undertook a lead for facilitating such a course at other Institutions as well.
Up scaling for Agri-input dealers trainingSince it is a herculean task to impart training to such a large number of dealers, there needs to be many organizations for imparting this type of out-reach training. Moreover, the course curriculum required focus on location specific farming systems as well as the Institution within easy reach to facilitate participation in Contact Programmes, which is an essential requirement for imparting on-farm skills in soil and plant deficiency symptoms, pest identification etc. Dhanuka Group therefore, addressed letters to the Planning Commission, (Now
called as the Niti Aayog) Ministry of Agriculture, Govt. of India, Indian Council of Agricultural Research, State Agricultural Universities for launching such an out-reach course.
PPP with State Agricultural Universities in GujaratOn Dhanuka Group’s initiative, Anand Agricultural University (AAU), Gujarat came forward and one-year Diploma course as an out-reach programme was launched in partnership with Dhanuka Group after a formal MoU was signed in 2012. Dhanuka Group paid Rs 4 Lakh as fee for 40 dealers, and facilitated formulation of guidelines, training modules in Gujarati on major farming systems practiced in the area, practical exercises and case studies, and examination schedule as per University requirements.
Based on this experience a Bulletin entitled ‘Today’s Dealers will be Tomorrow’s Credible Agriculture Technology Providers to the Farmers’ was published jointly by AAU & Dhanuka Group in 2013 and was widely circulated to all the stakeholders- ICAR Institutes, State Agricultural Universities, Krishi Vigyan Kendra, Ministry of Agriculture, Govt. of India, Niti Aayog, etc.
Since the feed-back from Agri-
input dealers at Anand was so encouraging, the Navsari Agricultural University too launched such a course in 2013 in PPP with Dhanuka after MoU on pattern with Anand was signed. The Vice Chancellor of Navsari Agricultural University was also a witness at the launch and concluding function of DAESI programme at AAU.
The first batch at Anand and Navsari Agricultural Universities, which was started by our contribution of 50 per cent of the fees and our persuasion of dealers to join this course, was of such a success that it has become a regular feature at both the SAUs, and dealers themselves are coming forward to join the course by paying full fees. The numbers of applicants have also outnumbered the available seats, and therefore, the Universities are selecting the dealers to be enrolled.
Another University –Junagadh Agricultural University too on our persuasion has started a similar programme in partnership with Dhanuka Group which was launched on 9th July 2015 in which the Vice Chancellor of Kamdhenu University, Gandhinagar- Prof : M.C. Varshney released the ‘Training Modules’ in the presence of Guest of Honour, Invitees and Agri-input Dealers.
Release of Booklet of Training Modules by the VIPs – (L-R) : Dr.D. J. Koshiya, Advisor (R&D), DAL; Shri P. K. Kanodia, DAL; Shri Rahul Dhanuka, Director (Marketing), DAL; Dr.A. R. Pathak, V.C., JAU; Prof.. M. C .Varsh-neya, V.C. Kamdhenu University, Gujarat; Dr. T. Radhakrishnan, Director, ICAR- Directorate of Groundnut Research, Junagadh; Dr. H. B. Gardhariya, Director of Extension Education, JAU
187www.agriculturetoday.in Agriculture Year Book 2015
Moving ForwardSuch a course has an added value now.The new Pesticides Management Bill and the new Gazette Notification issued by the Ministry of Agriculture has an added requirement that all the existing Pesticides Dealers must go through some long-term training in agriculture or they should employ B.Sc.(Agri) person for renewal of license to sell pesticides. Therefore, we need to start training pesticides dealers, in particular and for all other agri-input dealers in general, at several places in the country.
Rather than limiting to only a few SAUs, the country needs to adopt a scaling-up approach. It is therefore, proposed that such courses be organized by the SAUs (at present 45-excluding Veterinary & Fisheries) and Krishi Vigyan Kendras
-KVK (at present 642) as they have the necessary infrastructure for agriculture training, by orienting to the locally prevailing farming systems, though maintaining the basic course format. If such a Diploma/Certificate course is launched, say in 75 per cent of these Institutions, with an intake of 40 Dealers per year, thereby annually around 20,000 dealers can be trained. By further extrapolating that 3 lakh dealers are to be trained, it will require around 15 years. Further, training in agriculture is not onetime activity and as agriculture technology advances, the dealers would also be required to have some refresher training as well.
One dealer, on an average, is in touch with 1,500 farmers. Upgrading the knowledge of agriculture technology of the existing dealers
is expected to bring qualitative change in their agriculture knowledge, communication skills and entrepreneurship development, etc. Therefore, 45 crore farmers could be effectively provided access to improved agriculture technology, if all the dealers are trained. However, agriculture technology being fast changing, even this one-time training may not be sufficient. Therefore, the dealers will have to be provided technology backstopping by assigning additional responsibility to the SAUs and KVKs for regular interactive meetings.
Let the policy makers initiate early launch of such a course to provide much needed fillip to transfer of agriculture technology with enhanced reach! n
187www.agriculturetoday.in Agriculture Year Book 2015

lAteSt And mAjor Agriculture r&d
breAkthroughS in the World

190 Agriculture Year Book 2015
www.agriculturetoday.in
Team of scientists from India Mainak Das, Deepu Philip, Sushil Kumar Singh, Kalpana Bhargava and Niroj
K Sethy have successfully demonstrated a novel innovation that enhances productiv-ity without fertilizer or genetic engineer-ing. They have successfully demonstrated a new way to treat seeds with nano-particles of iron-pyrites before sowing that enhances plant growth significantly.Mainak Das and Deepu Philip are respectively from IIT Kanpur and IIT Kharagpur, while the rest of the team are from Defense Research & Development Organization (DRDO). En-couraging results have been found so far with crops like spinach, carrot, fenugreek, sesame and beetroot where productivity has increased from 40 per cent to 100 per cent without disturbing the soil ecosystem unlike chemical fertilizers.
Seed Treatment With Nano-Particles of Iron-Pyrites
Mappingof wild Emmer Wheat Genome Makes it Possible in Future for Genetically Engineered Breeds of Wheat to Thrive in Hot, Dry Climates
Israeli biotech start-up NRGene has been able to map out the genome for wild Emmer wheat in a record three months’ time whereas generally, genome mapping takes
years. This is a major technological achievement in agri-cultural research and development and also from the point of view of preventing world hunger. Mapping of the wild Emmer wheat genome means that it will be much easier now for scientists to develop breeds of bread wheat that will thrive in drier, hotter climates.Mapping genomes for plants allows scientists to see what attributes they contain which allow them to thrive in specific environments. Deci-
phering the genetic code that make up maize and rice had taken scientists anything between five to ten years. Rice ge-nome was mapped in 2002, and the maize genome mapping was completed in 2009. Mapping of the wheat by the Israeli company now makes it possible with the help of DNA data to point out a variety’s specific characteristics that will en-able farmers and scientists to breed variety of the crops that can stand up to arid surroundings, brackish water, and other harsh environmental conditions in as little as three years. Usually it takes 15 years or more to develop a strain that it more suited to specific conditions.

191www.agriculturetoday.in Agriculture Year Book 2015
Newly-discovered mole-cule called Fluensulfone proves to be effective control for Nematode
Adama Agricultural Solutions (formerly Makhteshim-Agan Industries Ltd) has de-veloped nematicide based on a newly-dis-
covered molecule called fluensulfone. Nematodes destroys a number of crops like tomatoes, cucum-bers, melons, okra plants, potatoes, and many more species. The product has been branded as Nimitz and is the culmination of a wide range of studies conducted over the past six years in 21 countries proving its efficacy. It is the first new nematicide introduced anywhere in the past 20 years, and is less hazardous to the environment than other solu-tions and has already got approval from countries like Israel, Australia, Europe, and many US states for marketing.
Big data is not just for cybersecurity or mo-bile app developers but
farmers too who can use it to increase their productivity, as demonstrated by the Israeli ag-tech big data firm AKOL. The platform created by this tech firm enables users see exactly what to do to take care of crops, when to do it, and how much of it to do, in order to get the best results from their fields. Chinese agricultural authori-ties signed a deal last month with AKOL to use its “agri-cultural cloud” technology for fish farms. This will help fish farmers to access detailed in-formation through sensors and analyzed on the system’s serv-ers, and informing them when to clean pools, how much and when to feed fish, etc.
Sensors are placed on trees, vines, and fields, or at-tached to cows, milking sys-tems, feed bins, and any other
appropriate host, where data is recorded about the environ-ment, temperature and humid-ity, how much animals are eat-ing, activity among animals, soil conditions for plants, the level of pests in an area, and much more. Captured data is then analyzed and compared to guidelines for ideal production under the circumstances, with specific instructions sent back to farmers. Beyond this raw data about growing and envi-ronmental conditions, AKOL’s systems take into account cul-tural issues as well, and ana-lyze the way people in specific areas work. Based on this, it was discovered that for farmers in Serbia, there was a definite connection between drinking coffee and farm productivity and that farmers who did not drink coffee first thing in the morning were not as produc-tive as those who did.
Big data teaches farmers means of better cropping
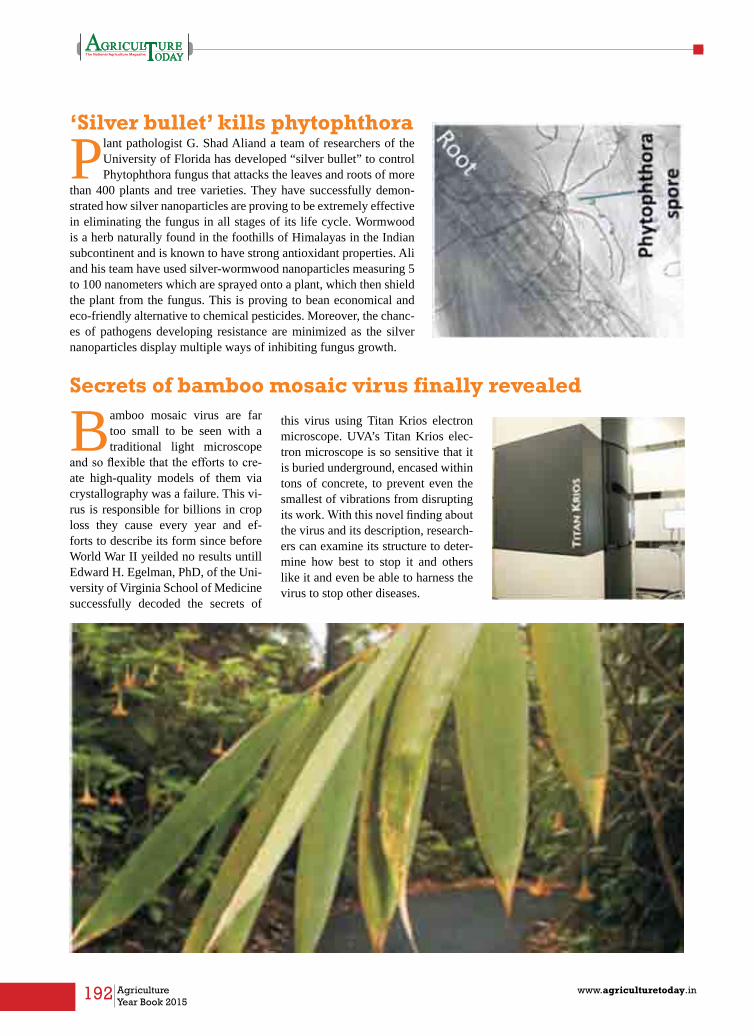
192 Agriculture Year Book 2015
www.agriculturetoday.in
Plant pathologist G. Shad Aliand a team of researchers of the University of Florida has developed “silver bullet” to control Phytophthora fungus that attacks the leaves and roots of more
than 400 plants and tree varieties. They have successfully demon-strated how silver nanoparticles are proving to be extremely effective in eliminating the fungus in all stages of its life cycle. Wormwood is a herb naturally found in the foothills of Himalayas in the Indian subcontinent and is known to have strong antioxidant properties. Ali and his team have used silver-wormwood nanoparticles measuring 5 to 100 nanometers which are sprayed onto a plant, which then shield the plant from the fungus. This is proving to bean economical and eco-friendly alternative to chemical pesticides. Moreover, the chanc-es of pathogens developing resistance are minimized as the silver nanoparticles display multiple ways of inhibiting fungus growth.
Bamboo mosaic virus are far too small to be seen with a traditional light microscope
and so flexible that the efforts to cre-ate high-quality models of them via crystallography was a failure. This vi-rus is responsible for billions in crop loss they cause every year and ef-forts to describe its form since before World War II yeilded no results untill Edward H. Egelman, PhD, of the Uni-versity of Virginia School of Medicine successfully decoded the secrets of
this virus using Titan Krios electron microscope. UVA’s Titan Krios elec-tron microscope is so sensitive that it is buried underground, encased within tons of concrete, to prevent even the smallest of vibrations from disrupting its work. With this novel finding about the virus and its description, research-ers can examine its structure to deter-mine how best to stop it and others like it and even be able to harness the virus to stop other diseases.
‘Silver bullet’ kills phytophthora
Secrets of bamboo mosaic virus finally revealed

193www.agriculturetoday.in Agriculture Year Book 2015
StAtuS oF commerciAl gm
cropS World And indiA
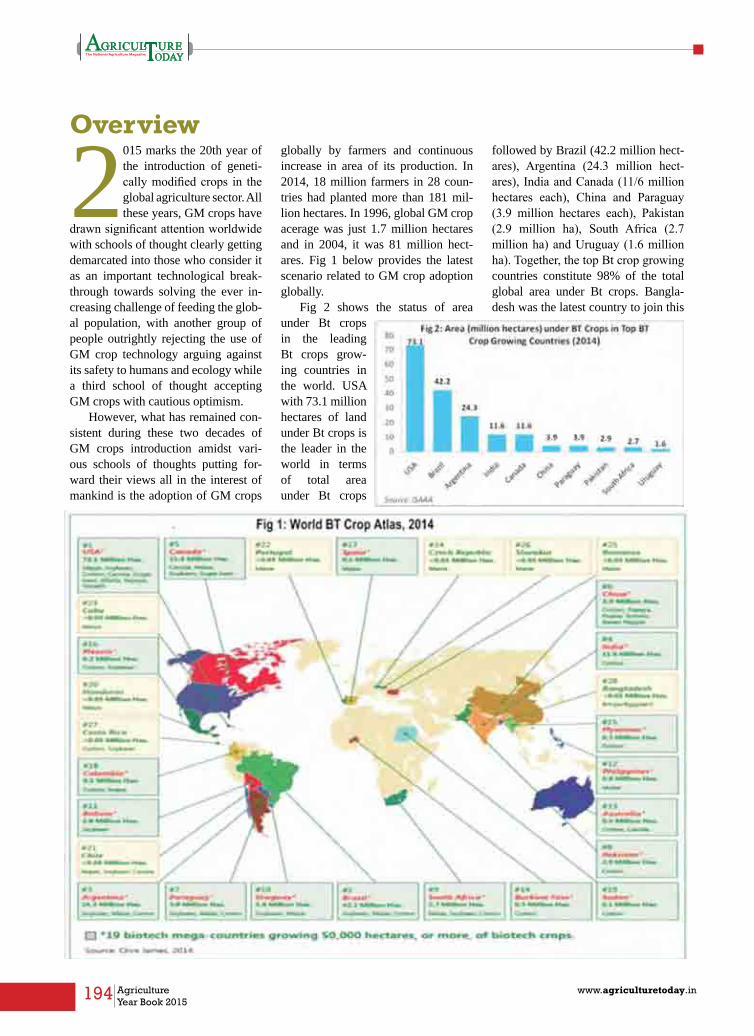
194 Agriculture Year Book 2015
www.agriculturetoday.in
Overview
2015 marks the 20th year of the introduction of geneti-cally modified crops in the global agriculture sector. All these years, GM crops have
drawn significant attention worldwide with schools of thought clearly getting demarcated into those who consider it as an important technological break-through towards solving the ever in-creasing challenge of feeding the glob-al population, with another group of people outrightly rejecting the use of GM crop technology arguing against its safety to humans and ecology while a third school of thought accepting GM crops with cautious optimism.
However, what has remained con-sistent during these two decades of GM crops introduction amidst vari-ous schools of thoughts putting for-ward their views all in the interest of mankind is the adoption of GM crops
globally by farmers and continuous increase in area of its production. In 2014, 18 million farmers in 28 coun-tries had planted more than 181 mil-lion hectares. In 1996, global GM crop acerage was just 1.7 million hectares and in 2004, it was 81 million hect-ares. Fig 1 below provides the latest scenario related to GM crop adoption globally.
Fig 2 shows the status of area under Bt crops in the leading Bt crops grow-ing countries in the world. USA with 73.1 million hectares of land under Bt crops is the leader in the world in terms of total area under Bt crops
followed by Brazil (42.2 million hect-ares), Argentina (24.3 million hect-ares), India and Canada (11/6 million hectares each), China and Paraguay (3.9 million hectares each), Pakistan (2.9 million ha), South Africa (2.7 million ha) and Uruguay (1.6 million ha). Together, the top Bt crop growing countries constitute 98% of the total global area under Bt crops. Bangla-desh was the latest country to join this
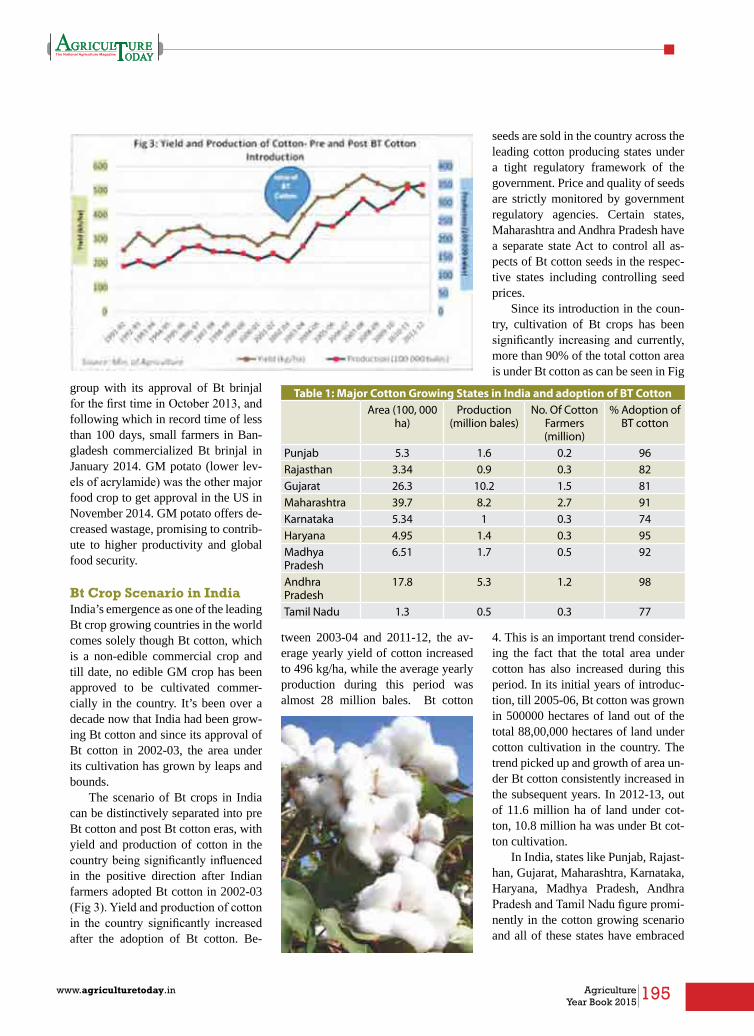
195www.agriculturetoday.in Agriculture Year Book 2015
group with its approval of Bt brinjal for the first time in October 2013, and following which in record time of less than 100 days, small farmers in Ban-gladesh commercialized Bt brinjal in January 2014. GM potato (lower lev-els of acrylamide) was the other major food crop to get approval in the US in November 2014. GM potato offers de-creased wastage, promising to contrib-ute to higher productivity and global food security.
Bt Crop Scenario in IndiaIndia’s emergence as one of the leading Bt crop growing countries in the world comes solely though Bt cotton, which is a non-edible commercial crop and till date, no edible GM crop has been approved to be cultivated commer-cially in the country. It’s been over a decade now that India had been grow-ing Bt cotton and since its approval of Bt cotton in 2002-03, the area under its cultivation has grown by leaps and bounds.
The scenario of Bt crops in India can be distinctively separated into pre Bt cotton and post Bt cotton eras, with yield and production of cotton in the country being significantly influenced in the positive direction after Indian farmers adopted Bt cotton in 2002-03 (Fig 3). Yield and production of cotton in the country significantly increased after the adoption of Bt cotton. Be-
seeds are sold in the country across the leading cotton producing states under a tight regulatory framework of the government. Price and quality of seeds are strictly monitored by government regulatory agencies. Certain states, Maharashtra and Andhra Pradesh have a separate state Act to control all as-pects of Bt cotton seeds in the respec-tive states including controlling seed prices.
Since its introduction in the coun-try, cultivation of Bt crops has been significantly increasing and currently, more than 90% of the total cotton area is under Bt cotton as can be seen in Fig
Table 1: Major Cotton Growing States in India and adoption of BT Cotton Area (100, 000
ha)Production
(million bales)No. Of Cotton
Farmers (million)
% Adoption of BT cotton
Punjab 5.3 1.6 0.2 96Rajasthan 3.34 0.9 0.3 82Gujarat 26.3 10.2 1.5 81Maharashtra 39.7 8.2 2.7 91Karnataka 5.34 1 0.3 74Haryana 4.95 1.4 0.3 95Madhya Pradesh
6.51 1.7 0.5 92
Andhra Pradesh
17.8 5.3 1.2 98
Tamil Nadu 1.3 0.5 0.3 77
tween 2003-04 and 2011-12, the av-erage yearly yield of cotton increased to 496 kg/ha, while the average yearly production during this period was almost 28 million bales. Bt cotton
4. This is an important trend consider-ing the fact that the total area under cotton has also increased during this period. In its initial years of introduc-tion, till 2005-06, Bt cotton was grown in 500000 hectares of land out of the total 88,00,000 hectares of land under cotton cultivation in the country. The trend picked up and growth of area un-der Bt cotton consistently increased in the subsequent years. In 2012-13, out of 11.6 million ha of land under cot-ton, 10.8 million ha was under Bt cot-ton cultivation.
In India, states like Punjab, Rajast-han, Gujarat, Maharashtra, Karnataka, Haryana, Madhya Pradesh, Andhra Pradesh and Tamil Nadu figure promi-nently in the cotton growing scenario and all of these states have embraced
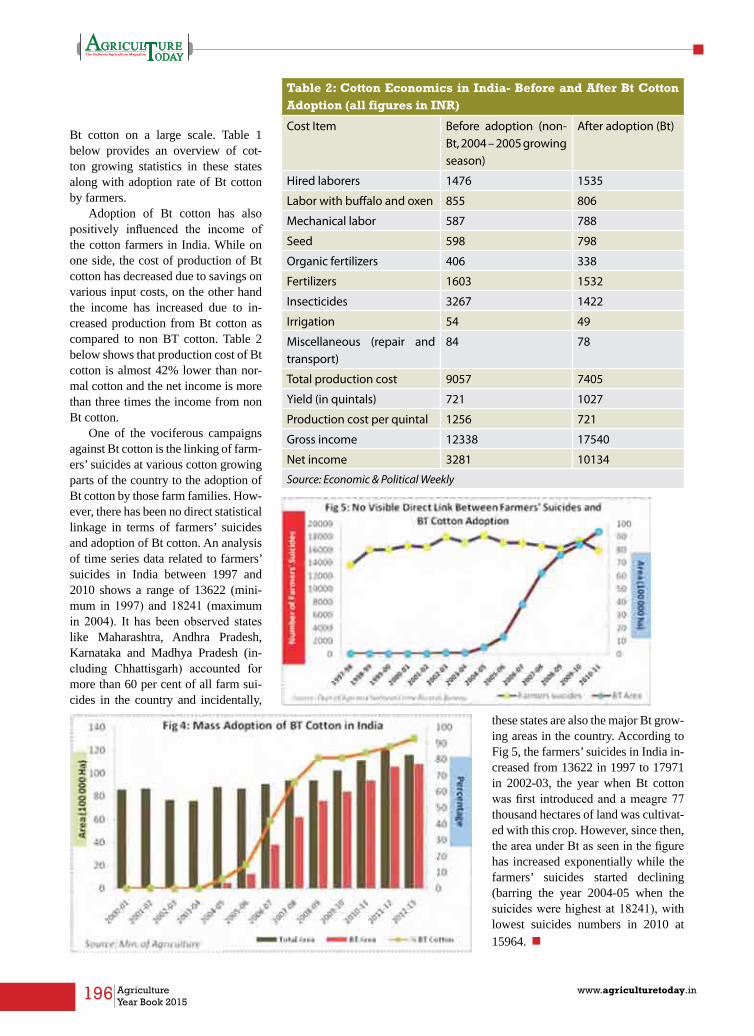
196 Agriculture Year Book 2015
www.agriculturetoday.in
Bt cotton on a large scale. Table 1 below provides an overview of cot-ton growing statistics in these states along with adoption rate of Bt cotton by farmers.
Adoption of Bt cotton has also positively influenced the income of the cotton farmers in India. While on one side, the cost of production of Bt cotton has decreased due to savings on various input costs, on the other hand the income has increased due to in-creased production from Bt cotton as compared to non BT cotton. Table 2 below shows that production cost of Bt cotton is almost 42% lower than nor-mal cotton and the net income is more than three times the income from non Bt cotton.
One of the vociferous campaigns against Bt cotton is the linking of farm-ers’ suicides at various cotton growing parts of the country to the adoption of Bt cotton by those farm families. How-ever, there has been no direct statistical linkage in terms of farmers’ suicides and adoption of Bt cotton. An analysis of time series data related to farmers’ suicides in India between 1997 and 2010 shows a range of 13622 (mini-mum in 1997) and 18241 (maximum in 2004). It has been observed states like Maharashtra, Andhra Pradesh, Karnataka and Madhya Pradesh (in-cluding Chhattisgarh) accounted for more than 60 per cent of all farm sui-cides in the country and incidentally,
Table 2: Cotton Economics in India- Before and After Bt Cotton Adoption (all figures in INR)
Cost Item Before adoption (non-Bt, 2004 – 2005 growing season)
After adoption (Bt)
Hired laborers 1476 1535
Labor with buffalo and oxen 855 806
Mechanical labor 587 788
Seed 598 798
Organic fertilizers 406 338
Fertilizers 1603 1532
Insecticides 3267 1422
Irrigation 54 49
Miscellaneous (repair and transport)
84 78
Total production cost 9057 7405
Yield (in quintals) 721 1027
Production cost per quintal 1256 721
Gross income 12338 17540
Net income 3281 10134
Source: Economic & Political Weekly
these states are also the major Bt grow-ing areas in the country. According to Fig 5, the farmers’ suicides in India in-creased from 13622 in 1997 to 17971 in 2002-03, the year when Bt cotton was first introduced and a meagre 77 thousand hectares of land was cultivat-ed with this crop. However, since then, the area under Bt as seen in the figure has increased exponentially while the farmers’ suicides started declining (barring the year 2004-05 when the suicides were highest at 18241), with lowest suicides numbers in 2010 at 15964. n

197www.agriculturetoday.in Agriculture Year Book 2015

198 Agriculture Year Book 2015
www.agriculturetoday.in
“Kisan is the sentinel of our food security. Annadaata Sukhibhava has been one of our fundamental civilizational values. My Government attaches enormous
importance to the well being of farmers. This will need value-added agriculture,
market reform, use of technology and improving productivity in areas with untapped potential.” Pranab Mukherjee President, India
“Today, the country has to import pulses. Let’s resolve that by 2022 we will no longer have to import pulses. Our agricultural universities should take up each variety of pulses, how to
do research on it, how to do genetic engineering, how to increase productivity,
how to increase protein content so that farmers get good prices” Narendra Modi, Prime Minister, India
“Today, the sons of farmers are willing to work even as watchmen, or take up any odd job in the city, but are not interested in working as farmers. (To solve this) We can promote small scale industry and set
up units here for industries such as food processing so that not only farmers get the
right price for their produce but local youth also get employment”Rajnath Singh, Union Home Minister
“A double digit growth is impossible if we ignore this sector. Agri-growth has multiplier effect on poverty reduction and rural prosperity. It has a high potential for creating ‘Near Farm’ jobs”
M. Venkaiah Naidu, Union Minister of Urban Development, Govt of India
“While acquiring land, three factors—food security, security of farmers and purpose for which land is to be acquired—should be kept in mind. Preserving land is a must as 90 percent of food for humanity comes
from the soil and only 10 percent comes from other resources such as the ocean”
Dr MS Swaminathan, Renowned Agriculture Scientist
“All economists agree on the importance of rural sector in the economy... Our government is seriously working towards developing rural areas and agriculture. The country can never
progress if the villages are not developed”Akhilesh Yadav, Chief Minister, UP
“If we are to eradicate hunger and poverty, we need to level the playing field by economically empowering women farmers,”
Dr. William Dar, former Director-General, ICRISAT
“In some states on certain occasions we have had debt waivers. How effective these debt waivers have been? In fact the studies that we have typically show that they have been ineffective. In fact
they have constrained the credit flow post waiver to the farmers.”
Raghuram Rajan, RBI Governor
“Agriculture and all that it encompasses is not only critical for our food supply,
it also remains a main source of livelihoods across the planet. While it is a sector at risk, agriculture also can
be the foundation upon which we build societies that are more resilient and better
equipped to deal with disasters” José Graziano da Silva, Director General, FAO
“We keep on emphasising empowerment of women and smallholder farmers and we
need to provide them with social and financial entitlements so as to enable them to absorb shocks,” Kanayo F Nwanze, President,
International Fund for Agricultural Development (IFAD)
“The Indian Government should focus on producing basic food and other food
grains should be imported. Instead of producing routine food crops, farmers should be persuaded to grow high
value crops with a potential to export” Juergen Voegele, Senior Director,
Agriculture Global Practice, World Bank
“Apart from increased productivity to produce more from less water and land, the losses that
occur due to droughts, floods, biotic and other abiotic stresses also need to be eliminated decisively through adoption of appropriate technologies. In this context, genetic engineering holds
great promise” Radha Mohan Singh, Agriculture Minister,
Govt of India

199www.agriculturetoday.in Agriculture Year Book 2015
“Currently, there is Rs 44,000 crore of wastage and unless we work towards removing that, our growth story cannot be completed,”
Harsimrat Kaur Badal, Food Processing Minister, Govt of India
“Food security is a humanitarian concern, especially in these times of uncertainty and volatility, and the issue of food security is critical to a
vast swathe of humanity and cannot be sacrificed to mercantilist considerations.”
Nirmala Sitharaman, Commerce and Industry Minister, Govt of India
“It is high time that farmers from Punjab and Haryana shun wheat, paddy and sugarcane crop pattern as traditional farming will continue to worsen their economic situation”
Nitin Gadkari, Minister of Road Transport and Highways of India, Govt of
India
“The issue of water use efficiency is recognised as being very important for water security in the coming years. Irrigation sector accounts for about 80 per cent of total water use and
therefore, it is imperative that water use efficiency is much more important in case
of irrigation projects.” Uma Bharti, Minister of Water Resources, River Development and Ganga Rejuvenation, Govt of India
“Agriculture is no longer a profitable venture as its input cost have increased manifold whereas the farmers are not getting remunerative prices of their harvest,”
Prakash Singh Badal, Chief Minister, Punjab
“Climate change is no longer a matter of debate. While our contribution to global warming is not much, there is
no other country which is more affected by climate change. It is something that we
have to be proactive on and not reactive to”Jairam Ramesh, MP and former Minister for Environment, India
“In longer run, you do need that (farm) workers come out of agriculture into manufacturing and services jobs. If you don’t want to leave this population
in that (poor) state”Arvind Panagariya, Vice Chairman,
NITI Aayog
“Without making agriculture exciting for the youth, we cannot involve them in the farm sector. Once they are involved, we can surely achieve our target”
Dr. RS Paroda, former Director-General, ICAR
“We are not listening enough to science as it should determine our policies. We are not becoming a knowledge society. We are becoming a knowledge proof society”
Dr. Sunita Narain, Director General of Centre for Science and Environment
“Time is now fit for shifting focus from field crops to other frontiers of agriculture such as horticulture, livestock, dairy farming, fisheries – towards integrated and sustainable
agriculture. This will help reduce the pressure on our scant resources such as
land and water and improve the quality of life and general prosperity of the people”Ashish Bahuguna, Chairman, FSSAI
“Any technology the country is trying to adopt should be evaluated from the lens of the small farmer, or you will polarize farming communities even further. GM technology is expensive.
Rain-fed farmers have suffered. Almost 80% of our farmers are very resource poor”.
Suman Sahai, Winner of Norman Borlaug Award, Head, Gene Campaign.
“It is unfortunate that though India is the world’s largest cotton producer, it has only a 4.5% market share in the world’s textile market while Bangladesh and Vietnam that do not produce a single
bale of cotton are way ahead of us. The government needs to focus on a fibre policy”
J Thulasidharan, President, Indian Cotton Federation (ICF).