
and Short-Range Order in Ln2(WO4)3 (Ln = Gd, Dy, Ho, Yb ...
20
Citation: Popov, V.V.; Zubavichus, Y.V.; Menushenkov, A.P.; Yastrebtsev, A.A.; Gaynanov, B.R.; Rudakov, S.G.; Ivanov, A.A.; Dubyago, F.E.; Svetogorov, R.D.; Khramov, E.V.; et al. Features of the Phase Preferences, Long- and Short-Range Order in Ln 2 (WO 4 ) 3 (Ln = Gd, Dy, Ho, Yb) with Their Relation to Hydration Behavior. Crystals 2022, 12, 892. https://doi.org/10.3390/ cryst12070892 Academic Editors: Maria Milanova and Martin Tsvetkov Received: 4 May 2022 Accepted: 17 June 2022 Published: 23 June 2022 Publisher’s Note: MDPI stays neutral with regard to jurisdictional claims in published maps and institutional affil- iations. Copyright: © 2022 by the authors. Licensee MDPI, Basel, Switzerland. This article is an open access article distributed under the terms and conditions of the Creative Commons Attribution (CC BY) license (https:// creativecommons.org/licenses/by/ 4.0/). crystals Article Features of the Phase Preferences, Long- and Short-Range Order in Ln 2 (WO 4 ) 3 (Ln = Gd, Dy, Ho, Yb) with Their Relation to Hydration Behavior VictorV. Popov 1,2, * , YanV. Zubavichus 3, * , Alexey P. Menushenkov 1 , Alexey A. Yastrebtsev 1 , Bulat R. Gaynanov 1 , Sergey G. Rudakov 1 , Andrey A. Ivanov 1 , Fyodor E. Dubyago 1 , Roman D. Svetogorov 2 , EvgenyV. Khramov 2 , Nadezhda A. Tsarenko 4 , NataliyaV. Ognevskaya 4 and IgorV. Shchetinin 5 1 Department of Solid State Physics and Nanosystems, National Research Nuclear University MEPhI (Moscow Engineering Physics Institute), 115409 Moscow, Russia; [email protected] (A.P.M.); [email protected] (A.A.Y.); [email protected] (B.R.G.); [email protected] (S.G.R.); [email protected] (A.A.I.); [email protected] (F.E.D.) 2 Kurchatov Synchrotron Radiation Source, National Research Center Kurchatov Institute, 123182 Moscow, Russia; [email protected] (R.D.S.); [email protected] (E.V.K.) 3 Synchrotron Radiation Facility SKIF, Boreskov Institute of Catalysis SB RAS, 630559 Koltsovo, Russia 4 JSC Design & Survey and Research & Development Institute of Industrial Technology, 115409 Moscow, Russia; [email protected] (N.A.T.); [email protected] (N.V.O.) 5 Material Science Department, National University of Science and Technology MISiS, 119049 Moscow, Russia; [email protected] * Correspondence: [email protected] (V.V.P.); [email protected] (Y.V.Z.) Abstract: The effect of synthesis conditions on the features of the long- and short-range order of Ln 2 (WO 4 ) 3 (Ln = Gd, Dy, Ho, Yb) powders synthesized via coprecipitation of salts has been studied by a complex of physico-chemical techniques including synchrotron X-ray powder diffraction, X-ray absorption spectroscopy, Raman and infrared spectroscopy, and simultaneous thermal analysis. It was found that crystallization of amorphous precursors begins at 600 ◦ C/3 h and leads to the formation of the monoclinic structure with sp. gr. C12/c1(15) for Ln 2 (WO 4 ) 3 (Ln = Gd, Dy) and with sp. gr. P12 1 /a1(14) for Ln = Yb, whereas crystallization of Ho precursor requires even higher temperature. After annealing at 1000 ◦ C, the P12 1 / a1(14) phase becomes the dominant phase component for all heavy lanthanoid types except for Ln = Gd. It was shown that the Ln (Ln = Dy, Ho, and Yb) tungstates with the P12 1 / a1(14) monoclinic structure correspond to trihydrates Ln 2 (WO 4 ) 3 ·3H 2 O formed due to a rapid spontaneous hydration under ambient conditions. It was concluded that the proneness to hydration is due to a specific structure of the P12 1 / a1(14) phase with large voids available to water molecules. Modifications in the local structure of Ln-O coordination shell accompanying the structure type change and hydration are monitored using EXAFS spectroscopy. Keywords: lanthanoid tungstates; phase transitions; hydration; Synchrotron XRD; X-ray Absorption Fine Structure (XAFS); simultaneous thermal analysis; raman spectroscopy; FT-IR spectroscopy 1. Introduction The lanthanoid (Ln) tungstates present a wide group of inorganic complex oxides of transition metal and rare earth elements, which attract great interest both for basic science (great chemical flexibility, rich polymorphism and phase transformations, high ionic conductivity, etc.), and for practical uses (from electronics to biology) due to their multifunctional properties (optical, electronic, luminescence and so on) [1–4]. The most typical Ln tritungstates Ln 2 (WO 4 ) 3 with the 2:3 lanthanoid:tungsten atomic ratio have been known for many decades [5–7]. In particular, a considerable interest in the Ln 2 (WO 4 ) 3 Crystals 2022, 12, 892. https://doi.org/10.3390/cryst12070892 https://www.mdpi.com/journal/crystals
-
Upload
khangminh22 -
Category
Documents
-
view
1 -
download
0
Transcript of and Short-Range Order in Ln2(WO4)3 (Ln = Gd, Dy, Ho, Yb ...

�����������������
Citation: Popov, V.V.; Zubavichus,
Y.V.; Menushenkov, A.P.; Yastrebtsev,
A.A.; Gaynanov, B.R.; Rudakov, S.G.;
Ivanov, A.A.; Dubyago, F.E.;
Svetogorov, R.D.; Khramov, E.V.; et al.
Features of the Phase Preferences,
Long- and Short-Range Order in
Ln2(WO4)3 (Ln = Gd, Dy, Ho, Yb)
with Their Relation to Hydration
Behavior. Crystals 2022, 12, 892.
https://doi.org/10.3390/
cryst12070892
Academic Editors: Maria Milanova
and Martin Tsvetkov
Received: 4 May 2022
Accepted: 17 June 2022
Published: 23 June 2022
Publisher’s Note: MDPI stays neutral
with regard to jurisdictional claims in
published maps and institutional affil-
iations.
Copyright: © 2022 by the authors.
Licensee MDPI, Basel, Switzerland.
This article is an open access article
distributed under the terms and
conditions of the Creative Commons
Attribution (CC BY) license (https://
creativecommons.org/licenses/by/
4.0/).
crystals
Article
Features of the Phase Preferences, Long- and Short-Range Orderin Ln2(WO4)3 (Ln = Gd, Dy, Ho, Yb) with Their Relation toHydration BehaviorVictor V. Popov 1,2,* , Yan V. Zubavichus 3,* , Alexey P. Menushenkov 1 , Alexey A. Yastrebtsev 1 ,Bulat R. Gaynanov 1 , Sergey G. Rudakov 1, Andrey A. Ivanov 1 , Fyodor E. Dubyago 1 ,Roman D. Svetogorov 2 , Evgeny V. Khramov 2 , Nadezhda A. Tsarenko 4, Nataliya V. Ognevskaya 4
and Igor V. Shchetinin 5
1 Department of Solid State Physics and Nanosystems, National Research Nuclear University MEPhI (MoscowEngineering Physics Institute), 115409 Moscow, Russia; [email protected] (A.P.M.);[email protected] (A.A.Y.); [email protected] (B.R.G.); [email protected] (S.G.R.);[email protected] (A.A.I.); [email protected] (F.E.D.)
2 Kurchatov Synchrotron Radiation Source, National Research Center Kurchatov Institute,123182 Moscow, Russia; [email protected] (R.D.S.); [email protected] (E.V.K.)
3 Synchrotron Radiation Facility SKIF, Boreskov Institute of Catalysis SB RAS, 630559 Koltsovo, Russia4 JSC Design & Survey and Research & Development Institute of Industrial Technology,
115409 Moscow, Russia; [email protected] (N.A.T.); [email protected] (N.V.O.)5 Material Science Department, National University of Science and Technology MISiS, 119049 Moscow, Russia;
[email protected]* Correspondence: [email protected] (V.V.P.); [email protected] (Y.V.Z.)
Abstract: The effect of synthesis conditions on the features of the long- and short-range order ofLn2(WO4)3 (Ln = Gd, Dy, Ho, Yb) powders synthesized via coprecipitation of salts has been studiedby a complex of physico-chemical techniques including synchrotron X-ray powder diffraction, X-rayabsorption spectroscopy, Raman and infrared spectroscopy, and simultaneous thermal analysis. It wasfound that crystallization of amorphous precursors begins at 600 ◦C/3 h and leads to the formationof the monoclinic structure with sp. gr. C12/c1(15) for Ln2(WO4)3 (Ln = Gd, Dy) and with sp. gr.P121/a1(14) for Ln = Yb, whereas crystallization of Ho precursor requires even higher temperature.After annealing at 1000 ◦C, the P121/a1(14) phase becomes the dominant phase component for allheavy lanthanoid types except for Ln = Gd. It was shown that the Ln (Ln = Dy, Ho, and Yb) tungstateswith the P121/a1(14) monoclinic structure correspond to trihydrates Ln2(WO4)3·3H2O formed due toa rapid spontaneous hydration under ambient conditions. It was concluded that the proneness tohydration is due to a specific structure of the P121/a1(14) phase with large voids available to watermolecules. Modifications in the local structure of Ln-O coordination shell accompanying the structuretype change and hydration are monitored using EXAFS spectroscopy.
Keywords: lanthanoid tungstates; phase transitions; hydration; Synchrotron XRD; X-ray AbsorptionFine Structure (XAFS); simultaneous thermal analysis; raman spectroscopy; FT-IR spectroscopy
1. Introduction
The lanthanoid (Ln) tungstates present a wide group of inorganic complex oxidesof transition metal and rare earth elements, which attract great interest both for basicscience (great chemical flexibility, rich polymorphism and phase transformations, highionic conductivity, etc.), and for practical uses (from electronics to biology) due to theirmultifunctional properties (optical, electronic, luminescence and so on) [1–4]. The mosttypical Ln tritungstates Ln2(WO4)3 with the 2:3 lanthanoid:tungsten atomic ratio have beenknown for many decades [5–7]. In particular, a considerable interest in the Ln2(WO4)3
Crystals 2022, 12, 892. https://doi.org/10.3390/cryst12070892 https://www.mdpi.com/journal/crystals
Crystals 2022, 12, 892 2 of 20
tungstates is observed in the past few decades because these compounds exhibit negativethermal expansion (NTE) [8–11].
Nowadays, it is commonly accepted that a crystalline structure of Ln2(WO4)3 is gov-erned by the ionic radius of the Ln3+ cation [7,9]. Light Ln (Ln = La–Eu) tungstates fromthe first half of the rare-earth series at room temperature are characterized by a monoclinicstructure (space group C12/c1) in which the Ln3+ cation is eight-coordinated by the oxygenatoms. Meanwhile, heavier Ln (Ln = Gd–Dy) tungstates from the mid of the series adoptat room temperature a monoclinic structure. These tungstates upon heating transforminto an orthorhombic structure, which is reported to be intrinsically hygroscopic at roomtemperature. The heaviest Ln (Ln = Ho–Lu) tungstates with smallest ionic radii are highlyhygroscopic and form a stable orthorhombic trihydrate structure (sp. gr. Pnca) at roomtemperature in which the Ln3+ cation is six-coordinated with the oxygen atoms [9].
However, some issues related to phase preferences of the Ln tungstates as well as exactboundary conditions of mutual phase transitions between them remain a subject of debateso far. The formation of light lanthanoid tungstates from La to Eu in their high-temperaturemodification was reported in [7]. This result contradicts to another report [9], whereno high-temperature phase was found. According to numerous reports, the RE2(WO4)3(RE = La–Ho) family has modulated scheelite structure (α-Eu2(WO4)3-structure of sp. gr.C12/c1) at room conditions [12–18]. In the case of Ho2(WO4)3 there were some smallpeaks in its diffraction pattern, which belonged to the γ-Sc2(WO4)3—phase (hydratedat room conditions) [18]. It is generally accepted [19] that 1/3 of all sites within the Lnsublattice in the Ln (Ln = La–Ho) tungstates with the imperfect scheelite-type structureremain unoccupied. The Ln vacancies tend to form an ordered superstructure at lowtemperatures, while statistically disordered structures tend to form upon heating. Xiaoet al. [20] have shown that Ho2(WO4)3 has a monoclinic structure and is not hygroscopic.However, Lahoz et al. [21] reported the presence of a small fraction of the hydrated γ -phase in the structure of Ho2(WO4)3 crystals.
Neither lattice parameters nor atomic coordinates within the crystal structure ofhygroscopic stable trihydrate Ln tungstates have been unequivocally determined so far.According to [9] the heavy Ln (Ln = Y, Er and Yb) tungstates form the trihydrate or-thorhombic Ln2(WO4)3·3H2O at room temperature. On the other hand it was reported thatY2(WO4)3·3H2O trihydrated phase can be indexed with a monoclinic cell (P2/m) [8,22,23].This monoclinic cell can be converted to a pseudo-orthorhombic phase, which is compara-ble to unhydrated orthorhombic phase at room temperature [8]. However, the mechanismresponsible for the phase transition observed remains essentially unclear.
A detailed analysis of the literature data on the crystal structures and lattice parametersof heavy Ln tungstates is presented in Table S1.
An important information about the local structure features around W sites in Lntungstates can be obtained with X-ray absorption fine structure (XANES and EXAFS)spectroscopy through the analysis of precise positions and relative intensities of W L1-pre-edge peak and L3- main edge [24,25] and non-linear curve fitting of coordination shellsin EXAFS Fourier Transforms.
A lot of publications available in the literature describe properties of well-crystallizedLn tungstates prepared by the solid-state synthesis method [6,7,9,19,22]. This method requiresthe use of high calcination temperatures (usually ≥ 1000 ◦C) and long processing times(usually few tens hours) and cannot be used to monitor changes with the crystal structureduring its emergence. In the present study, we apply another synthesis strategy, based onthe calcination of precursor powders synthesized via the coprecipitation of respective saltmixtures [5,23,26,27]. This method is especially suitable to elucidate the stepwise evolutionof overall crystallinity and phase transitions upon the emergence of well-crystallized mate-rial. It is realized by appropriate high-temperature treatments of the initially amorphousprecursors at variable temperatures [28–30].
The aim of this work is thus to elucidate the influence exerted by synthesis conditions(including the type of the Ln3+ cation, calcination temperature, conditions of cooling and
Crystals 2022, 12, 892 3 of 20
subsequent storage time in air) on the long- and short-range order within Ln tungstatesLn2(WO4)3 (Ln = Gd, Dy, Ho, Yb) synthesized via the coprecipitation followed by specifichigh-temperature treatments of the precipitated hydrated precursors. We apply a complexof physico-chemical methods, including synchrotron X-ray powder diffraction, XAFSspectroscopy, Raman and Fourier transform infrared (FT-IR) spectroscopies, supplementedby simultaneous thermal analysis. Earlier, we have successfully shown the potency ofsuch multi-technique structural analysis of lanthanoid hafnates [28], zirconates [29,30],titanates [30], molybdates [31], light and intermediate Ln tungstates [32].
2. Experimental2.1. Synthesis
The lanthanoid tungstates powders Ln2(WO4)3 were prepared by a reverse coprecip-itation method similar to that reported in [23]. The starting chemicals Ln(NO3)3·xH2O(Ln = Gd, Dy, Ho, Yb) (the purity not lower than 99.95–99.99% and x = 4–6 depending ofLn type) and Na2WO4·2H2O were purchased from CHIMMED (Moscow, Russia). TheLn(NO3)3 aqueous solutions (0.1 mol/L) were dropwise poured into the Na2WO4 aqueoussolution (0.15 mol/L) at a rate of 9 mL/min at continuous intense stirring. The solutions ofsalt precursors were mixed in exact ratios required by stoichiometry, i.e., Ln:W equals to1:1.5. The aqueous suspensions obtained were characterized by a nearly neutral pH of 7–8.They were aged for an hour at room temperature to guarantee that the reaction is complete.The precipitates formed were filtered off, washed for several times with distilled water andthen dried for 6 h at 80 ◦C. The dried precursors were then ground in an agate mortar to afine powder and loaded into a muffle furnace LHT 02/16 (Nabertherm GmbH, Lilienthal,Germany). The powders were heated to specific temperatures in the range 500–1000 ◦C inair at a temperature ramp rate of 10 ◦C/min and kept at a constant temperature for 3 h. Theannealed samples were either allowed to slowly cool to room temperature by unpluggingthe furnace or were quickly cooled (quenched) to room temperature by reloading fromthe hot furnace to the open air or a desiccator. The full list of samples studied is given inTable S2.
We adopted the following naming convention to denote samples under study. The firstpart of the codename corresponds to the chemical composition (LnWO, where Ln = Gd, Dy,Ho, Yb). The second term indicates the calcination temperature used for the sample prepa-ration (ranged from 500 ◦C to 1000 ◦C). Auxiliary conditions describing the preparationprotocol are given in the third coding term (desic or repeat). Since the heavy Ln tungstatesare intrinsically hygroscopic, the fourth coding term indicates the duration of their storagein air (from few minutes to 1.5 year). A detailed description of sample preparation andrespective coding is given in Table 1.
Table 1. Synthesis conditions and symbols for Ln2(WO4)3 samples.
No Preparation Protocol Sample Code
1 Ln2(WO4)3 precursors LnWO-prec
2 Ln2(WO4)3 calcined at 1000 ◦C, cooled in the open air LnWO-1000-1dand then stored in air 1 day *
3 Ln2(WO4)3 calcined at 1000 ◦C, cooled in a desiccator LnWO-1000-desic-1dand then stored in air 1 day *
4 Ln2(WO4)3 calcined at 1000 ◦C, cooled in the open LnWO-1000-repeat-1dair, after that repeat heated up to 1000 ◦C, cooled inthe open air and then stored in air 1 day *
* Note: (1) Ln could correspond to either Gd, Dy, Ho or Yb depending on the synthesis protocol; (2) the calcinationtemperature varies depending on the specific example in a range of 500–1000 ◦C; (3) the storage time in air variesdepending on the specific example from few minutes (min), days (d), weeks (w), months (m) to 1.5 years (1.5 y).
Crystals 2022, 12, 892 4 of 20
2.2. Characterization
The atomic emission spectroscopy with inductively coupled plasma (ICP-AES) wasapplied to quantify atomic ratios of metal cations in the freshly prepared precursors. ICP-AES measurements were performed using a Vista-PRO spectrometer (Varian Inc., Palo Alto,CA, USA).
The simultaneous thermal analysis (STA) of the powders, which implied thermo-gravimetry (TG) and differential scanning calorimetry (DSC) was performed with a SDTQ600 (TA Instruments, New Castle, DE, USA) analyzer over the range of temperatures of30–1000 ◦C at a temperature ramp rate of 10 ◦C/min in the air atmosphere. To determinethe water absorption rate all analyzed powders immediately prior to measurements weredried in a desiccator at 200 ◦C for 1 h. The kinetics experiments were conducted in air ata temperature of 25 ± 1 ◦C and relative humidity of (60 ± 5)%. Changes in the mass ofthe samples were monitored with an analytical balance XS205DV (Mettler Toledo LLC,Columbus, OH, USA) with a nominal accuracy of 1·10−5 g.
The preliminary crystallographic analysis of the synthesized powders was done byX-ray powder diffraction (XRD) using a MiniFlex 600 in-lab diffractometer (Rigaku, Tokyo,Japan) with Cu Kα1-radiation (λ = 1.5406 Å). More accurate structural information wasgathered using synchrotron radiation-based X-ray powder diffraction (s-XRD) at the X-rayStructural Analysis beamline (Belok/XSA) of the Kurchatov Synchrotron Radiation Source(NRC Kurchatov Institute, Moscow, Russia) (the electron storage ring with the electron en-ergy of 2.5 GeV and mean current stored of 100 mA). The incident radiation was monochro-mated to 0.8 Å (the photon energy 15,498 eV) using a Si(111) double-crystal monochromator.The X-ray beam spot size was about 400 µm [33]. The synchrotron data acquisition wasperformed at room temperature in the transmission geometry using a SX165 CCD detector(Rayonix LLC, Evanston, IL, USA). The sample-to-detector distance was 150 mm. To extendthe scattering angle range, the detector plane was tilted to 29.5◦. The exposure time was5 min. The polycrystalline reference powder LaB6 NIST SRM 660a was used for the angularscale calibration. The Rietveld full-profile analysis was carried out using the JANA2006software [34].
W L1-edge (12,099.8 eV), L3-edge (10,206.8 eV) and Ln L3-edges (from 7242.8 eV for Gdto 8943.6 eV for Yb) XAFS spectra were measured at the Structural Materials Science beam-line at the Kurchatov Synchrotron Radiation Source (NRC Kurchatov Institute, Moscow,Russia) [35]. The measurements were done in the transmission geometry at room temper-ature. A Si(111) channel-cut monochromator was used for the energy scanning, whichprovided an apparent energy resolution ∆E/E∼10−4. Intensities of the X-ray beams before(I0) and after (I1) the samples were measured with ion chambers with appropriate N2/Armixtures. The k2 weighted normalized EXAFS function χ(k)k2 was Fourier transformedover the k range of 2–14.5 Å−1 (W L3-edge) or 2–11 Å−1 (Ln L3-edges). X-ray AbsorptionNear-Edge Structure (XANES) spectra were processed using the ATHENA software fromthe IFFEFIT data analysis package [36,37]. Extended X-ray Absorption Fine Structure(EXAFS) spectra were analyzed by means of non-linear curve fitting in the k-space usingstandard procedure [38] using the IFFEFIT and VIPER [39] data analysis packages. Photo-electron backscattering amplitudes and phase functions were determined ab initio with theFEFF9 code [40].
The Raman spectra were acquired with an inVia Qontor confocal Raman microscope(Renishaw plc, Wotton-Under-Edge, UK) at λ1 = 532 nm and λ2 = 785 nm over a wavenum-ber range of 50–2700 cm−1 at a spectral resolution of 1 cm−1. A part of measurements wasperformed with a Nicolet iS50 FT-IR spectrometer (Thermo Fisher Scientific Inc., Waltham,MA, USA) with an auxiliary Thermo Scientific iS50 Raman unit (λ = 1064 nm) at roomtemperature over a wavenumber interval of 100–3700 cm−1 at a spectral resolution of4 cm−1.
FT-IR spectra were recorded on a Nicolet iS50 FT-IR spectrometer (Thermo Fisher Scien-tific Inc., Waltham, MA, USA) equipped with a single reflection diamond module (ATR). IRspectra were collected over a wavenumber range of 400–4000 cm−1 at a 4 cm−1 resolution.
Crystals 2022, 12, 892 5 of 20
3. Results and Discussion3.1. ICP-AES Study
According to the synthesis protocol, the precipitates immediately formed as a resultof the reaction between Ln3+ cations and tungstate anions (WO2−
4 ) as soon as reactantswere mixed. ICP-AES measurements confirmed that the Ln : W atomic ratio was closeto 1:1.5 in the as synthesized precursors in an agreement with the synthesis strategy.The residual concentration of sodium from reactants after careful washing did not exceed0.07 wt.%. Thus, the as synthesized precursor powders corresponded to stoichiometryLn2(WO4)3·xH2O and the potential formation of sodium-containing double tungstatesNaLn(WO4)2 can be decisively ruled out.
3.2. STA Study
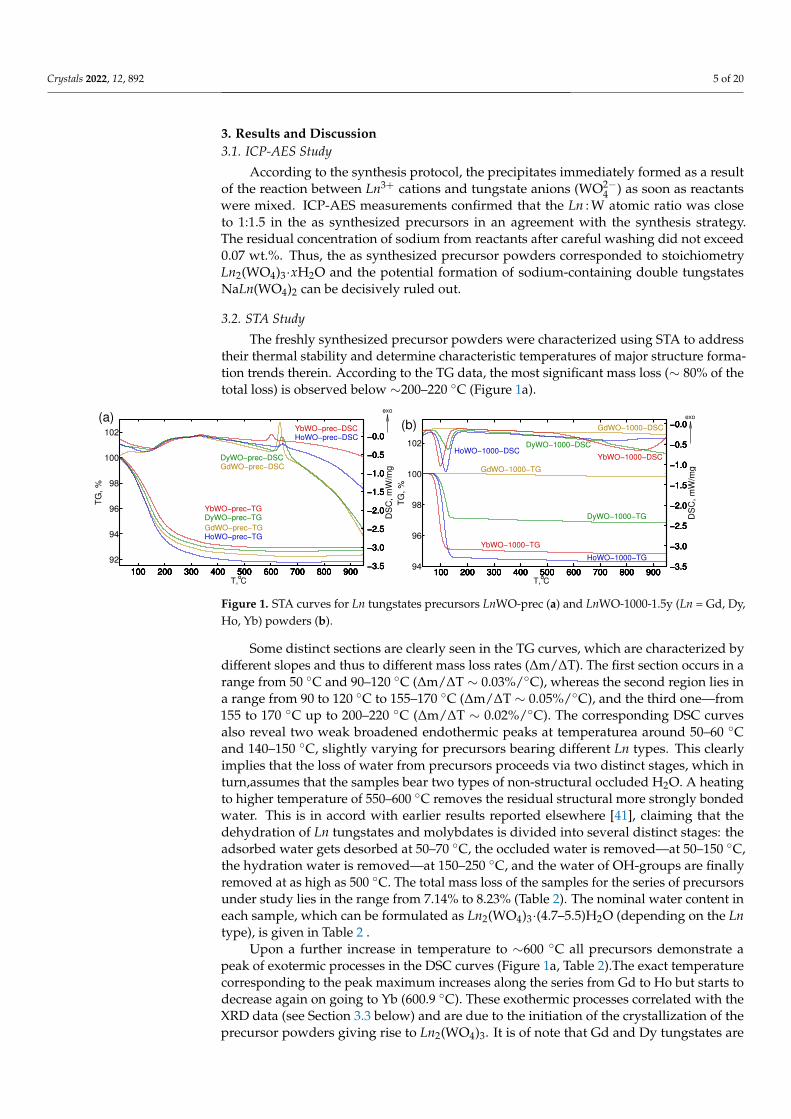
The freshly synthesized precursor powders were characterized using STA to addresstheir thermal stability and determine characteristic temperatures of major structure forma-tion trends therein. According to the TG data, the most significant mass loss (∼ 80% of thetotal loss) is observed below ∼200–220 ◦C (Figure 1a).
100 200 300 400 500 600 700 800 900
92
94
96
98
100
102
TG
, %
T, C°
exo
GdWO−prec−DSC
GdWO−prec−TG
DyWO−prec−DSC
DyWO−prec−TG
HoWO−prec−DSC
HoWO−prec−TG
YbWO−prec−DSC
YbWO−prec−TG
(a)
100 200 300 400 500 600 700 800 900 −3.5
−3.0
−2.5
−2.0
−1.5
−1.0
−0.5
−0.0
100 200 300 400 500 600 700 800 900 −3.5
−3.0
−2.5
−2.0
−1.5
−1.0
−0.5
−0.0
100 200 300 400 500 600 700 800 900 −3.5
−3.0
−2.5
−2.0
−1.5
−1.0
−0.5
−0.0
100 200 300 400 500 600 700 800 900 −3.5
−3.0
−2.5
−2.0
−1.5
−1.0
−0.5
−0.0
DS
C,
mW
/mg
100 200 300 400 500 600 700 800 90094
96
98
100
102
TG
, %
T, C°
exo
GdWO−1000−DSC
GdWO−1000−TG
DyWO−1000−DSC
DyWO−1000−TG
HoWO−1000−DSC
HoWO−1000−TG
YbWO−1000−DSC
YbWO−1000−TG
(b)
100 200 300 400 500 600 700 800 900 −3.5
−3.0
−2.5
−2.0
−1.5
−1.0
−0.5
−0.0
100 200 300 400 500 600 700 800 900 −3.5
−3.0
−2.5
−2.0
−1.5
−1.0
−0.5
−0.0
100 200 300 400 500 600 700 800 900 −3.5
−3.0
−2.5
−2.0
−1.5
−1.0
−0.5
−0.0
100 200 300 400 500 600 700 800 900 −3.5
−3.0
−2.5
−2.0
−1.5
−1.0
−0.5
−0.0
DS
C,
mW
/mg
Figure 1. STA curves for Ln tungstates precursors LnWO-prec (a) and LnWO-1000-1.5y (Ln = Gd, Dy,Ho, Yb) powders (b).
Some distinct sections are clearly seen in the TG curves, which are characterized bydifferent slopes and thus to different mass loss rates (∆m/∆T). The first section occurs in arange from 50 ◦C and 90–120 ◦C (∆m/∆T ∼ 0.03%/◦C), whereas the second region lies ina range from 90 to 120 ◦C to 155–170 ◦C (∆m/∆T ∼ 0.05%/◦C), and the third one—from155 to 170 ◦C up to 200–220 ◦C (∆m/∆T ∼ 0.02%/◦C). The corresponding DSC curvesalso reveal two weak broadened endothermic peaks at temperaturea around 50–60 ◦Cand 140–150 ◦C, slightly varying for precursors bearing different Ln types. This clearlyimplies that the loss of water from precursors proceeds via two distinct stages, which inturn,assumes that the samples bear two types of non-structural occluded H2O. A heatingto higher temperature of 550–600 ◦C removes the residual structural more strongly bondedwater. This is in accord with earlier results reported elsewhere [41], claiming that thedehydration of Ln tungstates and molybdates is divided into several distinct stages: theadsorbed water gets desorbed at 50–70 ◦C, the occluded water is removed—at 50–150 ◦C,the hydration water is removed—at 150–250 ◦C, and the water of OH-groups are finallyremoved at as high as 500 ◦C. The total mass loss of the samples for the series of precursorsunder study lies in the range from 7.14% to 8.23% (Table 2). The nominal water content ineach sample, which can be formulated as Ln2(WO4)3·(4.7–5.5)H2O (depending on the Lntype), is given in Table 2 .
Upon a further increase in temperature to ∼600 ◦C all precursors demonstrate apeak of exotermic processes in the DSC curves (Figure 1a, Table 2).The exact temperaturecorresponding to the peak maximum increases along the series from Gd to Ho but starts todecrease again on going to Yb (600.9 ◦C). These exothermic processes correlated with theXRD data (see Section 3.3 below) and are due to the initiation of the crystallization of theprecursor powders giving rise to Ln2(WO4)3. It is of note that Gd and Dy tungstates are
Crystals 2022, 12, 892 6 of 20
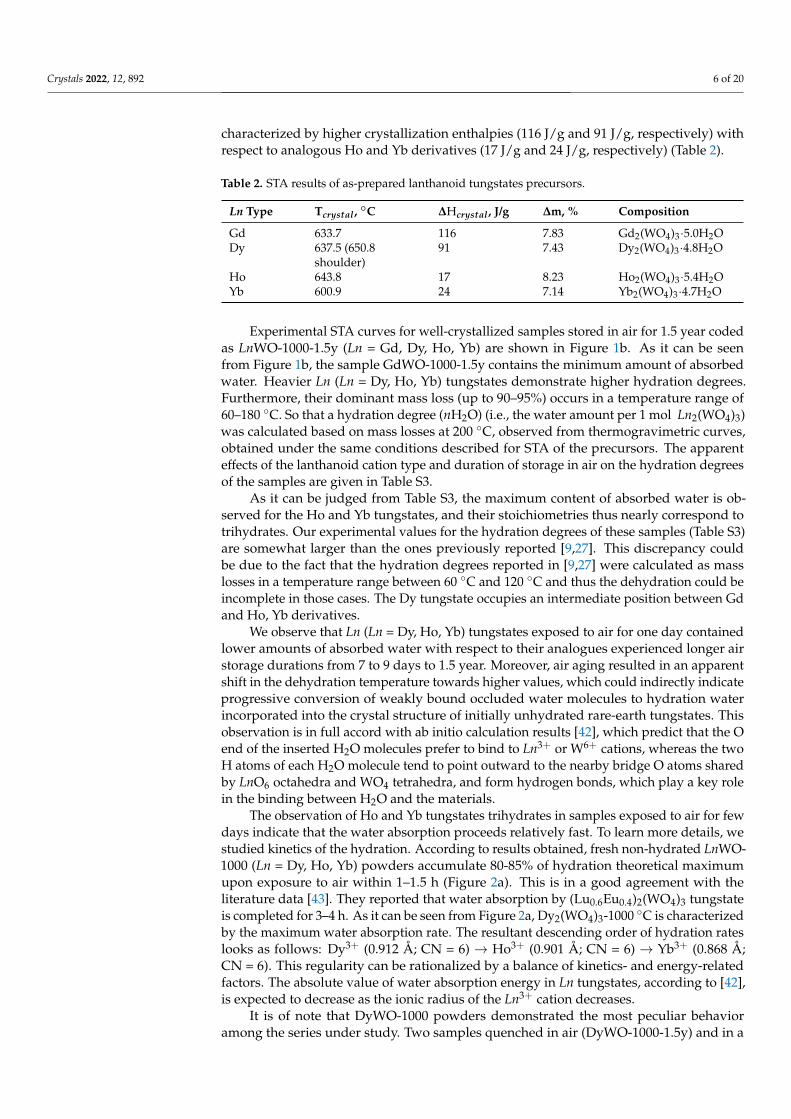
characterized by higher crystallization enthalpies (116 J/g and 91 J/g, respectively) withrespect to analogous Ho and Yb derivatives (17 J/g and 24 J/g, respectively) (Table 2).
Table 2. STA results of as-prepared lanthanoid tungstates precursors.
Ln Type Tcrystal , ◦C ∆Hcrystal , J/g ∆m, % Composition
Gd 633.7 116 7.83 Gd2(WO4)3·5.0H2ODy 637.5 (650.8 91 7.43 Dy2(WO4)3·4.8H2O
shoulder)Ho 643.8 17 8.23 Ho2(WO4)3·5.4H2OYb 600.9 24 7.14 Yb2(WO4)3·4.7H2O
Experimental STA curves for well-crystallized samples stored in air for 1.5 year codedas LnWO-1000-1.5y (Ln = Gd, Dy, Ho, Yb) are shown in Figure 1b. As it can be seenfrom Figure 1b, the sample GdWO-1000-1.5y contains the minimum amount of absorbedwater. Heavier Ln (Ln = Dy, Ho, Yb) tungstates demonstrate higher hydration degrees.Furthermore, their dominant mass loss (up to 90–95%) occurs in a temperature range of60–180 ◦C. So that a hydration degree (nH2O) (i.e., the water amount per 1 mol Ln2(WO4)3)was calculated based on mass losses at 200 ◦C, observed from thermogravimetric curves,obtained under the same conditions described for STA of the precursors. The apparenteffects of the lanthanoid cation type and duration of storage in air on the hydration degreesof the samples are given in Table S3.
As it can be judged from Table S3, the maximum content of absorbed water is ob-served for the Ho and Yb tungstates, and their stoichiometries thus nearly correspond totrihydrates. Our experimental values for the hydration degrees of these samples (Table S3)are somewhat larger than the ones previously reported [9,27]. This discrepancy couldbe due to the fact that the hydration degrees reported in [9,27] were calculated as masslosses in a temperature range between 60 ◦C and 120 ◦C and thus the dehydration could beincomplete in those cases. The Dy tungstate occupies an intermediate position between Gdand Ho, Yb derivatives.
We observe that Ln (Ln = Dy, Ho, Yb) tungstates exposed to air for one day containedlower amounts of absorbed water with respect to their analogues experienced longer airstorage durations from 7 to 9 days to 1.5 year. Moreover, air aging resulted in an apparentshift in the dehydration temperature towards higher values, which could indirectly indicateprogressive conversion of weakly bound occluded water molecules to hydration waterincorporated into the crystal structure of initially unhydrated rare-earth tungstates. Thisobservation is in full accord with ab initio calculation results [42], which predict that the Oend of the inserted H2O molecules prefer to bind to Ln3+ or W6+ cations, whereas the twoH atoms of each H2O molecule tend to point outward to the nearby bridge O atoms sharedby LnO6 octahedra and WO4 tetrahedra, and form hydrogen bonds, which play a key rolein the binding between H2O and the materials.
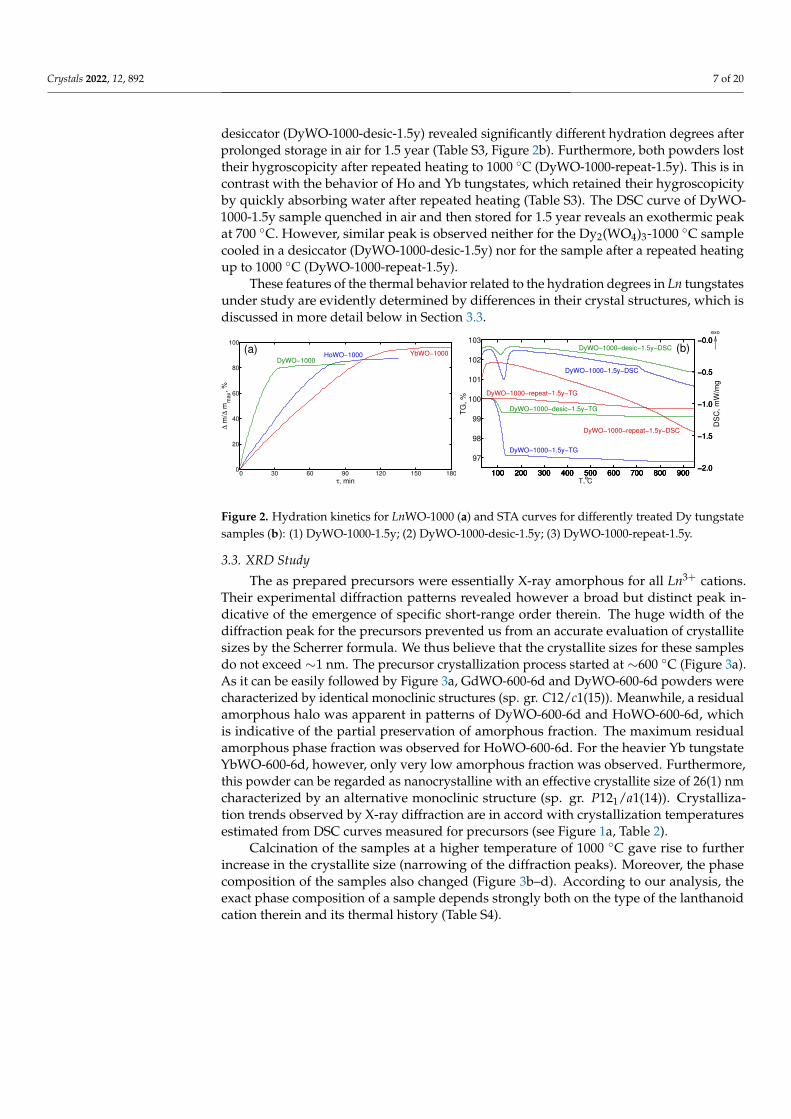
The observation of Ho and Yb tungstates trihydrates in samples exposed to air for fewdays indicate that the water absorption proceeds relatively fast. To learn more details, westudied kinetics of the hydration. According to results obtained, fresh non-hydrated LnWO-1000 (Ln = Dy, Ho, Yb) powders accumulate 80-85% of hydration theoretical maximumupon exposure to air within 1–1.5 h (Figure 2a). This is in a good agreement with theliterature data [43]. They reported that water absorption by (Lu0.6Eu0.4)2(WO4)3 tungstateis completed for 3–4 h. As it can be seen from Figure 2a, Dy2(WO4)3-1000 ◦C is characterizedby the maximum water absorption rate. The resultant descending order of hydration rateslooks as follows: Dy3+ (0.912 Å; CN = 6) → Ho3+ (0.901 Å; CN = 6) → Yb3+ (0.868 Å;CN = 6). This regularity can be rationalized by a balance of kinetics- and energy-relatedfactors. The absolute value of water absorption energy in Ln tungstates, according to [42],is expected to decrease as the ionic radius of the Ln3+ cation decreases.
It is of note that DyWO-1000 powders demonstrated the most peculiar behavioramong the series under study. Two samples quenched in air (DyWO-1000-1.5y) and in a
Crystals 2022, 12, 892 7 of 20
desiccator (DyWO-1000-desic-1.5y) revealed significantly different hydration degrees afterprolonged storage in air for 1.5 year (Table S3, Figure 2b). Furthermore, both powders losttheir hygroscopicity after repeated heating to 1000 ◦C (DyWO-1000-repeat-1.5y). This is incontrast with the behavior of Ho and Yb tungstates, which retained their hygroscopicityby quickly absorbing water after repeated heating (Table S3). The DSC curve of DyWO-1000-1.5y sample quenched in air and then stored for 1.5 year reveals an exothermic peakat 700 ◦C. However, similar peak is observed neither for the Dy2(WO4)3-1000 ◦C samplecooled in a desiccator (DyWO-1000-desic-1.5y) nor for the sample after a repeated heatingup to 1000 ◦C (DyWO-1000-repeat-1.5y).
These features of the thermal behavior related to the hydration degrees in Ln tungstatesunder study are evidently determined by differences in their crystal structures, which isdiscussed in more detail below in Section 3.3.
∆ m
/∆ m
max,
%
τ, min0 30 60 90 120 150 180
0
20
40
60
80
100
DyWO−1000HoWO−1000 YbWO−1000(a)
100 200 300 400 500 600 700 800 900
97
98
99
100
101
102
103
TG
, %
T, C°
exo
DyWO−1000−1.5y−DSC
DyWO−1000−1.5y−TG
DyWO−1000−desic−1.5y−DSC
DyWO−1000−desic−1.5y−TG
DyWO−1000−repeat−1.5y−DSC
DyWO−1000−repeat−1.5y−TG
(b)
100 200 300 400 500 600 700 800 900 −2.0
−1.5
−1.0
−0.5
−0.0
100 200 300 400 500 600 700 800 900 −2.0
−1.5
−1.0
−0.5
−0.0
100 200 300 400 500 600 700 800 900 −2.0
−1.5
−1.0
−0.5
−0.0
DS
C,
mW
/mg
Figure 2. Hydration kinetics for LnWO-1000 (a) and STA curves for differently treated Dy tungstatesamples (b): (1) DyWO-1000-1.5y; (2) DyWO-1000-desic-1.5y; (3) DyWO-1000-repeat-1.5y.
3.3. XRD Study
The as prepared precursors were essentially X-ray amorphous for all Ln3+ cations.Their experimental diffraction patterns revealed however a broad but distinct peak in-dicative of the emergence of specific short-range order therein. The huge width of thediffraction peak for the precursors prevented us from an accurate evaluation of crystallitesizes by the Scherrer formula. We thus believe that the crystallite sizes for these samplesdo not exceed ∼1 nm. The precursor crystallization process started at ∼600 ◦C (Figure 3a).As it can be easily followed by Figure 3a, GdWO-600-6d and DyWO-600-6d powders werecharacterized by identical monoclinic structures (sp. gr. C12/c1(15)). Meanwhile, a residualamorphous halo was apparent in patterns of DyWO-600-6d and HoWO-600-6d, whichis indicative of the partial preservation of amorphous fraction. The maximum residualamorphous phase fraction was observed for HoWO-600-6d. For the heavier Yb tungstateYbWO-600-6d, however, only very low amorphous fraction was observed. Furthermore,this powder can be regarded as nanocrystalline with an effective crystallite size of 26(1) nmcharacterized by an alternative monoclinic structure (sp. gr. P121/a1(14)). Crystalliza-tion trends observed by X-ray diffraction are in accord with crystallization temperaturesestimated from DSC curves measured for precursors (see Figure 1a, Table 2).
Calcination of the samples at a higher temperature of 1000 ◦C gave rise to furtherincrease in the crystallite size (narrowing of the diffraction peaks). Moreover, the phasecomposition of the samples also changed (Figure 3b–d). According to our analysis, theexact phase composition of a sample depends strongly both on the type of the lanthanoidcation therein and its thermal history (Table S4).

Crystals 2022, 12, 892 8 of 20
10 20 30 40 50 60 70 80 90 100
Inte
nsity, a.u
.
2θ,°
GdWO−600
DyWO−600
HoWO−600
YbWO−600
C12/c1
P121/a1
(a)
5 10 15 20 25 30 35 40 45
Inte
nsity, a.u
.
2θ,°
DyWO−1000−11d
C12/c1P121/a1
(b)
5 10 15 20 25 30 35 40 45
Inte
nsity, a.u
.
2θ,°
HoWO−1000−9d
P121/a1
(c)
5 10 15 20 25 30 35 40 45
Inte
nsity, a.u
.
2θ,°
YbWO−1000−13d
PbcnP121/a1
(d)
Figure 3. XRD patterns of LnWO-600-6d (Cu Kα) (a) and s- XRD patterns (λ = 0.8 Å) of DyWO-1000-11d (b), HoWO-1000-9d (c), YbWO-1000-13d (d).
All hydrated heavy Ln tungstates (Ln = Dy, Ho, Yb) powders are characterized by themonoclinic structure (sp. gr. P121/a1(14)) similar to that identified and studied in detail forIn2(WO4)3 [44]. However, this conclusion contradicts to other literature data claiming thattrihydrated form of heavy Ln tungstates Ln2(WO4)3·3H2O has either orthorhombic [9] ormonoclinic structure (sp. gr. P2/m) [8,22,23]. It is worth noting that the cell parameters weobtained (Table S4) agree well with data reported by other authors [8,23].
As it can be seen from Table S4, the annealing of precursors at 1000 ◦C gives rise to theformation of single-phase samples for Gd2(WO4)3 and Ho2(WO4)3, but two-phase mixturesare afforded for Dy2(WO4)3 and Yb2(WO4)3.
In the case of Gd2(WO4)3, both the freshly prepared sample and the one after aprolonged storage in air (1.5 year) contain only the monoclinic structure (sp. gr. C12/c1)with only minute modifications related to the air storage expressed as a some decrease inthe apparent crystallite size. The best-fit atomic coordinates and isothermal temperaturefactors for the monoclinic structure (sp. gr. C12/c1) of well-crystallized Gd2(WO4)3 andDy2(WO4)3 prepared by calcination at 1000◦ C from Rietveld refinements were reported byus earlier [32]. A sketch of the monoclinic crystal structure (sp. gr. C12/c1) in a polyhedralrepresentation is shown in Figure 4a. This crystal structure type is dominant for lightlanthanoid tungstates [12–18].
A complex evolution of crystal structures was observed for the two-phase samples.Dy2(WO4)3 can be regarded as a boundary compounds demonstrating the C12/c1(15)→P121/a1(14) phase transition (Figure S1). As it can be seen from Table S4, the fraction ofthe monoclinic structure (sp. gr. P121/a1(14)) increases in the course of the air storage.Furthermore, the sample DyWO-1000-1.5y prepared by quenching in air contained themonoclinic phase (sp. gr. P121/a1(14)) in an amount several fold higher than that in theDyWO-1000-desic-1.5y sample quenched in a desiccator, despite identically long post-synthesis exposure to air.
The repeated annealing of both samples to 1000 ◦C gave rise to single-phase pow-ders with the monoclinic structure (sp. gr. C12/c1(15)), i.e., initiated the P121/a1(14)→C12/c1(15) phase transition (Table S4). Therefore, we may associate the exothermic DSCpeak around 700 ◦C for the sample DyWO-1000-1.5y with the P121/a1(14)→ C12/c1(15)phase transition (Figure 2b). A combined analysis of X-ray diffraction (Table S4) and STA

Crystals 2022, 12, 892 9 of 20
results (Table S3) indicates that it is the monoclinic structure (sp. gr. P121/a1(14)) that isexclusively responsible for the intrinsic hygroscopicity of the heavy lanthanoid tungstates.The apparent hydration degree for DyWO-1000-1.5y corrected for the experimental fractionof the P121/a1 phase is 3.4, which is reasonably close to respective values in Ho and Ybtungstate trihydrates (Table S3).
(a) (c)
(b)
Figure 4. (a) Polyhedral representation of the monoclinic structure (sp. gr. C12/c1) encountered asthe main phase in lanthanoid tungstates Ln2(WO4)3 (Ln = Gd, Dy). The lanthanoid Ln3+ cations areeight-fold coordinated (shown in blue). The W6+ cations form WO4 tetrahedra (shown in grey). Allthe oxide O2− anions are shown in red; (b) Polyhedral representation of the monoclinic structure(sp. gr. P121/a1) encountered as the main phase in lanthanoid tungstates Ln2(WO4)3 (Ln = Ho, Yb).The lanthanoid Ln3+ cations are six-fold coordinated (shown in blue). The W6+ cations form WO4
tetrahedra (shown in grey). All the oxide O2− anions are shown in red. Additional oxygen atomsof hydration H2O molecules are shown in pink; (c) Polyhedral representation of the orthorhombicstructure (sp. gr. Pbcn) encountered as an admixture phase in Yb2(WO4)3. The Yb3+ cations aresix-fold coordinated (shown in blue). The W6+ cations form WO4 tetrahedra (shown in grey). Theoxide O2− anions are shown in red.
The Ho2(WO4)3 samples contain predominantly the monoclinic phase (sp. gr. P121/a1)corresponding to a hydrated holmium tungstate with approximately 3.0–3.5 hydrationwater molecules per formula unit. This was not altered to any significant extent by aprolonged storage in air (1.5 year). Though the storage resulted in a small decrease both incell parameters and volume as well as in an apparent decrease in a crystallite size. Bothquenching in air and in a desiccator afforded samples with the same phase compositions.The quenching, having no effect on the phase composition, led to some decrease in the cellparameters, its volume, and the crystallite size (Table S4).
We tried to refine the atomic coordinates in the monoclinic phase (sp. gr. P121/a1)of holmium tungstate using crystallographic parameters for anhydrous In2(WO4)3 [44].Positions of the cations were allowed to vary with identical thermal parameters. Positionsof the oxygen atoms were refined with geometrical constraints to yield reasonable Ho-O and

Crystals 2022, 12, 892 10 of 20
W-O bond lengths. At last stages of the refinement, six extra oxygen atoms per asymmetricunit corresponding to hydration water molecules were placed into voids of the crystalstructure. The list of best-fit coordinates is given in Table S5. Polyhedral representation ofthe monoclinic structure (sp. gr. P121/a1) encountered as the main phase in Ho2(WO4)3 isshown in Figure 4b.
In the case of Yb, a two-phase sample YbWO-1000-13d was afforded simultaneouslycontaining monoclinic (sp. gr. P121/a1(14)) tungstate trihydrate and an orthorhombicphase (sp. gr. Pbcn(60)) typical for the unhydrated form of heavy Ln tungstates (Table S4).As it can be seen from Table S4, the fraction of the monoclinic structure (sp. gr. P121/a1(14))increases in the course of air storage, which ultimately results in a complete disappearanceof the orthorhombic phase (sp. gr. Pbcn(60)) (Figure S2). Powders quenched in air and ina desiccator and then aged in air were characterized by similar phase compositions andcell parameters (Table S4). Polyhedral representation of the orthorhombic structure (sp. gr.Pbcn) encountered as an admixture phase in Yb2(WO4)3 is shown in Figure 4c.
The powder diffraction results can be thus summarized as follows. Within the samecrystal structure type (the same syngony and space group) unit cell parameters and volumeregularly decrease with a nominal decrease in the Ln3+ cation radius. For the two-phasesamples, the fraction of the monoclinic phase (sp. gr. P121/a1(14)) increases as air exposureduration increases. At that the unit cell parameters and volume also tend to decrease. Thedecrease in the unit cell volume upon progressive hydration corresponds to earlier reporteddata [45]. Additionally, the aging is accompanied by a decrease in the apparent crystallitesize (Table S4).
It is important to note that both orthorhombic structure (sp. gr. Pbcn) and monoclinicstructure (sp. gr. P121/a1) are less dense as compared to the monoclinic structure (sp.gr. C12/c1) and contains some structural voids accessible for water molecules, whichcan be considered as a driving force of the hydration (see above Section 3.2 and belowSection 3.5.2). The two former structures are closely related to each other. The monoclinicstructure (sp. gr. P121/a1) can be regarded as a lower-symmetry superstructure of theparent orthorhombic structure (sp. gr. Pbcn) resulted from a loss of one two-fold symmetryaxis. We speculate that the orthorhombic phase is observed for heavier lanthanoid tungsatesat an intermediate stage of hydration, whereas the full hydration stabilizes the monoclinicstructure (sp. gr. P121/a1).
3.4. X-ray Absorption Spectroscopy
The crystal structure as imaged by diffraction corresponds to an ensemble-averagedatomic configurations. Furthermore, the local structure probed by other techniques coulddiffer drastically from the crystallographic data. We used local structure-sensitive X-rayabsorption fine structure (XAFS) spectroscopy to elucidate the local atomic environment ofW and Ln atoms within the Ln tungstates under study and compare them with diffraction-extracted crystallographic parameters.
3.4.1. W L1- and L3-Edges XAFS Study
The analysis of XAFS spectra at the W L1- and L3-edges is commonly applied to gatherinformation on the local environment symmetry, coordination polyhedra, and oxidationstate of the W species in various complex oxide compounds due to unique properties ofthis technique [24,25].
W L1-Edge XANES
Figure 5a shows the W L1-edge XANES spectra of hydrated well-crystallized Lntungstate powders. All the spectra manifest a main-edge (the dipole-allowed 2s → 6pelectron transitions) and a sharp pre-edge peak (the dipole forbidden 2s → 5d electrontransitions) gathering a non-zero intensity due to the p− d hybridization [24]. The exactposition (12,102 eV) and intensity of the pre-edge peak reveal no statistically significantdependence on the Ln type. They are also similar to those in Na2WO4·2H2O (the experi-

Crystals 2022, 12, 892 11 of 20
mental position is 12,103 eV), which is a reference sample with tetrahedral WO4 units [24].This indicates the presence of undisturbed tetrahedral configurations WO4 in the studiedLn tungstates regardless of the Ln, i.e., their crystal structure type (see Table S4). As the Lnatomic number increases, the position of the main absorption maximum in the W L1-edgespectra shifts towards higher energies (from 12,131.9 eV for Gd2(WO4)3 to 12,135.9 eV forYb2(WO4)3) (Figure 5a), which could be due to a shift in the exact position of the Fermilevel for heavy Ln tungstates due to an increase in the number of 5d electrons localized inhybridized p− d orbitals.
12,050 12,100 12,150 12,200
a) W L1-edge XANES
Yb
Ho
Dy
Gd
Na
m(E)
, arb
.uni
ts
E, eV10,175 10,200 10,225 10,250 10,275
b) W L3-edge XANES
m(E)
, arb
.uni
ts
E, eV
NaGdDyHoYb
0 1 2 3 4 5 6
Gd
Na
Dy
|FT(c(k)k2 )|,
Å-3
c) W-O W L3-edge EXAFS
R-d, Å
Ho
Figure 5. W L1-(a) and L3-edge (b) XANES spectra and W L3-edge EXAFS FT moduli (c) of hydratedLnWO-1000-1.5y powders and Na2WO4·2H2O (reference sample).
W L3-Edge XANES
Figure 5b displays the W L3-edge XANES spectra of hydrated well-crystallized Lntungstate powders along with reference sample Na2WO4·2H2O. As it becomes evidentfrom Figure 5b, the near-edge spectra reveal a common well-resolved narrow and intenseasymmetric peak due to the dipole-allowed electron transitions 2p3/2 → 5d. The spectralparameters of the white line peak for all Ln2(WO4)3 samples under study are virtuallyidentical to each other for all the Ln types in the study and are again close to those in theNa2WO4·2H2O reference (10,209 eV). This confirms the earlier suggestion that undisturbedWO4 tetrahedra predominate as major structural units in all studied Ln2(WO4)3 samples,irrespective of their crystal structure type (see Table S4). An evident weakening of the right-hand shoulder of the white line (at about 10,218 eV) for heavier lanthanoids (that is wellpronounced on going from the spectrum of gadolinium compound to that of dysprosium)can be due to a change in the effective coordination geometry of the WO4 tetrahedral unitsaccompanying the transformation of the Ln2(WO4)3 structure type from one monoclinic(sp. gr. C12/c1(15)) in Gd2(WO4)3 to another monoclinic phase (sp. gr. P121/a1(14)) inheavier tungstates Ln2(WO4)3 (Ln = Dy, Ho, Yb).
W L3-Edge EXAFS
The Fourier transform moduli of W L3-edge EXAFS spectra for hydrated well-crystallizedLnWO-1000-1.5y samples are shown in Figures 5c and S3. The W L3-edge EXAFS FT moduliare dominated by a single intense peak at 1.4 Å, assigned to the W-O coordination shell (CS)formed by WO4 tetrahedra. Longer-distance CSs are characterized by negligible intensities.This assumes that the short-range atomic order of heavy metal ions around the W site israther irregular in the studied LnWO-1000-1.5y samples. Positions of FT modulus peaksshown in Figure 5c are apparently shorter than real interatomic distances due to the phaseshift associated with the photoelectron backscattering. Real bond lengths obtained fromEXAFS non-linear curve-fitting are given in Table 3.
Crystals 2022, 12, 892 12 of 20
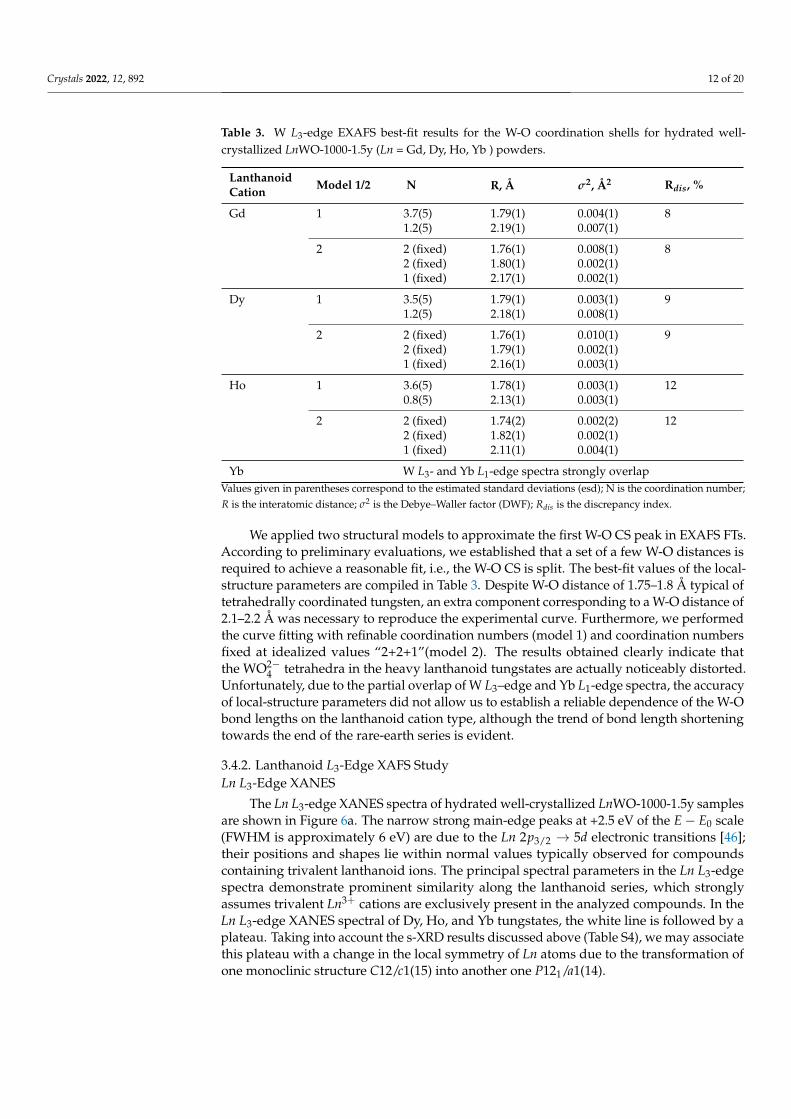
Table 3. W L3-edge EXAFS best-fit results for the W-O coordination shells for hydrated well-crystallized LnWO-1000-1.5y (Ln = Gd, Dy, Ho, Yb ) powders.
Lanthanoid Model 1/2 N R, Å σ2, Å2 Rdis, %Cation
Gd 1 3.7(5) 1.79(1) 0.004(1) 81.2(5) 2.19(1) 0.007(1)
2 2 (fixed) 1.76(1) 0.008(1) 82 (fixed) 1.80(1) 0.002(1)1 (fixed) 2.17(1) 0.002(1)
Dy 1 3.5(5) 1.79(1) 0.003(1) 91.2(5) 2.18(1) 0.008(1)
2 2 (fixed) 1.76(1) 0.010(1) 92 (fixed) 1.79(1) 0.002(1)1 (fixed) 2.16(1) 0.003(1)
Ho 1 3.6(5) 1.78(1) 0.003(1) 120.8(5) 2.13(1) 0.003(1)
2 2 (fixed) 1.74(2) 0.002(2) 122 (fixed) 1.82(1) 0.002(1)1 (fixed) 2.11(1) 0.004(1)
Yb W L3- and Yb L1-edge spectra strongly overlapValues given in parentheses correspond to the estimated standard deviations (esd); N is the coordination number;R is the interatomic distance; σ2 is the Debye–Waller factor (DWF); Rdis is the discrepancy index.
We applied two structural models to approximate the first W-O CS peak in EXAFS FTs.According to preliminary evaluations, we established that a set of a few W-O distances isrequired to achieve a reasonable fit, i.e., the W-O CS is split. The best-fit values of the local-structure parameters are compiled in Table 3. Despite W-O distance of 1.75–1.8 Å typical oftetrahedrally coordinated tungsten, an extra component corresponding to a W-O distance of2.1–2.2 Å was necessary to reproduce the experimental curve. Furthermore, we performedthe curve fitting with refinable coordination numbers (model 1) and coordination numbersfixed at idealized values “2+2+1”(model 2). The results obtained clearly indicate thatthe WO2−
4 tetrahedra in the heavy lanthanoid tungstates are actually noticeably distorted.Unfortunately, due to the partial overlap of W L3–edge and Yb L1-edge spectra, the accuracyof local-structure parameters did not allow us to establish a reliable dependence of the W-Obond lengths on the lanthanoid cation type, although the trend of bond length shorteningtowards the end of the rare-earth series is evident.
3.4.2. Lanthanoid L3-Edge XAFS StudyLn L3-Edge XANES
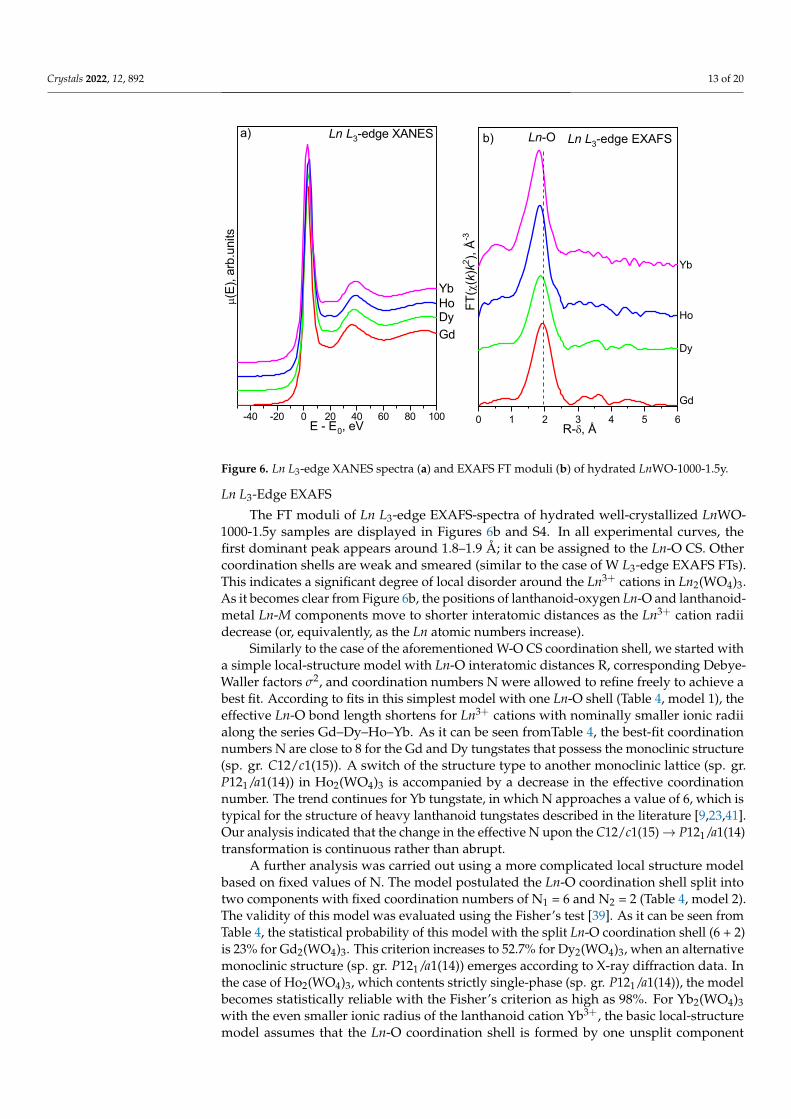
The Ln L3-edge XANES spectra of hydrated well-crystallized LnWO-1000-1.5y samplesare shown in Figure 6a. The narrow strong main-edge peaks at +2.5 eV of the E− E0 scale(FWHM is approximately 6 eV) are due to the Ln 2p3/2 → 5d electronic transitions [46];their positions and shapes lie within normal values typically observed for compoundscontaining trivalent lanthanoid ions. The principal spectral parameters in the Ln L3-edgespectra demonstrate prominent similarity along the lanthanoid series, which stronglyassumes trivalent Ln3+ cations are exclusively present in the analyzed compounds. In theLn L3-edge XANES spectral of Dy, Ho, and Yb tungstates, the white line is followed by aplateau. Taking into account the s-XRD results discussed above (Table S4), we may associatethis plateau with a change in the local symmetry of Ln atoms due to the transformation ofone monoclinic structure C12/c1(15) into another one P121/a1(14).
Crystals 2022, 12, 892 13 of 20
-40 -20 0 20 40 60 80 100
a) Ln L3-edge XANES
YbHoDyGd
m(E)
, arb
.uni
ts
E - E0, eV 0 1 2 3 4 5 6
Gd
Dy
Ho
Yb
b)
R-d, Å
FT(c
(k)k
2 ), Å-3
Ln-O Ln L3-edge EXAFS
Figure 6. Ln L3-edge XANES spectra (a) and EXAFS FT moduli (b) of hydrated LnWO-1000-1.5y.
Ln L3-Edge EXAFS
The FT moduli of Ln L3-edge EXAFS-spectra of hydrated well-crystallized LnWO-1000-1.5y samples are displayed in Figures 6b and S4. In all experimental curves, thefirst dominant peak appears around 1.8–1.9 Å; it can be assigned to the Ln-O CS. Othercoordination shells are weak and smeared (similar to the case of W L3-edge EXAFS FTs).This indicates a significant degree of local disorder around the Ln3+ cations in Ln2(WO4)3.As it becomes clear from Figure 6b, the positions of lanthanoid-oxygen Ln-O and lanthanoid-metal Ln-M components move to shorter interatomic distances as the Ln3+ cation radiidecrease (or, equivalently, as the Ln atomic numbers increase).
Similarly to the case of the aforementioned W-O CS coordination shell, we started witha simple local-structure model with Ln-O interatomic distances R, corresponding Debye-Waller factors σ2, and coordination numbers N were allowed to refine freely to achieve abest fit. According to fits in this simplest model with one Ln-O shell (Table 4, model 1), theeffective Ln-O bond length shortens for Ln3+ cations with nominally smaller ionic radiialong the series Gd–Dy–Ho–Yb. As it can be seen fromTable 4, the best-fit coordinationnumbers N are close to 8 for the Gd and Dy tungstates that possess the monoclinic structure(sp. gr. C12/c1(15)). A switch of the structure type to another monoclinic lattice (sp. gr.P121/a1(14)) in Ho2(WO4)3 is accompanied by a decrease in the effective coordinationnumber. The trend continues for Yb tungstate, in which N approaches a value of 6, which istypical for the structure of heavy lanthanoid tungstates described in the literature [9,23,41].Our analysis indicated that the change in the effective N upon the C12/c1(15)→ P121/a1(14)transformation is continuous rather than abrupt.
A further analysis was carried out using a more complicated local structure modelbased on fixed values of N. The model postulated the Ln-O coordination shell split intotwo components with fixed coordination numbers of N1 = 6 and N2 = 2 (Table 4, model 2).The validity of this model was evaluated using the Fisher’s test [39]. As it can be seen fromTable 4, the statistical probability of this model with the split Ln-O coordination shell (6 + 2)is 23% for Gd2(WO4)3. This criterion increases to 52.7% for Dy2(WO4)3, when an alternativemonoclinic structure (sp. gr. P121/a1(14)) emerges according to X-ray diffraction data. Inthe case of Ho2(WO4)3, which contents strictly single-phase (sp. gr. P121/a1(14)), the modelbecomes statistically reliable with the Fisher’s criterion as high as 98%. For Yb2(WO4)3with the even smaller ionic radius of the lanthanoid cation Yb3+, the basic local-structuremodel assumes that the Ln-O coordination shell is formed by one unsplit component
Crystals 2022, 12, 892 14 of 20
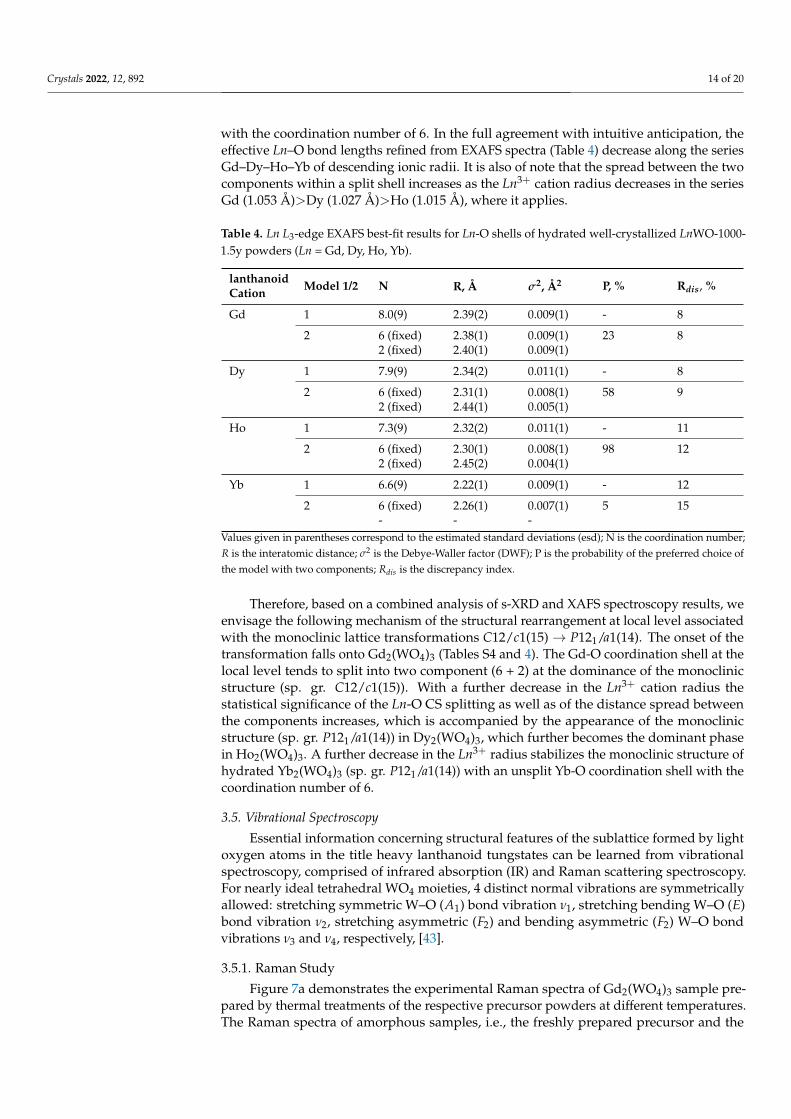
with the coordination number of 6. In the full agreement with intuitive anticipation, theeffective Ln–O bond lengths refined from EXAFS spectra (Table 4) decrease along the seriesGd–Dy–Ho–Yb of descending ionic radii. It is also of note that the spread between the twocomponents within a split shell increases as the Ln3+ cation radius decreases in the seriesGd (1.053 Å)>Dy (1.027 Å)>Ho (1.015 Å), where it applies.
Table 4. Ln L3-edge EXAFS best-fit results for Ln-O shells of hydrated well-crystallized LnWO-1000-1.5y powders (Ln = Gd, Dy, Ho, Yb).
lanthanoid Model 1/2 N R, Å σ2, Å2 P, % Rdis, %Cation
Gd 1 8.0(9) 2.39(2) 0.009(1) - 8
2 6 (fixed) 2.38(1) 0.009(1) 23 82 (fixed) 2.40(1) 0.009(1)
Dy 1 7.9(9) 2.34(2) 0.011(1) - 8
2 6 (fixed) 2.31(1) 0.008(1) 58 92 (fixed) 2.44(1) 0.005(1)
Ho 1 7.3(9) 2.32(2) 0.011(1) - 11
2 6 (fixed) 2.30(1) 0.008(1) 98 122 (fixed) 2.45(2) 0.004(1)
Yb 1 6.6(9) 2.22(1) 0.009(1) - 12
2 6 (fixed) 2.26(1) 0.007(1) 5 15- - -
Values given in parentheses correspond to the estimated standard deviations (esd); N is the coordination number;R is the interatomic distance; σ2 is the Debye-Waller factor (DWF); P is the probability of the preferred choice ofthe model with two components; Rdis is the discrepancy index.
Therefore, based on a combined analysis of s-XRD and XAFS spectroscopy results, weenvisage the following mechanism of the structural rearrangement at local level associatedwith the monoclinic lattice transformations C12/c1(15)→ P121/a1(14). The onset of thetransformation falls onto Gd2(WO4)3 (Tables S4 and 4). The Gd-O coordination shell at thelocal level tends to split into two component (6 + 2) at the dominance of the monoclinicstructure (sp. gr. C12/c1(15)). With a further decrease in the Ln3+ cation radius thestatistical significance of the Ln-O CS splitting as well as of the distance spread betweenthe components increases, which is accompanied by the appearance of the monoclinicstructure (sp. gr. P121/a1(14)) in Dy2(WO4)3, which further becomes the dominant phasein Ho2(WO4)3. A further decrease in the Ln3+ radius stabilizes the monoclinic structure ofhydrated Yb2(WO4)3 (sp. gr. P121/a1(14)) with an unsplit Yb-O coordination shell with thecoordination number of 6.
3.5. Vibrational Spectroscopy
Essential information concerning structural features of the sublattice formed by lightoxygen atoms in the title heavy lanthanoid tungstates can be learned from vibrationalspectroscopy, comprised of infrared absorption (IR) and Raman scattering spectroscopy.For nearly ideal tetrahedral WO4 moieties, 4 distinct normal vibrations are symmetricallyallowed: stretching symmetric W–O (A1) bond vibration ν1, stretching bending W–O (E)bond vibration ν2, stretching asymmetric (F2) and bending asymmetric (F2) W–O bondvibrations ν3 and ν4, respectively, [43].
3.5.1. Raman Study
Figure 7a demonstrates the experimental Raman spectra of Gd2(WO4)3 sample pre-pared by thermal treatments of the respective precursor powders at different temperatures.The Raman spectra of amorphous samples, i.e., the freshly prepared precursor and the
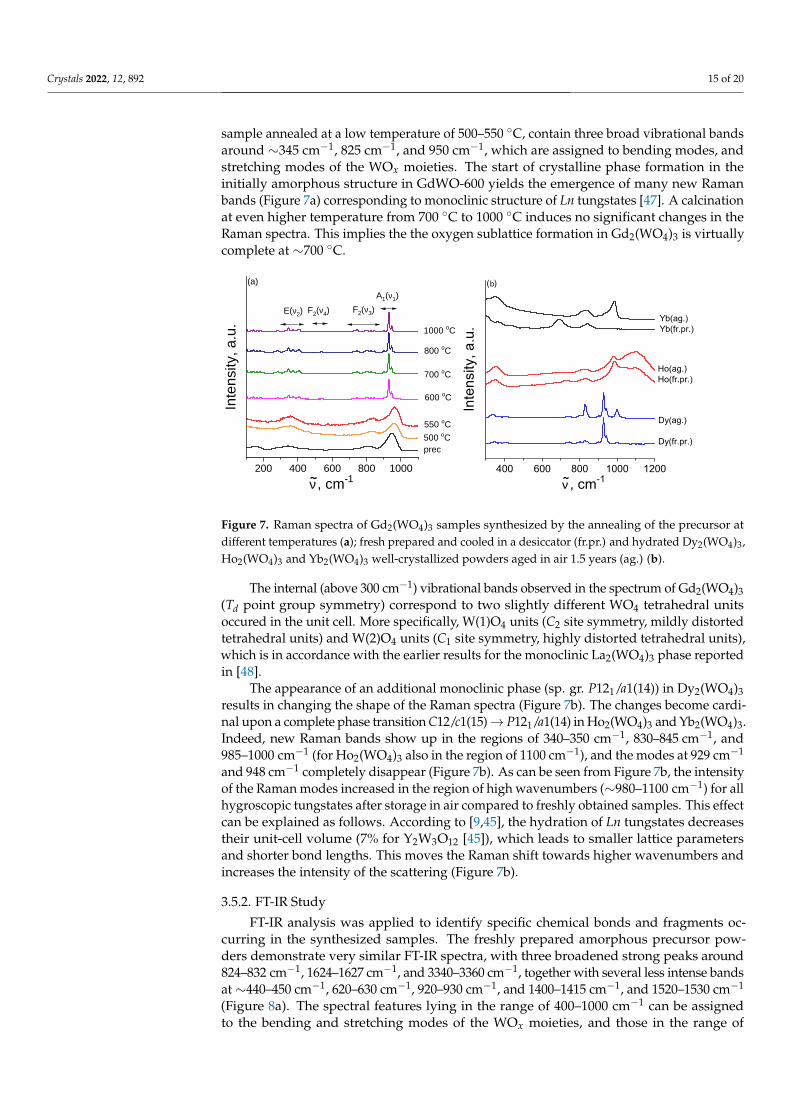
Crystals 2022, 12, 892 15 of 20
sample annealed at a low temperature of 500–550 ◦C, contain three broad vibrational bandsaround ∼345 cm−1, 825 cm−1, and 950 cm−1, which are assigned to bending modes, andstretching modes of the WOx moieties. The start of crystalline phase formation in theinitially amorphous structure in GdWO-600 yields the emergence of many new Ramanbands (Figure 7a) corresponding to monoclinic structure of Ln tungstates [47]. A calcinationat even higher temperature from 700 ◦C to 1000 ◦C induces no significant changes in theRaman spectra. This implies the the oxygen sublattice formation in Gd2(WO4)3 is virtuallycomplete at ∼700 ◦C.
2 0 0 4 0 0 6 0 0 8 0 0 1 0 0 0p r e c5 0 0 o C5 5 0 o C
6 0 0 o C
7 0 0 o C
8 0 0 o C
Inten
sity, a
.u.
F 2 ( ν4 )E ( ν2 )A 1 ( ν1 )
F 2 ( ν3 )
( a )
1 0 0 0 o C
ν , c m - 1 400 600 800 1000 1200
Dy(ag.)
Dy(fr.pr.)
Ho(ag.)Ho(fr.pr.)
Inte
nsity
,a.u
.
Yb(ag.)Yb(fr.pr.)
( )
ν , cm-1
b
Figure 7. Raman spectra of Gd2(WO4)3 samples synthesized by the annealing of the precursor atdifferent temperatures (a); fresh prepared and cooled in a desiccator (fr.pr.) and hydrated Dy2(WO4)3,Ho2(WO4)3 and Yb2(WO4)3 well-crystallized powders aged in air 1.5 years (ag.) (b).
The internal (above 300 cm−1) vibrational bands observed in the spectrum of Gd2(WO4)3(Td point group symmetry) correspond to two slightly different WO4 tetrahedral unitsoccured in the unit cell. More specifically, W(1)O4 units (C2 site symmetry, mildly distortedtetrahedral units) and W(2)O4 units (C1 site symmetry, highly distorted tetrahedral units),which is in accordance with the earlier results for the monoclinic La2(WO4)3 phase reportedin [48].
The appearance of an additional monoclinic phase (sp. gr. P121/a1(14)) in Dy2(WO4)3results in changing the shape of the Raman spectra (Figure 7b). The changes become cardi-nal upon a complete phase transition C12/c1(15)→ P121/a1(14) in Ho2(WO4)3 and Yb2(WO4)3.Indeed, new Raman bands show up in the regions of 340–350 cm−1, 830–845 cm−1, and985–1000 cm−1 (for Ho2(WO4)3 also in the region of 1100 cm−1), and the modes at 929 cm−1
and 948 cm−1 completely disappear (Figure 7b). As can be seen from Figure 7b, the intensityof the Raman modes increased in the region of high wavenumbers (∼980–1100 cm−1) for allhygroscopic tungstates after storage in air compared to freshly obtained samples. This effectcan be explained as follows. According to [9,45], the hydration of Ln tungstates decreasestheir unit-cell volume (7% for Y2W3O12 [45]), which leads to smaller lattice parametersand shorter bond lengths. This moves the Raman shift towards higher wavenumbers andincreases the intensity of the scattering (Figure 7b).
3.5.2. FT-IR Study
FT-IR analysis was applied to identify specific chemical bonds and fragments oc-curring in the synthesized samples. The freshly prepared amorphous precursor pow-ders demonstrate very similar FT-IR spectra, with three broadened strong peaks around824–832 cm−1, 1624–1627 cm−1, and 3340–3360 cm−1, together with several less intense bandsat ∼440–450 cm−1, 620–630 cm−1, 920–930 cm−1, and 1400–1415 cm−1, and 1520–1530 cm−1
(Figure 8a). The spectral features lying in the range of 400–1000 cm−1 can be assignedto the bending and stretching modes of the WOx moieties, and those in the range of
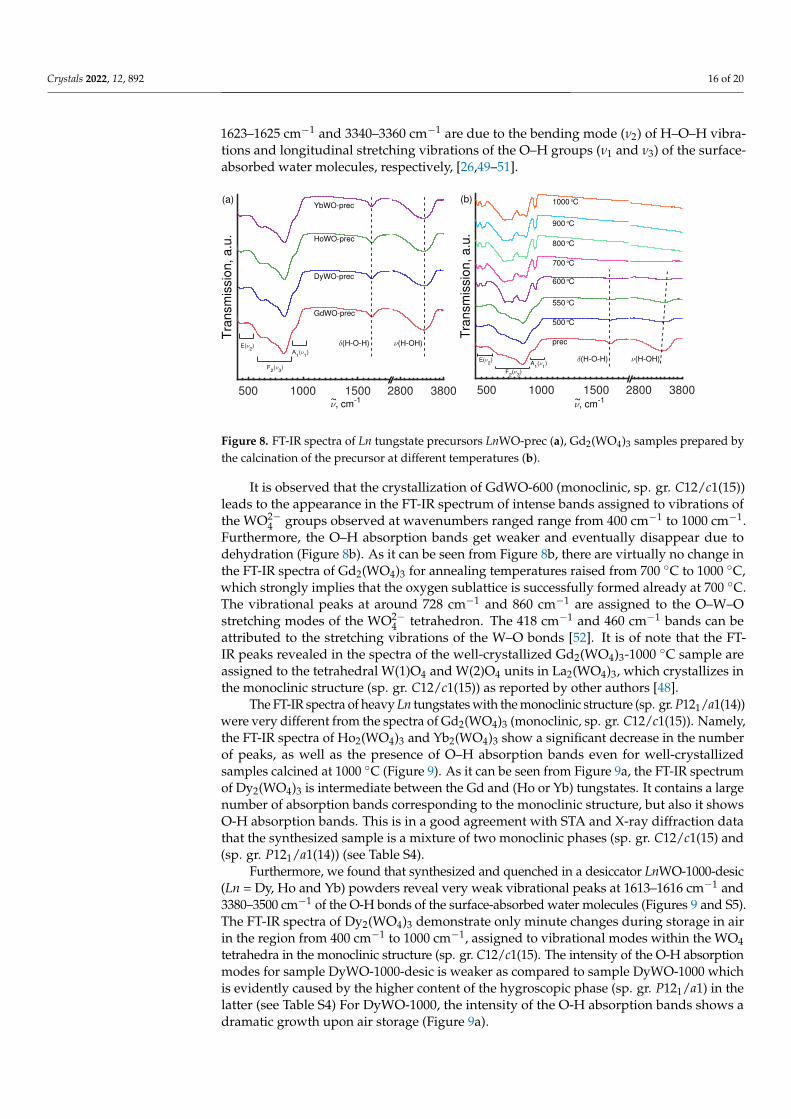
Crystals 2022, 12, 892 16 of 20
1623–1625 cm−1 and 3340–3360 cm−1 are due to the bending mode (ν2) of H–O–H vibra-tions and longitudinal stretching vibrations of the O–H groups (ν1 and ν3) of the surface-absorbed water molecules, respectively, [26,49–51].
500 1000 1500
Tra
nsm
issio
n, a.u
.
(a)
E(ν2)
F2(ν
3)
A1(ν
1)
δ(H-O-H)
ν, cm-1~2800 3800
ν(H-OH)
GdWO-prec
DyWO-prec
HoWO-prec
YbWO-prec
500 1000 1500
Tra
nsm
issio
n, a.u
.
(b)
E(ν2)
F2(ν
3)
A1(ν
1)
δ(H-O-H)
ν, cm-1~2800 3800
ν(H-OH)
prec
500°C
550°C
600°C
700°C
800°C
900°C
1000°C
Figure 8. FT-IR spectra of Ln tungstate precursors LnWO-prec (a), Gd2(WO4)3 samples prepared bythe calcination of the precursor at different temperatures (b).
It is observed that the crystallization of GdWO-600 (monoclinic, sp. gr. C12/c1(15))leads to the appearance in the FT-IR spectrum of intense bands assigned to vibrations ofthe WO2−
4 groups observed at wavenumbers ranged range from 400 cm−1 to 1000 cm−1.Furthermore, the O–H absorption bands get weaker and eventually disappear due todehydration (Figure 8b). As it can be seen from Figure 8b, there are virtually no change inthe FT-IR spectra of Gd2(WO4)3 for annealing temperatures raised from 700 ◦C to 1000 ◦C,which strongly implies that the oxygen sublattice is successfully formed already at 700 ◦C.The vibrational peaks at around 728 cm−1 and 860 cm−1 are assigned to the O–W–Ostretching modes of the WO2−
4 tetrahedron. The 418 cm−1 and 460 cm−1 bands can beattributed to the stretching vibrations of the W–O bonds [52]. It is of note that the FT-IR peaks revealed in the spectra of the well-crystallized Gd2(WO4)3-1000 ◦C sample areassigned to the tetrahedral W(1)O4 and W(2)O4 units in La2(WO4)3, which crystallizes inthe monoclinic structure (sp. gr. C12/c1(15)) as reported by other authors [48].
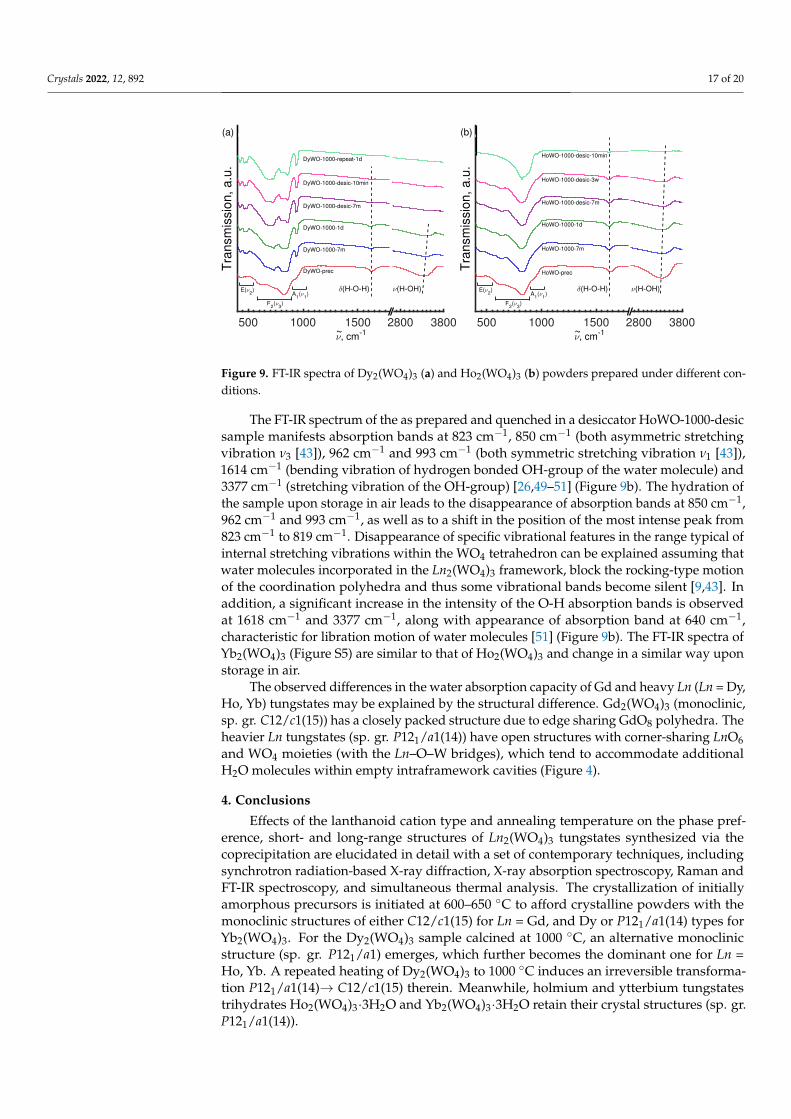
The FT-IR spectra of heavy Ln tungstates with the monoclinic structure (sp. gr. P121/a1(14))were very different from the spectra of Gd2(WO4)3 (monoclinic, sp. gr. C12/c1(15)). Namely,the FT-IR spectra of Ho2(WO4)3 and Yb2(WO4)3 show a significant decrease in the numberof peaks, as well as the presence of O–H absorption bands even for well-crystallizedsamples calcined at 1000 ◦C (Figure 9). As it can be seen from Figure 9a, the FT-IR spectrumof Dy2(WO4)3 is intermediate between the Gd and (Ho or Yb) tungstates. It contains a largenumber of absorption bands corresponding to the monoclinic structure, but also it showsO-H absorption bands. This is in a good agreement with STA and X-ray diffraction datathat the synthesized sample is a mixture of two monoclinic phases (sp. gr. C12/c1(15) and(sp. gr. P121/a1(14)) (see Table S4).
Furthermore, we found that synthesized and quenched in a desiccator LnWO-1000-desic(Ln = Dy, Ho and Yb) powders reveal very weak vibrational peaks at 1613–1616 cm−1 and3380–3500 cm−1 of the O-H bonds of the surface-absorbed water molecules (Figures 9 and S5).The FT-IR spectra of Dy2(WO4)3 demonstrate only minute changes during storage in airin the region from 400 cm−1 to 1000 cm−1, assigned to vibrational modes within the WO4tetrahedra in the monoclinic structure (sp. gr. C12/c1(15). The intensity of the O-H absorptionmodes for sample DyWO-1000-desic is weaker as compared to sample DyWO-1000 whichis evidently caused by the higher content of the hygroscopic phase (sp. gr. P121/a1) in thelatter (see Table S4) For DyWO-1000, the intensity of the O-H absorption bands shows adramatic growth upon air storage (Figure 9a).
Crystals 2022, 12, 892 17 of 20
500 1000 1500
Tra
nsm
issio
n, a.u
.
(a)
E(ν2)
F2(ν
3)
A1(ν
1)
δ(H-O-H)
ν, cm-1~2800 3800
ν(H-OH)
DyWO-prec
DyWO-1000-7m
DyWO-1000-1d
DyWO-1000-desic-7m
DyWO-1000-desic-10min
DyWO-1000-repeat-1d
500 1000 1500
Tra
nsm
issio
n, a.u
.
(b)
E(ν2)
F2(ν
3)
A1(ν
1)
δ(H-O-H)
ν, cm-1~2800 3800
ν(H-OH)
HoWO-prec
HoWO-1000-7m
HoWO-1000-1d
HoWO-1000-desic-7m
HoWO-1000-desic-3w
HoWO-1000-desic-10min
Figure 9. FT-IR spectra of Dy2(WO4)3 (a) and Ho2(WO4)3 (b) powders prepared under different con-ditions.
The FT-IR spectrum of the as prepared and quenched in a desiccator HoWO-1000-desicsample manifests absorption bands at 823 cm−1, 850 cm−1 (both asymmetric stretchingvibration ν3 [43]), 962 cm−1 and 993 cm−1 (both symmetric stretching vibration ν1 [43]),1614 cm−1 (bending vibration of hydrogen bonded OH-group of the water molecule) and3377 cm−1 (stretching vibration of the OH-group) [26,49–51] (Figure 9b). The hydration ofthe sample upon storage in air leads to the disappearance of absorption bands at 850 cm−1,962 cm−1 and 993 cm−1, as well as to a shift in the position of the most intense peak from823 cm−1 to 819 cm−1. Disappearance of specific vibrational features in the range typical ofinternal stretching vibrations within the WO4 tetrahedron can be explained assuming thatwater molecules incorporated in the Ln2(WO4)3 framework, block the rocking-type motionof the coordination polyhedra and thus some vibrational bands become silent [9,43]. Inaddition, a significant increase in the intensity of the O-H absorption bands is observedat 1618 cm−1 and 3377 cm−1, along with appearance of absorption band at 640 cm−1,characteristic for libration motion of water molecules [51] (Figure 9b). The FT-IR spectra ofYb2(WO4)3 (Figure S5) are similar to that of Ho2(WO4)3 and change in a similar way uponstorage in air.
The observed differences in the water absorption capacity of Gd and heavy Ln (Ln = Dy,Ho, Yb) tungstates may be explained by the structural difference. Gd2(WO4)3 (monoclinic,sp. gr. C12/c1(15)) has a closely packed structure due to edge sharing GdO8 polyhedra. Theheavier Ln tungstates (sp. gr. P121/a1(14)) have open structures with corner-sharing LnO6and WO4 moieties (with the Ln–O–W bridges), which tend to accommodate additionalH2O molecules within empty intraframework cavities (Figure 4).
4. Conclusions
Effects of the lanthanoid cation type and annealing temperature on the phase pref-erence, short- and long-range structures of Ln2(WO4)3 tungstates synthesized via thecoprecipitation are elucidated in detail with a set of contemporary techniques, includingsynchrotron radiation-based X-ray diffraction, X-ray absorption spectroscopy, Raman andFT-IR spectroscopy, and simultaneous thermal analysis. The crystallization of initiallyamorphous precursors is initiated at 600–650 ◦C to afford crystalline powders with themonoclinic structures of either C12/c1(15) for Ln = Gd, and Dy or P121/a1(14) types forYb2(WO4)3. For the Dy2(WO4)3 sample calcined at 1000 ◦C, an alternative monoclinicstructure (sp. gr. P121/a1) emerges, which further becomes the dominant one for Ln =Ho, Yb. A repeated heating of Dy2(WO4)3 to 1000 ◦C induces an irreversible transforma-tion P121/a1(14)→ C12/c1(15) therein. Meanwhile, holmium and ytterbium tungstatestrihydrates Ho2(WO4)3·3H2O and Yb2(WO4)3·3H2O retain their crystal structures (sp. gr.P121/a1(14)).
Crystals 2022, 12, 892 18 of 20
The local structure of all well-crystallized compounds is composed of Ln3+ lanthanoidcations and somewhat distorted WO2−
4 anionic tetrahedra. The change in the space grouppreference of the monoclinic crystalline structure of Ln tungstates along the series Gd-Dy-Ho-Yb is governed by progressive changes in the Ln-O coordination shell. The highhygroscopicity of lanthanoid tungstates Ln2(WO4)3 (Ln = Dy, Ho, Yb) is rationalized on thebasis of structural features of the monoclinic lattice (sp. gr. P121/a1).
Most essential features of phase preferences and hydration behavior found for heavylanthanoid tungstates in the present study are summarized in Table 5.
Table 5. Summary of structural features of heavy Ln tungstates under study.
Ln Phase CommentType Preference
Gd C12/c1 Negligible proneness to hydration
Dy C12/c1, The P121/a1 phase component is prone to fast spontaneoushydration.
P121/a1 The balance between C12/c1 and P121/a1 can be controlled bypreparationprotocol: a strictly single-phase C12/c1 can be obtained viarepeated heating
Ho P121/a1 Rapid spontaneous hydration
Yb P121/a1, Rapid spontaneous hydration; the Pbcn phase probablycorresponds to an
Pbcn unhydrated or partly hydrated structure; fully hydratedsamplesare single-phase P121/a1
Supplementary Materials: The following supporting information can be downloaded at: https://www.mdpi.com/article/10.3390/cryst12070892/s1.
Author Contributions: Conceptualization, V.V.P.; methodology, V.V.P.; validation, V.V.P, A.P.M. andY.V.Z.; formal analysis, A.A.Y., B.R.G., S.G.R. and E.V.K; investigation, V.V.P., Y.V.Z., S.G.R., F.E.D.,R.D.S., E.V.K., N.A.T., N.V.O. and I.V.S.; resources, V.V.P.; data curation, A.A.Y. and B.R.G.; writing—original draft preparation, V.V.P. and Y.V.Z.; writing—review and editing, V.V.P., Y.V.Z. and A.A.I.;visualization, A.A.Y., B.R.G., A.A.I., F.E.D. and E.V.K.; supervision, A.P.M.; project administration,A.P.M.; funding acquisition, A.P.M. All authors have read and agreed to the published version ofthe manuscript.
Funding: This work was supported by the Russian Federation represented by the Ministry of Scienceand Higher Education of the Russian Federation (Agreement No 075-15-2021-1352).
Institutional Review Board Statement: Not applicable.
Informed Consent Statement: Not applicable.
Data Availability Statement: Data sharing not applicable.
Acknowledgments: The authors thank O. N. Seregina, I. G. Rachenok, and K. V. Ponkratov for theirhelp in experiments.
Conflicts of Interest: The authors declare no conflict of interest.
References1. Imanaka, N.; Köhler, J.; Tamura, S.; Adachi, G. Ion conducting behavior in (Lu1−xMx)2(WO4)3 solid solutions (M = Sm, Ho, Er)
with the Sc2(WO4)3 type structure. Eur. J. Inorg. Chem. 2002, 1, 105–109.2. Zhou, Y.; Yan, B. RE2(MO4)3:Ln3+ (RE = Y, La, Gd, Lu; M = W, Mo; Ln = Eu, Sm, Dy) microcrystals: controlled synthesis,
microstructure and tunable luminescence. CrystEngComm 2013, 15, 5694. https://doi.org/10.1039/C3CE40495A.3. Kaczmarek, A.M.; Deun, R.V. Rare earth tungstate and molybdate compounds – from 0D to 3D architectures. Chem. Soc. Rev.
2013, 42, 8835–8848. https://doi.org/10.1039/C3CS60166H.
Crystals 2022, 12, 892 19 of 20
4. Liu, J.; Kaczmarek, A.; Deun, R. Advances in tailoring luminescent rare-earth mixed inorganic materials. Chem. Soc. Rev. 2018,47, 7225–7238. https://doi.org/10.1039/C7CS00893G.
5. Vickery, R.C. Studies of the rare-earth tungstates. J. Chem. Soc. 1949, 2501–2505. https://doi.org/10.1039/JR9490002501.6. Borchardt, H. Rare Earth Tungstates and 1:1 Oxytungstates. J. Chem. Phys. 1963, 39, 504–511. https://doi.org/10.1063/1.1734285.7. Nassau, K.; Levinstein, H.J.; Loiacono, G.M. A comprehensive study of trivalent tungstates and molybdates of the type L2(MO4)3.
J. Phys. Chem. Solids 1965, 26, 1805–1816. https://doi.org/10.1016/0022-3697(65)90213-1.8. Sleight, A.W. Negative Thermal Expansion. MRS Proc. 2002, 755, 106.https://doi.org/10.1557/PROC-755-DD10.6.9. Sumithra, S.; Umarji, A.M. Role of crystal structure on the thermal expansion of Ln2W3O12 (Ln = La, Nd, Dy, Y, Er and Yb). Solid
State Sci. 2004, 6, 1313–1319. https://doi.org/10.1016/j.solidstatesciences.2004.07.023.10. Liu, H.; Sun, W.; Zhang, Z.; Lovings, L.; Lind, C. Thermal Expansion Behavior in the A2M3O12 Family of Materials. Solids 2021,
2, 87–107. https://doi.org/10.3390/solids2010005.11. Marinkovic, B.A.; Pontón, P.I.; Romao, C.P.; Moreira, T.; White, M.A. Negative and Near-Zero Thermal Expansion in A2M3O12
and Related Ceramic Families: A Review. Front. Mater. 2021, 8, 741560. https://doi.org/10.3389/fmats.2021.741560.12. Templeton, D.H.; Zalkin, A. Crystal structure of europium tungstate. Acta Cryst. 1963, 16, 762–766.13. Gärtner, M.; Abeln, D.; Pring, A.; Wilde, M.; Reller, A. Synthesis, Structure, and Reactivity of Novel Lanthanum Tungstates. J.
Solid State Chem. 1994, 111, 128–133. https://doi.org/10.1006/jssc.1994.1207.14. Gressling, T.; Müller-Buschbaum, H. Zur Kristallstruktur von Ce2(WO4)3/On the Crystal Structure of Ce2(WO4)3. Z. Naturforsch.
B 1995, 50, 1513–1516. https://doi.org/10.1515/znb-1995-1013.15. Shen, R.; Wang, C.; Wang, T.; Dong, C.; Chen, X.; Liang, J. Crystal Structures of Dy2(WO4)3 and GdY(WO4)3. Rare Met. 2003,
22, 49–54.16. Weil, M.; Stöger, B.; Aleksandrov, L. Nd2(WO4)3. Acta Crystallogr. E 2009, 65, i45. https://doi.org/10.1107/S1600536809018108.17. dos Passos, R.H.D.; de Souza, C.P.; Bernard-Nicod, C.; Leroux, C.; Arab, M. Structural and electrical properties of cerium
tungstate: Application to methane conversion. Ceram. Int. 2020, 46, 8021–8030. https://doi.org/10.1016/j.ceramint.2019.12.026.18. Sabalisck, N.P.; de Cos, G.G.; González-Silgo, C.; Guzmán-Afonso, C.; Lavín, V.; López-Solano, J.; Martín-Mateos, I.T.; Mestres,
L.; Mujica, A.; Santamaría-Pérez, D.; et al. Role of rare earth sites and vacancies in the anomalous compression of modulatedscheelite tungstates RE2(WO4)3. Phys. Rev. Mater. 2021, 5, 123601. https://doi.org/10.1103/PhysRevMaterials.5.123601.
19. Pestereva, N.N.; Vyatkin, I.A.; Lopatin, D.A.; Guseva, A.F. Nature of ionic conductivity of lanthanoid tungstates with imperfectscheelite structure. Russ. J. Electrochem. 2016, 52, 1082–1089. https://doi.org/10.1134/S1023193516110094.
20. Xiao, X.; Cheng, Y.; Peng, J.; Wu, M.; Chen, D.; Hu, Z.; Kiyanagi, R.; Fieramosca, J.; Short, S.; Jorgensen, J. Thermal expansionproperties of A2(MO4)3 (A = Ho and Tm; M = W and Mo). Solid State Sci. 2008, 10, 321–325.
21. Lahoz, F.; Sabalisck, N.P.; Cerdeiras, E.; Mestres, L. Nano-to millisecond lifetime luminescence properties in Ln2(WO4)3 (Ln= La, Ho, Tm and Eu) microcrystalline powders with different crystal structures. J. Alloys Compd. 2015, 649, 1253–1259.https://doi.org/10.1016/j.jallcom.2015.07.155.
22. Kol’tsova, T.N. X-ray diffraction study of Y2W3O12·3H2O. Inorg. Mater. 2001, 37, 1175–1177.23. Pontón, P.I.; Prisco, L.P.; Dosen, A.; Faro, G.S.; de Abreu, M.A.; Marinkovic, B.A. Co-precipitation synthesis of Y2W3O12
submicronic powder. Ceram. Int. 2017, 43, 4222–4228. https://doi.org/10.1016/j.ceramint.2016.12.055.24. Yamazoe, S.; Hitomi, Y.; Shishido, T.; Tanaka, T. XAFS Study of Tungsten L1- and L3-Edges: Structural Analysis of
WO3 Species Loaded on TiO2 as a Catalyst for Photo-oxidation of NH3. J. Phys. Chem. C 2008, 112, 6869–6879.https://doi.org/10.1021/jp711250f.
25. Timoshenko, J.; Anspoks, A.; Kalinko, A.; Kuzmin, A. Local structure of nanosized tungstates revealed by evolutionary algorithm.Phys. Status Solidi A 2015, 212, 265–273. https://doi.org/10.1002/pssa.201431561.
26. Kuriakose, S.; H, H.; Jose, A.; John, M.; Varghese, T. Structural and optical characterization of lanthanum tungstatenanoparticles synthesized by chemical precipitation route and their photocatalytic activity. Opt. Mater. 2020, 99, 109571.https://doi.org/10.1016/j.optmat.2019.109571.
27. Meng, Q.; Hua, R.; Chen, B.; Tian, Y.; Lu, S.; Sun, L. Study on Luminescent Properties of Eu3+ Doped Gd2WO6,Gd2W2O9 and Gd2(WO4)3 Nanophosphors Prepared by Co-Precipitation. J. Nanosci. Nanotechnol. 2011, 11, 182–188.https://doi.org/10.1166/jnn.2011.3078.
28. Popov, V.V.; Menushenkov, A.P.; Yaroslavtsev, A.A.; Zubavichus, Y.V.; Gaynanov, B.R.; Yastrebtsev, A.A.; Leshchev, D.S.;Chernikov, R.V. Fluorite-pyrochlore phase transition in nanostructured Ln2Hf2O7 (Ln = La-Lu). J. Alloys Compd. 2016, 689, 669–679. https://doi.org/10.1016/j.jallcom.2016.08.019.
29. Popov, V.V.; Menushenkov, A.P.; Gaynanov, B.R.; Zubavichus, Y.V.; Svetogorov, R.D.; Yastrebtsev, A.A.; Pisarev, A.A.; Arzhatkina,L.A.; Ponkratov, K.V. Features of formation and evolution of crystal and local structures in nanocrystalline Ln2Zr2O7 (Ln =La–Tb). J. Phys. Conf. Ser. 2017, 941, 012079. https://doi.org/10.1088/1742-6596/941/1/012079.
30. Popov, V.V.; Menushenkov, A.P.; Ivanov, A.A.; Gaynanov, B.R.; Yastrebtsev, A.A.; d’Acapito, F.; Puri, A.; Castro, G.R.;Shchetinin, I.V.; Zheleznyi, M.V.; et al. Comparative analysis of long- and short-range structures features in titanates Ln2Ti2O7and zirconates Ln2Zr2O7 (Ln = Gd, Tb, Dy) upon the crystallization process. J. Phys. Chem. Solids 2019, 130, 144–153.https://doi.org/10.1016/j.jpcs.2019.02.019.
Crystals 2022, 12, 892 20 of 20
31. Popov, V.V.; Menushenkov, A.P.; Yastrebtsev, A.A.; Molokova, A.Y.; Rudakov, S.G.; Svetogorov, R.D.; Tsarenko, N.A.; Ponkratov,K.V.; Ognevskaya, N.V.; Seregina, O.N. The effect of the synthesis conditions on the structure and phase transitions in Ln2(MoO4)3.Solid State Sci. 2021, 112, 106518. https://doi.org/10.1016/j.solidstatesciences.2020.106518.
32. Popov, V.V.; Menushenkov, A.P.; Yastrebtsev, A.A.; Rudakov, S.G.; Ivanov, A.A.; Gaynanov, B.R.; Svetogorov, R.D.; Khramov, E.V.;Zubavichus, Y.V.; Molokova, A.Y.; et al. Multiscale study on the formation and evolution of the crystal and local structures inlanthanoid tungstates Ln2(WO)4)3. J. Alloys Compd. 2022, 910, 164922. https://doi.org/10.1016/j.jallcom.2022.164922.
33. Svetogorov, R.D.; Dorovatovskii, P.V.; Lazarenko, V.A. Belok/XSA Diffraction Beamline for Studying Crystalline Samples atKurchatov Synchrotron Radiation Source. Cryst. Res. Tech. 2020, 55, 1900184. https://doi.org/10.1002/crat.201900184.
34. Petricek, V.; Dusek, M.; Palatinus, L. Crystallographic computing system JANA2006: General features. Z. Krist. 2014, 229, 345–352.https://doi.org/10.1515/zkri-2014-1737.
35. Chernyshov, A.; Veligzhanin, A.; Zubavichus, Y. Structural Materials Science end-station at the Kurchatov Synchrotron RadiationSource: Recent instrumentation upgrades and experimental results. Nucl. Instrum. Methods Phys. Res. Sect. A 2009, 603, 95–98.https://doi.org/10.1016/j.nima.2008.12.167.
36. Ravel, B.; Newville, M. ATHENA, ARTEMIS, HEPHAESTUS: Data analysis for X-ray absorption spectroscopy using IFEFFIT. J.Synchrotron Radiat. 2005, 12, 537–541. https://doi.org/10.1107/S0909049505012719.
37. Newville, M. IFEFFIT: Interactive XAFS analysis and FEFF fitting. J. Synchrotron Radiat. 2001, 8, 322–324.38. Rehr, J.J.; Albers, R.C. Theoretical approaches to X-ray absorption fine structure. Rev. Mod. Phys. 2000, 72, 621–654.
https://doi.org/10.1103/RevModPhys.72.621.39. Klementev, K.V. Extraction of the fine structure from X–ray absorption spectra. J. Phys. D Appl. Phys. 2001, 34, 209–217.
https://doi.org/10.1088/0022-3727/34/2/309.40. Rehr, J.J.; Kas, J.J.; Vila, F.D.; Prange, M.P.; Jorissen, K. Parameter-free calculations of X-ray spectra with FEFF9. Phys. Chem. Chem.
Phys. 2010, 12, 5503–5513. https://doi.org/10.1039/B926434E.41. Evdokimov, A.A.; Efremov, V.A.; Trunov, V.K.; Kleinman, I.A.; Dzurinskii, B.F. Rare Earth Elements Compounds. Molybdates,
Tungstates; Nauka (Science): Moscow, Russia, 1991. (In Russian)42. Wu, M.Y.; Jia, Y.; Sun, Q. Effects of A3+ cations on hydration in A2M3O12 family materials: A first-principles study. Comput.
Mater. Sci. 2016, 111, 28–33. https://doi.org/10.1016/j.commatsci.2015.09.010.43. Shmurak, S.Z.; Kedrov, V.V.; Kiselev, A.P.; Fursova, T.N.; Zver’kova, I.I.; Khasanov, S.S. Spectral and Structural Characteristics of
(Lu1−xEux)2(WO4)3 Tungstates. Phys. Solid State 2019, 61, 2117–2129. https://doi.org/10.1134/S1063783419110325.44. Richard, A.P.; Edwards, D.D. Subsolidus phase relations and crystal structures of the mixed-oxide phases in the In2O3–WO3
system. J. Solid State Chem. 2004, 177, 2740–2748. https://doi.org/10.1016/j.jssc.2004.04.015.45. Sumithra, S.; Umarji, A.M. Hygroscopicity and bulk thermal expansion in Y2W3O12. Mater. Res. Bull. 2005, 40, 167–176.
https://doi.org/10.1016/j.materresbull.2004.09.009.46. Luo, Q.H.; Howell, R.C.; Dankova, M.; Bartis, J.; Williams, C.W.; Horrocks, W.D.; Young, V.G.; Rheingold, A.L.; Francesconi, L.C.;
Antonio, M.R. Coordination of Rare-Earth Elements in Complexes with Monovacant Wells–Dawson Polyoxoanions. Inorg. Chem.2001, 40, 1894–1901. https://doi.org/10.1021/ic001427+.
47. Sabalisck, N.P.; Lopez-Solano, J.; Guzman-Afonso, C.; Santamaria-Perez, D.; Gonzalez-Silgo, C.; Mujica, A.; Munoz, A.; Rodriguez-Hernandez, P.; Radescu, S.; Vendrell, X.; et al. Effect of pressure on La2(WO4)3 with a modulated scheelite-type structure. Phys.Rev. B 2014, 89, 174112. https://doi.org/10.1103/PhysRevB.89.174112.
48. Burcham, L.J.; Wachs, I.E. Vibrational analysis of the two non-equivalent, tetrahedral tungstate (WO4) units in Ce2(WO4)3 andLa2(WO4)3. Spectrochim. Acta A 1998, 54, 1355–1368. https://doi.org/10.1016/S1386-1425(98)00036-5.
49. Pourmortazavi, S.M.; Rahimi-Nasrabadi, M.; Ganjali, M.; Sadeghpour, K.M.; Norouzi, P.; Faridbod, F. Facile and EffectiveSynthesis of Praseodymium Tungstate Nanoparticles through an Optimized Procedure and Investigation of PhotocatalyticActivity. Open Chem. J. 2017, 15, 129–138. https://doi.org/10.1515/chem-2017-0014.
50. Rahimi-Nasrabadi, M.; Pourmortazavi, S.M.; Ganjali, M.R.; Banan, A.R.; Ahmadi, F. Synthesis procedure optimization and charac-terization of europium (III) tungstate nanoparticles. J. Mol. Struct. 2014, 1074, 85–91. https://doi.org/10.1016/j.molstruc.2014.05.044.
51. Nakamoto, K. Infrared and Raman Spectra of Inorganic and Coordination Compounds. Part A: Theory and Applications in InorganicChemistry, 6th ed.; John Wiley & Sons, Inc.: Hoboken, NJ, USA, 2009.
52. Yin, M.; Liu, Y.; Mei, L.; Molokeev, M.S.; Huang, Z.; Fang, M. Preparation, crystal structure and up-conversion luminescence ofEr3+, Yb3+ co-doped Gd2(WO4)3. RSC Adv. 2015, 5, 73077–73082. https://doi.org/10.1039/c5ra12959a.


![Electronic spectra of Yb[sup 2+]-doped SrCl[sub 2]](https://static.fdokumen.com/doc/165x107/633592f8b5f91cb18a0b76fc/electronic-spectra-of-ybsup-2-doped-srclsub-2.jpg)

![Mononuclear Lanthanide Single Molecule Magnets Based on the Polyoxometalates [Ln(W 5 O 18 ) 2 ] 9− and [Ln(β 2 SiW 11 O 39 ) 2 ] 13− (Ln III = Tb, Dy, Ho, Er, Tm, and Yb](https://static.fdokumen.com/doc/165x107/63221a7e050768990e0fb2ea/mononuclear-lanthanide-single-molecule-magnets-based-on-the-polyoxometalates-lnw.jpg)