Downconversion for solar cells in YF_{3}:Nd^{3+}, Yb^{3+}
9
Downconversion for solar cells in YF 3 :Nd 3+ , Yb 3+ Janne-Mieke Meijer, 1 Linda Aarts, 1 Bryan M. van der Ende, 1 Thijs J. H. Vlugt, 2 and Andries Meijerink 1, * 1 Condensed Matter and Interfaces, Debye Institute for Nanomaterials Science, Utrecht University, Princetonplein 5, 3584 CC Utrecht, The Netherlands 2 Process & Energy Laboratory, Delft University of Technology, Leeghwaterstraat 44, 2628 CA Delft, The Netherlands Received 9 October 2009; published 12 January 2010 Energy losses inherent to the conversion of sunlight to electricity in solar cells are mainly due to the so-called spectral mismatch: low energy photons are not absorbed while the energy of high energy photons is only partly used by the solar cell. The losses can be significantly reduced by adapting the solar spectrum. A promising avenue is the use of a downconversion material where one higher energy visible blue-green photon is “cut” into two lower-energy near-infrared photons that both can be used by the solar cell. Here the efficiency of downconversion for the Nd 3+ ,Yb 3+ couple in YF 3 is studied to investigate if efficient two-step energy transfer occurs from the 4 G 9/2 level of Nd 3+ situated around 21 000 cm -1 or 470 nm exciting two neighbor- ing Yb 3+ ions to the 2 F 5/2 level around 10 000 cm -1 or 1000 nm. Optical measurements of YF 3 doped with Nd 3+ and Yb 3+ show that there is efficient energy transfer from Nd 3+ to Yb 3+ , but downconversion from the 4 G 9/2 level does not occur due to fast multiphonon relaxation. Relaxation from this level to lower-energy levels populates the 4 F 3/2 level of Nd 3+ from which efficient one-step energy transfer to Yb 3+ occurs. Analysis of the luminescence decay curves for different Yb 3+ -concentrations using Monte Carlo simulations reveals a high nearest neighbor transfer rate 3.3 10 5 s -1 through a dipole-dipole interaction mechanism. Downconversion is observed from the 4 D 3/2 level situated in the UV, around 28 000 cm -1 or 360 nm with an estimated quantum efficiency up to 140%. For application in solar cells this UV to 2 NIR downconversion will only result in a marginal reduction of spectral mismatch losses. DOI: 10.1103/PhysRevB.81.035107 PACS numbers: 33.50.j, 78.40.Ha, 78.47.p, 78.55.Hx I. INTRODUCTION The theoretical maximum conversion efficiency of solar cells is 30%. 1 A large part of the energy losses that limit the efficiency is related to the spectral mismatch: photons with energy smaller than the band-gap E g will not be absorbed sub-band-gap transmission and a large part of the energy of photons with energy larger than the band gap is lost as heat thermalization losses. There are two ways to reduce the energy losses related to the spectral mismatch: either the so- lar cell can be adapted to use the solar spectrum more effi- ciently, or the solar spectrum can be adapted before it is absorbed by the solar cell. Solar cells can be adapted to make better use of the spectrum by combining multiple semicon- ductor materials with different band gaps, each converting a different part of the solar spectrum with high efficiency. This approach has been successfully applied in tandem solar cells, and energy efficiencies over 40% have been reported. 2 There are two ways to adapt the solar spectrum before it is absorbed by the solar cell. The first option is to add two lower-energy photons that are otherwise transmitted to ob- tain one higher energy photon that can be absorbed by the solar cell. This process is known as upconversion UC and is especially useful for solar cells with a large band-gap where transmission losses dominate. The second option is to split one higher energy photon to obtain two photons with a smaller energy. Each of these photons can subsequently be absorbed by the solar cell and generate an electron-hole pair. This is known as downconversion DC and is most benefi- cial for solar cells with a smaller band-gap where thermali- zation losses are the major loss factor. This process is also known as quantum cutting because one photon is “cut” into two smaller energy photons. Lanthanide ions are very well suited to use for both DC and UC because they have a rich energy level structure that allows for efficient spectral con- version. There are many examples of efficient upconversion and downconversion using lanthanides, either with one type of lanthanide ion or a pair of lanthanide ions. 3,4 The effect of using either upconversion or downconver- sion materials in combination with solar cells has been mod- eled by Trupke et al. 5–7 When a solar cell with a band gap of 1.1 eV is combined with an ideal downconverting material in front of the cell splitting every photon above 2E g into two photons that can be absorbed and both generate an electron- hole pair, an efficiency of 40% is possible. 5 An upper limit of approximately 50% can be reached when a solar cell with a band gap of 2 eV is combined with an ideal upconverter at the rear of the cell. 6,7 UC is a nonlinear process: for the two-step UC process where two photons are added to obtain one photon with a larger energy the UC light intensity I UC is proportional to square of the incident light intensity I i . As a result, high conversion efficiencies are only obtained at suf- ficiently high excitation density which can be easily realized using lasers, but will require strong concentration of sun- light. The most efficient UC is realized using lanthanide ions. 3 An example of a particularly efficient upconverting couple is Er 3+ ,Yb 3+ . Under high power laser excitation an efficiency of around 50% has been reported for the conversion of NIR 1000 nm to visible light in NaYF 4 :Er 3+ , Yb 3+ . 8 Gibart et al. proposed using this upconversion couple to increase the efficiency of a substrate-free GaAs solar cell and have re- ported an efficiency of 2.5% for excitation with 1.39 eV photons. 9 The feasibility of upconversion for solar cells was PHYSICAL REVIEW B 81, 035107 2010 1098-0121/2010/813/0351079 ©2010 The American Physical Society 035107-1
-
Upload
independent -
Category
Documents
-
view
0 -
download
0
Transcript of Downconversion for solar cells in YF_{3}:Nd^{3+}, Yb^{3+}

Downconversion for solar cells in YF3:Nd3+, Yb3+
Janne-Mieke Meijer,1 Linda Aarts,1 Bryan M. van der Ende,1 Thijs J. H. Vlugt,2 and Andries Meijerink1,*1Condensed Matter and Interfaces, Debye Institute for Nanomaterials Science, Utrecht University, Princetonplein 5,
3584 CC Utrecht, The Netherlands2Process & Energy Laboratory, Delft University of Technology, Leeghwaterstraat 44, 2628 CA Delft, The Netherlands
�Received 9 October 2009; published 12 January 2010�
Energy losses inherent to the conversion of sunlight to electricity in solar cells are mainly due to theso-called spectral mismatch: low energy photons are not absorbed while the energy of high energy photons isonly partly used by the solar cell. The losses can be significantly reduced by adapting the solar spectrum. Apromising avenue is the use of a downconversion material where one higher energy visible �blue-green� photonis “cut” into two lower-energy near-infrared photons that both can be used by the solar cell. Here the efficiencyof downconversion for the �Nd3+,Yb3+� couple in YF3 is studied to investigate if efficient two-step energytransfer occurs from the 4G9/2 level of Nd3+ �situated around 21 000 cm−1 or 470 nm� exciting two neighbor-ing Yb3+ ions to the 2F5/2 level �around 10 000 cm−1 or 1000 nm�. Optical measurements of YF3 doped withNd3+ and Yb3+ show that there is efficient energy transfer from Nd3+ to Yb3+, but downconversion from the4G9/2 level does not occur due to fast multiphonon relaxation. Relaxation from this level to lower-energy levelspopulates the 4F3/2 level of Nd3+ from which efficient one-step energy transfer to Yb3+ occurs. Analysis of theluminescence decay curves for different Yb3+-concentrations using Monte Carlo simulations reveals a highnearest neighbor transfer rate �3.3�105 s−1� through a dipole-dipole interaction mechanism. Downconversionis observed from the 4D3/2 level �situated in the UV, around 28 000 cm−1 or 360 nm� with an estimatedquantum efficiency up to 140%. For application in solar cells this UV to 2 NIR downconversion will onlyresult in a marginal reduction of spectral mismatch losses.
DOI: 10.1103/PhysRevB.81.035107 PACS number�s�: 33.50.�j, 78.40.Ha, 78.47.�p, 78.55.Hx
I. INTRODUCTION
The theoretical maximum conversion efficiency of solarcells is 30%.1 A large part of the energy losses that limit theefficiency is related to the spectral mismatch: photons withenergy smaller than the band-gap �Eg� will not be absorbed�sub-band-gap transmission� and a large part of the energy ofphotons with energy larger than the band gap is lost as heat�thermalization losses�. There are two ways to reduce theenergy losses related to the spectral mismatch: either the so-lar cell can be adapted to use the solar spectrum more effi-ciently, or the solar spectrum can be adapted before it isabsorbed by the solar cell. Solar cells can be adapted to makebetter use of the spectrum by combining multiple semicon-ductor materials with different band gaps, each converting adifferent part of the solar spectrum with high efficiency. Thisapproach has been successfully applied in tandem solar cells,and energy efficiencies over 40% have been reported.2
There are two ways to adapt the solar spectrum before itis absorbed by the solar cell. The first option is to add twolower-energy photons �that are otherwise transmitted� to ob-tain one higher energy photon that can be absorbed by thesolar cell. This process is known as upconversion �UC� andis especially useful for solar cells with a large band-gapwhere transmission losses dominate. The second option is tosplit one higher energy photon to obtain two photons with asmaller energy. Each of these photons can subsequently beabsorbed by the solar cell and generate an electron-hole pair.This is known as downconversion �DC� and is most benefi-cial for solar cells with a smaller band-gap where thermali-zation losses are the major loss factor. This process is alsoknown as quantum cutting because one photon is “cut” into
two smaller energy photons. Lanthanide ions are very wellsuited to use for both DC and UC because they have a richenergy level structure that allows for efficient spectral con-version. There are many examples of efficient upconversionand downconversion using lanthanides, either with one typeof lanthanide ion or a pair of lanthanide ions.3,4
The effect of using either upconversion or downconver-sion materials in combination with solar cells has been mod-eled by Trupke et al.5–7 When a solar cell with a band gap of1.1 eV is combined with an ideal downconverting material infront of the cell �splitting every photon above 2Eg into twophotons that can be absorbed and both generate an electron-hole pair�, an efficiency of 40% is possible.5 An upper limitof approximately 50% can be reached when a solar cell witha band gap of �2 eV is combined with an ideal upconverterat the rear of the cell.6,7 UC is a nonlinear process: for thetwo-step UC process �where two photons are added to obtainone photon with a larger energy� the UC light intensity IUC isproportional to square of the incident light intensity Ii. As aresult, high conversion efficiencies are only obtained at suf-ficiently high excitation density which can be easily realizedusing lasers, but will require strong concentration of sun-light.
The most efficient UC is realized using lanthanide ions.3
An example of a particularly efficient upconverting couple is�Er3+ ,Yb3+�. Under high power laser excitation an efficiencyof around 50% has been reported for the conversion of NIR��1000 nm� to visible light in NaYF4:Er3+, Yb3+.8 Gibart etal. proposed using this upconversion couple to increase theefficiency of a substrate-free GaAs solar cell and have re-ported an efficiency of 2.5% for excitation with 1.39 eVphotons.9 The feasibility of upconversion for solar cells was
PHYSICAL REVIEW B 81, 035107 �2010�
1098-0121/2010/81�3�/035107�9� ©2010 The American Physical Society035107-1

also demonstrated using NIR upconversion in NaYF4 dopedwith Er3+.7,10
Contrary to UC, DC is a linear process. This makes itpossible to obtain high conversion efficiencies independentof the incident power and allows for the use nonconcentratedsunlight. Demonstrations of efficient DC materials are stilllimited �contrary to UC materials�. Initially the work focusedon the conversion of a single VUV photon into two visiblephotons. The �Gd3+ ,Eu3+� couple in a LiGdF4 host latticeshows efficient VUV to VIS DC �internal quantum efficiencyof approximately 190%� and Er3+, Gd3+, and Tb3+ in thesame host lattice have an efficiency of 130%.4,11,12
Downconversion of UV or visible photons into NIR pho-tons was first demonstrated in �Y,Yb�PO4:Tb3+.13 After ex-citation into the 5D4 state of the Tb3+-ion two neighboringYb3+ ions are excited through a cooperative energy transferprocess. The 5D4 level of Tb3+ is found at about twice theenergy of the Yb3+ 2F5/2 level, and after energy transfer Yb3+
emission is observed around 1000 nm. This is just above theband gap of crystalline silicon which makes Yb3+ an attrac-tive candidate for DC materials to be used in combinationwith c-Si solar cells. More recently, cooperative downcon-version has also been reported for �Tb3+ ,Yb3+� in other hostmaterials14,15 and with other lanthanide couples, viz.�Pr3+ ,Yb3+� �Ref. 16� and �Tm3+,Yb3+�.17 It is not clear,however, that the second-order cooperative energy transferprocess is the operative mechanism in the latter two systems,as also first-order energy transfer processes are possible andare expected to dominate.18 Second-order cooperative energytransfer processes have a lower efficiency, making it onlyefficient at very high Yb3+ concentrations where the Yb3+
emission is largely quenched through concentration quench-ing. For more efficient energy transfer, an intermediate levelon the donor ion should be used in order to obtain downcon-version through two resonant energy transfer steps.
In this paper we investigate if efficient downconversion ispossible with the �Nd3+ ,Yb3+� couple in YF3. We have cho-sen YF3 as a host because this lattice has a low phononenergy �maximum phonon energy �500 cm−1� �Ref. 19�; alower phonon energy minimizes multiphonon relaxation pro-cesses between the closely spaced energy levels of Nd3+,which can reduce the radiative downconversion efficiency. InFig. 1 the downconversion scheme for the �Nd3+ ,Yb3+�couple via sequential two-step energy transfer is shown.When Nd3+ is excited into the 4G9/2 state, part of the energyis transferred to Yb3+ via cross relaxation: Nd3+ �4G9/2→ 4F3/2�, Yb3+ �2F7/2→ 2F5/2�, populating the 2F5/2 level ofYb3+. In a second step the remaining energy can be trans-ferred to a second Yb3+ ion, which can then emit a photon, orotherwise emission can occur from the 4F3/2 level of Nd3+.
II. METHODS
A. Synthesis
Crystalline powder samples of YF3 doped with Nd3+ andYb3+ were synthesized via coprecipitation. The Nd3+ concen-tration was kept constant at 0.5% while the Yb3+ concentra-tion was varied between 0 and 10% �0, 2, 3, 5, or 10%�. Alsotwo samples without Nd3+ were synthesized, containing 2%
and 10% Yb3+. In all cases the percentages given for thedopants Yb3+ or Nd3+ are in mol % with respect to Y3+. Alow Nd3+ concentration was used to prevent cross relaxationbetween Nd3+ pairs. The Yb3+ concentration was varied: atlow Yb3+ concentrations there is less concentration quench-ing, while at higher concentrations energy transfer from Nd3+
to Yb3+ is more efficient because each Nd3+ ion has one ormore Yb3+ neighbors. Therefore it is important to find theoptimum Yb3+ concentration. The samples were prepared bymixing stoichiometric amounts of Y2O3, Nd2O3, and Yb2O3�purity at least 4N�. The powder mixture was dissolved indilute hydrochloric or nitric acid. After adding a solutionwith an excess of NH4F �98+%� a precipitate was formed,which was centrifuge-washed and then dried. The blend wasput into an alumina crucible and fired in an oven togetherwith an excess of NH4F under a nitrogen flow. The sampleswere first heated to 300 °C for 2 h �to remove adsorbedwater molecules� and then to 1000 °C for 3 h. After thesamples had cooled sufficiently they were crushed with apestle and mortar and x-ray diffraction measurements wereperformed to check for phase purity.
B. Measurements
Diffuse reflectance spectra were measured with a Perkin-Elmer Lambda 950 UV/VIS/IR absorption spectrometer.Emission and excitation measurements were performed us-ing an Edinburgh Instruments FLS920 fluorescence spec-trometer. The 0.3 m excitation double monochromator dis-
FIG. 1. Schematic representation of the desired mechanism fordownconversion with the Nd3+, Yb3+ couple. Nd3+ is excited intothe 4G9/2 state. Part of the energy is transferred to Yb3+ via crossrelaxation: Nd3+ �4G9/2→ 4F3/2�, Yb3+ �2F7/2→ 2F5/2�, populatingthe 2F5/2 level of Yb3+. In the second step the remaining energy canbe transferred to a second Yb3+ ion from the 4F3/2 level of Nd3+.Both Yb3+ ions can then emit a photon of approximately 1000 nm.
MEIJER et al. PHYSICAL REVIEW B 81, 035107 �2010�
035107-2
perses light from a 450 W Xe lamp with gratings blazed at300, 500, or 1200 nm. UV and visible sample emission isdetected with an emission monochromator with a gratingblazed at 300 or 500 nm and a Hamamatsu R928 photomul-tiplier tube �PMT�. The NIR emission is detected with an-other emission monochromator with a grating blazed at 1200nm and a liquid nitrogen-cooled Hamamatsu R5509–72PMT. The Edinburgh fluorescence spectrometer is equippedwith an Oxford helium flow cryostat for low temperaturemeasurements. The spectra were not corrected for the instru-mental response.
Lifetime measurements upon pulsed excitation at a wave-length of 452 nm were performed with the use of a LambdaPhysik LPD3000 tunable dye laser with a Coumarin 120 dyesolution �tunable between 423–462 nm�. Lifetime measure-ments with an excitation wavelength of 950 nm were per-formed on the same setup with Styryl 14 dye solution �tun-able between 904–992 nm�. The dye laser is pumped by aLambda Physik LPX100 excimer �XeCl� laser. The typicalpulse width for the setup is �20 ns and the repetition rate is10 Hz. The laser excitation is steered into the sample cham-ber of the Edinburgh fluorescence spectrometer using a pairof prisms.
III. RESULTS AND DISCUSSION
A. Characterization
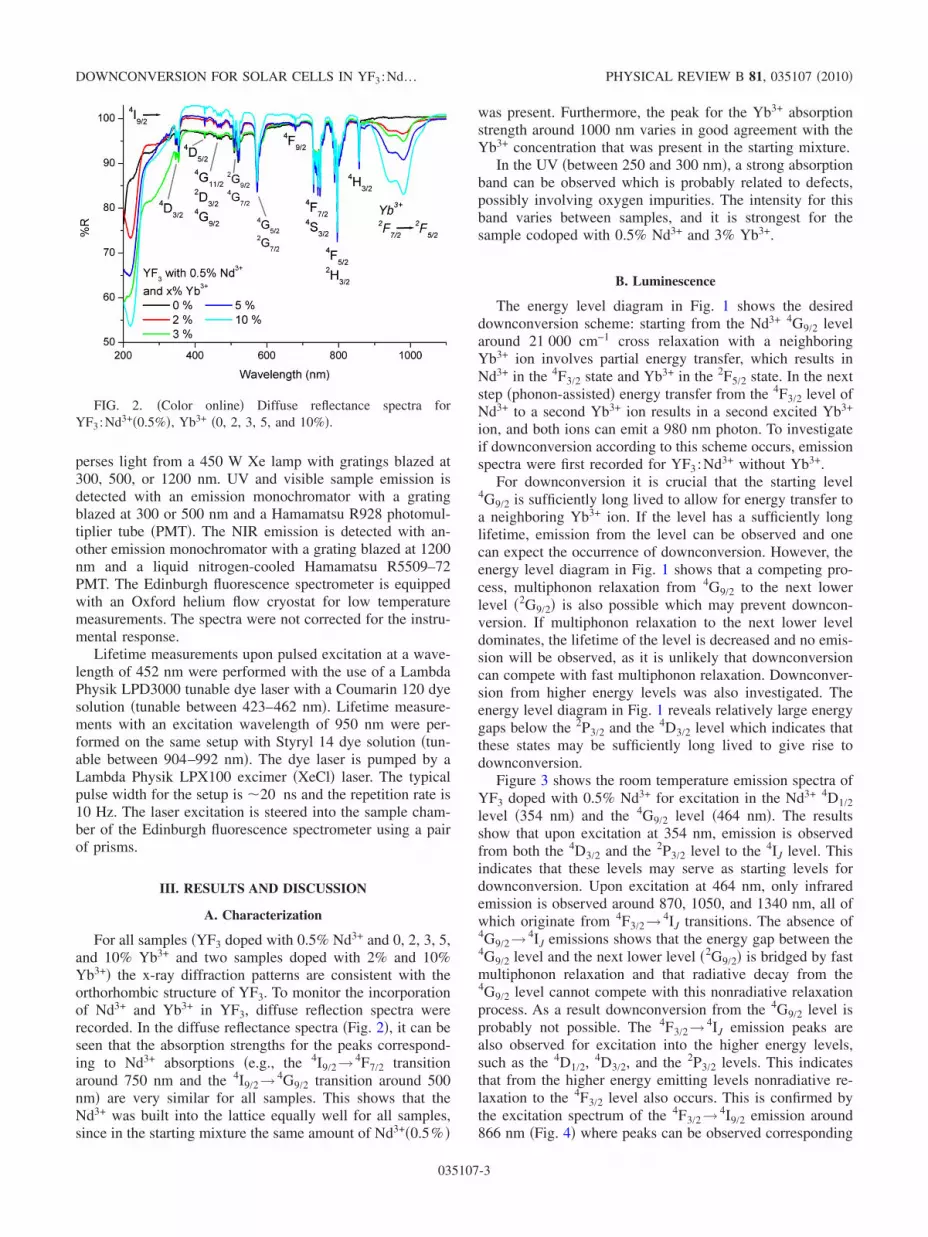
For all samples �YF3 doped with 0.5% Nd3+ and 0, 2, 3, 5,and 10% Yb3+ and two samples doped with 2% and 10%Yb3+� the x-ray diffraction patterns are consistent with theorthorhombic structure of YF3. To monitor the incorporationof Nd3+ and Yb3+ in YF3, diffuse reflection spectra wererecorded. In the diffuse reflectance spectra �Fig. 2�, it can beseen that the absorption strengths for the peaks correspond-ing to Nd3+ absorptions �e.g., the 4I9/2→ 4F7/2 transitionaround 750 nm and the 4I9/2→ 4G9/2 transition around 500nm� are very similar for all samples. This shows that theNd3+ was built into the lattice equally well for all samples,since in the starting mixture the same amount of Nd3+�0.5% �
was present. Furthermore, the peak for the Yb3+ absorptionstrength around 1000 nm varies in good agreement with theYb3+ concentration that was present in the starting mixture.
In the UV �between 250 and 300 nm�, a strong absorptionband can be observed which is probably related to defects,possibly involving oxygen impurities. The intensity for thisband varies between samples, and it is strongest for thesample codoped with 0.5% Nd3+ and 3% Yb3+.
B. Luminescence
The energy level diagram in Fig. 1 shows the desireddownconversion scheme: starting from the Nd3+ 4G9/2 levelaround 21 000 cm−1 cross relaxation with a neighboringYb3+ ion involves partial energy transfer, which results inNd3+ in the 4F3/2 state and Yb3+ in the 2F5/2 state. In the nextstep �phonon-assisted� energy transfer from the 4F3/2 level ofNd3+ to a second Yb3+ ion results in a second excited Yb3+
ion, and both ions can emit a 980 nm photon. To investigateif downconversion according to this scheme occurs, emissionspectra were first recorded for YF3:Nd3+ without Yb3+.
For downconversion it is crucial that the starting level4G9/2 is sufficiently long lived to allow for energy transfer toa neighboring Yb3+ ion. If the level has a sufficiently longlifetime, emission from the level can be observed and onecan expect the occurrence of downconversion. However, theenergy level diagram in Fig. 1 shows that a competing pro-cess, multiphonon relaxation from 4G9/2 to the next lowerlevel �2G9/2� is also possible which may prevent downcon-version. If multiphonon relaxation to the next lower leveldominates, the lifetime of the level is decreased and no emis-sion will be observed, as it is unlikely that downconversioncan compete with fast multiphonon relaxation. Downconver-sion from higher energy levels was also investigated. Theenergy level diagram in Fig. 1 reveals relatively large energygaps below the 2P3/2 and the 4D3/2 level which indicates thatthese states may be sufficiently long lived to give rise todownconversion.
Figure 3 shows the room temperature emission spectra ofYF3 doped with 0.5% Nd3+ for excitation in the Nd3+ 4D1/2level �354 nm� and the 4G9/2 level �464 nm�. The resultsshow that upon excitation at 354 nm, emission is observedfrom both the 4D3/2 and the 2P3/2 level to the 4IJ level. Thisindicates that these levels may serve as starting levels fordownconversion. Upon excitation at 464 nm, only infraredemission is observed around 870, 1050, and 1340 nm, all ofwhich originate from 4F3/2→ 4IJ transitions. The absence of4G9/2→ 4IJ emissions shows that the energy gap between the4G9/2 level and the next lower level �2G9/2� is bridged by fastmultiphonon relaxation and that radiative decay from the4G9/2 level cannot compete with this nonradiative relaxationprocess. As a result downconversion from the 4G9/2 level isprobably not possible. The 4F3/2→ 4IJ emission peaks arealso observed for excitation into the higher energy levels,such as the 4D1/2, 4D3/2, and the 2P3/2 levels. This indicatesthat from the higher energy emitting levels nonradiative re-laxation to the 4F3/2 level also occurs. This is confirmed bythe excitation spectrum of the 4F3/2→ 4I9/2 emission around866 nm �Fig. 4� where peaks can be observed corresponding
FIG. 2. �Color online� Diffuse reflectance spectra forYF3:Nd3+�0.5%�, Yb3+ �0, 2, 3, 5, and 10%�.
DOWNCONVERSION FOR SOLAR CELLS IN YF3:Nd… PHYSICAL REVIEW B 81, 035107 �2010�
035107-3

to transitions to all levels above the 4F3/2 level of Nd3+.The Nd3+ emission is quenched when the samples are
codoped with Yb3+. At a concentration of 3% Yb3+, the Nd3+
emission both in the visible and in the infrared has almostcompletely disappeared �Fig. 5�. When the Yb3+ concentra-tion is increased to 10% the remaining Nd3+ emission inten-sity is less than 1% of the intensity for the sample withoutYb3+. At the same time, the Yb3+ emission around 1000 nmstarts to increase, and it reaches its maximum for the sampledoped with 0.5% Nd3+ and 5% Yb3+. Increasing the concen-tration further does not lead to a higher Yb3+ emission inten-sity. Instead, the emission intensity starts to decrease for thesample with 0.5% Nd3+ and 10% Yb3+, which is explainedby concentration quenching.
For the highest Yb3+ concentration there is also a changein the relative intensities of the Yb3+ emission at 986 and at1028 nm. The peak at 986 nm is higher than the peak at 1028nm for Yb3+ concentrations up to 5%, while the 1028 nmpeak is higher for the YF3:Nd3+�0.5%�, Yb3+�10%� sample.For this high concentration, reabsorption of the shorter wave-length emission around 986 nm can occur, thus lowering therelative intensity of this emission component. Furthermore,energy transfer over multiple Yb3+ ions can occur to Yb3+
ions that emit at lower-energy values, leading to emission atlonger wavelengths.
The emission spectra recorded after excitation in thelower-energy levels of Nd3+ �below the 4G9/2 level�, shownfor 4G11/2 �520 nm� in Fig. 5�b�, demonstrate that the energytransfer from Nd3+ to Yb3+ after multiphonon relaxation isefficient and does lead to emission from Yb3+ as desired.This indicates that one-step energy transfer occurs from Nd3+
to Yb3+. After nonradiative relaxation to the 4F3/2 level, effi-cient transfer can be expected as the 4F3/2→ 4I11/2 transitionon Nd3+ is resonant with the 2F5/2→ 2F7/2 transition on Yb3+.
To determine if downconversion occurs from the higherenergy levels via the two-step energy transfer process �yield-ing two IR photons� excitation spectra were recorded foremission from the 4F3/2 level of Nd3+ in YF3:Nd3+�0.5%�and emission from the 2F5/2 level of Yb3+ inYF3:Nd3+�0.5%�, Yb3+�2%�. If downconversion occurs froma high energy level, the relative intensity of the peak corre-sponding to the transition to this level should increase in theexcitation spectrum of the Yb3+ emission, as two instead ofone IR photons are generated.18 The spectra are compared bynormalizing to the excitation of the Nd3+ 2G7/2 / 4G5/2 level�Fig. 6�. Excitation below the 2G7/2 / 4G5/2 level will be fol-
FIG. 3. �Color online� Room temperature emission spectra forthe visible �a� and infrared �b� part of the spectrum forYF3:Nd3+�0.5%�. The excitation wavelength is 354 nm �4D1/2level�.
FIG. 4. Room temperature excitation spectrum of 4F3/2→ 4I9/2emission �866 nm� for YF3:Nd3+�0.5%�.
FIG. 5. �Color online� Room temperature emission spectra forYF3:Nd3+�0.5%�, Yb3+ �0, 2, 3, 5, and 10%�. �a� Visible part of thespectrum, excitation wavelength is 354 nm �4D1/2 level�. �b� Infra-red part of the spectrum, excitation wavelength is 520 nm �4G11/2level�.
MEIJER et al. PHYSICAL REVIEW B 81, 035107 �2010�
035107-4

lowed by rapid multiphonon relaxation to the 4F3/2 level as isevident from the small energy gaps separating the levels be-low this level �see Fig. 1�. In both excitation spectra thepeaks for these levels will appear with approximately thesame relative intensities. Figure 6 shows that there is noincrease in the relative intensity of the peak for excitationinto the 4G9/2 level �470 nm� for the Yb3+ codoped samplecompared to the sample only doped with Nd3+. This indicatesthat downconversion does not occur from the 4G9/2 level.There is, however, an increase in the relative intensity of thepeak for excitation into the 4D3/2 level at 354 nm. Whencomparing the excitation peak intensities of the 866 nm Nd3+
and the 986 nm Yb3+ emission, an increase is observed in allsamples codoped with Yb3+ �Fig. 7�. The ratio of the inten-sities of the 4D3/2 excitation peak relative to the 2G7/2 / 4G5/2excitation peaks increases from 1.1 to 1.4 when the Yb3+
concentration is increased from 2 to 10%. This indicates thatdownconversion occurs from the Nd3+ 4D3/2 level, and thatthe efficiency increases with increasing Yb3+ concentration,
as expected. Based on the observed intensity ratios, it can beconcluded that the downconversion efficiency increases up to140% in the sample with 10% Yb3+.
The absence of downconversion from the 4G9/2 level isattributed to multiphonon relaxation. To further investigatethe multiphonon relaxation process, a high resolution excita-tion spectrum of the 4F3/2 emission in YF3:Nd3+�0.5%� wasrecorded to determine the energy gap between the 4G9/2 and2G9/2 level �Fig. 8�. The excitation spectrum shows sharptransitions to the various crystal field �CF� components of the4G9/2 level between 460 and 475 nm and to the 2G9/2 com-ponents between 495 and 525 nm. The energy gap betweenthe lowest CF of the 4G9/2 and the highest CF component ofthe 2G9/2 level is determined to be 1012 cm−1. Since themaximum phonon energy of YF3 is �500 cm−1, the energygap between the 4G9/2 and 2G9/2 level can be bridged by twoto three phonons. Based on the energy-gap law and experi-mental results, a rule of thumb predicts that radiative decayand multiphonon relaxation can compete when the gap is fivetimes the phonon energy. For a smaller energy-gap, mul-tiphonon relaxation dominates. Therefore the absence ofemission from the Nd3+ 4G9/2 level is in agreement withpresent findings: the energy difference between the 4G9/2level and the next lower level �2G9/2� is small enough fornonradiative decay to dominate in this host, making DC fromthe 4G9/2 level inefficient. In hosts with a smaller phononenergy, e.g., chlorides ����250 cm−1� or bromides����180 cm−1�, DC from the 4G9/2 level may competewith nonradiative relaxation, and efficient downconversioncould be achieved.
C. Decay measurements
To gain further insight in the energy transfer processesbetween Nd3+ and Yb3+, luminescence decay curves wererecorded for the Nd3+ and Yb3+ emission upon excitationinto the 4G9/2 level at 456 nm �Figs. 9 and 10�. The lumines-cence decay curves of the Nd3+ 4F3/2 emission �866 nm� inYF3:Nd3+�0.5%� can be described by a single exponentialwith a lifetime of 390 �s. When the sample is codoped with
FIG. 6. �Color online� Room temperature excitation spectrum ofNd3+ emission �1050 nm� in YF3:Nd3+�0.5%� and Yb3+ emission�986 nm� in YF3:Nd3+�0.5%�, Yb3+�2% �, both normalized at 572nm �2G7/2 / 4G5/2�.
FIG. 7. Comparison of relative excitation peak intensities ofNd3+ and Yb3+ emission for YF3:Nd3+�0.5%�, Yb3+ �2, 3, 5, and10%�. The excitation spectra were measured at room temperatureand normalized at 572 nm.
FIG. 8. High resolution excitation spectrum of 1050 nm emis-sion in YF3:Nd3+�0.5%� measured at 4 K.
DOWNCONVERSION FOR SOLAR CELLS IN YF3:Nd… PHYSICAL REVIEW B 81, 035107 �2010�
035107-5
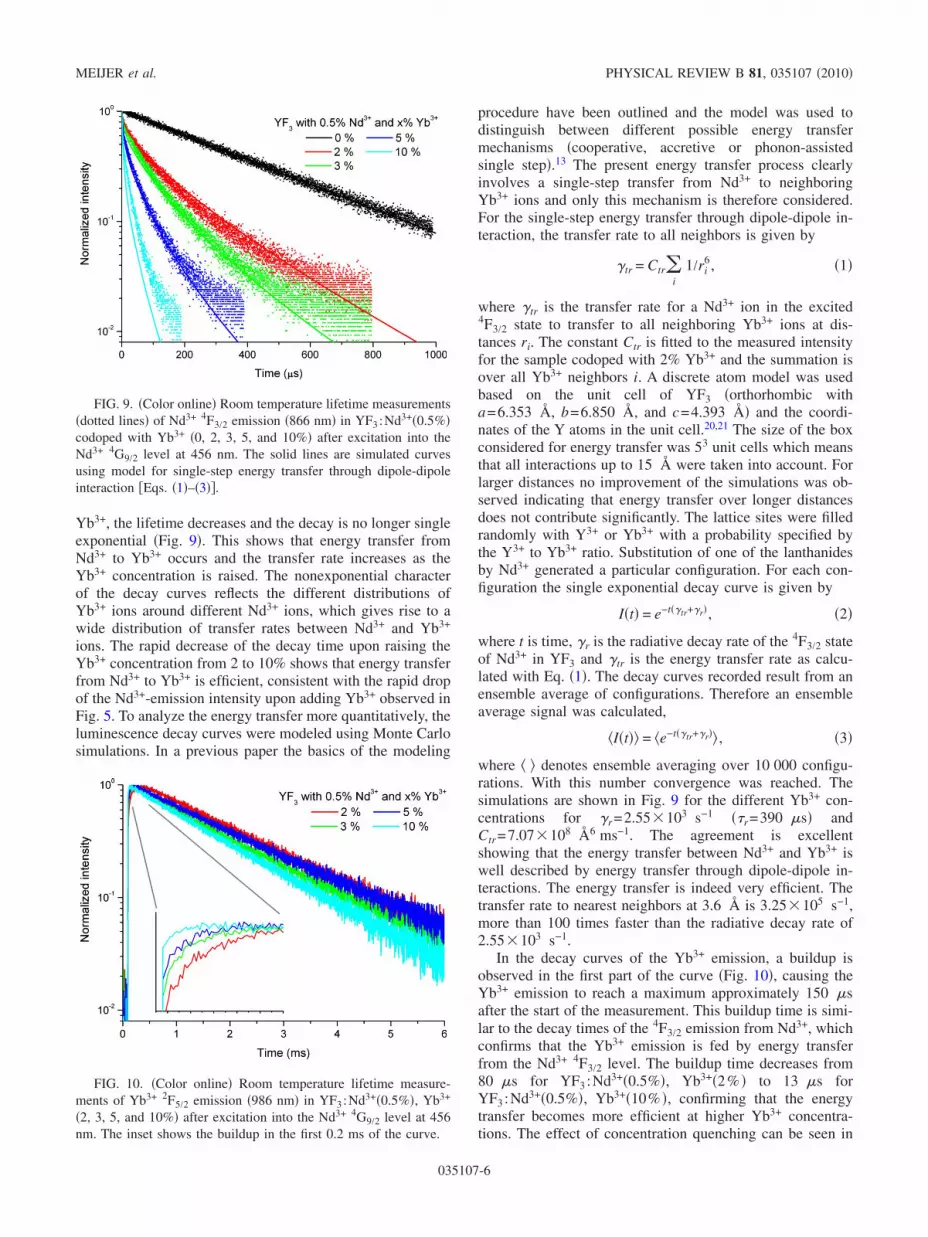
Yb3+, the lifetime decreases and the decay is no longer singleexponential �Fig. 9�. This shows that energy transfer fromNd3+ to Yb3+ occurs and the transfer rate increases as theYb3+ concentration is raised. The nonexponential characterof the decay curves reflects the different distributions ofYb3+ ions around different Nd3+ ions, which gives rise to awide distribution of transfer rates between Nd3+ and Yb3+
ions. The rapid decrease of the decay time upon raising theYb3+ concentration from 2 to 10% shows that energy transferfrom Nd3+ to Yb3+ is efficient, consistent with the rapid dropof the Nd3+-emission intensity upon adding Yb3+ observed inFig. 5. To analyze the energy transfer more quantitatively, theluminescence decay curves were modeled using Monte Carlosimulations. In a previous paper the basics of the modeling
procedure have been outlined and the model was used todistinguish between different possible energy transfermechanisms �cooperative, accretive or phonon-assistedsingle step�.13 The present energy transfer process clearlyinvolves a single-step transfer from Nd3+ to neighboringYb3+ ions and only this mechanism is therefore considered.For the single-step energy transfer through dipole-dipole in-teraction, the transfer rate to all neighbors is given by
�tr = Ctr�i
1/ri6, �1�
where �tr is the transfer rate for a Nd3+ ion in the excited4F3/2 state to transfer to all neighboring Yb3+ ions at dis-tances ri. The constant Ctr is fitted to the measured intensityfor the sample codoped with 2% Yb3+ and the summation isover all Yb3+ neighbors i. A discrete atom model was usedbased on the unit cell of YF3 �orthorhombic witha=6.353 Å, b=6.850 Å, and c=4.393 Å� and the coordi-nates of the Y atoms in the unit cell.20,21 The size of the boxconsidered for energy transfer was 53 unit cells which meansthat all interactions up to 15 Å were taken into account. Forlarger distances no improvement of the simulations was ob-served indicating that energy transfer over longer distancesdoes not contribute significantly. The lattice sites were filledrandomly with Y3+ or Yb3+ with a probability specified bythe Y3+ to Yb3+ ratio. Substitution of one of the lanthanidesby Nd3+ generated a particular configuration. For each con-figuration the single exponential decay curve is given by
I�t� = e−t��tr+�r�, �2�
where t is time, �r is the radiative decay rate of the 4F3/2 stateof Nd3+ in YF3 and �tr is the energy transfer rate as calcu-lated with Eq. �1�. The decay curves recorded result from anensemble average of configurations. Therefore an ensembleaverage signal was calculated,
�I�t�� = �e−t��tr+�r�� , �3�
where � � denotes ensemble averaging over 10 000 configu-rations. With this number convergence was reached. Thesimulations are shown in Fig. 9 for the different Yb3+ con-centrations for �r=2.55�103 s−1 ��r=390 �s� andCtr=7.07�108 Å6 ms−1. The agreement is excellentshowing that the energy transfer between Nd3+ and Yb3+ iswell described by energy transfer through dipole-dipole in-teractions. The energy transfer is indeed very efficient. Thetransfer rate to nearest neighbors at 3.6 Å is 3.25�105 s−1,more than 100 times faster than the radiative decay rate of2.55�103 s−1.
In the decay curves of the Yb3+ emission, a buildup isobserved in the first part of the curve �Fig. 10�, causing theYb3+ emission to reach a maximum approximately 150 �safter the start of the measurement. This buildup time is simi-lar to the decay times of the 4F3/2 emission from Nd3+, whichconfirms that the Yb3+ emission is fed by energy transferfrom the Nd3+ 4F3/2 level. The buildup time decreases from80 �s for YF3:Nd3+�0.5%�, Yb3+�2% � to 13 �s forYF3:Nd3+�0.5%�, Yb3+�10% �, confirming that the energytransfer becomes more efficient at higher Yb3+ concentra-tions. The effect of concentration quenching can be seen in
FIG. 9. �Color online� Room temperature lifetime measurements�dotted lines� of Nd3+ 4F3/2 emission �866 nm� in YF3:Nd3+�0.5%�codoped with Yb3+ �0, 2, 3, 5, and 10%� after excitation into theNd3+ 4G9/2 level at 456 nm. The solid lines are simulated curvesusing model for single-step energy transfer through dipole-dipoleinteraction �Eqs. �1�–�3��.
FIG. 10. �Color online� Room temperature lifetime measure-ments of Yb3+ 2F5/2 emission �986 nm� in YF3:Nd3+�0.5%�, Yb3+
�2, 3, 5, and 10%� after excitation into the Nd3+ 4G9/2 level at 456nm. The inset shows the buildup in the first 0.2 ms of the curve.
MEIJER et al. PHYSICAL REVIEW B 81, 035107 �2010�
035107-6

the long time part of the decay curve: at low Yb3+ concen-trations the lifetime is approximately 1900 �s, and as theYb3+ concentration increases to 10%, the lifetime decreasesto �1560 �s. The decrease in lifetime is ascribed to energymigration of the excitation energy over the Yb3+ sublattice,which can result in quenching of the luminescence if themigrating excitation encounters a quenching site.
D. Temperature dependent measurements
To gain further understanding about the energy transferprocesses and the concentration quenching in YF3:Nd3+,Yb3+, temperature dependent measurements were performed.Figure 11 shows typical temperature-dependent spectra forYF3:Nd3+�0.5%�, Yb3+�2% �. At 4 K the emission peaks ofboth Nd3+ and Yb3+ are very narrow compared to the spectraat room temperature. Thermally induced relaxation processescause the emission peaks to broaden at higher temperatures�lifetime broadening�. Furthermore, additional peaks foremission from higher crystal field components start to appearwhen the temperature is raised. An example of this effect isthe peak for emission from a higher crystal field componentof the Yb3+ 2F5/2 level at 965 nm that appears when thetemperature is increased to 50 K.
As seen from the room temperature emission spectra �Fig.5� and the lifetime measurements of the Yb3+ emission �Fig.10� Yb3+ 2F5/2 emission starts to decrease due to concentra-tion quenching for high Yb3+ concentrations. At very lowtemperatures �4 K�, concentration quenching is hampered,which causes a strong increase in the Yb3+ emission inten-sity. This is explained by the small energy mismatches be-tween the energy levels of neighboring Yb3+ ions, whichimpose the need for phonon-assisted energy transfer; byfreezing out the phonons at low temperatures, the energymigration becomes less efficient and the concentrationquenching is reduced.
At low temperatures, an additional peak is visible in theYb3+ emission spectra at 980.5 nm �see the inset of Fig. 11�,
which disappears when the temperature is raised above 50 K.Low-temperature lifetime measurements for the emissionpeaks between 980 and 1024 nm are compared �Fig. 12�. Thelifetime of the tail of the decay curves is approximately1500 �s for all curves, and all four decay curves show abuildup in the beginning of the curve. The buildup time is�50 �s for emission wavelengths between 987 and 1024nm, and is attributed to energy transfer from Nd3+ to Yb3+
�see also Fig. 10�. The buildup time for the 980.5 nm emis-sion is approximately 225 �s. The longer buildup time onthe decay curve and the observation that this emission peakdisappears above 50 K can be explained by the presence of asmall amount of oxygen in the sample. For Yb3+ ions situ-ated next to an oxygen impurity, a very common contamina-tion in fluorides, the lowest 2F5/2 level is lowered in energy��47 cm−1 based on the position of the emission lines at976 nm for Yb3+ on the dominant site, and 980.5 nm forYb3+ next to an oxygen impurity, which will be indicated byYb-OF��. At higher temperatures thermal detrapping occurs,and this explains the observed decrease in the 980.5 nmemission intensity above 50 K. To confirm the presence ofYb-OF�, the excitation spectrum for the 980.5 nm emissionwas compared to an excitation spectrum of Yb3+ emission at987 nm �Fig. 13�a��. In the excitation spectrum for the Yb3+
emission �solid line� peaks for excitation into the differentNd3+ levels are present �compare Fig. 6�, while for the 980.5nm emission �dotted line� a broad band between 250 and 350nm can be observed. Such a band is typical for oxygenligand-to-metal charge-transfer �CT� for lanthanides, in thiscase from O2− to Yb3+.22 This is further confirmed by com-paring the emission spectra for excitation into the CT bandwhich results in an intense Yb3+ emission at 980.5 nm, whilefor excitation into the Nd3+ 4G9/2 level the intrinsic Yb3+
emission lines dominate �Fig. 13�b��. The shift of the emis-sion peak indicates that oxygen lowers the position of theYb3+ 2F5/2 energy level, which can then act as an energy trap�Yb-OF�� at lower temperatures, resulting in an emission peakat 980 nm below 50 K �Fig. 11�. The slower buildup in thedecay curve of the 980 nm emission is then explained byenergy transfer to Yb-OF� �Fig. 12�.
FIG. 11. �Color online� Temperature dependent emission spectrafor YF3:Nd3+�0.5%�, Yb3+�2%�. The inset shows the effect of tem-perature on the peak at 980 nm.
FIG. 12. �Color online� Lifetime measurements at 4 K of Yb3+
2F5/2 emission at different wavelengths in YF3:Nd3+�0.5%�,Yb3+�5% � after excitation into the Nd3+ 4G9/2 level at 456 nm.
DOWNCONVERSION FOR SOLAR CELLS IN YF3:Nd… PHYSICAL REVIEW B 81, 035107 �2010�
035107-7

The presence of oxygen can also be observed in the ab-sorption spectra as an absorption band around 250 nm �Fig.2�. Oxygen and fluoride have a similar ionic radius, makingoxide contamination of fluorides a commonly observed prob-lem.
IV. CONCLUSIONS
Downconversion for the �Nd3+ ,Yb3+� couple has been in-vestigated in YF3:Nd3+, Yb3+. Emission and excitation mea-surements of YF3:Nd3+�0.5%� show that excitation into en-ergy levels of Nd3+ between 28 500 and 17 500 cm−1 �350–
570 nm�, results in nonradiative decay to the 4F3/2 level,followed by emission from this level to the 4IJ levels in theinfrared. In codoped samples downconversion fromthe Nd3+ 4G9/2 level via the cross-relaxation processNd3+ �4G9/2→ 4F3/2�, Yb3+ �2F7/2→ 2F5/2�, followed by a sec-ond energy transfer step from the 4F3/2 level of Nd3+ to Yb3+,could possibly lead to the emission of two IR photons fromYb3+. However, fast multiphonon relaxation is found to oc-cur from the 4G9/2 level to the lower 2G9/2 level and thisprevents efficient downconversion from the 4G9/2 level, ascross-relaxation is much less efficient than multiphonon re-laxation.
The multiphonon relaxation from the 4G9/2 level andlower-energy levels results in population of the 4F3/2 level ofNd3+. From here efficient one-step energy transfer to Yb3+
occurs through dipole-dipole interaction. The energy differ-ence between the Nd3+ 4G9/2 and the next lower 2G9/2 level isdetermined to be 1012 cm−1 and this small energy differenceexplains that multiphonon relaxation dominates in YF3,where the maximum phonon energy is around 500 cm−1.Possibly efficient downconversion from the Nd3+ 4G9/2 levelto two Yb3+ ions can be achieved in a host lattice with muchlower phonon energies �e.g., bromides or chlorides�.
From the higher energy 4D3/2 level of Nd3+ downconver-sion is observed with efficiencies up to 40%. The high en-ergy position of this level �in the UV part of the spectrum�does not make this a promising downconversion route forsolar cell applications.
ACKNOWLEDGMENTS
This work is part of the Joint Solar Programme �JSP� ofthe Stichting voor Fundamenteel Onderzoek der MaterieFOM, which is supported financially by Nederlandse Organi-satie voor Wetenschappelijk Onderzoek �NWO�. The JSP iscofinanced by Gebied Chemische Wetenschappen of NWOand Stichting Shell Research. Financial support from the“Energie Onderzoek Subsidie” �EOS� program of Senter-Novem, an agency of the “Ministerie van EconomischeZaken” of the Netherlands, is gratefully acknowledged.
*[email protected] W. Shockley and H. J. Queisser, J. Appl. Phys. 32, 510 �1961�.2 M. A. Green, K. Emery, Y. Hishikawa, and W. Warta, Prog.
Photovoltaics 17, 85 �2009�.3 F. Auzel, Chem. Rev. 104, 139 �2004�.4 R. T. Wegh, H. Donker, K. D. Oskam, and A. Meijerink, Science
283, 663 �1999�.5 T. Trupke, M. A. Green, and P. Würfel, J. Appl. Phys. 92, 1668
�2002�.6 T. Trupke, M. A. Green, and P. Würfel, J. Appl. Phys. 92, 4117
�2002�.7 T. Trupke, A. Shalav, B. S. Richards, P. Würfel, and M. A.
Green, Sol. Energy Mater. Sol. Cells 90, 3327 �2006�.8 J. F. Suyver, A. Aebischer, D. Biner, P. Gerner, J. Grimm, S.
Heer, K. W. Krämer, C. Reinhard, and H. U. Güdel, Opt. Mater.
27, 1111 �2005�.9 P. Gibart, F. Auzel, J. C. Guillaume, and K. Zahraman, Jpn. J.
Appl. Phys., Part 1 35, 4401 �1996�.10 A. Shalav, B. S. Richards, T. Trupke, K. W. Krämer, and H. U.
Güdel, Appl. Phys. Lett. 86, 013505 �2005�.11 K. D. Oskam, R. T. Wegh, H. Donker, E. V. D. van Loef, and A.
Meijerink, J. Alloys Compd. 300-301, 421 �2000�.12 R. T. Wegh, E. V. D. van Loef, and A. Meijerink, J. Lumin. 90,
111 �2000�.13 P. Vergeer, T. J. H. Vlugt, M. H. F. Kox, M. I. den Hertog, J. P.
J. M. van der Eerden, and A. Meijerink, Phys. Rev. B 71,014119 �2005�.
14 Q. Y. Zhang, G. F. Yang, and Z. H. Jiang, Appl. Phys. Lett. 91,051903 �2007�.
15 J. L. Yuan, X. Y. Zeng, J. T. Zhao, Z. J. Zhang, H. H. Chen, and
FIG. 13. �Color online� Excitation �a� and emission �b� spectrafor YF3:Nd3+�0.5%�, Yb3+�10% � showing the O2−-Yb3+ CT bandand emission from Yb3+ affected by the presence of oxygen�Yb-OF��.
MEIJER et al. PHYSICAL REVIEW B 81, 035107 �2010�
035107-8

X. X. Yang, J. Phys. D 41, 105406 �2008�.16 G. Lakshminarayana, H. Yang, S. Ye, Y. Liu, and J. Qiu, J.
Mater. Res. 23, 3090 �2008�.17 G. Lakshminarayana, H. Yang, S. Ye, Y. Liu, and J. Qiu, J. Phys.
D 41, 175111 �2008�.18 B. M. van der Ende, L. Aarts, and A. Meijerink, Adv. Mater. 21,
3073 �2009�.19 H. E. Rast, H. H. Caspers, and S. A. Miller, Phys. Rev. 180, 890
�1969�.20 Ralph Walter Graystone Wyckoff, Crystal Structures, 2nd ed.
�Interscience, New York, 1963�, Vol. 2, p. 58–60.21 A. Zalkin and D. H. Templeton, J. Am. Chem. Soc. 75, 2453
�1953�.22 L. van Pieterson, M. Heeroma, E. de Heer, and A. Meijerink, J.
Lumin. 91, 177 �2000�.
DOWNCONVERSION FOR SOLAR CELLS IN YF3:Nd… PHYSICAL REVIEW B 81, 035107 �2010�
035107-9


![Electronic spectra of Yb[sup 2+]-doped SrCl[sub 2]](https://static.fdokumen.com/doc/165x107/633592f8b5f91cb18a0b76fc/electronic-spectra-of-ybsup-2-doped-srclsub-2.jpg)