Applications of depth-resolved cathodoluminescence spectroscopy
Upload
independentCategory
view
2download
0
EGFR Variant Heterogeneity in Glioblastoma Resolved through Single-Nucleus Sequencing Joshua M. Francis 1,2 , Cheng-Zhong Zhang 1 , Cecile L. Maire 2 , Joonil Jung 1 , Veronica E. Manzo 2 , Viktor A. Adalsteinsson 1,3,4 , Heather Homer 5 , Sam Haidar 2 , Brendan Blumenstiel 1 , Chandra Sekhar Pedamallu 1,2 Azra H. Ligon 5,6,7,8 , J. Christopher Love 1,3,4 , Matthew Meyerson 1,2,8,9 and Keith L. Ligon 2,5,6,7,8
RESEARCH ARTICLE

AUGUST 2014�CANCER DISCOVERY | 957
1 Broad Institute of Harvard and MIT, Cambridge, Massachusetts. 2 Depart-ment of Medical Oncology, Dana-Farber Cancer Institute, Boston, Massa-chusetts. 3 Department of Chemical Engineering, Massachusetts Institute of Technology, Cambridge, Massachusetts. 4 The David H. Koch Institute for Integrative Cancer Research, Massachusetts Institute of Technology, Cam-bridge, Massachusetts. 5 Center for Molecular Oncologic Pathology, Dana-Farber Cancer Institute, Boston, Massachusetts. 6 Department of Pathology, Brigham and Women’s Hospital, Boston, Massachusetts. 7 Department of Pathology, Boston Children’s Hospital, Boston, Massachusetts. 8 Department of Pathology, Harvard Medical School, Boston, Massachusetts. 9 Center for Can-cer Genome Discovery, Dana-Farber Cancer Institute, Boston, Massachusetts.
Note: Supplementary data for this article are available at Cancer Discovery Online (http://cancerdiscovery.aacrjournals.org/).
J.M. Francis, C.-Z. Zhang, and C.L. Maire contributed equally to this article.
Corresponding Authors: Keith L. Ligon, Dana-Farber Cancer Institute, 450 Brookline Avenue, Boston, MA 02215. Phone: 617-632-2357; Fax: 617-582-8760; E-mail: [email protected] ; and Mathew Meyerson, [email protected]
doi: 10.1158/2159-8290.CD-13-0879
©2014 American Association for Cancer Research.
ABSTRACT Glioblastomas (GBM) with EGFR amplifi cation represent approximately 50% of
newly diagnosed cases, and recent studies have revealed frequent coexistence of
multiple EGFR aberrations within the same tumor, which has implications for mutation cooperation and
treatment resistance. However, bulk tumor sequencing studies cannot resolve the patterns of how the
multiple EGFR aberrations coexist with other mutations within single tumor cells. Here, we applied a
population-based single-cell whole-genome sequencing methodology to characterize genomic hetero-
geneity in EGFR -amplifi ed glioblastomas. Our analysis effectively identifi ed clonal events, including a
novel translocation of a super enhancer to the TERT promoter, as well as subclonal LOH and multiple
EGFR mutational variants within tumors. Correlating the EGFR mutations onto the cellular hierarchy
revealed that EGFR truncation variants (EGFRvII and EGFR carboxyl-terminal deletions) identifi ed in
the bulk tumor segregate into nonoverlapping subclonal populations. In vitro and in vivo functional
studies show that EGFRvII is oncogenic and sensitive to EGFR inhibitors currently in clinical trials. Thus,
the association between diverse activating mutations in EGFR and other subclonal mutations within a
single tumor supports an intrinsic mechanism for proliferative and clonal diversifi cation with broad
implications in resistance to treatment.
SIGNIFICANCE: We developed a novel single-cell sequencing methodology capable of identifying
unique, nonoverlapping subclonal alterations from archived frozen clinical specimens. Using GBM as an
example, we validated our method to successfully defi ne tumor cell subpopulations containing distinct
genetic and treatment resistance profi les and potentially mutually cooperative combinations of altera-
tions in EGFR and other genes. Cancer Discov; 4(8); 956–71. ©2014 AACR.
See related commentary by Gini and Mischel, p. 876.
INTRODUCTION Glioblastoma (GBM), also known as diffuse astrocytoma
WHO grade IV, is the most common primary brain tumor in
adults and a leading example of a tumor containing a high
degree of cellular heterogeneity ( 1 ). Recurrent genetic altera-
tions in GBM have been identifi ed ( 2–4 ), with frequent ampli-
fi cation of several receptor tyrosine kinases (RTK) including
EGFR , PDGFRA , and MET . Genomic heterogeneity in tumors
of the central nervous system, especially GBM, is an emerg-
ing problem with substantial ramifi cations for treatment
strategies ( 5, 6 ). One of the most prominent examples is the
mosaic pattern of different RTK amplifi cations present in
different subpopulations of tumor cells ( 7, 8 ).
As the most frequent RTK amplifi cation in glioblastoma,
EGFR is focally amplifi ed in about half of all primary glio-
blastomas and in 95% of the classic subtype ( 9 ). Recent reports
by The Cancer Genome Atlas (TCGA) revealed unprecedented
complexity at the focally amplifi ed EGFR locus within indi-
vidual tumors, including clusters of chromosomal break-
points ( 10, 11 ), and the expression of multiple EGFR variants
and extracellular domain missense mutations ( 4 , 12 ). How-
ever, outside of the EGFRvIII variant and carboxyl-terminal
truncations, it is currently unknown whether many such vari-
ants are oncogenic and how such variants coexist at a single-
cell level ( 13–15 ). Such patterns are important with regard to
whether aberrations may functionally cooperate within indi-
vidual cells or between cells with differing mutations. The
functional importance of such distinctions is underscored
by recent work showing the differential effects and interac-
tions of variant receptors on EGFR activation within indi-
vidual cells ( 16 ). Furthermore, extrachromosomal amplicons
containing EGFRvIII (a constitutively active form of EGFR
resulting from the deletion of exons 2–7) were recently shown
to be dynamically lost and/or silenced in response to EGFR
inhibitor treatment and then to re-emerge following removal
of this selective pressure ( 5 ). The expression of EGFRvIII is
also known to be regionally heterogeneous by IHC and RT-
PCR, and it has been proposed that there may be functional
synergy between tumor cells expressing the oncogenic variant
(EGFRvIII) and those with the slower-growing counterpart
(EGFRwt; refs. 5 , 14 , 17 ). However, whether this heterogeneity
958 | CANCER DISCOVERY�AUGUST 2014 www.aacrjournals.org
Francis et al.RESEARCH ARTICLE
is due to differences in the genomes of single cells has not
been fully assessed.
Traditional statistical analysis of bulk average sequencing
data cannot resolve the complexity at the EGFR locus because
both the high copy number and the nonmitotic segregation
of EGFR variants present in extrachromosomal amplicons pre-
vent accurate clonality inference ( 18, 19 ). Although FISH can
assess the amplifi cations of different RTK genes ( EGFR , PDG-
FRA , and MET ), it is diffi cult to distinguish between multiple
variants of these oncogenes by FISH, as it is generally limited
to the characterization of known alterations spanning large
genomic regions, and cannot probe single-nucleotide variants
(SNV), short deletions, or discover de novo alterations.
Single-cell sequencing has great potential to dissect coexist-
ing genomic alterations. Here, we describe a population-based
framework for single-cell genomic analysis and demonstrate
its potential by dissecting the subclonal populations in two
primary glioblastomas with focal EGFR amplifi cations. Our
methodology uses a novel approach for confi dent inference of
LOH and enables unambiguous characterization of the sub-
clonal tumor cell populations with implications for EGFR-
targeted therapies in brain cancer and other cancers.
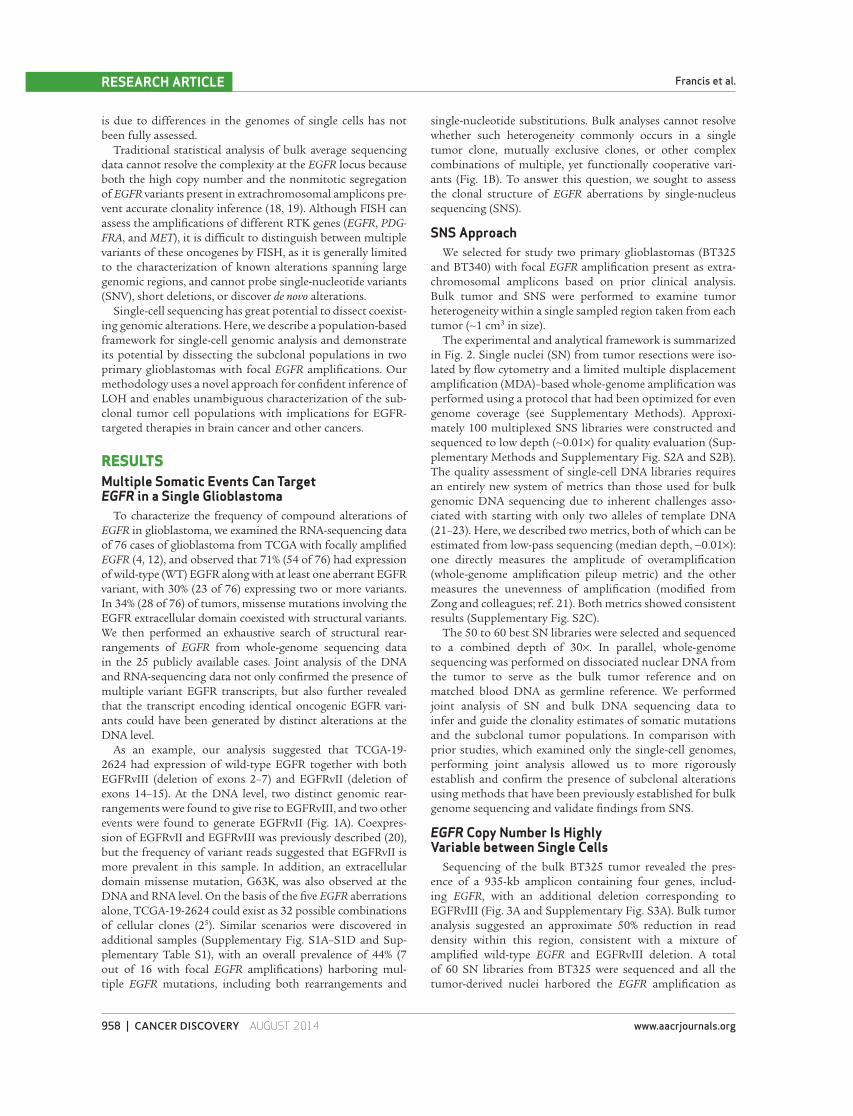
RESULTS Multiple Somatic Events Can Target EGFR in a Single Glioblastoma
To characterize the frequency of compound alterations of
EGFR in glioblastoma, we examined the RNA-sequencing data
of 76 cases of glioblastoma from TCGA with focally amplifi ed
EGFR ( 4 , 12 ), and observed that 71% (54 of 76) had expression
of wild-type (WT) EGFR along with at least one aberrant EGFR
variant, with 30% (23 of 76) expressing two or more variants.
In 34% (28 of 76) of tumors, missense mutations involving the
EGFR extracellular domain coexisted with structural variants.
We then performed an exhaustive search of structural rear-
rangements of EGFR from whole-genome sequencing data
in the 25 publicly available cases. Joint analysis of the DNA
and RNA-sequencing data not only confi rmed the presence of
multiple variant EGFR transcripts, but also further revealed
that the transcript encoding identical oncogenic EGFR vari-
ants could have been generated by distinct alterations at the
DNA level.
As an example, our analysis suggested that TCGA-19-
2624 had expression of wild-type EGFR together with both
EGFRvIII (deletion of exons 2–7) and EGFRvII (deletion of
exons 14–15). At the DNA level, two distinct genomic rear-
rangements were found to give rise to EGFRvIII, and two other
events were found to generate EGFRvII ( Fig. 1A ). Coexpres-
sion of EGFRvII and EGFRvIII was previously described ( 20 ),
but the frequency of variant reads suggested that EGFRvII is
more prevalent in this sample. In addition, an extracellular
domain missense mutation, G63K, was also observed at the
DNA and RNA level. On the basis of the fi ve EGFR aberrations
alone, TCGA-19-2624 could exist as 32 possible combinations
of cellular clones (2 5 ). Similar scenarios were discovered in
additional samples (Supplementary Fig. S1A–S1D and Sup-
plementary Table S1), with an overall prevalence of 44% (7
out of 16 with focal EGFR amplifi cations) harboring mul-
tiple EGFR mutations, including both rearrangements and
single-nucleotide substitutions. Bulk analyses cannot resolve
whether such heterogeneity commonly occurs in a single
tumor clone, mutually exclusive clones, or other complex
combinations of multiple, yet functionally cooperative vari-
ants ( Fig. 1B ). To answer this question, we sought to assess
the clonal structure of EGFR aberrations by single-nucleus
sequencing (SNS).
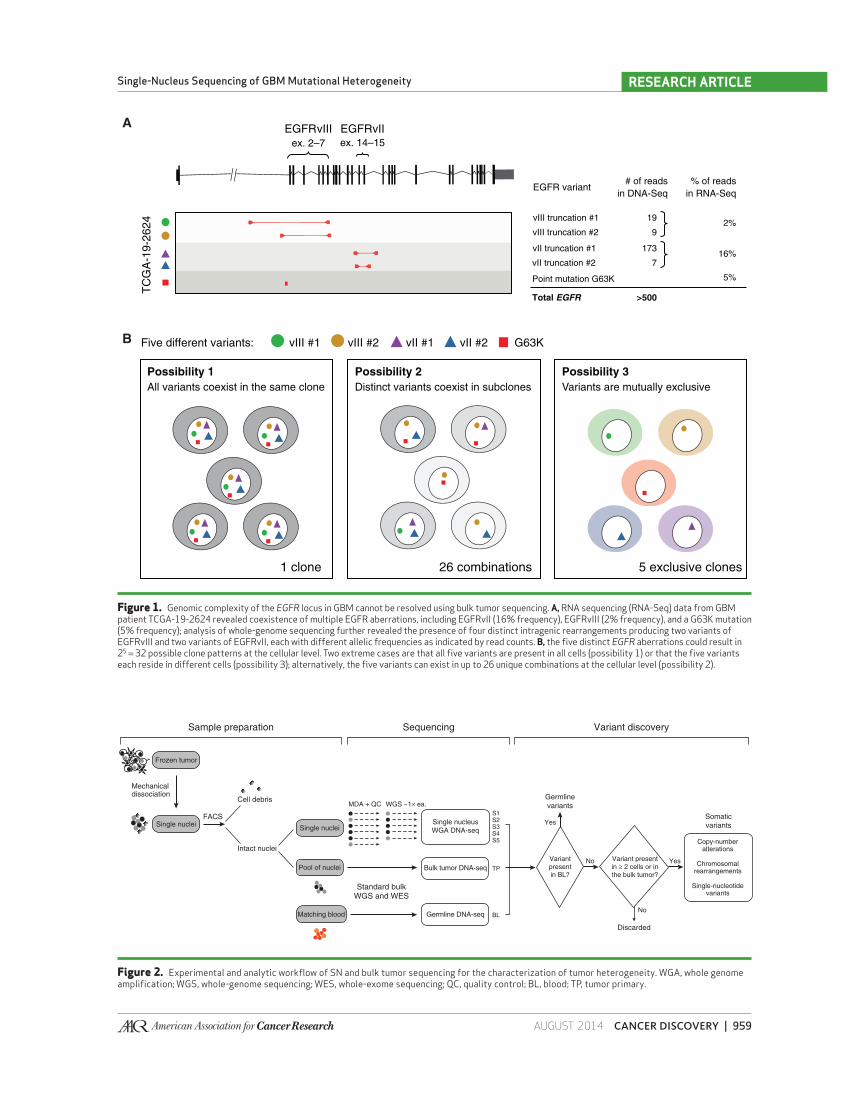
SNS Approach We selected for study two primary glioblastomas (BT325
and BT340) with focal EGFR amplifi cation present as extra-
chromosomal amplicons based on prior clinical analysis.
Bulk tumor and SNS were performed to examine tumor
heterogeneity within a single sampled region taken from each
tumor (∼1 cm 3 in size).
The experimental and analytical framework is summarized
in Fig. 2 . Single nuclei (SN) from tumor resections were iso-
lated by fl ow cytometry and a limited multiple displacement
amplifi cation (MDA)–based whole-genome amplifi cation was
performed using a protocol that had been optimized for even
genome coverage (see Supplementary Methods). Approxi-
mately 100 multiplexed SNS libraries were constructed and
sequenced to low depth (∼0.01×) for quality evaluation (Sup-
plementary Methods and Supplementary Fig. S2A and S2B).
The quality assessment of single-cell DNA libraries requires
an entirely new system of metrics than those used for bulk
genomic DNA sequencing due to inherent challenges asso-
ciated with starting with only two alleles of template DNA
( 21–23 ). Here, we described two metrics, both of which can be
estimated from low-pass sequencing (median depth, ∼0.01×):
one directly measures the amplitude of overamplifi cation
(whole-genome amplifi cation pileup metric) and the other
measures the unevenness of amplifi cation (modifi ed from
Zong and colleagues; ref. 21 ). Both metrics showed consistent
results (Supplementary Fig. S2C).
The 50 to 60 best SN libraries were selected and sequenced
to a combined depth of 30×. In parallel, whole-genome
sequencing was performed on dissociated nuclear DNA from
the tumor to serve as the bulk tumor reference and on
matched blood DNA as germline reference. We performed
joint analysis of SN and bulk DNA sequencing data to
infer and guide the clonality estimates of somatic mutations
and the subclonal tumor populations. In comparison with
prior studies, which examined only the single-cell genomes,
performing joint analysis allowed us to more rigorously
establish and confi rm the presence of subclonal alterations
using methods that have been previously established for bulk
genome sequencing and validate fi ndings from SNS.
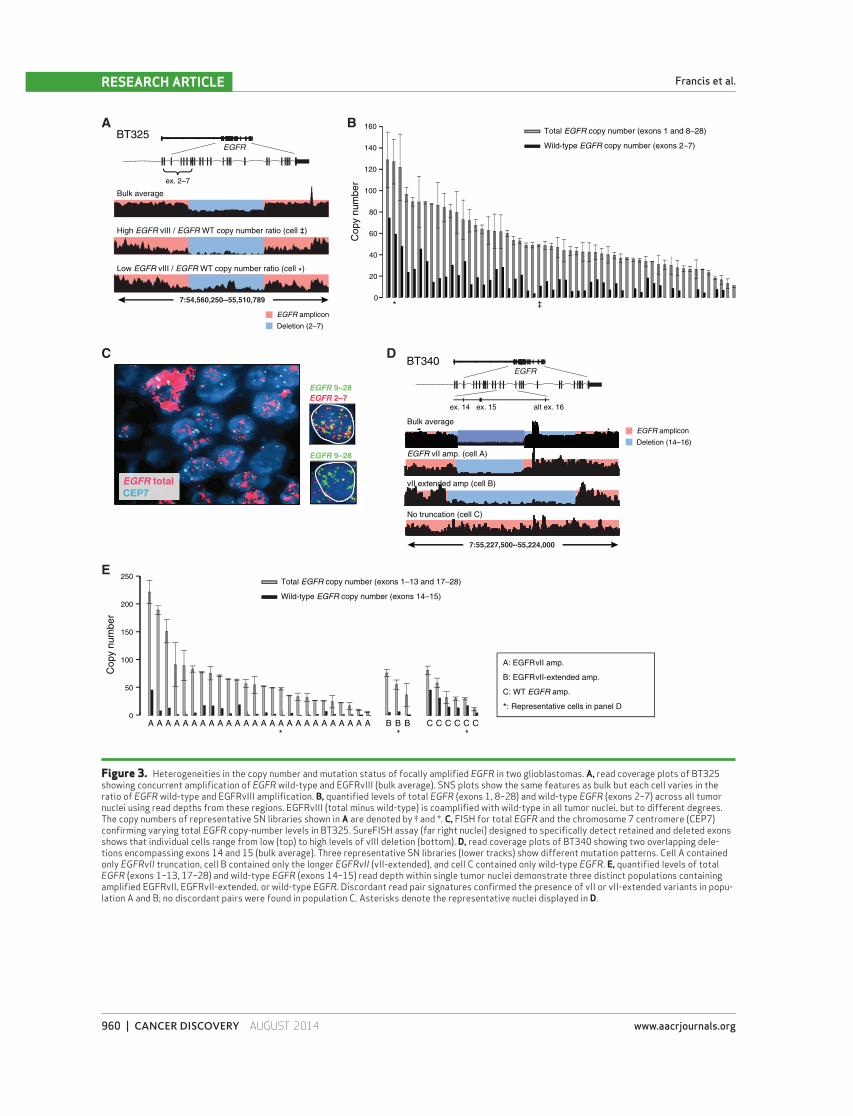
EGFR Copy Number Is Highly Variable between Single Cells
Sequencing of the bulk BT325 tumor revealed the pres-
ence of a 935-kb amplicon containing four genes, includ-
ing EGFR , with an additional deletion corresponding to
EGFRvIII ( Fig. 3A and Supplementary Fig. S3A). Bulk tumor
analysis suggested an approximate 50% reduction in read
density within this region, consistent with a mixture of
amplifi ed wild-type EGFR and EGFRvIII deletion. A total
of 60 SN libraries from BT325 were sequenced and all the
tumor-derived nuclei harbored the EGFR amplifi cation as
AUGUST 2014�CANCER DISCOVERY | 959
Single-Nucleus Sequencing of GBM Mutational Heterogeneity RESEARCH ARTICLE
Figure 1. Genomic complexity of the EGFR locus in GBM cannot be resolved using bulk tumor sequencing. A, RNA sequencing (RNA-Seq) data from GBM patient TCGA-19-2624 revealed coexistence of multiple EGFR aberrations, including EGFRvII (16% frequency), EGFRvIII (2% frequency), and a G63K mutation (5% frequency); analysis of whole-genome sequencing further revealed the presence of four distinct intragenic rearrangements producing two variants of EGFRvIII and two variants of EGFRvII, each with different allelic frequencies as indicated by read counts. B, the fi ve distinct EGFR aberrations could result in 2 5 = 32 possible clone patterns at the cellular level. Two extreme cases are that all fi ve variants are present in all cells (possibility 1) or that the fi ve variants each reside in different cells (possibility 3); alternatively, the fi ve variants can exist in up to 26 unique combinations at the cellular level (possibility 2).
A
TC
GA
-19
-26
24
Point mutation G63K
B
vIII truncation #1
vIII truncation #2
vII truncation #1
vII truncation #2
Total EGFR
% of reads
in RNA-Seq
2%
16%
5%
EGFR variant# of reads
in DNA-Seq
19
9
173
7
>500
Possibility 3
Variants are mutually exclusive
5 exclusive clones
Possibility 2
Distinct variants coexist in subclones
26 combinations
vIII #1 G63KFive different variants: vIII #2 vII #1 vII #2
Possibility 1
All variants coexist in the same clone
1 clone
EGFRvIIEGFRvIII
ex. 2–7 ex. 14–15
Figure 2. Experimental and analytic workfl ow of SN and bulk tumor sequencing for the characterization of tumor heterogeneity. WGA, whole genome amplifi cation; WGS, whole-genome sequencing; WES, whole-exome sequencing; QC, quality control; BL, blood; TP, tumor primary.
Sample preparation Variant discovery
Mechanicaldissociation
Frozen tumor
Intact nuclei
Cell debris
BL
TP
Standard bulkWGS and WES
S1S2S3S4S5
FACS
Sequencing
Single nucleiSingle nuclei
Pool of nuclei
Matching blood
MDA + QC WGS ~1× ea.
Single nucleus
WGA DNA-seq
Bulk tumor DNA-seq
Germline DNA-seq
Yes
No
No
Variantpresentin BL?
Variant presentin ≥ 2 cells or inthe bulk tumor?
Copy-numberalterations
Chromosomalrearrangements
Single-nucleotidevariants
Germline
variants
Discarded
Somatic
variants
Yes
960 | CANCER DISCOVERY�AUGUST 2014 www.aacrjournals.org
Francis et al.RESEARCH ARTICLE
Figure 3. Heterogeneities in the copy number and mutation status of focally amplifi ed EGFR in two glioblastomas. A, read coverage plots of BT325 showing concurrent amplifi cation of EGFR wild-type and EGFRvIII (bulk average). SNS plots show the same features as bulk but each cell varies in the ratio of EGFR wild-type and EGFRvIII amplifi cation. B, quantifi ed levels of total EGFR (exons 1, 8–28) and wild-type EGFR (exons 2–7) across all tumor nuclei using read depths from these regions. EGFRvIII (total minus wild-type) is coamplifi ed with wild-type in all tumor nuclei, but to different degrees. The copy numbers of representative SN libraries shown in A are denoted by ‡ and *. C, FISH for total EGFR and the chromosome 7 centromere (CEP7) confi rming varying total EGFR copy-number levels in BT325. SureFISH assay (far right nuclei) designed to specifi cally detect retained and deleted exons shows that individual cells range from low (top) to high levels of vIII deletion (bottom). D, read coverage plots of BT340 showing two overlapping dele-tions encompassing exons 14 and 15 (bulk average). Three representative SN libraries (lower tracks) show different mutation patterns. Cell A contained only EGFRvII truncation, cell B contained only the longer EGFRvII (vII-extended), and cell C contained only wild-type EGFR . E, quantifi ed levels of total EGFR (exons 1–13, 17–28) and wild-type EGFR (exons 14–15) read depth within single tumor nuclei demonstrate three distinct populations containing amplifi ed EGFRvII, EGFRvII-extended, or wild-type EGFR . Discordant read pair signatures confi rmed the presence of vII or vII-extended variants in popu-lation A and B; no discordant pairs were found in population C. Asterisks denote the representative nuclei displayed in D.
Bulk average
BT325
20
40
60
80
100
120
140
160
Copy n
um
ber
BT340
EGFR
EGFR total
CEP7
7:54,560,250--55,510,789
A B
0
ex. 2–7
High EGFR vIII / EGFR WT copy number ratio (cell ‡)
Low EGFR vIII / EGFR WT copy number ratio (cell *)
Total EGFR copy number (exons 1 and 8–28)
Wild-type EGFR copy number (exons 2–7)
‡*EGFR amplicon
Deletion (2–7)
C D
EGFR amplicon
Deletion (14–16)
Bulk average
EGFR
7:55,227,500--55,224,000
ex. 14
EGFR vII amp. (cell A)
ex. 15 alt ex. 16
vII extended amp (cell B)
No truncation (cell C)
EGFR 9–28
EGFR 2–7
EGFR 9–28
E
50
100
150
200
250
Copy n
um
ber
0
Total EGFR copy number (exons 1–13 and 17–28)
Wild-type EGFR copy number (exons 14–15)
A A A A A A A A A A A A A A A A A A AA A A AAA A B B B C C C CCC
***
A: EGFRvII amp.
C: WT EGFR amp.
B: EGFRvII-extended amp.
*: Representative cells in panel D
AUGUST 2014�CANCER DISCOVERY | 961
Single-Nucleus Sequencing of GBM Mutational Heterogeneity RESEARCH ARTICLE
well as the vIII deletion ( Fig. 3B ). The common EGFR ampli-
con boundaries and EGFRvIII deletion breakpoints shared
among tumor nuclei suggested that the deletion occurred
after the wild-type EGFR amplifi cation. The total EGFR copy
number and the wild-type EGFR copy number estimated
from the read depth demonstrated that each individual cell
harbored amplifi cations of both wild-type EGFR as well as
EGFRvIII, albeit at varying levels. To further validate our
fi ndings, we designed an oligonucleotide-based multiprobe
FISH assay that specifi cally discriminates between the exons
deleted in the EGFRvIII variant and those retained. Applica-
tion of this novel FISH approach to BT325 validated the
large differences in total EGFR copy number, including the
presence of variation in levels of EGFRvIII among individual
cells ( Fig. 3C ). Our observation of highly variable levels of
EGFRvIII at the single-cell DNA level with respect to wild-
type EGFR further supports a mechanism for local selective
pressure of EGFR variants that may be associated with nutri-
ent availability and diversifi cation.
Multiple EGFRvII Variants Exist in Nonoverlapping Cell Populations
We next performed sequencing of the BT340 tumor. This
tumor harbored a 535-kb amplicon containing the EGFR
locus (Supplementary Fig. S3B). Bulk sequencing showed a
marked decrease in read density in the region of exons 14 and
15 indicative of EGFRvII ( Fig. 3D , top). An additional region
of decreased read density indicative of a 7.6-kb deletion that
included alternative exon 16 was also found. Discordant read
pairs in the bulk tumor sequencing data corroborated the
presence of these deletions and defi ned their precise bounda-
ries as being distinct (Supplementary Fig. S3C). We denoted
this novel deletion variant as EGFRvII-extended.
Examination of SNS libraries showed three distinct cell
populations with respect to exons 14 to 16 of the EGFR locus
( Fig. 3D ). EGFRvII and EGFRvII-extended segregated into
two populations based on read depth and discordant read
pairs corresponding to the rearrangements ( Fig. 3D , cell A
and cell B). Cells that did not harbor any discordant read
pairs supporting either EGFRvII variant were inferred to
retain these exons ( Fig. 3D , cell C). The initial amplicon was
derived from a single copy of the wild-type allele (allele A)
as assessed by germline SNVs; however, the exact number of
copies per amplicon cannot be determined.
We further characterized the copy number of different
EGFR variants within each individual cell. The total EGFR
copy number was estimated from the read depths in exons
1 to 13 and in exons 17 to 28, and the wild-type EGFR copy
number was estimated from the read depth in exons 14 and
15. In 35 of the 48 SN libraries, we were able to confi dently
assess the absolute number of EGFR copies. The total EGFR
copy number showed an extremely broad range, from fi ve
copies to more than 200 copies in different nuclei, and was
consistent with our FISH analysis ( Fig. 3E , gray bars and
Supplementary Fig. S3D). From 35 nuclei, we identifi ed 26
containing EGFRvII and three EGFRvII-extended with no
overlap. Further examination of the other six nuclei within
the non-vII cluster revealed amplifi ed EGFR , with three nuclei
showing discordant read pairs spanning C-terminal break-
points that occur in the presence of wild-type EGFR .
Determination of EGFRvII Evolutionary Hierarchy Based on Tumor Subclones
The common genomic boundaries of the overall EGFR
amplicon in all three populations in BT340 suggested that
the clonal diversifi cation occurred after the common ances-
tral EGFR amplifi cation. Although the vII-extended and the
vII deletion existed in distinct cell populations, their clonal
association could not be unambiguously determined (e.g.,
the larger vII-extended deletion may theoretically be derived
from the smaller vII). We therefore sought to characterize
the clonal hierarchy based on coexisting alterations unre-
lated to EGFR to infer the clonal origin of the two EGFR
variants.
SNS allows one to reconstruct the lineage evolution history
in tumors using copy-number profi ling and single-nucleotide
variant clustering ( 24–27 ). However, the generic clustering
approach previously used in these studies cannot identify
the exact clonal or subclonal alterations that differentiate
subclonal populations as in bulk analysis ( 19 , 28 ), and can
be confounded by artifacts that are introduced during whole-
genome amplifi cation ( 22 ). To circumvent this limitation, we
developed and applied an integrative approach to identify
distinct tumor populations based on joint detection of clonal
and subclonal events from the bulk tumor and SN genomes.
Of particular importance, by requiring true variants to be
present in at least two SN libraries, or with evidence in the
bulk tumor DNA, we were able to exclude the majority of
random MDA artifacts generated within individual librar-
ies, and, at the same time, increase detection sensitivity for
subclonal events that are present in the bulk library at low
allelic frequencies.
Profi ling Clonal Aberrations Increases Sensitivity for Detection of Subclonal Alterations
We fi rst focused on clonal events inferred from bulk tumor
analysis that could be used as markers for SNS analysis.
In both BT340 and BT325, we identifi ed characteristic glio-
blastoma somatic copy-number alterations (SCNA), including
homozygous loss of CDKN2A/CDKN2B , hemizygous loss of
chromosome 10, as well as gains of chromosome 7 ( Fig. 4A and
B and Supplementary Fig. S4A and S4B). BT325 was found
to have a common activating mutation within the promoter
region of TERT (chr 5:1295228, G→A) that is observed in >80%
of glioblastomas ( 4 , 29–31 ). In BT340, we observed a nonre-
ciprocal translocation of a putative super enhancer within
chromosome 10 ( 32 ) to the TERT promoter that could be an
alternative mechanism for activating TERT in glioblastoma
( Fig. 4C ).
We then characterized the SNS libraries of BT340 accord-
ing to the clonal deletion events. In regions of hemizygous
deletion or LOH, SN should harbor only one consensus
haplotype. We used this feature to cluster individual nuclei
based on the differences in their observed genotypes in LOH
regions and infer the consensus haplotype within these
regions (Supplementary Fig. S5A–S5H and Supplementary
Methods). Using the germline heterozygous sites to infer the
haplotype information from chromosome 10, we clustered
the 48 nuclei derived from BT340 into two groups ( Fig. 4D ).
The 44 tumor-derived nuclei (black circles) showed minimal
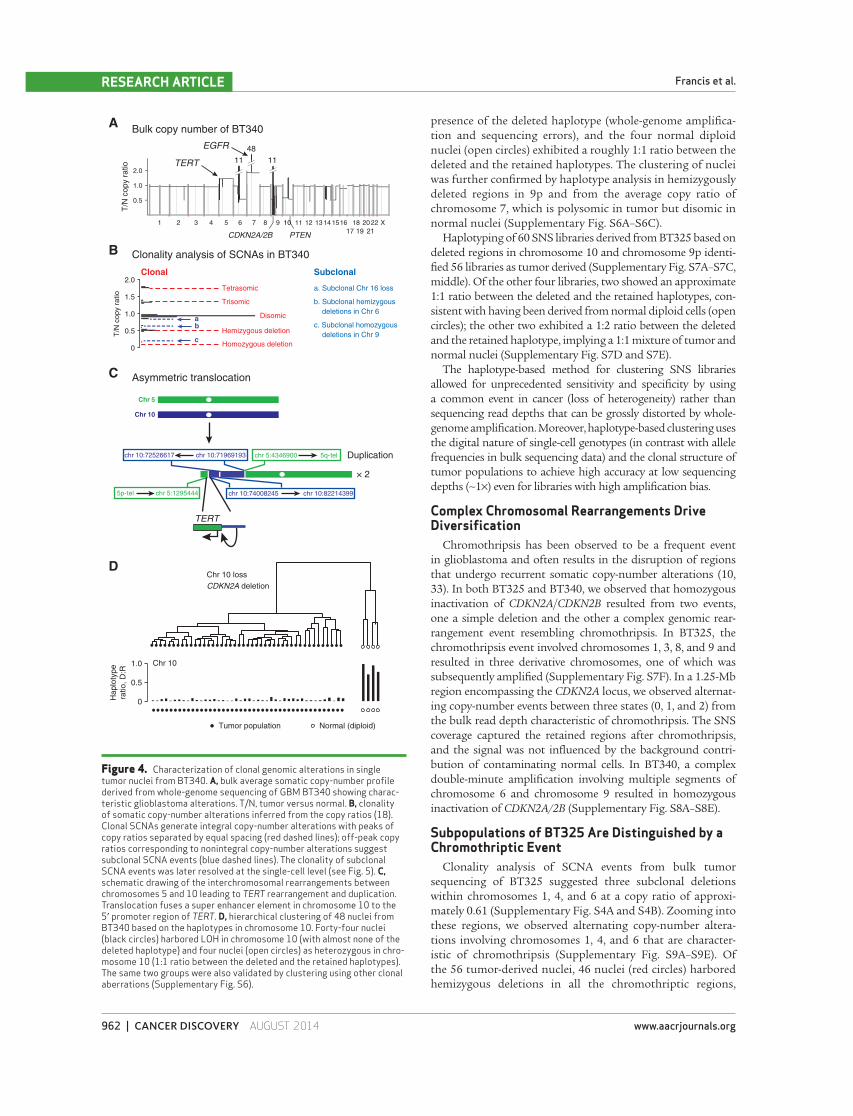
962 | CANCER DISCOVERY�AUGUST 2014 www.aacrjournals.org
Francis et al.RESEARCH ARTICLE
presence of the deleted haplotype (whole-genome amplifi ca-
tion and sequencing errors), and the four normal diploid
nuclei (open circles) exhibited a roughly 1:1 ratio between the
deleted and the retained haplotypes. The clustering of nuclei
was further confi rmed by haplotype analysis in hemizygously
deleted regions in 9p and from the average copy ratio of
chromosome 7, which is polysomic in tumor but disomic in
normal nuclei (Supplementary Fig. S6A–S6C).
Haplotyping of 60 SNS libraries derived from BT325 based on
deleted regions in chromosome 10 and chromosome 9p identi-
fi ed 56 libraries as tumor derived (Supplementary Fig. S7A–S7C,
middle). Of the other four libraries, two showed an approximate
1:1 ratio between the deleted and the retained haplotypes, con-
sistent with having been derived from normal diploid cells (open
circles); the other two exhibited a 1:2 ratio between the deleted
and the retained haplotype, implying a 1:1 mixture of tumor and
normal nuclei (Supplementary Fig. S7D and S7E).
The haplotype-based method for clustering SNS libraries
allowed for unprecedented sensitivity and specifi city by using
a common event in cancer (loss of heterogeneity) rather than
sequencing read depths that can be grossly distorted by whole-
genome amplifi cation. Moreover, haplotype-based clustering uses
the digital nature of single-cell genotypes (in contrast with allele
frequencies in bulk sequencing data) and the clonal structure of
tumor populations to achieve high accuracy at low sequencing
depths (∼1×) even for libraries with high amplifi cation bias.
Complex Chromosomal Rearrangements Drive Diversifi cation
Chromothripsis has been observed to be a frequent event
in glioblastoma and often results in the disruption of regions
that undergo recurrent somatic copy-number alterations ( 10 ,
33 ). In both BT325 and BT340, we observed that homozygous
inactivation of CDKN2A / CDKN2B resulted from two events,
one a simple deletion and the other a complex genomic rear-
rangement event resembling chromothripsis. In BT325, the
chromothripsis event involved chromosomes 1, 3, 8, and 9 and
resulted in three derivative chromosomes, one of which was
subsequently amplifi ed (Supplementary Fig. S7F). In a 1.25-Mb
region encompassing the CDKN2A locus, we observed alternat-
ing copy-number events between three states (0, 1, and 2) from
the bulk read depth characteristic of chromothripsis. The SNS
coverage captured the retained regions after chromothripsis,
and the signal was not infl uenced by the background contri-
bution of contaminating normal cells. In BT340, a complex
double-minute amplifi cation involving multiple segments of
chromosome 6 and chromosome 9 resulted in homozygous
inactivation of CDKN2A/2B (Supplementary Fig. S8A–S8E).
Subpopulations of BT325 Are Distinguished by a Chromothriptic Event
Clonality analysis of SCNA events from bulk tumor
sequencing of BT325 suggested three subclonal deletions
within chromosomes 1, 4, and 6 at a copy ratio of approxi-
mately 0.61 (Supplementary Fig. S4A and S4B). Zooming into
these regions, we observed alternating copy-number altera-
tions involving chromosomes 1, 4, and 6 that are character-
istic of chromothripsis (Supplementary Fig. S9A–S9E). Of
the 56 tumor-derived nuclei, 46 nuclei (red circles) harbored
hemizygous deletions in all the chromothriptic regions,
Figure 4. Characterization of clonal genomic alterations in single tumor nuclei from BT340. A, bulk average somatic copy-number profi le derived from whole-genome sequencing of GBM BT340 showing charac-teristic glioblastoma alterations. T/N, tumor versus normal. B, clonality of somatic copy-number alterations inferred from the copy ratios ( 18 ). Clonal SCNAs generate integral copy-number alterations with peaks of copy ratios separated by equal spacing (red dashed lines); off-peak copy ratios corresponding to nonintegral copy-number alterations suggest subclonal SCNA events (blue dashed lines). The clonality of subclonal SCNA events was later resolved at the single-cell level (see Fig. 5 ). C, schematic drawing of the interchromosomal rearrangements between chromosomes 5 and 10 leading to TERT rearrangement and duplication. Translocation fuses a super enhancer element in chromosome 10 to the 5′ promoter region of TERT . D, hierarchical clustering of 48 nuclei from BT340 based on the haplotypes in chromosome 10. Forty-four nuclei (black circles) harbored LOH in chromosome 10 (with almost none of the deleted haplotype) and four nuclei (open circles) as heterozygous in chro-mosome 10 (1:1 ratio between the deleted and the retained haplotypes). The same two groups were also validated by clustering using other clonal aberrations (Supplementary Fig. S6).
SubclonalClonal
Homozygous deletion
Trisomic
Tetrasomic
Disomic
Hemizygous deletion
1.0
2.0
0.5
1.5
0
T/N
copy r
atio
ab
c
a. Subclonal Chr 16 loss
b. Subclonal hemizygous
deletions in Chr 6
c. Subclonal homozygous
deletions in Chr 9
EGFR
TERT
CDKN2A/2B PTEN
Bulk copy number of BT340
Clonality analysis of SCNAs in BT340
Chr 5
Chr 10
chr 10:71969193 chr 5:4346900
chr 5:1295444 chr 10:74008245
chr 10:72526617
chr 10:82214399
Asymmetric translocation
Duplication
× 2
TERT
5q-tel
5p-tel
Normal (diploid)Tumor population
A
B
C
D
0.5
1.0
T/N
copy r
atio
2.0
1111
48
1 2 3 4 5 6 7 8 9 10 11 12 13 14 1516
17
18
19
20
21
22 X
Chr 10 loss
CDKN2A deletion
0
0.5
Haplo
type
ratio, D
:R
1.0 Chr 10
AUGUST 2014�CANCER DISCOVERY | 963
Single-Nucleus Sequencing of GBM Mutational Heterogeneity RESEARCH ARTICLE
whereas six nuclei (blue circles) were heterozygous at these
loci (Supplementary Fig. S9B). Four additional SNS librar-
ies had a haplotype ratio suggesting a 1:1 mixture of the
tumor clones (magenta circles). This “all-or-none” scenario
of all deletions clearly established that these events had been
acquired within a single event as implied in chromothripsis.
On the basis of the presence of shared clonal features such
as EGFRvIII, TERT promoter mutations, and loss of chro-
mosome 10, but the absence of the chromosome 1, 4, and 6
chromothriptic event in six nuclei, we infer that the minor
subclone split from the major subclone at this point (Sup-
plementary Fig. S9F).
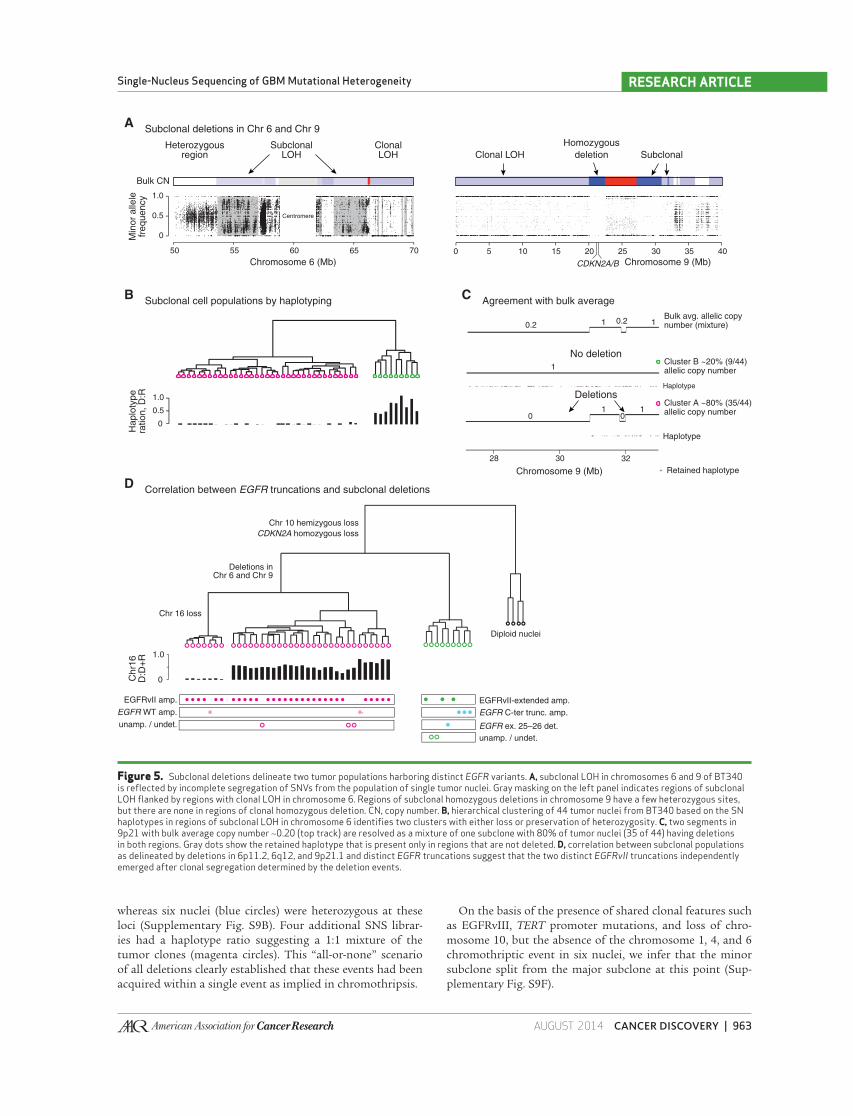
Figure 5. Subclonal deletions delineate two tumor populations harboring distinct EGFR variants. A, subclonal LOH in chromosomes 6 and 9 of BT340 is refl ected by incomplete segregation of SNVs from the population of single tumor nuclei. Gray masking on the left panel indicates regions of subclonal LOH fl anked by regions with clonal LOH in chromosome 6. Regions of subclonal homozygous deletions in chromosome 9 have a few heterozygous sites, but there are none in regions of clonal homozygous deletion. CN, copy number. B, hierarchical clustering of 44 tumor nuclei from BT340 based on the SN haplotypes in regions of subclonal LOH in chromosome 6 identifi es two clusters with either loss or preservation of heterozygosity. C, two segments in 9p21 with bulk average copy number ∼0.20 (top track) are resolved as a mixture of one subclone with 80% of tumor nuclei (35 of 44) having deletions in both regions. Gray dots show the retained haplotype that is present only in regions that are not deleted. D, correlation between subclonal populations as delineated by deletions in 6p11.2, 6q12, and 9p21.1 and distinct EGFR truncations suggest that the two distinct EGFRvII truncations independently emerged after clonal segregation determined by the deletion events.
Haplotype
1
100
1
0.2 1 10.2
Haplotype
Deletions
No deletion
Diploid nuclei
Chromosome 6 (Mb)
Centromere
Heterozygousregion
0 5 10 15 20 25 30 35 40
Chromosome 9 (Mb)CDKN2A/B
SubclonalClonal LOH
Homozygous
deletion
Bulk CN
Subclonal deletions in Chr 6 and Chr 9A
0
0.5
Min
or
alle
lefr
eq
ue
ncy 1.0
SubclonalLOH
ClonalLOH
605550 7065
Subclonal cell populations by haplotypingB
0
0.5
Ha
plo
typ
era
tio
n,
D:R 1.0
Agreement with bulk averageC
Correlation between EGFR truncations and subclonal deletionsD
Chr 10 hemizygous loss
CDKN2A homozygous loss
Deletions inChr 6 and Chr 9
Chr 16 loss
0Chr1
6D
:D+
R 1.0
Chromosome 9 (Mb)
3028 32
Retained haplotype
Bulk avg. allelic copynumber (mixture)
Cluster B ~20% (9/44)allelic copy number
Cluster A ~80% (35/44)allelic copy number
EGFRvII amp.
EGFR WT amp.
unamp. / undet.
EGFRvII-extended amp.
EGFR C-ter trunc. amp.
unamp. / undet.
EGFR ex. 25–26 det.
964 | CANCER DISCOVERY�AUGUST 2014 www.aacrjournals.org
Francis et al.RESEARCH ARTICLE
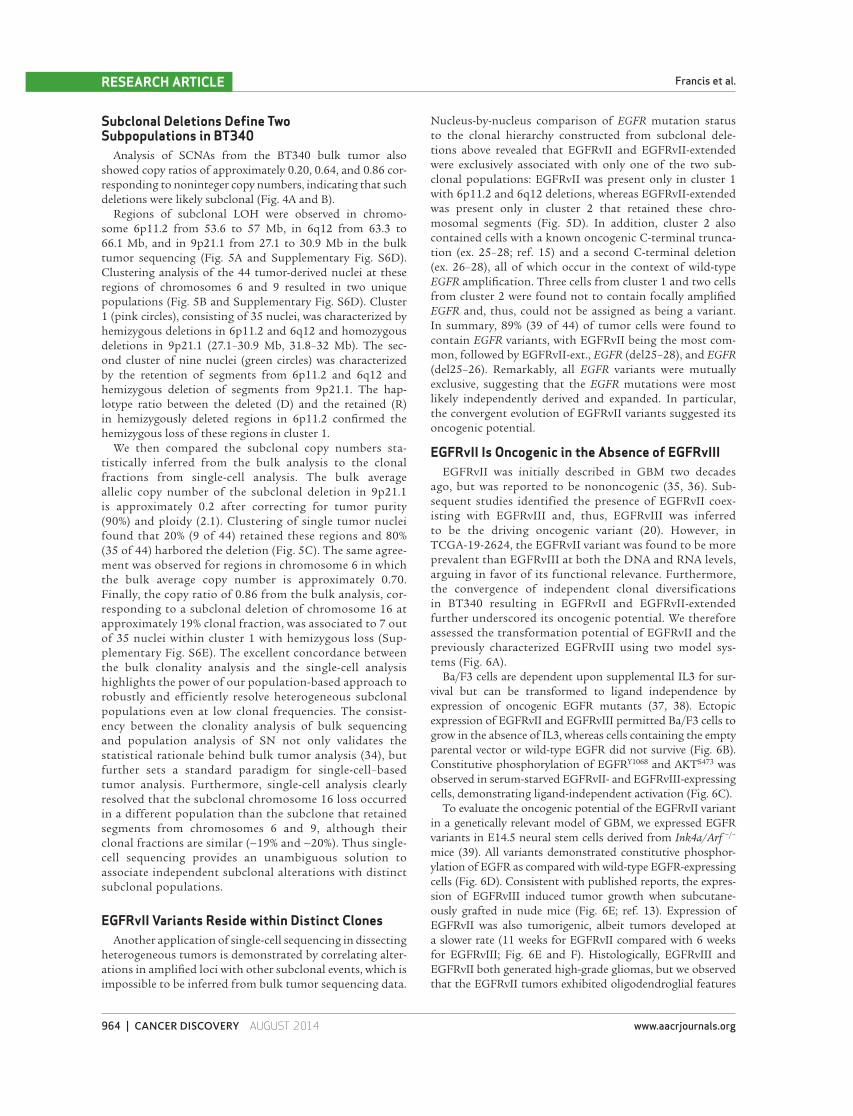
Subclonal Deletions Defi ne Two Subpopulations in BT340
Analysis of SCNAs from the BT340 bulk tumor also
showed copy ratios of approximately 0.20, 0.64, and 0.86 cor-
responding to noninteger copy numbers, indicating that such
deletions were likely subclonal ( Fig. 4A and B ).
Regions of subclonal LOH were observed in chromo-
some 6p11.2 from 53.6 to 57 Mb, in 6q12 from 63.3 to
66.1 Mb, and in 9p21.1 from 27.1 to 30.9 Mb in the bulk
tumor sequencing ( Fig. 5A and Supplementary Fig. S6D).
Clustering analysis of the 44 tumor-derived nuclei at these
regions of chromosomes 6 and 9 resulted in two unique
populations ( Fig. 5B and Supplementary Fig. S6D). Cluster
1 (pink circles), consisting of 35 nuclei, was characterized by
hemizygous deletions in 6p11.2 and 6q12 and homozygous
deletions in 9p21.1 (27.1–30.9 Mb, 31.8–32 Mb). The sec-
ond cluster of nine nuclei (green circles) was characterized
by the retention of segments from 6p11.2 and 6q12 and
hemizygous deletion of segments from 9p21.1. The hap-
lotype ratio between the deleted (D) and the retained (R)
in hemizygously deleted regions in 6p11.2 confi rmed the
hemizygous loss of these regions in cluster 1.
We then compared the subclonal copy numbers sta-
tistically inferred from the bulk analysis to the clonal
fractions from single-cell analysis. The bulk average
allelic copy number of the subclonal deletion in 9p21.1
is approximately 0.2 after correcting for tumor purity
(90%) and ploidy (2.1). Clustering of single tumor nuclei
found that 20% (9 of 44) retained these regions and 80%
(35 of 44) harbored the deletion ( Fig. 5C ). The same agree-
ment was observed for regions in chromosome 6 in which
the bulk average copy number is approximately 0.70.
Finally, the copy ratio of 0.86 from the bulk analysis, cor-
responding to a subclonal deletion of chromosome 16 at
approximately 19% clonal fraction, was associated to 7 out
of 35 nuclei within cluster 1 with hemizygous loss (Sup-
plementary Fig. S6E). The excellent concordance between
the bulk clonality analysis and the single-cell analysis
highlights the power of our population-based approach to
robustly and efficiently resolve heterogeneous subclonal
populations even at low clonal frequencies. The consist-
ency between the clonality analysis of bulk sequencing
and population analysis of SN not only validates the
statistical rationale behind bulk tumor analysis ( 34 ), but
further sets a standard paradigm for single-cell–based
tumor analysis. Furthermore, single-cell analysis clearly
resolved that the subclonal chromosome 16 loss occurred
in a different population than the subclone that retained
segments from chromosomes 6 and 9, although their
clonal fractions are similar (∼19% and ∼20%). Thus single-
cell sequencing provides an unambiguous solution to
associate independent subclonal alterations with distinct
subclonal populations.
EGFRvII Variants Reside within Distinct Clones Another application of single-cell sequencing in dissecting
heterogeneous tumors is demonstrated by correlating alter-
ations in amplifi ed loci with other subclonal events, which is
impossible to be inferred from bulk tumor sequencing data.
Nucleus-by-nucleus comparison of EGFR mutation status
to the clonal hierarchy constructed from subclonal dele-
tions above revealed that EGFRvII and EGFRvII-extended
were exclusively associated with only one of the two sub-
clonal populations: EGFRvII was present only in cluster 1
with 6p11.2 and 6q12 deletions, whereas EGFRvII-extended
was present only in cluster 2 that retained these chro-
mosomal segments ( Fig. 5D ). In addition, cluster 2 also
contained cells with a known oncogenic C-terminal trunca-
tion (ex. 25–28; ref. 15 ) and a second C-terminal deletion
(ex. 26–28), all of which occur in the context of wild-type
EGFR amplifi cation. Three cells from cluster 1 and two cells
from cluster 2 were found not to contain focally amplifi ed
EGFR and, thus, could not be assigned as being a variant.
In summary, 89% (39 of 44) of tumor cells were found to
contain EGFR variants, with EGFRvII being the most com-
mon, followed by EGFRvII-ext., EGFR (del25–28), and EGFR
(del25–26). Remarkably, all EGFR variants were mutually
exclusive, suggesting that the EGFR mutations were most
likely independently derived and expanded. In particular,
the convergent evolution of EGFRvII variants suggested its
oncogenic potential.
EGFRvII Is Oncogenic in the Absence of EGFRvIII EGFRvII was initially described in GBM two decades
ago, but was reported to be nononcogenic ( 35, 36 ). Sub-
sequent studies identified the presence of EGFRvII coex-
isting with EGFRvIII and, thus, EGFRvIII was inferred
to be the driving oncogenic variant ( 20 ). However, in
TCGA-19-2624, the EGFRvII variant was found to be more
prevalent than EGFRvIII at both the DNA and RNA levels,
arguing in favor of its functional relevance. Furthermore,
the convergence of independent clonal diversifications
in BT340 resulting in EGFRvII and EGFRvII-extended
further underscored its oncogenic potential. We therefore
assessed the transformation potential of EGFRvII and the
previously characterized EGFRvIII using two model sys-
tems ( Fig. 6A ).
Ba/F3 cells are dependent upon supplemental IL3 for sur-
vival but can be transformed to ligand independence by
expression of oncogenic EGFR mutants ( 37, 38 ). Ectopic
expression of EGFRvII and EGFRvIII permitted Ba/F3 cells to
grow in the absence of IL3, whereas cells containing the empty
parental vector or wild-type EGFR did not survive ( Fig. 6B ).
Constitutive phosphorylation of EGFR Y1068 and AKT S473 was
observed in serum-starved EGFRvII- and EGFRvIII-expressing
cells, demonstrating ligand-independent activation ( Fig. 6C ).
To evaluate the oncogenic potential of the EGFRvII variant
in a genetically relevant model of GBM, we expressed EGFR
variants in E14.5 neural stem cells derived from Ink4a/Arf −/−
mice ( 39 ). All variants demonstrated constitutive phosphor-
ylation of EGFR as compared with wild-type EGFR-expressing
cells ( Fig. 6D ). Consistent with published reports, the expres-
sion of EGFRvIII induced tumor growth when subcutane-
ously grafted in nude mice ( Fig. 6E ; ref. 13 ). Expression of
EGFRvII was also tumorigenic, albeit tumors developed at
a slower rate (11 weeks for EGFRvII compared with 6 weeks
for EGFRvIII; Fig. 6E and F ). Histologically, EGFRvIII and
EGFRvII both generated high-grade gliomas, but we observed
that the EGFRvII tumors exhibited oligodendroglial features
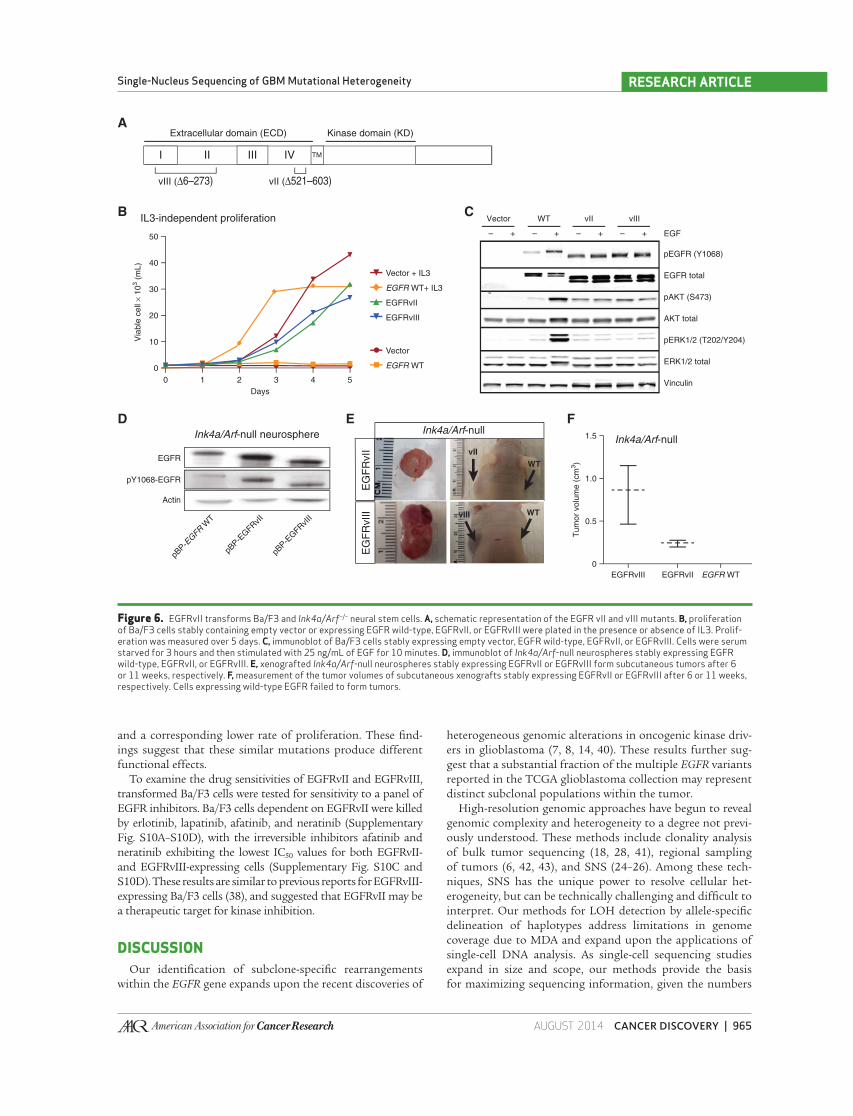
AUGUST 2014�CANCER DISCOVERY | 965
Single-Nucleus Sequencing of GBM Mutational Heterogeneity RESEARCH ARTICLE
and a corresponding lower rate of proliferation. These fi nd-
ings suggest that these similar mutations produce different
functional effects.
To examine the drug sensitivities of EGFRvII and EGFRvIII,
transformed Ba/F3 cells were tested for sensitivity to a panel of
EGFR inhibitors. Ba/F3 cells dependent on EGFRvII were killed
by erlotinib, lapatinib, afatinib, and neratinib (Supplementary
Fig. S10A–S10D), with the irreversible inhibitors afatinib and
neratinib exhibiting the lowest IC 50 values for both EGFRvII-
and EGFRvIII-expressing cells (Supplementary Fig. S10C and
S10D). These results are similar to previous reports for EGFRvIII-
expressing Ba/F3 cells ( 38 ), and suggested that EGFRvII may be
a therapeutic target for kinase inhibition.
DISCUSSION Our identifi cation of subclone-specifi c rearrangements
within the EGFR gene expands upon the recent discoveries of
heterogeneous genomic alterations in oncogenic kinase driv-
ers in glioblastoma ( 7, 8 , 14 , 40 ). These results further sug-
gest that a substantial fraction of the multiple EGFR variants
reported in the TCGA glioblastoma collection may represent
distinct subclonal populations within the tumor.
High-resolution genomic approaches have begun to reveal
genomic complexity and heterogeneity to a degree not previ-
ously understood. These methods include clonality analysis
of bulk tumor sequencing ( 18 , 28 , 41 ), regional sampling
of tumors ( 6 , 42 , 43 ), and SNS ( 24–26 ). Among these tech-
niques, SNS has the unique power to resolve cellular het-
erogeneity, but can be technically challenging and diffi cult to
interpret. Our methods for LOH detection by allele-specifi c
delineation of haplotypes address limitations in genome
coverage due to MDA and expand upon the applications of
single-cell DNA analysis. As single-cell sequencing studies
expand in size and scope, our methods provide the basis
for maximizing sequencing information, given the numbers
Figure 6. EGFRvII transforms Ba/F3 and Ink4a/Arf −/− neural stem cells. A, schematic representation of the EGFR vII and vIII mutants. B, proliferation of Ba/F3 cells stably containing empty vector or expressing EGFR wild-type, EGFRvII, or EGFRvIII were plated in the presence or absence of IL3. Prolif-eration was measured over 5 days. C, immunoblot of Ba/F3 cells stably expressing empty vector, EGFR wild-type, EGFRvII, or EGFRvIII. Cells were serum starved for 3 hours and then stimulated with 25 ng/mL of EGF for 10 minutes. D, immunoblot of Ink4a/Arf -null neurospheres stably expressing EGFR wild-type, EGFRvII, or EGFRvIII. E, xenografted Ink4a/Arf -null neurospheres stably expressing EGFRvII or EGFRvIII form subcutaneous tumors after 6 or 11 weeks, respectively. F, measurement of the tumor volumes of subcutaneous xenografts stably expressing EGFRvII or EGFRvIII after 6 or 11 weeks, respectively. Cells expressing wild-type EGFR failed to form tumors.
Ink4a/Arf-null
EG
FR
vIII
EG
FR
vII
TM
Extracellular domain (ECD)
vIII (Δ6–273) vII (Δ521–603)
vII
EGFRvII
EGFRvIII
Days
A
C
40
50
20
30
0
10
4 52 30 1
Vector + IL3
EGFR WT+ IL3
Vector
EGFR WT
IL3-independent proliferation
I II III IV
B
Vinculin
EGFR total
ERK1/2 total
pERK1/2 (T202/Y204)
pAKT (S473)
AKT total
pEGFR (Y1068)
Vector
– +
WT
– +
vII
– +
vIII
– + EGF
D E1.5
Tum
or
volu
me (
cm
3)
0.5
1.0
0
vIII WT
WT
Ink4a/Arf-null
F
EGFR WTEGFRvIIEGFRvIII
Ink4a/Arf-null neurosphere
Actin
pY1068-EGFR
EGFR
pBP-E
GFR WT
pBP-E
GFR
vII
pBP-E
GFR
vIII
Via
ble
cell
× 10
3 (
mL)
Kinase domain (KD)

966 | CANCER DISCOVERY�AUGUST 2014 www.aacrjournals.org
Francis et al.RESEARCH ARTICLE
Figure 7. Summary of cellular genomic heterogeneity in glioblastoma. Left, different RTK amplifi cations can lead to clonal diversifi cation after com-mon clonal mutations. Right, mutations in a single RTK can also lead to clonal diversifi cation through multiple variants, SNVs, and amplifi cation of these different alleles. The presence of multiple concurrent RTK amplifi cations/mutations implies potential need for multiple drugs targeting the same RTK via different mechanisms.
Cellular genomic heterogeneity in GBM
Different RTK amplifications define
clonal diversification
Distinct variants in single RTK define
clonal diversification
Common GBM alterations
Disruptions of RB1, TP53 pathways
Activation of TERT
Multiple RTK
amplifications
MET amp. PDGFRA amp.
Single RTK
amplification
EGFR amp.
EGFR var. I. EGFR var. II
Multiple variants
of a single RTK
EGFR wt
EGFR amp.
MET + EGFR amp. PDGFRA + EGFR amp.
First
event
Second
event
Third
event
Multiple target RTKs
Combination of
RTK inhibitors
against multiple
clones
Specific RTK
inhibitor against
multiple clones
Single target RTK
AUGUST 2014�CANCER DISCOVERY | 967
Single-Nucleus Sequencing of GBM Mutational Heterogeneity RESEARCH ARTICLE
of cells sequenced. Clonality inference by combining bulk
tumor analysis with single-cell population analysis further
provides a unique strategy for resolving clonal evolution
and coassociation of independent genomic alterations at the
single-cell level. The combination of SNS and joint calling
with bulk sequencing allowed us to detect minor subclonal
populations that were present in as low as 10% of the tumor
at relatively low sequencing depth.
Genomic diversifi cation in cancer is known to contribute
to targeted and cytotoxic therapy failure and emergence of
resistance ( 5 , 44 , 45 ). Large-scale genomic studies of cancer
have outlined sets of alterations that affect growth-promot-
ing and tumor-suppressing pathways that are necessary to
drive tumorigenesis. In glioblastoma, the RB , TP53 , and
PTEN tumor suppressors are frequently inactivated directly
or indirectly through aberrations in pathway factors such
CDKN2A/CDKN2B or MDM2 ( 4 ). These genomic alterations
serve as the foundation upon which RTKs like EGFR , MET ,
and PDGFRA can become amplifi ed and evolve as the tumor
cells begin to compete with each other for growth advan-
tage. As FISH studies have demonstrated, RTKs within a
tumor can be amplifi ed alone or in combination ( Fig. 7 , left;
refs. 7, 8 ). Presumably, clones with diverse growth signaling
pathways will gain an advantage and expand as competition
ensues.
Here, our study reveals an additional paradigm for the
diversifi cation of growth-signaling pathways through the
acquisition of multiple variants of a single RTK gene ( Fig. 7 ,
right). The convergence of subclone-specifi c EGFRvII dele-
tions refl ects the dynamic evolution of amplifi ed EGFR copies
and pinpoints its oncogenic potential. We further demon-
strated that overexpression of EGFRvII does cause trans-
formation in both Ba/F3 and Ink4a / Arf −/− neural stem cell
models, a variant previously thought not to be oncogenic
because it co-occurred with EGFRvIII ( 20 , 35 ). TCGA RNA
sequencing even revealed the expression of EGFRvII to be
present in 9% (7 of 76) of cases with focally amplifi ed EGFR
( 4 ). Our functional characterizations found that constitutive
expression of EGFRvII results in downstream activation of
AKT signaling, consistent with that of EGFRvIII, but not
with enhanced ERK activation. It is possible that EGFRvII
activates an alternative pathway such as STAT3/5 and poses a
more direct means of inducing transcriptional changes ( 16 ).
Therefore, the presence of multiple EGFR variants in a single
tumor highlights the intratumoral heterogeneity of glioblas-
toma conferred by the plasticity of EGFR amplicons.
Heterogeneous expression of oncogenic EGFR mutants
and cooperativity of EGFR with itself or other RTKs have
each been hypothesized to contribute to tumor growth and
resistance to therapy ( 14 , 16 , 40 ). It is conceivable that
heterogeneity and cooperativity mechanisms play a role in
RTK diversifi cation and will affect the effi cacy of targeted
therapies in cancer, and, in particular, may explain the lack of
response in glioblastoma. Further complicating this scenario
is recent work demonstrating how EGFRvIII-containing cells
can evade EGFR inhibitors through amplicon loss and down-
regulation of the oncogenic receptor ( 5 ). It is striking that
small-molecule inhibitors can be so successful in non–small-
cell lung cancers, but remain ineffective in glioblastomas,
despite EGFR being functionally signifi cant ( 2, 3 , 46–49 ).
This work suggests that combining multiple EGFR inhibitors
that act through different mechanisms on the receptor could
be required in patients with multiple variants in nonoverlap-
ping subclones and also potentially prevent the activation of
a resistance pathway. Such concepts deserve further evalua-
tion in preclinical models.
As cancer genomic research approaches the discovery of the
plurality of somatic mutations, it becomes crucial to under-
stand the distribution pattern of somatic mutations among
individual tumor cells and clones and how these mutations
work together to drive tumor fi tness ( 50 ). Single-cell analysis
has the potential to greatly contribute to our understanding
of co-dependency of mutations and tumor heterogeneity.
The input requirements of this approach also make it feasi-
ble to deliver great insights into biopsies, necrotic tissues, or
tumors with great immune infi ltration to delineate the full
spectrum of cell-specifi c oncogenic drivers. Once a thorough
understanding of the tumor state can be integrated, it is then
possible to select combinations of drugs to prevent resistance
due to emergence of preexisting subclonal populations of
tumor cells not detected in bulk tumor sequencing.
METHODS Isolation of SN and Preparation of Bulk Tumor DNA
Anonymized tumor and matching blood specimens were collected
following informed, written consent and processed under protocols
approved by the Institutional Review Boards of the Dana-Farber
Cancer Institute and the Broad Institute (protocol 11-433). Two cases
of de novo GBM, designated as brain tumor BT325 and BT340, were
mechanically dissociated into pools of nuclei as previously described
( 24 ). A portion of the dissociated material was selected to represent
bulk tumor. Genomic DNA was isolated from the pooled nuclei and
matched blood using DNeasy columns (Qiagen).
Preparation of SN DNA Libraries SN were sorted directly into 96-well PCR plates containing 5 μL of
phosphate-buffered saline using the BD FACSAria IIu fl ow cytometer
calibrated to deposit SN into each well. A 4′,6-diamidino-2-phenylin-
dole (DAPI)-based DNA stain was used to select intact nuclei. Empty
wells were included on every plate to control for background MDA
amplifi cation. See Supplementary Methods for additional details.
Quality Assessment of SN DNA Libraries We generated SN DNA libraries from approximately 100 SN with
the aim of selecting the best libraries from each tumor for deeper
sequencing and analysis. Quality assessment was done by multi-
plexed sequencing of SN libraries to an average depth of 0.01× per
library. Two criteria were used to select the best SNS libraries for
deeper sequencing.
First, we removed libraries with more than 20% read sequences
not aligned to the human reference. We then evaluated the evenness
of the remaining MDA libraries by two metrics. The fi rst metric was
adapted from the method recently described ( 21 ) to measure the
evenness of genome-wide coverage by evaluating the distribution
of reads in a DNA library across different genomic loci stratifi ed by
the sequencing coverage at each locus. The second metric, termed
the pileup metric, estimates the percentage of sequenced reads that
were accumulated in local regions at densities 10 times higher than
the chromosomal average. The spacing between each read and the
adjacent reads (left and right) was used to infer if the read was in a
pileup region. Reads in pileup regions were then downsampled to the
968 | CANCER DISCOVERY�AUGUST 2014 www.aacrjournals.org
Francis et al.RESEARCH ARTICLE
average density estimated from the fl anking nonpileup regions. The
downsampling was iterated until no pileup region exceeding a certain
size (e.g., 100 reads) was remaining. The pileup metric was calculated
from the percentage of reads removed during the downsampling
procedure.
The two metrics showed a strong correlation between each other
(Supplementary Fig. S2C): both can be used to estimate of the even-
ness of coverage for SNS libraries to guide the optimization of SNS
workfl ow or select better libraries for deeper sequencing. In addition,
removing the pileup reads can smooth the sequence coverage and
reveal true copy-number profi les for each SNS library, which can be
used to identify (tumor) samples of interest.
Two-Step Strategy for Somatic Variant Detection by SNS Whole-genome amplifi cation by MDA is known to generate
artifacts, including single-base errors and random chimera, which
can be indistinguishable from true somatic mutations. Given these
considerations, we adopted a two-step strategy to analyze somatic
mutations by SNS of many tumor nuclei. First, we detected all
clonal and subclonal somatic variants, including single-nucleotide
variants and chromosomal rearrangements, from the pool of SNS
complemented with bulk whole-genome sequencing. Second, we
searched for the detected variants within each SNS and in the
bulk tumor to infer the clonality of these variants and construct
the clonal hierarchy of these variants. See expanded methods for
additional details.
Detection of Somatic Copy - Number Alterations Whole-genome amplifi cation by MDA from single-nuclear DNA
can generate multiple distortions to the original DNA copy-number
profi le, which pose a considerable challenge to the detection of true
somatic copy-number events in SN libraries. We, therefore, did not
use the read depth signal from SN libraries to detect copy-number
breakpoints but only inferred copy-number breakpoints from read
depths in the bulk tumor against the germline reference using
SegSeq ( 51 ). At 10× sequencing depth, the read depth signal from
the bulk tumor should be suffi cient to detect somatic copy-number
alterations of 10 kb or longer at or above 15% clonal fraction, which
is comparable with the smallest subclone we can identify from 50 to
60 single cells.
As the read depth signal often resulted in oversegmentation, we
merged the copy-number breakpoints inferred from the bulk tumor
read depth with the list of nonreciprocal chromosomal transloca-
tion breakpoints detected from the pool of bulk tumor and SN
libraries. We then identifi ed true chromosomal breaks as supported
both by read depth difference across the breakpoint and by the
presence of somatic rearrangement signatures on the higher copy-
number side. This fi nal set of chromosomal breakpoints was then
used to segment the copy-number profi le for the bulk tumor as well
as for each SN.
Haplotype-Based Detection of LOH A unique feature of many tumor genomes is the LOH of large
chromosomal regions as well as smaller homozygous deletions, lead-
ing to the elimination of one or both germline haplotypes (refs. 52,
53 ; Supplementary Fig. S4A). For cells with LOH in a region of the
genome, the retained haplotype, or allelotype ( 54 ), can be directly
determined from the sequencing data (Supplementary Fig. S5B). If
whole-genome amplifi cation from single cells were complete and
represented all alleles, then the haploid genotype of cells with LOH
could be readily distinguished from the heterozygous genotype of
diploid cells (Supplementary Fig. S5B, left). However, single-cell
sequencing is inevitably incomplete and not all alleles are represented
in the resulting data (Supplementary Fig. S5B, right). Single-base
errors introduced during MDA can further confound the inference
of true genotype.
We devised a clustering-based approach to dissect the cell popu-
lations harboring heterozygous and/or homozygous genotypes in
each genomic region. First, the pairwise distance between single-
cell genotypes was calculated from the fraction of germline het-
erozygous sites covered in both libraries with different genotypes
(Supplementary Fig. S5C); this distance is large if cells are discord-
ant for heterozygosity/homozygosity, and small if they are both
homozygous (concordant). We then performed clustering analysis
of cellular populations to identify cells with LOH in a given region,
which formed a very tight cluster (Supplementary Fig. S5C, right).
Supplementary Figure S5D shows the two clusters formed by 60
SNS libraries from BT325 identifi ed by LOH in chromosome 10, one
cluster displaying a unique haploid genotype (LOH), and a second
cluster that was heterozygous.
By pooling the genotype data of LOH cells in cluster 1, we can
determine both the retained haplotype “R” and the deleted haplotype
“D” and assign individual or combined “RD” haplotypes to each
nucleus at all covered germline heterozygous sites (Supplementary
Fig. S5E). This analysis showed that cluster 1 contains BT325 nuclei
with only allele “R,” whereas cluster 2 contains an admixture of alle-
les “R” and “D” on chromosome 10 (Supplementary Fig. S5F). The
ratio of the deleted to retained haplotypes is approximately 0 in LOH
nuclei, and close to 1 in diploid nuclei. Interestingly, the D:R ratio is
near 0.5 in another population of nuclei (Supplementary Fig. S5G).
We inferred that the population with a D:R ratio of 0.5 represents
libraries derived from a 1:1 mixture of tumor and normal nuclei. The
normal/tumor mixture was later confi rmed by the presence of clonal
drivers at subclonal quantities in these samples (Supplementary
Fig. S7). Therefore, the haplotype analysis also provides an accurate
method to identify and characterize cellular mixtures in presumably
single-nuclear samples.
FISH on FFPE Tissue FISH was performed on 5-μm formalin-fi xed paraffi n-embedded
(FFPE) tissues, which were baked at 60°C for at least 2 hours, then
deparaffi nized and digested using methods described previously ( 55 ).
See Supplementary Methods for probes used in this study. Tissue
sections and probes were codenatured, hybridized at least 16 hours
at 37°C in a darkened humid chamber, washed in 2× saline-sodium
citrate (SSC) at 70°C for 10 minutes, rinsed in room-temperature 2×
SSC, and counterstained with DAPI (Abbott Molecular/Vysis, Inc.).
Slides were imaged using an Olympus BX51 fl uorescence micro-
scope. Individual images were captured using an Applied Imaging
system running CytoVision Genus version 3.9, and all aberrations
detected by FISH were reviewed and confi rmed by a cytogeneticist
(A.H. Ligon).
BAC Probes in FISH Bacterial artifi cial chromosome (BAC) probes were all obtained
from the CHORI BACPAC Resources Center (Oakland, CA) and
included: clone RP11-815K24 (corresponding to EGFR , at 7p11.2),
clone RP11-121K16 (corresponding to 6q13), and clone RP11-482I10
(mapping to 9p21.3). Commercially available probes (all obtained
from Abbott Molecular) included CEP6 (6p11.1-q11), CEP7 (7p11.1-
q11.1), and CEP9 (9p11-q11). Final homebrew probe concentra-
tions were 100 ng/μL. Final concentrations for commercial reference
probes followed the manufacturer’s directions.
Agilent SureFISH Specifi c detection of the EGFRvIII and EGFR wild-type alleles was
performed using custom-designed pooled oligonucleotide probe sets
(SureFISH), which tiled exons 2 to 7 (red probe, retained in wild-type

AUGUST 2014�CANCER DISCOVERY | 969
Single-Nucleus Sequencing of GBM Mutational Heterogeneity RESEARCH ARTICLE
EGFR ) and exons 9 to 28 (green probe, used to enumerate copies of
both wild-type EGFR and EGFRvIII). Hybridization was performed
according to the manufacturer’s protocol (Agilent Technologies) on
4-μm FFPE sections from BT325.
Expression Constructs Wild-type EGFR and EGFRvIII p-BABE-puro vectors were prepared
as previously described ( 38 ). QuikChange site-directed mutagenesis
(Stratagene) was used for generating EGFR vII using wild-type EGFR
as a template. All plasmids were confi rmed by sequencing.
Cell Culture and Generation of Cell Lines by Viral Transduction
Ba/F3 cells were obtained, thawed, and maintained as previously
described ( 38 ). Proliferation assays were performed as previously
described ( 37 ). The Ba/F3 cells were confi rmed to be the parental line
through a cell viability test following removal of IL3.
Mouse neural stem cells were derived from E14.5 ganglionic emi-
nencies of p16Ink4a:p19Arf-null embryos, genotyped by qPCR on
genomic DNA as described ( 13 , 39 ). Cells were transduced by EGFR
wild-type, EGFRvII, or EGFRvIII p-BABE retrovirus and selected with
puromycin after 3 days for two passages. Transduction of the EGFR
variant was confi rmed by immunoblot. For subcutaneous xenograft
studies, EGFRvII- or EGFRvIII-transduced mouse neural stem cells
(10 6 cells) were injected in the left fl ank of nude mice with EGFR wild-
type injected on the right as control. Five mice were injected for each
EGFR variant. All animal experiments were performed in accordance
with Dana-Farber Cancer Institute animal facility regulations and
policy under the protocol #09-016.
Drug Sensitivity Assay For growth inhibition assays, Ba/F3 cells (10,000 cells) were plated
in 180 μL of media in 96-well fl at-bottom plates. Twenty-four hours
after plating, drugs prepared in 20 μL of cell culture medium were
added to cells. All drugs were purchased from LC Laboratories. The
concentrations of erlotinib and lapatinib used for the assay ranged
from 0.1 nmol/L to 10 μmol/L. The concentrations of afatinib
and neratinib ranged from 0.001 to 100 nmol/L. The cells were
incubated for another 72 hours and the viable cell numbers were
measured using CellTiter Glo (Promega).
Immunoblotting and Antibodies Cultures were serum-starved for 3 hours before EGF stimulation
and harvesting. EGF (PeproTech) stimulations were performed using
25 ng/mL for 10 minutes. Anti-EGFR, phospho-EGFR (pY1068),
AKT, phospho-AKT (pS473), ERK1/2, and phospho-ERK1/2 (pT202/
Y204) antibodies were purchased from Cell Signaling Technology.
Anti-vinculin was from Sigma-Aldrich.
Disclosure of Potential Confl icts of Interest M. Meyerson reports receiving a commercial research grant from
Bayer and has ownership interest (including patents) in and is a
consultant/advisory board member for Foundation Medicine. No
potential confl icts of interest were disclosed by the other authors.
Authors’ Contributions Conception and design: J.M. Francis, C.-Z. Zhang, C.L. Maire, J.
Jung, V.A. Adalsteinsson, M. Meyerson, K.L. Ligon
Development of methodology: J.M. Francis, C.-Z. Zhang, C.L. Maire,
J. Jung, B. Blumenstiel, K.L. Ligon
Acquisition of data (provided animals, acquired and man-
aged patients, provided facilities, etc.): J.M. Francis, C.-Z. Zhang,
C.L. Maire, V.E. Manzo, S. Haidar, J.C. Love, K.L. Ligon
Analysis and interpretation of data (e.g., statistical analysis,
biostatistics, computational analysis): J.M. Francis, C.-Z. Zhang,
C.L. Maire, S. Haidar, C.S. Pedamallu, A.H. Ligon, K.L. Ligon
Writing, review, and/or revision of the manuscript: J.M. Francis,
C.-Z. Zhang, C.L. Maire, J. Jung, A.H. Ligon, M. Meyerson, K.L. Ligon
Administrative, technical, or material support (i.e., reporting or
organizing data, constructing databases): J.M. Francis, C.-Z. Zhang,
H. Homer, S. Haidar, K.L. Ligon
Study supervision: J.M. Francis, C.-Z. Zhang, J.C. Love, M. Meyer-
son, K.L. Ligon
Acknowledgments The authors thank Dr. Juliann Chmielecki for generating the EGFRvII
expression construct and Drs. Scott Carter and Marcin Imielinski for
helpful discussions. The authors also thank the Brigham and Women’s
Hospital Tissue Biorepository Core (Dr. William Richards, Director)
and the Department of Pathology faculty and staff of the Dana-Farber
Cancer Institute Tissue Bank for their help and dedication. The authors
also thank Leslie Gaffney for help in preparing fi gures.
Grant Support This work was supported by the Bridge Project, a collaboration
between The David H. Koch Institute for Integrative Cancer Research
at MIT and the Dana-Farber/Harvard Cancer Center (DF/HCC), and
the National Brain Tumor Society (to J.C. Love, K.L. Ligon, and M.
Meyerson). This work was supported in part by grants to K.L. Ligon
from NCI R01CA170592, P01CA142536, and the Sontag Founda-
tion, and to M. Meyerson from NCI R01CA116020.
Received November 15, 2013; revised May 18, 2014; accepted May
22, 2014; published OnlineFirst June 3, 2014.
REFERENCES 1. Furnari FB , Fenton T , Bachoo RM , Mukasa A , Stommel JM , Stegh
A , et al. Malignant astrocytic glioma: genetics, biology, and paths to
treatment . Genes Dev 2007 ; 21 : 2683 – 710 .
2. TCGA . Comprehensive genomic characterization defi nes human
glioblastoma genes and core pathways . Nature 2008 ; 455 : 1061 – 8 .
3. Parsons DW , Jones S , Zhang X , Lin JC , Leary RJ , Angenendt P , et al.
An integrated genomic analysis of human glioblastoma multiforme .
Science 2008 ; 321 : 1807 – 12 .
4. Brennan CW , Verhaak RG , McKenna A , Campos B , Noushmehr H ,
Salama SR , et al. The somatic genomic landscape of glioblastoma .
Cell 2013 ; 155 : 462 – 77 .
5. Nathanson DA , Gini B , Mottahedeh J , Visnyei K , Koga T , Gomez G ,
et al. Targeted therapy resistance mediated by dynamic regulation of
extrachromosomal mutant EGFR DNA . Science 2014 ; 343 : 72 – 6 .
6. Johnson BE , Mazor T , Hong C , Barnes M , Aihara K , McLean CY , et al.
Mutational analysis reveals the origin and therapy-driven evolution
of recurrent glioma . Science 2014 ; 343 : 189 – 93 .
7. Snuderl M , Fazlollahi L , Le LP , Nitta M , Zhelyazkova BH , Davidson
CJ , et al. Mosaic amplifi cation of multiple receptor tyrosine kinase
genes in glioblastoma . Cancer Cell 2011 ; 20 : 810 – 7 .
8. Szerlip NJ , Pedraza A , Chakravarty D , Azim M , McGuire J , Fang Y , et al.
Intratumoral heterogeneity of receptor tyrosine kinases EGFR and PDG-
FRA amplifi cation in glioblastoma defi nes subpopulations with distinct
growth factor response . Proc Natl Acad Sci U S A 2012 ; 109 : 3041 – 6 .
9. Verhaak RG , Hoadley KA , Purdom E , Wang V , Qi Y , Wilkerson MD ,
et al. Integrated genomic analysis identifi es clinically relevant sub-
types of glioblastoma characterized by abnormalities in PDGFRA,
IDH1, EGFR, and NF1 . Cancer Cell 2010 ; 17 : 98 – 110 .
10. Yang L , Luquette LJ , Gehlenborg N , Xi R , Haseley PS , Hsieh CH , et al.
Diverse mechanisms of somatic structural variations in human can-
cer genomes . Cell 2013 ; 153 : 919 – 29 .
970 | CANCER DISCOVERY�AUGUST 2014 www.aacrjournals.org
Francis et al.RESEARCH ARTICLE
11. Sanborn JZ , Salama SR , Grifford M , Brennan CW , Mikkelsen T ,
Jhanwar S , et al. Double minute chromosomes in glioblastoma multi-
forme are revealed by precise reconstruction of oncogenic amplicons .
Cancer Res 2013 ; 73 : 6036 – 45 .
12. Zheng S , Fu J , Vegesna R , Mao Y , Heathcock LE , Torres-Garcia W ,
et al. A survey of intragenic breakpoints in glioblastoma identifi es
a distinct subset associated with poor survival . Genes Dev 2013 ; 27 :
1462 – 72 .
13. Bachoo RM , Maher EA , Ligon KL , Sharpless NE , Chan SS , You MJ ,
et al. Epidermal growth factor receptor and Ink4a/Arf: convergent
mechanisms governing terminal differentiation and transformation
along the neural stem cell to astrocyte axis . Cancer Cell 2002 ; 1 :
269 – 77 .
14. Inda MM , Bonavia R , Mukasa A , Narita Y , Sah DW , Vandenberg
S , et al. Tumor heterogeneity is an active process maintained by a
mutant EGFR-induced cytokine circuit in glioblastoma . Genes Dev
2010 ; 24 : 1731 – 45 .
15. Cho J , Pastorino S , Zeng Q , Xu X , Johnson W , Vandenberg S , et al.
Glioblastoma-derived epidermal growth factor receptor carboxyl-
terminal deletion mutants are transforming and are sensitive to
EGFR-directed therapies . Cancer Res 2011 ; 71 : 7587 – 96 .
16. Fan QW , Cheng CK , Gustafson WC , Charron E , Zipper P , Wong
RA , et al. EGFR phosphorylates tumor-derived EGFRvIII driving
STAT3/5 and progression in glioblastoma . Cancer Cell 2013 ; 24 :
438 – 49 .
17. Nishikawa R , Sugiyama T , Narita Y , Furnari F , Cavenee WK , Mat-
sutani M . Immunohistochemical analysis of the mutant epidermal
growth factor, deltaEGFR, in glioblastoma . Brain Tumor Pathol
2004 ; 21 : 53 – 6 .
18. Carter SL , Cibulskis K , Helman E , McKenna A , Shen H , Zack T , et al.
Absolute quantifi cation of somatic DNA alterations in human can-
cer . Nat Biotechnol 2012 ; 30 : 413 – 21 .
19. Nik-Zainal S , Van Loo P , Wedge DC , Alexandrov LB , Greenman CD ,
Lau KW , et al. The life history of 21 breast cancers . Cell 2012 ; 149 : 994 –
1007 .
20. Frederick L , Wang XY , Eley G , James CD . Diversity and frequency of
epidermal growth factor receptor mutations in human glioblasto-
mas . Cancer Res 2000 ; 60 : 1383 – 7 .
21. Zong C , Lu S , Chapman AR , Xie XS . Genome-wide detection of
single-nucleotide and copy-number variations of a single human cell .
Science 2012 ; 338 : 1622 – 6 .
22. Voet T , Kumar P , Van Loo P , Cooke SL , Marshall J , Lin ML , et al.
Single-cell paired-end genome sequencing reveals structural variation
per cell cycle . Nucleic Acids Res 2013 ; 41 : 6119 – 38 .
23. Van der Aa N , Cheng J , Mateiu L , Esteki MZ , Kumar P , Dimitriadou
E , et al. Genome-wide copy number profi ling of single cells in S-phase
reveals DNA-replication domains . Nucleic Acids Res 2013 ; 41 : e66 .
24. Navin N , Kendall J , Troge J , Andrews P , Rodgers L , McIndoo J ,
et al. Tumour evolution inferred by single-cell sequencing . Nature
2011 ; 472 : 90 – 4 .
25. Hou Y , Song L , Zhu P , Zhang B , Tao Y , Xu X , et al. Single-cell exome
sequencing and monoclonal evolution of a JAK2-negative myelopro-
liferative neoplasm . Cell 2012 ; 148 : 873 – 85 .
26. Xu X , Hou Y , Yin X , Bao L , Tang A , Song L , et al. Single-cell exome
sequencing reveals single-nucleotide mutation characteristics of a
kidney tumor . Cell 2012 ; 148 : 886 – 95 .
27. Potter NE , Ermini L , Papaemmanuil E , Cazzaniga G , Vijayaraghavan
G , Titley I , et al. Single cell mutational profi ling and clonal phylogeny
in cancer . Genome Res 2013 ; 23 : 2115 – 25 .
28. Landau DA , Carter SL , Stojanov P , McKenna A , Stevenson K , Law-
rence MS , et al. Evolution and impact of subclonal mutations in
chronic lymphocytic leukemia . Cell 2013 ; 152 : 714 – 26 .
29. Huang FW , Hodis E , Xu MJ , Kryukov GV , Chin L , Garraway LA .
Highly recurrent TERT promoter mutations in human melanoma .
Science 2013 ; 339 : 957 – 9 .
30. Horn S , Figl A , Rachakonda PS , Fischer C , Sucker A , Gast A , et al.
TERT promoter mutations in familial and sporadic melanoma . Sci-
ence 2013 ; 339 : 959 – 61 .
31. Killela PJ , Reitman ZJ , Jiao Y , Bettegowda C , Agrawal N , Diaz LA Jr ,
et al. TERT promoter mutations occur frequently in gliomas and a
subset of tumors derived from cells with low rates of self-renewal .
Proc Natl Acad Sci U S A 2013 ; 110 : 6021 – 6 .
32. Loven J , Hoke HA , Lin CY , Lau A , Orlando DA , Vakoc CR , et al. Selec-
tive inhibition of tumor oncogenes by disruption of super-enhancers .
Cell 2013 ; 153 : 320 – 34 .
33. Zack TI , Schumacher SE , Carter SL , Cherniack AD , Saksena G , Tabak
B , et al. Pan-cancer patterns of somatic copy number alteration . Nat
Genet 2013 ; 45 : 1134 – 40 .
34. Yates LR , Campbell PJ . Evolution of the cancer genome . Nat Rev
Genet 2012 ; 13 : 795 – 806 .
35. Humphrey PA , Gangarosa LM , Wong AJ , Archer GE , Lund-Johansen
M , Bjerkvig R , et al. Deletion-mutant epidermal growth factor recep-
tor in human gliomas: effects of type II mutation on receptor func-
tion . Biochem Biophys Res Commun 1991 ; 178 : 1413 – 20 .
36. Wong AJ , Ruppert JM , Bigner SH , Grzeschik CH , Humphrey PA ,
Bigner DS , et al. Structural alterations of the epidermal growth factor
receptor gene in human gliomas . Proc Natl Acad Sci U S A 1992 ; 89 :
2965 – 9 .
37. Jiang J , Greulich H , Janne PA , Sellers WR , Meyerson M , Griffi n
JD . Epidermal growth factor-independent transformation of Ba/
F3 cells with cancer-derived epidermal growth factor receptor
mutants induces gefi tinib-sensitive cell cycle progression . Cancer Res
2005 ; 65 : 8968 – 74 .
38. Ji H , Zhao X , Yuza Y , Shimamura T , Li D , Protopopov A , et al. Epider-
mal growth factor receptor variant III mutations in lung tumorigen-
esis and sensitivity to tyrosine kinase inhibitors . Proc Natl Acad Sci
U S A 2006 ; 103 : 7817 – 22 .
39. Serrano M , Lee H , Chin L , Cordon-Cardo C , Beach D , DePinho RA .
Role of the INK4a locus in tumor suppression and cell mortality . Cell
1996 ; 85 : 27 – 37 .
40. Stommel JM , Kimmelman AC , Ying H , Nabioullin R , Ponugoti
AH , Wiedemeyer R , et al. Coactivation of receptor tyrosine kinases
affects the response of tumor cells to targeted therapies . Science
2007 ; 318 : 287 – 90 .
41. Ding L , Ley TJ , Larson DE , Miller CA , Koboldt DC , Welch JS , et al.
Clonal evolution in relapsed acute myeloid leukaemia revealed by
whole-genome sequencing . Nature 2012 ; 481 : 506 – 10 .
42. Gerlinger M , Rowan AJ , Horswell S , Larkin J , Endesfelder D , Gron-
roos E , et al. Intratumor heterogeneity and branched evolution
revealed by multiregion sequencing . N Engl J Med 2012 ; 366 : 883 – 92 .
43. Sottoriva A , Spiteri I , Piccirillo SG , Touloumis A , Collins VP , Mar-
ioni JC , et al. Intratumor heterogeneity in human glioblastoma
refl ects cancer evolutionary dynamics . Proc Natl Acad Sci U S A
2013 ; 110 : 4009 – 14 .
44. Bell DW , Gore I , Okimoto RA , Godin-Heymann N , Sordella R , Mul-
loy R , et al. Inherited susceptibility to lung cancer may be associated
with the T790M drug resistance mutation in EGFR . Nat Genet
2005 ; 37 : 1315 – 6 .
45. Kobayashi S , Boggon TJ , Dayaram T , Janne PA , Kocher O , Meyerson
M , et al. EGFR mutation and resistance of non-small-cell lung cancer
to gefi tinib . N Engl J Med 2005 ; 352 : 786 – 92 .
46. Yeh P , Chen H , Andrews J , Naser R , Pao W , Horn L . DNA-mutation
inventory to refi ne and enhance cancer treatment (DIRECT): a cata-
log of clinically relevant cancer mutations to enable genome-directed
anticancer therapy . Clin Cancer Res 2013 ; 19 : 1894 – 901 .
47. Barber TD , Vogelstein B , Kinzler KW , Velculescu VE . Somatic muta-
tions of EGFR in colorectal cancers and glioblastomas . N Engl J Med
2004 ; 351 : 2883 .
48. Lee JC , Vivanco I , Beroukhim R , Huang JH , Feng WL , DeBiasi RM ,
et al. Epidermal growth factor receptor activation in glioblastoma
through novel missense mutations in the extracellular domain . PLoS
Med 2006 ; 3 : e485 .
49. Vivanco I , Robins HI , Rohle D , Campos C , Grommes C , Nghiem-
phu PL , et al. Differential sensitivity of glioma- versus lung cancer-
specifi c EGFR mutations to EGFR kinase inhibitors . Cancer Discov
2012 ; 2 : 458 – 71 .
AUGUST 2014�CANCER DISCOVERY | 971
Single-Nucleus Sequencing of GBM Mutational Heterogeneity RESEARCH ARTICLE
50. Vogelstein B , Papadopoulos N , Velculescu VE , Zhou S , Diaz LA
Jr , Kinzler KW . Cancer genome landscapes . Science 2013 ; 339 :
1546 – 58 .
51. Chiang DY , Getz G , Jaffe DB , O’Kelly MJ , Zhao X , Carter SL , et al.
High-resolution mapping of copy-number alterations with massively
parallel sequencing . Nat Methods 2009 ; 6 : 99 – 103 .
52. Baker SJ , Fearon ER , Nigro JM , Hamilton SR , Preisinger AC , Jessup
JM , et al. Chromosome 17 deletions and p53 gene mutations in color-
ectal carcinomas . Science 1989 ; 244 : 217 – 21 .
53. Kern SE , Fearon ER , Tersmette KW , Enterline JP , Leppert M , Naka-
mura Y , et al. Clinical and pathological associations with allelic loss
in colorectal carcinoma [corrected] . JAMA 1989 ; 261 : 3099 – 103 .
54. Vogelstein B , Fearon ER , Kern SE , Hamilton SR , Preisinger AC , Naka-
mura Y , et al. Allelotype of colorectal carcinomas . Science 1989 ; 244 :
207 – 11 .
55. Firestein R , Bass AJ , Kim SY , Dunn IF , Silver SJ , Guney I , et al. CDK8
is a colorectal cancer oncogene that regulates beta-catenin activity .
Nature 2008 ; 455 : 547 – 51 .
Copyright © 2022 FDOKUMEN