Broadband time-resolved spectroscopy of thermonuclear X ...
23
arXiv:2109.14631v1 [astro-ph.HE] 29 Sep 2021 MNRAS 000, 1–23 (2021) Preprint 1 October 2021 Compiled using MNRAS L A T E X style file v3.0 Broadband time-resolved spectroscopy of thermonuclear X-ray bursts from 4U 1636-536 using AstroSat Unnati Kashyap 1 ★ , Biki Ram 1 , Tolga Güver 2,3 , Manoneeta Chakraborty 1 1 Department of Astronomy, Astrophysics and Space Engineering (DAASE), Indian Institute of Technology Indore, Khandwa Road, Simrol, Indore 453552, India 2 Istanbul University, Science Faculty, Department of Astronomy and Space Sciences, Beyazıt, 34119, İstanbul, Turkey 3 Istanbul University Observatory Research and Application Center, Istanbul University 34119, İstanbul Turkey Accepted XXX. Received YYY; in original form ZZZ ABSTRACT Broadband spectral studies of Type-I X-ray bursts can put strong constraints on the physics of burst spectra as well as their interaction with the environment. We present the results obtained from the broadband time-resolved spectroscopy of 15 ther- monuclear bursts detected simultaneously from the neutron star atoll source 4U 1636–536 using LAXPC and SXT onboard AstroSat. During the observations with AstroSat, the Low mass X-ray binary (LMXB) 4U 1636–536 is observed to show a modest spectral evolution within the island state. The broadband burst spectra are observed to show an excess in addition to the thermal emission from the neutron star surface near the peak of the bursts. We investigate the interpretation of the excess observed near the peak of the burst as re-emission/reprocessing of the photons by the accretion disk/corona or scattering of the photons in the neutron star atmosphere or the enhanced persistent emission due to Poynting–Robertson drag. This is the first reported broadband simultaneous study of Type-I bursts using LAXPC and SXT onboard AstroSat. This kind of study may provide a better understanding of the burst-accretion interaction and how the bursts influence the overall accretion process contributed by the accretion disk as well as the corona. Key words: accretion disk – stars: individual (4U 1636–536) – stars: neutron – X-rays: binaries – X-rays: bursts 1 INTRODUCTION Thermonuclear X-ray bursts (Type-I) occur due to the unstable burn- ing of primarily hydrogen and/or helium at the surface of the ac- creting neutron star in Low Mass X-ray Binaries (LMXBs). During these thermonuclear ignition events, the source flux increases by sev- eral times than the persistent level (Galloway et al. 2008; Zhang et al. 2009; Woosley & Taam 1976). These thermonuclear bursts are char- acterized by fast rise times ranging between 1 and 10 seconds, long decay times ranging from ten to hundreds of seconds, and recur- rence times of hours to days. Following the peak, the burst undergoes an exponential decay (Lewin et al. 1993). Several meters thick lay- ers are formed via the accumulation of matter on the surface of the neutron star from the binary companion (Galloway et al. 2008). The burst properties strongly depend on the mass accretion rate (Fujimoto et al. 1981; Zhang et al. 2011; Galloway & Keek 2021) in addition to several other factors such as accreted fuel, the spin of the neutron star, compactness, metallicity as well as the thermal state of the accreting neutron star (Narayan & Heyl 2003; Bildsten 1995, 1998; Cumming & Macbeth 2004). The physics behind the occurrence of Type I X-ray burst is very complex, but the burst spec- tra were usually well described by the simple blackbody function (Wijnands 2001; Güver et al. 2012). The time-resolved spectroscopic analysis of thermonuclear bursts shows that the burst spectra are de- scribed by evolving Planckian functions with temperature ranging ★ E-mail: [email protected] from 1-3 keV (Strohmayer & Bildsten 2006; Degenaar et al. 2018; Galloway & Keek 2021). Deviations from the Planckian model were found during the RXTE/PCA observations indicating an excess in the burst spectra (Worpel et al. 2013, 2015). This kind of excess may be produced by reflections of burst radiation from the disk or repro- cessing of the burst photons from the corona or enhancement of the accretion flow due to the Poynting–Robertson radiation drag on the disk (in’t Zand et al. 2013; Degenaar et al. 2013; Keek et al. 2017, 2018a; Worpel et al. 2013; Roy et al. 2021). The detection of the iron lines during superbursts reveals the reprocessing/reflection of the burst emission by the inner accretion disk and impacts of the bursts on the accretion disk (Ballantyne 2004; Ballantyne & Strohmayer 2004; Keek et al. 2014b). The LMXB neutron star atoll source 4U 1636-536 is a very fre- quent and prolific X-ray burster. A total of 664 unique bursts were detected from this source starting from 1996 February 8 through 2012 May 3 with a mean burst rate of 0.26 ℎ −1 (Galloway et al. 2020). Most bursts from this source are detected and studied with in- struments that are sensitive to relatively high photon energies and the corresponding spectra were usually fitted with a standard Planckian spectrum (Galloway et al. 2008; Keek et al. 2014b; Beri et al. 2019). In this work, we analyze a total of 15 Type I X-ray bursts de- tected simultaneously by LAXPC and SXT onboard AstroSat. We study and investigate the interpretations of the broadband spectra of these bursts. We present the results obtained from the broadband (LAXPC+SXT) time-resolved spectroscopy of all the bursts detected simultaneously. This kind of joint broadband study of thermonuclear © 2021 The Authors
-
Upload
khangminh22 -
Category
Documents
-
view
1 -
download
0
Transcript of Broadband time-resolved spectroscopy of thermonuclear X ...

arX
iv:2
109.
1463
1v1
[as
tro-
ph.H
E]
29
Sep
2021
MNRAS 000, 1–23 (2021) Preprint 1 October 2021 Compiled using MNRAS LATEX style file v3.0
Broadband time-resolved spectroscopy of thermonuclear X-ray burstsfrom 4U 1636-536 using AstroSat
Unnati Kashyap 1★, Biki Ram 1, Tolga Güver 2,3, Manoneeta Chakraborty11 Department of Astronomy, Astrophysics and Space Engineering (DAASE), Indian Institute of Technology Indore, Khandwa Road, Simrol, Indore 453552, India2 Istanbul University, Science Faculty, Department of Astronomy and Space Sciences, Beyazıt, 34119, İstanbul, Turkey3 Istanbul University Observatory Research and Application Center, Istanbul University 34119, İstanbul Turkey
Accepted XXX. Received YYY; in original form ZZZ
ABSTRACT
Broadband spectral studies of Type-I X-ray bursts can put strong constraints on the physics of burst spectra as well as theirinteraction with the environment. We present the results obtained from the broadband time-resolved spectroscopy of 15 ther-monuclear bursts detected simultaneously from the neutron star atoll source 4U 1636–536 using LAXPC and SXT onboardAstroSat. During the observations with AstroSat, the Low mass X-ray binary (LMXB) 4U 1636–536 is observed to show amodest spectral evolution within the island state. The broadband burst spectra are observed to show an excess in addition to thethermal emission from the neutron star surface near the peak of the bursts. We investigate the interpretation of the excess observednear the peak of the burst as re-emission/reprocessing of the photons by the accretion disk/corona or scattering of the photonsin the neutron star atmosphere or the enhanced persistent emission due to Poynting–Robertson drag. This is the first reportedbroadband simultaneous study of Type-I bursts using LAXPC and SXT onboard AstroSat. This kind of study may provide abetter understanding of the burst-accretion interaction and how the bursts influence the overall accretion process contributed bythe accretion disk as well as the corona.
Key words: accretion disk – stars: individual (4U 1636–536) – stars: neutron – X-rays: binaries – X-rays: bursts
1 INTRODUCTION
Thermonuclear X-ray bursts (Type-I) occur due to the unstable burn-ing of primarily hydrogen and/or helium at the surface of the ac-creting neutron star in Low Mass X-ray Binaries (LMXBs). Duringthese thermonuclear ignition events, the source flux increases by sev-eral times than the persistent level (Galloway et al. 2008; Zhang et al.2009; Woosley & Taam 1976). These thermonuclear bursts are char-acterized by fast rise times ranging between 1 and 10 seconds, longdecay times ranging from ten to hundreds of seconds, and recur-rence times of hours to days. Following the peak, the burst undergoesan exponential decay (Lewin et al. 1993). Several meters thick lay-ers are formed via the accumulation of matter on the surface ofthe neutron star from the binary companion (Galloway et al. 2008).The burst properties strongly depend on the mass accretion rate(Fujimoto et al. 1981; Zhang et al. 2011; Galloway & Keek 2021)in addition to several other factors such as accreted fuel, the spinof the neutron star, compactness, metallicity as well as the thermalstate of the accreting neutron star (Narayan & Heyl 2003; Bildsten1995, 1998; Cumming & Macbeth 2004). The physics behind theoccurrence of Type I X-ray burst is very complex, but the burst spec-tra were usually well described by the simple blackbody function(Wijnands 2001; Güver et al. 2012). The time-resolved spectroscopicanalysis of thermonuclear bursts shows that the burst spectra are de-scribed by evolving Planckian functions with temperature ranging
★ E-mail: [email protected]
from 1-3 keV (Strohmayer & Bildsten 2006; Degenaar et al. 2018;Galloway & Keek 2021). Deviations from the Planckian model werefound during the RXTE/PCA observations indicating an excess inthe burst spectra (Worpel et al. 2013, 2015). This kind of excess maybe produced by reflections of burst radiation from the disk or repro-cessing of the burst photons from the corona or enhancement of theaccretion flow due to the Poynting–Robertson radiation drag on thedisk (in’t Zand et al. 2013; Degenaar et al. 2013; Keek et al. 2017,2018a; Worpel et al. 2013; Roy et al. 2021). The detection of theiron lines during superbursts reveals the reprocessing/reflection of theburst emission by the inner accretion disk and impacts of the burstson the accretion disk (Ballantyne 2004; Ballantyne & Strohmayer2004; Keek et al. 2014b).
The LMXB neutron star atoll source 4U 1636-536 is a very fre-quent and prolific X-ray burster. A total of 664 unique bursts weredetected from this source starting from 1996 February 8 through2012 May 3 with a mean burst rate of 0.26 ℎA−1 (Galloway et al.2020). Most bursts from this source are detected and studied with in-struments that are sensitive to relatively high photon energies and thecorresponding spectra were usually fitted with a standard Planckianspectrum (Galloway et al. 2008; Keek et al. 2014b; Beri et al. 2019).
In this work, we analyze a total of 15 Type I X-ray bursts de-tected simultaneously by LAXPC and SXT onboard AstroSat. Westudy and investigate the interpretations of the broadband spectraof these bursts. We present the results obtained from the broadband(LAXPC+SXT) time-resolved spectroscopy of all the bursts detectedsimultaneously. This kind of joint broadband study of thermonuclear
© 2021 The Authors

2 U. Kashyap et al.
Table 1. Observation details of the bursts detected in the LAXPC data of 4U1636–536
Observation ID No. of Bursts detected
9000001326 39000001574 69000002084 29000002278 29000002316 14
bursts provides a better opportunity to study burst-accretion inter-actions and the impact of bursts on the accretion environment. Wealso present a detailed analysis of the excess detected in the burstspectra. Through this work, we show that the broadband capabilityof AstroSat enables an insightful study of the deviations from thePlanckian spectrum during a thermonuclear burst and their physicalorigin.
2 OBSERVATIONS AND DATA REDUCTION
2.1 LAXPC
The LAXPC (Large Area X-ray Proportional Counter) instrument isone of the major payloads on AstroSat consisting of three identicalproportional counter detector units named LAXPC10, LAXPC20,and LAXPC30. It has three identical units with the largest effectivearea in the mid-X-ray range 3-80 keV and a large area collectionof 6000 2<2 at 15 keV. The deadtime and time resolution of thesedetectors are about 42 `s and 10 `s. The good time resolution makesLAXPC ideal for fast timing analysis and time-resolved spectroscopyof thermonuclear bursts (Yadav et al. 2017).
2.2 SXT
The Soft X-ray Telescope (SXT) onboard AstroSat provides spectrain the energy range of 0.3-8 keV. The effective area of SXT is 90 2<2
at 1.5 keV, and it has a focal length of 2 meters. Its field of view is40 ′ and the size of the point spread function (PSF) is 3-4 arcmin.The time resolution of SXT is 2.37 s. The spatial as well as spectralresolution and the good sensitivity makes SXT favorable for spectralanalysis as well as variability observations in the soft X-ray regime(Singh et al. 2017).
2.3 Data
We searched the AstroSat observation database of 4U 1636–536starting from 21 June 2017 till 20 Aug 2018 for bursts that were si-multaneously covered by LAXPC and SXT. LAXPC and SXT jointlyobserved this source over 8 observational epochs during this entireperiod (Table 2).
2.3.1 LAXPC
For spectro-temporal analysis using LAXPC data, event analysis(EA) mode data were used. In the event mode, the arrival times,as well as energies of each detected photons, are recorded. The de-tails of the bursts detected by LAXPC are listed in Table 1. TheLAXPC data were analyzed using LaxpcSoft software (Antia et al.2017). The light curves, spectra as well as background, and responsefiles were processed using LaxpcSoft software. Due to gas leakage,
0 100 200 300 400Total intensity (counts/s)
0.6
0.8
1.0
1.2
1.4
HC
21june20172oct20173oct2017
9may20186aug2018
18aug201819aug201820aug2018
Figure 1. The hardness-intensity diagram of the LAXPC observations of 4U1636–536 which contain the bursts in our sample. Different colors representthe observations on different dates. Hard color is defined as the 16.0-9.7keV/9.7-6.4 keV background subtracted count rate ratio and intensity as thewhole energy band background subtracted count rate. Each point correspondsto a 256 s bin size.
LAXPC30 has low gain and consequently, the LAXPC 30 data werenot useful. For most of the LAXPC analysis, LAXPC20 data wereused as it provides the maximum gain and sensitivity.
2.3.2 SXT
Similar to LAXPC, we collected SXT level2 data for the sameobservations. In order to extract the image, light curves, as wellas spectrum, these cleaned level2 event files were used. For thepurpose of extracting images, light curves, as well as spectrumftool XSELECT distributed as a part of Heasoft 6.24 package,was used. The sxtARFmodule was used to produce appropriateancillary response files. During spectral analysis the response file(sxt_pc_mat_g0to12.rmf) and blank sky background spectrum file(SkyBkg_comb_EL3p5_Cl_Rd16p0_v01.pha) provided by the SXTteam were used. All the data were in PC (photon counting) mode. InPC mode, data from the entire CCD (≈ 36000 pixels) above specifiedthreshold energy are collected. The time resolution of SXT in thismode is 2.37 s. The region-filtered event files were obtained using acircular region of 16 arcmins around the source location using ds9.
3 RESULTS
3.1 The HID
Figure 1 shows the Hardness Intensity diagram (HID) of the source.The hard color (HC) is defined as the ratio of the background-subtracted count rates in two energy bands 16.0-9.7 keV and 6.4-9.7keV. The different colors demonstrate the observations on differentdays. Starting from 21 June 2017, the source moves to a relativelysofter state during 2 October 2017 to 3 October 2017 observations.The source is observed to be in a relatively harder state during 18August 2018 to 20 August 2018 observations.
MNRAS 000, 1–23 (2021)
Broadband AstroSat study of 4U 1636–536 bursts 3
Table 2. Details of the bursts detected simultaneously with SXT as well as LAXPC onboard AstroSat from 4U 1636-536
Burst ID Observation ID Date (dd-mm-yyyy) Start time Burst (MET/UTC) Duration (s) Peak Flux0 Fluence1
B1 9000001326 21-06-2017 235769000.50 / 19:23:19.50 42.79 3.80+0.09−0.09 6.09+1.78
−1.78B2 235780295.43 / 22:31:34.43 57.05 17.38+0.40
−0.00 24.56+7.55−7.55
B3 9000001574 02-10-2017 244654733.96 / 15:38:52.96 47.55 7.41+0.17−0.17 8.96+3.45
−3.45
B4 9000001574 03-10-2017 244707001.09 / 06:10:00.09 23.77 2.09+0.10−0.09 2.42+0.67
−0.67
B5 9000002084 09-05-2018 263585754.65 / 18:15:53.65 23.77 4.57+0.11−0.10 4.08+1.70
−1.70
B6 9000002278 06-08-2018 271268546.74 / 16:22:25.74 76.07 14.79+0.34−0.34 29.54+8.76
−8.76B7 271278876.47 / 19:14:35.47 66.57 20.890.49
0.00 32.55+11.37−11.37
B8 9000002316 18-08-2018 272284280.83 / 10:31:19.83 33.28 5.75+0.13−0.13 7.70+2.40
−2.40
B9 9000002316 19-08-2018 272389159.87 / 15:39:18.87 47.55 14.45+0.00−0.33 21.75+6.11
−6.11B10 272390686.29 / 16:04:45.29 38.04 5.50+0.13
−0.13 7.79+2.54−2.54
B11 272401025.50 / 18:57:04.50 71.32 13.18+0.00−0.30 20.50+6.75
−6.75
B12 9000002316 20-08-2018 272419666.72 / 00:07:45.72 71.32 12.88+0.30−0.29 20.65+6.50
−6.50B13 272448343.01 / 08:05:42.01 52.30 13.80+0.32
−0.00 27.15+7.02−7.02
B14 272478238.91 / 16:23:57.91 71.32 16.98+0.40−0.00 26.90+8.53
−8.53B15 272488604.11 / 19:16:43.11 57.05 16.98+0.40
−0.00 25.26+8.11−8.11
0 In units of 10−9 erg/s/cm2
1 In units of 10−8 erg/cm2
Time (s) since burst start
0
10
20
30
40
Cou
nt R
ate
(ct
s/s)
SXT
-60 -40 -20 0 20 40 60200
400
600
800
1000
Cou
nt R
ate
(ct
s/s)
LAXPC
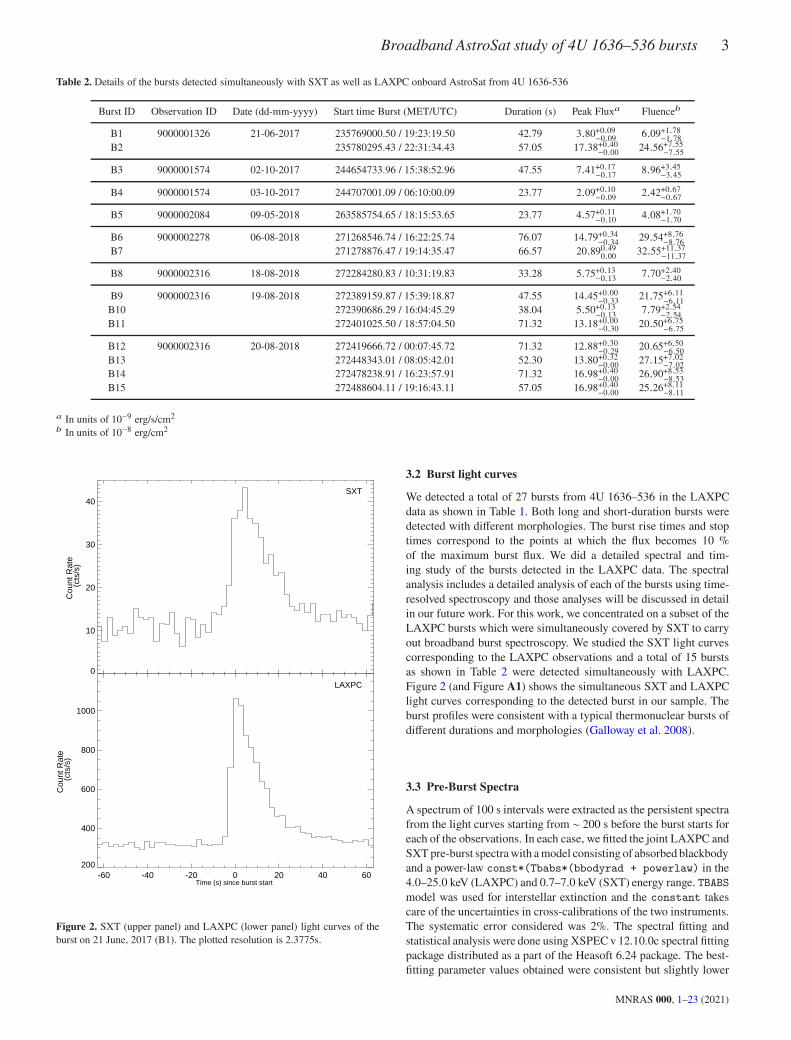
Figure 2. SXT (upper panel) and LAXPC (lower panel) light curves of theburst on 21 June, 2017 (B1). The plotted resolution is 2.3775s.
3.2 Burst light curves
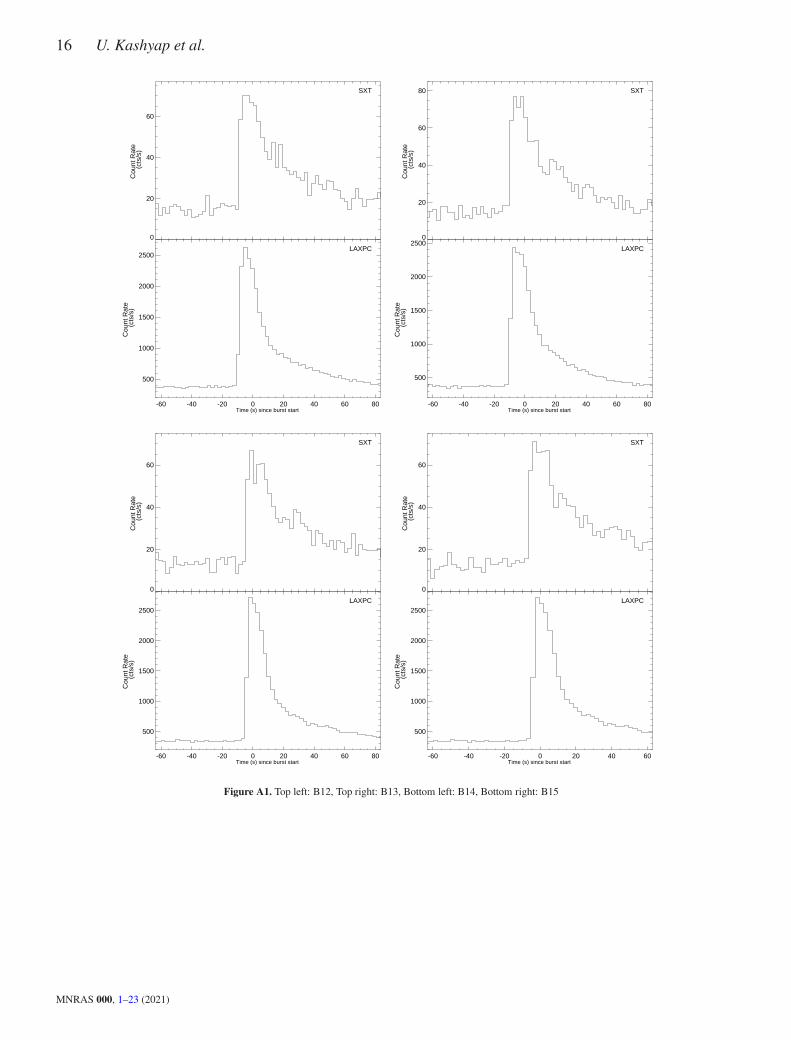
We detected a total of 27 bursts from 4U 1636–536 in the LAXPCdata as shown in Table 1. Both long and short-duration bursts weredetected with different morphologies. The burst rise times and stoptimes correspond to the points at which the flux becomes 10 %of the maximum burst flux. We did a detailed spectral and tim-ing study of the bursts detected in the LAXPC data. The spectralanalysis includes a detailed analysis of each of the bursts using time-resolved spectroscopy and those analyses will be discussed in detailin our future work. For this work, we concentrated on a subset of theLAXPC bursts which were simultaneously covered by SXT to carryout broadband burst spectroscopy. We studied the SXT light curvescorresponding to the LAXPC observations and a total of 15 burstsas shown in Table 2 were detected simultaneously with LAXPC.Figure 2 (and Figure A1) shows the simultaneous SXT and LAXPClight curves corresponding to the detected burst in our sample. Theburst profiles were consistent with a typical thermonuclear bursts ofdifferent durations and morphologies (Galloway et al. 2008).
3.3 Pre-Burst Spectra
A spectrum of 100 s intervals were extracted as the persistent spectrafrom the light curves starting from ∼ 200 s before the burst starts foreach of the observations. In each case, we fitted the joint LAXPC andSXT pre-burst spectra with a model consisting of absorbed blackbodyand a power-law const*(Tbabs*(bbodyrad + powerlaw) in the4.0–25.0 keV (LAXPC) and 0.7–7.0 keV (SXT) energy range. TBABSmodel was used for interstellar extinction and the constant takescare of the uncertainties in cross-calibrations of the two instruments.The systematic error considered was 2%. The spectral fitting andstatistical analysis were done using XSPEC v 12.10.0c spectral fittingpackage distributed as a part of the Heasoft 6.24 package. The best-fitting parameter values obtained were consistent but slightly lower
MNRAS 000, 1–23 (2021)

4 U. Kashyap et al.
100 101Energy (keV)
10−1
100
101
102
Rate (c
ount/s/keV
)
LAXPCSXTsingle BBDouble BBPower lawVariable persistent emission
Figure 3. Comparison of different models for fitting the broadband(SXT+LAXPC) burst spectrum of a 4.7549 s segment bin (where F-testcondition is satisfied) of the burst detected on 6 August 2018 (B6). A singleblackbody (black) gives a poor fit; whereas double black bodies (blue), Power-law (magenta), and a variable persistent flux (red) all give better goodnessof fits to a similar extent. The shaded band represents the 1f errors for thespectral fitting in the 0.7-20 keV band.
than the previously reported literature values due to the variation inthe spectral states (Li et al. 2021).
3.4 Time-resolved burst spectroscopy
To probe the spectral evolution during the thermonuclear bursts,the spectra were extracted from each of 4.7549 s time interval seg-ments during the bursts. This is because we are limited by the time-resolution of SXT which is ∼ 2.37 s, and to obtain a spectrum withsignificant statistics (especially from SXT data) we had to extractspectrum from at least a duration of 4.7549 s. It should be noted herethat to conduct joint spectroscopy, spectra were extracted from thesame intervals from the LAXPC data as well. Due to low counts,spectra for bins were grouped using GRPPHA to have a minimumcount rate of 10 counts per bin. Although 10 counts per bin is afairly low grouping criterion, we still went with it to have enoughgrouped energy bins to enable enough degrees of freedom for the fit.We considered a Churazov weighting for the spectral fitting to takecare of any effects of the non-Gaussianity of the data (Churazov et al.1996). We first modeled the burst spectra with a single blackbodymodel (BB) which is the generally followed procedure for model-ing burst spectra. We fitted the burst spectra taking pre-burst spectradescribed in § 3.3, as the background. The burst spectra for eachtime bin were fitted jointly for both LAXPC and SXT instrumentsin XSPEC using the model const*Tbabs*(bbodyrad), consistingof parameters :) and normalisation, # = ('/310)
2, where R isthe blackbody radius in kilometers and 310 is the source distance inunits of 10 kpc. The neutral hydrogen column density =� was fixed as0.379×1022 cm−2 (Pandel et al. 2008). TBABS model (Wilms et al.2000) was used for interstellar extinction and systematic error con-sidered for time-resolved spectroscopy was 2%. However, BB fitsshowed a substantial excess in the fit residuals, especially for the
Table 3. j2 and corresponding DOFs obtained from fitting the broadband(SXT+LAXPC) burst spectrum of a 4.7549 s segment bin of the burst detectedon 6 August 2018 (B6) using single BB, double BB, BB+power-law, and BB+avariable persistent emission models as displayed in Figure 3
Model j2 DOF
Single BB 66.88 37BB+BB 28.10 35BB+power-law 30.57 35BB+Variable persistent emission 32.17 36
bins near the peak of the bursts. So, we tested three alternative two-component phenomenological models to investigate the excess byadding a second blackbody (DBB) const*(Tbabs*(bbodyrad +
bbodyrad)), a power-law const*(Tbabs*(bbodyrad + power-
law)), and a variable persistent emission component to fit the burstspectra. In the last case, we fitted the burst spectra with an absorbedblackbody model taking instrumental background (obtained from thepipeline in case of LAXPC) as the background instead of the pre-burstspectrum (Worpel et al. 2013) i.e., the burst spectra for each time binwere fitted in XSPEC using a model const*Tbabs*(bbodyrad)+ 50*(const*(Tbabs*(bbodyrad + powerlaw))). Here the con-stant 50 is a factor quantifying the change of the persistent emissionduring the burst. The spectral fits were performed within the 4.0-20.0keV energy range for LAXPC and 0.7-4.0 keV for SXT. All of thesemodels gave better fits to the burst spectra as shown in Figure 3. Thecorresponding fit residuals and error-weighted residuals are shownin Figure 4. A significant excess in the fit residuals was observedwhen the burst spectra for the bins near the peak were fitted withthe BB model. Whereas adding a second component (a blackbody ora power law or a variable persistent component) to the model tookcare of the fit excess observed in the case of the BB model makingthe fit better (Figure 3). The j2 values & DOFs corresponding to thefits are given in Table 3. An inspection of the fit residuals confirmsthat the DBB model typically provides the least residuals most fre-quently among the two-component models, particularly for the timebins around the peak of the bursts (Figure 4). Hence, we use the DBBmodel, only as a representative of all the two-component models asall the two-component models are statistically equivalent.
To check the statistical significance of the best fitting spectralmodels corresponding to each bin during the burst, we performedan F-test taking the corresponding fit statistic (j2) values of bothBB and DBB models for each of the bins during the burst. We puta threshold of 3f significance on the chance probability obtainedthrough the F-test i.e., the second component will only be consideredin the cases where the chance probability of the improvement ofthe fit is less than 0.27%. We have also checked the satisfactionof the threshold criterion based on the chance probability of theimprovement of the fit obtained using the Protassov et al. (2002)methodology and except for a handful of bins in the boundary ofthe DBB model to the single BB model satisfaction transition, nosignificant deviation is observed from the results obtained using theF-test. Moreover, We observed that for most of the spectra duringintervals close to the burst peak where the burst intensity was high,the F-test condition was satisfied strongly requiring the existence ofthe second component. For the brighter and longer duration bursts,the spectra of a significant fraction of the time bins during the burstsrequired a second component.
Figure 5 (and Figure B1) shows the time evolution of the best fitspectral parameters during the bursts in our sample. For the timebins where the F-test condition was satisfied we show both BB and
MNRAS 000, 1–23 (2021)

Broadband AstroSat study of 4U 1636–536 bursts 5
100 101−10
0
10
20
Data-M
odel
(Sing
le BB)
100 101Energy (keV)
−10
0
10
20
Data-M
odel
(Dou
ble BB
)
100 101Energy (keV)
−10
0
10
20
Data-M
odel
(Pow
er la
w)
100 101Energy (keV)
−10
0
10
20
Data-M
odel
(Va
riable pe
rsist
ent e
miss
ion)
100 101−4
−2
0
2
(Data-Mod
el)/e
rror
(Sing
le BB)
100 101Energy (keV)
−4
−2
0
2
(Data-Mod
el)/e
rror
(Dou
ble BB
)
100 101Energy (keV)
−4
−2
0
2
(Data-Mod
el)/e
rror
(Pow
er la
w)
100 101Energy (keV)
−4
−2
0
2(D
ata-Mod
el)/e
rror
(Va
riable pe
rsist
ent e
miss
ion)
Figure 4. Residuals (left) and error-weighted residuals (right) for joint spectral fits to the 4.7549 s spectrum bin (where F-test condition is satisfied) of burst B6from 4U 1636–536 . A single blackbody shows strong residuals (1st panel); two blackbodies (2nd panel), blackbody+power law (3rd panel), and blackbody+avariable persistent flux (4th panel) all give better fits to similar extents. The shaded region shows the 1f error. The dashed line shows the zero deviation level.
DBB model fit results. The first two panels show the evolution oftemperatures during the bursts. The temperatures obtained from BBfit and the corresponding cooler temperatures obtained from DBB fitsare shown in the first panel. The corresponding hotter temperaturesof the DBB fits are shown in the second panel. The temperatures inthe BB model and the cooler temperatures in the DBB model varied1-2 keV whereas the hotter temperatures for the DBB model typicallyexhibited values above 2 keV. The third and fourth panels show howthe LAXPC (4.0-20.0 keV) and SXT (0.7-4.0 keV) flux varies duringthe bursts. The evolution of the normalisations obtained from theBB model and the DBB model (where it is present) are shown inthe fifth panel. The evolution of both the BB normalisations and thatof the cooler component of the DBB normalisations are observedto be similar. It is to be noted that though the DBB model wasvery strongly required, for bins with low flux the second blackbodyparameters could not always be constrained well resulting in largeuncertainties in the second blackbody parameters. The reduced chi-square values corresponding to the BB and DBB (where required)are shown in the sixth panel. The seventh panel shows the DOFscorresponding to the BB and DBB (where required). It can be seenfrom the time-resolved spectroscopic analysis plots that the DBBmodel gave statistically better fits (shown in red) near the burst peaksthan the BB model (shown in light blue). For the time bins nearing theend of the bursts, the BB model is sufficient to provide statisticallygood fits as exhibited by the corresponding j2 values (shown in
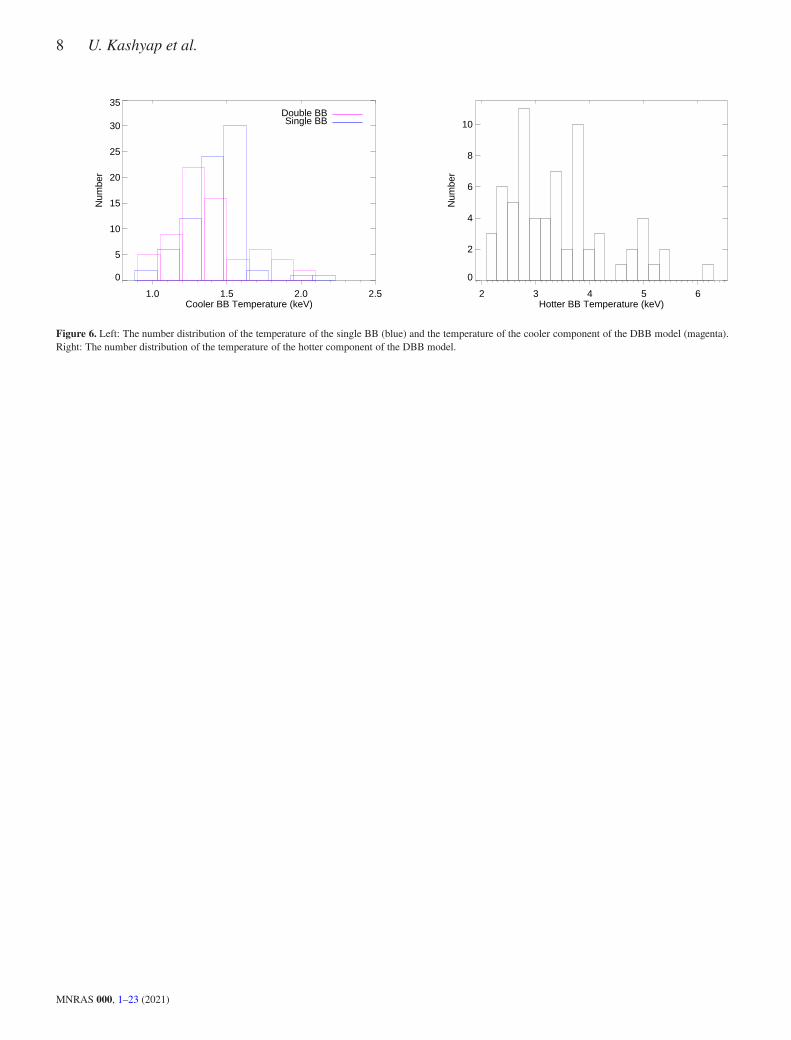
deep blue). All the bursts were observed to show a sharp rise andexponential-like decay in flux (both LAXPC and SXT) with a coolingtail except the bursts B1, B4, B5, B8, and B10, where the coolingtails were not detected. The cooler temperatures were observed tomaintain a stable trend during these bursts. Figure 6 shows the numberdistribution of the BB temperature, the cooler components of theDBB temperatures (left), and the hotter components of the DBB(right). The temperature distribution of the cooler component ofthe DBB was observed to be consistent with the BB temperaturedistribution whereas the distribution of the hotter component of theDBB was observed to be different - slightly skewed - exhibitingvalues above 2 keV.
Figure 7 shows an example of the comparative time evolutionof fluxes within 4.0-20.0 keV obtained for the burst B12 usingconst*(Tbabs*(bbodyrad + bbodyrad)) model. The total fluxis given in orange and whereas the blue curve represents the fluxcontribution of the additional component of the DBB model. As theburst decays, the absolute value of second BB intensity decreases.So, as a consequence, the observable impact of the second BB com-ponent is more pronounced near the intervals around the peak of theburst. A weaker contribution of the additional component was alsoobserved for the relatively fainter bursts suggesting a dependence ofthe contribution of the second component on the strength of the totalflux.
It is to be noted here that for ensuring significant statistics we
MNRAS 000, 1–23 (2021)
6 U. Kashyap et al.
have considered relatively larger time bins (4.7549 s) for broadbandtime-resolved spectroscopy. To check the effect of this averaging,we generated LAXPC spectra with finer time (∼ 1s) resolutionscorresponding to the joint time-resolved spectroscopy bins for thesebursts. These LAXPC spectra were fitted with tbabs*bbodyrad
model individually. The average of the burst parameters fromthese only LAXPC spectra was found to be generally consis-tent with the burst parameters obtained from joint spectroscopyat the same time. Finally, we compared the combined BB modeltbabs*(bbodyrad+bbodyrad+bbodyrad+bbodyrad+bbodyrad)
(governed by the parameters obtained from the fine LAXPC time-resolved analysis) for the corresponding joint spectra with theresiduals obtained from our joint spectral fitting. The presence ofsignificant fit residuals for the former compared to the latter showsthat our findings are not primarily due to the contribution of the timeaveraging of the spectra and is far beyond what is expected from theeffect of averaging over larger bins.
MNRAS 000, 1–23 (2021)

Broadband AstroSat study of 4U 1636–536 bursts 7
Time (s) since burst start
0.8
1.0
1.2
1.4
1.6
1.8
Tem
pera
ture
(
keV
)B1
2
4
6
8
Tem
pera
ture
(
keV
)
0
1
2
3
4
Flu
x_l
(10
-9 e
rg/s
/cm
2 )
0.00.5
1.0
1.5
2.0
2.5
Flu
x_s
(10
-9 e
rg/s
/cm
2 )
0.1
1.0
10.0
100.0
Nor
mal
isat
ion
0.0
0.5
1.0
1.5
rchi
0 10 20 30 40
20
30
40
50
DO
F
Time (s) since burst start
1.0
1.5
2.0
2.5
Tem
pera
ture
(
keV
)
B2
2345678
Tem
pera
ture
(
keV
)
0
5
10
15
Flu
x_l
(10
-9 e
rg/s
/cm
2 )
0
1
2
3
4
Flu
x_s
(10
-9 e
rg/s
/cm
2 )
0.01
0.10
1.00
10.00
100.00
Nor
mal
isat
ion
0.5
1.0
1.5
2.0
rchi
0 10 20 30 40 50 602530
35
40
45
5055
DO
F
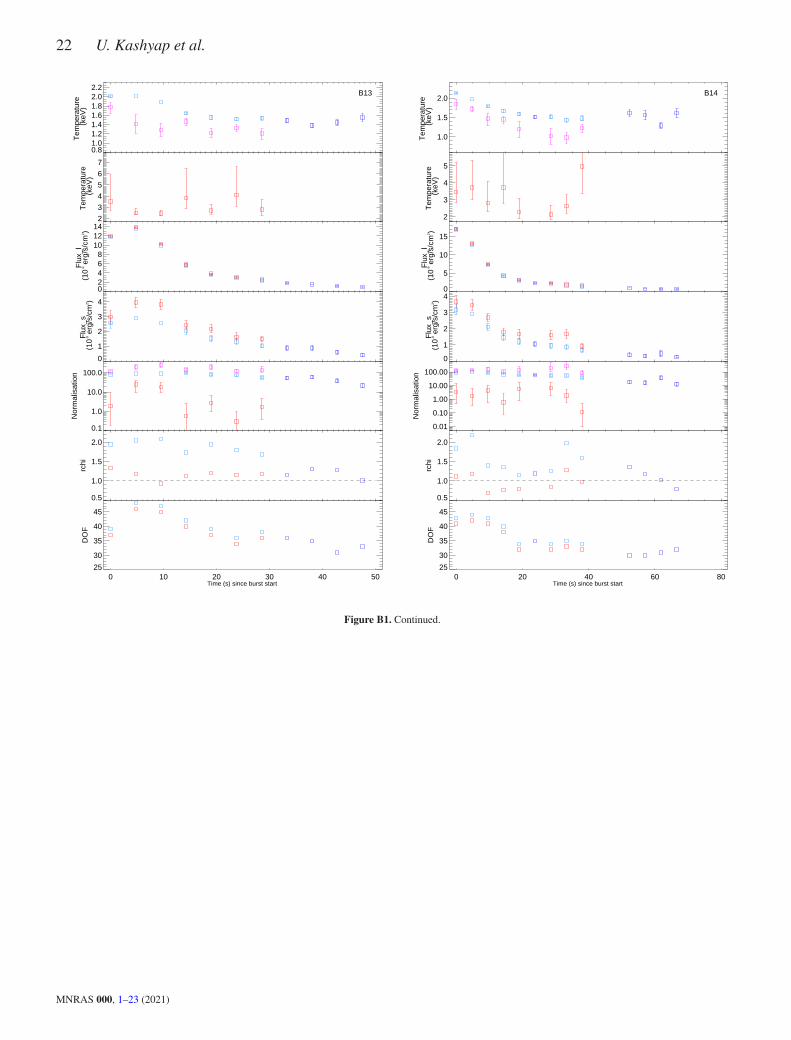
Figure 5. Best fitting parameters from time-resolved spectroscopic analysis of all the 15 bursts detected with single and double blackbody models (and figure
B1). 1st panel: temperature of the single blackbody model (blue) or the temperature of the cooler component of the double blackbody model (magenta) whereit is required, 2nd panel: temperature (red) of the hotter component where the double blackbody model is required, 3rd panel: 4.0–20.0 keV flux from LAXPCfor single blackbody (blue) and double blackbody (red), 4th panel: 0.7–4.0 keV flux from SXT for single blackbody (blue) and double blackbody (red), 5thpanel: normalisation of the single blackbody (blue) and the cooler (magenta)/hotter (red) blackbody where double blackbody was required, 6th panel: reducedj2 values corresponding to the fits for the single blackbody model (blue) and the double blackbody model (red) where required, 7th panel: DOFs correspondingto the fits for the single blackbody model (blue) and the double blackbody model (red) where required. The errors given on the parameters are 1f values.
MNRAS 000, 1–23 (2021)
8 U. Kashyap et al.
1.0 1.5 2.0 2.5Cooler BB Temperature (keV)
0
5
10
15
20
25
30
35N
umbe
r
Double BBSingle BB
2 3 4 5 6Hotter BB Temperature (keV)
0
2
4
6
8
10
Num
ber
Figure 6. Left: The number distribution of the temperature of the single BB (blue) and the temperature of the cooler component of the DBB model (magenta).Right: The number distribution of the temperature of the hotter component of the DBB model.
MNRAS 000, 1–23 (2021)

Broadband AstroSat study of 4U 1636–536 bursts 9
0 10 20 30 40 50 60 70Time since the burst starts
0
2
4
6
8
10
12
Flux
(10
−9 erg/s/cm
2 )
Totalsecond component
Figure 7. The time evolution of the burst flux (4.0-20.0 keV) obtained fromtime-resolved spectroscopy of the burst B12. The orange points show thetotal burst flux and 1f errors are smaller than the graph point sizes. Theblue points represent the contribution from the second blackbody in the DBBmodel, 1f errors are are smaller than the graph point sizes for the bins whereF-test condition was satisfied and upper limits are shown for the rest.
4 DISCUSSION
In this paper, we report the detection of 15 thermonuclear burstscovered simultaneously with LAXPC and SXT onboard AstroSat.We analyzed the broadband data of all the 15 Type I X-ray bursts.We report and discuss the results obtained from time-resolved spec-troscopy of the bursts and investigate the physical interpretations ofthe excess observed near the peak of the bursts. We also studied thedependence of the hotter BB temperature and its requirement fora good spectral fit on the varying state of the source as observedfrom HID (Figure 1). But no such state dependence was observed al-though the HID showed a modest spectral evolution within the islandstate of the atoll track (Altamirano et al. 2008). Also, the proper-ties of the bursts including duration, morphology, burst peak flux aswell as burst fluence were observed to exhibit no systematic trendand displayed significant variation even within the same observa-tion. Moreover, we studied the energy-dependent burst light curvesof all the 15 bursts reported and no hard X-ray dips implying coronalchanges could be detected in our burst sample as the data presentedhere does not have sufficient sensitivity to detect hard X-ray dips ofthe magnitude reported by Ji et al. (2014).
From the broadband time-resolved spectroscopy of all the simul-taneously detected Type I bursts in our sample, it was observed thatthe time intervals near the burst peaks were well described by two-component models as compared to the BB models usually used fordescribing burst spectra. We have demonstrated that with broadbandcoverage the deviation from the widely used Planckian spectrum ofthe burst (Buisson et al. 2020; Keek et al. 2018a,b; Bult et al. 2019)can be clearly ascertained and the burst-accretion interaction can betraced out. From our time-resolved spectroscopic results using thebest fit models, the characteristic thermal cooling tail during burstdecay was observed for all the bursts except B1, B4, B5, B8, andB10. For these 5 bursts, the cooler BB temperatures were observedto maintain a stable temperature value throughout the bursts. Thesubset of bursts with the absence of a clear cooling trend systemat-ically corresponded to a relatively shorter duration. The absence of
Peak flux (10-9 erg/s/cm2)
0
5
10
15
20
25
β
B2
B3
B6
B7
B9
B11
B12B13
B14B15
B1
B4
B5B8 B10
0 5 10 15 20 250
5
10
15
S/N
(
10−
5 )
Figure 8. Evolution of ratio V (top) and (/# (bottom) with the burst peakflux in 4.0-20.0 keV. ’△’ stands for the "non-cooling" bursts.
cooling during X-rays does not necessarily dispute their thermonu-clear origin, as such "non-cooling" (where thermal cooling is notdetected) bursts have previously been detected from several burstingsources (Linares et al. 2011; Guver et al. 2021).
To further investigate the absence of cooling in these bursts,we followed the same approach as Linares et al. (2011) to exam-ine the origin of "non-cooling" bursts. We obtained the peak-to-persistent flux ratio V (=�?40:/�?4AB ) as well as signal-to-noise
ratio ((/# = �?40:/√
�?40: + �?4AB) for all the bursts in our sam-ple. These are figure-of-merit parameters for quantifying the strengthof the burst emission over persistent emission for each burst. Thevalues of both V as well as (/# were observed to be systematicallylower for these "non-cooling" bursts in our sample (Figure 8). Also,although a sharp transition is observed from a cooling behavior toa non-cooling behavior as a function of peak flux between B3 andB10, the observed difference between the bursts B3 and B10, basedon burst fluence and duration is not very significant (Table 2). As theburst intensity decreases near the tail of the bursts for these low (/#
bursts, the variation of temperature and normalisation becomes lessconstrained and more susceptible to initial values due to a decrease insensitivity to spectral cooling. In general, the bursts observed at dif-ferent accretion rates during an outburst are observed to become lessenergetic with the increase in the persistent flux of the bursts due tounstable burning conditions being more quickly reached at a high ac-cretion rate (Chakraborty et al. 2011; Linares et al. 2011). The higheraccretion rate may lead to a hotter neutron star photosphere which inturn may smear out the burst cooling tails (Linares et al. 2011). Butthe accretion rate does not change much for our burst sample, and wesee from Figure 8 that the lower peak flux bursts show lower V and(/# . Hence the "non-cooling" tails observed is due to the decreasein sensitivity to spectral cooling.
We investigate the interpretations of the excess observed in theresiduals of the spectra near the peak of the bursts for the singleblackbody fits. We tried to fit the spectra with three two-component
MNRAS 000, 1–23 (2021)

10 U. Kashyap et al.
phenomenological models involving thermal, non-thermal, and vari-able persistent emission (Figure 3). Similar kinds of excess werefound in such LMXB sources with multiple other instruments such asNICER (Buisson et al. 2020; Keek et al. 2018a,b; Bult et al. 2019),especially those having soft X-ray coverage. The interpretations ofthis excess observed from 4U 1636-536 has also been reported anddiscussed (Worpel et al. 2013; Keek et al. 2014b,a; Koljonen et al.2016). Near the peak, where the burst flux was higher, all thetwo-component models performed significantly better suggestinga stronger deviation from the canonical Planckian burst spectrummodel at these fluxes. The reason behind the excess may possiblybe the burst emission incident on the disk and re-emitted by thedisk resulting in an extra black body (Keek et al. 2018a; Ballantyne2004; Ballantyne & Strohmayer 2004; Keek et al. 2014b). The de-tection of features such as emission lines and absorption edge duringthe time-resolved spectral analysis of the RXTE PCA spectrum ofthe 2001 superburst from 4U 1636–536 suggests reflection of thesuperburst radiation off the accretion disk (Keek et al. 2014b). Ourdata for the X-ray bursts were not sensitive enough to differentiateamong the possible interpretations of the two-component models aswell as for possible detection of such features using such complexmodels. However, photons may also be scattered in the neutron staratmosphere. The hot neutron star atmosphere may scatter the burstphotons coming from the hot-spot and increase the observed temper-ature and spectrum (Romani 1987; London et al. 1986; Madej et al.2004; Suleimanov et al. 2011, 2012). This is usually combined in thecolor factor use to infer the intrinsic temperature and radius fromthe effective observed temperature and radius. Furthermore, the ex-cess may be produced by reprocessing the photons in an opticallythin medium such as corona (Keek et al. 2018a). The soft excesscan also be explained by an enhanced persistent component i.e., anincreased persistent emission signifying an enhanced accretion ratebecause of the radiation torques on the accretion disk around thestar by the burst photons (Poynting–Robertson drag) (Worpel et al.2013, 2015). In our work we compared different simple models forthe excess however, given the quality of the data, no model could bestatistically favoured over the others.
During the strong PRE (Photospheric radius Expansion X-rayburst) burst detected from 4U 1820-30 near its Eddington limit, astrong distinctly higher rise in the 50 value was observed (Keek et al.2018b). Physically, this corresponded to an additional Comptoniza-tion component during the PRE phase followed by re-brightening ofthe thermal component with a drop in the Comptonization flux. Dur-ing the PRE burst, the NS photosphere expands to a significant radiusensuring a much stronger likelihood of interaction of burst radiationwith the surrounding environment and thus may help to distinguishthe fraction of the spectral excess contributed by the thermal and thenon-thermal components and understanding their origin. However,the evolution of the burst temperature and normalisation as observedfrom the time-resolved spectroscopy suggests that none of the burstsin our sample is a PRE burst. In addition to that, the maximum peakburst flux found in our sample was 2.09 ×10⁻⁸ 4A6/B/2<2 (4.0–20.0keV) whereas the reported average PRE burst peak flux for 4U 1636–536 is 5.37 ×10⁻⁸ 4A6/B/2<2 1 (4.0–20.0 keV) (Galloway et al.2006). This flux comparison furthermore supports the non-PRE na-ture of the bursts in our sample.
At this current juncture with the current data sensitivity, it is dif-ficult to favor any of these models over the others and consequentlyany of the physical scenarios over the others. However, for the burst
1 PIMMS predicted flux of 6.4 ×10⁻⁸ 4A6/B/2<2 RXTE flux (2.5-20 keV)
0.01 0.10 1.00 10.00 100.00Flux in bins
(10-9 erg/s/cm2)
0
10
20
30
40
50
Num
ber
of b
ins
AllBins requiring 2nd component
Figure 9. Distribution of observed flux in 4.0-20.0 keV in time bins. Theblack line shows the distribution of the total flux whereas the red dashedline shows the distribution of flux in time bins where the DBB model wasstatistically required.
spectra, the double blackbody model performed the best though thiscan not be statistically substantiated over the other two-componentmodels. We have also studied how the requirement of the second BBcomponent for a good spectral fit depends on the total observed fluxduring the bursts, burst duration, and burst peak flux. Figure 9 showsthe comparison of the distribution of observed total flux in all bursttime bins along with the flux distribution (in red) in time bins wherethe requirement of the DBB component was statistically significant.It can be clearly observed that at low fluxes the single BB compo-nents suffices whereas as the flux increases the DBB is required inmost of the burst time bins. To further quantify the significance ofthe dissimilarity of these two distributions we have carried out a Kol-mogorov–Smirnov (KS) test. The KS test shows that the probabilitythat two sets of flux (total flux and flux of the second BB component)distributions belong to the same parent distribution is 9.61 × 10⁻⁸.
Furthermore, the fraction of burst time bins with excess observedin the fit residuals were more for long-duration bursts as well as forthe bursts with higher peak flux as shown by the left and right plots,respectively, of Figure 10. But, the burst B7 represents an outlier inthe correlation between the peak flux and fraction of bins requiringthe DBB model. This can be explained by the relatively faster burst in-tensity decay observed in the case of this particular burst (Figure B1),which occurred when the source was in a relatively harder state (Fig-ure 1). A similar kind of fast decay in burst flux was observed from4U 1636–536 earlier in its H-rich bursts in hard state revealing theimpact of accretion on the bursting properties (Kuuttila et al. 2017).A correlation test performed between the fraction of the total numberbins requiring a second BB component for a good fit and the burstduration as well as burst peak flux show a Spearman’s rank corre-lation coefficient value of 0.54 and 0.73 respectively, correspondingto more than 2f and 3f significance. It indicates that the absolutecontribution of the second BB component becomes higher for thebrighter and the long-duration bursts, especially near the peaks. Itimplies a stronger burst accretion interaction, which may also bearising from the increasing S/N ratio near the peaks of the bursts.
Additionally, we examined the dependence of the contribution ofthe second additional blackbody on the total flux at that time duringthe burst. Figure 11 shows that the flux of the second black bodyis correlated with the total flux of the bursts. We found a corre-lation between both the fluxes with a Spearman’s rank correlation
MNRAS 000, 1–23 (2021)

Broadband AstroSat study of 4U 1636–536 bursts 11
20 30 40 50 60 70 80Duration (s)
0.0
0.2
0.4
0.6
0.8
1.0F
ract
ion
of b
ins
requ
iring
sec
ond
com
pone
nt
0 5 10 15 20 25Peak flux
(10-9 erg/s/cm2)
0.0
0.2
0.4
0.6
0.8
1.0
Fra
ctio
n of
bin
s re
quiri
ng s
econ
d co
mpo
nent
Figure 10. Variation of the fraction of time bins requiring the second BB (from the DBB model) with burst duration (left) and burst peak flux in 4.0-20.0 keVrange (right).
0.1 1.0 10.0Total Flux
(10-9 erg/s/cm2)
0.01
0.10
1.00
10.00
Sec
ond
BB
flux
(
10-9 e
rg/s
/cm
2 )
Figure 11. Variation of the flux in 4.0-20.0 keV range contributed by theadditional component of DBB model with the total flux in 4.0-20.0 keV fromthe DBB model for all time bins during the bursts in the sample.
coefficient of 0.80 corresponding to a 11f significance. Moreover, aPearson correlation coefficient computed between the two fluxes wasfound to be 0.83. This dependence is observed to show a transitionat ∼ 8 × 10⁻⁹ 4A6/B/2<2. Above this transition, the fractional con-tribution of the second blackbody appears to grow as the total fluxincreases. Whereas, below this transition, the second BB is observedto contribute about 1/6th of the total flux Figure 11. This suggeststhat the presence and strength of the additional component, possiblysuggesting a burst-surrounding interaction, is strongly guided by theburst flux. This is consistent with the above theoretical scenarios ineach of which a stronger burst flux implies a stronger interaction.However, we did not observe any strong dependence of the hotterblackbody temperature on the total burst flux though it should benoted that given the data the second BB parameters have relativelylarger uncertainties. Furthermore, the original sites of the secondblackbody component may be quite complex, and a simplistic singleblackbody may not be able to completely capture the nuances of theundergoing physical process.
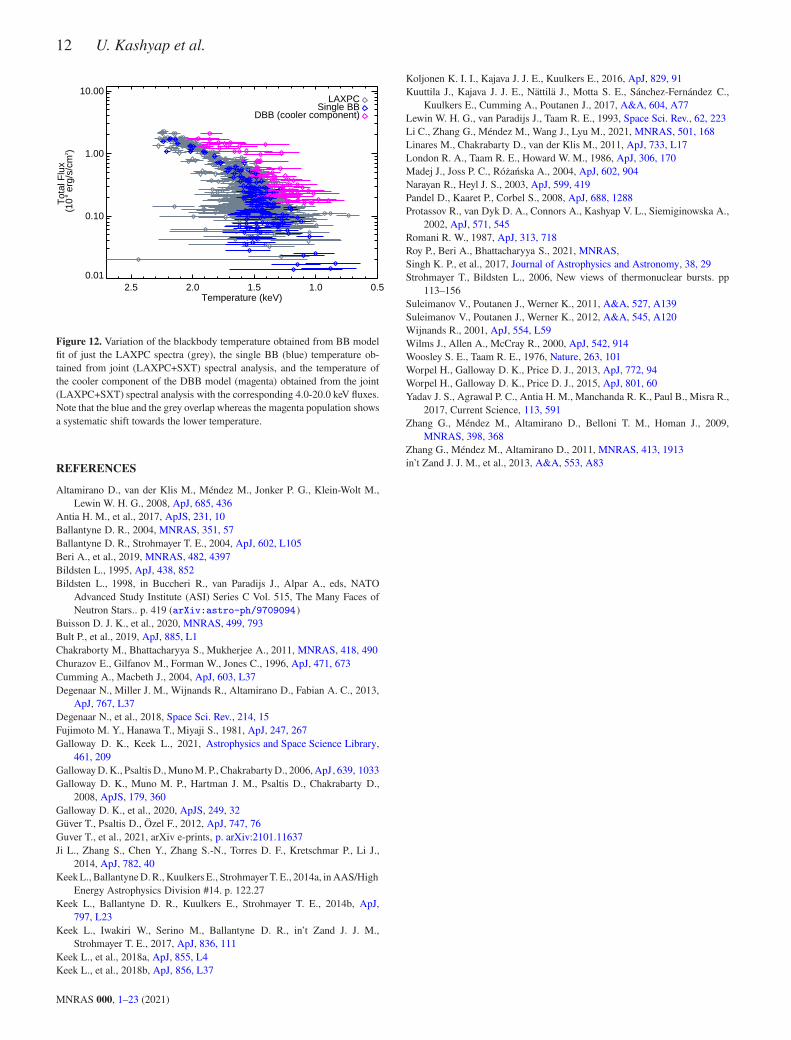
Figure 12 shows the variation of the burst blackbody temperaturewith the corresponding burst flux. Here the burst temperatures fromthe single blackbody and double blackbody fits are shown in blue and
magenta respectively. We have also carried out time-resolved spec-troscopy from just LAXPC data alone with finer (1 s) time bins forthese bursts, and the corresponding temperatures are shown in grey.As expected the higher-energy sensitive LAXPC fits correspondedmore closely with the less effective single blackbody model temper-atures, whereas with joint spectroscopy, especially at higher fluxes,DBB model was the favored and the consequent burst temperaturesexhibited a systematic shift towards lower values compared to theprevious two temperature populations. With NICER, which has softenergy sensitive spectral capability, a similar but opposite, relativelyhigher trend has sometimes been observed for the burst tempera-ture, with burst temperatures obtained from the time-resolved spec-troscopy using 50 method showing a systematic shift towards highervalues (Guver et al., in preparation). Thus our study reveals the needfor broadband spectroscopic analysis of bursts. Further such stud-ies with more sensitive broadband spectral coverage and detailedtime-dependent burst emission models will be able to shed light onburst-accretion environment interaction.
5 CONCLUSIONS
We have presented the first broadband time-resolved spectroscopystudy of 15 Type I X-ray bursts detected using LAXPC and SXT on-board AstroSat. In our broadband analysis of Type I bursts, an excessnear the peaks of the bursts was observed in almost all the burstsdetected simultaneously even in the relatively fainter bursts. Thiskind of broadband joint analysis of thermonuclear bursts provides abetter platform for studying excess and deviation from the Planckianspectrum, which is not often identifiable statistically. It also manifeststhe requirements of more such broadband observations with bettersensitivity.
DATA AVAILABILITY
This paper includes data collected by the AstroSat mission,which is publicly available from the ISRO Science Data Archivefor AstroSat Mission and the data is made available to theusers by the Indian Space Science Data Centre (ISSDC), ISRO.[https://astrobrowse.issdc.gov.in/astro_archive/archive/Home.jsp]
MNRAS 000, 1–23 (2021)
12 U. Kashyap et al.
2.5 2.0 1.5 1.0 0.5Temperature (keV)
0.01
0.10
1.00
10.00
Tot
al F
lux
(10
-8 e
rg/s
/cm
2 )
LAXPCSingle BB
DBB (cooler component)
Figure 12. Variation of the blackbody temperature obtained from BB modelfit of just the LAXPC spectra (grey), the single BB (blue) temperature ob-tained from joint (LAXPC+SXT) spectral analysis, and the temperature ofthe cooler component of the DBB model (magenta) obtained from the joint(LAXPC+SXT) spectral analysis with the corresponding 4.0-20.0 keV fluxes.Note that the blue and the grey overlap whereas the magenta population showsa systematic shift towards the lower temperature.
REFERENCES
Altamirano D., van der Klis M., Méndez M., Jonker P. G., Klein-Wolt M.,Lewin W. H. G., 2008, ApJ, 685, 436
Antia H. M., et al., 2017, ApJS, 231, 10Ballantyne D. R., 2004, MNRAS, 351, 57Ballantyne D. R., Strohmayer T. E., 2004, ApJ, 602, L105Beri A., et al., 2019, MNRAS, 482, 4397Bildsten L., 1995, ApJ, 438, 852Bildsten L., 1998, in Buccheri R., van Paradijs J., Alpar A., eds, NATO
Advanced Study Institute (ASI) Series C Vol. 515, The Many Faces ofNeutron Stars.. p. 419 (arXiv:astro-ph/9709094)
Buisson D. J. K., et al., 2020, MNRAS, 499, 793Bult P., et al., 2019, ApJ, 885, L1Chakraborty M., Bhattacharyya S., Mukherjee A., 2011, MNRAS, 418, 490Churazov E., Gilfanov M., Forman W., Jones C., 1996, ApJ, 471, 673Cumming A., Macbeth J., 2004, ApJ, 603, L37Degenaar N., Miller J. M., Wijnands R., Altamirano D., Fabian A. C., 2013,
ApJ, 767, L37Degenaar N., et al., 2018, Space Sci. Rev., 214, 15Fujimoto M. Y., Hanawa T., Miyaji S., 1981, ApJ, 247, 267Galloway D. K., Keek L., 2021, Astrophysics and Space Science Library,
461, 209Galloway D. K., Psaltis D., Muno M. P., Chakrabarty D., 2006, ApJ, 639, 1033Galloway D. K., Muno M. P., Hartman J. M., Psaltis D., Chakrabarty D.,
2008, ApJS, 179, 360Galloway D. K., et al., 2020, ApJS, 249, 32Güver T., Psaltis D., Özel F., 2012, ApJ, 747, 76Guver T., et al., 2021, arXiv e-prints, p. arXiv:2101.11637Ji L., Zhang S., Chen Y., Zhang S.-N., Torres D. F., Kretschmar P., Li J.,
2014, ApJ, 782, 40Keek L., Ballantyne D. R., Kuulkers E., Strohmayer T. E., 2014a, in AAS/High
Energy Astrophysics Division #14. p. 122.27Keek L., Ballantyne D. R., Kuulkers E., Strohmayer T. E., 2014b, ApJ,
797, L23Keek L., Iwakiri W., Serino M., Ballantyne D. R., in’t Zand J. J. M.,
Strohmayer T. E., 2017, ApJ, 836, 111Keek L., et al., 2018a, ApJ, 855, L4Keek L., et al., 2018b, ApJ, 856, L37
Koljonen K. I. I., Kajava J. J. E., Kuulkers E., 2016, ApJ, 829, 91Kuuttila J., Kajava J. J. E., Nättilä J., Motta S. E., Sánchez-Fernández C.,
Kuulkers E., Cumming A., Poutanen J., 2017, A&A, 604, A77Lewin W. H. G., van Paradijs J., Taam R. E., 1993, Space Sci. Rev., 62, 223Li C., Zhang G., Méndez M., Wang J., Lyu M., 2021, MNRAS, 501, 168Linares M., Chakrabarty D., van der Klis M., 2011, ApJ, 733, L17London R. A., Taam R. E., Howard W. M., 1986, ApJ, 306, 170Madej J., Joss P. C., Różańska A., 2004, ApJ, 602, 904Narayan R., Heyl J. S., 2003, ApJ, 599, 419Pandel D., Kaaret P., Corbel S., 2008, ApJ, 688, 1288Protassov R., van Dyk D. A., Connors A., Kashyap V. L., Siemiginowska A.,
2002, ApJ, 571, 545Romani R. W., 1987, ApJ, 313, 718Roy P., Beri A., Bhattacharyya S., 2021, MNRAS,Singh K. P., et al., 2017, Journal of Astrophysics and Astronomy, 38, 29Strohmayer T., Bildsten L., 2006, New views of thermonuclear bursts. pp
113–156Suleimanov V., Poutanen J., Werner K., 2011, A&A, 527, A139Suleimanov V., Poutanen J., Werner K., 2012, A&A, 545, A120Wijnands R., 2001, ApJ, 554, L59Wilms J., Allen A., McCray R., 2000, ApJ, 542, 914Woosley S. E., Taam R. E., 1976, Nature, 263, 101Worpel H., Galloway D. K., Price D. J., 2013, ApJ, 772, 94Worpel H., Galloway D. K., Price D. J., 2015, ApJ, 801, 60Yadav J. S., Agrawal P. C., Antia H. M., Manchanda R. K., Paul B., Misra R.,
2017, Current Science, 113, 591Zhang G., Méndez M., Altamirano D., Belloni T. M., Homan J., 2009,
MNRAS, 398, 368Zhang G., Méndez M., Altamirano D., 2011, MNRAS, 413, 1913in’t Zand J. J. M., et al., 2013, A&A, 553, A83
MNRAS 000, 1–23 (2021)

Broadband AstroSat study of 4U 1636–536 bursts 13
Time (s) since burst start
0
10
20
30
40
Cou
nt R
ate
(ct
s/s)
SXT
-60 -40 -20 0 20 40 60200
400
600
800
1000
Cou
nt R
ate
(ct
s/s)
LAXPC
Time (s) since burst start
0
20
40
60
80
Cou
nt R
ate
(ct
s/s)
SXT
-60 -40 -20 0 20 40 60
500
1000
1500
2000
2500
Cou
nt R
ate
(ct
s/s)
LAXPC
Time (s) since burst start
0
20
40
60
Cou
nt R
ate
(ct
s/s)
SXT
-60 -40 -20 0 20 40 60
500
1000
1500
Cou
nt R
ate
(ct
s/s)
LAXPC
Time (s) since burst start
0
10
20
30
40
50
Cou
nt R
ate
(ct
s/s)
SXT
-60 -40 -20 0 20 40200
400
600
800
Cou
nt R
ate
(ct
s/s)
LAXPC
Figure A1. Top left: B1, Top right: B2, Bottom left: B3, Bottom right: B4
APPENDIX A: LIGHT CURVES OF THERMONUCLEAR X-RAY BURSTS DETECTED SIMULTANEOUSLY BY LAXPC AND
SXT ONBOARD ASTROSAT
MNRAS 000, 1–23 (2021)

14 U. Kashyap et al.
Time (s) since burst start
0
10
20
30
40
Cou
nt R
ate
(ct
s/s)
SXT
-60 -40 -20 0 20 40200
400
600
800
1000
Cou
nt R
ate
(ct
s/s)
LAXPC
Time (s) since burst start
0
20
40
60
Cou
nt R
ate
(ct
s/s)
SXT
-60 -40 -20 0 20 40 60 80
500
1000
1500
2000
2500
Cou
nt R
ate
(ct
s/s)
LAXPC
Time (s) since burst start
0
20
40
60
80
Cou
nt R
ate
(ct
s/s)
SXT
-60 -40 -20 0 20 40 60 80
500
1000
1500
2000
2500
3000
Cou
nt R
ate
(ct
s/s)
LAXPC
Time (s) since burst start
0
10
20
30
40
50
Cou
nt R
ate
(ct
s/s)
SXT
-60 -40 -20 0 20 40200
400
600
800
1000
1200
1400
Cou
nt R
ate
(ct
s/s)
LAXPC
Figure A1. Top left: B5, Top right: B6, Bottom left: B7, Bottom right: B8
MNRAS 000, 1–23 (2021)

Broadband AstroSat study of 4U 1636–536 bursts 15
Time (s) since burst start
0
20
40
60
Cou
nt R
ate
(ct
s/s)
SXT
-60 -40 -20 0 20 40 60
500
1000
1500
2000
2500
Cou
nt R
ate
(ct
s/s)
LAXPC
Time (s) since burst start
0
10
20
30
40
50
60
Cou
nt R
ate
(ct
s/s)
SXT
-60 -40 -20 0 20 40200
400
600
800
1000
1200
1400
Cou
nt R
ate
(ct
s/s)
LAXPC
Time (s) since burst start
0
20
40
60
Cou
nt R
ate
(ct
s/s)
SXT
-60 -40 -20 0 20 40 60 80
500
1000
1500
2000
Cou
nt R
ate
(ct
s/s)
LAXPC
Figure A1. Top left: B9, Top right: B10, Bottom: B11
MNRAS 000, 1–23 (2021)
16 U. Kashyap et al.
Time (s) since burst start
0
20
40
60
Cou
nt R
ate
(ct
s/s)
SXT
-60 -40 -20 0 20 40 60 80
500
1000
1500
2000
2500
Cou
nt R
ate
(ct
s/s)
LAXPC
Time (s) since burst start
0
20
40
60
80
Cou
nt R
ate
(ct
s/s)
SXT
-60 -40 -20 0 20 40 60 80
500
1000
1500
2000
2500
Cou
nt R
ate
(ct
s/s)
LAXPC
Time (s) since burst start
0
20
40
60
Cou
nt R
ate
(ct
s/s)
SXT
-60 -40 -20 0 20 40 60 80
500
1000
1500
2000
2500
Cou
nt R
ate
(ct
s/s)
LAXPC
Time (s) since burst start
0
20
40
60
Cou
nt R
ate
(ct
s/s)
SXT
-60 -40 -20 0 20 40 60
500
1000
1500
2000
2500
Cou
nt R
ate
(ct
s/s)
LAXPC
Figure A1. Top left: B12, Top right: B13, Bottom left: B14, Bottom right: B15
MNRAS 000, 1–23 (2021)

Broadband AstroSat study of 4U 1636–536 bursts 17
Time (s) since burst start
0.60.8
1.0
1.2
1.4
1.6
Tem
pera
ture
(
keV
)B3
2
4
6
8
Tem
pera
ture
(
keV
)
0
2
4
6
8
Flu
x_l
(10
-9 e
rg/s
/cm
2 )
0
1
2
3
4
Flu
x_s
(10
-9 e
rg/s
/cm
2 )
0.0010.010
0.100
1.000
10.000
100.000
Nor
mal
isat
ion
0.60.81.01.21.41.61.8
rchi
0 10 20 30 40 5025303540455055
DO
F
Time (s) since burst start
0.60.81.01.21.41.61.8
Tem
pera
ture
(
keV
)
B4
2.22.42.62.83.03.23.4
Tem
pera
ture
(
keV
)
0.00.5
1.0
1.5
2.0
2.5
Flu
x_l
(10
-9 e
rg/s
/cm
2 )
0.00.20.40.60.81.01.2
Flu
x_s
(10
-9 e
rg/s
/cm
2 )
0.1
1.0
10.0
100.0
Nor
mal
isat
ion
0.6
0.8
1.0
1.2
1.4rc
hi
0 5 10 15 2025
30
35
40
DO
F
Figure B1. Continued.
APPENDIX B: BEST FITTING PARAMETERS FROM TIME-RESOLVED SPECTROSCOPIC ANALYSIS OF ALL THE 15
BURSTS DETECTED WITH SINGLE AND DOUBLE BLACKBODY MODELS.
MNRAS 000, 1–23 (2021)

18 U. Kashyap et al.
Time (s) since burst start
1.0
1.2
1.4
1.6
1.82.0
Tem
pera
ture
(
keV
)B5
2
4
6
8
10
Tem
pera
ture
(
keV
)
01
2
3
4
5
Flu
x_l
(10
-9 e
rg/s
/cm
2 )
0.00.5
1.0
1.5
2.0
2.5
Flu
x_s
(10
-9 e
rg/s
/cm
2 )
0.01
0.10
1.00
10.00
100.00
Nor
mal
isat
ion
0.5
1.0
1.5
2.0
rchi
0 5 10 15 2015202530354045
DO
F
Time (s) since burst start
1.0
1.5
2.0
Tem
pera
ture
(
keV
)
B6
2
4
6
8
Tem
pera
ture
(
keV
)
0
5
10
15
Flu
x_l
(10
-9 e
rg/s
/cm
2 )
0
1
2
3
4
Flu
x_s
(10
-9 e
rg/s
/cm
2 )
0.0010.010
0.100
1.000
10.000
100.000
Nor
mal
isat
ion
0.5
1.0
1.5
2.0
rchi
0 20 40 60 802530
35
40
45
50
DO
F
Figure B1. Continued.
MNRAS 000, 1–23 (2021)

Broadband AstroSat study of 4U 1636–536 bursts 19
Time (s) since burst start
1.0
1.5
2.0
2.5
Tem
pera
ture
(
keV
)B7
0
2
4
6
8
Tem
pera
ture
(
keV
)
05
10
15
20
25
Flu
x_l
(10
-9 e
rg/s
/cm
2 )
01
2
3
4
5
Flu
x_s
(10
-9 e
rg/s
/cm
2 )
0.0010.010
0.100
1.000
10.000
100.000
Nor
mal
isat
ion
0.5
1.0
1.5
2.0
rchi
0 20 40 60 8025303540455055
DO
F
Time (s) since burst start
0.81.0
1.2
1.4
1.6
1.82.0
Tem
pera
ture
(
keV
)
B8
1.01.52.02.53.03.54.0
Tem
pera
ture
(
keV
)
0123456
Flu
x_l
(10
-9 e
rg/s
/cm
2 )
0
1
2
3
Flu
x_s
(10
-9 e
rg/s
/cm
2 )
0.1
1.0
10.0
100.0
Nor
mal
isat
ion
0.5
1.0
1.5
2.0
rchi
0 10 20 3025
30
35
40
DO
F
Figure B1. Continued.
MNRAS 000, 1–23 (2021)

20 U. Kashyap et al.
Time (s) since burst start
1.01.21.41.61.82.02.2
Tem
pera
ture
(
keV
)B9
2
3
4
5
6
Tem
pera
ture
(
keV
)
02468
101214
Flu
x_l
(10
-9 e
rg/s
/cm
2 )
0
1
2
3
Flu
x_s
(10
-9 e
rg/s
/cm
2 )
0.1
1.0
10.0
100.0
Nor
mal
isat
ion
0.5
1.0
1.5
2.0
rchi
0 10 20 30 40 5025
30
35
40
45
DO
F
Time (s) since burst start
0.81.0
1.2
1.4
1.6
1.82.0
Tem
pera
ture
(
keV
)
B10
23
4
5
6
7
Tem
pera
ture
(
keV
)
0123456
Flu
x_l
(10
-9 e
rg/s
/cm
2 )
0.00.51.01.52.02.53.0
Flu
x_s
(10
-9 e
rg/s
/cm
2 )
0.1
1.0
10.0
100.0
Nor
mal
isat
ion
0.40.60.81.01.21.41.6
rchi
0 10 20 3025
30
35
40
45
DO
F
Figure B1. Continued.
MNRAS 000, 1–23 (2021)

Broadband AstroSat study of 4U 1636–536 bursts 21
Time (s) since burst start
1.0
1.2
1.4
1.6
1.8
2.0
Tem
pera
ture
(
keV
)B11
2
3
4
5
Tem
pera
ture
(
keV
)
02468
101214
Flu
x_l
(10
-9 e
rg/s
/cm
2 )
0
1
2
3
Flu
x_s
(10
-9 e
rg/s
/cm
2 )
0.01
0.10
1.00
10.00
100.00
Nor
mal
isat
ion
0.5
1.0
1.5
2.0
rchi
0 20 40 60 8025
30
35
40
45
DO
F
Time (s) since burst start
1.0
1.5
2.0
Tem
pera
ture
(
keV
)
B12
2
4
6
8
10
Tem
pera
ture
(
keV
)
0
5
10
15
Flu
x_l
(10
-9 e
rg/s
/cm
2 )
0
1
2
3
Flu
x_s
(10
-9 e
rg/s
/cm
2 )
0.0010.010
0.100
1.000
10.000
100.000
Nor
mal
isat
ion
0.5
1.0
1.5
2.0
rchi
0 20 40 60 8025
30
35
40
45
DO
F
Figure B1. Continued.
MNRAS 000, 1–23 (2021)
22 U. Kashyap et al.
Time (s) since burst start
0.81.01.21.41.61.82.02.2
Tem
pera
ture
(
keV
)B13
2
3
4
5
6
7
Tem
pera
ture
(
keV
)
02468
101214
Flu
x_l
(10
-9 e
rg/s
/cm
2 )
0
1
2
3
4
Flu
x_s
(10
-9 e
rg/s
/cm
2 )
0.1
1.0
10.0
100.0
Nor
mal
isat
ion
0.5
1.0
1.5
2.0
rchi
0 10 20 30 40 5025
30
35
40
45
DO
F
Time (s) since burst start
1.0
1.5
2.0
Tem
pera
ture
(
keV
)
B14
2
3
4
5
Tem
pera
ture
(
keV
)
0
5
10
15
Flu
x_l
(10
-9 e
rg/s
/cm
2 )
0
1
2
3
4
Flu
x_s
(10
-9 e
rg/s
/cm
2 )
0.01
0.10
1.00
10.00
100.00
Nor
mal
isat
ion
0.5
1.0
1.5
2.0
rchi
0 20 40 60 8025
30
35
40
45
DO
F
Figure B1. Continued.
MNRAS 000, 1–23 (2021)

Broadband AstroSat study of 4U 1636–536 bursts 23
Time (s) since burst start
1.0
1.5
2.0
Tem
pera
ture
(
keV
)B15
2
4
6
8
10
12
Tem
pera
ture
(
keV
)
0
5
10
15
Flu
x_l
(10
-9 e
rg/s
/cm
2 )
0
1
2
3
4
Flu
x_s
(10
-9 e
rg/s
/cm
2 )
0.01
0.10
1.00
10.00
100.00
Nor
mal
isat
ion
0.5
1.0
1.5
2.0
rchi
0 10 20 30 40 50 6025
30
35
40
45
DO
F
Figure B1. Continued.
This paper has been typeset from a TEX/LATEX file prepared by the author.
MNRAS 000, 1–23 (2021)