Effect of warm bladder irrigation fluid for benign prostatic ...
Upload
independentCategory
view
0download
0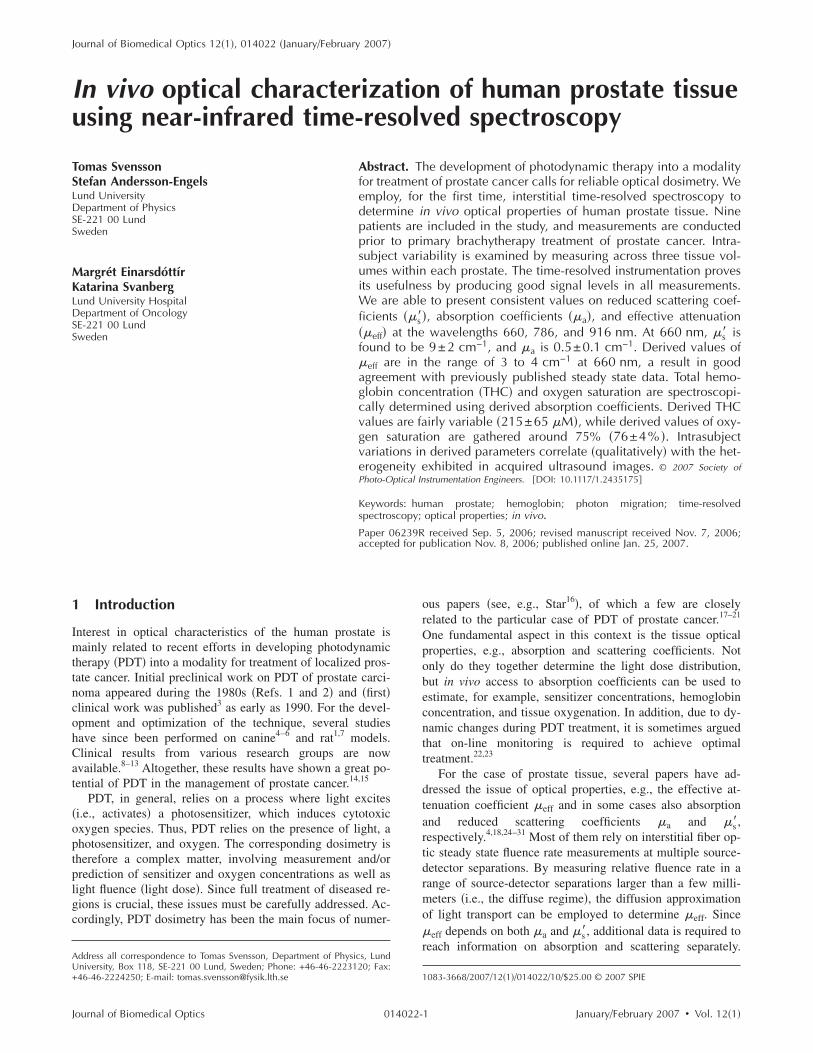
Journal of Biomedical Optics 12�1�, 014022 �January/February 2007�
In vivo optical characterization of human prostate tissueusing near-infrared time-resolved spectroscopy
Tomas SvenssonStefan Andersson-EngelsLund UniversityDepartment of PhysicsSE-221 00 LundSweden
Margrét EinarsdóttírKatarina SvanbergLund University HospitalDepartment of OncologySE-221 00 LundSweden
Abstract. The development of photodynamic therapy into a modalityfor treatment of prostate cancer calls for reliable optical dosimetry. Weemploy, for the first time, interstitial time-resolved spectroscopy todetermine in vivo optical properties of human prostate tissue. Ninepatients are included in the study, and measurements are conductedprior to primary brachytherapy treatment of prostate cancer. Intra-subject variability is examined by measuring across three tissue vol-umes within each prostate. The time-resolved instrumentation provesits usefulness by producing good signal levels in all measurements.We are able to present consistent values on reduced scattering coef-ficients ��s��, absorption coefficients ��a�, and effective attenuation��eff� at the wavelengths 660, 786, and 916 nm. At 660 nm, �s� isfound to be 9±2 cm−1, and �a is 0.5±0.1 cm−1. Derived values of�eff are in the range of 3 to 4 cm−1 at 660 nm, a result in goodagreement with previously published steady state data. Total hemo-globin concentration �THC� and oxygen saturation are spectroscopi-cally determined using derived absorption coefficients. Derived THCvalues are fairly variable �215±65 �M�, while derived values of oxy-gen saturation are gathered around 75% �76±4% �. Intrasubjectvariations in derived parameters correlate �qualitatively� with the het-erogeneity exhibited in acquired ultrasound images. © 2007 Society ofPhoto-Optical Instrumentation Engineers. �DOI: 10.1117/1.2435175�
Keywords: human prostate; hemoglobin; photon migration; time-resolvedspectroscopy; optical properties; in vivo.Paper 06239R received Sep. 5, 2006; revised manuscript received Nov. 7, 2006;accepted for publication Nov. 8, 2006; published online Jan. 25, 2007.
1 Introduction
Interest in optical characteristics of the human prostate ismainly related to recent efforts in developing photodynamictherapy �PDT� into a modality for treatment of localized pros-tate cancer. Initial preclinical work on PDT of prostate carci-noma appeared during the 1980s �Refs. 1 and 2� and �first�clinical work was published3 as early as 1990. For the devel-opment and optimization of the technique, several studieshave since been performed on canine4–6 and rat1,7 models.Clinical results from various research groups are nowavailable.8–13 Altogether, these results have shown a great po-tential of PDT in the management of prostate cancer.14,15
PDT, in general, relies on a process where light excites�i.e., activates� a photosensitizer, which induces cytotoxicoxygen species. Thus, PDT relies on the presence of light, aphotosensitizer, and oxygen. The corresponding dosimetry istherefore a complex matter, involving measurement and/orprediction of sensitizer and oxygen concentrations as well aslight fluence �light dose�. Since full treatment of diseased re-gions is crucial, these issues must be carefully addressed. Ac-cordingly, PDT dosimetry has been the main focus of numer-
Address all correspondence to Tomas Svensson, Department of Physics, LundUniversity, Box 118, SE-221 00 Lund, Sweden; Phone: +46-46-2223120; Fax:
+46-46-2224250; E-mail: [email protected]Journal of Biomedical Optics 014022-
ous papers �see, e.g., Star16�, of which a few are closelyrelated to the particular case of PDT of prostate cancer.17–21
One fundamental aspect in this context is the tissue opticalproperties, e.g., absorption and scattering coefficients. Notonly do they together determine the light dose distribution,but in vivo access to absorption coefficients can be used toestimate, for example, sensitizer concentrations, hemoglobinconcentration, and tissue oxygenation. In addition, due to dy-namic changes during PDT treatment, it is sometimes arguedthat on-line monitoring is required to achieve optimaltreatment.22,23
For the case of prostate tissue, several papers have ad-dressed the issue of optical properties, e.g., the effective at-tenuation coefficient �eff and in some cases also absorptionand reduced scattering coefficients �a and �s�,respectively.4,18,24–31 Most of them rely on interstitial fiber op-tic steady state fluence rate measurements at multiple source-detector separations. By measuring relative fluence rate in arange of source-detector separations larger than a few milli-meters �i.e., the diffuse regime�, the diffusion approximationof light transport can be employed to determine �eff. Since�eff depends on both �a and �s�, additional data is required toreach information on absorption and scattering separately.
1083-3668/2007/12�1�/014022/10/$25.00 © 2007 SPIE
January/February 2007 � Vol. 12�1�1
Svensson et al.: In vivo optical characterization of human prostate tissue…
One option is to determine �t�=�a+�s� by measuring relativeradiance at multiple, but short, source-detector separations.32
A second option, avoiding the need of short source-detectorseparations, is to measure absolute �instead of relative� flu-ence rate in the diffuse regime.33 Data evaluation, by means ofcurve fitting, then yields �eff and �s�. Hence, both optionsenable estimation of absorption and scattering coefficients.
Previously published values on optical properties of thehuman prostate, together with the results obtained in thisstudy, are given in Sec. 3. The first published work presents exvivo steady state measurements of �eff and �t�=�a+�s�, at633 nm, in three whole, nonmalignant human prostates.24 An-other post mortem study estimates prostate optical properties ��a, scattering coefficient �s, scattering anisotropy g, and �s��at 1064 nm, by measuring through thin prostate slices.25 Invivo effective attenuation in prostates diagnosed with benignprostatic hyperplasia �BPH� or prostatic carcinoma �PC� hasbeen estimated at 630, 633, and 665 nm, by employing steadystate fluence rate measurements.26,28,29 Other studies rely onabsolute fluence rate measurements to determine both absorp-tion and scattering coefficients. By measuring fluence ratesalong a linear channel �5 mm away from the source fiber�,one such study presents optical properties at 732 nm, beforeand after motexafin-lutetium-mediated PDT of locally recur-rent prostate cancer.34 In a similar study, optical fibers are keptfixed �five source fibers and three detector fibers�, and abso-lute fluence rate data is collected for 15 source-detector sepa-rations �at 762 nm�. Measurements were in that case per-formed in connection with TOOKAD-mediated PDT ofrecurrent prostate cancer.30 Regarding hemoglobin monitoringin human subjects, only very limited data have beenpublished.30,31
This study employs interstitial time-resolved spectroscopyto characterize human prostate tissue in vivo. Conceptually,this approach is very different from those chosen in previ-ously published work related to prostate tissue. By analyzingthe temporal broadening of picosecond laser pulses due topropagation through tissue, this technique provides reliableestimations of absorption and reduced scattering coefficients.The use of multiple wavelengths enables spectroscopic deter-mination of total hemoglobin concentration �THC� and oxy-gen saturation �StO2�. The technique has previously beenused in various areas of biomedical optics.35–39
The aim of the paper is to provide information on param-eters of dosimetric importance, as well as to introduce time-resolved spectroscopy as a tool in PDT research. In particular,the aim is to achieve separate information on �a and �s�, aswell as quantitative information on hemoglobin parameters.We also wish to give a proper indication on intra- and inter-subject variation, for the case of untreated prostate cancer.These parameters are important for PDT dosimetry calcula-tions, and are not extensively explored in previous studies.
Nine patients diagnosed with prostate cancer were in-cluded in the study, and all measurements were performedbefore primary treatment. By inserting three optical fibers,three tissue volumes were probed, yielding information on
prostate tissue heterogeneity.Journal of Biomedical Optics 014022-
2 Material and Methods2.1 InstrumentationTime-resolved data were acquired using a compact �50�50�30 cm� and portable time-domain photon migration instru-ment primarily intended for spectroscopy of biological tissuesin clinical environments.39,40 A schematic illustration is givenin Fig. 1.
The system is based on diode laser technology and time-correlated single-photon-counting �TCSPC�. A laser driver�SEPIA PDL 808, PicoQuant, Germany� controls four pulseddiode lasers �LDH, PicoQuant at 660, 786, 916, and 974 nm�.Wavelengths are chosen to enable monitoring of importanttissue constituents �hemoglobin, water, and lipids� and prop-erties �tissue oxygenation�. Lasers are typically operated at 1to 2 mW, generating pulses about 70 ps wide �FWHM�. Fourwavelength pulse trains are generated at a repetition fre-quency of 40 MHz. This is accomplished by separating theindividual pulses in time ��6 ns�, using electric cables ofdifferent lengths.
The light emitted from each diode laser is individuallycoupled into a separate 200-�m graded-index �GRIN� fiber�G 200/280 N, ART Photonics, Germany�. A four-to-one cou-pler is used to couple all light into a single 600-�m GRINfiber �G 600/840 P, ART Photonics�, which serves as the lightsource. A second fiber collects light and delivers it to thedetector. Each of these two fibers is approximately 2 m long.To fit into 1-mm inner diameter brachytherapy needles, a thinpolyimide layer acts as the only fiber coating at the fiber end-ings. Remaining parts are protected in polyolefin tubing.
Proper photon levels are achieved by sending collectedlight through an adjustable gradient neutral density �ND� fil-ter. Remaining photons are sent to a cooled microchannelplate photomultiplier tube �MCP-PMT; R3809-59,Hamamatsu Photonics, Japan�. A TCSPC computer card�SPC-300, Becker&Hickl, Germany� is used to obtain time-dispersion histograms with channel widths of approximately25 ps.
Broadening in the fibers and the detector yields an instru-ment response function �IRF� that is about 100 ps wide. TheIRF is measured by inserting source and detector fibers into achamber so that the end facets are separated by 150 mm andface each other. The chamber is made of black delrin, andcontains a pinhole that is inserted between the two fibers toblock reflected stray light.
2.2 ModelingExperimental data are modeled using the diffusion approxi-mation of transport theory. More specifically, data are fitted tothe analytical solution of the time-dependent diffusion equa-
41
Fig. 1 Schematic of the instrumentation in interstitial mode.
tion for the case of a homogenous and infinite medium.
January/February 2007 � Vol. 12�1�2

Svensson et al.: In vivo optical characterization of human prostate tissue…
Accordingly, the fluence rate � due to a infinitely short lightpulse from an isotropic point source can be written as
��r,t� = c�E0�4�c�Dt�−3/2 exp�−r2
4c�Dt− �ac�t� , �1�
where E0 is the pulse energy, r is the distance from the pointsource, c� is the speed of light within the material, and D isthe diffusion coefficient. The refractive index is assumed to ben=1.4. To comply with recent work concerning the diffusioncoefficient, it is defined as in Eq. �2�, rather than in the tradi-tional �absorption-dependent� way42,43:
D =1
3�s�. �2�
The form of Eq. �1� enables deduction of both �s� and �afrom experimental data without requiring absolute measure-ments of light fluence. This is achieved by considering tem-poral shapes only. That is, experimental data are fitted usingan expression similar to that given in Eq. �1�, but in whichamplitude information is contained in a free parameter k. Thisexpression is given as
y��a,�s�,k,t� = k t−3/2 exp�−3�s�r
2
4c�t− �ac�t� . �3�
The best fit is reached iteratively using a Levenberg-Marquardt algorithm, where �s�, �a, and k are varied to mini-mize a �2 error norm.44 Final values of �s� and �a are thenestimations of the reduced scattering coefficient and absorp-tion coefficient, respectively. Note that the IRF, being about100 ps wide, cannot be regarded as infinitely short in com-parison to the tissue response. Therefore, each iteration in thecurve-fitting procedure involves a convolution of analyticaldata and IRF. It should also be noted that fitting is performedusing the part of experimental data between times given bythe 50% of maximum on the rising edge, and 20% on thefalling edge �see Fig. 5 in Sec. 3�.
The previous studies of human prostate optical propertiesmentioned in the introduction used the same theoreticalframework. However, by employing steady state techniques,they rely on a stationary solution rather that the time-dependent solution given in Eq. �1�. The stationary solution ofthe diffusion equation for an infinite homogenous medium isgiven as
��r� =3�s�P0
4�rexp�− �eff r� . �4�
Here, P0 is the power of the point source, r is the distancefrom the source, and �eff the effective attenuation. The effec-tive attenuation is defined as
�eff = ��a/D�1/2 = �3�a�s��1/2 �5�
From the form of Eq. �4�, we see that �eff can be deducedfrom relative fluence measurements at multiple source detec-tor separations. Only if absolute fluence rate is measured, itcan be used to get information on reduced scattering and ab-
sorption separately. Absolute measurement of fluence rate inJournal of Biomedical Optics 014022-
living tissue is of course a difficult matter �especially in inter-stitial settings�. Note also that �eff is a primary parameterwhen using the steady state technique. Time-resolved experi-ments provide estimations of �a and �s� which in a secondstep can be used to calculate �eff.
2.3 Hemoglobin SpectroscopyThe spectroscopic evaluation employed in this study assumesthat the absorption exhibited by prostate tissue originates fromoxy- and deoxyhemoglobin �Hb and HbO2, respectively�, wa-ter, and lipids. Since high absorption prevented the use of974-nm data �see Sec. 3�, water and lipid concentrations couldnot be estimated. Instead, absorption coefficients at 660 and786 nm were used to extract oxy- and deoxyhemoglobin con-centrations ��HbO2� and �Hb�, respectively�. In this proce-dure, the prostate was assumed to contain 70% water and 10%lipids �note that due to relatively low absorption of water andlipids at 660 and 786 nm, the choice of these values is of verylittle importance�. The extinction coefficients of these chro-mophores were taken from literature45–47 and are presented inTable 1.
In a second step, total hemoglobin concentration and oxy-gen saturation are calculated from �HbO2� and �Hb�.
2.4 Clinical ProcedureClinical data were collected at the Lund University Hospitaladhering to a protocol approved by the regional ethics com-mittee. All nine patients involved in the study were undergo-ing primary treatment of prostate cancer. Measurements wereperformed in connection with brachytherapy �low-dose seedimplantation�. This fact limits our study to patients suitablefor this treatment, that is, patients fulfilling the following re-quirements: �1� Gleason index �6, �2� prostate specific anti-gen �PSA� �10, �3� no tumor obstruction of urethra, and �4�prostate volume of the order of 20 to 40 cm3. Such patientsare often referred to as low-risk patients.
This type of brachytherapy of prostate cancer involves per-manent implantation of radioactive seeds �internal radio-therapy�. The procedure takes place in an operating theater,while patients are under general anesthesia. At the Lund Uni-versity Hospital, the first step in this procedure is to image theprostate gland using transrectal ultrasound. When the physi-cian has marked important boundaries in these images �pros-tate, urethra, and rectum�, a radiotherapist performs dosimet-ric calculations. Dosimetric calculations open a time windowof about 20 min in which the time-resolved measurements
Table 1 Extinction and absorption coefficients of tissue chro-mophores.
Unit 660 nm 786 nm
Pure water cm−1 0.0036 0.0222
Pure lipid cm−1 0.0042 0.0036
Hb cm−1/�M 0.0074 0.0022
HbO2 cm−1/�M 0.00074 0.0017
were performed without interfering with the routine proce-
January/February 2007 � Vol. 12�1�3

Svensson et al.: In vivo optical characterization of human prostate tissue…
dures. Three standard brachytherapy needles were then in-serted, all to the same depth �using transrectal ultrasoundguidance�. A standard transperineal brachytherapy needle ma-trix handles lateral positioning �5�5-mm grid spacing�. Threesterilized optical fibers were inserted through the threeneedles so that they were located edge to edge with the needletips �this positioning is achieved by premarking the fibers�.Fiber separations are inferred from ultrasound images �B-KMedical Hawk 2102 EXL with transducer 8658-T operating at6.5 to 7.5 MHz�. Figure 2 shows two authentic ultrasoundimages.
By using three needles, it is possible to probe three fairlynonoverlapping prostate tissue volumes. Fiber separationswere in the range of 10 to 30 mm. The three fiber separationsused within each patient were chosen to differ, and typicallyset in a triangular pattern to approximately 15, 20, and25 mm. The longest fiber separation corresponds to a morecentral volume of the prostate, bordering the urethra. Typicalfiber positioning is schematically illustrated in Fig. 3. In ad-dition, this figure also indicates sampling volumes bydisplaying48 PHDs.
Since the instrumentation used in this study supports onlyone source and one detector fiber at a time, three sequentialmeasurements must be performed. The total data acquisitiontime was approximately 3 min per patient �1 min per tissuevolume�. To detect unexpected changes during data acquisi-
Fig. 2 Two ultrasound images showing three needles inserted into theprostate. For clarity, the needles are marked by circles. Shadows be-hind the needles are due to their high reflectivity. The fairly homog-enous image �a� originates from patient 5, while the heterogenousstructure in �b� was exhibited by patient 6.
tion, measurements were performed in 1 s increments. After
Journal of Biomedical Optics 014022-
completion of the tissue measurements, the IRF is measuredusing the same set of fibers. To ensure system stability �e.g.,avoid drifts due to temperature changes�, this step is con-ducted while the system is in the operating theater.
3 ResultsAnalysis of collected data reveals that time-resolved spectros-copy can provide consistent optical and physiological charac-teristics of human prostate tissue. Data were collected at fourwavelengths: 660, 786, 916, and 974 nm. For each patientand wavelength, raw data consist of three dispersion curves�tissue response� corresponding to the three utilized fiberseparations �in total, 27 time-resolved data sets from nine pa-tients�. Since the fiber separations within a patient are chosento be different, e.g., 15, 20, and 25 mm, the obtained curvesare significantly different. For the range of fiber separationsused in this study, most detected light travels a time less than1.5 ns through tissue �corresponding to maximum pathlengths of about 30 cm�. An example of raw data, for the caseof 660 nm, is given in Fig. 4.
By means of curve fitting, optical properties were extractedfor 660, 786, and 916 nm from all 27 time-resolved data sets.Unfortunately, high absorption at 974 nm prevented analysisof data acquired at that wavelength. A typical fitting example,for the case of 786 nm, is shown in Fig. 5.
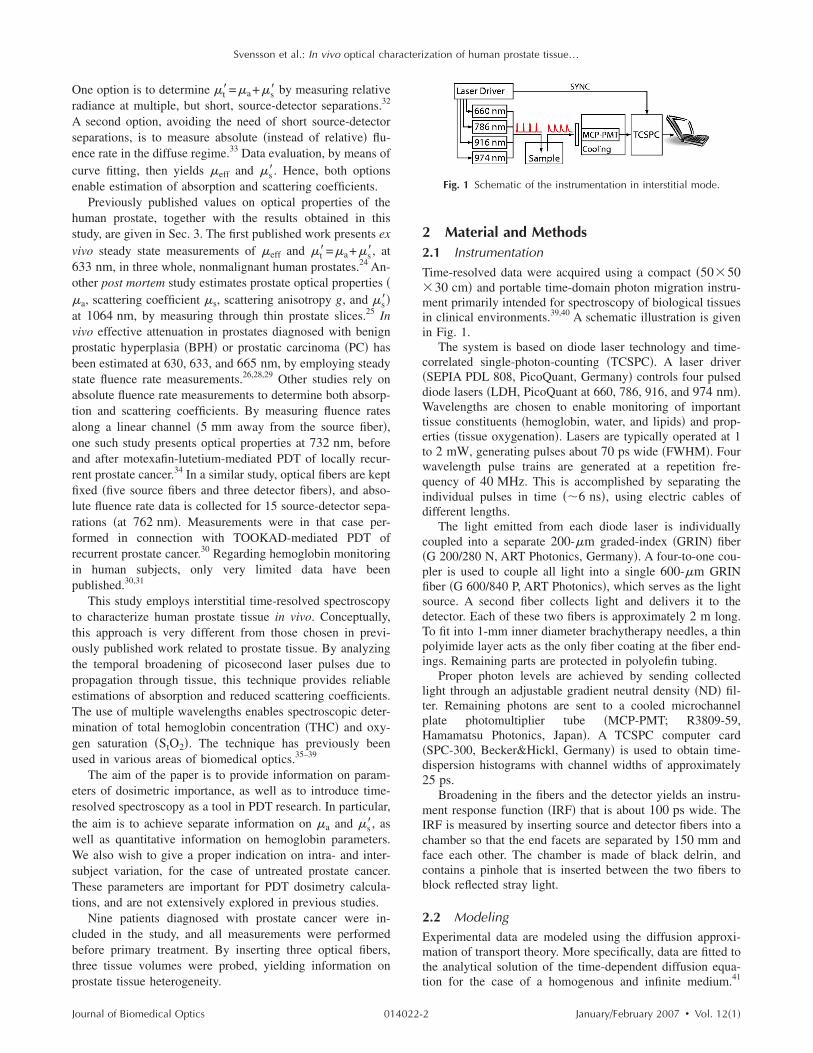
A summary of the results of this study is given in Table 2,in which previously published data are presented for compari-son. A detailed report on measured optical �at 660 and786 nm� and physiological characteristics are given in Table3. In the following, graphical representation of data fromTable 3 is used to illustrate and support further analysis.
No pronounced correlation between estimated values of �a
and �s� was seen for any wavelength, implying that results donot suffer from �s� to �a crosstalk. This is shown in Fig. 6,where results from 660 nm are presented. A general commentis, however, helpful in interpreting the pattern shown. Threemeasurements �21.5 and 26.4 mm from patient 6, and
Fig. 3 Schematic drawing of fiber positioning �compare with Fig.2�a��. The needle template has 5-mm grid spacing. Three optical fibersare inserted to the same depth. Fiber separations are 15, 20, and25 mm. The three tissue volumes being probed are indicated usingcalculations of photon-hitting densities �PHDs� at the plane of fibertips ��s�=8.7 and �a=0.49 cm−1�. Isocurves indicate where the PHDis 50% of the value exhibited halfway between source- and detectorfibers.
25.0 mm from patient 8� resulted in very low values of both
January/February 2007 � Vol. 12�1�4

Svensson et al.: In vivo optical characterization of human prostate tissue…
absorption and reduced scattering �leading to a THC less than100 �M�. In these cases, note that an extremely low degreeof bleeding was noted during the measurements �almost noblood stains on the used fibers, while the average fiber washeavily stained after a measurement�. Thus, it is likely thatthese measurement outcomes correspond to a particular tissuecomposition, rather than a systematic error such as �s� to �acrosstalk.
The influence of fiber separation on derived optical prop-erties is illustrated in Fig. 7. Although derived optical proper-ties show no strict dependence on the fiber separation, theremight be a tendency toward measuring lower �a and �s� forlarge fiber separations. Such a tendency may be related to thefact that the longest fiber separation �for each patient� corre-sponds to a central prostate volume, while the two shortercorrespond to outer volumes. For comparison, note that stud-ies on intralipid phantoms having prostate-like optical proper-ties were performed. In these, the selection of fiber separationhad no systematic influence on derived optical properties.
Fig. 4 Acquired time-resolved data at 660 nm for patient 5 �afterbackground subtraction�. Data are shown in both linear �upper axes,normalized� and logarithmic scale �lower axes�. Corresponding660-nm IRFs are also shown. Input laser pulses are broadened from90 ps �IRF� to 222 �14.8�, 264 �17.7�, and 291 ps �23.3 mm�.
Fig. 5 Fitting of 786-nm time-resolved data from patient 4 �26.5-mmfiber separation�. Dispersion data used in fitting are marked by soliddots. Weighted residuals are shown below, together with the zerolevel �solid line� and the �−1.96,1.96� prediction interval of standard-
ized normal distributions �dashed lines�.Journal of Biomedical Optics 014022-
As we can see in Fig. 8, derived hemoglobin concentra-tions show a behavior similar to that of �a, while oxygensaturation showed no correlation to utilized fiber separation.
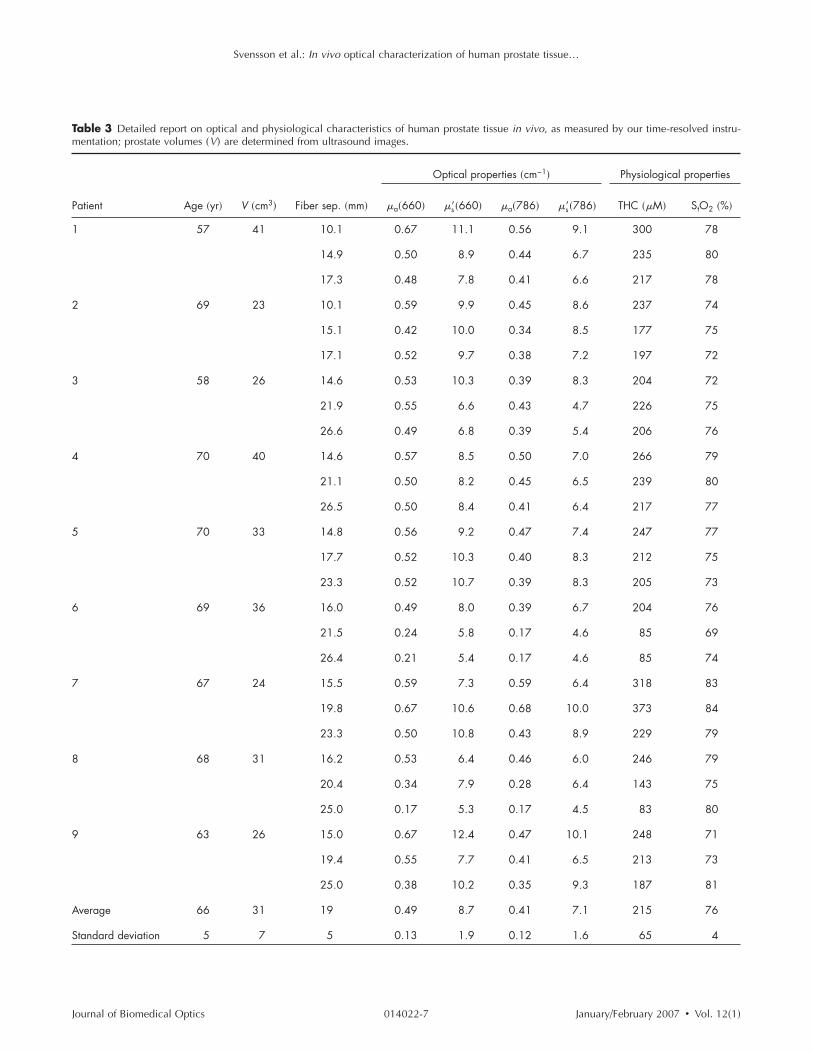
Turning to inter- and intrapatient variations, an importantgeneral observation is that patients 2 to 5 exhibited homog-enous ultrasound images, while obvious inhomogeneities dueto calcifications are found in images from patients 1 and 6 to9. As we can see in Figs. 9–11, this fact correlates to mea-sured intrasubject variations. A second general observation isthat all derived parameters, except oxygen saturation, can besubject to a fairly large spread, even within individual pa-tients. Figure 9 presents inter- and intrapatient variations of660-nm optical properties.
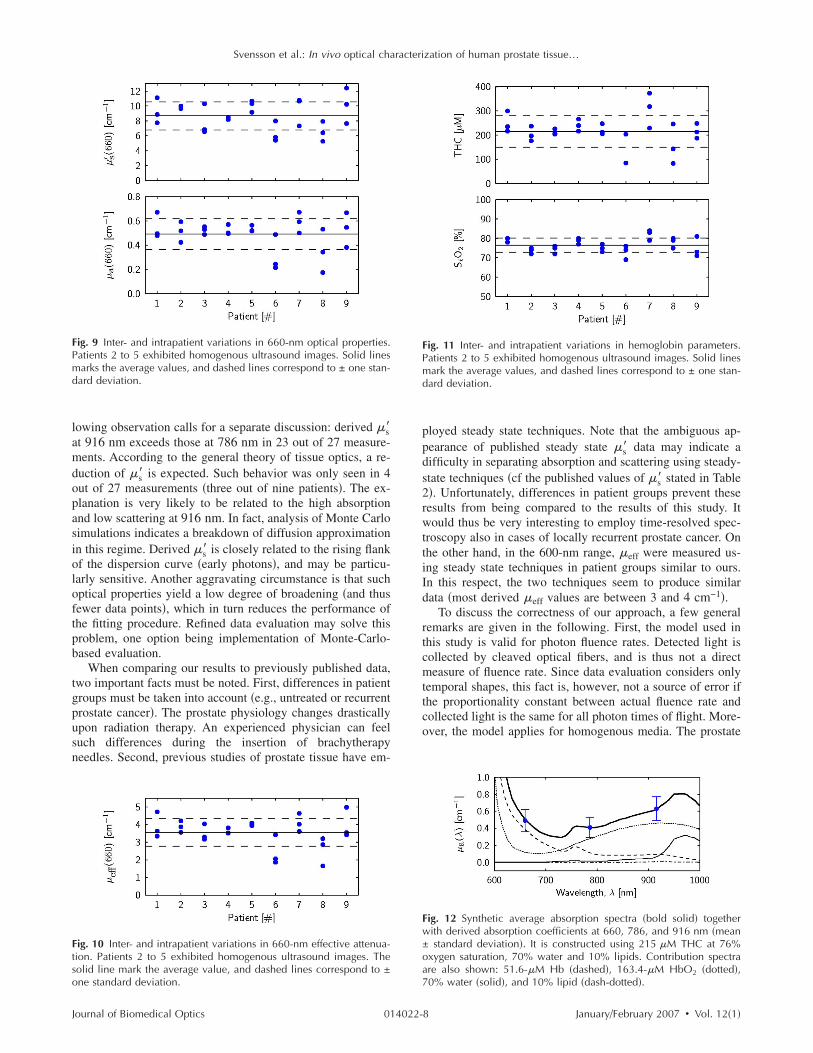
Effective attenuation, being an important parameter inPDT dosimetry, was calculated from extracted �a and �s� andis presented in Fig. 10.
Hemoglobin concentrations and oxygen saturation werespectroscopically determined using absorption coefficients asmeasured at 660 and 786 nm. As we can see in Fig. 11, THCexhibit substantial inter- and intrasubject variations. Oxygensaturation, on the other hand, displays only minor variations.
One alternative to deriving hemoglobin concentrationsfrom 660- and 786-nm data only, would be to include 916-nmdata �still assuming that the prostate contains 70% water and10% lipids�. If this procedure is followed, resulting THC val-ues deviate by +1.5±8.7%, and StO2 by +1.1±4.1% fromthe values calculated from 660- and 786-nm data only. Interms of overall impact, derived THC changes from 215±65to 215±56 �M �the rounded average is coincidentally con-served�, and StO2 from 76±4 to 77±4%. These fairly smallchanges can also be understood by analyzing the differencebetween measured 916-nm �a, and the predicted 916-nm �a,as calculated from derived hemoglobin levels �estimated from660- and 786-nm data� in combination with the assumption of70% water and 10% lipids. Such analysis show that measured916-nm �a deviates by 2±11% from predicted values.
A synthetic absorption spectra can be constructed usingderived hemoglobin concentrations and assumed concentra-tions of water and lipids. Figure 12 presents the average com-posite absorption spectra of the prostate, as derived in thisstudy.
4 DiscussionReliable optical dosimetry is an important issue in the devel-opment of PDT into a modality for treatment of prostate can-
Fig. 6 Scatterplot showing correlation between derived �s� and �a at660 nm. The three points in the lower left correspond to the threemeasurement cases exhibiting a low degree of bleeding and low THC
�r=0.31 if disregarded�.January/February 2007 � Vol. 12�1�5

Svensson et al.: In vivo optical characterization of human prostate tissue…
cer. Whether reliable dosimetry means on-line monitoring ofcertain parameters, individual pretreatment planning, or gen-eral knowledge on intra- and intersubject variations remainsan open question. By employing time-resolved spectroscopy,this study was able to generate estimations of optical andphysiological characteristics ��a, �s�, �eff, total hemoglobinconcentration, and oxygen saturation� for all involved pa-tients, and thus providing a reliable indication on intra- and
Table 2 Optical properties �given in inverse centimeters� of human prpatients is also given �N�; note differences regarding wavelength.
Study Description
Pantelides et al.24 �1990� ex vivo steady state data, normal wh
Whitehurst et al.26 �1994� in vivo steady state data, untreated
Lee et al.28 �1995� in vivo steady state data, untreated
Lee et al.28 �1995� in vivo steady state data, untreated
Lee et al.29 �1999� in vivo steady state data, untrea
This study in vivo time-resolved data, untre
Weersink et al.30 �2005� in vivo steady state data, recur
Zhu et al.34 �2005� in vivo steady state data, recur
This study in vivo time-resolved data, untre
This study in vivo time-resolved data, untre
Essenpreis et al.25 �1992� ex vivo integrating sphere data, norm
Fig. 7 Scatterplot showing the correlation between utilized fiber sepa-ration and derived optical properties at 660 nm. Correlation coeffi-cients r are added for reference. The three points with �a�0.25 cor-respond to the three measurement cases exhibiting a low degree of
bleeding and low THC.Journal of Biomedical Optics 014022-
intersubject variations for the case of untreated prostate can-cer. In fact, as we can see in Table 3, all measurements re-sulted in quality data. In addition, by requiring only two fixedfibers for a single measurement, the time-resolved techniqueis accompanied with fairly simple clinical procedures.
Calculations of PHDs suggest that sampling volumes arekept within the prostate. Results are consistent and imply thatthe prostates of the patient group under consideration exhibitmoderate intra- and intersubject variations. However, the fol-
issue as reported in various published studies; the number of involved
� �nm� N �a �s� �eff
states 633 3 0.7±0.2 8.6±0.5 4.3±0.5
d PC 633 11 3.6±0.2
d PC 633 11 3.9±0.5
d PC 665 11 3.2±0.5
630 7 3.5±0.7
660 9 0.5±0.1 8.7±1.9 3.6±0.8
762 22 0.4±0.2 3.4±1.6 2.0±0.6
732 13 0.4±0.2 11.8±8.2 3.3±0.5
786 9 0.4±0.1 7.1±1.6 2.9±0.7
916 9 0.6±0.1 7.7±1.8 3.8±0.8
states 1064 1.5±0.2 6.4
Fig. 8 Scatterplot showing the correlation between utilized fiber sepa-ration and THC and StO2, respectively. Correlation coefficients r are
ostate t
ole pro
BPH an
BPH an
BPH an
ted PC
ated PC
rent PC
rent PC
ated PC
ated PC
al pro
added for reference.
January/February 2007 � Vol. 12�1�6
Svensson et al.: In vivo optical characterization of human prostate tissue…
Table 3 Detailed report on optical and physiological characteristics of human prostate tissue in vivo, as measured by our time-resolved instru-mentation; prostate volumes �V� are determined from ultrasound images.
Optical properties �cm−1� Physiological properties
Patient Age �yr� V �cm3� Fiber sep. �mm� �a�660� �s��660� �a�786� �s��786� THC ��M� StO2 �%�
1 57 41 10.1 0.67 11.1 0.56 9.1 300 78
14.9 0.50 8.9 0.44 6.7 235 80
17.3 0.48 7.8 0.41 6.6 217 78
2 69 23 10.1 0.59 9.9 0.45 8.6 237 74
15.1 0.42 10.0 0.34 8.5 177 75
17.1 0.52 9.7 0.38 7.2 197 72
3 58 26 14.6 0.53 10.3 0.39 8.3 204 72
21.9 0.55 6.6 0.43 4.7 226 75
26.6 0.49 6.8 0.39 5.4 206 76
4 70 40 14.6 0.57 8.5 0.50 7.0 266 79
21.1 0.50 8.2 0.45 6.5 239 80
26.5 0.50 8.4 0.41 6.4 217 77
5 70 33 14.8 0.56 9.2 0.47 7.4 247 77
17.7 0.52 10.3 0.40 8.3 212 75
23.3 0.52 10.7 0.39 8.3 205 73
6 69 36 16.0 0.49 8.0 0.39 6.7 204 76
21.5 0.24 5.8 0.17 4.6 85 69
26.4 0.21 5.4 0.17 4.6 85 74
7 67 24 15.5 0.59 7.3 0.59 6.4 318 83
19.8 0.67 10.6 0.68 10.0 373 84
23.3 0.50 10.8 0.43 8.9 229 79
8 68 31 16.2 0.53 6.4 0.46 6.0 246 79
20.4 0.34 7.9 0.28 6.4 143 75
25.0 0.17 5.3 0.17 4.5 83 80
9 63 26 15.0 0.67 12.4 0.47 10.1 248 71
19.4 0.55 7.7 0.41 6.5 213 73
25.0 0.38 10.2 0.35 9.3 187 81
Average 66 31 19 0.49 8.7 0.41 7.1 215 76
Standard deviation 5 7 5 0.13 1.9 0.12 1.6 65 4
Journal of Biomedical Optics January/February 2007 � Vol. 12�1�014022-7
Svensson et al.: In vivo optical characterization of human prostate tissue…
lowing observation calls for a separate discussion: derived �s�at 916 nm exceeds those at 786 nm in 23 out of 27 measure-ments. According to the general theory of tissue optics, a re-duction of �s� is expected. Such behavior was only seen in 4out of 27 measurements �three out of nine patients�. The ex-planation is very likely to be related to the high absorptionand low scattering at 916 nm. In fact, analysis of Monte Carlosimulations indicates a breakdown of diffusion approximationin this regime. Derived �s� is closely related to the rising flankof the dispersion curve �early photons�, and may be particu-larly sensitive. Another aggravating circumstance is that suchoptical properties yield a low degree of broadening �and thusfewer data points�, which in turn reduces the performance ofthe fitting procedure. Refined data evaluation may solve thisproblem, one option being implementation of Monte-Carlo-based evaluation.
When comparing our results to previously published data,two important facts must be noted. First, differences in patientgroups must be taken into account �e.g., untreated or recurrentprostate cancer�. The prostate physiology changes drasticallyupon radiation therapy. An experienced physician can feelsuch differences during the insertion of brachytherapyneedles. Second, previous studies of prostate tissue have em-
Fig. 9 Inter- and intrapatient variations in 660-nm optical properties.Patients 2 to 5 exhibited homogenous ultrasound images. Solid linesmarks the average values, and dashed lines correspond to ± one stan-dard deviation.
Fig. 10 Inter- and intrapatient variations in 660-nm effective attenua-tion. Patients 2 to 5 exhibited homogenous ultrasound images. Thesolid line mark the average value, and dashed lines correspond to ±
one standard deviation.Journal of Biomedical Optics 014022-
ployed steady state techniques. Note that the ambiguous ap-pearance of published steady state �s� data may indicate adifficulty in separating absorption and scattering using steady-state techniques �cf the published values of �s� stated in Table2�. Unfortunately, differences in patient groups prevent theseresults from being compared to the results of this study. Itwould thus be very interesting to employ time-resolved spec-troscopy also in cases of locally recurrent prostate cancer. Onthe other hand, in the 600-nm range, �eff were measured us-ing steady state techniques in patient groups similar to ours.In this respect, the two techniques seem to produce similardata �most derived �eff values are between 3 and 4 cm−1�.
To discuss the correctness of our approach, a few generalremarks are given in the following. First, the model used inthis study is valid for photon fluence rates. Detected light iscollected by cleaved optical fibers, and is thus not a directmeasure of fluence rate. Since data evaluation considers onlytemporal shapes, this fact is, however, not a source of error ifthe proportionality constant between actual fluence rate andcollected light is the same for all photon times of flight. More-over, the model applies for homogenous media. The prostate
Fig. 11 Inter- and intrapatient variations in hemoglobin parameters.Patients 2 to 5 exhibited homogenous ultrasound images. Solid linesmark the average values, and dashed lines correspond to ± one stan-dard deviation.
Fig. 12 Synthetic average absorption spectra �bold solid� togetherwith derived absorption coefficients at 660, 786, and 916 nm �mean± standard deviation�. It is constructed using 215 �M THC at 76%oxygen saturation, 70% water and 10% lipids. Contribution spectraare also shown: 51.6-�M Hb �dashed�, 163.4-�M HbO2 �dotted�,
70% water �solid�, and 10% lipid �dash-dotted�.January/February 2007 � Vol. 12�1�8
Svensson et al.: In vivo optical characterization of human prostate tissue…
is, of course, heterogenous, and out of all detected photons,those that have traveled through regions of low attenuationwill be overrepresented. One should therefore be careful ininterpreting the derived values as true volume averages.
Second, the choice of data range involved in curve fittingoccasionally has an influence on the outcome. Finding an op-timal fitting range is, however, a complex issue, since thecorrectness of our model varies with the photon time of flight.For example, early photons are often disregarded since diffu-sion theory does not describe them very well. In this study, wefocus on regions with fairly high photon count rates by choos-ing to cut the tail of late photons at 20% of maximum �seeSec. 2.2�. The reason why later photons are excluded is toavoid a region with many data points at a low signal level,where even small absolute systematic measurement/model er-rors will have a significant impact on fitted parameters.
Third, as we can see in Eq. �3�, the fiber separation is animportant parameter in time-resolved spectroscopy. The infer-ring of fiber separations from ultrasound images is, of course,afflicted with some errors. However, it is unlikely that theerror between true and measured separation, rtrue and rmeas,respectively, exceeds 1 mm. From Eq. �3�, one finds that er-rors in fiber separation will produce errors only in derivedreduced scattering coefficients. The optimal fit is expectedwhen �s� is selected so that
�s�rmeas2 = �s��rtrue + �r�2 = �s,true� rtrue
2 , �6�
where �s,true� is the true reduced scattering coefficient, and �ris the error in fiber separation. The impact of uncertaintiesregarding fiber separation can be described by the tuning co-efficient
r = � ��s�
��r�
�r=0=
− 2�s,true�
rtrue, �7�
which states the change in derived reduced scattering coeffi-cients due to �small� errors in fiber separation. For the case of�s,true� =8.7 cm−1 and rtrue=20 mm, one finds that r=0.87 cm−1/mm. Hence, a nonnegligible part of the intra-subject variations in derived reduced scattering coefficientsmay be assigned to errors in fiber separation. However, cor-relation with ultrasound heterogeneity and the large variationsmeasured in some patients imply that there are significantinherent intrasubject variations.
Finally, the time-resolved approach, in contrast to steadystate techniques, should be rather insensitive to bleedingsaround the needle tips. These bleedings can be thought of asrandom filters, and may therefore disturb measurements offluence rate. However, all detected photons must pass the re-gion of bleeding, leaving the temporal shape unchanged.
5 SummaryThis study clearly shows that time-resolved spectroscopy is asuitable tool for accessing information on human prostate tis-sue in vivo. By producing consistent estimations of absorption��a�, reduced scattering ��s��, effective attenuation ��eff�, he-moglobin concentrations, and tissue oxygenation, this tech-nique was able to generate the most complete in vivo optical
characterization of human prostate tissue published so far. ByJournal of Biomedical Optics 014022-
measuring across three tissue volumes in each prostate, bothinter- and intrasubject variations were examined. All derivedparameters, with the exception of tissue oxygen saturation, aresubject to fairly large intrasubject variation. Interestingly,these variations correlate with the heterogeneity exhibited byacquired ultrasound images.
AcknowledgmentsThe authors wish to thank the brachytherapy team at the LundUniversity Hospital, especially Ola Bratt, Inger-Lena Lamm,Per Munck af Rosenschöld, Jonas Nilsson, and Pia Nilsson,for friendly and professional cooperation. We are also gratefulto Christoffer Abrahamsson, Ann Johansson, and JohannesSwartling for fruitful discussions, as well as to Johan Stenssonfor technical assistance during measurements.
References1. M. S. McPhee, C. W. Thorndyke, G. Thomas, J. Tulip, D. Chapman,
and W. H. Lakey, “Interstitial applications of laser irradiation in he-matoporphyrin derivative-photosensitized dunning r3327 prostatecancers, Lasers Surg. Med. 4�1�, 93–98 �1984�.
2. J. L. Camps, S. K. Powers, W. C. Beckman, J. T. Brown, and R. M.Weissman, “Photodynamic therapy of prostate-cancer: an in vitrostudy,” J. Urol. (Baltimore) 134�6�, 1222–1226 �1985�.
3. T. Windahl, S. O. Andersson, and L. Lofgren, “Photodynamic therapyof localized prostatic cancer,” Langmuir 336�8723�, 1139–1139�1990�.
4. L. K. Lee, C. Whitehurst, Q. Chen, M. L. Pantelides, F. W. Hetzel,and J. V. Moore, “Interstitial photodynamic therapy in the canineprostate,” Br. J. Urol. 80�6�, 898–902 �1997�.
5. Q. Chen, Z. Huang, D. Luck, J. Beckers, P. H. Brun, B. C. Wilson, A.Scherz, Y. Salomon, and F. W. Hetzel, “Preclinical studies in normalcanine prostate of a novel palladium-bacteriopheophorbide �WST09�photosensitizer for photodynamic therapy of prostate cancer,” Photo-chem. Photobiol. 76�4�, 438–445 �2002�.
6. R. Sroka, D. Zaak, M. Hoppner, R. Muschter, R. Knuchel, A. Per-lmutter, and A. Hofstetter, “In vivo investigations of photodynamictherapy by means of 5-ALA induced PPIX on canine prostates,” Med.Laser Appl. 18�1�, 87–90 �1992�.
7. D. Zaak, R. Sroka, et al., “Photodynamic therapy of prostate cancerby means of 5-aminolevulinic acid-induced protoporphyrin IX—invivo experiments on the dunning rat tumor model,” Urol. Int. 72�3�,196–202 �2004�.
8. A. M. Ronn, M. Nouri, L. A. Lofgren, B. M. Steinberg, A. Wester-born, T. Windahl, M. J. Shikowitz, and A. L. Abramson, “Humantissue levels and plasma pharmacokinetics of temoporfin �Foscan�R�,mTHPC�,” Lasers Med. Sci. 11�4�, 267–272 �1996�.
9. D. Zaak, R. Sroka, M. Hoppner, W. Khoder, O. Reich, S. Tritschler,R. Muschter, R. Knuchel, and A. Hofstetter, “Photodynamic therapyby means of 5-ALA induced PPIX in human prostate cancer—preliminary results,” Med. Laser Appl. 18�1�, 91–95 �2003�.
10. T. Nathan, D. Whitelaw, et al., “Photodynamic therapy for prostatecancer recurrence after radiotherapy: a phase I study,” J. Urol. (Bal-timore) 168�4�, 1427–1432 �2002�.
11. K. Verigos, D. C. H. Stripp, et al., “Updated results of a phase I trialof motexafin lutetium-mediated interstitial photodynamic therapy in-patients with locally recurrent prostate cancer,” J. Environ. Pathol.Toxicol. Oncol. 25�1–2�, 373–387 �2006�.
12. K. L. Du, R. Mick, et al., “Preliminary results of interstitial motexafinlutetium-mediated PDT for prostate cancer,” Lasers Surg. Med.38�5�, 427–434 �2006�.
13. C. M. Moore, T. R. Nathan, W. R. Lees, C. A. Mosse, A. Freeman,M. Emberton, and S. G. Bown, “Photodynamic therapy using mesotetra hydroxy phenyl chlorin �mTHPC� in early prostate cancer,” La-sers Surg. Med. 38�5�, 356–363 �2006�.
14. C. M. Moore, I. M. Hoh, S. G. Bown, and M. Emberton, “Doesphotodynamic therapy have the necessary attributes to become a fu-ture treatment for organ-confined prostate cancer?” BJU Int., 96�6�,
754–758 �2005�.January/February 2007 � Vol. 12�1�9
Svensson et al.: In vivo optical characterization of human prostate tissue…
15. J. H. Pinthus, A. Bogaards, R. Weersink, B. C. Wilson, and J. Tra-chtenberg, “Photodynamic therapy for urological malignancies: pastto current approaches,” J. Urol. (Baltimore) 175�4�, 1201–1207�2006�.
16. W. M. Star, “Light dosimetry in vivo,” Phys. Med. Biol. 42�5�, 763–787 �1997�.
17. C. Whitehurst, M. L. Pantelides, J. V. Moore, and N. J. Blacklock,“Optimization of multifiber light delivery for the photodynamictherapy of localized prostate-cancer,” Photochem. Photobiol. 58�4�,589–593 �1993�.
18. Q. Chen and F. Hetzel, “Laser dosimetry studies in the prostate,” J.Clin. Laser Med. Surg. 16�1�, 9–12 �1998�.
19. L. Lilge, N. Pomerleau-Dalcourt, A. Douplik, S. Selman, R. Keck,M. Szkudlarek, M. Pestka, and J. Jankun, “Transperineal in vivofluence-rate dosimetry in the canine prostate during SnET2-mediatedPDT,” Phys. Med. Biol. 49�14�, 3209–3225 �2004�.
20. M. D. Altschuler, T. C. Zhu, J. Li, and S. M. Hahn, “Optimizedinterstitial PDT prostate treatment planning with the Cimmino feasi-bility algorithm,” Med. Phys. 32�12�, 3524–3536 �2005�.
21. J. Jankun, R. W. Keck, E. Skrzypczak-Jankun, L. Lilge, and S. H.Selman, “Diverse optical characteristic of the prostate and light de-livery system: implications for computer modelling of prostatic pho-todynamic therapy,” BJU Int. 95�9�, 1237–1244 �2005�.
22. J. Jankun, L. Lilge, A. Douplik, R. W. Keck, M. Pestka, M. Szkud-larek, P. J. Stevens, R. J. Lee, and S. H. Selman, “Optical character-istics of the canine prostate at 665 nm sensitized with tin etiopurpurindichloride: need for real-time monitoring of photodynamic therapy,”J. Urol. (Baltimore) 172�2�, 739–743 �2004�.
23. A. Johansson, T. Johansson, M. Soto Thompson, N. Bendsoe, K.Svanberg, S. Svanberg, and S. Andersson-Engels, “In vivo measure-ment of parameters of dosimetric importance during photodynamictherapy of thick skin tumors,” J. Biomed. Opt. 11�3�, 034029 �2006�.
24. M. L. Pantelides, C. Whitehurst, J. V. Moore, T. A. King, and N. J.Blacklock, “Photodynamic therapy for localized prostatic cancer—light penetration in the human prostate-gland,” J. Urol. (Baltimore)143�2�, 398–401 �1990�.
25. M. Essenpreis, “Thermally induced changes in optical properties ofbiological tissues,” Ph.D. Thesis, University College London �1992�.
26. C. Whitehurst, M. L. Pantelides, J. V. Moore, P. J. C. Brooman, andN. J. Blacklock, “In vivo laser-light distribution in human prostatic-carcinoma,” J. Urol. (Baltimore) 151�5�, 1411–1415 �1994�.
27. Q. Chen, B. C. Wilson, S. D. Shetty, M. S. Patterson, J. C. Cerny, andF. W. Hetzel, “Changes in in vivo optical properties and light distri-butions in normal canine prostate during photodynamic therapy,” Ra-diat. Res. 147�1�, 86–91 �1997�.
28. L. K. Lee, C. Whitehurst, M. L. Pantelides, and J. V. Moore, “In situcomparison of 665 nm and 633 nm wavelength light penetration inthe human prostate gland,” Photochem. Photobiol. 62�5�, 882–886�1995�.
29. L. K. Lee, C. Whitehurst, M. L. Pantelides, and J. V. Moore, “Aninterstitial light assembly for photodynamic therapy in prostatic car-cinoma,” BJU Int. 84�7�, 821–826 �1999�.
30. R. A. Weersink, A. Bogaards, M. Gertner, S. R. H. Davidson, K.Zhang, G. Netchev, J. Trachtenberg, and B. C. Wilson, “Techniquesfor delivery and monitoring of TOOKAD �WST09�-mediated photo-dynamic therapy of the prostate: clinical experience and practicali-ties,” J. Photochem. Photobiol., B 79�3�, 211–222 �2005�.
31. T. C. Zhu, J. C. Finlay, and S. M. Hahn, “Determination of the dis-tribution of light, optical properties, drug concentration, and tissueoxygenation in vivo in human prostate during motexafin lutetium-mediated photodynamic therapy,” J. Photochem. Photobiol., B 79�3�,231–241 �2005�.
Journal of Biomedical Optics 014022-1
32. D. R. Doiron, L. O. Svaasand, and A. E. Profio, “Light dosimetry intissue: application to photoradiation therapy,” Appl. Spectrosc. 160,63–76 �1983�.
33. A. Dimofte, J. C. Finlay, and T. C. Zhu, “A method for determinationof the absorption and scattering properties interstitially in turbid me-dia,” Phys. Med. Biol. 50�10�, 2291–2311 �2005�.
34. T. C. Zhu, A. Dimofte, J. C. Finlay, D. Stripp, T. Busch, J. Miles, R.Whittington, S. B. Malkowicz, Z. Tochner, E. Glatstein, and S. M.Hahn, “Optical properties of human prostate at 732 nm measuredduring motexafin lutetium-mediated photodynamic therapy, Photo-chem. Photobiol. 81�1�, 96–105 �2005�.
35. A. H. Barnett, J. P. Culver, A. G. Sorensen, A. Dale, and D. A. Boas,“Robust inference of baseline optical properties of the human headwith three-dimensional segmentation from magnetic resonance imag-ing,” Appl. Opt. 42�16�, 3095–3108 �2003�.
36. C. Abrahamsson, A. Löwgren, B. Strömdahl, T. Svensson, S.Andersson-Engels, J. Johansson, and S. Folestad, “Scatter correctionof transmission near-infrared spectra by photon migration data: quan-titative analysis of solids,” Appl. Spectrosc. 59�11�, 1381–1387�2005�.
37. P. Taroni, A. Torricelli, L. Spinelli, A. Pifferi, F. Arpaia, G. Danesini,and R. Cubeddu, “Time-resolved optical mammography between 637and 985 nm: clinical study on the detection and identification ofbreast lesions,” Phys. Med. Biol. 50�11�, 2469–2488 �2005�.
38. Y. Hoshi, M. Shimada, C. Sato, and Y. Iguchi, “Reevaluation of near-infrared light propagation in the adult human head: implications forfunctional near-infrared spectroscopy,” J. Biomed. Opt. 10�6�,064032 �2005�.
39. T. Svensson, J. Swartling, P. Taroni, A. Torricelli, P. Lindblom, C.Ingvar, and S. Andersson-Engels, “Characterization of normal breasttissue heterogeneity using time-resolved near-infrared spectroscopy,”Phys. Med. Biol. 50�11�, 2559–2571 �2005�.
40. A. Pifferi, A. Torricelli, A. Bassi, P. Taroni, R. Cubeddu, H. Wabnitz,D. Grosenick, M. Moller, R. Macdonald, J. Swartling, T. Svensson, S.Andersson-Engels, R. L. P. van Veen, H. J. C. M. Sterenborg, J. M.Tualle, H. L. Nghiem, S. Avrillier, M. Whelan, and H. Stamm, “Per-formance assessment of photon migration instruments: the MED-PHOT protocol,” Appl. Opt. 44�11�, 2104–2114 �2005�.
41. M. S. Patterson, B. Chance, and B. C. Wilson, “Time resolved reflec-tance and transmittance for the noninvasive measurement of tissueoptical-properties,” Appl. Opt. 28�12�, 2331–2336 �1989�.
42. T. Nakai, G. Nishimura, K. Yamamoto, and M. Tamura, “Expressionof optical diffusion coefficient in high-absorption turbid media,”Phys. Med. Biol. 42�12�, 2541–2549 �1997�.
43. T. Durduran, A. G. Yodh, B. Chance, and D. A. Boas, “Does thephoton-diffusion coefficient depend on absorption?” J. Opt. Soc. Am.A 14�12�, 3358–3365 �1997�.
44. W. Press, S. Teukolsky, W. Vetterling, and B. Flannery, NumericalRecipes in C: The Art of Scientific Computing, 2nd ed., CambridgeUniversity Press, Cambridge �1992�.
45. G. M. Hale and M. R. Querry, “Optical-constants of water in 200-nmto 200-mum wavelength region,” Appl. Opt. 12�3�, 555–563 �1973�.
46. R. L. P. van Veen, H. J. C. M. Sterenborg, A. Pifferi, A. Torricelli, E.Chikoidze, and R. Cubeddu, “Determination of visible near-IR ab-sorption coefficients of mammalian fat using time- and spatially re-solved diffuse reflectance and transmission spectroscopy,” J. Biomed.Opt. 10�5�, 054004 �2005�.
47. S. Prahl, “Optical absorption of hemoglobin,” URL http://omlc.ogi.edu/spectra/hemoglobin/index.html�2006�.
48. J. C. Schotland, J. C. Haselgrove, and J. S. Leigh, “Photon hittingdensity,” Appl. Opt. 32�4�, 448–453 �1993�.
January/February 2007 � Vol. 12�1�0
Copyright © 2022 FDOKUMEN