The Florida State University Hollow Gold Nanosphere Optical Transducers Studied Using Femtosecond...
157
e Florida State University DigiNole Commons Electronic eses, Treatises and Dissertations e Graduate School 4-8-2013 Hollow Gold Nanosphere Optical Transducers Studied Using Femtosecond Time-Resolved Laser Spectroscopy Anne-Marie Dowgiallo e Florida State University Follow this and additional works at: hp://diginole.lib.fsu.edu/etd is Dissertation - Open Access is brought to you for free and open access by the e Graduate School at DigiNole Commons. It has been accepted for inclusion in Electronic eses, Treatises and Dissertations by an authorized administrator of DigiNole Commons. For more information, please contact [email protected]. Recommended Citation Dowgiallo, Anne-Marie, "Hollow Gold Nanosphere Optical Transducers Studied Using Femtosecond Time-Resolved Laser Spectroscopy" (2013). Electronic eses, Treatises and Dissertations. Paper 7357.
Transcript of The Florida State University Hollow Gold Nanosphere Optical Transducers Studied Using Femtosecond...
The Florida State UniversityDigiNole Commons
Electronic Theses, Treatises and Dissertations The Graduate School
4-8-2013
Hollow Gold Nanosphere Optical TransducersStudied Using Femtosecond Time-Resolved LaserSpectroscopyAnne-Marie DowgialloThe Florida State University
Follow this and additional works at: http://diginole.lib.fsu.edu/etd
This Dissertation - Open Access is brought to you for free and open access by the The Graduate School at DigiNole Commons. It has been accepted forinclusion in Electronic Theses, Treatises and Dissertations by an authorized administrator of DigiNole Commons. For more information, please [email protected].
Recommended CitationDowgiallo, Anne-Marie, "Hollow Gold Nanosphere Optical Transducers Studied Using Femtosecond Time-Resolved LaserSpectroscopy" (2013). Electronic Theses, Treatises and Dissertations. Paper 7357.
THE FLORIDA STATE UNIVERSITY
COLLEGE OF ARTS AND SCIENCES
HOLLOW GOLD NANOSPHERE OPTICAL TRANSDUCERS STUDIED USING
FEMTOSECOND TIME-RESOLVED LASER SPECTROSCOPY
By
ANNE-MARIE DOWGIALLO
A Dissertation submitted to the
Department of Chemistry and Biochemistry
in partial fulfillment of the
requirements for the degree of
Doctor of Philosophy
Degree Awarded:
Spring Semester, 2013
ii
Anne-Marie Dowgiallo defended this dissertation on March 15, 2013.
The members of the supervisory committee were:
Kenneth L. Knappenberger, Jr.
Professor Directing Dissertation
James Brooks
University Representative
Naresh Dalal
Committee Member
Geoffrey F. Strouse
Committee Member
The Graduate School has verified and approved the above-named committee members, and
certifies that the dissertation has been approved in accordance with university requirements.

iii
I dedicated this to my Uncle Billy
iv
ACKNOWLEDGEMENTS
As I conclude my graduate career in chemistry with the completion of this dissertation, I
would like to thank everyone that contributed to my growth and success these past five years. In
particular, I would like to thank my younger sister Jackie for being one of my biggest support
systems. Even though you were living far away in D.C., I knew you were always only a phone
call away and we talked all the time about everything. When you moved to Tallahassee, I was so
happy that I got to live with you, even if it was only for a short time. I seriously could not have
done this without you. Thank you for always encouraging me to achieve my goals no matter
what. Special thanks to my parents for providing me with love and support throughout my years
in college and graduate school. Dad, I would not have an interest in science if it wasn’t for you.
Thank you for instilling a passion in me for learning about science and nature. Your advice about
everything has allowed me to be where I am today and I am eternally grateful for that. Thank
you Mom for always being supportive of me no matter what I wanted to do in life, and
encouraging me to just be myself. You told me when I was younger “dare to be different” and I
have always lived by that. Thank you to my sisters Karin and Carolyn, my grandparents, Nancy
and Bill Piechota, my Aunt Laurie, Uncle Kurt, Aunt Jackie, Uncle Jeff, and Aunt Louise for all
of your encouragement and support throughout my college and graduate school years. Finally I
would like to thank the rest of my extended family.
To my major advisor, Dr. Kenneth L. Knappenberger, Jr., thank you for all of your
support and guidance during these past five years. You have been extremely supportive of my
goals and aspirations since the first day I walked into your office, and I couldn’t be more grateful
for that. Your passion for science and research is inspiring, and I thank you for taking the time to
work with me one-on-one in the lab so that I could develop my own passion for ultrafast lasers
v
and spectroscopy. Thank you for being patient with me and extremely helpful when I would
practice my presentations over and over with you. Also, thank you for giving me the opportunity
to travel to many different conferences. The ACS meeting in San Francisco was remarkable in
terms of the latest research being done in chemistry, and I am thankful I had you as an expert
tour guide to explore that beautiful city!
I would also like to acknowledge my committee members Dr. Naresh Dalal, Dr. Geoffrey
Strouse, and Dr. James Brooks. Thank you Dr. Dalal for your insightful lessons in quantum
mechanics during my second year at FSU. Thank you Dr. Strouse and Dr. Brooks for all of your
invaluable help and guidance during my time as a graduate student. Special thanks to Dr. Rafael
Bruschweiler for being another valuable mentor and teacher while I was at FSU. Your course on
thermodynamics was the first class I had as a graduate student, and that experience made me
realize I was in the right place to further my studies in chemistry. Also thank you to Dr. David
Gormin for being very patient with me when I taught physical chemistry laboratory for the first
time. You made the teaching assistant experience very worthwhile, and I looked forward to
coming to lab every day.
Last but not least, I would like to thank my group members Manabendra, Lenzi, Tom,
Jeremy, Casey, Daniel, Andrew, Chongyue, Domllermut, and Pat. Thank you for coming to
every practice talk I gave and giving me invaluable advice and feedback. Thank you Manabendra
for teaching me how to do second harmonic generation experiments and dark field microscopy.
Lenzi, best of luck to you with continuing my iron porphyrin project, I hope the things I taught
you about hollow gold nanospheres and Raman spectroscopy help you in your future research.
Thank you all for being supportive group members and friends and I wish the best of luck to all
of you in the future.
vi
TABLE OF CONTENTS
List of Tables ................................................................................................................................. ix
List of Figures ..................................................................................................................................x
Abstract ....................................................................................................................................... xvii
1. INTRODUCTION ...................................................................................................................1
1.1 Characteristics and Significance of Hollow Gold Nanospheres ....................................1
1.2 Analysis of Hollow Gold Nanospheres..........................................................................4
1.3 Overview of the Dissertation Study ...............................................................................5
1.4 Description of the Dissertation Chapters .......................................................................7
2. EXPERIMENTAL METHODS ..............................................................................................9
2.1 Nanoparticle Synthesis And Characterization ...............................................................9
2.1.1 Hollow Gold Nanoparticle Synthesis.................................................................9
2.1.2 Solid Gold Nanoparticle Synthesis ..................................................................12
2.1.3 Characterization Tools .....................................................................................13
2.1.4 Aggregation Techniques ..................................................................................14
2.2 Femtosecond Transient Extinction Spectroscopy ........................................................15
2.2.1 Data Fitting Routine .........................................................................................16
3. STRUCTURE-DEPENDENT COHERENT ACOUSTIC VIBRATIONS OF HOLLOW
GOLD NANOSPHERES ...............................................................................................................18
3.1 Introduction ..................................................................................................................18
3.2 Materials and Methods .................................................................................................19
3.2.1 Coherent Data ..................................................................................................19
3.3 Results and Discussion ................................................................................................20
3.3.1 Transient Extinction of HGNs .........................................................................20
3.3.2 Residuals and Fourier Transformations ...........................................................23
3.3.3 Vibrational Frequencies ...................................................................................25
3.3.4 Oscillation Phase ..............................................................................................26
3.3.5 Electron-Phonon Coupling...............................................................................28
3.4 Conclusions ..................................................................................................................30
4. ULTRAFAST ELECTRON-PHONON COUPLING IN HOLLOW GOLD
NANOSPHERES ...........................................................................................................................31
4.1 Introduction ..................................................................................................................31
4.2 Materials and Methods .................................................................................................34
4.2.1 HGN and SGN Samples...................................................................................34
4.2.2 Two-Temperature Model .................................................................................37
4.3 Results and Discussion ................................................................................................38
4.3.1 Electron-Phonon Coupling of HGNs ...............................................................38
4.3.2 Size Dependence ..............................................................................................41
4.3.3 Solvent Dependence ........................................................................................46
4.4 Conclusions ..................................................................................................................48
vii
5. INFLUENCE OF CONFINED FLUIDS ON NANOPARTICLE-TO-SURROUNDINGS
ENERGY TRANSFER ..................................................................................................................49
5.1 Introduction ..................................................................................................................49
5.2 Materials and Methods .................................................................................................52
5.3 Results and Discussion ................................................................................................54
5.3.1 Phonon-Phonon Coupling in HGNs.................................................................54
5.3.2 Energy Transfer Mechanisms ..........................................................................59
5.3.3 Interfacial Thermal Conductance of HGNs .....................................................61
5.3.4 Solvent Dependence.........................................................................................64
5.4 Conclusions ..................................................................................................................67
6. INTERPARTICLE ELECTROMAGNETIC COUPLING ENHANCEMENT IN HOLLOW
GOLD NANOSPHERE AGGREGATES .....................................................................................68
6.1 Introduction ..................................................................................................................68
6.2 Materials and Methods .................................................................................................70
6.2.1 Aggregation Techniques ..................................................................................70
6.2.2 Characterization Tools .....................................................................................70
6.2.3 Computational Methods ...................................................................................74
6.3 Electronic Relaxation Dynamics in HGN Aggregates .................................................75
6.3.1 Linear Absorption Spectral Changes ...............................................................75
6.3.2 Transient Extinction of HGN Aggregates........................................................77
6.4 Controlled SPR Properties of HGN Aggregates ..........................................................80
6.4.1 Thiol-Induced Aggregation of HGNs ..............................................................81
6.4.2 SPR Spectra and Electric Field Simulations ....................................................87
6.4.3 Cysteine-Induced Aggregation ........................................................................90
6.4.4 Ethanedithiol-Induced Aggregation .................................................................92
6.5 Conclusions ..................................................................................................................94
7. GOLD NANOPARTICLE AND IRON PORPHRYIN INTERACTION ............................96
7.1 Introduction ..................................................................................................................96
7.2 Materials and Methods .................................................................................................97
7.2. Aggregation Using FeTMPyP..........................................................................97
7.2.2 Raman Spectroscopy ........................................................................................97
7.3 FeTMPyP-Induced Aggregation of HGNs and SGNs .................................................99
7.3.1 Linear Extinction Measurements .....................................................................99
7.3.2 SERS of FeTMPyP ........................................................................................101
7.4 Conclusions ................................................................................................................104
8. CONCLUSIONS AND FUTURE WORK ..........................................................................105
APPENDICES .............................................................................................................................107
A. HGN AND SGN SIZE DISTRIBUTIONS .............................................................................107
B. HGN AGGREGATE SIZE DISTRIBUTIONS ......................................................................112
C. COPYRIGHT PERMISSION INFORMATION ....................................................................114

viii
REFERENCES ............................................................................................................................122
BIOGRAPHICAL SKETCH .......................................................................................................135
ix
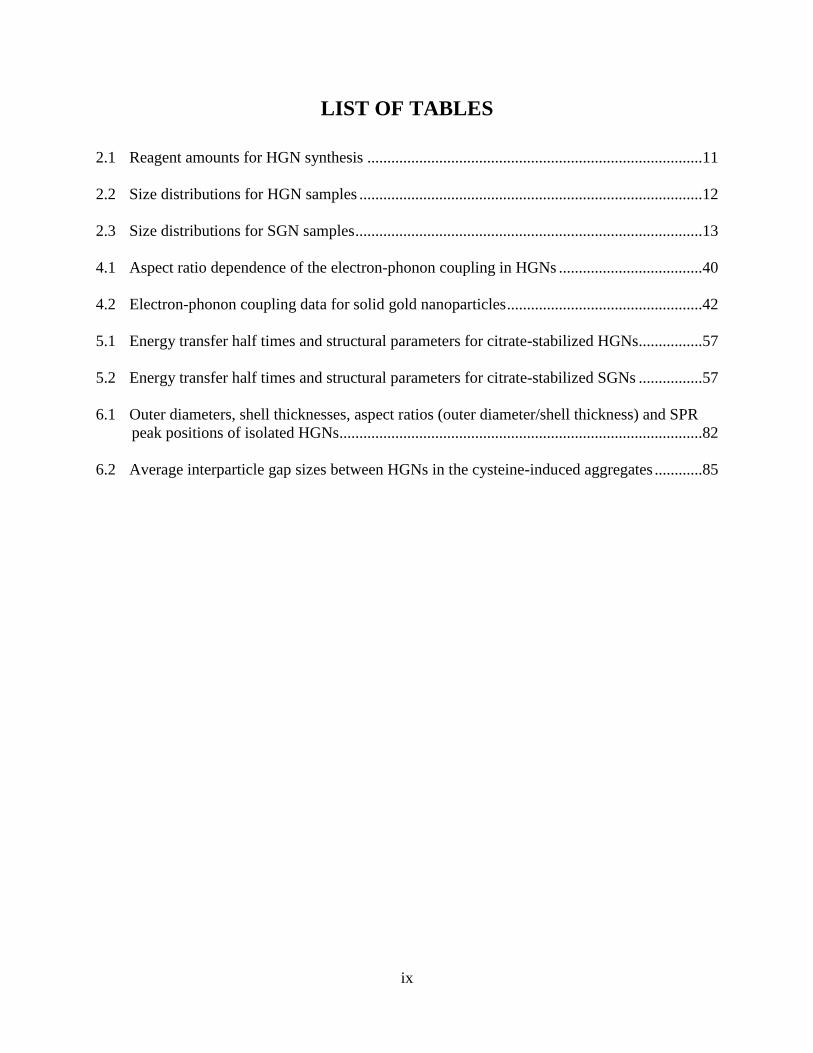
LIST OF TABLES
2.1 Reagent amounts for HGN synthesis ....................................................................................11
2.2 Size distributions for HGN samples ......................................................................................12
2.3 Size distributions for SGN samples .......................................................................................13
4.1 Aspect ratio dependence of the electron-phonon coupling in HGNs ....................................40
4.2 Electron-phonon coupling data for solid gold nanoparticles .................................................42
5.1 Energy transfer half times and structural parameters for citrate-stabilized HGNs ................57
5.2 Energy transfer half times and structural parameters for citrate-stabilized SGNs ................57
6.1 Outer diameters, shell thicknesses, aspect ratios (outer diameter/shell thickness) and SPR
peak positions of isolated HGNs...........................................................................................82
6.2 Average interparticle gap sizes between HGNs in the cysteine-induced aggregates ............85
x
LIST OF FIGURES
2.1 UV-Visible extinction spectra for various HGN samples. The SPR spectral position shifted
to longer wavelengths as the aspect ratio increased ..............................................................13
2.2 TEM images of (a) low aspect ratio HGNs (HGN-2), and (b) high aspect ratio HGNs
(HGN-5). The scale bar applies to both images ....................................................................14
2.3 Laser table layout for femtosecond transient extinction experiments ...................................16
3.1 Two-dimensional transient extinction image plot of the 40 nm OR, R1/R2 = 0.75 HGN
following 400 nm excitation .................................................................................................21
3.2 (a) Transient extinction spectrum acquired for the HGN with R1/R2 aspect ratio of 0.75. The
spectrum was recorded at a pump-probe delay of 1.5 ps following excitation by 400-nm
light. (b) The oscillatory data obtained from temporal integration at the wavelengths
denoted by the vertical lines, 585 nm (blue) and 695 nm (red) from (a) ..............................21
3.3 SPR peak position (black) and spectral width (red) of the R1/R2 = 0.75 HGN plotted as a
function of pump-probe time delay. The period of the SPR fluctuations is about 65 ps,
which is consistent with the oscillations observed in Figure 3.2b ........................................22
3.4 Coherent portion of the transient extinction signal for samples (a) HGN-3, R1/R2=0.38, (b)
HGN-2, R1/R2=0.46 and (c) HGN-13, R1/R2=0.75 ...............................................................23
3.5 Fourier transformation of transient extinction time-domain data for a series of HGNs. The
outer radii were (a) 10, (b) 15, (c) 25, (d) 28, and (e) 40 nm ................................................24
3.6 Summary of coherent acoustic vibration frequencies. (a) The high-frequency mode for a
series of low-aspect ratio HGNs is plotted as a function of the inverse particle outer radius
(open circles). Results from SGNs are included for comparison (filled circles). (b) The low-
frequency vibration measured for high-aspect ratio HGNs is plotted as a function of the
inverse particle outer radius ..................................................................................................26
3.7 Modulated portion of the HGN transient extinction signal for an HGN with R1/R2 = 0.75
(outer radius = 40 nm) along with the fit obtained using the phenomenological response
function given above .............................................................................................................27
4.1 (a) UV-Visible extinction spectra for HGN samples studied here. The SPR spectral position
shifted to longer wavelengths as the aspect ratio increased from 3.5 (HGN-2) to 9.5 (HGN-
15). TEM images of (b) low-aspect ratio HGNs (HGN-5) and (c) high-aspect ratio HGNs
(HGN-15). The scale bar applies to both images ..................................................................35
4.2 UV-visible extinction for solid gold nanoparticle samples SGN-2, SGN-4, and SGN-7 .....36
xi
4.3 TEM images of the solid gold nanoparticle samples used in this study: (a) SGN-2, (b) SGN-
4, and (c) SGN-7, having diameters of approximately 20, 40, and 80 nm, respectively ......36
4.4 (a) Differential extinction for sample J (diameter = 53 ± 11 nm, shell thickness = 5.7 ± 1.0
nm, and aspect ratio = 9.5 ± 2.1) after excitation with 400-nm laser pulses of 90-fs duration
at zero time delay. The dashed line is located at zero differential amplitude as a guide for
the eye. (b) Bleach recovery kinetics observed at the maximum of the SPR band (630 nm
for sample J) for a series of different laser pulse intensities. The raw data (●) were fit to a
bi-exponential decay (—). Higher laser powers gave rise to longer lifetimes ......................39
4.5 Relaxation times determined for the electron–phonon coupling step when different laser
pulse energies were used to excite the sample. The two-temperature model was used to
obtain the zero-point electron–phonon coupling time from the y-intercept of the linear fit
for HGN-2 (squares), HGN-8 (circles), and HGN-12 (triangles). Higher aspect ratio HGNs
exhibited more rapid electron–phonon relaxation ................................................................40
4.6 (a) The room-temperature zero-point electron–phonon coupling times for HGNs (open
circles) and SGNs (closed circles) as a function of aspect ratio and inverse radius,
respectively. (b) The corresponding electron–phonon coupling constants (G) for HGNs and
SGNs, also as a function of aspect ratio and inverse radius, respectively. The coupling
constant was calculated from the room-temperature zero-point electron–phonon coupling
time t0 using t0 = γT0/G (g = 66 J m-3
K-2
for gold and T0=298 K). In both figures, the
dotted line is located at the average value for t0 and G of HGN-2, HGN-4, and HGN-6 and
SGN-2, SGN-4, and SGN-7, at 1.08 ps and 1.84 x 10¹⁶
W m-3
K-1
, respectively. In addition,
a linear fit was applied to the t0 and G values for HGN-7, -8, and 11-15 .............................42
4.7 Electron–phonon coupling constants, G, as a function of the total surface area (a) and total
volume (b) of HGNs (samples 2, 5-8, and 11-15) ................................................................45
4.8 Electron–phonon coupling constants, G, as a function of the HGN surface to volume ratio
(total surface area/total volume). The solid line is a linear fit to the data .............................46
4.9 Electron-phonon coupling times as a function of the laser pulse energy for HGN-12 in
water (circles) and methanol (triangles). The room-temperature zero-point electron–phonon
coupling time (or the y-intercept) was 690 and 770 fs in water and methanol, respectively.47
4.10 Electron–phonon relaxation times as a function of the laser pulse energy for HGN-14
dispersed in water (solid circles) and in methanol (solid triangles). The room-temperature
zero-point electron–phonon coupling time (or the y-intercept) was 650 and 990 fs in water
and methanol, respectively....................................................................................................47
5.1 Normalized extinction spectra for select HGN samples used in this chapter. The SPR
maximum wavelength ranges from 550 to 710 nm with increasing outer-diameter-to-shell-
thickness aspect ratio ............................................................................................................52
xii
5.2 Representative TEM images of sample HGN-5 (a) and corresponding EDS data (b). The
scale bar in part a is 20 nm. The images and EDS data indicated that the structures were
composed of a gold shell and a hollow cavity. Cu peaks in panel b arose from the sample
grid and were not indicative of sample contamination .........................................................53
5.3 (a) Spectrally resolved transient extinction spectra of HGN-5. The data were recorded at a
pump−probe time delay of 5 ps following excitation by a 400-nm laser pulse (500
nJ/pulse). (b) Temporally resolved extinction data obtained by monitoring the spectrum
shown in panel a at a probe wavelength of 610 nm (center wavelength of bleach). The
experimental data are plotted along with the best fit to the data, obtained using equation 1.
The dashed vertical line in panel b provides a guide to the point at which the data reflect
nanoparticle-to-surroundings energy transfer kinetics ..........................................................55
5.4 Nanoparticle-to-surroundings energy transfer half times (τET) of HGNs plotted as a function
of their total surface area. These HGNs have cavity radii ranging from 3.3 to 27.5 nm, shell
thicknesses from 5 to 11 nm, and aspect ratios from 3 to 9. The data exhibited behaviors
that were categorized in two classes: HGNs with cavity radii <15 nm and those with cavity
radii ≥15 nm. The data point corresponding to a 15-nm HGN cavity radius is denoted by an
arrow. In both cases, the τET half time was linearly dependent on the total surface area. A
linear fit to the data collected for HGNs with small cavities yielded γ = 20 ± 4 fs/nm2; γ =
65 ± 5 fs/nm2 was obtained for large cavities. x-Axis error bars were determined based on
the outer and inner diameters from TEM images of several particles, and assume uniform
HGN shells. (b) Nanoparticle-to-surroundings energy transfer half times of SGNs as a
function of their total surface area. The τET relaxation time is linearly dependent on the
surface area, with a γ value of 62 ± 3 fs/nm2 ........................................................................58
5.5 HGN (○) and SGN (●) energy transfer half times (τET) plotted as a function of HGN shell
thickness, or SGN radius. The experimental half times are plotted along with calculated
size-dependent interfacial thermal conductivities, G. The values for G were obtained using
equation 8, and bulk values obtained from reference 109 ....................................................61
5.6 Nanoparticle-to-surroundings energy transfer relaxation kinetics obtained for HGN-10. The
raw differential extinction data (black) is plotted along with the result from a two-
component exponential decay (red). The bleach data was inverted for clarity ....................64
5.7 Comparison of the time-resolved extinctions obtained for SGN-5 dispersed in water (black
trace) and methanol (red trace). The raw data reflected a slower transient bleach recovery
for gold nanospheres dispersed in methanol than for those dispersed in water ....................65
5.8 (a) Summary of the energy transfer half times obtained for HGN-5 dispersed in water or
methanol at several excitation pulse energies. The data reflected an increase of τET by a
factor of ∼2.5. (b) Summary of τET for SGN-1 dispersed in methanol or water at several
excitation pulse energies. The data reflected a 3-fold increase in the energy transfer half
time .......................................................................................................................................66
xiii
6.1 Extinction spectra recorded for HGN-5 as an isolated (black) and aggregated (blue) species.
Aggregation was achieved by adding KCl to the HGN-5 aqueous suspension ....................71
6.2 UV-Visible absorption spectra of isolated (black) and aggregated (red) solid gold
nanospheres that an outer diameter of 50 nm. Upon aggregation using a KCl solution, the
SPR band of the isolated SGNs broadens and a new longitudinal band appears at redder
wavelengths, consistent with previous findings.104,105
..........................................................71
6.3 HRTEM image of different regions of HGN-5 aggregates. The images show surface
necking occurring to various degrees, and also that the particles remain hollow .................72
6.4 Dynamic Light Scattering measurements of isolated HGN-5 sample (black) and their
aggregates (red) .....................................................................................................................73
6.5 EDS data for two (a) and several (b) hollow gold nanospheres in the HGN-5 aggregate.
Copper is from the sample grid. The EDS data indicate the aggregates are free of oxides ..74
6.6 Electron diffraction pattern from several hollow gold nanospheres in the HGN-5 aggregate75
6.7 Normalized extinction spectra for isolated and aggregated HGN-10. A noticeable shift of
the SPR λmax to bluer wavelengths is observed upon aggregation ........................................76
6.8 (a) Femtosecond transient extinction spectra of isolated (red) and aggregated (blue) hollow
gold nanoparticles. The nanospheres were excited with a 400 nm pump (500 nJ/pulse) and
probed at 500 fs time delay with a white-light continuum probe. The aggregate spectrum is
clearly blue-shifted with respect to that of the isolated HGN sample. (b) Kinetic traces
resulting from temporal integration of transient extinction bleach from (a) for HGN (red)
and HGN aggregates (blue). The HGN bleach recovery is much slower for the aggregate
system ...................................................................................................................................77
6.9 Electron-phonon coupling relaxation times as a function of relative pump pulse energy for
both isolated (●) and aggregated (○) HGN samples. A linear fit was applied to each set of
data to determine the zero-point electron-phonon coupling time, τel-ph, which is the y-
intercept. The HGN aggregates exhibit a longer electron-phonon coupling lifetime
compared to isolated HGNs and begins to approach bulk values .........................................78
6.10 (a) Femtosecond transient extinction kinetic traces of 50 nm solid gold nanospheres probed
at 520 nm following 405 nm excitation. The excitation pulse energies are: 0.1 μJ/pulse
(blue), 0.2 μJ/pulse (black) and 1 μJ/pulse (red). (b) Electron-phonon relaxation times
plotted as a function of relative excitation pulse energy. The y-intercept from the linear fit
corresponds to the zero-point electron-phonon coupling lifetime for 50 nm SGNs, 770 ±
150 fs .....................................................................................................................................79
6.11 Experimental extinction spectra of isolated HGN and cysteine and ethanedithiol-induced
HGN aggregates. The dashed lines are located at the center of the extinction peaks. A
distinct blue shift of the SPR for HGNs having shell thickness <7 nm (a,b) occurred upon
xiv
ethanedithiol addition. However for HGNs with shell thickness >7 nm (c,d), only a small
red shift or no peak shift occurred after ethanedithiol addition. The insets show the same
spectra normalized at the respective SPR maxima to show the peak shift more clearly ......82
6.12 Cysteine-induced (A) and ethanedithiol-induced (B) aggregates of HGN-6. The scale bars
correspond to 50 nm. In the cysteine-induced aggregates, distinct gaps can be seen and
were usually about 1 nm wide. On the other hand, ethanedithiol-induced aggregates usually
formed small dimers or trimers and showed little to no interparticle gap ............................83
6.13 Absorption spectra of HGN-13 (a), 15 (b), 16 (c), and 17 (d) formed by low concentration
addition of cysteine (2 μL of 5 mM cysteine) .......................................................................84
6.14 Probable hydrogen-bonding scheme of the cysteine-induced HGN aggregates (not to scale) 85
6.15 FTIR spectra of cysteine and cysteine induced aggregates of HGN-15. Absence of SH
stretching vibrational mode at 2564 cm-1
in the spectrum of aggregates suggest that
cysteine is attached to the gold surface by Au−S linkage .....................................................86
6.16 Simulated absorption spectra using FDTD calculations of an HGN having an outer diameter
of 53 nm and shell thickness of (a) 5 nm and (b) 8 nm. These results are similar to the
experimental results presented in Figure 6.11 b (HGN-17) and d (HGN-8). .......................87
6.17 The normalized peak shift (Δλ/λ0) as a function of HGN shell thickness. Panel (a) shows the
experimentally determined values for ethanedithiol-induced HGN aggregates. Panel (b)
shows the FDTD simulated results for HGN dimers (outer diameter of 53 nm) in contact. 88
6.18 Simulated electric field maps using FDTD calculations for various shell thicknesses: from
left to right in each panel, 5, 7, and 10 nm. The outer diameter of the HGNs was fixed at 53
nm for each panel. The top panels are for an isolated HGN, the middle panels are for HGNs
dimers in contact, and the bottom panels are for HGN dimers that are separated by 5 nm ..89
6.19 Simulated SPR peak shift (red shift Δλ for spatially separated dimers divided by the SPR
maximum of the isolated particle, λ0) as a function of interparticle gap to outer diameter
ratio (D/d) for HGN-6. The decay constant (t) value is consistent with that of similarly
sized solid gold nanospheres .................................................................................................91
6.20 Schematic of a stable charge-transfer plasmon where the incident electromagnetic field is
polarized parallel to the interparticle axis of the hollow gold nanospheres. The distance
between the two cavities is given by D .................................................................................93
7.1 Normalized extinction spectra for isolated SGNs (black) and FeTMPyP-induced SGN
aggregates (red). The changes occurring following aggregation include a slight red-shift of
the transverse SPR band to 535 nm and a new red-shifted band at 820 nm .........................99
xv
7.2 Normalized extinction spectra for isolated HGNs (black) and FeTMPyP-induced HGN
aggregates (red). The SPR band of the isolated HGNs red-shifts slightly to 557 nm and
another red-shifted peak occurs at 685 nm .........................................................................100
7.3 Surface-enhanced Raman spectra of FeTMPyP in the presence of SGN-5 aggregates (black)
and 2.5 x 10⁻⁷
M FeTMPyP (red). The solutions were excited using a 785 nm laser. The
peaks are labeled according to reported Raman bands for FeTMPyP ................................101
7.4 Surface-enhanced Raman spectra of FeTMPyP in the presence of HGN aggregates. The
solutions were excited using a 633 nm laser. The peaks are labeled according to reported
Raman bands for FeTMPyP ................................................................................................102
A.1 Size distributions for HGN-1 having d = 16.6 ± 2.9 nm, t = 5.0 ± 1.2 nm, AR = 3.4 ± 0.6,
and R1/R2 = 0.40 ± 0.08 ......................................................................................................107
A.2 Size distributions for HGN-2 having d = 29.9 ± 6.2 nm, t = 8.5 ± 2.2 nm, AR = 3.5 ± 0.6,
and R1/R2 = 0.46 ± 0.1 ........................................................................................................107
A.3 Size distributions for HGN-4 having d = 27.9 ± 3.2 nm, t = 6.3 ± 1.3 nm, AR = 4.4 ± 2.1,
and R1/R2 = 0.56 ± 0.07 ......................................................................................................107
A.4 Size distributions for HGN-5 having d = 51.1 ± 5.1 nm, t = 10.0 ± 1.0 nm, AR = 5.1 ± 0.6,
and R1/R2 = 0.61 ± 0.05 ......................................................................................................108
A.5 Size distributions for HGN-6 having d = 31.2 ± 4.6 nm, t = 6.3 ± 2.1 nm, AR = 5.4 ± 1.5,
and R1/R2 = 0.60 ± 0.10 ......................................................................................................108
A.6 Size distributions for HGN-7 having d = 50.7 ± 8.9 nm, t = 8.2 ± 2.2 nm, AR = 6.5 ± 1.3,
and R1/R2 = 0.68 ± 0.15 ......................................................................................................108
A.7 Size distributions for HGN-8 having d = 54.6 ± 12.5 nm, t =8.6 ± 2.9 nm, AR = 6.7 ± 1.8,
and R1/R2 = 0.67 ± 0.08 ......................................................................................................108
A.8 Size distributions for HGN-10 having d = 77.9 ± 5.5nm, t = 11.3 ± 2.2nm, AR = 6.9 ± 1.2,
and R1/R2 = 0.75 ± 0.05 ......................................................................................................109
A.9 Size distributions for HGN-11 having d = 46.7 ± 8.5 nm, t = 7.0 ± 2.1 nm, AR = 7.2 ± 2.1,
and R1/R2 = 0.70 ± 0.16 ......................................................................................................109
A.10 Size distributions for HGN-12 having d = 53.2 ± 7.2 nm, t = 7.1 ± 1.7 nm, AR = 7.8 ± 1.6,
and R1/R2 = 0.73 ± 0.12 ......................................................................................................109
A.11 Size distributions for HGN-13 having d = 54.8 ± 12.2 nm, t = 6.9 ± 1.6 nm, AR = 8.3 ± 2.3,
and R1/R2 = 0.74 ± 0.07 ......................................................................................................109
xvi
A.12 Size distributions for HGN-14 having d = 52.2 ± 8.0 nm, t = 5.9 ± 1.0 nm, AR = 9.0 ± 1.6
and R1/R2 = 0.77 ± 0.17 ......................................................................................................110
A.13 Size distributions for HGN-15 having : d = 53.3 ± 10.5 nm, t = 5.7 ± 1.0 nm, AR = 9.5 ±
2.1, and R1/R2 = 0.78 ± 0.05 ...............................................................................................110
A.14 Size distributions for SGN samples: (a) SGN-2, d = 19.8 3.7 nm, (b) SGN-4, d = 37.7
3.3 nm, and (c) SGN-7, d = 83.3 7.5 nm .........................................................................110
A.15 Size distributions for SGN samples: (a) SGN-1, d = 18.3 2.0 nm, (b) SGN-3, d = 25.4
4.2 nm, (c) SGN-5, d = 38.4 4.2 nm ................................................................................110
A.16 Size distribution for SGN-6, d = 59.8 7.8 nm ..................................................................111
B.1 Ethanedithiol-induced HGN aggregate distributions for HGN-2, HGN-6, HGN-13, HGN-
15, HGN-16, and HGN-17. The occurrence of each type of aggregate (i.e. monomer, dimer,
trimer, etc.) was plotted as a histogram up until aggregates comprising 8 HGNs ..............112
B.2 Ethanedithiol-induced HGN aggregate distributions for HGN-8. The occurrence of each
type of aggregate (i.e. monomer, dimer, trimer, tetramer, etc.) was plotted as a histogram
up until aggregates comprising 8 HGNs .............................................................................113
xvii
ABSTRACT
This dissertation presents and evaluates the unique interplay between nanoparticle
structure, environment, and electronic energy relaxation. This knowledge will provide useful
information for tailoring nanoparticle properties so that they can be applied to the development
of more efficient transducers, such as a light-harvesting antenna. In particular, plasmonic gold
nanoparticles have been synthesized, both hollow (HGNs) and solid (SGNs), and their structural
properties have been characterized using transmission electron microscopy (TEM), energy
dispersive spectroscopy (EDS), dynamic light scattering (DLS), and UV/Vis absorption
spectrophotometry. Femtosecond pump-probe transient extinction experiments have been
conducted on both isolated and aggregated HGNs and SGNs in order to elucidate their electronic
energy relaxation properties. While studying how aggregated nanostructures influence optical
and electronic properties, an unexpected spectral blue-shift of the surface plasmon resonance
(SPR) was observed upon aggregation of HGNs using a salt solution, which led to longer
electronic energy relaxation times compared to isolated HGNs. These findings were significant
because previous studies have found that SGNs red-shift upon aggregation and have faster
electronic energy relaxation times. In order to understand further the nature of the blue shift in
HGN aggregates, alkane-thiols were used to induce the aggregation, where it was found that at a
critical thickness of the HGN shell, the SPR blue-shifts due to the interaction of the electric
fields within the hollow cavities of the nanoparticles. These alkane-thiol ligands provide for
more controlled aggregation over the interparticle gap than other aggregating agents such as
potassium chloride salt. Transient extinction experiments at high pulse energies were conducted
to learn about the modulation in the SPR frequency of HGNs following excitation by a
femtosecond laser pulse. The oscillation frequency and phase were determined for a wide range
xviii
of HGN sizes, revealing a size-dependent excitation mechanism of the vibrational modes. In
addition, transient extinction experiments were carried out at low pulse energies in order to
determine the electron-phonon coupling times for a wide range of sizes of HGN and SGN
samples. As the aspect ratio of the HGN increases, the electron-phonon coupling time decreases
(or the electron-phonon coupling increases), whereas for SGNs, the electron-phonon coupling
remains constant with increasing diameter. The electron-phonon coupling enhancement exhibited
by high aspect ratio HGNs was attributed to the large surface to volume ratio of these structures,
which results in non-negligible contributions from their environment. Finally, the phonon-
phonon coupling properties of HGNs were investigated, which is the last step in electronic
energy relaxation in metal nanoparticles. This study revealed that fluids confined to the hollow
core of HGNs have different properties compared to their bulk counterparts, thereby influencing
the particle-to-surroundings energy transfer rates. Hence, the cavity influences the electronic and
mechanical properties of the HGNs. The structural, optical, and electronic studies on the
aforementioned types of metal nanoparticles provide the basis to understand how the surface
plasmons influence light absorption in a nearby molecule. Specifically, how the surface
plasmons of HGNs and their aggregates interact with the discrete electric-dipole transitions of
iron porphyrin molecules. Surface-enhanced Raman spectroscopy (SERS) of iron porphyrin
molecules near SGN and HGN aggregate surfaces was employed to understand the interaction
between the strong electric fields of HGNs and molecular electronic transitions.
1
CHAPTER ONE
INTRODUCTION
1.1 Characteristics and Significance of Hollow Gold Nanospheres
Hollow gold nanospheres (HGNs) have the potential to be used as more efficient optical
transducers, such as light-harvesting antennas. The dimensions of these high surface-to-volume
ratio structures can be used to tailor the efficiency of the conversion from the initial electronic
energy to thermal energy. The nanoparticle structure and surrounding environment of HGNs
significantly influence electronic energy relaxation in these particles, where HGNs exhibit more
efficient electronic energy relaxation than solid gold nanospheres (SGNs). In addition, as
broadband optical antennas, the strong electric field near the surface of the HGNs could lead to
coupling between energy levels in a nearby molecule. The surface plasmon resonance (SPR)
phenomenon exhibited by noble metal nanoparticles can provide selective enhancement of
molecular spectroscopies such as surface-enhanced Raman spectroscopy (SERS)6 and metal-
enhanced fluorescence (MEF).7-9
The SPR is an extremely short-lived species on the order of a
few femtoseconds; hence, the SPR has been utilized as a probe to study longer events on the
picosecond time scale, such as electronic energy relaxation. The electronic energy relaxation
steps that will be described for metal nanostructures are the coherent vibrational resonances,
electron gas-to-metal lattice energy transfer, and lattice-to-solvent energy transfer. These energy
relaxation steps have been well characterized for solid gold nanoparticles, but making the
nanoparticle hollow leads to significant differences. The hollow gold nanosphere is a unique
nanostructure that contains a gold shell and a fluid dielectric core.10-14
The frequency of the SPR
observed for HGNs can be tuned from the visible to the near-IR by altering the structure’s aspect
2
ratio, which can be defined as the ratio of the outer diameter-to-shell thickness. This wide range
of tunability is not observed for solid gold nanospheres. The tunability of the SPR and the high
electron temperatures obtained upon excitation of metals using ultrafast laser pulses15-19
make
HGNs potential materials for use as efficient photothermal therapy agents. In addition, they
possess structure dependent vibrations which could allow them to function as nanomechanical
resonators for ultrasensitive chemical sensing.20,21
HGNs exhibit additional properties that differ from those of solid gold nanospheres. For
example, HGNs exhibit first hyperpolarizabilities that are three times larger than the values
determined for comparably sized SGNs, suggesting that HGNs could be highly useful for
nonlinear optical applications.13
Similarly, increased surface-enhanced Raman scattering by
HGNs over SGNs has been reported by Zhang and co-workers.18
The mechanical properties of
HGNs also differ from those of SGNs; the coherent acoustic oscillations of HGNs exhibit a
longer period compared to SGNs.23–25
Examination of a comprehensive range of particle sizes
demonstrated that the isotropic coherent acoustic vibrations of HGNs are structure dependent.25
In addition, interparticle HGN plasmon resonances are heavily affected by the interior (cavity)
surface, resulting in a blue shift of the SPR resonance rather than the red shift common to SGN
aggregates.11,12
However, the properties of the fluids confined to the nanoscale dimensions of the
HGN interior cavity, and their influence on HGN optical, mechanical, and electronic relaxation
properties, remain unclear. Finally, electron–phonon coupling rates observed for isolated HGNs
are faster (fastest time being 0.59 ± 0.08 ps) to than those seen for HGN aggregates or SGNs
(average value, 1.08 ± 0.08 ps).11
The high surface-to-volume ratio of HGNs leads to more
efficient electron-phonon coupling in these structures. The latter property may significantly
3
impact technologies depending on metal-interface energy transfer, such as nanoelectronics and
photothermal therapy.
The process of nanoparticle-to-surroundings energy transfer in HGNs can enhance the
efficiency of several applications such as micro/nanoelectronics,26
material processing,27
photodynamic therapy,28
and electromagnetic energy transport through patterned nanoparticle
networks.29
The nanostructure synthesis and fabrication techniques currently available allows for
the production of particles over a vast range of sizes and morphologies, which can be exploited
to tune particle-to-environment energy transfer rates.1−5,30
Structure-dependent energy transfer
rates of HGNs were quantified using femtosecond time-resolved transient extinction
spectroscopy, which is a reliable experimental diagnostic for studying the rapid electronic energy
relaxation mechanisms of metal nanostructures.31-34
When HGNs are aggregated, they have the potential to contribute to three-dimensional
photon delivery in nanoscale devices.35
The near-field coupling that takes place in plasmonic
nanoparticle aggregates provides a nanostructured waveguide to promote the coherent
propagation of electromagnetic radiation.11
The combination of facile laboratory
synthesis1,10,15,16,36
and elegant “superstructure” assembly techniques37-42
has stimulated
expectations of superior products in fields such as photovoltaics,43,44
biological labels,45,46
nonlinear optics,47,48
three-dimensional waveguides,49,50
and negative refractive index
materials.51-53
However, the influence of the precise arrangement of plasmonic nanoparticles
within a designed array on the collective properties of composite materials must be understood
before many of these applications can be realized. Hollow gold nanospheres have potential to
contribute to several of these applications due to their wide range of tunability in terms of their
structure, optical, and electronic properties.
4
1.2 Analysis of Hollow Gold Nanospheres
Electronic excitation of metals using short-pulse lasers generates a non-equilibrium electron gas
with high electron temperatures, which relaxes by three successive steps: (i) electron−electron
scattering, (ii) electron−phonon coupling, and (iii) energy transfer to surroundings.32
Following
ultrafast (∼100 fs) electron−electron scattering, the hot electron distribution equilibrates with the
metal lattice on a ∼1-ps time scale via electron−phonon coupling. The final step in this electronic
energy relaxation sequence is energy transfer from the hot electron and phonon subsystems to the
environment. The time scale for the electron–phonon relaxation process (a few picoseconds) is
shorter than the phonon period (typically tens of picoseconds).31,54
Thus, the process of electron-
phonon coupling leads to lattice expansion. For metals, this expansion reduces the material’s
charge density and modifies the metal’s dielectric properties, yielding a modulation of the SPR
frequency.31
As a result, femtosecond time-resolved transient extinction has become a reliable
experimental diagnostic for studying the electronic, optical, and mechanical properties of
plasmon-supporting nanostructures.31,54-66
This time-resolved pump–probe technique monitors
the surface plasmon resonance in the ‘‘probe’’ step to report on the cooling rates of these three
processes.31,32-34,67
In particular, the use of the two-temperature model and measurements of the
electron–phonon coupling rate (step 2) as a function of excitation pulse energy allow for
determination of the metal’s electron–phonon coupling constant, G.68
When HGNs are aggregated, the SPR is shifted to shorter wavelengths than the transverse
SPR of an isolated HGN.11
Finite difference time domain simulations (FDTD) suggest the blue-
shifted SPR can be assigned to newly formed longitudinal SPR of HGN dimers. Two possible
explanations for this surprising SPR blue shift are (i) antibonding modes of hybridized plasmons
of HGN dimers69
or (ii) a charge-transfer plasmon resonance.70-72
In the first case, a SPR blue
5
shift would be observed for an asymmetric nanosphere aggregate when spectral weight is
transferred from the lower-frequency bonding mode to the higher-frequency antibonding hybrid
mode, or other higher-order modes.73
In the case of the charge-transfer model,71,72
a blue shift
would be expected when the particles are either in contact or separated by distances short enough
to permit a conductive overlap; such an overlap would lead to a collective time-dependent charge
oscillation over the two particles comprising the dimer. Thiol linkages were used to form small
aggregates such as nanosphere dimers, trimers, and tetramers, as well as larger extended
structures that can be used to elucidate key parameters that influence collective charge
oscillations in plasmonic assemblies. Our findings indicated that HGNs can exhibit both
hybridized plasmon modes and collective charge transfer resonances when the particles are
assembled into small or large extended aggregate structures. The interparticle gap and shell
thickness were identified as key factors that influenced aggregate optical properties. When
aggregates containing significant interparticle spatial separation were created, a dielectric gap
was formed that screened the two particles. In this case, the optical response was fully described
by the hybridization of surface plasmon modes. In contrast, negligible interparticle gaps led to a
domination of the visible absorption spectra by charge-transfer resonances.
1.3 Overview of the Dissertation Study
The influence of particle size and morphology on the nanostructure’s acoustic vibrations can be
studied directly using ultrafast laser-based techniques.20,21,31
Experimental femtosecond time-
resolved transient extinction data is presented in this work to demonstrate that the excitation
mechanism and the frequency of the isotropic vibrational mode of HGNs are both size-
dependent. This work represents the first study of electronic energy relaxation and coherent
acoustic vibrations of hollow gold nanospheres spanning a comprehensive range of particles
6
sizes. Conclusions are supported by quantitative analysis of the frequency, amplitude and phase
components of the coherent transient data.
In addition, electron–phonon relaxation lifetimes (and the corresponding electron–
phonon coupling constants) have been determined for hollow gold nanospheres having outer
diameter-to-shell thickness ratios (aspect ratios) ranging from 3.5 to 9.5. The electron–phonon
relaxation times were obtained using pump–probe transient extinction spectroscopy. As the HGN
aspect ratios increased, the electron–phonon coupling times decreased, leading to larger
electron–phonon coupling constants. The size-dependence likely arose from non-negligible
environmental contributions to the cooling process that occurred as the HGN total surface-area-
to volume ratio increased. Descriptions of the dependence of the electronic energy relaxation on
the particle composition, size, shape, and surroundings are necessary to develop novel devices
that utilize their unique thermal and electrical transport properties.1-3,5
The last step in the relaxation process involving particle-to-surroundings energy transfer
is analyzed to determine the half times for a series of HGNs having outer diameter-to-shell
thickness aspect ratios ranging from 3 to 9 and total surface areas ranging from 1.0 × 10³ to 2.8 ×
104 nm
2. The apparent energy transfer half times were obtained using femtosecond time-resolved
pump−probe transient extinction spectroscopy. As the HGN surface area increased, the energy
transfer half times also increased, but the data showed a discontinuity at a particle cavity radius
of 15 nm. Analysis of HGN interfacial energy transfer indicated small HGNs (cavity radius <15
nm) had interfacial thermal conductivities that were ∼1.9−2.4 times less than those of SGNs and
larger HGNs. This effect was attributed to the difference between the thermal conductivity of
water confined to small HGN cavities and that for bulk water. The apparent energy transfer half
7
times were also sensitive to the surrounding environment, becoming larger when the HGNs were
dispersed in methanol, which has a lower thermal conductivity than water.
Next, the aggregation of HGNs demonstrates control over the SPR spectral position and
electric field spatial distribution of these nanostructures.12
Thiol-induced aggregation forms
structures that contain only a few HGNs, such as dimers and trimers. It was found that the SPR
spectral position could be tuned to either higher or lower frequencies, depending upon the size of
the interparticle gap and the thickness of the HGN shell. Both numerical and experimental results
indicated that the electric field amplitude and spatial distribution of HGN aggregates could be
tailored by changing the dimensions of the individual nanospheres in the aggregate.
1.4 Description of the Dissertation Chapters
The chapters that follow introduce experimental methods and describe the powerful instrumental
technique, femtosecond transient extinction spectroscopy, used to study electronic energy
redistribution in both hollow and solid gold nanospheres. Chapter 2 provides a detailed
description of the synthetic protocol, instrumentation, and data analysis. Specifically, this chapter
presents the synthesis of both hollow and solid gold nanospheres, and their characterization using
UV-Visible absorption spectrophotometry, electron microscopy, dynamic light scattering (DLS),
and energy dispersive spectroscopy (EDS). In addition, the experimental set-up of femtosecond
transient extinction spectroscopy and data fitting routine is discussed.
Chapter 3 presents the size-dependent coherent acoustic vibrations exhibited by HGNs.
The frequency and phase analysis of this data is described and presented to reveal that HGNs
exhibit two different categories for the excitation of acoustic vibrations: (1) direct isotropic
expansion in low aspect ratio particles, and (2) indirectly launched low-frequency modes in high
8
aspect ratio particles. The indirectly-launched modes result from efficient electron-phonon
coupling in high aspect ratio (and hence, higher surface-to-volume ratio) HGNs.
In Chapter 4, the electron-phonon coupling properties of HGNs and SGNs are presented.
It discusses how the higher surface-to-volume ratio of high aspect ratio HGNs leads to shorter
electron-phonon coupling times, or increased electron-phonon coupling constants. In contrast,
SGN samples did not exhibit size-dependent electron-phonon coupling times. In addition, this
chapter describes solvent-dependent measurements.
Chapter 5 describes nanoparticle-to-surroundings energy transfer for both hollow and
solid gold nanospheres. It discusses how HGNs exhibit two different behaviors during this
process depending on the size of their cavities.
The aggregation properties of HGNs is presented in Chapter 6. HGNs were aggregated
using KCl salt solution, cysteine, and ethanedithiol. Cavity plasmon resonances appear to
contribute significantly to interparticle modes that are formed when neighboring particles
undergo near-field coupling.11-13
Aggregation of HGNs by surface necking results in decreased
electron−phonon coupling rates owing to the formation of a continuous nanoparticle network that
has a decreased effective surface-to-volume ratio.11
In Chapter 7, a cationic porphyrin, iron(III) tetrakis(1-methyl-4-pyridyl)porphine
(FeTMPyP), was used to aggregate SGNs and HGNs. This aggregation was verified using UV-
visible absorption spectrophotometry and surface-enhanced Raman scattering measurements.
Future research on this topic will focus on describing the influence of the plasmon on molecular
electric-dipole transitions in FeTMPyP.
Finally, Chapter 8 summarizes the main conclusions from each work.
9
CHAPTER TWO
EXPERIMENTAL METHODS
In this chapter, the synthesis and characterization of both hollow and solid gold nanospheres will
be described. In addition, the method of nanoparticle aggregation will be presented. The
technique used to study the electronic properties of hollow and solid gold nanospheres is
femtosecond transient extinction spectroscopy and will be described here.
2.1 Nanoparticle Synthesis And Characterization
2.1.1 Hollow Gold Nanosphere Synthesis
Hollow gold nanospheres were synthesized by a sacrificial galvanic replacement technique
involving the oxidation of cobalt nanoparticles and the subsequent reduction of gold ions.10
The
materials used for the HGN synthesis included: cobalt chloride hexahydrate (CoCl2·6H2O,
Puratronic, 99.998%, Alfa Aesar), chloroauric acid trihydrate (HAuCl4·3H2O) ACS reagent
grade, 99.99%, Alfa Aesar), sodium citrate tribasic dihydrate (C6H9Na3O9, ACS reagent grade,
>99%, Sigma-Aldrich), and sodium borohydride (NaBH4, 99.99%, Sigma-Aldrich). All water
used in the syntheses was 18.2 MΩ milli-Q filtered. Under deoxygenated conditions and constant
argon flow, cobalt nanoparticles were first synthesized by the sodium borohydride-mediated
reduction of Co2+
ions in the presence of citrate ions. Once hydrogen gas formation had ceased,
the desired amount of gold salt was added to the cobalt nanoparticle suspension where the Co0
oxidized to Co2+
ions and Au3+
ions reduced to Au0 onto the cobalt nanoparticle template.
Exposure to ambient conditions ensured the complete oxidation of the cobalt nanoparticle and
formation of a thin gold shell encapsulating water and dissolved salts. For example, a cobalt
10
nanosphere suspension was first prepared using 100 L of 0.4 M cobalt chloride solution (this
amount is the same for all syntheses) and 400 L of 0.1 M sodium citrate solution in 100 mL of
water. The amounts of each reagent used for each HGN sample are listed in Table 2.1. Cobalt
nanospheres are highly sensitive to dissolved oxygen. Hence, the cobalt nanosphere solution
was vacuumed for 30 minutes and then bubbled with argon gas for 10 minutes. The Co2+
in
solution was reduced to cobalt nanospheres by adding 100 L of a freshly-made 1 M sodium
borohydride solution with vigorous stirring. The cobalt nanoparticles serve as sacrificial
templates to leave a hollow spherical shell of gold remaining. The addition of NaBH4 generated
H2 gas bubbles that need to dissipate before adding any gold to the solution. Hence, the cobalt
nanosphere solution was allowed to stir under constant argon flow for about 45 minutes, or until
there were no visible H2 gas bubbles. The gold solution was prepared by adding 30-80 L of 0.1
M chloroauric acid solution to 10 mL of water in a beaker. Then, 30 mL of the cobalt
nanoparticle suspension was quickly added to this beaker containing the gold solution. Exposing
the solution to air allows the cobalt nanoparticles to be completely oxidized, leaving only a thin
shell of gold remaining with water and dissolved salts on the inside. Using this method, it is
possible to produce different aspect ratios of HGNs samples by using the same cobalt
nanoparticle suspension and different amount of gold solution. HGN-13, HGN-15, and HGN-16
were obtained from the same cobalt nanoparticle solution. HGN-2 and HGN-6 were also
obtained from the same cobalt solution, and finally HGN-12 and HGN-14 were synthesized from
the same batch of cobalt nanoparticles. In addition, HGNs can be produced by instead adding a
high concentration of gold solution.
HGN samples 5, 7, and 8 were prepared in this slightly different manner. First, cobalt
nanoparticles were prepared as described above. Then, 50 L of 0.1 M chloroauric acid was
11
added to the stirring cobalt nanoparticle solution (under constant Ar flow) at 60 seconds intervals
until a total volume of 200 L of gold solution added was reached. The solution was then
exposed to air, allowing the hollow gold nanospheres to form through the oxidation of cobalt and
reduction of gold. This alternative procedure produced 100 mL of HGN sample solution as
opposed to the previous procedure that produced only 30 mL of each HGN sample solution.
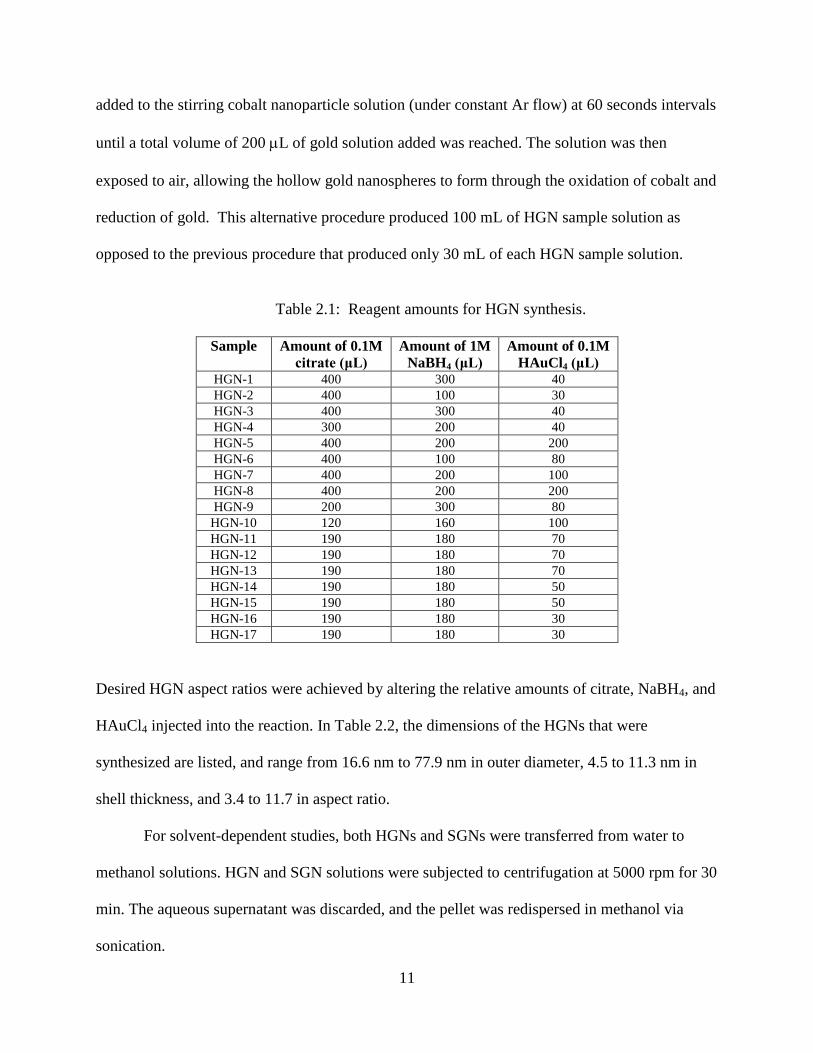
Table 2.1: Reagent amounts for HGN synthesis.
Sample Amount of 0.1M
citrate (μL)
Amount of 1M
NaBH4 (μL)
Amount of 0.1M
HAuCl4 (μL) HGN-1 400 300 40
HGN-2 400 100 30
HGN-3 400 300 40
HGN-4 300 200 40
HGN-5 400 200 200
HGN-6 400 100 80
HGN-7 400 200 100
HGN-8 400 200 200
HGN-9 200 300 80
HGN-10 120 160 100
HGN-11 190 180 70
HGN-12 190 180 70
HGN-13 190 180 70
HGN-14 190 180 50
HGN-15 190 180 50
HGN-16 190 180 30
HGN-17 190 180 30
Desired HGN aspect ratios were achieved by altering the relative amounts of citrate, NaBH4, and
HAuCl4 injected into the reaction. In Table 2.2, the dimensions of the HGNs that were
synthesized are listed, and range from 16.6 nm to 77.9 nm in outer diameter, 4.5 to 11.3 nm in
shell thickness, and 3.4 to 11.7 in aspect ratio.
For solvent-dependent studies, both HGNs and SGNs were transferred from water to
methanol solutions. HGN and SGN solutions were subjected to centrifugation at 5000 rpm for 30
min. The aqueous supernatant was discarded, and the pellet was redispersed in methanol via
sonication.
12
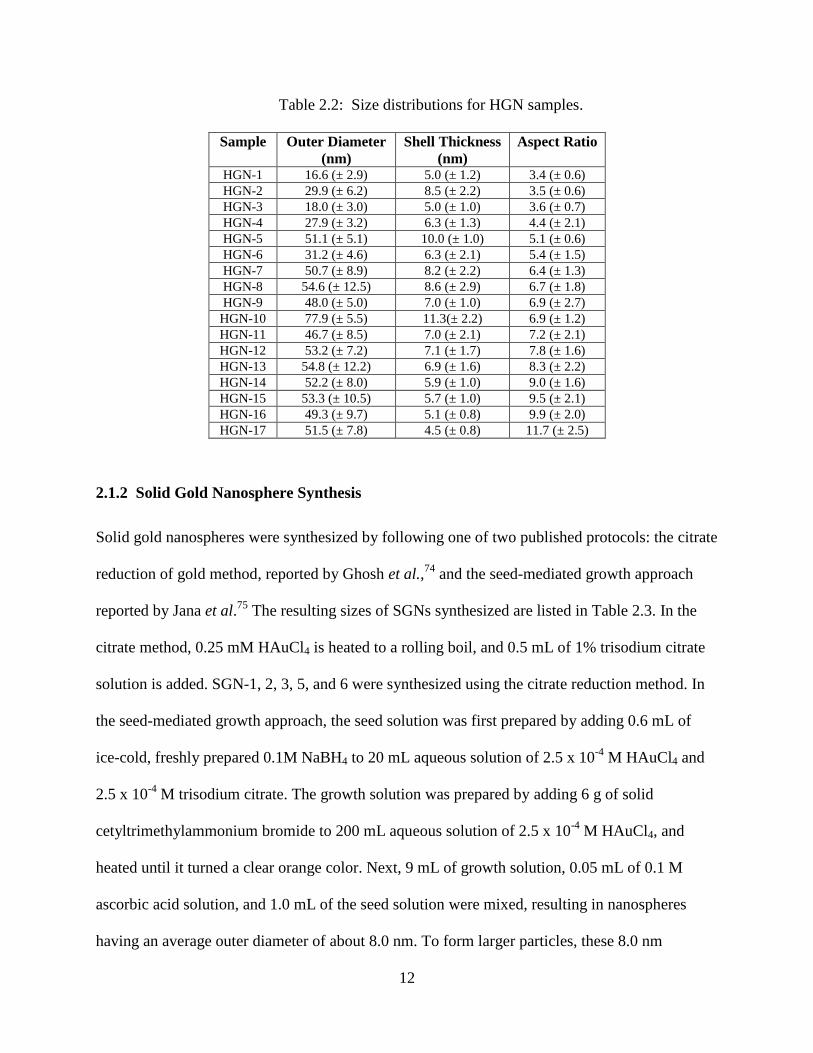
Table 2.2: Size distributions for HGN samples.
Sample Outer Diameter
(nm)
Shell Thickness
(nm)
Aspect Ratio
HGN-1 16.6 (± 2.9) 5.0 (± 1.2) 3.4 (± 0.6)
HGN-2 29.9 (± 6.2) 8.5 (± 2.2) 3.5 (± 0.6)
HGN-3 18.0 (± 3.0) 5.0 (± 1.0) 3.6 (± 0.7)
HGN-4 27.9 (± 3.2) 6.3 (± 1.3) 4.4 (± 2.1)
HGN-5 51.1 (± 5.1) 10.0 (± 1.0) 5.1 (± 0.6)
HGN-6 31.2 (± 4.6) 6.3 (± 2.1) 5.4 (± 1.5)
HGN-7 50.7 (± 8.9) 8.2 (± 2.2) 6.4 (± 1.3)
HGN-8 54.6 (± 12.5) 8.6 (± 2.9) 6.7 (± 1.8)
HGN-9 48.0 (± 5.0) 7.0 (± 1.0) 6.9 (± 2.7)
HGN-10 77.9 (± 5.5) 11.3(± 2.2) 6.9 (± 1.2)
HGN-11 46.7 (± 8.5) 7.0 (± 2.1) 7.2 (± 2.1)
HGN-12 53.2 (± 7.2) 7.1 (± 1.7) 7.8 (± 1.6)
HGN-13 54.8 (± 12.2) 6.9 (± 1.6) 8.3 (± 2.2)
HGN-14 52.2 (± 8.0) 5.9 (± 1.0) 9.0 (± 1.6)
HGN-15 53.3 (± 10.5) 5.7 (± 1.0) 9.5 (± 2.1)
HGN-16 49.3 (± 9.7) 5.1 (± 0.8) 9.9 (± 2.0)
HGN-17 51.5 (± 7.8) 4.5 (± 0.8) 11.7 (± 2.5)
2.1.2 Solid Gold Nanosphere Synthesis
Solid gold nanospheres were synthesized by following one of two published protocols: the citrate
reduction of gold method, reported by Ghosh et al.,74
and the seed-mediated growth approach
reported by Jana et al.75
The resulting sizes of SGNs synthesized are listed in Table 2.3. In the
citrate method, 0.25 mM HAuCl4 is heated to a rolling boil, and 0.5 mL of 1% trisodium citrate
solution is added. SGN-1, 2, 3, 5, and 6 were synthesized using the citrate reduction method. In
the seed-mediated growth approach, the seed solution was first prepared by adding 0.6 mL of
ice-cold, freshly prepared 0.1M NaBH4 to 20 mL aqueous solution of 2.5 x 10⁻⁴
M HAuCl4 and
2.5 x 10⁻⁴
M trisodium citrate. The growth solution was prepared by adding 6 g of solid
cetyltrimethylammonium bromide to 200 mL aqueous solution of 2.5 x 10⁻⁴
M HAuCl4, and
heated until it turned a clear orange color. Next, 9 mL of growth solution, 0.05 mL of 0.1 M
ascorbic acid solution, and 1.0 mL of the seed solution were mixed, resulting in nanospheres
having an average outer diameter of about 8.0 nm. To form larger particles, these 8.0 nm
13
particles were used as the seed solution for the next preparation. Again, 9 mL of the growth
solution was mixed with 0.05 mL of 0.1 M ascorbic acid, followed by 1.0 mL of the 8.0 nm
SGNs. SGN-4 and SGN-7 were synthesized by the seed-mediated growth method.
Table 2.3: Size distributions for SGN samples.
Sample Outer Diameter
(nm) SGN-1 18.3 (± 2.0)
SGN-2 19.8 (± 3.7)
SGN-3 25.4 (± 4.2)
SGN-4 37.7 (± 3.3)
SGN-5 38.4 (± 4.2)
SGN-6 59.8 (± 7.8)
SGN-7 83.3 (± 7.5)
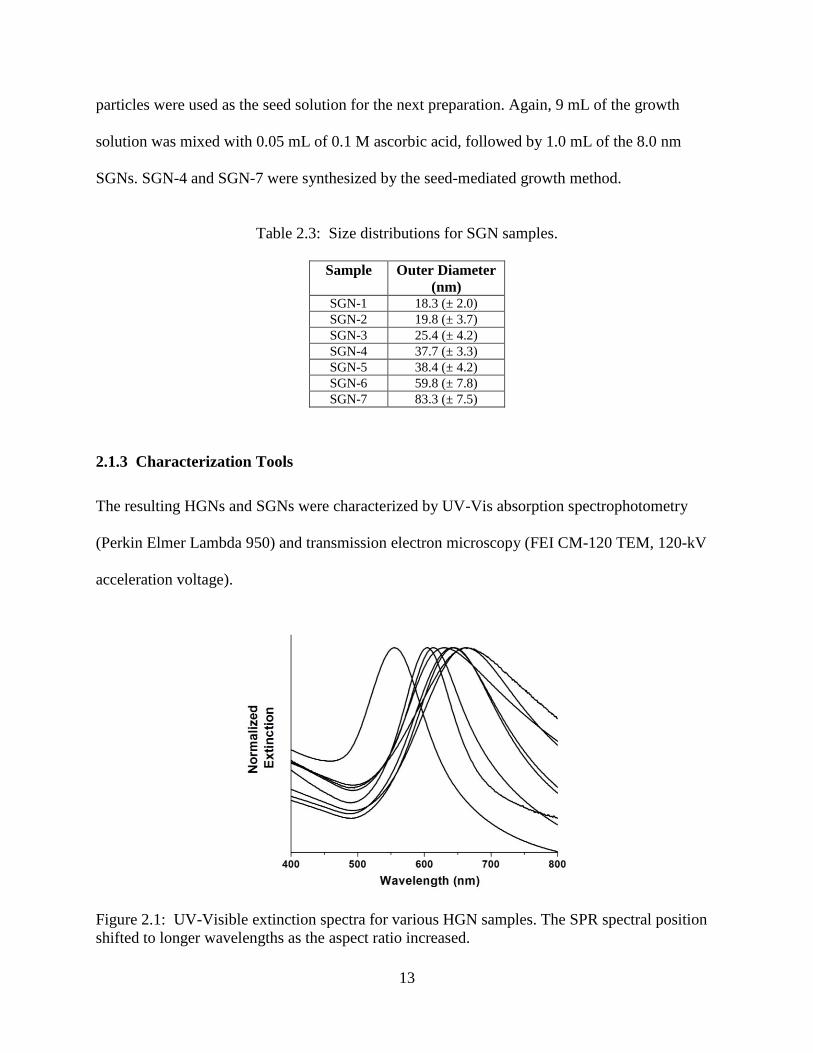
2.1.3 Characterization Tools
The resulting HGNs and SGNs were characterized by UV-Vis absorption spectrophotometry
(Perkin Elmer Lambda 950) and transmission electron microscopy (FEI CM-120 TEM, 120-kV
acceleration voltage).
Figure 2.1: UV-Visible extinction spectra for various HGN samples. The SPR spectral position
shifted to longer wavelengths as the aspect ratio increased.
14
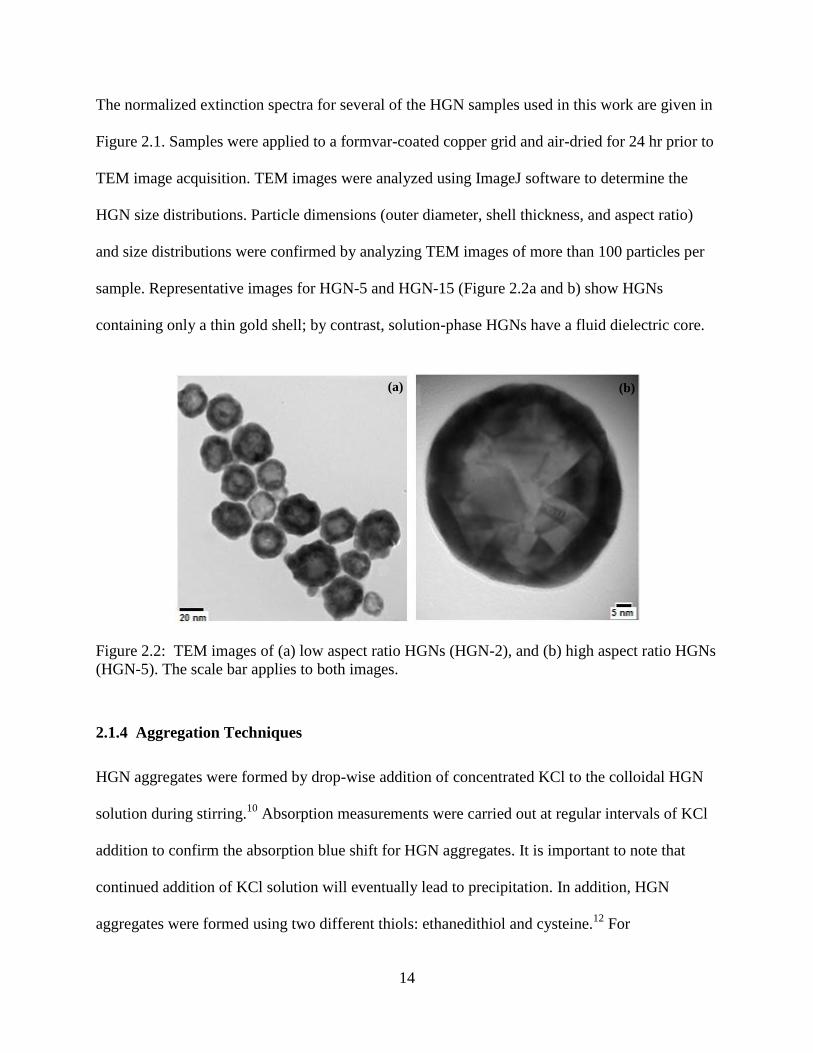
The normalized extinction spectra for several of the HGN samples used in this work are given in
Figure 2.1. Samples were applied to a formvar-coated copper grid and air-dried for 24 hr prior to
TEM image acquisition. TEM images were analyzed using ImageJ software to determine the
HGN size distributions. Particle dimensions (outer diameter, shell thickness, and aspect ratio)
and size distributions were confirmed by analyzing TEM images of more than 100 particles per
sample. Representative images for HGN-5 and HGN-15 (Figure 2.2a and b) show HGNs
containing only a thin gold shell; by contrast, solution-phase HGNs have a fluid dielectric core.
Figure 2.2: TEM images of (a) low aspect ratio HGNs (HGN-2), and (b) high aspect ratio HGNs
(HGN-5). The scale bar applies to both images.
2.1.4 Aggregation Techniques
HGN aggregates were formed by drop-wise addition of concentrated KCl to the colloidal HGN
solution during stirring.10
Absorption measurements were carried out at regular intervals of KCl
addition to confirm the absorption blue shift for HGN aggregates. It is important to note that
continued addition of KCl solution will eventually lead to precipitation. In addition, HGN
aggregates were formed using two different thiols: ethanedithiol and cysteine.12
For
(a) (b)
15
ethanedithiol-induced aggregation, 2 μL of a 5 mM ethanedithiol solution in ethanol were added
to 1 mL of an HGN solution. For cysteine-induced aggregates, 10 μL of a 1 M aqueous solution
of cysteine were added to 1 mL of an HGN solution. Then, the HGN aggregate solutions were
agitated by shaking and allowed to sit at room temperature for one hour before their use.
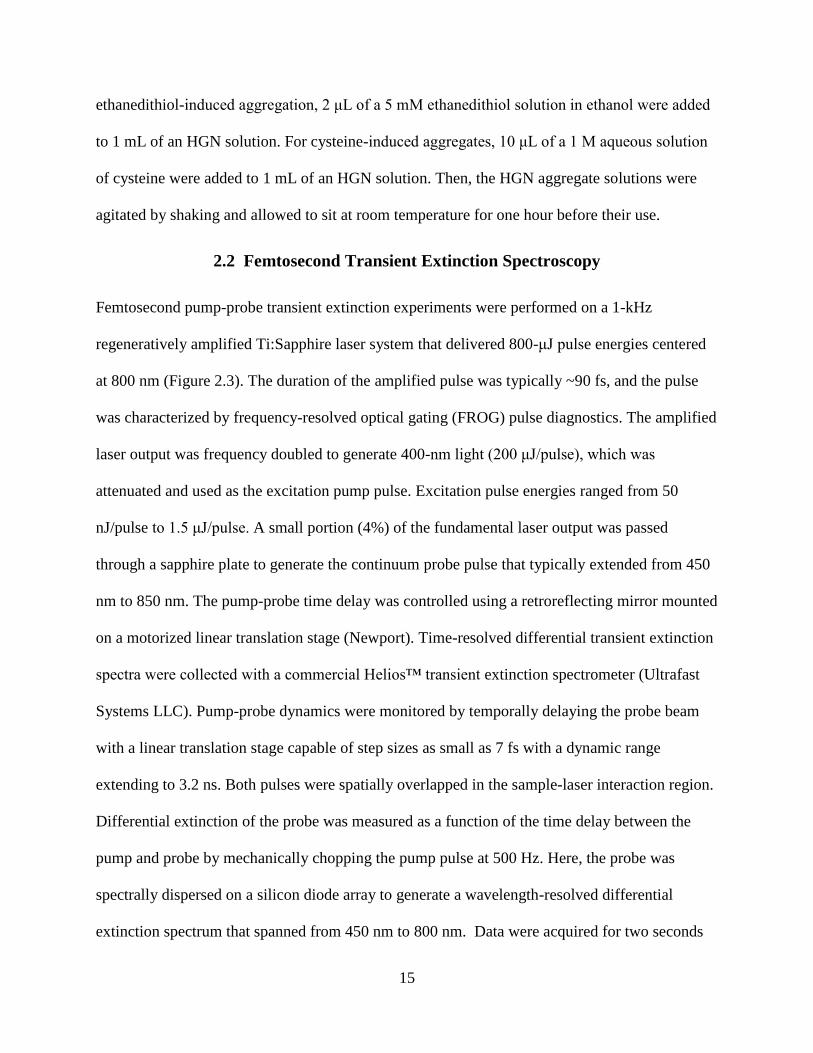
2.2 Femtosecond Transient Extinction Spectroscopy
Femtosecond pump-probe transient extinction experiments were performed on a 1-kHz
regeneratively amplified Ti:Sapphire laser system that delivered 800-μJ pulse energies centered
at 800 nm (Figure 2.3). The duration of the amplified pulse was typically ~90 fs, and the pulse
was characterized by frequency-resolved optical gating (FROG) pulse diagnostics. The amplified
laser output was frequency doubled to generate 400-nm light (200 μJ/pulse), which was
attenuated and used as the excitation pump pulse. Excitation pulse energies ranged from 50
nJ/pulse to 1.5 μJ/pulse. A small portion (4%) of the fundamental laser output was passed
through a sapphire plate to generate the continuum probe pulse that typically extended from 450
nm to 850 nm. The pump-probe time delay was controlled using a retroreflecting mirror mounted
on a motorized linear translation stage (Newport). Time-resolved differential transient extinction
spectra were collected with a commercial Helios™ transient extinction spectrometer (Ultrafast
Systems LLC). Pump-probe dynamics were monitored by temporally delaying the probe beam
with a linear translation stage capable of step sizes as small as 7 fs with a dynamic range
extending to 3.2 ns. Both pulses were spatially overlapped in the sample-laser interaction region.
Differential extinction of the probe was measured as a function of the time delay between the
pump and probe by mechanically chopping the pump pulse at 500 Hz. Here, the probe was
spectrally dispersed on a silicon diode array to generate a wavelength-resolved differential
extinction spectrum that spanned from 450 nm to 800 nm. Data were acquired for two seconds
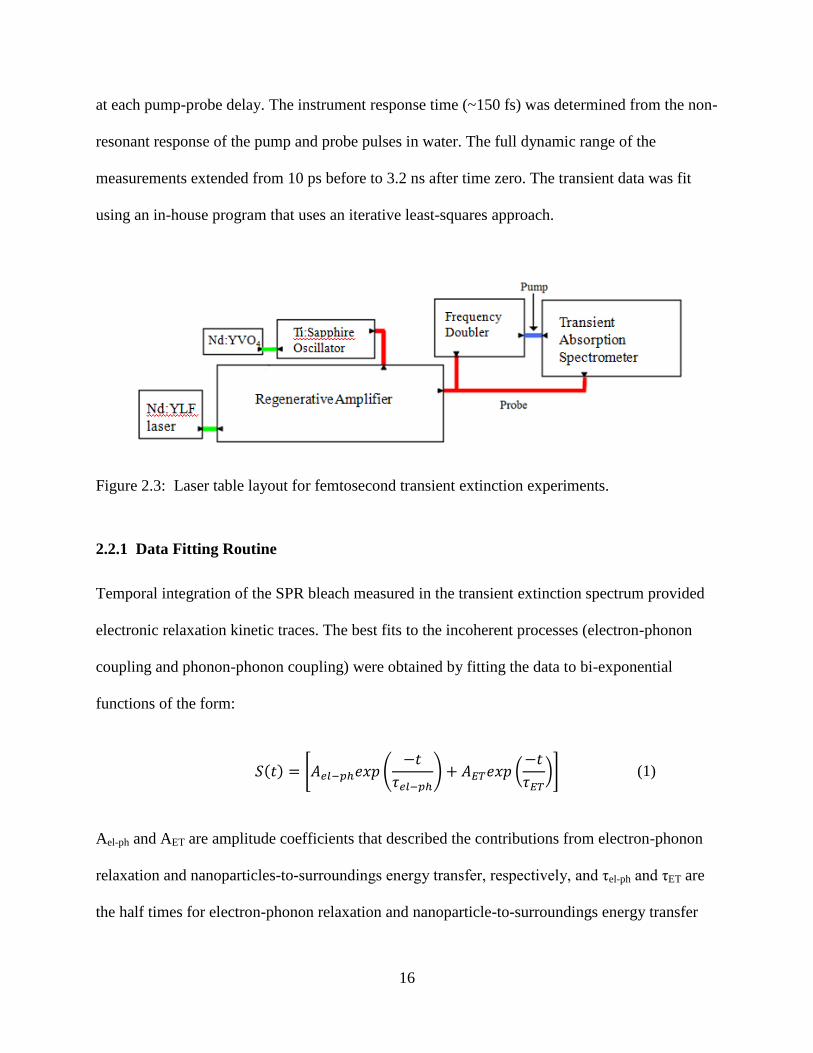
16
at each pump-probe delay. The instrument response time (~150 fs) was determined from the non-
resonant response of the pump and probe pulses in water. The full dynamic range of the
measurements extended from 10 ps before to 3.2 ns after time zero. The transient data was fit
using an in-house program that uses an iterative least-squares approach.
Figure 2.3: Laser table layout for femtosecond transient extinction experiments.
2.2.1 Data Fitting Routine
Temporal integration of the SPR bleach measured in the transient extinction spectrum provided
electronic relaxation kinetic traces. The best fits to the incoherent processes (electron-phonon
coupling and phonon-phonon coupling) were obtained by fitting the data to bi-exponential
functions of the form:
(1)
Ael-ph and AET are amplitude coefficients that described the contributions from electron-phonon
relaxation and nanoparticles-to-surroundings energy transfer, respectively, and τel-ph and τET are
the half times for electron-phonon relaxation and nanoparticle-to-surroundings energy transfer

17
(or phonon-phonon coupling), respectively. The pump-probe delay time was given by t. The
transient data was fit using a program written in house, which relies on an iterative least-squares
approach.
18
CHAPTER THREE
STRUCTURE-DEPENDENT COHERENT ACOUSTIC
VIBRATIONS OF HOLLOW GOLD NANOSPHERES
Reproduced with permission from Dowgiallo, A.M., Schwartzberg, A.M. and Knappenberger,
K.L., Jr., Nano Letters, 11 (2011) 3258–3262. DOI: 10.1021/nl201557s.
Copyright 2011 American Chemical Society.
3.1 Introduction
This chapter describes the coherent vibrational response of hollow gold nanospheres following
electronic excitation using femtosecond time-resolved transient extinction. The results from
these experiments indicated that HGNs support an isotropic mode, resulting in periodic
modulation of the surface plasmon differential extinction. Two different categories of coherent
acoustic vibrations, which depend on particle dimensions, were observed for HGNs. Further, the
vibration launching mechanism was dependent upon the dimensions of the HGN. Coherent
vibrations in HGNs characterized by small outer radii (<10 nm) and low cavity-radius-to-outer-
shell radius (R1/R2) aspect ratios (<0.5) were excited by a direct mechanism, whereas the
vibrations observed for the larger particles (>25 nm outer radius) with higher aspect ratios (>0.5)
resulted from an indirect mechanism. Coupling of electrons with the radial expansion mode can
be either direct or indirect. When the pump excites the phonons in an indirect way, the electron
gas is heated by the pump and its relaxation through electron-phonon coupling dumps energy
into the lattice where the nanoparticles expand in response to this rapid heating. Impulsive lattice
heating occurs because the time scale for electron-phonon coupling is faster than the vibrational
19
period. However, impulsive lattice heating is not the complete picture because at high electron
temperatures, the electrons exert a significant force on the nuclei, known as the hot electron
pressure, and this triggers in-phase dilation of the nanoparticles around its equilibrium size. The
dynamics of these two processes are different and they can thus be separated by analyzing the
phase of the observed oscillations.56
These findings may be significant for developing a
predictive understanding of nanostructure optical and mechanical properties.
3.2 Materials and Methods
All HGNs featured here were synthesized using a sacrificial galvanic replacement method.10
The
synthetic protocol yielded HGNs having outer diameters ranging from 20 to 80 nm and shell
thicknesses of 3 to 11 nm (resulting ratios of cavity radius to outer-shell radius were 0.38 to 0.82;
specifically, these are HGN-2, 3, 4, 5, 6, 8, 10, 13, 15, 16, and 17 (Table 2.2)). Exact HGN
dimensions were determined from high-resolution TEM data. Detailed synthetic protocols,
particle size data and extinction spectra for each HGN system are provided in Chapter 2. For all
HGN systems, the interband transition of gold was excited using the 400 nm second harmonic of
an amplified Ti:sapphire laser, and the time-domain relaxation dynamics were recorded using a
white-light continuum probe that monitored the resultant SPR bleach.
3.2.1 Coherent data
To understand more fully the acoustic vibrations of HGNs, the intensity recurrences observed in
the transient bleach were analyzed quantitatively. First, the incoherent electron cooling processes
were fit to the two-component exponential decay function given in 2.2.1, accounting for the
electron-phonon and phonon-phonon coupling processes described previously. Next, the
residuals from the fit, which represented the coherent vibrations, were Fourier transformed to
yield frequency data. This data is also used for the phase analysis of the coherent vibrations. The
20
pronounced oscillatory component of the time-dependent extinction was modeled using the
phenomenological response function
(2)
where A is an amplitude coefficient, τ is the dephasing time and ϕ is the phase of the oscillation.
3.3 Results and Discussion
3.3.1 Transient Extinction of HGNs
These results represent the first study of electronic energy relaxation and coherent acoustic
vibrations of hollow gold nanospheres spanning a comprehensive range of particles sizes.
Conclusions are supported by quantitative analysis of the frequency, amplitude and phase
components of the coherent transient data. For all HGN systems, the interband transition of gold
was excited using the 400 nm second harmonic of an amplified Ti:sapphire laser, and the time-
domain relaxation dynamics were recorded using a white-light continuum probe that monitored
the resultant SPR bleach. Figure 3.1 portrays the SPR bleach wavelength for a 40 nm outer
radius (OR) HGN following 400 nm excitation. This two-dimensional (2D) map captures all of
the features of the transient data; the time-dependent change in SPR wavelength and spectral
width are both evident. The steady-state wavelength-resolved differential extinction spectrum
and transient bleach recovery kinetics for an HGN with an outer radius of 40 nm and an aspect
ratio of 0.75 is shown in Figure 3.2 a and b, respectively. The maximum of the SPR bleach was
located at 640 nm; the time-domain data shown in Figure 3.2b were obtained by monitoring the
bleach at either 585 nm(blue) or 695 nm(red). The kinetic traces exhibited regular periodic
intensity modulations that were exactly out of phase with each other.
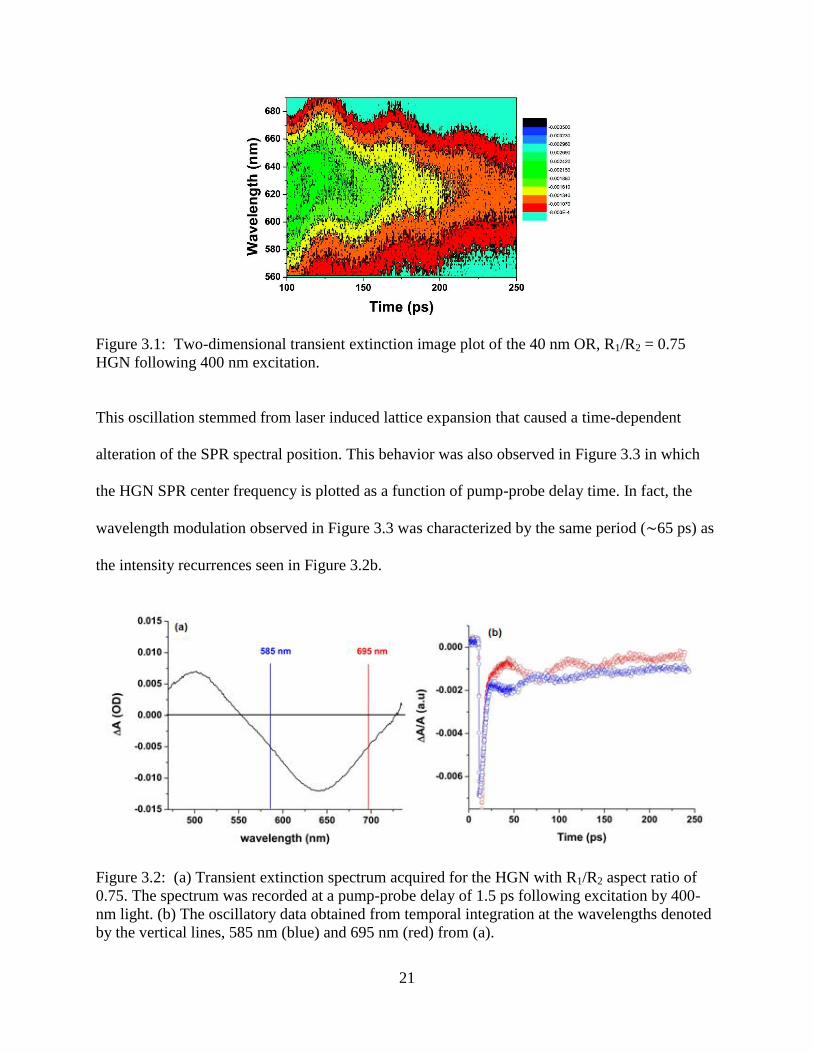
21
Figure 3.1: Two-dimensional transient extinction image plot of the 40 nm OR, R1/R2 = 0.75
HGN following 400 nm excitation.
This oscillation stemmed from laser induced lattice expansion that caused a time-dependent
alteration of the SPR spectral position. This behavior was also observed in Figure 3.3 in which
the HGN SPR center frequency is plotted as a function of pump-probe delay time. In fact, the
wavelength modulation observed in Figure 3.3 was characterized by the same period (∼65 ps) as
the intensity recurrences seen in Figure 3.2b.
Figure 3.2: (a) Transient extinction spectrum acquired for the HGN with R1/R2 aspect ratio of
0.75. The spectrum was recorded at a pump-probe delay of 1.5 ps following excitation by 400-
nm light. (b) The oscillatory data obtained from temporal integration at the wavelengths denoted
by the vertical lines, 585 nm (blue) and 695 nm (red) from (a).

22
The time-dependent peak width of the SPR is also shown in Figure 3.3. These data also exhibited
time-dependent modulations but with an approximate π/2 phase shift with respect to the SPR
wavelength.
Figure 3.3: SPR peak position (black) and spectral width (red) of the R1/R2 = 0.75 HGN plotted
as a function of pump-probe time delay. The period of the SPR fluctuations is about 65 ps, which
is consistent with the oscillations observed in Figure 3.2b.
Previous work by Apkarian and co-workers indicates that SPR peak position depends on lattice
strain; further, peak width is sensitive to the strain rate and surrounding dielectric, which is
temperature dependent.63,65
Continuing research will be necessary to fully describe all of the
transient spectral features of HGNs.
In solid gold nanospheres, excitation of the isotropic breathing mode yields similar
oscillations with frequencies that are inversely proportional to nanosphere radius.31
By
comparison, the oscillation frequencies observed for HGNs with an OR of 40 nm (0.5 cm-1
,
Figure 3.2) were 3-fold lower than those predicted for similarly sized SGNs (1.7 cm-1
). These
findings agree well with previous work on core-shell and hollow nanospheres.23-24,76
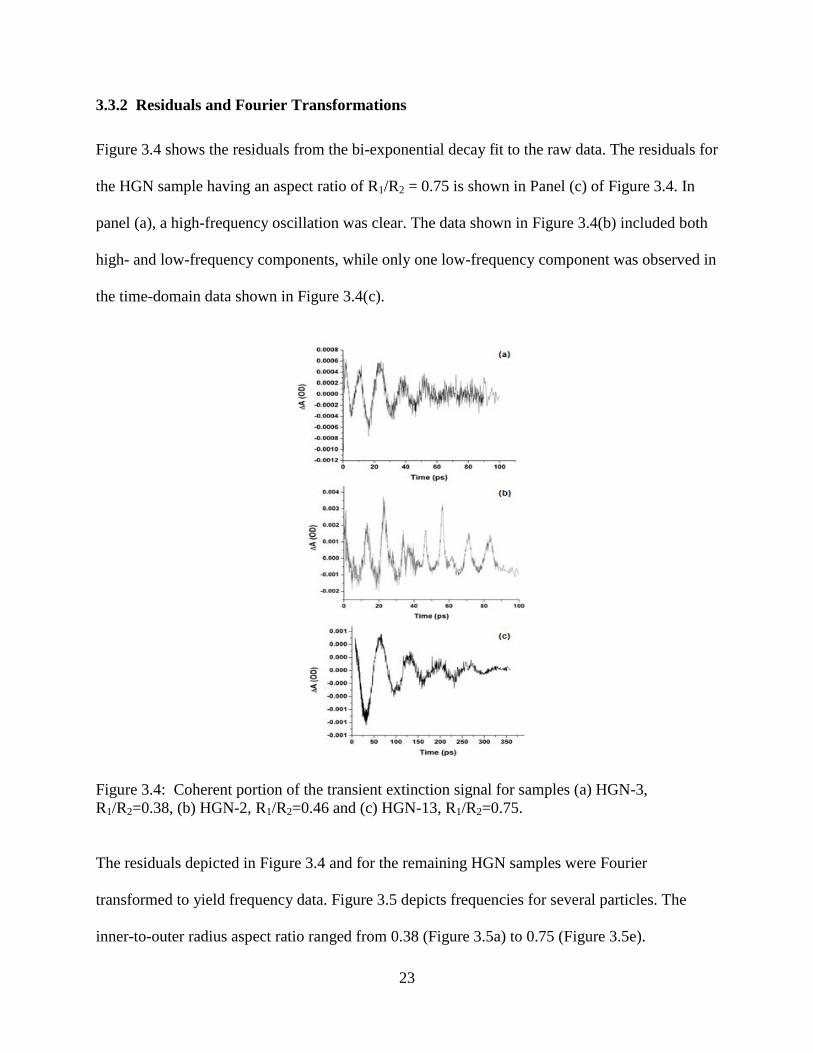
23
3.3.2 Residuals and Fourier Transformations
Figure 3.4 shows the residuals from the bi-exponential decay fit to the raw data. The residuals for
the HGN sample having an aspect ratio of R1/R2 = 0.75 is shown in Panel (c) of Figure 3.4. In
panel (a), a high-frequency oscillation was clear. The data shown in Figure 3.4(b) included both
high- and low-frequency components, while only one low-frequency component was observed in
the time-domain data shown in Figure 3.4(c).
Figure 3.4: Coherent portion of the transient extinction signal for samples (a) HGN-3,
R1/R2=0.38, (b) HGN-2, R1/R2=0.46 and (c) HGN-13, R1/R2=0.75.
The residuals depicted in Figure 3.4 and for the remaining HGN samples were Fourier
transformed to yield frequency data. Figure 3.5 depicts frequencies for several particles. The
inner-to-outer radius aspect ratio ranged from 0.38 (Figure 3.5a) to 0.75 (Figure 3.5e).
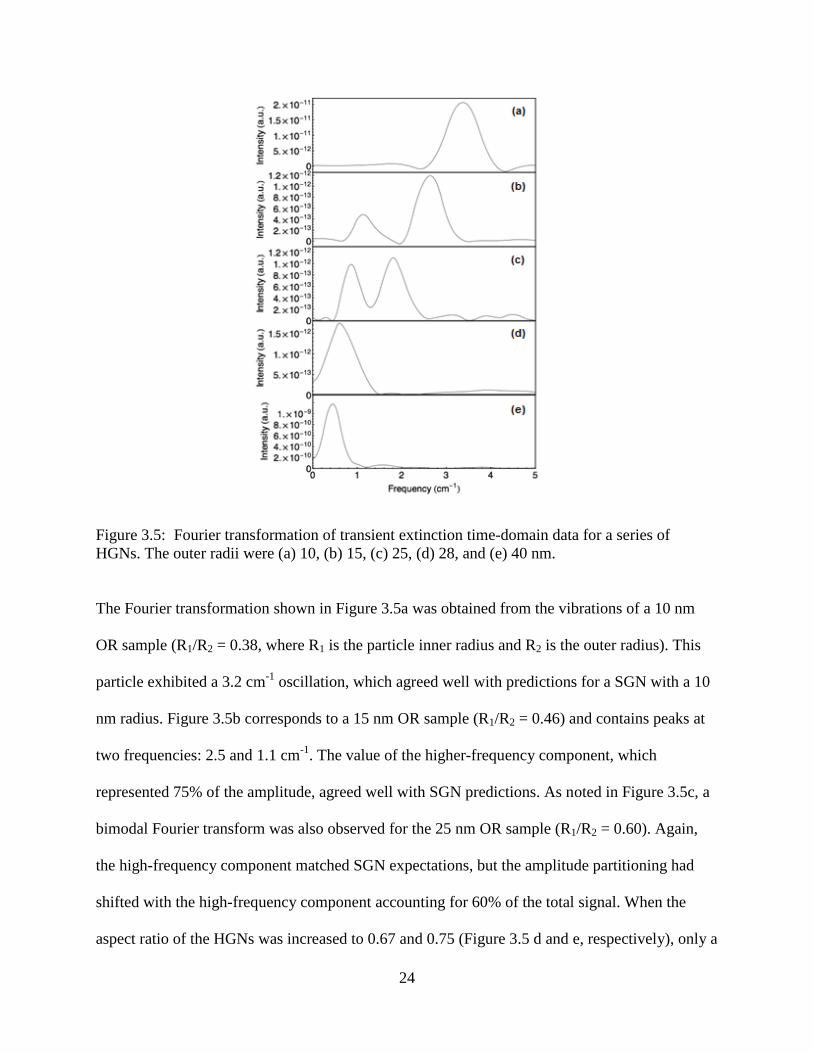
24
Figure 3.5: Fourier transformation of transient extinction time-domain data for a series of
HGNs. The outer radii were (a) 10, (b) 15, (c) 25, (d) 28, and (e) 40 nm.
The Fourier transformation shown in Figure 3.5a was obtained from the vibrations of a 10 nm
OR sample (R1/R2 = 0.38, where R1 is the particle inner radius and R2 is the outer radius). This
particle exhibited a 3.2 cm-1
oscillation, which agreed well with predictions for a SGN with a 10
nm radius. Figure 3.5b corresponds to a 15 nm OR sample (R1/R2 = 0.46) and contains peaks at
two frequencies: 2.5 and 1.1 cm-1
. The value of the higher-frequency component, which
represented 75% of the amplitude, agreed well with SGN predictions. As noted in Figure 3.5c, a
bimodal Fourier transform was also observed for the 25 nm OR sample (R1/R2 = 0.60). Again,
the high-frequency component matched SGN expectations, but the amplitude partitioning had
shifted with the high-frequency component accounting for 60% of the total signal. When the
aspect ratio of the HGNs was increased to 0.67 and 0.75 (Figure 3.5 d and e, respectively), only a
25
single low-frequency component that did not match SGN values was observed. The data shown
in Figure 3.5 clearly indicated that the nature of the coherent oscillations observed for HGNs was
size dependent; high aspect ratio HGNs appeared to vibrate more slowly than low aspect ratio
HGNs. The two frequencies observed for HGNs with intermediate aspect ratios likely arose from
different expansion processes exhibited by the sample rather than from the excitation of multiple
modes within a single particle; the ensemble contained particles that exhibited either the low- or
high-frequency acoustic vibration, but not both.
3.3.3 Vibrational Frequencies
Vibrational frequencies for all HGNs examined here are shown in Figure 3.6 as a function of
particle dimensions, with the high-frequency component depicted in Figure 3.6a and the low-
frequency vibration in Figure 3.6b. For comparison, the frequencies we observed for SGNs are
also included in Figure 3.6a. These values agreed well with the previous works of Hartland and
illustrated the similarity between SGNs and the low aspect ratio HGNs.31
The vibrational
frequencies for these two classes of particles were inversely proportional to the outer radius, as
indicated by the linear fit to SGNs. As demonstrated in Figure 3.6b, the vibrational frequencies
of high aspect ratio HGNs were inversely proportional to the HGN outer radius; the frequencies
increased linearly as a function of 1/outer radius. This trend, which holds over a large range of
radii, was consistent with theoretical predictions.23
Polarization-dependent pump-probe
measurements on these samples revealed that all vibrational modes were isotropic. Low-
frequency modes that were observed previously for high aspect ratio samples have been
attributed to softening of the isotropic breathing mode due to efficient cooling and the inherent
polycrystallinity of the HGN lattice.24
The data in Figures 3.5 and 3.6 represent the first
experimental investigation of HGN vibrational modes over a comprehensive range of particle
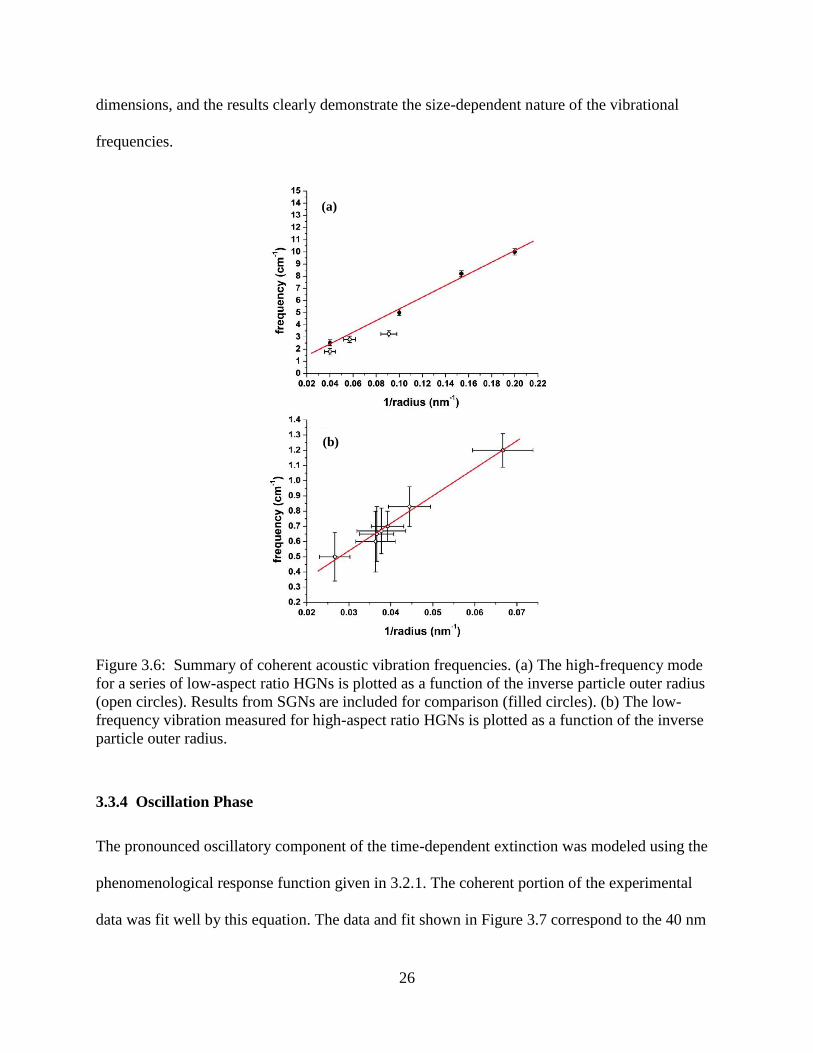
26
dimensions, and the results clearly demonstrate the size-dependent nature of the vibrational
frequencies.
Figure 3.6: Summary of coherent acoustic vibration frequencies. (a) The high-frequency mode
for a series of low-aspect ratio HGNs is plotted as a function of the inverse particle outer radius
(open circles). Results from SGNs are included for comparison (filled circles). (b) The low-
frequency vibration measured for high-aspect ratio HGNs is plotted as a function of the inverse
particle outer radius.
3.3.4 Oscillation Phase
The pronounced oscillatory component of the time-dependent extinction was modeled using the
phenomenological response function given in 3.2.1. The coherent portion of the experimental
data was fit well by this equation. The data and fit shown in Figure 3.7 correspond to the 40 nm
(a)
(b)
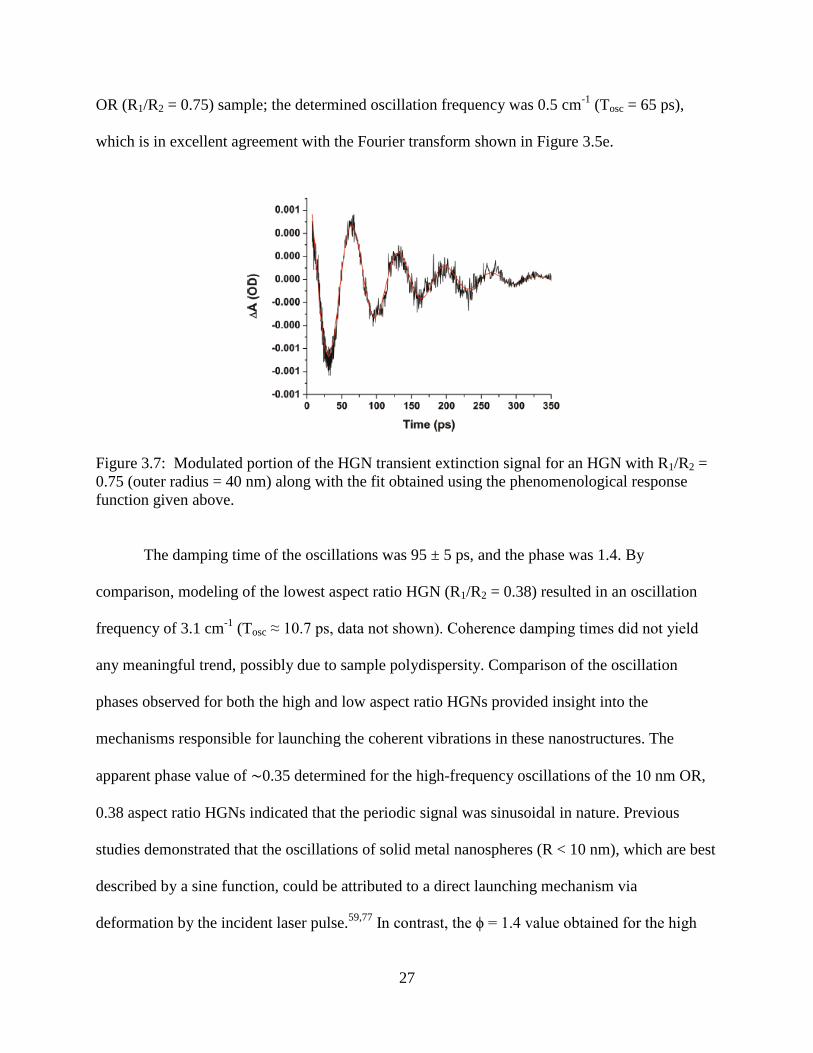
27
OR (R1/R2 = 0.75) sample; the determined oscillation frequency was 0.5 cm-1
(Tosc = 65 ps),
which is in excellent agreement with the Fourier transform shown in Figure 3.5e.
Figure 3.7: Modulated portion of the HGN transient extinction signal for an HGN with R1/R2 =
0.75 (outer radius = 40 nm) along with the fit obtained using the phenomenological response
function given above.
The damping time of the oscillations was 95 ± 5 ps, and the phase was 1.4. By
comparison, modeling of the lowest aspect ratio HGN (R1/R2 = 0.38) resulted in an oscillation
frequency of 3.1 cm-1
(Tosc ≈ 10.7 ps, data not shown). Coherence damping times did not yield
any meaningful trend, possibly due to sample polydispersity. Comparison of the oscillation
phases observed for both the high and low aspect ratio HGNs provided insight into the
mechanisms responsible for launching the coherent vibrations in these nanostructures. The
apparent phase value of ∼0.35 determined for the high-frequency oscillations of the 10 nm OR,
0.38 aspect ratio HGNs indicated that the periodic signal was sinusoidal in nature. Previous
studies demonstrated that the oscillations of solid metal nanospheres (R < 10 nm), which are best
described by a sine function, could be attributed to a direct launching mechanism via
deformation by the incident laser pulse.59,77
In contrast, the ϕ = 1.4 value obtained for the high
28
aspect ratio HGNs indicated that modeling of the time-dependent response required a cosine
function. Like the large aspect ratio HGNs studied here, large-diameter solid metal nanospheres
also exhibit cosine-like behavior.56,59
This observed π phase shift suggested excitation of the
acoustic vibrations via an indirect mechanism involving efficient electron gas-to-metal-lattice
energy transfer.56,59,78
These results indicated that the larger aspect ratio HGNs exhibited more
efficient electron-phonon coupling than the low aspect ratio structures.
3.3.5 Electron-Phonon Coupling
The electron-phonon coupling strength is described by the electron-phonon coupling constant, G
(W m-3
K-1
). Previously, we reported a G value of 6.6 x 10¹⁶
W m-3
K-1
for an HGN similar in
size to the high aspect ratio samples considered here (R1/R2 ≈ 0.6).11
By comparison, the G
values of comparably sized SGNs are typically 2 x 10¹⁶
W m-3
K-1
. In the current study, G values
of ∼3 x 10¹⁶
and ∼7 x 10¹⁶
W m-3
K-1
were determined for HGNs with R1/R2 values of 0.38
(Figure 3.5a) and 0.75 (Figure 3.5e), respectively. Taken together, these findings indicated that
high aspect ratio samples exhibited larger electron phonon coupling strengths than similarly
sized SGNs and low aspect ratio HGNs. Therefore, we attribute the difference in the observed
excitation mechanism of the acoustic vibrations to more efficient electron-phonon coupling for
high aspect ratio HGNs. Electron-phonon coupling strength also influences the amplitude (A) of
the intensity-modulated signal since A is inversely proportional to the electron-phonon coupling
lifetime.56
Therefore, based on our current and previous data,11
HGNs with larger aspect ratios,
which allow for more efficient electron-phonon coupling, should be characterized by high
amplitude oscillations. Indeed, the amplitude of the oscillations observed for the low aspect ratio
sample (R1/R2 = 0.38) was only 65% of the amplitude observed for the R1/R2 = 0.75 sample.
Taken together, the oscillation phases, the degree of electron-phonon coupling, and the
29
amplitude comparison were all consistent with the conclusion that the different vibrational
excitation mechanisms observed for high and low aspect ratio nanospheres were, at least in part,
the result of electron-phonon coupling efficiency.
In addition to the size-dependent transition from direct to indirect vibrational excitation,
the HGNs examined here also displayed a reduction in oscillation frequency for particles with
large R1/R2 values. Previous experimental and theoretical data published by Guillion et al.
reported similar low-frequency isotropic vibrations for core-shell nanostructures.23
The authors
propose a theoretical model that predicts a linear decrease in the breathing mode frequency as a
function of increasing aspect ratio, and they attribute this behavior to lattice polycrystallinity.
Later, Newhouse et al. adopted the same model to account for low frequency oscillations of
R1/R2 ≈ 0.75 HGNs.24
This predictive model is in relative agreement with our experimental data
on high aspect ratio HGNs, (Figure 3.6b). However, the experimentally observed frequencies
reported here, as well as all previous reports of HGNs and core-shell structures, were still lower
than theory by a factor of at least two.
The HGNs studied here and in previous works contained polycrystalline shells. This
physical property likely contributed to a “softening” of the isotropic vibration. However, the
present data indicated that electron-phonon coupling strength was crucial for determining the
nature of the coherent oscillations. Moreover, the data clearly demonstrated that launching of
acoustic vibrations was structure specific and that femtosecond time-resolved pump surface
plasmon-probe spectroscopy was a sensitive tool for analyzing the structure-specific relaxation
mechanisms of electronically excited HGNs. Previous work on metal nanocubes also revealed
the presence of multiple vibrational frequencies for large structures.77
In that case, the low-
frequency vibration was attributed to inhomogeneous heating of the structure by the laser. This
30
effect should not be relevant here because all HGNs examined in this study contained shells that
were within the skin depth of the metal, leading to homogeneous sample heating.
3.4 Conclusions
In conclusion, size-dependent coherent acoustic vibrations in hollow gold nanospheres were
reported. Detailed frequency and phase analysis of the periodic transient SPR extinction revealed
two different categories for the excitation of acoustic vibrations in HGNs: (1) direct isotropic
expansion in small, low aspect ratio particles and (2) indirectly launched low-frequency modes in
isotropic oscillations in large, high aspect ratio particles. The indirect excitation mechanism
observed for larger particles was attributed to efficient heating of the lattice via electron gas-to-
lattice energy transfer exhibited by high aspect ratio samples. These results are significant for
providing a fundamental understanding of the interplay between nanomaterial structure and
mechanical properties and also for applications where a predictive understanding of interfacial
energy transfer is critical. Rapid cooling, which appears to be a feature of HGNs, may benefit
applications requiring efficient local heating (e.g., photothermal therapy).
31
CHAPTER FOUR
ULTRAFAST ELECTRON-PHONON COUPLING IN HOLLOW
GOLD NANOSPHERES
Phys. Chem. Chem. Phys., 2011, 13, 21585 – 21592. DOI:10.1039/C1CP22743B
Reproduced by permission of the PCCP Owner Societies.
4.1 Introduction
This chapter describes how electronic energy relaxation in HGNs was studied using femtosecond
time-resolved transient extinction spectroscopy. A range of HGNs having outer diameter-to-shell
thickness aspect ratios of 3.5 to 9.5 were synthesized by the galvanic replacement method. The
HGNs exhibited electron–phonon relaxation times that decreased from 1.18 ± 0.16 to 0.59 ± 0.08
ps as the aspect ratio increased over this range. The corresponding electron–phonon coupling
constants, G, ranged from (1.67 ± 0.22) to (3.33 ± 0.45) x 1016
W m-3
K-1
. Electron–phonon
coupling was also determined for SGNs with diameters spanning 20 nm to 83 nm; no size
dependence was observed for these structures. The HGNs with high aspect ratios exhibited larger
electron–phonon coupling constants than the SGNs, whose average G value was (1.9 ± 0.2) x
1016
W m-3
K-1
. By comparison, low-aspect ratio HGNs exhibited values comparable to SGNs.
The electron–phonon coupling of high-aspect ratio HGNs was also influenced by the
surrounding fluid dielectric; slightly smaller G values were obtained when methanol was the
solvent as opposed to water. This coupling enhancement observed for high-aspect ratio HGNs
was attributed to the large surface-to-volume ratio of these structures, which results in non-
negligible contributions from the environment.
32
Metal nanostructures exhibit a range of unique optical and mechanical properties.
Continued advances in colloidal synthesis allow the morphology, size, and composition of the
nanoparticles to be tailored so that they possess the desired properties.1–5,10,11,16,28,79,80
In the case
of hollow gold nanospheres (HGNs), which consist of a metal shell and a fluid interior dielectric,
variation of the outer diameter-to-shell thickness aspect ratio provides tunability of the localized
surface plasmon resonance (SPR).10,11,16
In Chapter 3, the difference between the mechanical
properties of HGNs compared to those of SGNs was discussed; the coherent acoustic oscillations
of HGNs exhibit a longer period compared to SGNs.23–25
Examination of a comprehensive range
of particle sizes demonstrated that the isotropic coherent acoustic vibrations of HGNs are
structure dependent and depend on the electron-phonon coupling lifetime.25
In addition, apparent
electron–phonon coupling rates observed for isolated HGNs are faster than those seen for HGN
aggregates or SGNs.11
The latter property may significantly impact technologies depending on
metal-interface energy transfer (e.g. nanoelectronics, photothermal therapy, etc.). This issue is
addressed by systematically studying the size-dependent electron–phonon coupling of a series of
isolated HGNs and SGNs using femtosecond time resolved transient extinction spectroscopy.
Electron–phonon coupling can be studied quantitatively using the pump–probe technique.
Electronic excitation of metals by femtosecond laser pulses results in a non-equilibrium electron
gas with high electron temperatures. These hot electrons subsequently cool in three successive
steps: (1) electron–electron scattering, (2) equilibration with the phonon modes of the metal
lattice (electron–phonon coupling), and (3) lattice-to-solvent energy transfer (phonon-phonon
coupling).31
Time-resolved pump–probe techniques that monitor the surface plasmon resonance
in the ‘‘probe’’ step can report on the cooling rates of these three processes.31–34,67
In particular,
the use of the two-temperature model and measurements of the electron–phonon coupling rate
33
(step 2) as a function of excitation pulse energy allow for determination of the metal’s electron–
phonon coupling constant, G.68
As a result, femtosecond time-resolved transient extinction has
become a widely used experimental tool for quantifying electron–phonon coupling strength in
both bulk films and metal nanostructures.31–34,67,81–92
Electron–phonon coupling times and constants for metal nanoparticles exhibit both
particle size-independent83–89
as well as size-dependent90–92
values, depending on the identity of
the metal and the domain size being examined. Hodak et al. reported electron–phonon coupling
times of 630 ± 100 fs and 500 ± 200 fs for 10 ± 3 nm and 50 ± 10 nm diameter silver particles,
respectively.93
The authors attributed the apparent size independence of the electron–phonon
time to the fact that both the electronic heat capacity and the coupling constant, which determine
the lifetime, are directly proportional to particle volume.93
Link et al. made similar observations;
electron–phonon relaxation times of 1.6, 1.6, and 1.7 ps were determined for gold nanoparticles
with diameters of 9, 22, and 48 nm, respectively.87
These authors proposed that the dominant
electron scattering process occurred at twin boundaries or other particle defects revealed in the
HRTEM images, resulting in size-independent lifetimes.87
In contrast, Del Fatti et al. observed
size-dependent dynamics for silver nanoparticles embedded in a glass matrix; the lifetimes
determined for these structures ranged from ~0.5 ps for particles with a 3-nm radius to 0.9 ps for
particles with a 15-nm radius.34
They proposed that the combination of the spatial confinement
of the electron-lattice interactions in the smaller particles and the increased electron-surface
scattering created by the ultrafast heating of the electrons enhanced the electron–phonon
coupling in small metal nanoparticles.34
In examining Ag and Au nanoparticles of various sizes
that were either supported on a glass slide, suspended in aqueous solutions, or embedded in
polymer matrices, Arbouet et al. found that the electron– phonon time was independent of the
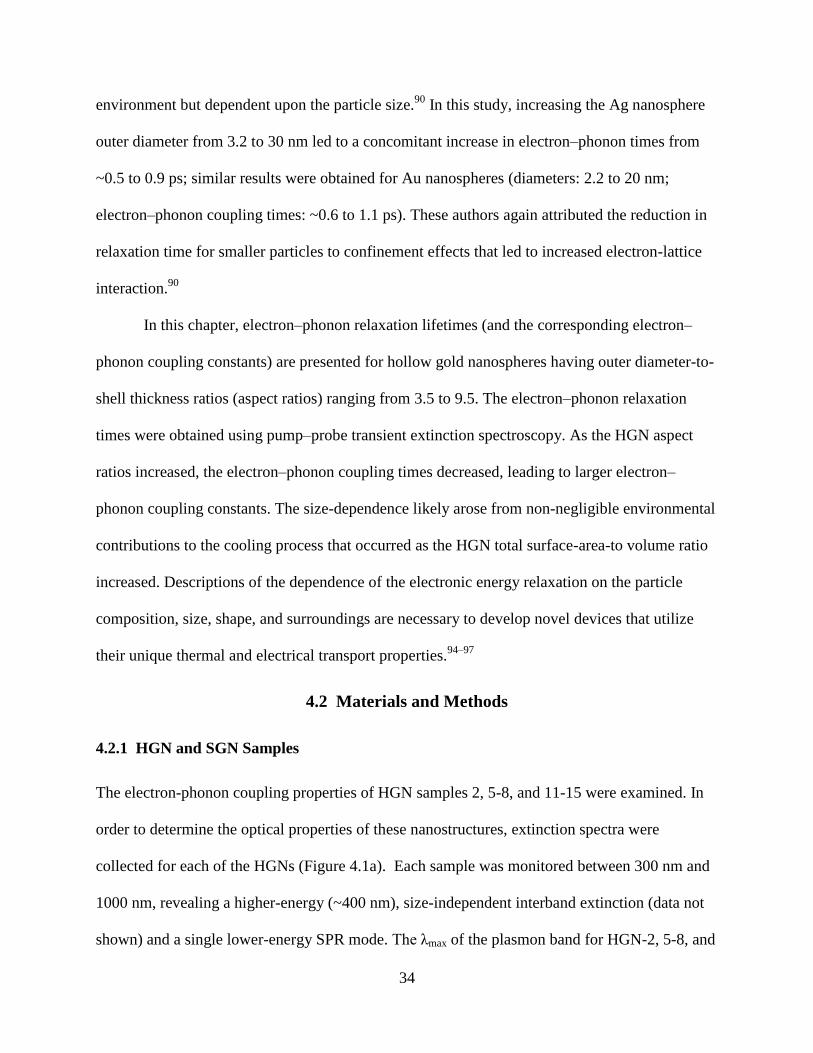
34
environment but dependent upon the particle size.90
In this study, increasing the Ag nanosphere
outer diameter from 3.2 to 30 nm led to a concomitant increase in electron–phonon times from
~0.5 to 0.9 ps; similar results were obtained for Au nanospheres (diameters: 2.2 to 20 nm;
electron–phonon coupling times: ~0.6 to 1.1 ps). These authors again attributed the reduction in
relaxation time for smaller particles to confinement effects that led to increased electron-lattice
interaction.90
In this chapter, electron–phonon relaxation lifetimes (and the corresponding electron–
phonon coupling constants) are presented for hollow gold nanospheres having outer diameter-to-
shell thickness ratios (aspect ratios) ranging from 3.5 to 9.5. The electron–phonon relaxation
times were obtained using pump–probe transient extinction spectroscopy. As the HGN aspect
ratios increased, the electron–phonon coupling times decreased, leading to larger electron–
phonon coupling constants. The size-dependence likely arose from non-negligible environmental
contributions to the cooling process that occurred as the HGN total surface-area-to volume ratio
increased. Descriptions of the dependence of the electronic energy relaxation on the particle
composition, size, shape, and surroundings are necessary to develop novel devices that utilize
their unique thermal and electrical transport properties.94–97
4.2 Materials and Methods
4.2.1 HGN and SGN Samples
The electron-phonon coupling properties of HGN samples 2, 5-8, and 11-15 were examined. In
order to determine the optical properties of these nanostructures, extinction spectra were
collected for each of the HGNs (Figure 4.1a). Each sample was monitored between 300 nm and
1000 nm, revealing a higher-energy (~400 nm), size-independent interband extinction (data not
shown) and a single lower-energy SPR mode. The λmax of the plasmon band for HGN-2, 5-8, and
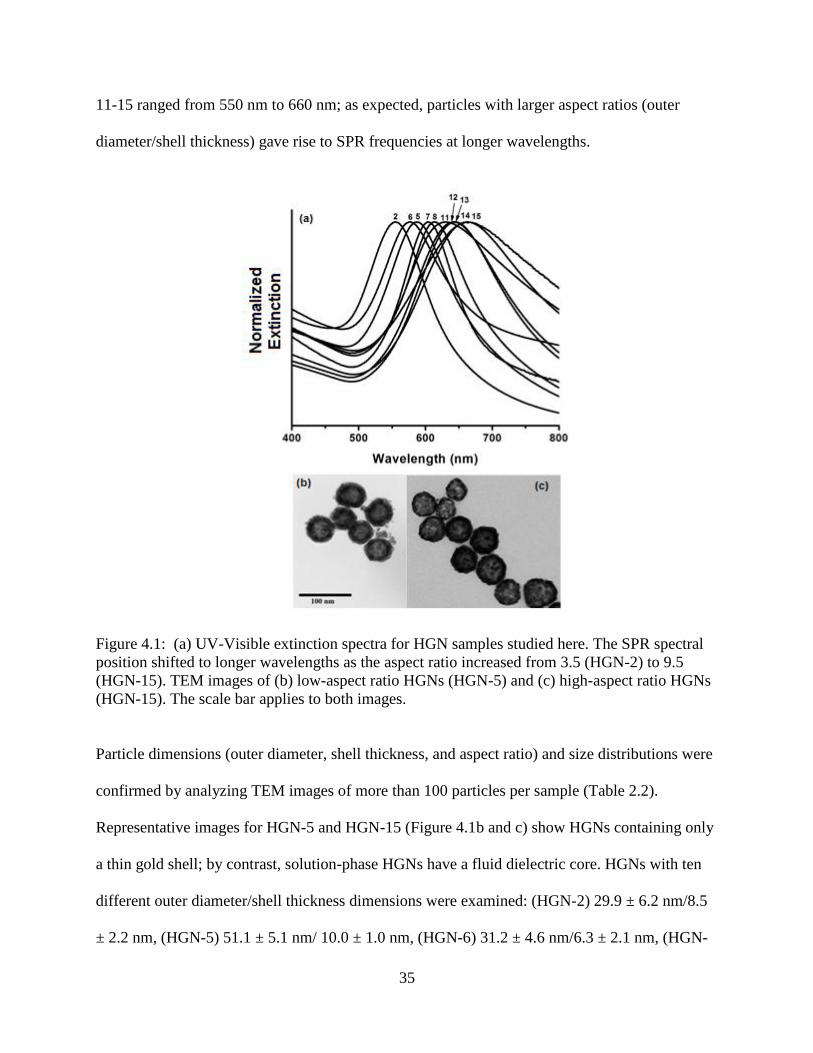
35
11-15 ranged from 550 nm to 660 nm; as expected, particles with larger aspect ratios (outer
diameter/shell thickness) gave rise to SPR frequencies at longer wavelengths.
Figure 4.1: (a) UV-Visible extinction spectra for HGN samples studied here. The SPR spectral
position shifted to longer wavelengths as the aspect ratio increased from 3.5 (HGN-2) to 9.5
(HGN-15). TEM images of (b) low-aspect ratio HGNs (HGN-5) and (c) high-aspect ratio HGNs
(HGN-15). The scale bar applies to both images.
Particle dimensions (outer diameter, shell thickness, and aspect ratio) and size distributions were
confirmed by analyzing TEM images of more than 100 particles per sample (Table 2.2).
Representative images for HGN-5 and HGN-15 (Figure 4.1b and c) show HGNs containing only
a thin gold shell; by contrast, solution-phase HGNs have a fluid dielectric core. HGNs with ten
different outer diameter/shell thickness dimensions were examined: (HGN-2) 29.9 ± 6.2 nm/8.5
± 2.2 nm, (HGN-5) 51.1 ± 5.1 nm/ 10.0 ± 1.0 nm, (HGN-6) 31.2 ± 4.6 nm/6.3 ± 2.1 nm, (HGN-
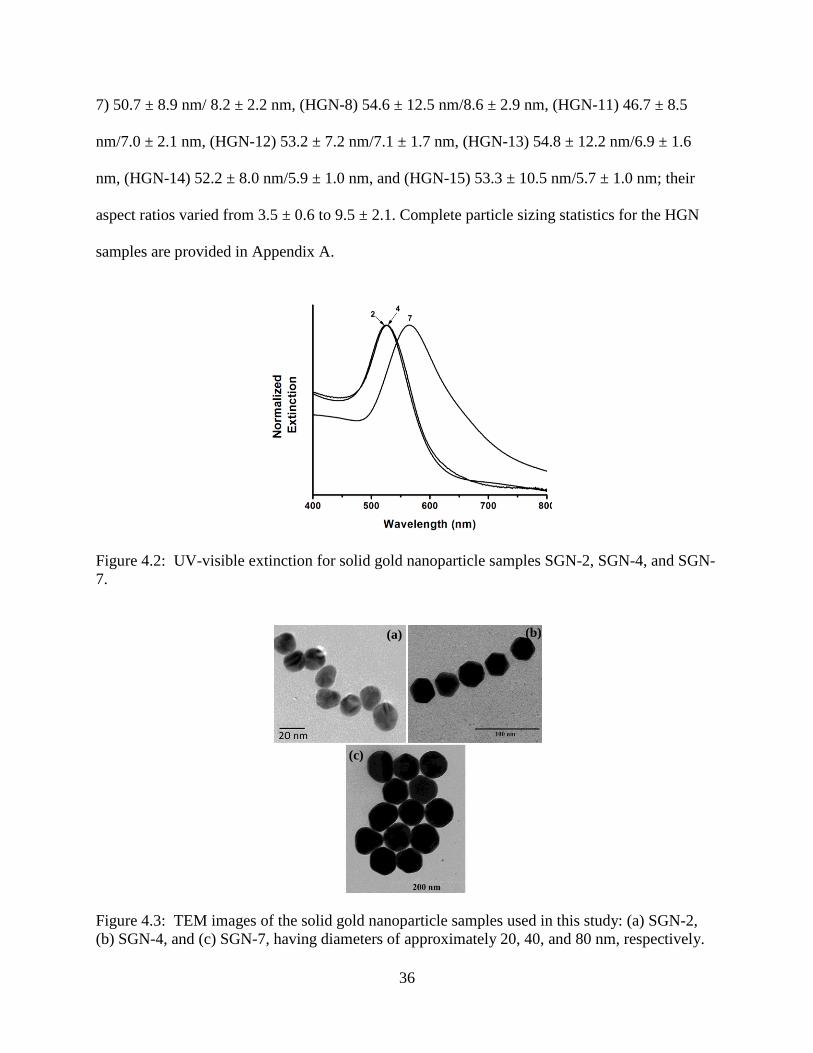
36
7) 50.7 ± 8.9 nm/ 8.2 ± 2.2 nm, (HGN-8) 54.6 ± 12.5 nm/8.6 ± 2.9 nm, (HGN-11) 46.7 ± 8.5
nm/7.0 ± 2.1 nm, (HGN-12) 53.2 ± 7.2 nm/7.1 ± 1.7 nm, (HGN-13) 54.8 ± 12.2 nm/6.9 ± 1.6
nm, (HGN-14) 52.2 ± 8.0 nm/5.9 ± 1.0 nm, and (HGN-15) 53.3 ± 10.5 nm/5.7 ± 1.0 nm; their
aspect ratios varied from 3.5 ± 0.6 to 9.5 ± 2.1. Complete particle sizing statistics for the HGN
samples are provided in Appendix A.
Figure 4.2: UV-visible extinction for solid gold nanoparticle samples SGN-2, SGN-4, and SGN-
7.
Figure 4.3: TEM images of the solid gold nanoparticle samples used in this study: (a) SGN-2,
(b) SGN-4, and (c) SGN-7, having diameters of approximately 20, 40, and 80 nm, respectively.
(c)
(a) (b)
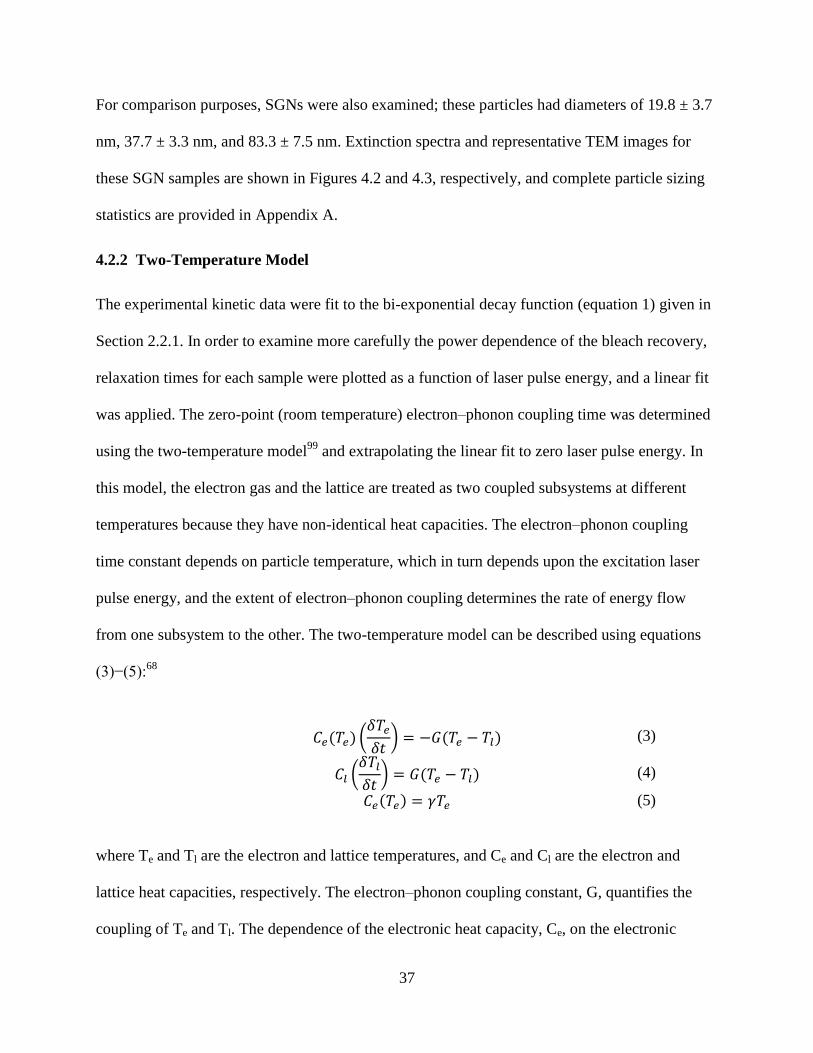
37
For comparison purposes, SGNs were also examined; these particles had diameters of 19.8 ± 3.7
nm, 37.7 ± 3.3 nm, and 83.3 ± 7.5 nm. Extinction spectra and representative TEM images for
these SGN samples are shown in Figures 4.2 and 4.3, respectively, and complete particle sizing
statistics are provided in Appendix A.
4.2.2 Two-Temperature Model
The experimental kinetic data were fit to the bi-exponential decay function (equation 1) given in
Section 2.2.1. In order to examine more carefully the power dependence of the bleach recovery,
relaxation times for each sample were plotted as a function of laser pulse energy, and a linear fit
was applied. The zero-point (room temperature) electron–phonon coupling time was determined
using the two-temperature model99
and extrapolating the linear fit to zero laser pulse energy. In
this model, the electron gas and the lattice are treated as two coupled subsystems at different
temperatures because they have non-identical heat capacities. The electron–phonon coupling
time constant depends on particle temperature, which in turn depends upon the excitation laser
pulse energy, and the extent of electron–phonon coupling determines the rate of energy flow
from one subsystem to the other. The two-temperature model can be described using equations
(3)−(5):68
(3)
(4)
(5)
where Te and Tl are the electron and lattice temperatures, and Ce and Cl are the electron and
lattice heat capacities, respectively. The electron–phonon coupling constant, G, quantifies the
coupling of Te and Tl. The dependence of the electronic heat capacity, Ce, on the electronic
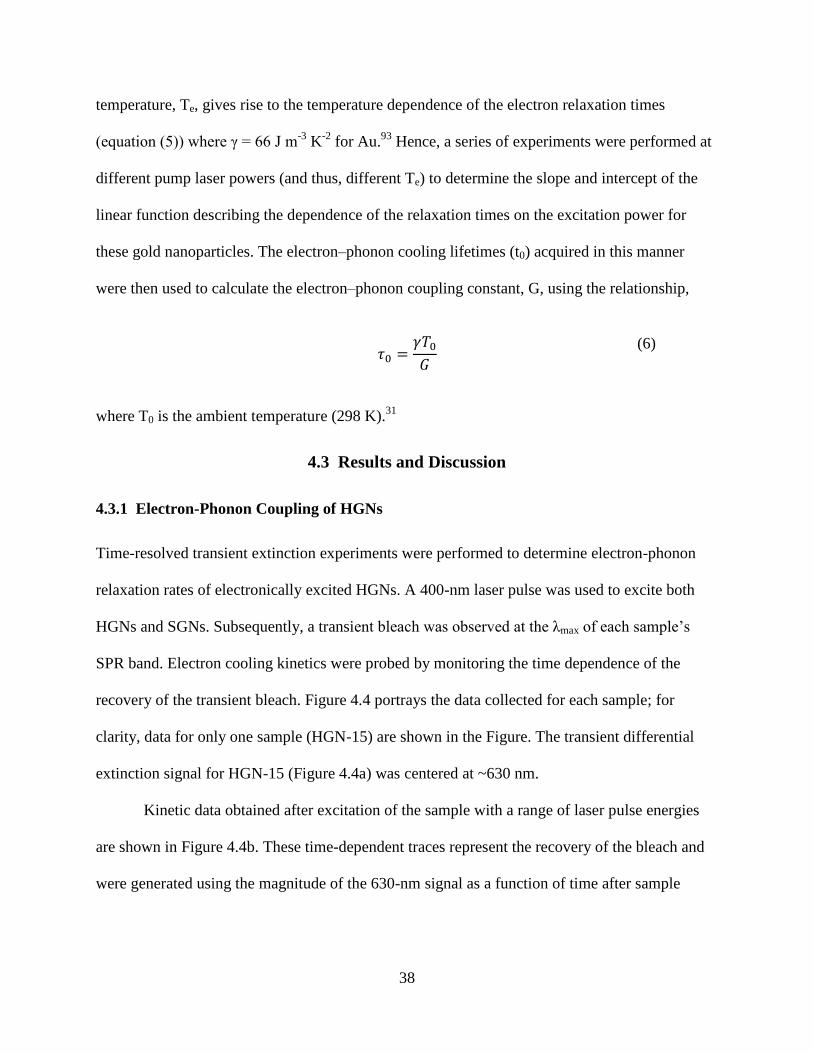
38
temperature, Te, gives rise to the temperature dependence of the electron relaxation times
(equation (5)) where γ = 66 J m-3
K-2
for Au.93
Hence, a series of experiments were performed at
different pump laser powers (and thus, different Te) to determine the slope and intercept of the
linear function describing the dependence of the relaxation times on the excitation power for
these gold nanoparticles. The electron–phonon cooling lifetimes (t0) acquired in this manner
were then used to calculate the electron–phonon coupling constant, G, using the relationship,
(6)
where T0 is the ambient temperature (298 K).31
4.3 Results and Discussion
4.3.1 Electron-Phonon Coupling of HGNs
Time-resolved transient extinction experiments were performed to determine electron-phonon
relaxation rates of electronically excited HGNs. A 400-nm laser pulse was used to excite both
HGNs and SGNs. Subsequently, a transient bleach was observed at the λmax of each sample’s
SPR band. Electron cooling kinetics were probed by monitoring the time dependence of the
recovery of the transient bleach. Figure 4.4 portrays the data collected for each sample; for
clarity, data for only one sample (HGN-15) are shown in the Figure. The transient differential
extinction signal for HGN-15 (Figure 4.4a) was centered at ~630 nm.
Kinetic data obtained after excitation of the sample with a range of laser pulse energies
are shown in Figure 4.4b. These time-dependent traces represent the recovery of the bleach and
were generated using the magnitude of the 630-nm signal as a function of time after sample
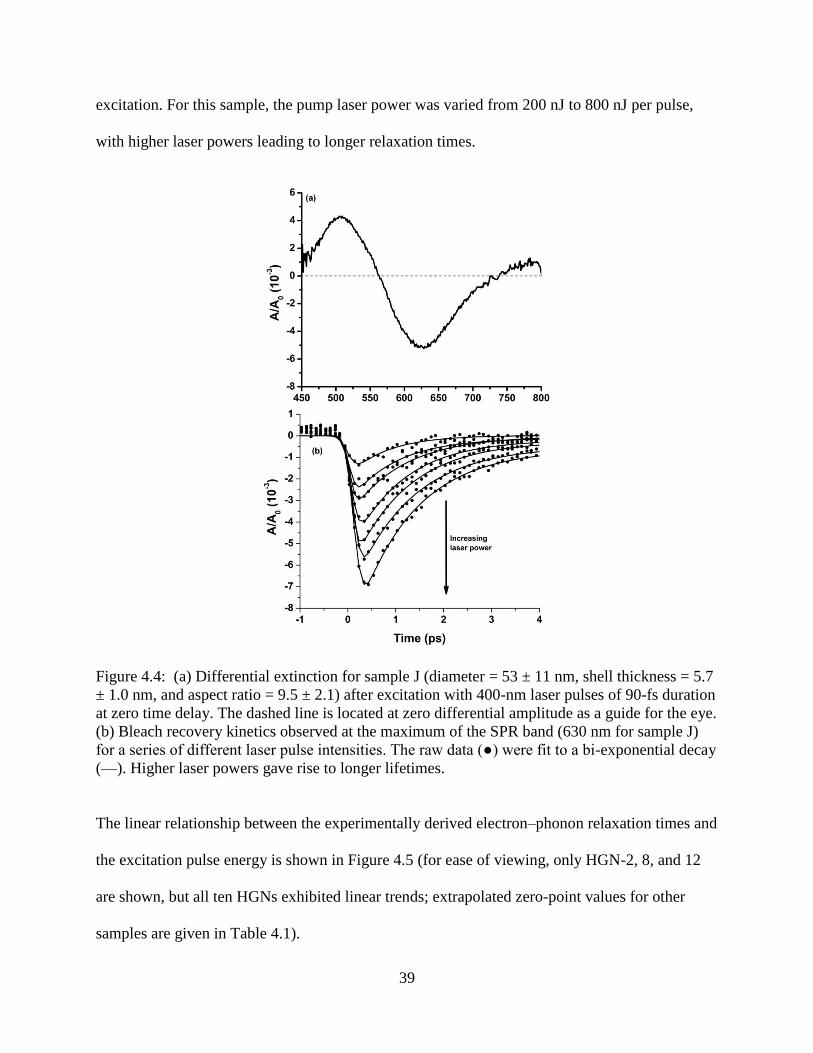
39
excitation. For this sample, the pump laser power was varied from 200 nJ to 800 nJ per pulse,
with higher laser powers leading to longer relaxation times.
Figure 4.4: (a) Differential extinction for sample J (diameter = 53 ± 11 nm, shell thickness = 5.7
± 1.0 nm, and aspect ratio = 9.5 ± 2.1) after excitation with 400-nm laser pulses of 90-fs duration
at zero time delay. The dashed line is located at zero differential amplitude as a guide for the eye.
(b) Bleach recovery kinetics observed at the maximum of the SPR band (630 nm for sample J)
for a series of different laser pulse intensities. The raw data (●) were fit to a bi-exponential decay
(—). Higher laser powers gave rise to longer lifetimes.
The linear relationship between the experimentally derived electron–phonon relaxation times and
the excitation pulse energy is shown in Figure 4.5 (for ease of viewing, only HGN-2, 8, and 12
are shown, but all ten HGNs exhibited linear trends; extrapolated zero-point values for other
samples are given in Table 4.1).
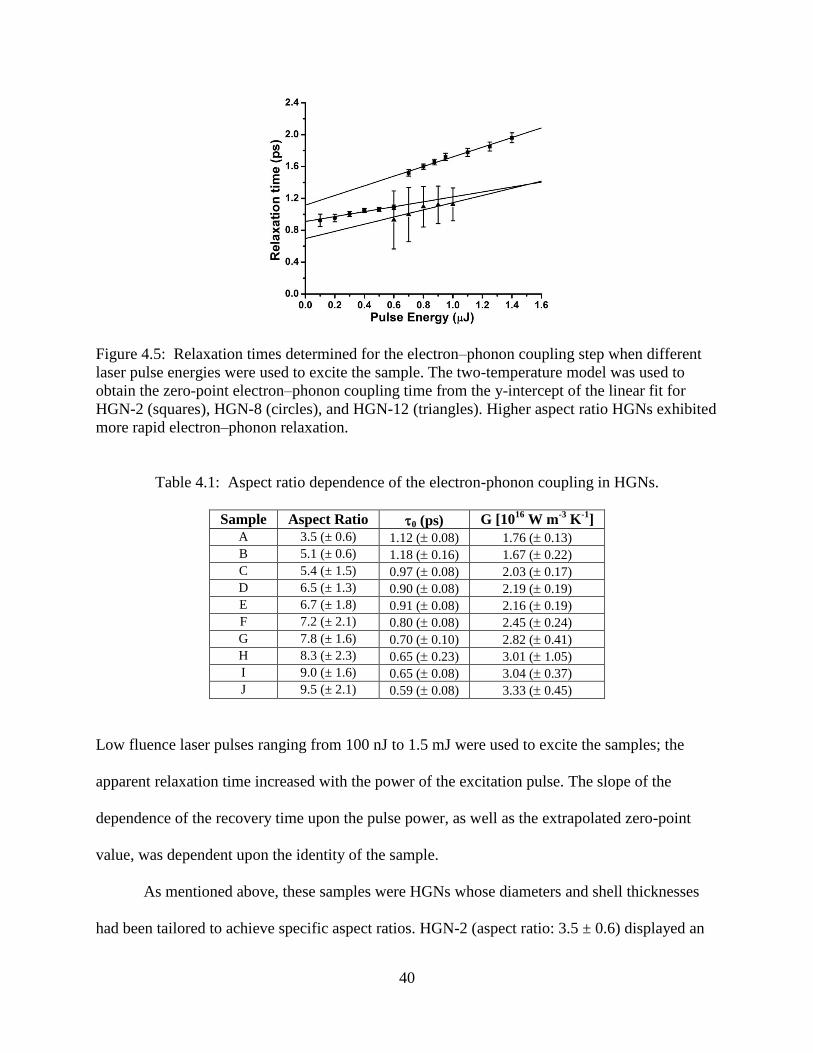
40
Figure 4.5: Relaxation times determined for the electron–phonon coupling step when different
laser pulse energies were used to excite the sample. The two-temperature model was used to
obtain the zero-point electron–phonon coupling time from the y-intercept of the linear fit for
HGN-2 (squares), HGN-8 (circles), and HGN-12 (triangles). Higher aspect ratio HGNs exhibited
more rapid electron–phonon relaxation.
Table 4.1: Aspect ratio dependence of the electron-phonon coupling in HGNs.
Sample Aspect Ratio 0 (ps) G [1016
W m-3
K-1
]
A 3.5 (± 0.6) 1.12 ( 0.08) 1.76 ( 0.13)
B 5.1 (± 0.6) 1.18 ( 0.16) 1.67 ( 0.22)
C 5.4 (± 1.5) 0.97 ( 0.08) 2.03 ( 0.17)
D 6.5 (± 1.3) 0.90 ( 0.08) 2.19 ( 0.19)
E 6.7 (± 1.8) 0.91 ( 0.08) 2.16 ( 0.19)
F 7.2 (± 2.1) 0.80 ( 0.08) 2.45 ( 0.24)
G 7.8 (± 1.6) 0.70 ( 0.10) 2.82 ( 0.41)
H 8.3 (± 2.3) 0.65 ( 0.23) 3.01 ( 1.05)
I 9.0 (± 1.6) 0.65 ( 0.08) 3.04 ( 0.37)
J 9.5 (± 2.1) 0.59 ( 0.08) 3.33 ( 0.45)
Low fluence laser pulses ranging from 100 nJ to 1.5 mJ were used to excite the samples; the
apparent relaxation time increased with the power of the excitation pulse. The slope of the
dependence of the recovery time upon the pulse power, as well as the extrapolated zero-point
value, was dependent upon the identity of the sample.
As mentioned above, these samples were HGNs whose diameters and shell thicknesses
had been tailored to achieve specific aspect ratios. HGN-2 (aspect ratio: 3.5 ± 0.6) displayed an
41
apparent electron–phonon relaxation time of 1.12 ± 0.08 ps, similar to that observed for a solid
gold nanoparticle. When the HGN aspect ratio was increased to 6.7 ± 1.8 (HGN-8), the electron–
phonon relaxation occurred more quickly (0.91 ± 0.08 ps). The observed relaxation was even
more rapid (0.70 ± 0.10 ps) for HGN-12, which contained HGNs with an aspect ratio of 7.8 ±
1.6. The larger error bars in HGN-12 likely arose from the smaller absorption cross section of
thinner-shelled HGNs, which decreases the optical density, making low power measurements
more difficult to acquire (shell thicknesses: 2—8.5 nm, 8—8.6 nm, 12—7.1 nm). The electron–
phonon coupling times as well as the corresponding coupling constants (G) for all samples are
presented in Table 4.1.
4.3.2 Size Dependence
Coupling times ranged from 0.59 ± 0.08 ps (HGN-15) to 1.18 ± 0.16 ps (HGN-5); G values
spanned (1.67 ± 0.22) x 1016
W m-3
K-1
for HGN-5 to (3.33 ± 0.45) x 1016
W m-3
K-1
for HGN-
15. Figure 4.6a portrays the zero-point electron–phonon coupling times as a function of the
particle aspect ratio; increases in the HGN aspect ratio led to decreases in the electron–phonon
coupling times. Figure 4.6b shows the linear relationship between G and the particle aspect ratio,
suggesting a size-dependence for the HGN electron–phonon coupling. However, the G values
obtained for samples HGN-2 and HGN-5 (aspect ratios 3.5 and 5.1, respectively) were within
error of each other. Further, their electron–phonon cooling times were similar to those observed
for SGNs, suggesting that size dependence becomes more pronounced for higher-aspect ratio
hollow particles.
To determine whether a similar size dependence could be observed in the relaxation
kinetics of solid particles, SGNs with diameters of 20 nm (HGN-2), 38 nm (HGN-4), and 83 nm
(HGN-7) were examined. The apparent electron–phonon coupling times were 1.00 ± 0.10, 1.20 ±
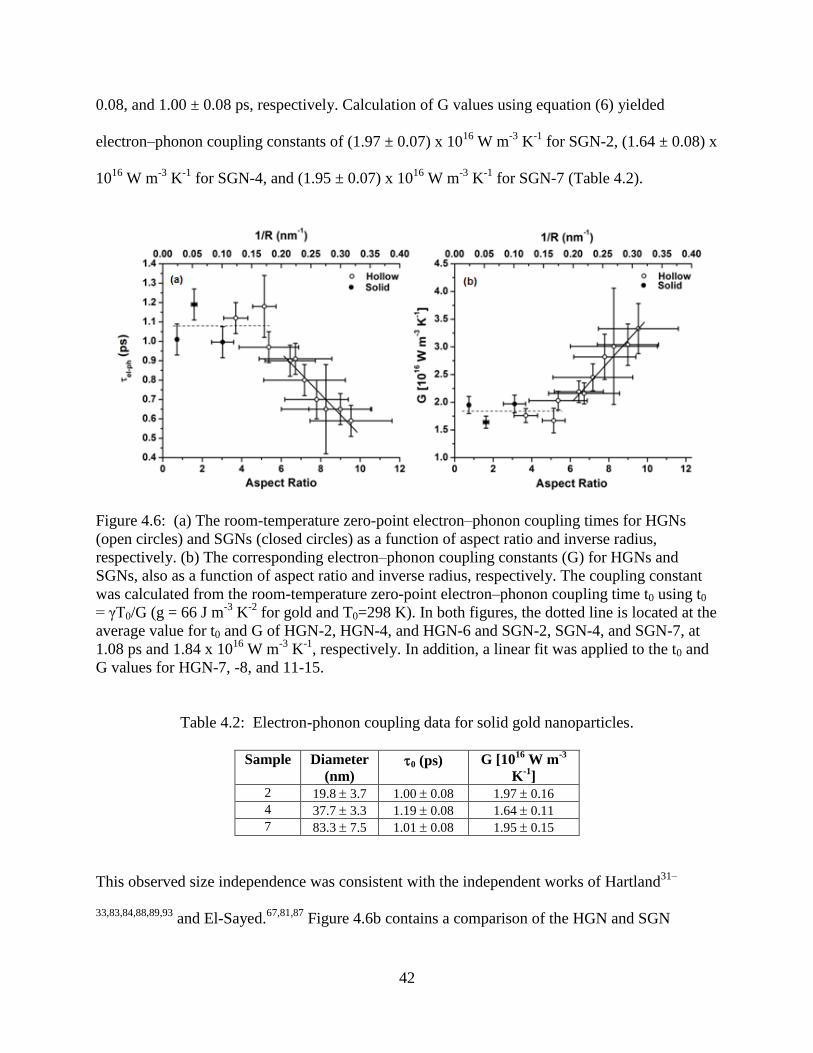
42
0.08, and 1.00 ± 0.08 ps, respectively. Calculation of G values using equation (6) yielded
electron–phonon coupling constants of (1.97 ± 0.07) x 1016
W m-3
K-1
for SGN-2, (1.64 ± 0.08) x
1016
W m-3
K-1
for SGN-4, and (1.95 ± 0.07) x 1016
W m-3
K-1
for SGN-7 (Table 4.2).
Figure 4.6: (a) The room-temperature zero-point electron–phonon coupling times for HGNs
(open circles) and SGNs (closed circles) as a function of aspect ratio and inverse radius,
respectively. (b) The corresponding electron–phonon coupling constants (G) for HGNs and
SGNs, also as a function of aspect ratio and inverse radius, respectively. The coupling constant
was calculated from the room-temperature zero-point electron–phonon coupling time t0 using t0
= γT0/G (g = 66 J m-3
K-2
for gold and T0=298 K). In both figures, the dotted line is located at the
average value for t0 and G of HGN-2, HGN-4, and HGN-6 and SGN-2, SGN-4, and SGN-7, at
1.08 ps and 1.84 x 10¹⁶
W m-3
K-1
, respectively. In addition, a linear fit was applied to the t0 and
G values for HGN-7, -8, and 11-15.
Table 4.2: Electron-phonon coupling data for solid gold nanoparticles.
Sample Diameter
(nm) 0 (ps) G [10
16 W m
-3
K-1
] 2 19.8 3.7 1.00 0.08 1.97 0.16
4 37.7 3.3 1.19 0.08 1.64 0.11
7 83.3 7.5 1.01 0.08 1.95 0.15
This observed size independence was consistent with the independent works of Hartland31–
33,83,84,88,89,93 and El-Sayed.
67,81,87 Figure 4.6b contains a comparison of the HGN and SGN
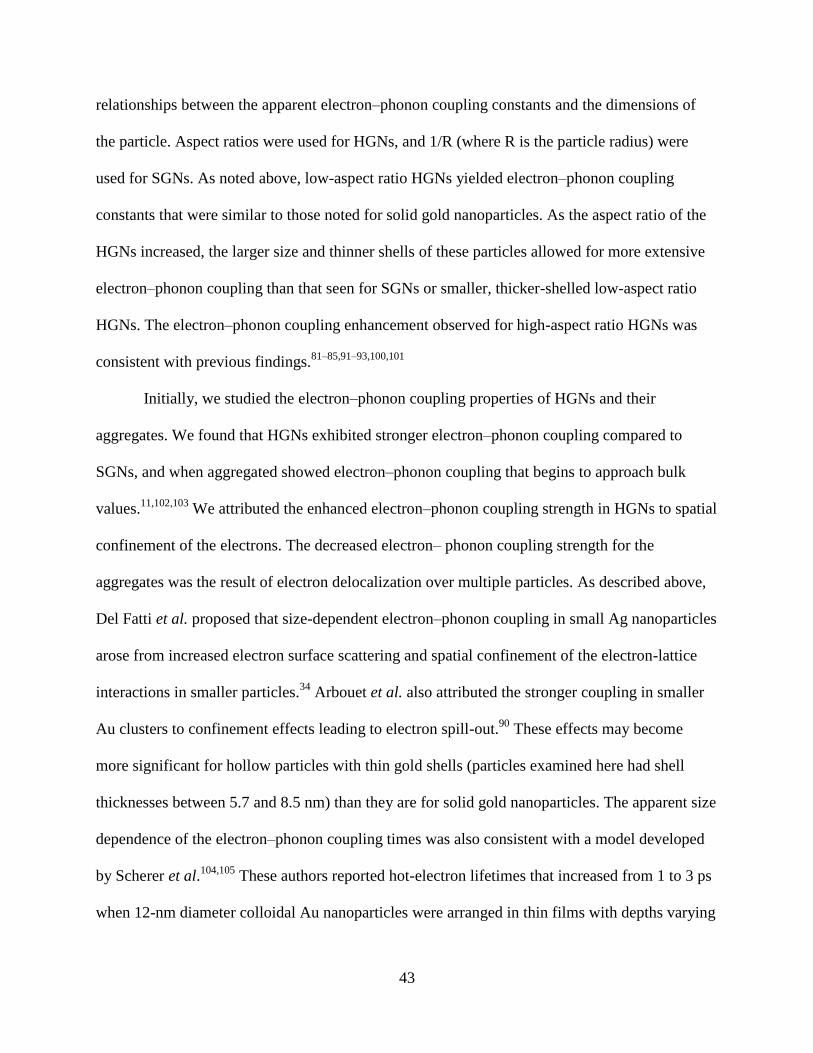
43
relationships between the apparent electron–phonon coupling constants and the dimensions of
the particle. Aspect ratios were used for HGNs, and 1/R (where R is the particle radius) were
used for SGNs. As noted above, low-aspect ratio HGNs yielded electron–phonon coupling
constants that were similar to those noted for solid gold nanoparticles. As the aspect ratio of the
HGNs increased, the larger size and thinner shells of these particles allowed for more extensive
electron–phonon coupling than that seen for SGNs or smaller, thicker-shelled low-aspect ratio
HGNs. The electron–phonon coupling enhancement observed for high-aspect ratio HGNs was
consistent with previous findings.81–85,91–93,100,101
Initially, we studied the electron–phonon coupling properties of HGNs and their
aggregates. We found that HGNs exhibited stronger electron–phonon coupling compared to
SGNs, and when aggregated showed electron–phonon coupling that begins to approach bulk
values.11,102,103
We attributed the enhanced electron–phonon coupling strength in HGNs to spatial
confinement of the electrons. The decreased electron– phonon coupling strength for the
aggregates was the result of electron delocalization over multiple particles. As described above,
Del Fatti et al. proposed that size-dependent electron–phonon coupling in small Ag nanoparticles
arose from increased electron surface scattering and spatial confinement of the electron-lattice
interactions in smaller particles.34
Arbouet et al. also attributed the stronger coupling in smaller
Au clusters to confinement effects leading to electron spill-out.90
These effects may become
more significant for hollow particles with thin gold shells (particles examined here had shell
thicknesses between 5.7 and 8.5 nm) than they are for solid gold nanoparticles. The apparent size
dependence of the electron–phonon coupling times was also consistent with a model developed
by Scherer et al.104,105
These authors reported hot-electron lifetimes that increased from 1 to 3 ps
when 12-nm diameter colloidal Au nanoparticles were arranged in thin films with depths varying
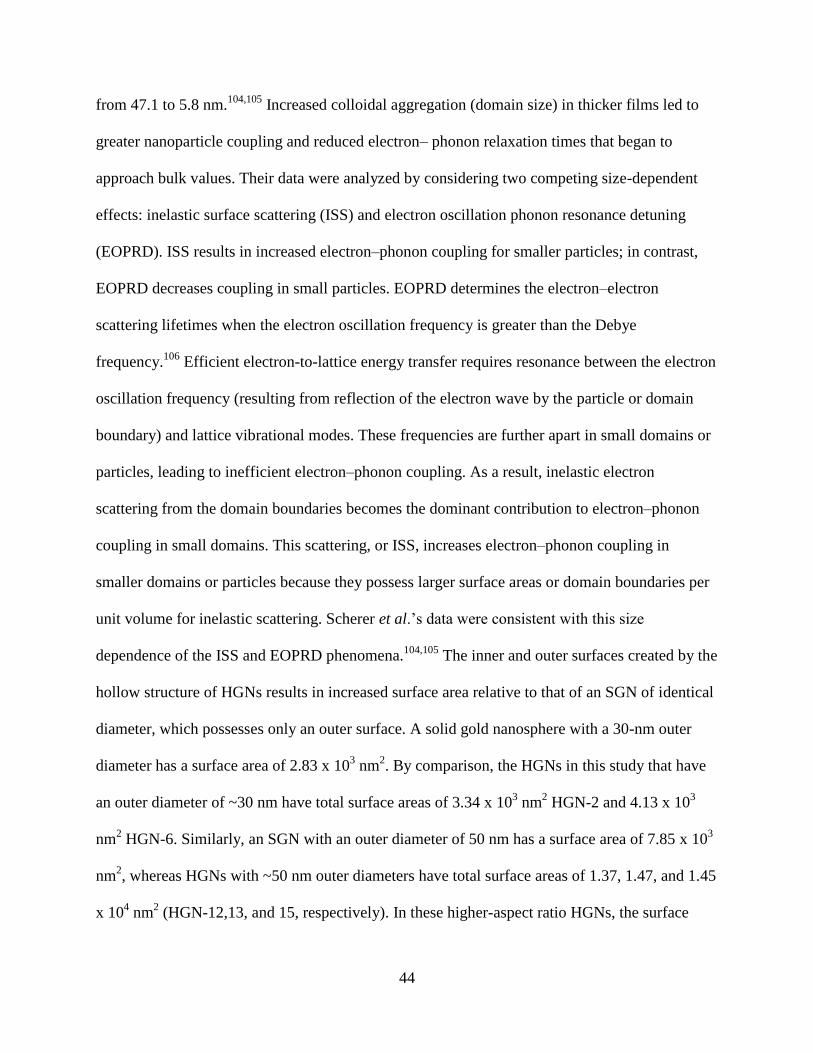
44
from 47.1 to 5.8 nm.104,105
Increased colloidal aggregation (domain size) in thicker films led to
greater nanoparticle coupling and reduced electron– phonon relaxation times that began to
approach bulk values. Their data were analyzed by considering two competing size-dependent
effects: inelastic surface scattering (ISS) and electron oscillation phonon resonance detuning
(EOPRD). ISS results in increased electron–phonon coupling for smaller particles; in contrast,
EOPRD decreases coupling in small particles. EOPRD determines the electron–electron
scattering lifetimes when the electron oscillation frequency is greater than the Debye
frequency.106
Efficient electron-to-lattice energy transfer requires resonance between the electron
oscillation frequency (resulting from reflection of the electron wave by the particle or domain
boundary) and lattice vibrational modes. These frequencies are further apart in small domains or
particles, leading to inefficient electron–phonon coupling. As a result, inelastic electron
scattering from the domain boundaries becomes the dominant contribution to electron–phonon
coupling in small domains. This scattering, or ISS, increases electron–phonon coupling in
smaller domains or particles because they possess larger surface areas or domain boundaries per
unit volume for inelastic scattering. Scherer et al.’s data were consistent with this size
dependence of the ISS and EOPRD phenomena.104,105
The inner and outer surfaces created by the
hollow structure of HGNs results in increased surface area relative to that of an SGN of identical
diameter, which possesses only an outer surface. A solid gold nanosphere with a 30-nm outer
diameter has a surface area of 2.83 x 10³ nm
2. By comparison, the HGNs in this study that have
an outer diameter of ~30 nm have total surface areas of 3.34 x 10³ nm
2 HGN-2 and 4.13 x 10
3
nm2 HGN-6. Similarly, an SGN with an outer diameter of 50 nm has a surface area of 7.85 x 10
3
nm2, whereas HGNs with ~50 nm outer diameters have total surface areas of 1.37, 1.47, and 1.45
x 104 nm
2 (HGN-12,13, and 15, respectively). In these higher-aspect ratio HGNs, the surface
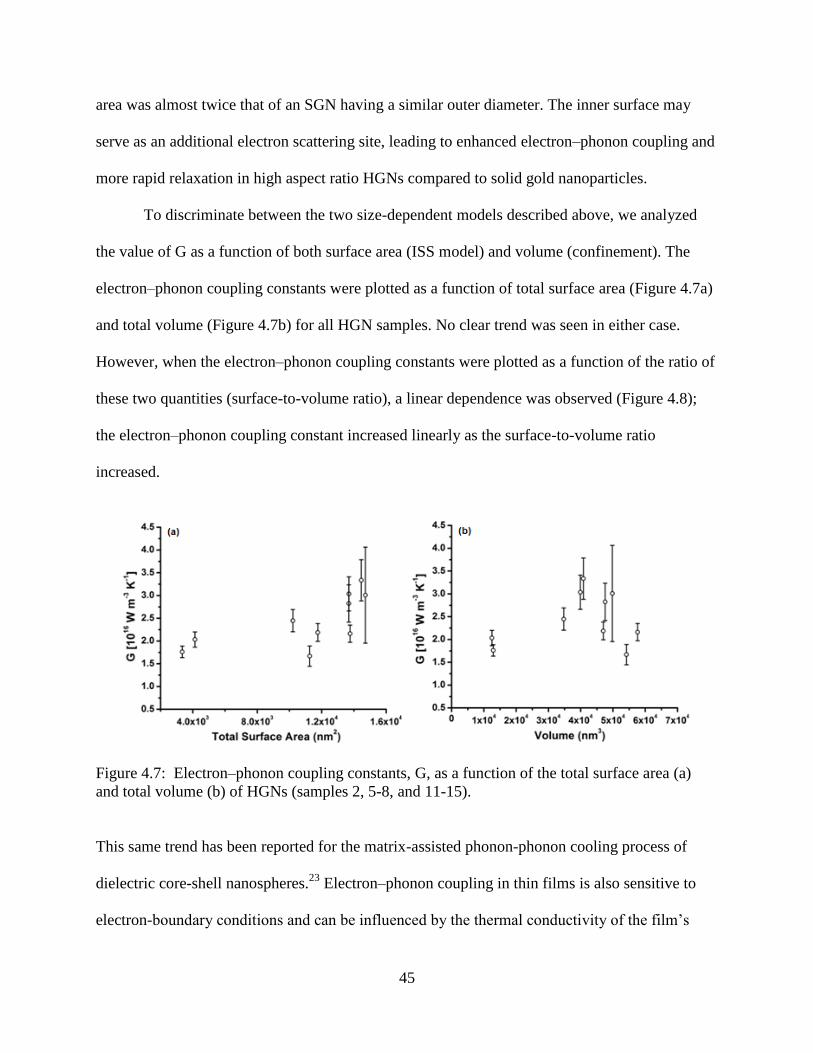
45
area was almost twice that of an SGN having a similar outer diameter. The inner surface may
serve as an additional electron scattering site, leading to enhanced electron–phonon coupling and
more rapid relaxation in high aspect ratio HGNs compared to solid gold nanoparticles.
To discriminate between the two size-dependent models described above, we analyzed
the value of G as a function of both surface area (ISS model) and volume (confinement). The
electron–phonon coupling constants were plotted as a function of total surface area (Figure 4.7a)
and total volume (Figure 4.7b) for all HGN samples. No clear trend was seen in either case.
However, when the electron–phonon coupling constants were plotted as a function of the ratio of
these two quantities (surface-to-volume ratio), a linear dependence was observed (Figure 4.8);
the electron–phonon coupling constant increased linearly as the surface-to-volume ratio
increased.
Figure 4.7: Electron–phonon coupling constants, G, as a function of the total surface area (a)
and total volume (b) of HGNs (samples 2, 5-8, and 11-15).
This same trend has been reported for the matrix-assisted phonon-phonon cooling process of
dielectric core-shell nanospheres.23
Electron–phonon coupling in thin films is also sensitive to
electron-boundary conditions and can be influenced by the thermal conductivity of the film’s
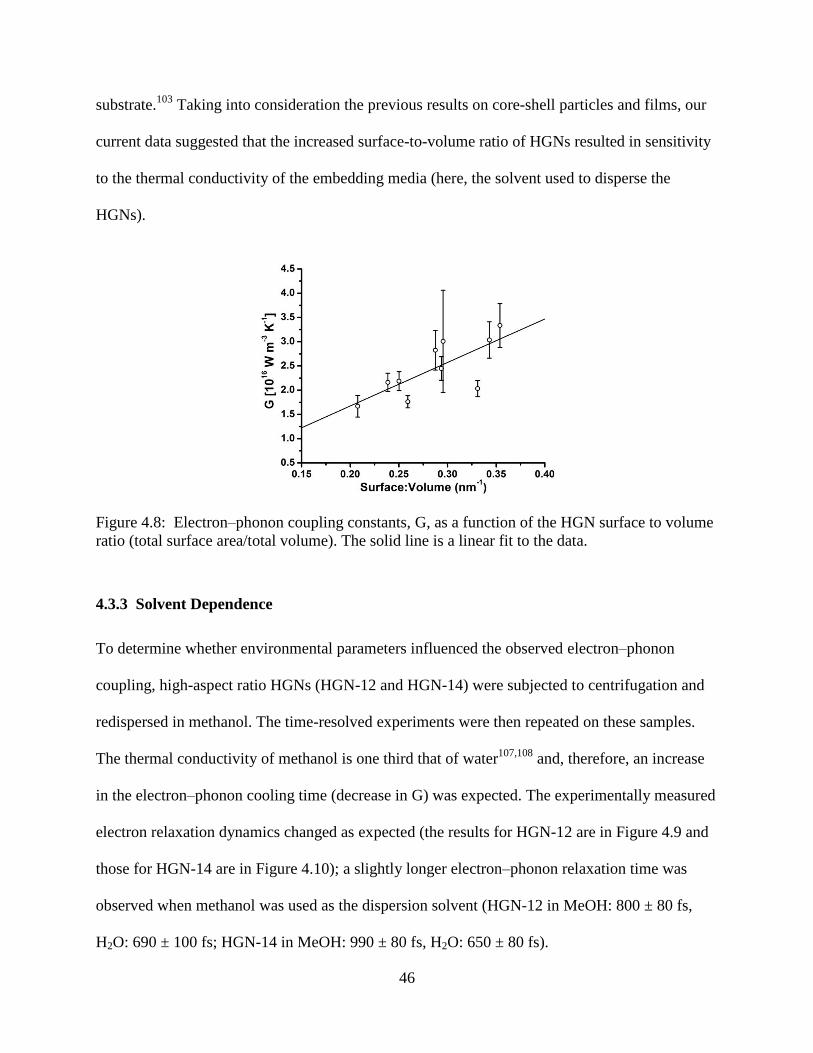
46
substrate.103
Taking into consideration the previous results on core-shell particles and films, our
current data suggested that the increased surface-to-volume ratio of HGNs resulted in sensitivity
to the thermal conductivity of the embedding media (here, the solvent used to disperse the
HGNs).
Figure 4.8: Electron–phonon coupling constants, G, as a function of the HGN surface to volume
ratio (total surface area/total volume). The solid line is a linear fit to the data.
4.3.3 Solvent Dependence
To determine whether environmental parameters influenced the observed electron–phonon
coupling, high-aspect ratio HGNs (HGN-12 and HGN-14) were subjected to centrifugation and
redispersed in methanol. The time-resolved experiments were then repeated on these samples.
The thermal conductivity of methanol is one third that of water107,108
and, therefore, an increase
in the electron–phonon cooling time (decrease in G) was expected. The experimentally measured
electron relaxation dynamics changed as expected (the results for HGN-12 are in Figure 4.9 and
those for HGN-14 are in Figure 4.10); a slightly longer electron–phonon relaxation time was
observed when methanol was used as the dispersion solvent (HGN-12 in MeOH: 800 ± 80 fs,
H2O: 690 ± 100 fs; HGN-14 in MeOH: 990 ± 80 fs, H2O: 650 ± 80 fs).
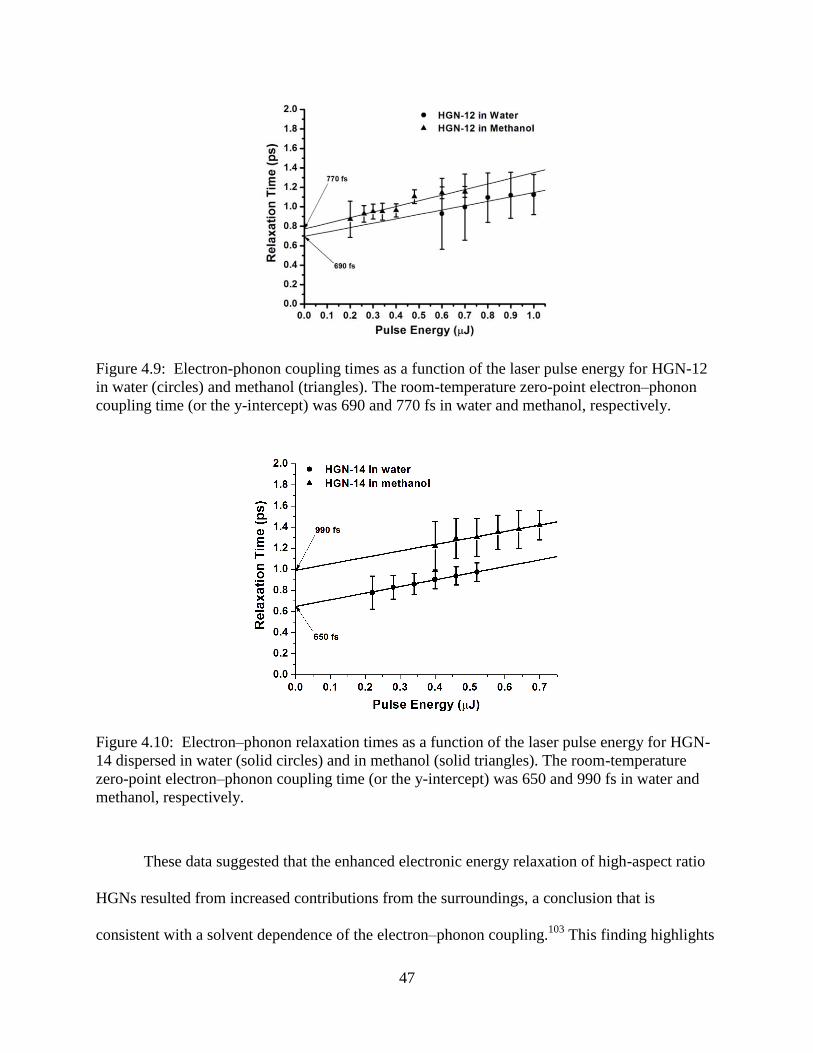
47
Figure 4.9: Electron-phonon coupling times as a function of the laser pulse energy for HGN-12
in water (circles) and methanol (triangles). The room-temperature zero-point electron–phonon
coupling time (or the y-intercept) was 690 and 770 fs in water and methanol, respectively.
Figure 4.10: Electron–phonon relaxation times as a function of the laser pulse energy for HGN-
14 dispersed in water (solid circles) and in methanol (solid triangles). The room-temperature
zero-point electron–phonon coupling time (or the y-intercept) was 650 and 990 fs in water and
methanol, respectively.
These data suggested that the enhanced electronic energy relaxation of high-aspect ratio
HGNs resulted from increased contributions from the surroundings, a conclusion that is
consistent with a solvent dependence of the electron–phonon coupling.103
This finding highlights
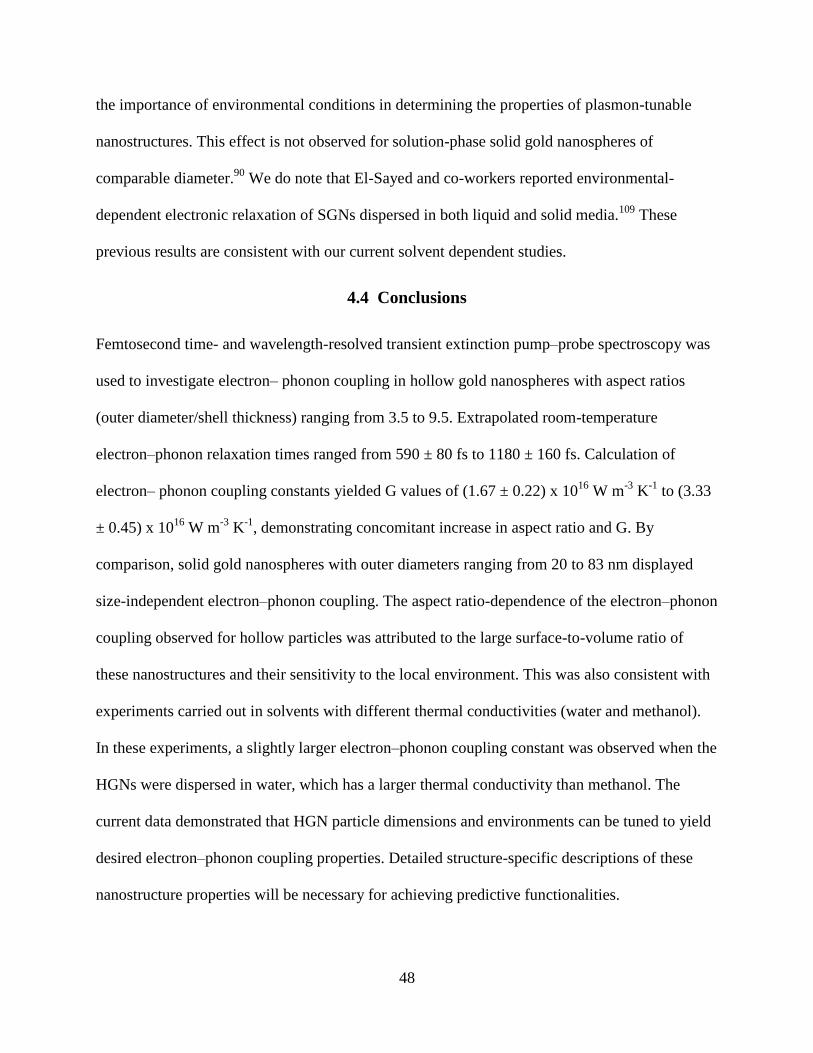
48
the importance of environmental conditions in determining the properties of plasmon-tunable
nanostructures. This effect is not observed for solution-phase solid gold nanospheres of
comparable diameter.90
We do note that El-Sayed and co-workers reported environmental-
dependent electronic relaxation of SGNs dispersed in both liquid and solid media.109
These
previous results are consistent with our current solvent dependent studies.
4.4 Conclusions
Femtosecond time- and wavelength-resolved transient extinction pump–probe spectroscopy was
used to investigate electron– phonon coupling in hollow gold nanospheres with aspect ratios
(outer diameter/shell thickness) ranging from 3.5 to 9.5. Extrapolated room-temperature
electron–phonon relaxation times ranged from 590 ± 80 fs to 1180 ± 160 fs. Calculation of
electron– phonon coupling constants yielded G values of (1.67 ± 0.22) x 1016
W m-3
K-1
to (3.33
± 0.45) x 1016
W m-3
K-1
, demonstrating concomitant increase in aspect ratio and G. By
comparison, solid gold nanospheres with outer diameters ranging from 20 to 83 nm displayed
size-independent electron–phonon coupling. The aspect ratio-dependence of the electron–phonon
coupling observed for hollow particles was attributed to the large surface-to-volume ratio of
these nanostructures and their sensitivity to the local environment. This was also consistent with
experiments carried out in solvents with different thermal conductivities (water and methanol).
In these experiments, a slightly larger electron–phonon coupling constant was observed when the
HGNs were dispersed in water, which has a larger thermal conductivity than methanol. The
current data demonstrated that HGN particle dimensions and environments can be tuned to yield
desired electron–phonon coupling properties. Detailed structure-specific descriptions of these
nanostructure properties will be necessary for achieving predictive functionalities.
49
CHAPTER FIVE
INFLUENCE OF CONFINED FLUIDS ON NANOPARTICLE-
TO-SURROUNDINGS ENERGY TRANSFER
Reproduced with permission from A.M. Dowgiallo and K.L. Knappenberger, Jr., J. Am. Chem.
Soc., 2012, 134, 19393-19400. DOI: 10.1021/ja306644p.
Copyright 2012 American Chemical Society.
5.1 Introduction
The influence of confined fluids on the rate of nanoparticles-to-surroundings energy transfer will
be described in this chapter for both hollow and solid gold nanospheres. The HGNs exhibited
energy transfer half times that ranged from 105 ± 10 ps to 1010 ± 80 ps as the total particle
surface area increased from 1,005 to 28,115 nm2. These data showed behaviors that were
categorized into two classes: energy transfer from HGNs to interior fluids that were confined to
cavities with radii <15 nm and ≥15 nm. Energy transfer times were also determined for solid
gold nanospheres having radii spanning 9−30 nm, with a similar size dependence where the
relaxation times increased from 140 ± 10 to 310 ± 15 ps with increasing nanoparticle size.
Analysis of the size-dependent energy transfer half times revealed that the distinct relaxation rate
constants observed for particle-to-surroundings energy transfer for HGNs with small cavities
were the result of reduced thermal conductivity of confined fluids. These data indicate that the
thermal conductivity of HGN cavity-confined fluids is approximately one-half as great as it is for
bulk liquid water. For all HGNs and SGNs studied, energy dissipation through the solvent and
transfer across the particle/surroundings interface both contributed to the energy relaxation
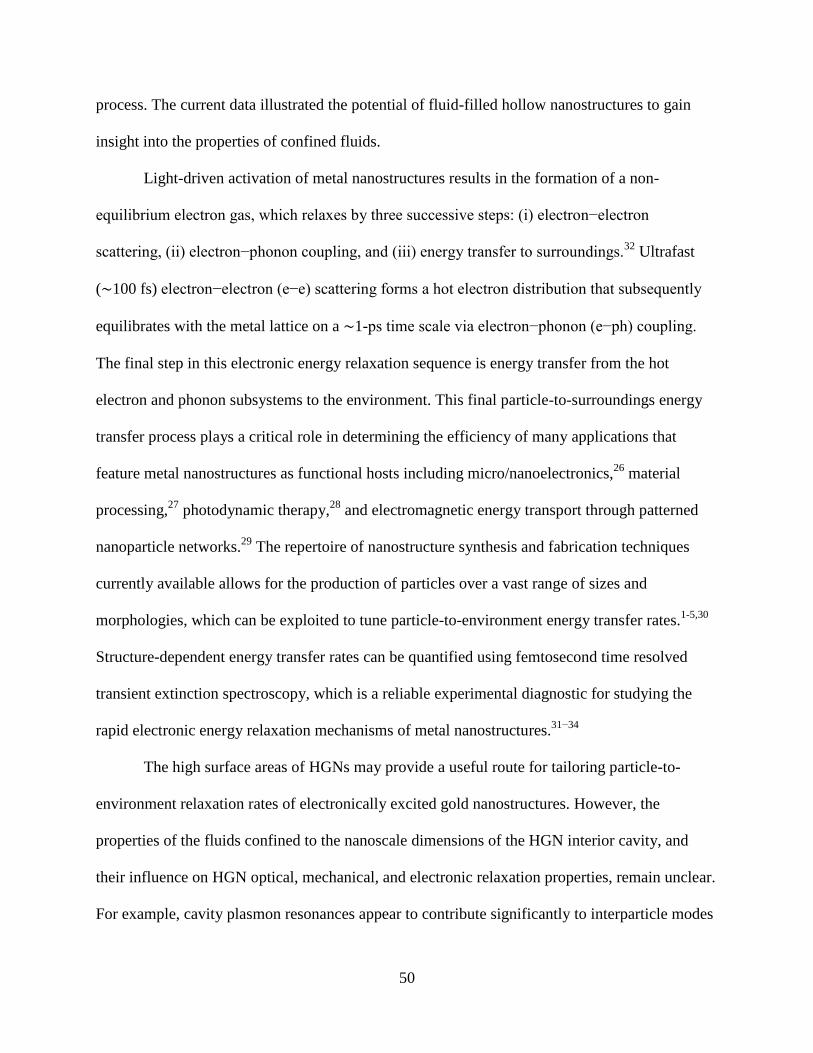
50
process. The current data illustrated the potential of fluid-filled hollow nanostructures to gain
insight into the properties of confined fluids.
Light-driven activation of metal nanostructures results in the formation of a non-
equilibrium electron gas, which relaxes by three successive steps: (i) electron−electron
scattering, (ii) electron−phonon coupling, and (iii) energy transfer to surroundings.32
Ultrafast
(∼100 fs) electron−electron (e−e) scattering forms a hot electron distribution that subsequently
equilibrates with the metal lattice on a ∼1-ps time scale via electron−phonon (e−ph) coupling.
The final step in this electronic energy relaxation sequence is energy transfer from the hot
electron and phonon subsystems to the environment. This final particle-to-surroundings energy
transfer process plays a critical role in determining the efficiency of many applications that
feature metal nanostructures as functional hosts including micro/nanoelectronics,26
material
processing,27
photodynamic therapy,28
and electromagnetic energy transport through patterned
nanoparticle networks.29
The repertoire of nanostructure synthesis and fabrication techniques
currently available allows for the production of particles over a vast range of sizes and
morphologies, which can be exploited to tune particle-to-environment energy transfer rates.1-5,30
Structure-dependent energy transfer rates can be quantified using femtosecond time resolved
transient extinction spectroscopy, which is a reliable experimental diagnostic for studying the
rapid electronic energy relaxation mechanisms of metal nanostructures.31−34
The high surface areas of HGNs may provide a useful route for tailoring particle-to-
environment relaxation rates of electronically excited gold nanostructures. However, the
properties of the fluids confined to the nanoscale dimensions of the HGN interior cavity, and
their influence on HGN optical, mechanical, and electronic relaxation properties, remain unclear.
For example, cavity plasmon resonances appear to contribute significantly to interparticle modes
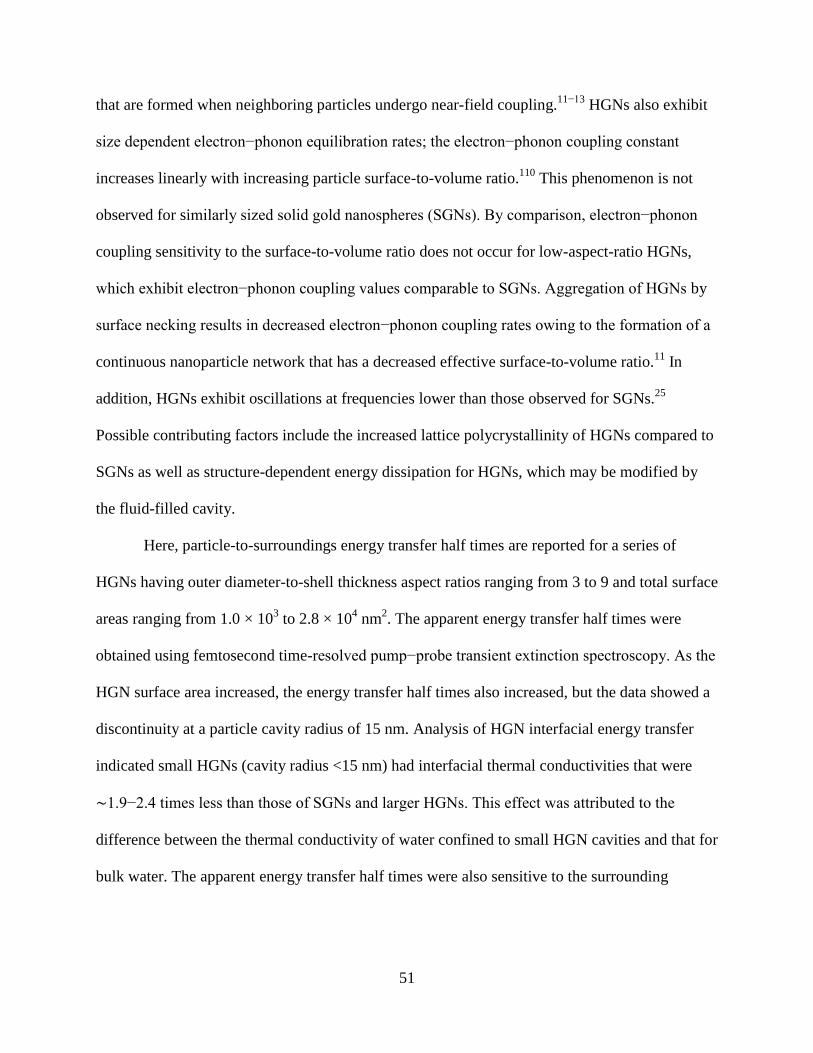
51
that are formed when neighboring particles undergo near-field coupling.11−13
HGNs also exhibit
size dependent electron−phonon equilibration rates; the electron−phonon coupling constant
increases linearly with increasing particle surface-to-volume ratio.110
This phenomenon is not
observed for similarly sized solid gold nanospheres (SGNs). By comparison, electron−phonon
coupling sensitivity to the surface-to-volume ratio does not occur for low-aspect-ratio HGNs,
which exhibit electron−phonon coupling values comparable to SGNs. Aggregation of HGNs by
surface necking results in decreased electron−phonon coupling rates owing to the formation of a
continuous nanoparticle network that has a decreased effective surface-to-volume ratio.11
In
addition, HGNs exhibit oscillations at frequencies lower than those observed for SGNs.25
Possible contributing factors include the increased lattice polycrystallinity of HGNs compared to
SGNs as well as structure-dependent energy dissipation for HGNs, which may be modified by
the fluid-filled cavity.
Here, particle-to-surroundings energy transfer half times are reported for a series of
HGNs having outer diameter-to-shell thickness aspect ratios ranging from 3 to 9 and total surface
areas ranging from 1.0 × 10³ to 2.8 × 10
4 nm
2. The apparent energy transfer half times were
obtained using femtosecond time-resolved pump−probe transient extinction spectroscopy. As the
HGN surface area increased, the energy transfer half times also increased, but the data showed a
discontinuity at a particle cavity radius of 15 nm. Analysis of HGN interfacial energy transfer
indicated small HGNs (cavity radius <15 nm) had interfacial thermal conductivities that were
∼1.9−2.4 times less than those of SGNs and larger HGNs. This effect was attributed to the
difference between the thermal conductivity of water confined to small HGN cavities and that for
bulk water. The apparent energy transfer half times were also sensitive to the surrounding
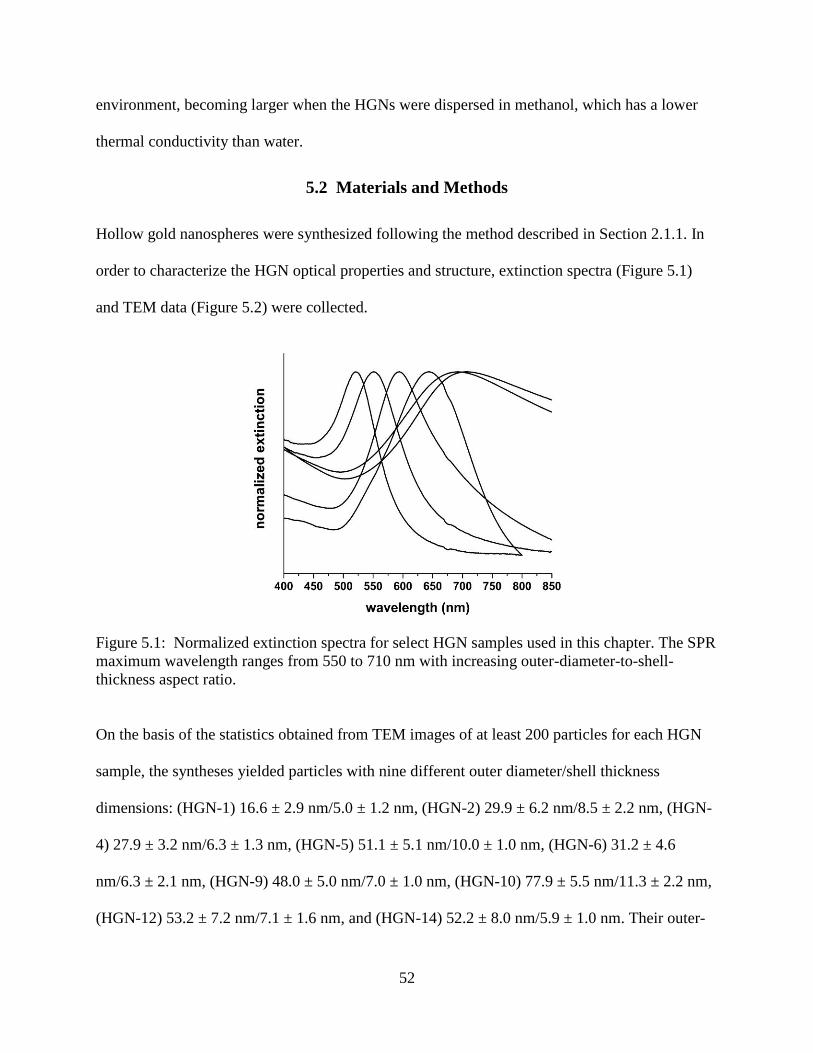
52
environment, becoming larger when the HGNs were dispersed in methanol, which has a lower
thermal conductivity than water.
5.2 Materials and Methods
Hollow gold nanospheres were synthesized following the method described in Section 2.1.1. In
order to characterize the HGN optical properties and structure, extinction spectra (Figure 5.1)
and TEM data (Figure 5.2) were collected.
Figure 5.1: Normalized extinction spectra for select HGN samples used in this chapter. The SPR
maximum wavelength ranges from 550 to 710 nm with increasing outer-diameter-to-shell-
thickness aspect ratio.
On the basis of the statistics obtained from TEM images of at least 200 particles for each HGN
sample, the syntheses yielded particles with nine different outer diameter/shell thickness
dimensions: (HGN-1) 16.6 ± 2.9 nm/5.0 ± 1.2 nm, (HGN-2) 29.9 ± 6.2 nm/8.5 ± 2.2 nm, (HGN-
4) 27.9 ± 3.2 nm/6.3 ± 1.3 nm, (HGN-5) 51.1 ± 5.1 nm/10.0 ± 1.0 nm, (HGN-6) 31.2 ± 4.6
nm/6.3 ± 2.1 nm, (HGN-9) 48.0 ± 5.0 nm/7.0 ± 1.0 nm, (HGN-10) 77.9 ± 5.5 nm/11.3 ± 2.2 nm,
(HGN-12) 53.2 ± 7.2 nm/7.1 ± 1.6 nm, and (HGN-14) 52.2 ± 8.0 nm/5.9 ± 1.0 nm. Their outer-
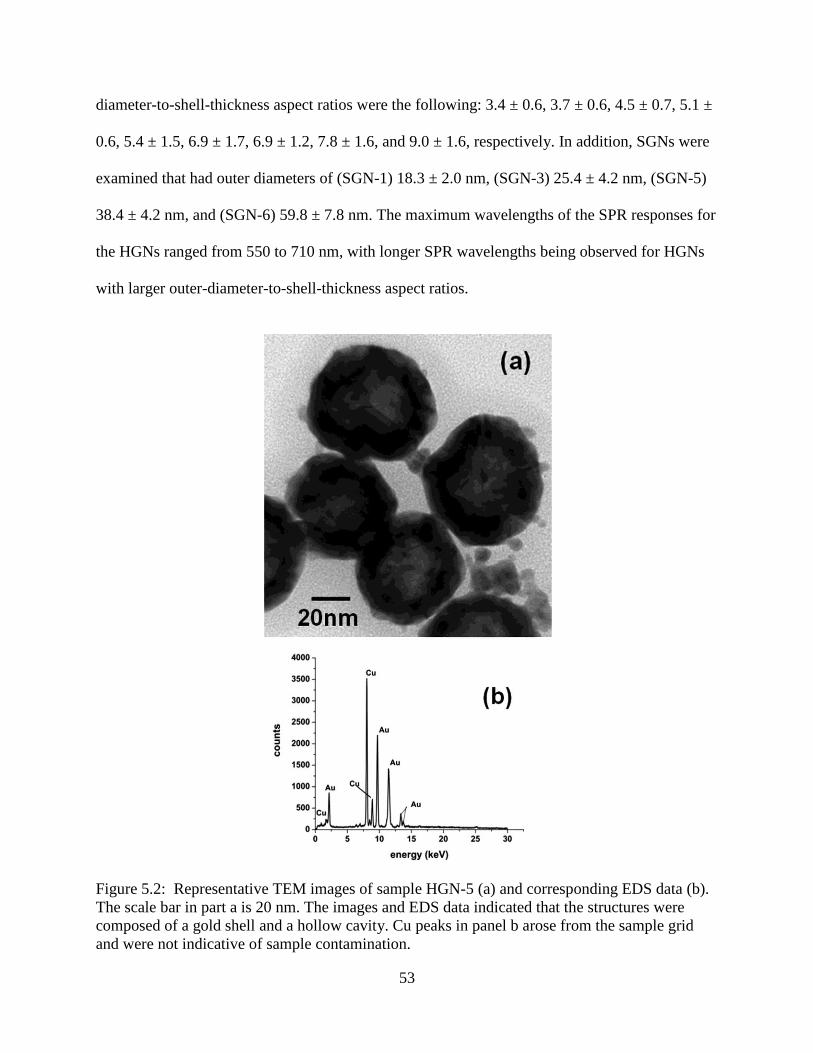
53
diameter-to-shell-thickness aspect ratios were the following: 3.4 ± 0.6, 3.7 ± 0.6, 4.5 ± 0.7, 5.1 ±
0.6, 5.4 ± 1.5, 6.9 ± 1.7, 6.9 ± 1.2, 7.8 ± 1.6, and 9.0 ± 1.6, respectively. In addition, SGNs were
examined that had outer diameters of (SGN-1) 18.3 ± 2.0 nm, (SGN-3) 25.4 ± 4.2 nm, (SGN-5)
38.4 ± 4.2 nm, and (SGN-6) 59.8 ± 7.8 nm. The maximum wavelengths of the SPR responses for
the HGNs ranged from 550 to 710 nm, with longer SPR wavelengths being observed for HGNs
with larger outer-diameter-to-shell-thickness aspect ratios.
Figure 5.2: Representative TEM images of sample HGN-5 (a) and corresponding EDS data (b).
The scale bar in part a is 20 nm. The images and EDS data indicated that the structures were
composed of a gold shell and a hollow cavity. Cu peaks in panel b arose from the sample grid
and were not indicative of sample contamination.
54
Representative transmission electron micrographs of HGN-5 are given in Figure 5.2. TEM
images, along with energy dispersive analysis (Figure 5.2b), indicated that the HGNs consisted
of a thin gold shell and a hollow cavity. Taken together, the optical and TEM data provided
evidence that the solution-phase samples used for transient extinction spectroscopy
measurements were gold shells with fluid-filled cavities; cavity radii ranged from 3.3 to 27.5 nm.
SGNs were prepared by citrate reduction of gold, following the method reported by Ghosh et
al.74
and described in Section 2.1.2. For solvent-dependent studies, both HGNs and SGNs were
transferred from water to methanol solutions using the method reported in Section 2.1.1.
Femtosecond pump−probe transient extinction experiments were performed on a 1-kHz
regeneratively amplified Ti:Sapphire laser system that delivered 800-μJ pulse energies centered
at 800 nm as described in Section 2.2. Temporal integration of the SPR bleach measured in the
transient extinction spectrum provided electronic relaxation kinetic traces. The transient data was
fit with an in-house program that uses an iterative least-squares approach.112,113
The best fits to
the data were obtained using Equation 1, which accounted for both electron−phonon and
phonon−phonon relaxation rates, τel‑ph and τET.
5.3 Results and Discussion
5.3.1 Phonon-Phonon Coupling in HGNs
After the initial structural and optical characterization, time resolved transient extinction
experiments were performed to examine the relaxation dynamics of electronically excited HGNs
and SGNs. Both HGNs and SGNs were excited using a 400-nm laser pulse, and the relaxation
dynamics of the electron and phonon systems were subsequently probed using a continuum laser
pulse. The transient extinction spectrum obtained from one sample (HGN-5) is shown in Figure
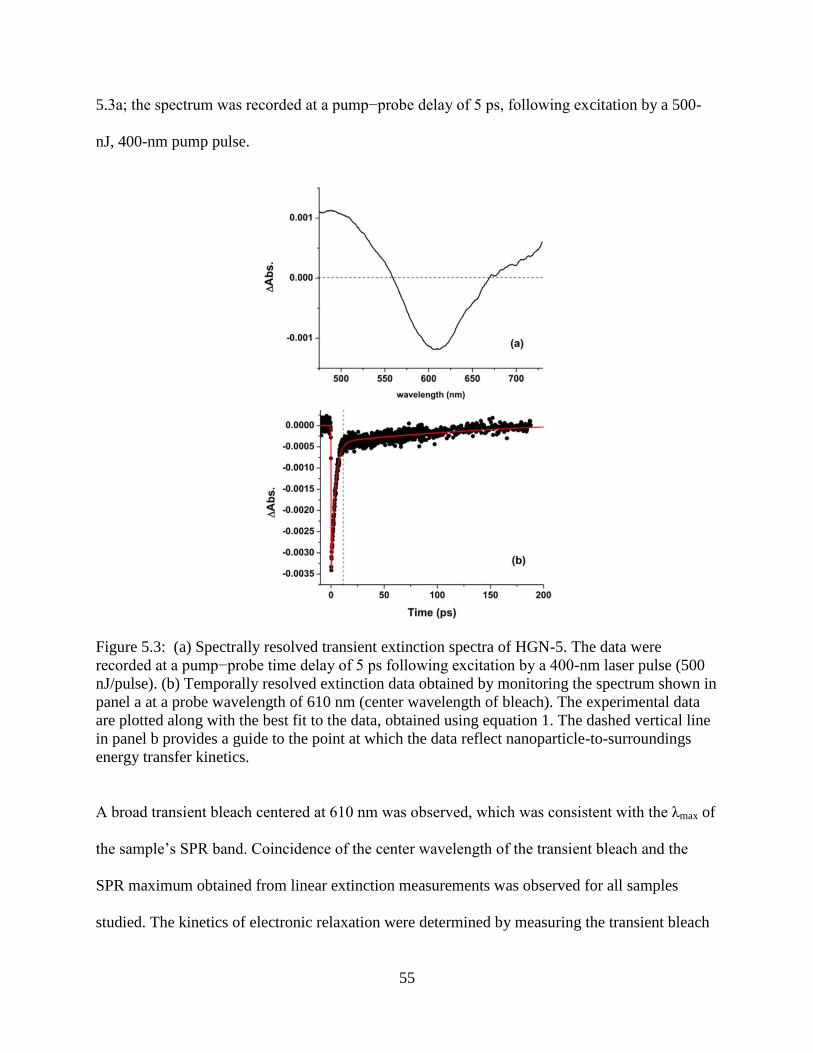
55
5.3a; the spectrum was recorded at a pump−probe delay of 5 ps, following excitation by a 500-
nJ, 400-nm pump pulse.
Figure 5.3: (a) Spectrally resolved transient extinction spectra of HGN-5. The data were
recorded at a pump−probe time delay of 5 ps following excitation by a 400-nm laser pulse (500
nJ/pulse). (b) Temporally resolved extinction data obtained by monitoring the spectrum shown in
panel a at a probe wavelength of 610 nm (center wavelength of bleach). The experimental data
are plotted along with the best fit to the data, obtained using equation 1. The dashed vertical line
in panel b provides a guide to the point at which the data reflect nanoparticle-to-surroundings
energy transfer kinetics.
A broad transient bleach centered at 610 nm was observed, which was consistent with the λmax of
the sample’s SPR band. Coincidence of the center wavelength of the transient bleach and the
SPR maximum obtained from linear extinction measurements was observed for all samples
studied. The kinetics of electronic relaxation were determined by measuring the transient bleach
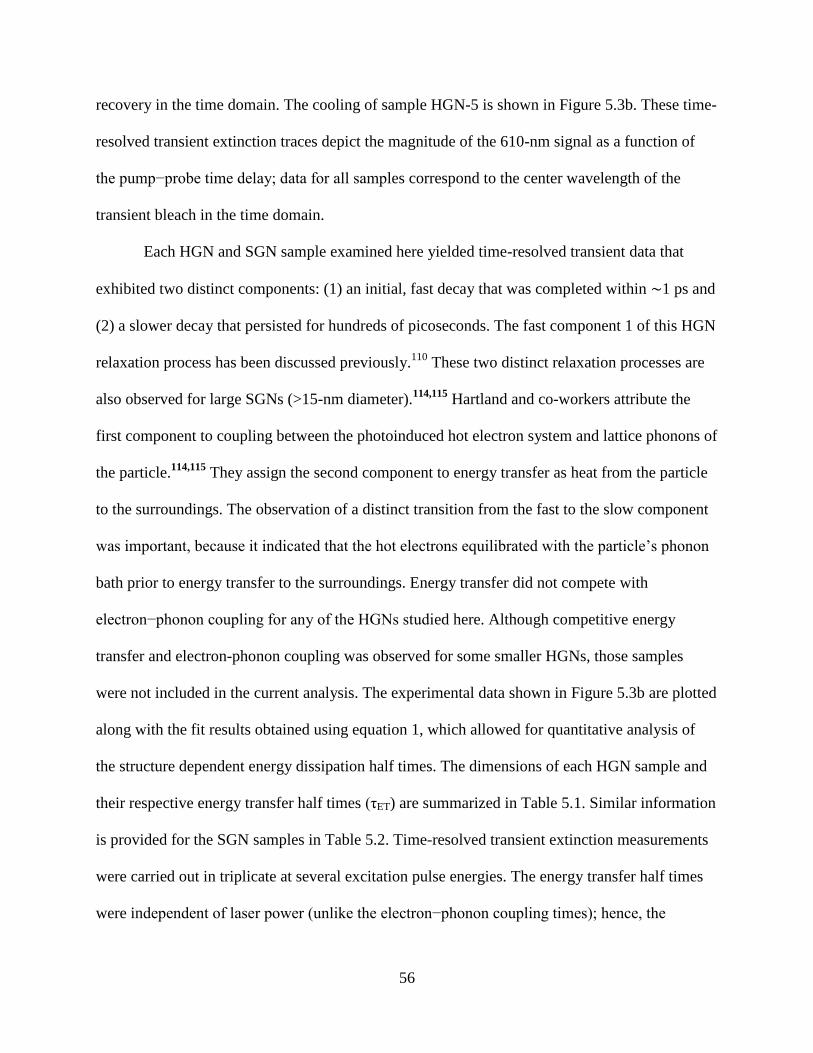
56
recovery in the time domain. The cooling of sample HGN-5 is shown in Figure 5.3b. These time-
resolved transient extinction traces depict the magnitude of the 610-nm signal as a function of
the pump−probe time delay; data for all samples correspond to the center wavelength of the
transient bleach in the time domain.
Each HGN and SGN sample examined here yielded time-resolved transient data that
exhibited two distinct components: (1) an initial, fast decay that was completed within ∼1 ps and
(2) a slower decay that persisted for hundreds of picoseconds. The fast component 1 of this HGN
relaxation process has been discussed previously.110
These two distinct relaxation processes are
also observed for large SGNs (>15-nm diameter).114,115
Hartland and co-workers attribute the
first component to coupling between the photoinduced hot electron system and lattice phonons of
the particle.114,115
They assign the second component to energy transfer as heat from the particle
to the surroundings. The observation of a distinct transition from the fast to the slow component
was important, because it indicated that the hot electrons equilibrated with the particle’s phonon
bath prior to energy transfer to the surroundings. Energy transfer did not compete with
electron−phonon coupling for any of the HGNs studied here. Although competitive energy
transfer and electron-phonon coupling was observed for some smaller HGNs, those samples
were not included in the current analysis. The experimental data shown in Figure 5.3b are plotted
along with the fit results obtained using equation 1, which allowed for quantitative analysis of
the structure dependent energy dissipation half times. The dimensions of each HGN sample and
their respective energy transfer half times (τET) are summarized in Table 5.1. Similar information
is provided for the SGN samples in Table 5.2. Time-resolved transient extinction measurements
were carried out in triplicate at several excitation pulse energies. The energy transfer half times
were independent of laser power (unlike the electron−phonon coupling times); hence, the
57
relaxation times obtained for different powers were averaged to determine the energy transfer
half times for each sample.
Table 5.1: Energy transfer half times and structural parameters for citrate-stabilized HGNs.
Sample Outer diameter, shell
thickness (nm)
Surface Area
(nm2)
S:V
(nm-1
)
τET (ps)
HGN-1 16.6 ± 2.9, 5.0 ± 1.2 (1.00 ± 0.65) x 103 0.45 105 ± 10
HGN-2 29.9 ± 6.2, 8.5 ± 2.2 (3.34 ± 2.62) x 103 0.26 165 ± 30
HGN-4 27.9 ± 3.2, 6.3 ± 1.3 (3.17 ± 1.24) x 103 0.33 155 ± 40
HGN-5 51.1 ± 5.1, 10.0 ± 1.0 (1.13 ± 0.45) x 104 0.21 245 ± 25
HGN-6 31.2 ± 4.6, 6.3 ± 2.1 (4.13 ± 1.90) x 103 0.33 195 ± 40
HGN-9 48.0 ± 5.0 , 7.0 ± 1.0 (1.09 ± 0.43) x 104 0.29 160 ± 15
HGN-10 77.9 ± 5.5, 11.3 ± 2.2 (2.86 ± 0.61) x 104 0.18 1010 ± 80
HGN-12 53.2 ± 7.2, 7.1 ± 1.6 (1.36 ± 0.68) x 104 0.29 325 ± 70
HGN-14 52.2 ± 8.0, 5.9 ± 1.0 (1.37 ± 0.83) x 104 0.34 330 ± 30
Table 5.2: Energy transfer half times and structural parameters for citrate-stabilized SGNs.
Sample Outer diameter
(nm)
Surface Area
(nm2)
S:V
(nm-1
)
τph-ph (ps)
SGN-1 18.3 ± 2.0 (1.05 ± 0.22) x 103 0.33 140 ± 10
SGN-3 25.4 ± 4.2 (2.03 ± 0.67) x 103 0.24 170 ± 10
SGN-5 38.4 ± 4.2 (4.64 ± 1.02) x 103 0.16 210 ± 20
SGN-6 59.8 ± 7.8 (1.12 ± 2.92) x 104 0.10 310 ± 15
In order to summarize size-dependent nanoparticle energy transfer, the time constants
obtained for energy transfer from the photoexcited nanoparticles to the surroundings were plotted
with respect to the total surface area for each of the nanoparticles. Figure 5.4a shows the energy-
transfer-to-solvent half times for all of the HGN samples as a function of total surface areas. Two
distinct regions of the plot were observed, both of which exhibited linear surface area
dependencies for the energy transfer half times. HGNs with small surface areas resulted in a
shallower slope. In addition, the shallow-sloped portion of Figure 5.4a corresponded to HGNs
with cavity radii <15 nm, whereas the data for the HGNs with cavity radii ≥15nm fell on the
portion of Figure 5.4a characterized by the steeper slope.
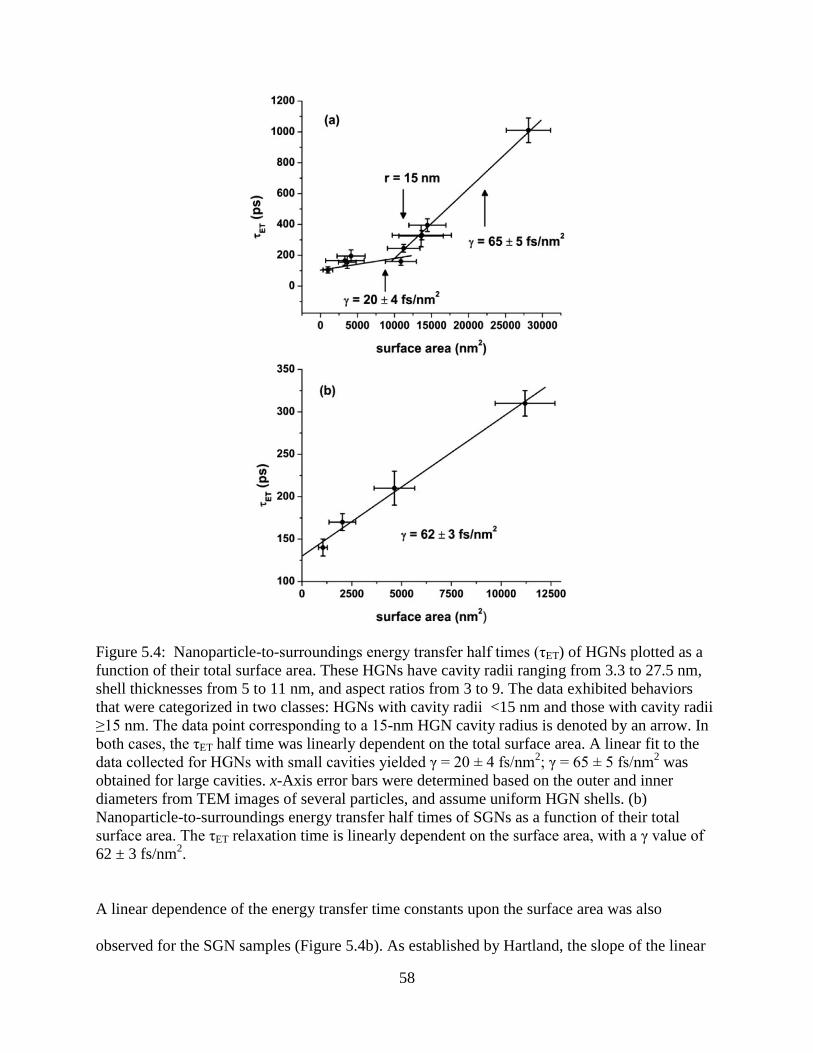
58
Figure 5.4: Nanoparticle-to-surroundings energy transfer half times (τET) of HGNs plotted as a
function of their total surface area. These HGNs have cavity radii ranging from 3.3 to 27.5 nm,
shell thicknesses from 5 to 11 nm, and aspect ratios from 3 to 9. The data exhibited behaviors
that were categorized in two classes: HGNs with cavity radii <15 nm and those with cavity radii
≥15 nm. The data point corresponding to a 15-nm HGN cavity radius is denoted by an arrow. In
both cases, the τET half time was linearly dependent on the total surface area. A linear fit to the
data collected for HGNs with small cavities yielded γ = 20 ± 4 fs/nm2; γ = 65 ± 5 fs/nm
2 was
obtained for large cavities. x-Axis error bars were determined based on the outer and inner
diameters from TEM images of several particles, and assume uniform HGN shells. (b)
Nanoparticle-to-surroundings energy transfer half times of SGNs as a function of their total
surface area. The τET relaxation time is linearly dependent on the surface area, with a γ value of
62 ± 3 fs/nm2.
A linear dependence of the energy transfer time constants upon the surface area was also
observed for the SGN samples (Figure 5.4b). As established by Hartland, the slope of the linear
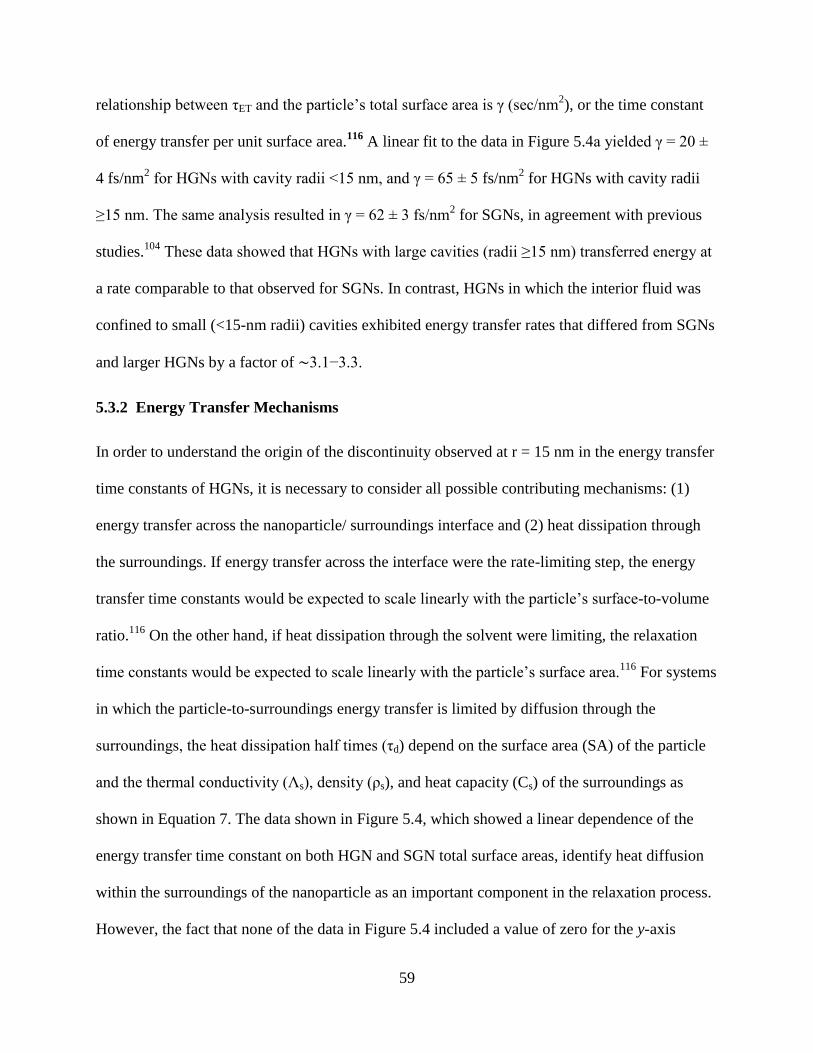
59
relationship between τET and the particle’s total surface area is γ (sec/nm2), or the time constant
of energy transfer per unit surface area.116
A linear fit to the data in Figure 5.4a yielded γ = 20 ±
4 fs/nm2 for HGNs with cavity radii <15 nm, and γ = 65 ± 5 fs/nm
2 for HGNs with cavity radii
≥15 nm. The same analysis resulted in γ = 62 ± 3 fs/nm2 for SGNs, in agreement with previous
studies.104
These data showed that HGNs with large cavities (radii ≥15 nm) transferred energy at
a rate comparable to that observed for SGNs. In contrast, HGNs in which the interior fluid was
confined to small (<15-nm radii) cavities exhibited energy transfer rates that differed from SGNs
and larger HGNs by a factor of ∼3.1−3.3.
5.3.2 Energy Transfer Mechanisms
In order to understand the origin of the discontinuity observed at r = 15 nm in the energy transfer
time constants of HGNs, it is necessary to consider all possible contributing mechanisms: (1)
energy transfer across the nanoparticle/ surroundings interface and (2) heat dissipation through
the surroundings. If energy transfer across the interface were the rate-limiting step, the energy
transfer time constants would be expected to scale linearly with the particle’s surface-to-volume
ratio.116
On the other hand, if heat dissipation through the solvent were limiting, the relaxation
time constants would be expected to scale linearly with the particle’s surface area.116
For systems
in which the particle-to-surroundings energy transfer is limited by diffusion through the
surroundings, the heat dissipation half times (τd) depend on the surface area (SA) of the particle
and the thermal conductivity (Λs), density (ρs), and heat capacity (Cs) of the surroundings as
shown in Equation 7. The data shown in Figure 5.4, which showed a linear dependence of the
energy transfer time constant on both HGN and SGN total surface areas, identify heat diffusion
within the surroundings of the nanoparticle as an important component in the relaxation process.
However, the fact that none of the data in Figure 5.4 included a value of zero for the y-axis
60
intercept indicated that equation 7 did not fully account for the data. Therefore, energy transfer
across the metal/surroundings interface was included in the data analysis.
(7)
The time required for energy transfer across the nanoparticle interface (τi) increases as a
linear function of SGN radius (HGN shell thickness; R − r) and the particle’s volumetric heat
capacity (Cp). The interfacial energy transfer time is inversely dependent upon interfacial thermal
conductivity, G:
(8)
Equation 8 describes interfacial energy transfer for HGNs; for SGNs (R − r) is replaced by r.
Interface effects become significant when τd and τi are comparable. As such, a critical value for
G, which reflects the onset of interfacial contributions to the relaxation dynamics, can be
obtained by equating equations 7 and 8.116,117
(9)
When G greatly exceeds Gcritical, energy diffusion through the solvent dominates heat dissipation
by excited nanoparticles. Equation 9 was used to calculate the critical interface thermal
conductance for the HGNs studied here. The resultant values of Gcritical spanned from ∼265 to
∼600 MW m-2
K-1
. Cf is the heat capacity of the fluid and Λf is the thermal conductivity of the
fluid. Previous studies on SGNs in water yielded G = 100−110 MW m-2
K-1
.32,118,119
Taken
together, our calculations and previous experimental results indicated interfacial energy transfer
61
must be included in the analysis of the relaxation dynamics for all HGN samples. Importantly,
since Gcritical > G for all HGNs, the discontinuity observed in Figure 5.4a did not result from a
size-dependent crossover from interface- to diffusion-controlled nanoparticle-to-surroundings
energy transfer.
5.3.3 Interfacial Thermal Conductance of HGNs
Interfacial conductivity was estimated by plotting the experimentally determined energy transfer
half times with respect to HGN shell thickness and SGN radius (Figure 5.5).
Figure 5.5: HGN (○) and SGN (●) energy transfer half times (τET) plotted as a function of HGN
shell thickness, or SGN radius. The experimental half times are plotted along with calculated
size-dependent interfacial thermal conductivities, G. The values for G were obtained using
equation 8, and bulk values obtained from reference 109.
These data were fit to equation 8 to obtain G. In the case of SGNs, analysis of our experimental
data resulted in G = 85 MW m-2
K-1
, which provided good agreement with previous
research.32,118,119
However, the interfacial thermal conductance obtained for HGNs ranged from
G = 35 to G = 45 MW m-2
K-1
, which was significantly reduced compared to SGNs. These data
represented a reduction in interfacial thermal conductance by a factor of ∼1.9−2.4, which
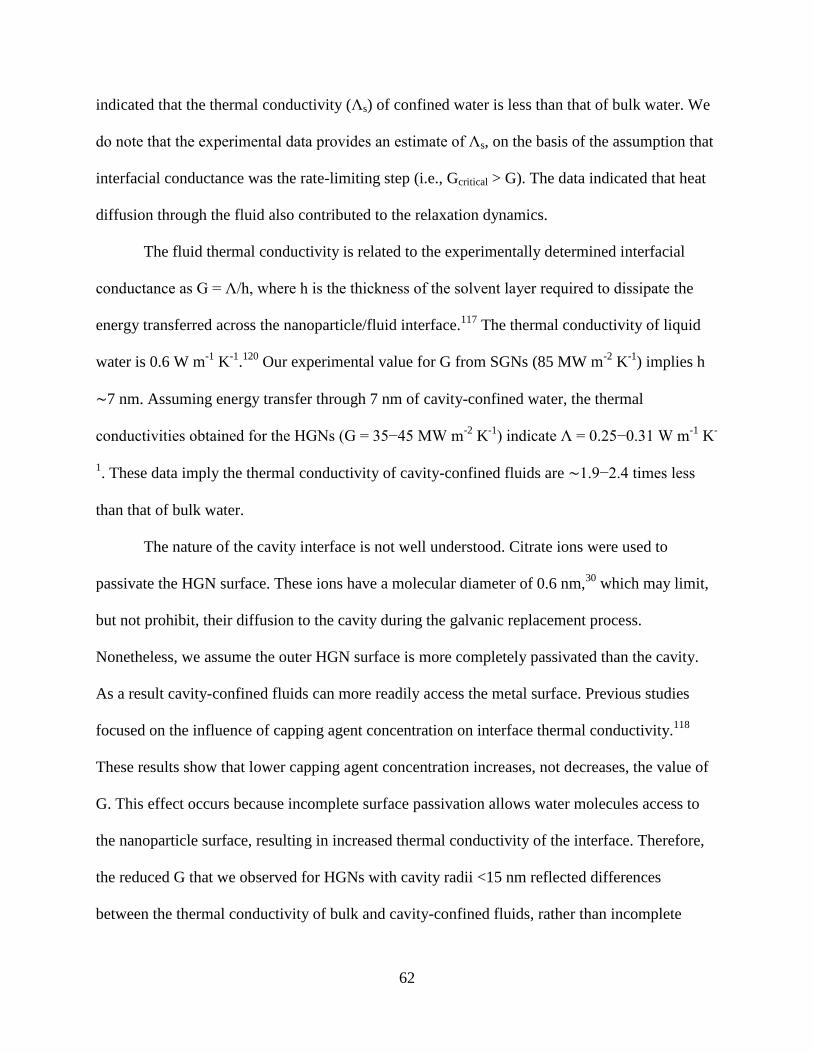
62
indicated that the thermal conductivity (Λs) of confined water is less than that of bulk water. We
do note that the experimental data provides an estimate of Λs, on the basis of the assumption that
interfacial conductance was the rate-limiting step (i.e., Gcritical > G). The data indicated that heat
diffusion through the fluid also contributed to the relaxation dynamics.
The fluid thermal conductivity is related to the experimentally determined interfacial
conductance as G = Λ/h, where h is the thickness of the solvent layer required to dissipate the
energy transferred across the nanoparticle/fluid interface.117
The thermal conductivity of liquid
water is 0.6 W m-1
K-1
.120
Our experimental value for G from SGNs (85 MW m-2
K-1
) implies h
∼7 nm. Assuming energy transfer through 7 nm of cavity-confined water, the thermal
conductivities obtained for the HGNs (G = 35−45 MW m-2
K-1) indicate Λ = 0.25−0.31 W m
-1 K
-
1. These data imply the thermal conductivity of cavity-confined fluids are ∼1.9−2.4 times less
than that of bulk water.
The nature of the cavity interface is not well understood. Citrate ions were used to
passivate the HGN surface. These ions have a molecular diameter of 0.6 nm,30
which may limit,
but not prohibit, their diffusion to the cavity during the galvanic replacement process.
Nonetheless, we assume the outer HGN surface is more completely passivated than the cavity.
As a result cavity-confined fluids can more readily access the metal surface. Previous studies
focused on the influence of capping agent concentration on interface thermal conductivity.118
These results show that lower capping agent concentration increases, not decreases, the value of
G. This effect occurs because incomplete surface passivation allows water molecules access to
the nanoparticle surface, resulting in increased thermal conductivity of the interface. Therefore,
the reduced G that we observed for HGNs with cavity radii <15 nm reflected differences
between the thermal conductivity of bulk and cavity-confined fluids, rather than incomplete
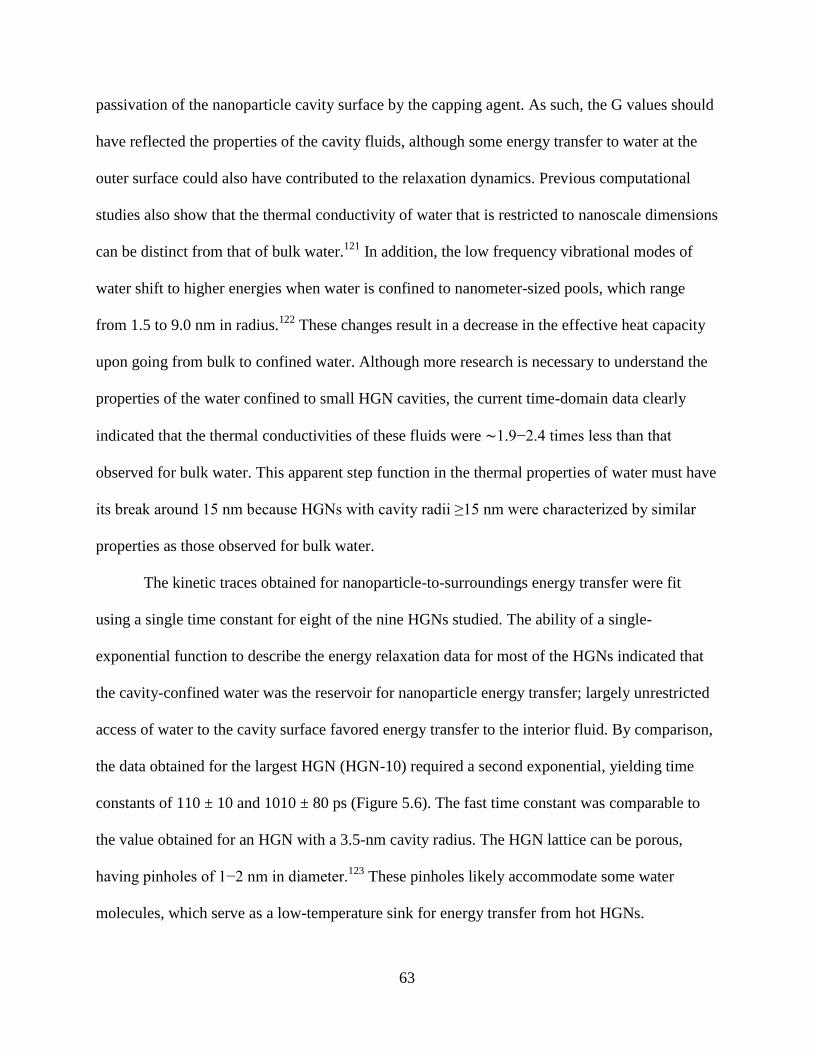
63
passivation of the nanoparticle cavity surface by the capping agent. As such, the G values should
have reflected the properties of the cavity fluids, although some energy transfer to water at the
outer surface could also have contributed to the relaxation dynamics. Previous computational
studies also show that the thermal conductivity of water that is restricted to nanoscale dimensions
can be distinct from that of bulk water.121
In addition, the low frequency vibrational modes of
water shift to higher energies when water is confined to nanometer-sized pools, which range
from 1.5 to 9.0 nm in radius.122
These changes result in a decrease in the effective heat capacity
upon going from bulk to confined water. Although more research is necessary to understand the
properties of the water confined to small HGN cavities, the current time-domain data clearly
indicated that the thermal conductivities of these fluids were ∼1.9−2.4 times less than that
observed for bulk water. This apparent step function in the thermal properties of water must have
its break around 15 nm because HGNs with cavity radii ≥15 nm were characterized by similar
properties as those observed for bulk water.
The kinetic traces obtained for nanoparticle-to-surroundings energy transfer were fit
using a single time constant for eight of the nine HGNs studied. The ability of a single-
exponential function to describe the energy relaxation data for most of the HGNs indicated that
the cavity-confined water was the reservoir for nanoparticle energy transfer; largely unrestricted
access of water to the cavity surface favored energy transfer to the interior fluid. By comparison,
the data obtained for the largest HGN (HGN-10) required a second exponential, yielding time
constants of 110 ± 10 and 1010 ± 80 ps (Figure 5.6). The fast time constant was comparable to
the value obtained for an HGN with a 3.5-nm cavity radius. The HGN lattice can be porous,
having pinholes of 1−2 nm in diameter.123
These pinholes likely accommodate some water
molecules, which serve as a low-temperature sink for energy transfer from hot HGNs.
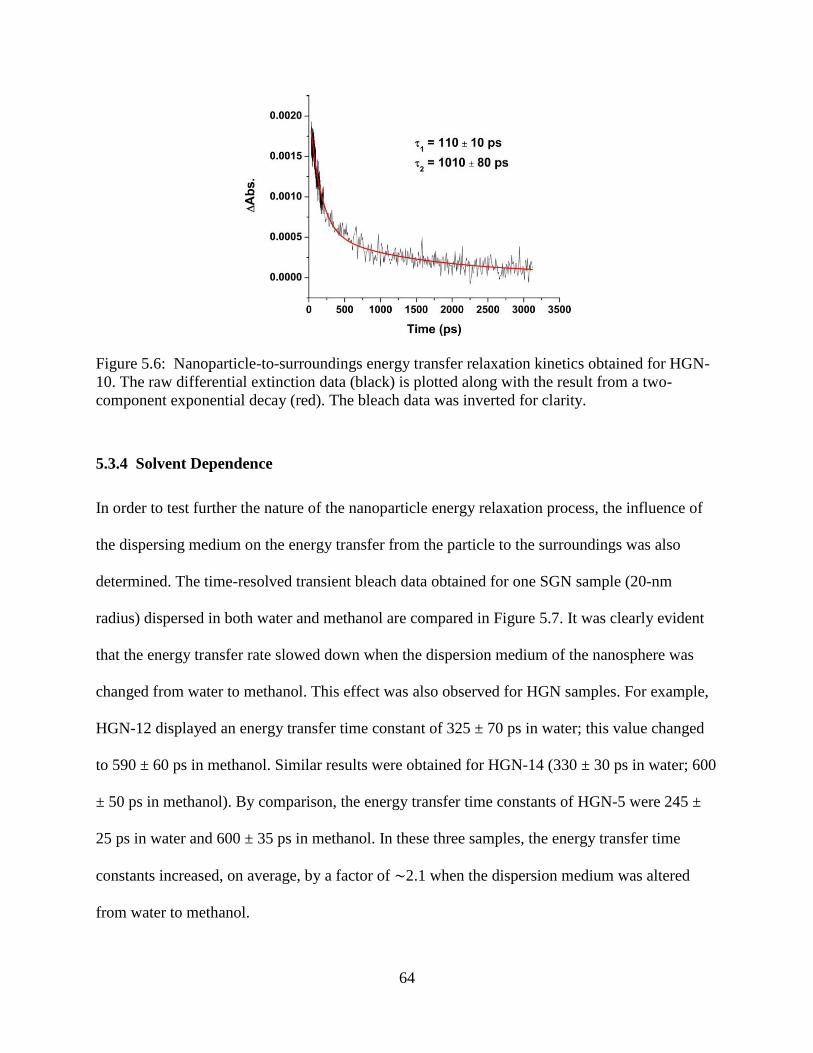
64
Figure 5.6: Nanoparticle-to-surroundings energy transfer relaxation kinetics obtained for HGN-
10. The raw differential extinction data (black) is plotted along with the result from a two-
component exponential decay (red). The bleach data was inverted for clarity.
5.3.4 Solvent Dependence
In order to test further the nature of the nanoparticle energy relaxation process, the influence of
the dispersing medium on the energy transfer from the particle to the surroundings was also
determined. The time-resolved transient bleach data obtained for one SGN sample (20-nm
radius) dispersed in both water and methanol are compared in Figure 5.7. It was clearly evident
that the energy transfer rate slowed down when the dispersion medium of the nanosphere was
changed from water to methanol. This effect was also observed for HGN samples. For example,
HGN-12 displayed an energy transfer time constant of 325 ± 70 ps in water; this value changed
to 590 ± 60 ps in methanol. Similar results were obtained for HGN-14 (330 ± 30 ps in water; 600
± 50 ps in methanol). By comparison, the energy transfer time constants of HGN-5 were 245 ±
25 ps in water and 600 ± 35 ps in methanol. In these three samples, the energy transfer time
constants increased, on average, by a factor of ∼2.1 when the dispersion medium was altered
from water to methanol.
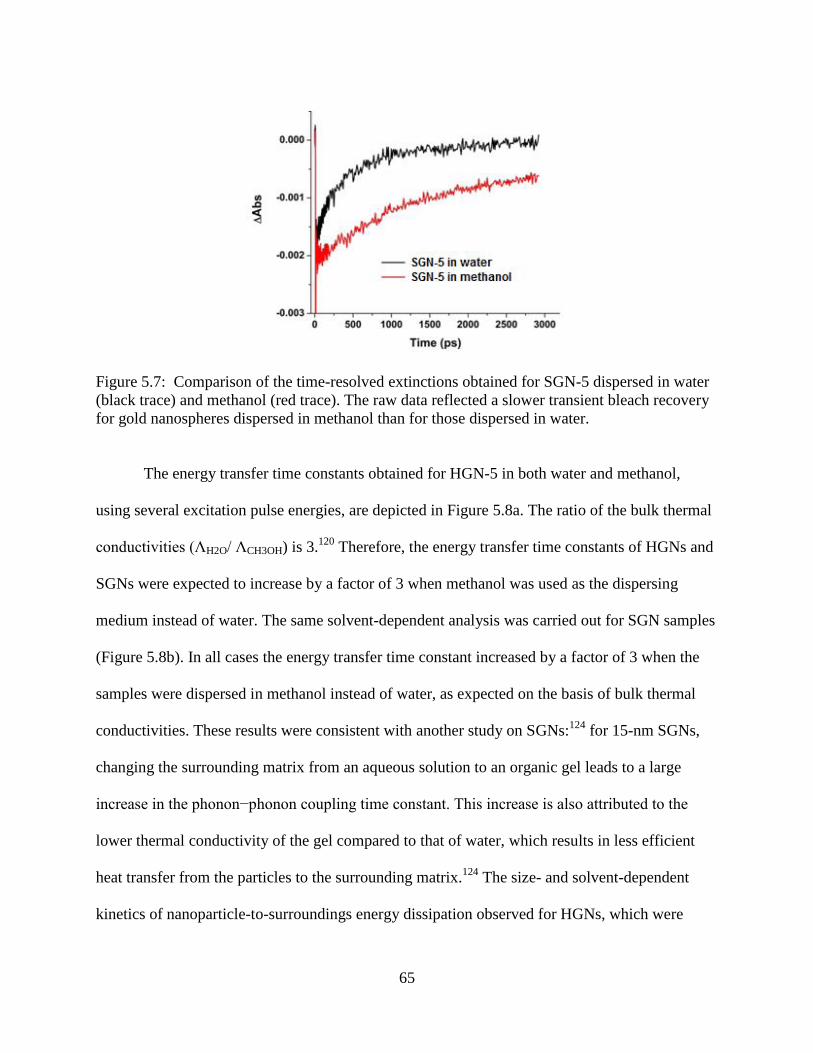
65
Figure 5.7: Comparison of the time-resolved extinctions obtained for SGN-5 dispersed in water
(black trace) and methanol (red trace). The raw data reflected a slower transient bleach recovery
for gold nanospheres dispersed in methanol than for those dispersed in water.
The energy transfer time constants obtained for HGN-5 in both water and methanol,
using several excitation pulse energies, are depicted in Figure 5.8a. The ratio of the bulk thermal
conductivities (ΛH2O/ ΛCH3OH) is 3.120
Therefore, the energy transfer time constants of HGNs and
SGNs were expected to increase by a factor of 3 when methanol was used as the dispersing
medium instead of water. The same solvent-dependent analysis was carried out for SGN samples
(Figure 5.8b). In all cases the energy transfer time constant increased by a factor of 3 when the
samples were dispersed in methanol instead of water, as expected on the basis of bulk thermal
conductivities. These results were consistent with another study on SGNs:124
for 15-nm SGNs,
changing the surrounding matrix from an aqueous solution to an organic gel leads to a large
increase in the phonon−phonon coupling time constant. This increase is also attributed to the
lower thermal conductivity of the gel compared to that of water, which results in less efficient
heat transfer from the particles to the surrounding matrix.124
The size- and solvent-dependent
kinetics of nanoparticle-to-surroundings energy dissipation observed for HGNs, which were
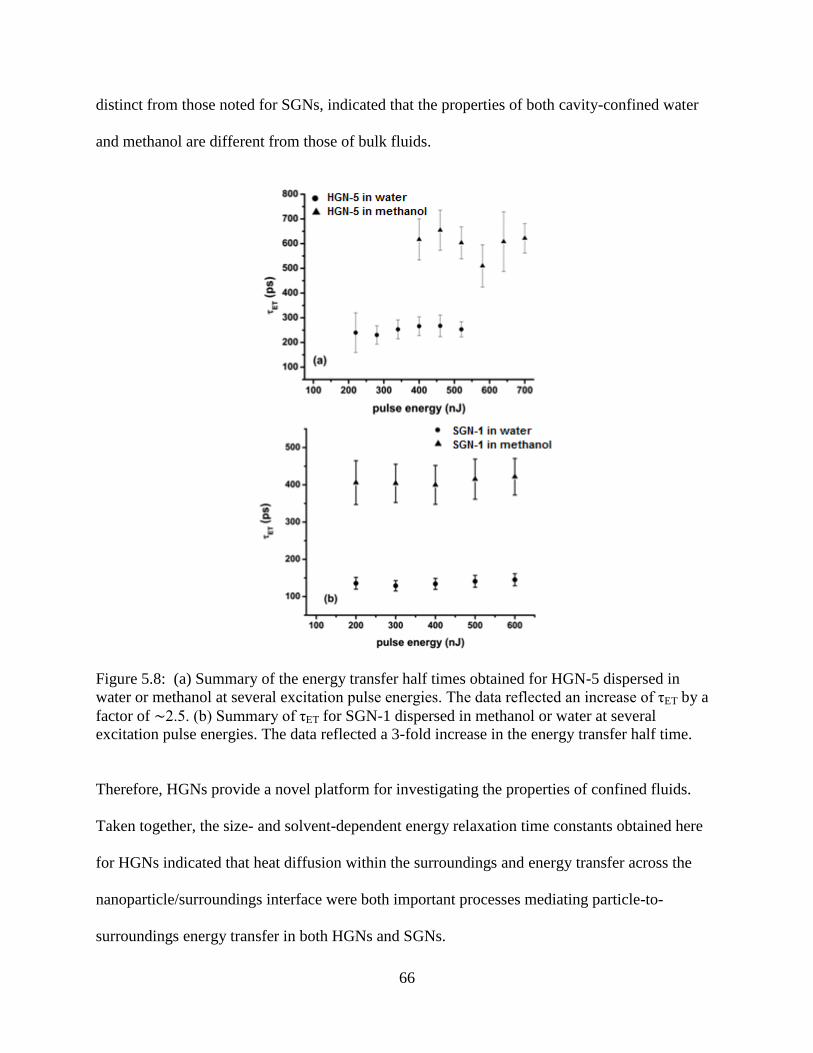
66
distinct from those noted for SGNs, indicated that the properties of both cavity-confined water
and methanol are different from those of bulk fluids.
Figure 5.8: (a) Summary of the energy transfer half times obtained for HGN-5 dispersed in
water or methanol at several excitation pulse energies. The data reflected an increase of τET by a
factor of ∼2.5. (b) Summary of τET for SGN-1 dispersed in methanol or water at several
excitation pulse energies. The data reflected a 3-fold increase in the energy transfer half time.
Therefore, HGNs provide a novel platform for investigating the properties of confined fluids.
Taken together, the size- and solvent-dependent energy relaxation time constants obtained here
for HGNs indicated that heat diffusion within the surroundings and energy transfer across the
nanoparticle/surroundings interface were both important processes mediating particle-to-
surroundings energy transfer in both HGNs and SGNs.
67
5.4 Conclusions
Nanoparticle-to-surroundings energy transfer was studied for citrate-stabilized hollow and solid
gold nanospheres with outer diameters ranging from 17 to 78 nm using femtosecond time
resolved transient extinction spectroscopy. The HGNs had fluid-filled cavities with radii ranging
from 3 to 27.5 nm. In all cases, energy transfer across the nanoparticle/fluid interface and heat
diffusion through the surroundings were both contributing energy relaxation mechanisms. The
energy transfer half times ranged from 105 ± 10 ps to 1010 ± 80 ps for the HGNs and 140 ± 10
ps to 310 ± 15 ps for the SGNs. The data obtained for the preferential energy transfer from hot
HGNs to cavity confined fluids indicated that the HGNs could be split into two classes: those
with cavity radii <15 nm and those with cavity radii ≥15 nm. In the former case, the kinetic data
reflected an ∼3-fold reduction in the thermal conductivities of confined water with respect to
bulk values. In the latter case, HGN and SGN kinetics were similar, indicating that the thermal
properties of water confined to cavities with radii ≥15 nm approached bulk values. Experiments
on HGNs and SGNs dispersed in methanol also supported the idea that fluids confined to
nanoscale dimensions (radius <15 nm) had different thermal properties than those observed for
bulk fluids. In contrast, solvent-dependent data obtained for SGNs were consistent with
predications based on bulk thermal conductivities. These data indicated that hollow
nanostructures are useful for understanding the properties of fluids confined to nanoscale
dimensions.
68
CHAPTER SIX
INTERPARTICLE ELECTROMAGNETIC COUPLING
ENHANCEMENT IN HOLLOW GOLD NANOSPHERE
AGGREGATES
Reproduced with permission from Knappenberger, K. L., Jr., Schwartzberg, A. M., Dowgiallo, A.
M. and Lowman, C. A., Journal of the American Chemical Society, 131 (2009) 13892–13893.
DOI: 10.1021/ja903086g; Chandra, M., Dowgiallo, A. M. and Knappenberger, K. L., Jr.,
Journal of the American Chemical Society, 132 (2010) 15782–15789. DOI: 10.1021/ja106910x.
Copyright 2012 American Chemical Society.
6.1 Introduction
Plasmon-supporting nanoparticles have potential to be used in devices capable of
functioning throughout the visible and near-infrared electromagnetic regions. A thorough
understanding of the interplay between the precise arrangement of these particles within a
designed array and the collective properties of composite materials is required. The
electromagnetic surface fields formed by the interaction of nanospheres and nanorods have been
studied by several research groups.11,130-1134,64,69-73
It has been previously observed that a large
spectral red-shift of the plasmon resonance occurs when nanospheres aggregate in such a manner
that a large (>1 nm) interparticle gap exists between the individual nanoparticles.73,131
This type
of behavior results from the formation of a bonding hybridized plasmon resonance mode.73
However, a detailed description of the aggregate properties when nanoparticles are in contact
with little to no gap is still needed.
69
Femtosecond transient extinction measurements of electronic relaxation and interparticle
electromagnetic coupling in hollow gold nanospheres (HGNs) and HGN aggregates will be
described. HGNs exhibit a tunable SPR, and upon aggregation, a systematic blue shift of this
resonance occurs. The blue-shifted SPR narrows significantly as compared to isolated HGN,
indicative of preserved plasmon coherence. Finite-difference time-domain (FDTD) calculations
confirm that this blue shift is due to the delocalization of the Fermi-gas over multiple particles.
The relaxation of the excited electrons proceeds by: (1) ultrafast electron scattering, (2) electron-
phonon coupling and (3) energy dissipation to the solvent. A 48-nm HGN with a shell thickness
of 7 nm has an electron−phonon coupling lifetime of 300 ± 100 fs, and upon aggregation, this
lifetime increases to 730 ± 140 fs, indicating Fermi-gas delocalization over multiple particles.
In addition, HGNs having dimensions ranging from 29.9 nm/8.5 nm (outer diameter/shell
thickness) to 51.5 nm/4.5 nm and having aspect ratios spanning 3.5-11.7 were employed to
investigate the SPR and electric field enhancement of HGN aggregates by variation of the aspect
ratio, interparticle gap, and cavity spatial separation. HGN aggregation was achieved using either
ethanedithiol or cysteine, resulting in dimeric structures in which monomer subunits were
spatially separated by <3 Å and 1.2 ± 0.7 nm, respectively. Particle dimensions and separation
distances were confirmed by TEM. Experimental extinction spectra obtained for high-aspect
ratio HGNs aggregated by ethanedithiol exhibited an obvious blue shift of the SPR relative to
that observed for isolated HGNs. One explanation for the blue-shifting is due to a charge-transfer
plasmon resonance at the dimer interface. In addition, the blue shifting depended on the
thickness of the hollow shell. Thin-shelled HGNs that were in contact due to aggregation from
the dithiol exhibited the largest blue-shift, whereas thick-shelled (≥7 nm) HGNs did not display a
significant SPR shift when the individual particles were in contact. On the other hand, cysteine
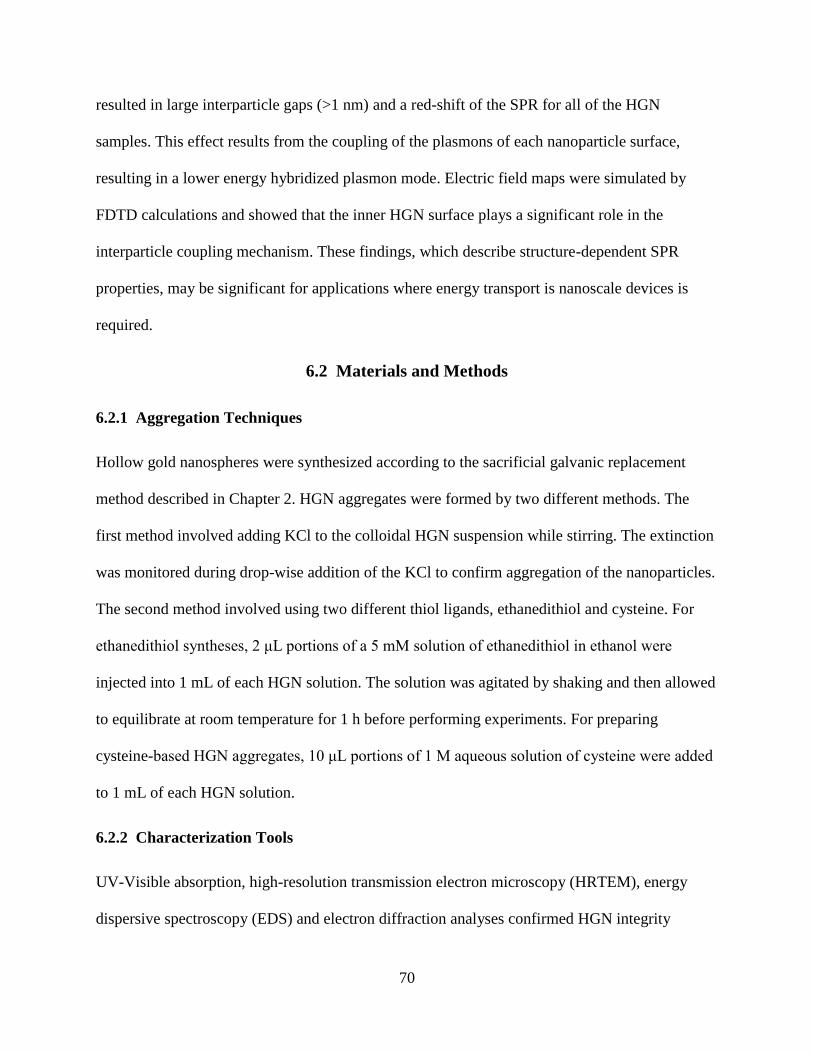
70
resulted in large interparticle gaps (>1 nm) and a red-shift of the SPR for all of the HGN
samples. This effect results from the coupling of the plasmons of each nanoparticle surface,
resulting in a lower energy hybridized plasmon mode. Electric field maps were simulated by
FDTD calculations and showed that the inner HGN surface plays a significant role in the
interparticle coupling mechanism. These findings, which describe structure-dependent SPR
properties, may be significant for applications where energy transport is nanoscale devices is
required.
6.2 Materials and Methods
6.2.1 Aggregation Techniques
Hollow gold nanospheres were synthesized according to the sacrificial galvanic replacement
method described in Chapter 2. HGN aggregates were formed by two different methods. The
first method involved adding KCl to the colloidal HGN suspension while stirring. The extinction
was monitored during drop-wise addition of the KCl to confirm aggregation of the nanoparticles.
The second method involved using two different thiol ligands, ethanedithiol and cysteine. For
ethanedithiol syntheses, 2 μL portions of a 5 mM solution of ethanedithiol in ethanol were
injected into 1 mL of each HGN solution. The solution was agitated by shaking and then allowed
to equilibrate at room temperature for 1 h before performing experiments. For preparing
cysteine-based HGN aggregates, 10 μL portions of 1 M aqueous solution of cysteine were added
to 1 mL of each HGN solution.
6.2.2 Characterization Tools
UV-Visible absorption, high-resolution transmission electron microscopy (HRTEM), energy
dispersive spectroscopy (EDS) and electron diffraction analyses confirmed HGN integrity
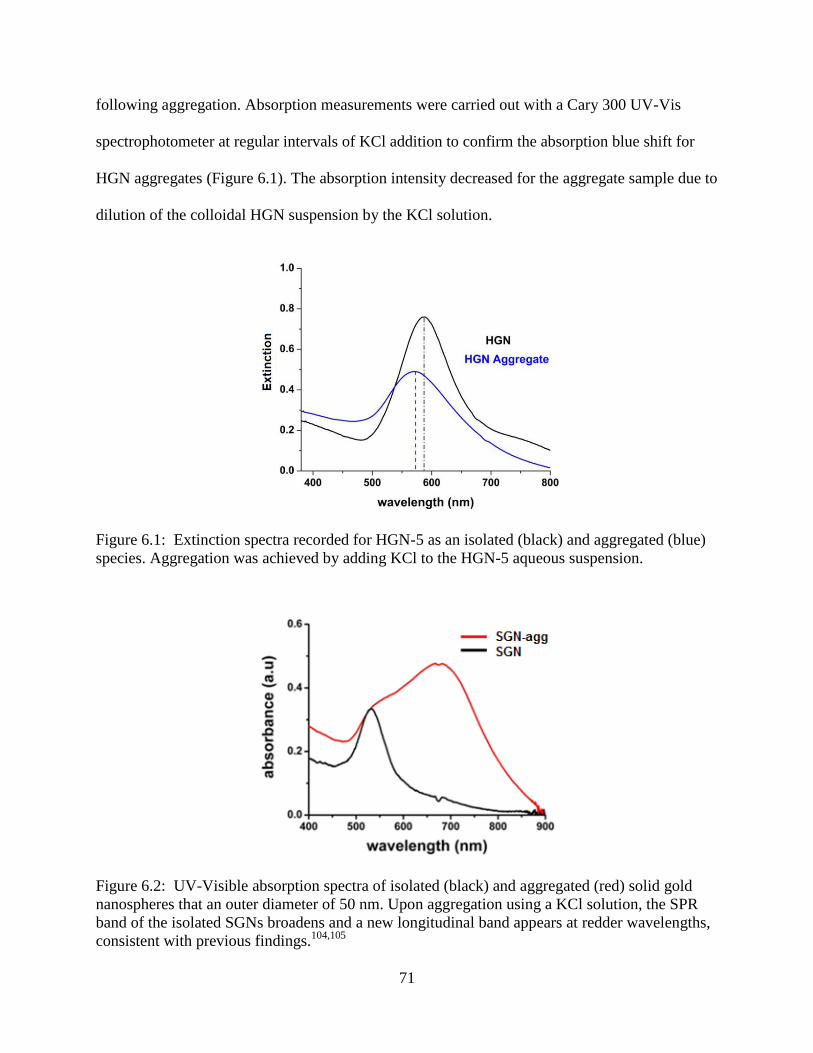
71
following aggregation. Absorption measurements were carried out with a Cary 300 UV-Vis
spectrophotometer at regular intervals of KCl addition to confirm the absorption blue shift for
HGN aggregates (Figure 6.1). The absorption intensity decreased for the aggregate sample due to
dilution of the colloidal HGN suspension by the KCl solution.
Figure 6.1: Extinction spectra recorded for HGN-5 as an isolated (black) and aggregated (blue)
species. Aggregation was achieved by adding KCl to the HGN-5 aqueous suspension.
Figure 6.2: UV-Visible absorption spectra of isolated (black) and aggregated (red) solid gold
nanospheres that an outer diameter of 50 nm. Upon aggregation using a KCl solution, the SPR
band of the isolated SGNs broadens and a new longitudinal band appears at redder wavelengths,
consistent with previous findings.104,105
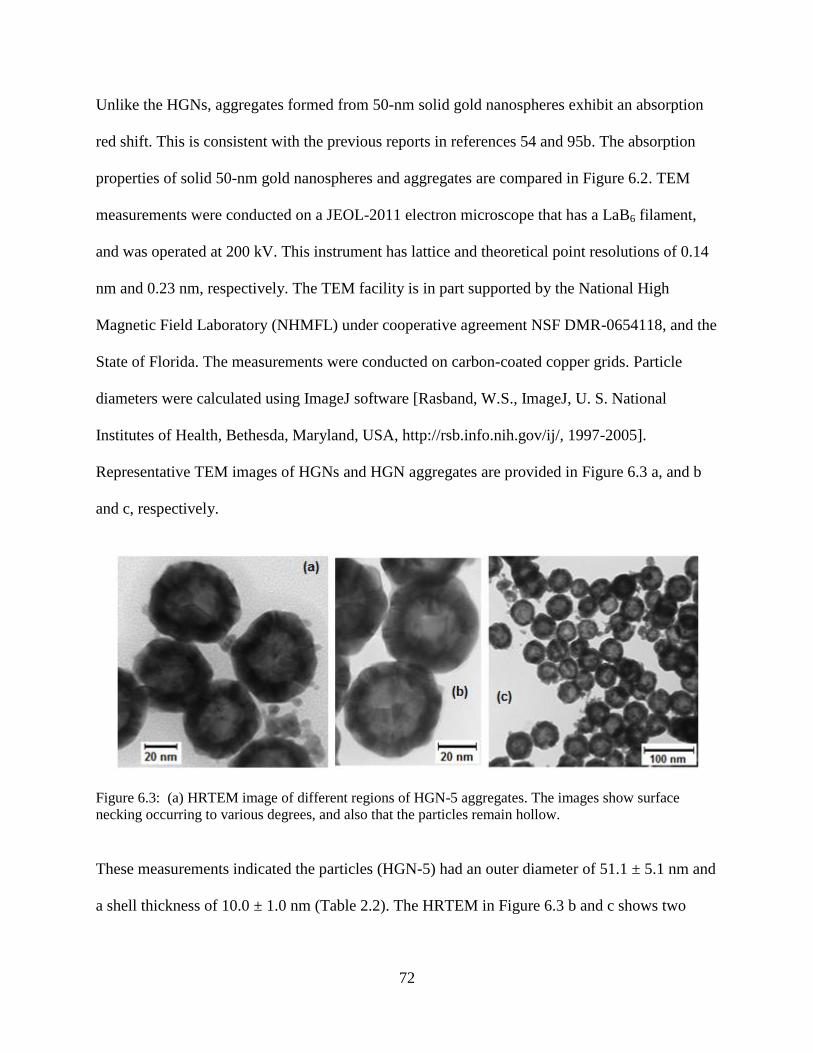
72
Unlike the HGNs, aggregates formed from 50-nm solid gold nanospheres exhibit an absorption
red shift. This is consistent with the previous reports in references 54 and 95b. The absorption
properties of solid 50-nm gold nanospheres and aggregates are compared in Figure 6.2. TEM
measurements were conducted on a JEOL-2011 electron microscope that has a LaB6 filament,
and was operated at 200 kV. This instrument has lattice and theoretical point resolutions of 0.14
nm and 0.23 nm, respectively. The TEM facility is in part supported by the National High
Magnetic Field Laboratory (NHMFL) under cooperative agreement NSF DMR-0654118, and the
State of Florida. The measurements were conducted on carbon-coated copper grids. Particle
diameters were calculated using ImageJ software [Rasband, W.S., ImageJ, U. S. National
Institutes of Health, Bethesda, Maryland, USA, http://rsb.info.nih.gov/ij/, 1997-2005].
Representative TEM images of HGNs and HGN aggregates are provided in Figure 6.3 a, and b
and c, respectively.
Figure 6.3: (a) HRTEM image of different regions of HGN-5 aggregates. The images show surface
necking occurring to various degrees, and also that the particles remain hollow.
These measurements indicated the particles (HGN-5) had an outer diameter of 51.1 ± 5.1 nm and
a shell thickness of 10.0 ± 1.0 nm (Table 2.2). The HRTEM in Figure 6.3 b and c shows two
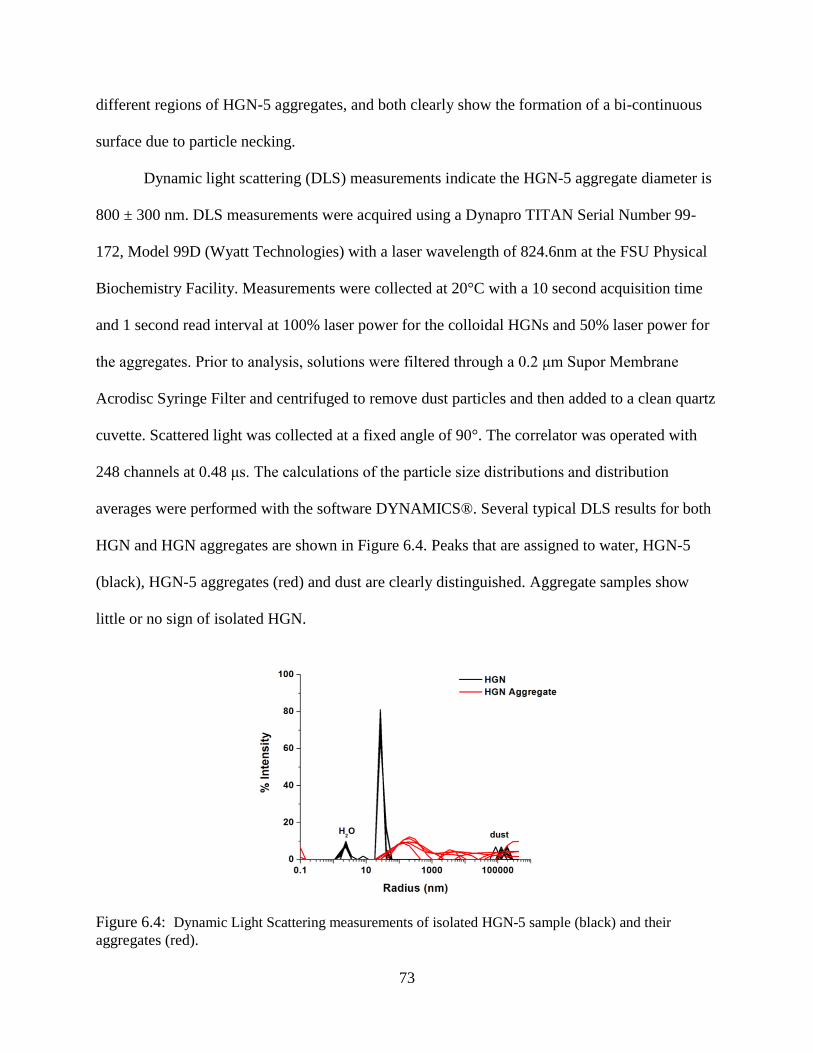
73
different regions of HGN-5 aggregates, and both clearly show the formation of a bi-continuous
surface due to particle necking.
Dynamic light scattering (DLS) measurements indicate the HGN-5 aggregate diameter is
800 ± 300 nm. DLS measurements were acquired using a Dynapro TITAN Serial Number 99-
172, Model 99D (Wyatt Technologies) with a laser wavelength of 824.6nm at the FSU Physical
Biochemistry Facility. Measurements were collected at 20°C with a 10 second acquisition time
and 1 second read interval at 100% laser power for the colloidal HGNs and 50% laser power for
the aggregates. Prior to analysis, solutions were filtered through a 0.2 μm Supor Membrane
Acrodisc Syringe Filter and centrifuged to remove dust particles and then added to a clean quartz
cuvette. Scattered light was collected at a fixed angle of 90°. The correlator was operated with
248 channels at 0.48 μs. The calculations of the particle size distributions and distribution
averages were performed with the software DYNAMICS®. Several typical DLS results for both
HGN and HGN aggregates are shown in Figure 6.4. Peaks that are assigned to water, HGN-5
(black), HGN-5 aggregates (red) and dust are clearly distinguished. Aggregate samples show
little or no sign of isolated HGN.
Figure 6.4: Dynamic Light Scattering measurements of isolated HGN-5 sample (black) and their
aggregates (red).
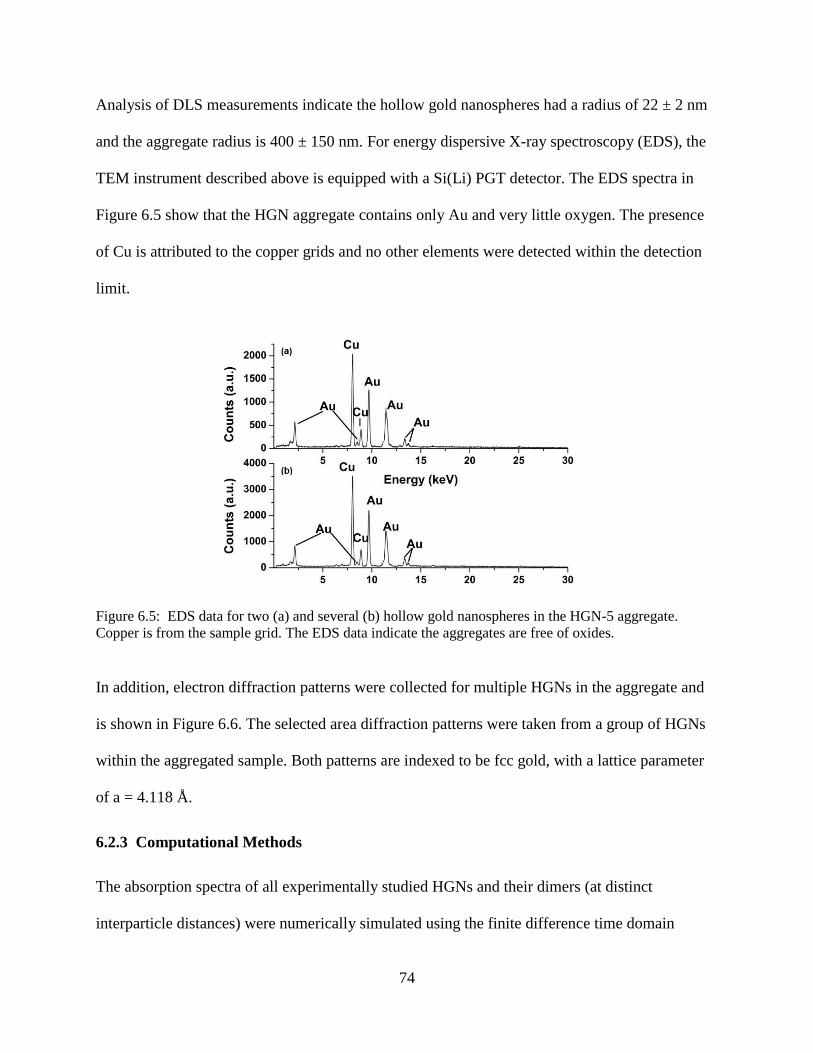
74
Analysis of DLS measurements indicate the hollow gold nanospheres had a radius of 22 ± 2 nm
and the aggregate radius is 400 ± 150 nm. For energy dispersive X-ray spectroscopy (EDS), the
TEM instrument described above is equipped with a Si(Li) PGT detector. The EDS spectra in
Figure 6.5 show that the HGN aggregate contains only Au and very little oxygen. The presence
of Cu is attributed to the copper grids and no other elements were detected within the detection
limit.
Figure 6.5: EDS data for two (a) and several (b) hollow gold nanospheres in the HGN-5 aggregate.
Copper is from the sample grid. The EDS data indicate the aggregates are free of oxides.
In addition, electron diffraction patterns were collected for multiple HGNs in the aggregate and
is shown in Figure 6.6. The selected area diffraction patterns were taken from a group of HGNs
within the aggregated sample. Both patterns are indexed to be fcc gold, with a lattice parameter
of a = 4.118 Å.
6.2.3 Computational Methods
The absorption spectra of all experimentally studied HGNs and their dimers (at distinct
interparticle distances) were numerically simulated using the finite difference time domain
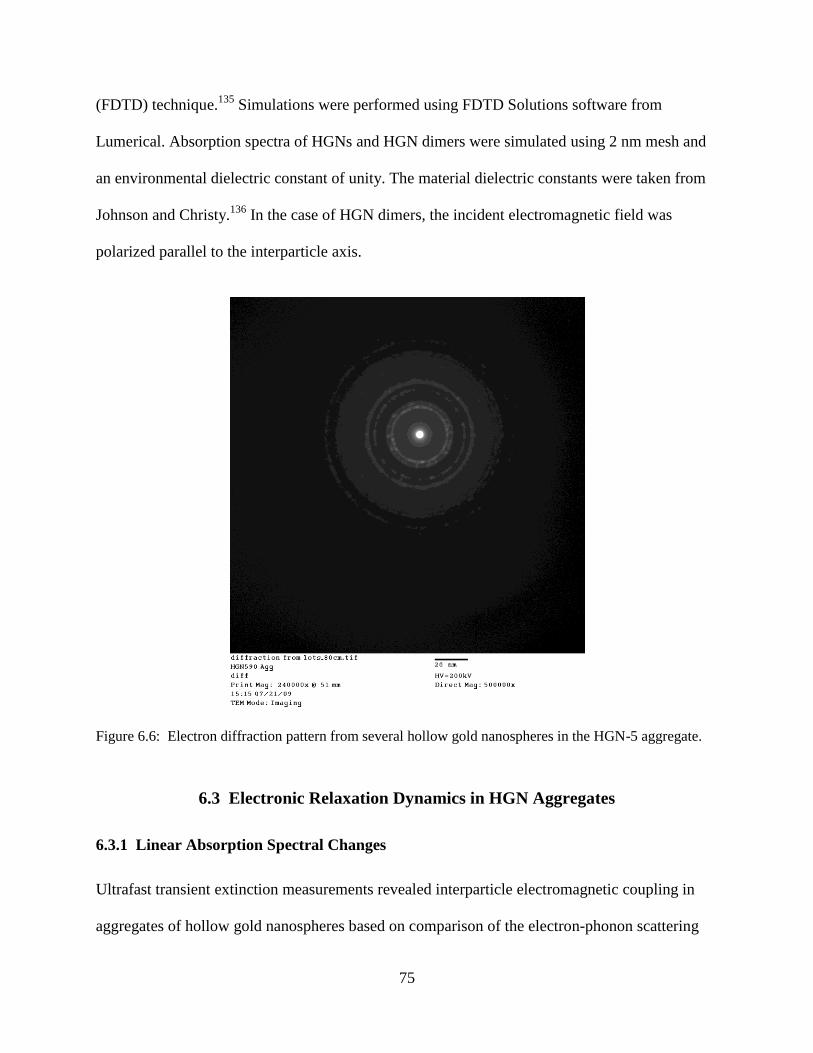
75
(FDTD) technique.135
Simulations were performed using FDTD Solutions software from
Lumerical. Absorption spectra of HGNs and HGN dimers were simulated using 2 nm mesh and
an environmental dielectric constant of unity. The material dielectric constants were taken from
Johnson and Christy.136
In the case of HGN dimers, the incident electromagnetic field was
polarized parallel to the interparticle axis.
Figure 6.6: Electron diffraction pattern from several hollow gold nanospheres in the HGN-5 aggregate.
6.3 Electronic Relaxation Dynamics in HGN Aggregates
6.3.1 Linear Absorption Spectral Changes
Ultrafast transient extinction measurements revealed interparticle electromagnetic coupling in
aggregates of hollow gold nanospheres based on comparison of the electron-phonon scattering
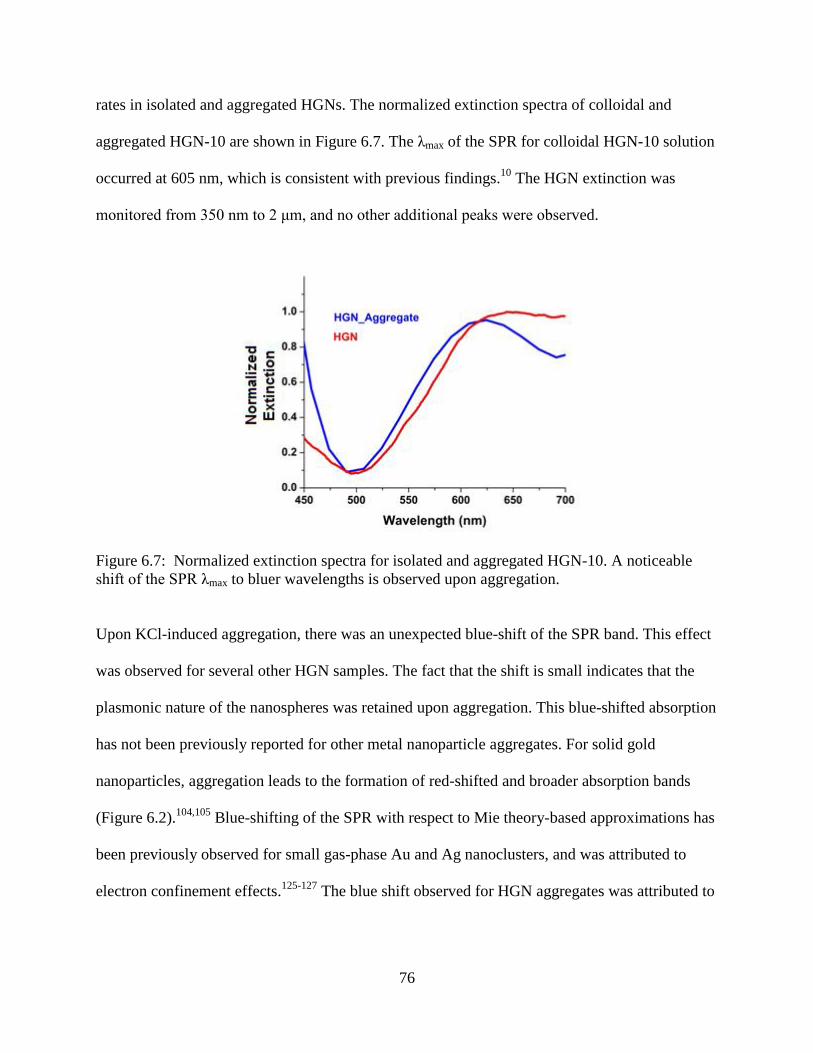
76
rates in isolated and aggregated HGNs. The normalized extinction spectra of colloidal and
aggregated HGN-10 are shown in Figure 6.7. The λmax of the SPR for colloidal HGN-10 solution
occurred at 605 nm, which is consistent with previous findings.10
The HGN extinction was
monitored from 350 nm to 2 μm, and no other additional peaks were observed.
Figure 6.7: Normalized extinction spectra for isolated and aggregated HGN-10. A noticeable
shift of the SPR λmax to bluer wavelengths is observed upon aggregation.
Upon KCl-induced aggregation, there was an unexpected blue-shift of the SPR band. This effect
was observed for several other HGN samples. The fact that the shift is small indicates that the
plasmonic nature of the nanospheres was retained upon aggregation. This blue-shifted absorption
has not been previously reported for other metal nanoparticle aggregates. For solid gold
nanoparticles, aggregation leads to the formation of red-shifted and broader absorption bands
(Figure 6.2).104,105
Blue-shifting of the SPR with respect to Mie theory-based approximations has
been previously observed for small gas-phase Au and Ag nanoclusters, and was attributed to
electron confinement effects.125-127
The blue shift observed for HGN aggregates was attributed to
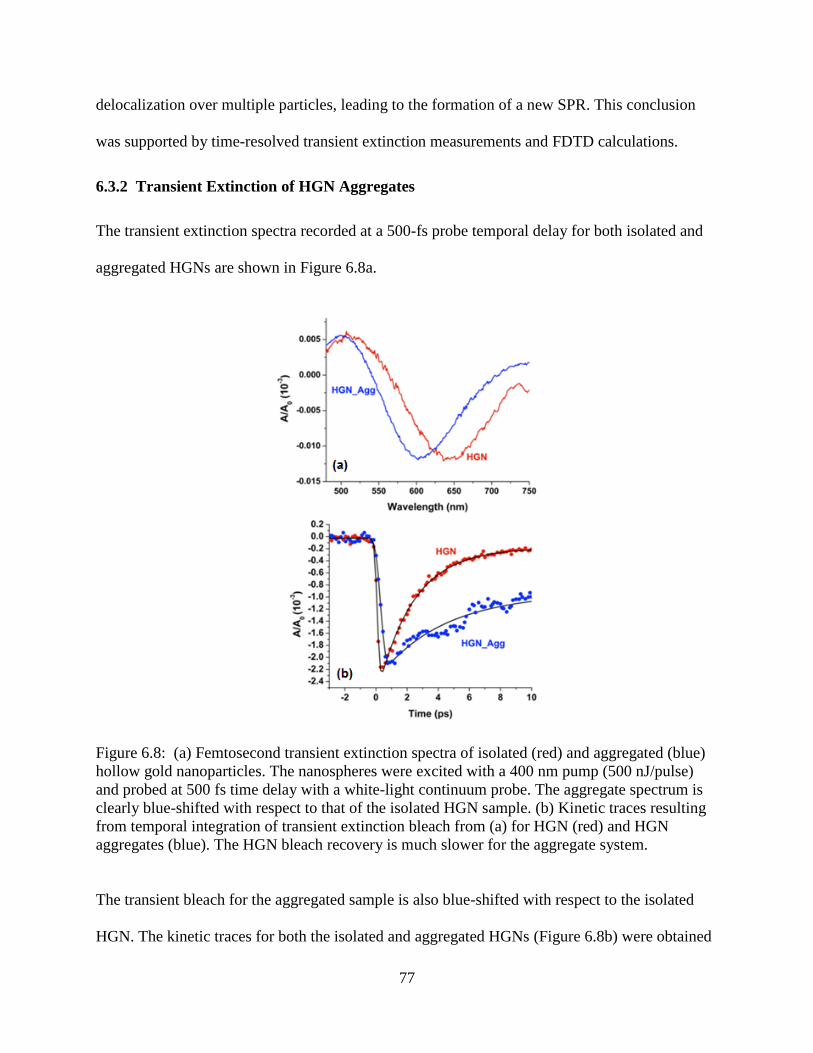
77
delocalization over multiple particles, leading to the formation of a new SPR. This conclusion
was supported by time-resolved transient extinction measurements and FDTD calculations.
6.3.2 Transient Extinction of HGN Aggregates
The transient extinction spectra recorded at a 500-fs probe temporal delay for both isolated and
aggregated HGNs are shown in Figure 6.8a.
Figure 6.8: (a) Femtosecond transient extinction spectra of isolated (red) and aggregated (blue)
hollow gold nanoparticles. The nanospheres were excited with a 400 nm pump (500 nJ/pulse)
and probed at 500 fs time delay with a white-light continuum probe. The aggregate spectrum is
clearly blue-shifted with respect to that of the isolated HGN sample. (b) Kinetic traces resulting
from temporal integration of transient extinction bleach from (a) for HGN (red) and HGN
aggregates (blue). The HGN bleach recovery is much slower for the aggregate system.
The transient bleach for the aggregated sample is also blue-shifted with respect to the isolated
HGN. The kinetic traces for both the isolated and aggregated HGNs (Figure 6.8b) were obtained
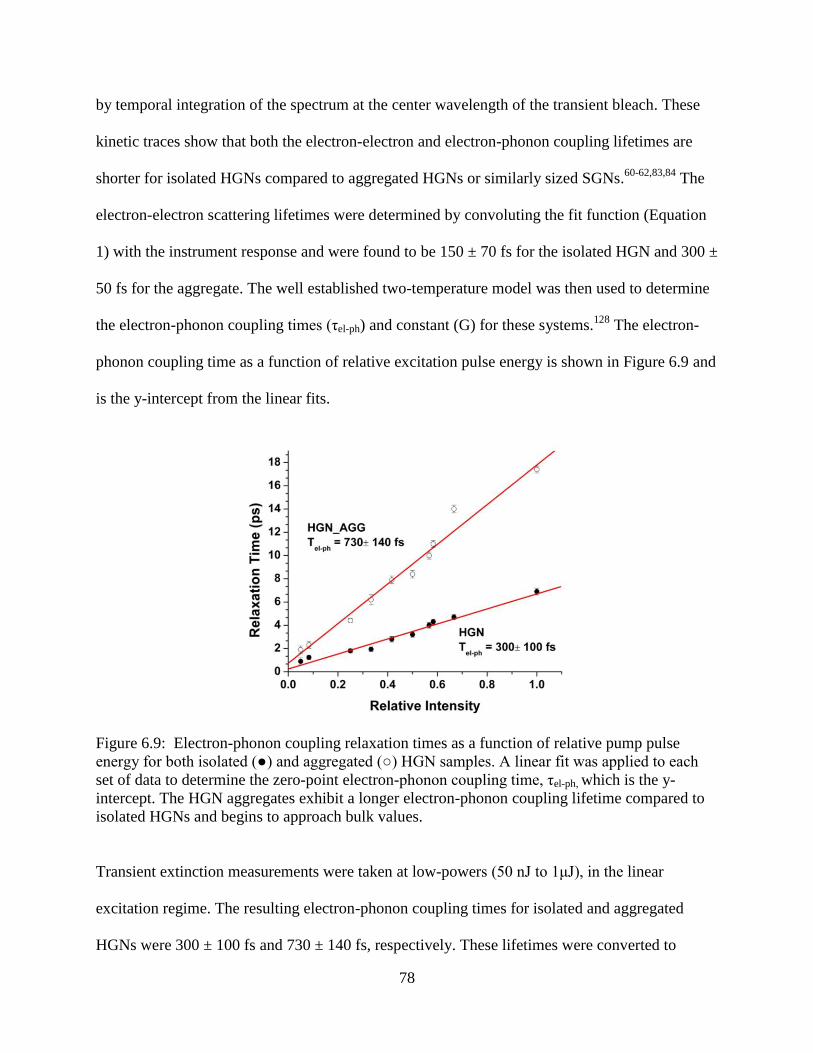
78
by temporal integration of the spectrum at the center wavelength of the transient bleach. These
kinetic traces show that both the electron-electron and electron-phonon coupling lifetimes are
shorter for isolated HGNs compared to aggregated HGNs or similarly sized SGNs.60-62,83,84
The
electron-electron scattering lifetimes were determined by convoluting the fit function (Equation
1) with the instrument response and were found to be 150 ± 70 fs for the isolated HGN and 300 ±
50 fs for the aggregate. The well established two-temperature model was then used to determine
the electron-phonon coupling times (τel-ph) and constant (G) for these systems.128
The electron-
phonon coupling time as a function of relative excitation pulse energy is shown in Figure 6.9 and
is the y-intercept from the linear fits.
Figure 6.9: Electron-phonon coupling relaxation times as a function of relative pump pulse
energy for both isolated (●) and aggregated (○) HGN samples. A linear fit was applied to each
set of data to determine the zero-point electron-phonon coupling time, τel-ph, which is the y-
intercept. The HGN aggregates exhibit a longer electron-phonon coupling lifetime compared to
isolated HGNs and begins to approach bulk values.
Transient extinction measurements were taken at low-powers (50 nJ to 1μJ), in the linear
excitation regime. The resulting electron-phonon coupling times for isolated and aggregated
HGNs were 300 ± 100 fs and 730 ± 140 fs, respectively. These lifetimes were converted to
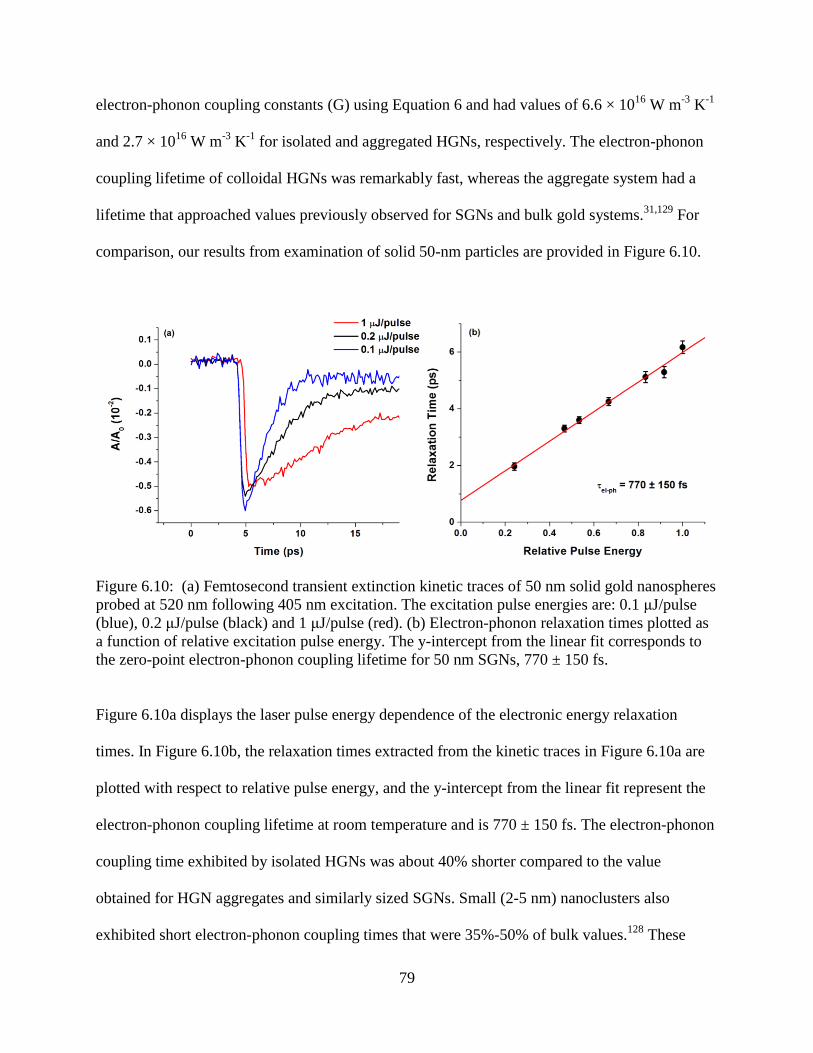
79
electron-phonon coupling constants (G) using Equation 6 and had values of 6.6 × 10¹⁶
W m-3
K-1
and 2.7 × 10¹⁶
W m-3
K-1
for isolated and aggregated HGNs, respectively. The electron-phonon
coupling lifetime of colloidal HGNs was remarkably fast, whereas the aggregate system had a
lifetime that approached values previously observed for SGNs and bulk gold systems.31,129
For
comparison, our results from examination of solid 50-nm particles are provided in Figure 6.10.
Figure 6.10: (a) Femtosecond transient extinction kinetic traces of 50 nm solid gold nanospheres
probed at 520 nm following 405 nm excitation. The excitation pulse energies are: 0.1 μJ/pulse
(blue), 0.2 μJ/pulse (black) and 1 μJ/pulse (red). (b) Electron-phonon relaxation times plotted as
a function of relative excitation pulse energy. The y-intercept from the linear fit corresponds to
the zero-point electron-phonon coupling lifetime for 50 nm SGNs, 770 ± 150 fs.
Figure 6.10a displays the laser pulse energy dependence of the electronic energy relaxation
times. In Figure 6.10b, the relaxation times extracted from the kinetic traces in Figure 6.10a are
plotted with respect to relative pulse energy, and the y-intercept from the linear fit represent the
electron-phonon coupling lifetime at room temperature and is 770 ± 150 fs. The electron-phonon
coupling time exhibited by isolated HGNs was about 40% shorter compared to the value
obtained for HGN aggregates and similarly sized SGNs. Small (2-5 nm) nanoclusters also
exhibited short electron-phonon coupling times that were 35%-50% of bulk values.128
These
80
previous findings for small nanoclusters suggest that the faster electron-phonon coupling times
of HGNs result from the higher surface-to-volume ratio of these structures, where the electrons
are spatially confined in the thin shell. The blue shift of the SPR and relaxation lifetimes
approaching values of large SGNs and bulk gold suggest that the HGN aggregates exhibit
interparticle coupling. This can be most simply rationalized as a volume effect where the
electronic energy seems to delocalize through the aggregate. More importantly, this occurs
because the electron is spatially confined within the thin shell of the HGN. These initial findings
show that HGN aggregates have potential to be used to control energy transport over nanometer-
length scales.
6.4 Controlled SPR Properties of HGN Aggregates
In addition to SPR shifts, the aggregation of hollow gold nanospheres leads to changes in the
spatial distribution of the strong electric fields generated at the surface of these nanoparticles.
This section will demonstrate that these properties can be tailored using thiol-ligands, instead of
KCl solution, to form aggregates that contain only a few HGNs, such as dimers and trimers.
Furthermore, the SPR spectral position and electric field distribution depends heavily upon the
size of the interparticle separation and the HGN shell thickness. Since the shell thickness is
typically less than 10 nm, HGNs can be used to study the interaction between the interior
(cavity) surfaces that are separated by very small distances.10,16
As described in Section 6.3, the
SPR of aggregated surface-necked HGNs shifts to shorter wavelengths compared to the
transverse SPR of an isolated HGN.11
FDTD simulations were performed and suggest that the
blue-shifted SPR can be assigned to a newly formed longitudinal SPR of HGN dimers. Two
possible explanations for this blue shift are (1) antibonding modes of hybridized plasmons of two
HGNs69
or (2) a charge-transfer plasmon resonance.70-72
In the first case, a SPR blue shift would
81
occur in an asymmetric nanosphere aggregate. The individual plasmon modes of each HGN
hybridize to form a lower energy bonding mode and a higher energy antibonding mode. For an
asymmetric dimer, the spectral weight would be shifted from the bonding to the antibonding
mode, or other higher-order modes.74
In the case of the charge-transfer model,71,72
conductive
overlap may occur when the particles are either in contact leading to the blue shift; such an
overlap would lead to a collective time-dependent charge oscillation over the dimer. The results
presented here indicate that HGNs can exhibit both hybridized plasmon modes and collective
charge transfer resonances when the particles are assembled into small or large extended
aggregate structures. Dielectric screening occurs for aggregates formed using cysteine molecules
where a significant interparticle gap between adjacent HGNs exists. For these structures, the
optical properties can be explained using the hybridization model of surface plasmon modes. In
contrast, the spectral shifts exhibited by contact HGN dimers results from charge-transfer
resonances.
6.4.1 Thiol-Induced Aggregation of HGNs
In order to study the structure dependence of interparticle coupling, the aggregates of HGN-2,
HGN-6, HGN-8, HGN-13, HGN-15, HGN-16, and HGN-17 were examined. Dimensions, along
with their standard deviations, for all HGNs investigated are provided in Table 6.1. The different
thiols used as aggregating agents formed two different types of aggregate structures.
Ethanedithiol-induced aggregates were characterized by HGNs in close contact with one another,
usually as dimers. Cysteine-induced aggregates were characterized by HGNs separated by >1 nm
gap. The extinction spectra of both isolated and aggregated HGN-2, HGN-6, HGN-8, and HGN-
17 are shown in Figure 6.11. This spectral position depends directly on the outer diameter-to-
shell thickness aspect ratio. For all seven HGNs examined in this study, cysteine addition yielded
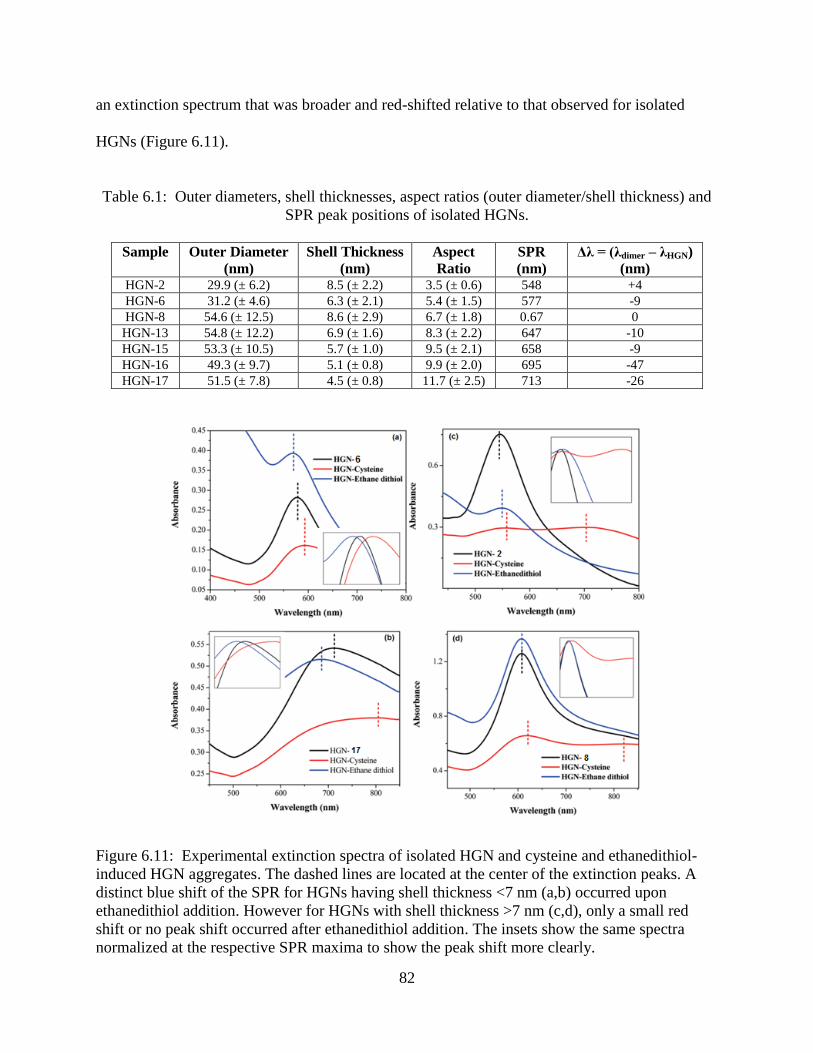
82
an extinction spectrum that was broader and red-shifted relative to that observed for isolated
HGNs (Figure 6.11).
Table 6.1: Outer diameters, shell thicknesses, aspect ratios (outer diameter/shell thickness) and
SPR peak positions of isolated HGNs.
Sample Outer Diameter
(nm)
Shell Thickness
(nm)
Aspect
Ratio
SPR
(nm)
Δλ = (λdimer – λHGN)
(nm) HGN-2 29.9 (± 6.2) 8.5 (± 2.2) 3.5 (± 0.6) 548 +4
HGN-6 31.2 (± 4.6) 6.3 (± 2.1) 5.4 (± 1.5) 577 -9
HGN-8 54.6 (± 12.5) 8.6 (± 2.9) 6.7 (± 1.8) 0.67 0
HGN-13 54.8 (± 12.2) 6.9 (± 1.6) 8.3 (± 2.2) 647 -10
HGN-15 53.3 (± 10.5) 5.7 (± 1.0) 9.5 (± 2.1) 658 -9
HGN-16 49.3 (± 9.7) 5.1 (± 0.8) 9.9 (± 2.0) 695 -47
HGN-17 51.5 (± 7.8) 4.5 (± 0.8) 11.7 (± 2.5) 713 -26
Figure 6.11: Experimental extinction spectra of isolated HGN and cysteine and ethanedithiol-
induced HGN aggregates. The dashed lines are located at the center of the extinction peaks. A
distinct blue shift of the SPR for HGNs having shell thickness <7 nm (a,b) occurred upon
ethanedithiol addition. However for HGNs with shell thickness >7 nm (c,d), only a small red
shift or no peak shift occurred after ethanedithiol addition. The insets show the same spectra
normalized at the respective SPR maxima to show the peak shift more clearly.
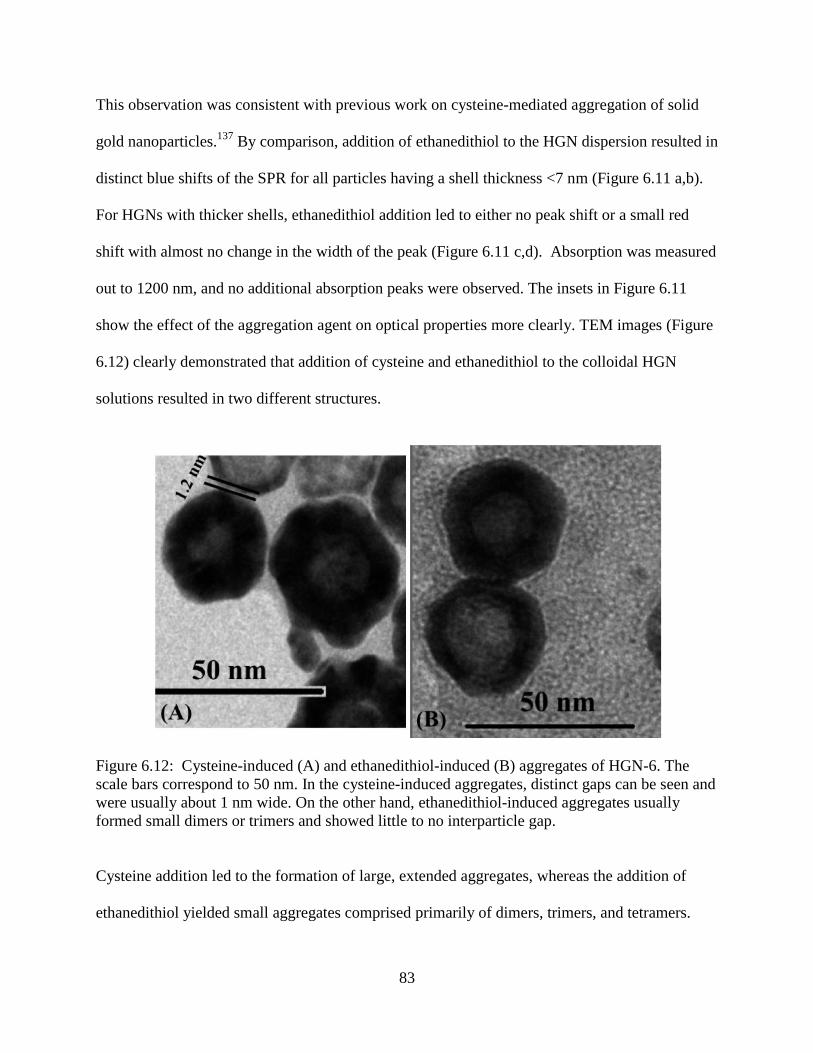
83
This observation was consistent with previous work on cysteine-mediated aggregation of solid
gold nanoparticles.137
By comparison, addition of ethanedithiol to the HGN dispersion resulted in
distinct blue shifts of the SPR for all particles having a shell thickness <7 nm (Figure 6.11 a,b).
For HGNs with thicker shells, ethanedithiol addition led to either no peak shift or a small red
shift with almost no change in the width of the peak (Figure 6.11 c,d). Absorption was measured
out to 1200 nm, and no additional absorption peaks were observed. The insets in Figure 6.11
show the effect of the aggregation agent on optical properties more clearly. TEM images (Figure
6.12) clearly demonstrated that addition of cysteine and ethanedithiol to the colloidal HGN
solutions resulted in two different structures.
Figure 6.12: Cysteine-induced (A) and ethanedithiol-induced (B) aggregates of HGN-6. The
scale bars correspond to 50 nm. In the cysteine-induced aggregates, distinct gaps can be seen and
were usually about 1 nm wide. On the other hand, ethanedithiol-induced aggregates usually
formed small dimers or trimers and showed little to no interparticle gap.
Cysteine addition led to the formation of large, extended aggregates, whereas the addition of
ethanedithiol yielded small aggregates comprised primarily of dimers, trimers, and tetramers.
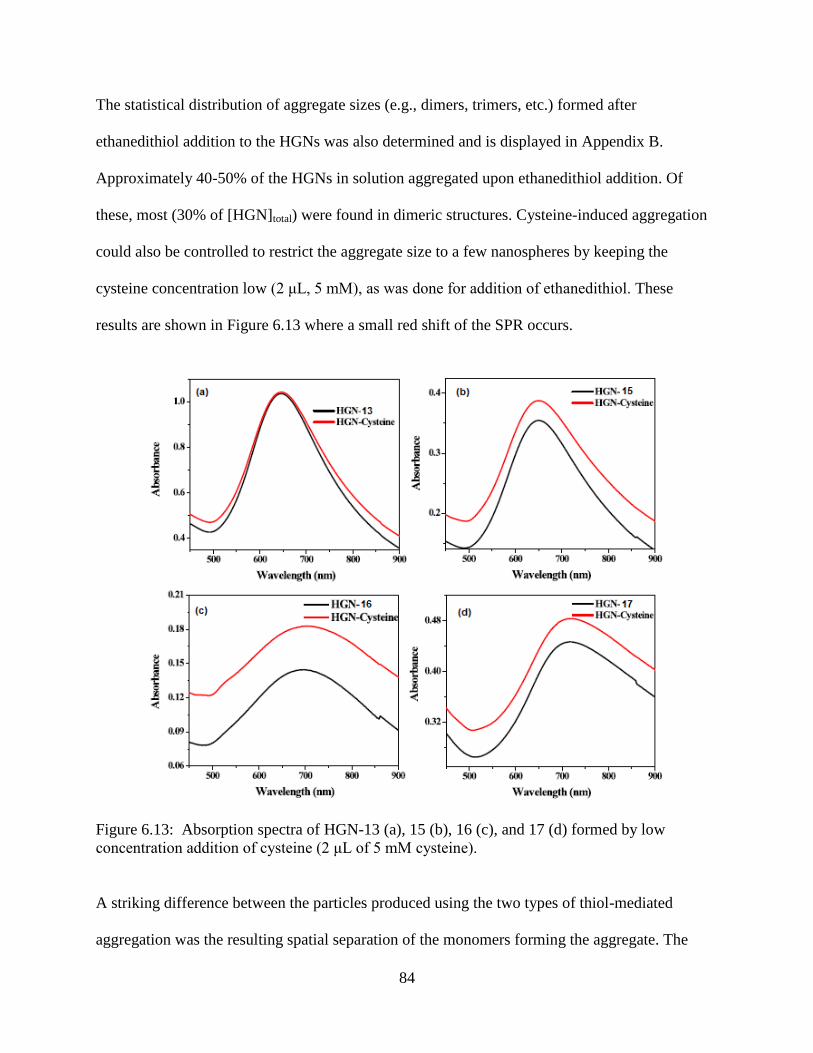
84
The statistical distribution of aggregate sizes (e.g., dimers, trimers, etc.) formed after
ethanedithiol addition to the HGNs was also determined and is displayed in Appendix B.
Approximately 40-50% of the HGNs in solution aggregated upon ethanedithiol addition. Of
these, most (30% of [HGN]total) were found in dimeric structures. Cysteine-induced aggregation
could also be controlled to restrict the aggregate size to a few nanospheres by keeping the
cysteine concentration low (2 μL, 5 mM), as was done for addition of ethanedithiol. These
results are shown in Figure 6.13 where a small red shift of the SPR occurs.
Figure 6.13: Absorption spectra of HGN-13 (a), 15 (b), 16 (c), and 17 (d) formed by low
concentration addition of cysteine (2 μL of 5 mM cysteine).
A striking difference between the particles produced using the two types of thiol-mediated
aggregation was the resulting spatial separation of the monomers forming the aggregate. The
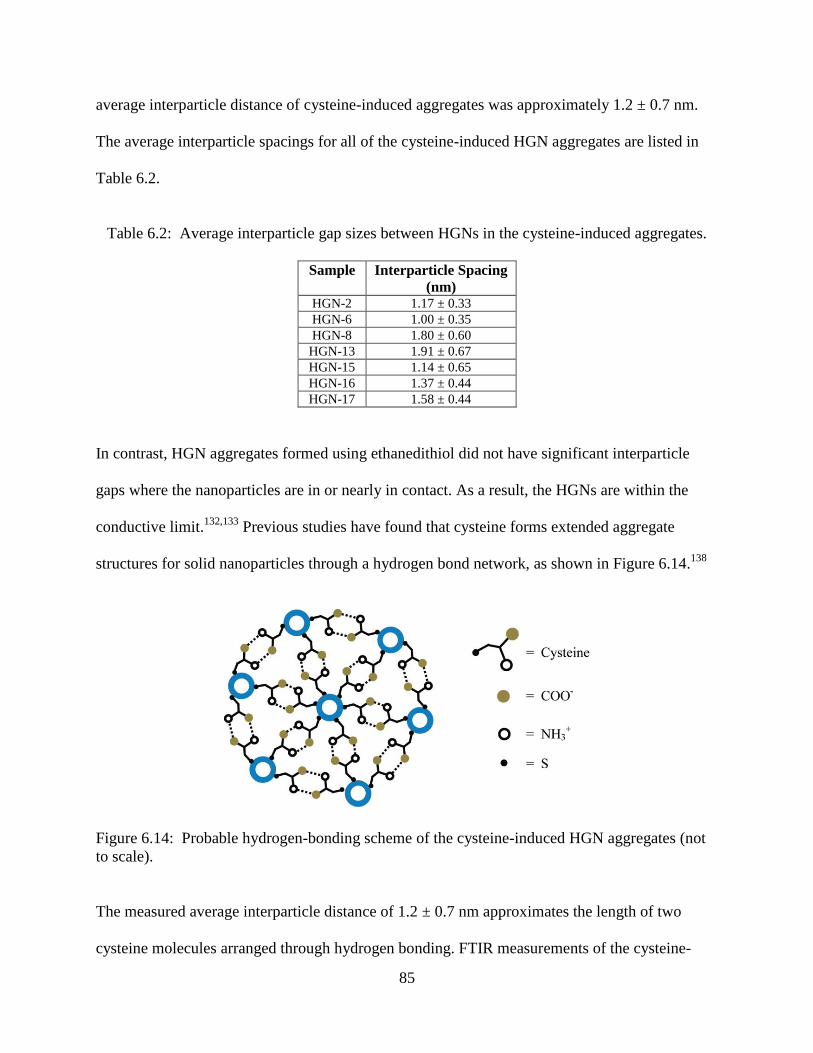
85
average interparticle distance of cysteine-induced aggregates was approximately 1.2 ± 0.7 nm.
The average interparticle spacings for all of the cysteine-induced HGN aggregates are listed in
Table 6.2.
Table 6.2: Average interparticle gap sizes between HGNs in the cysteine-induced aggregates.
Sample Interparticle Spacing
(nm) HGN-2 1.17 ± 0.33
HGN-6 1.00 ± 0.35
HGN-8 1.80 ± 0.60
HGN-13 1.91 ± 0.67
HGN-15 1.14 ± 0.65
HGN-16 1.37 ± 0.44
HGN-17 1.58 ± 0.44
In contrast, HGN aggregates formed using ethanedithiol did not have significant interparticle
gaps where the nanoparticles are in or nearly in contact. As a result, the HGNs are within the
conductive limit.132,133
Previous studies have found that cysteine forms extended aggregate
structures for solid nanoparticles through a hydrogen bond network, as shown in Figure 6.14.138
Figure 6.14: Probable hydrogen-bonding scheme of the cysteine-induced HGN aggregates (not
to scale).
The measured average interparticle distance of 1.2 ± 0.7 nm approximates the length of two
cysteine molecules arranged through hydrogen bonding. FTIR measurements of the cysteine-
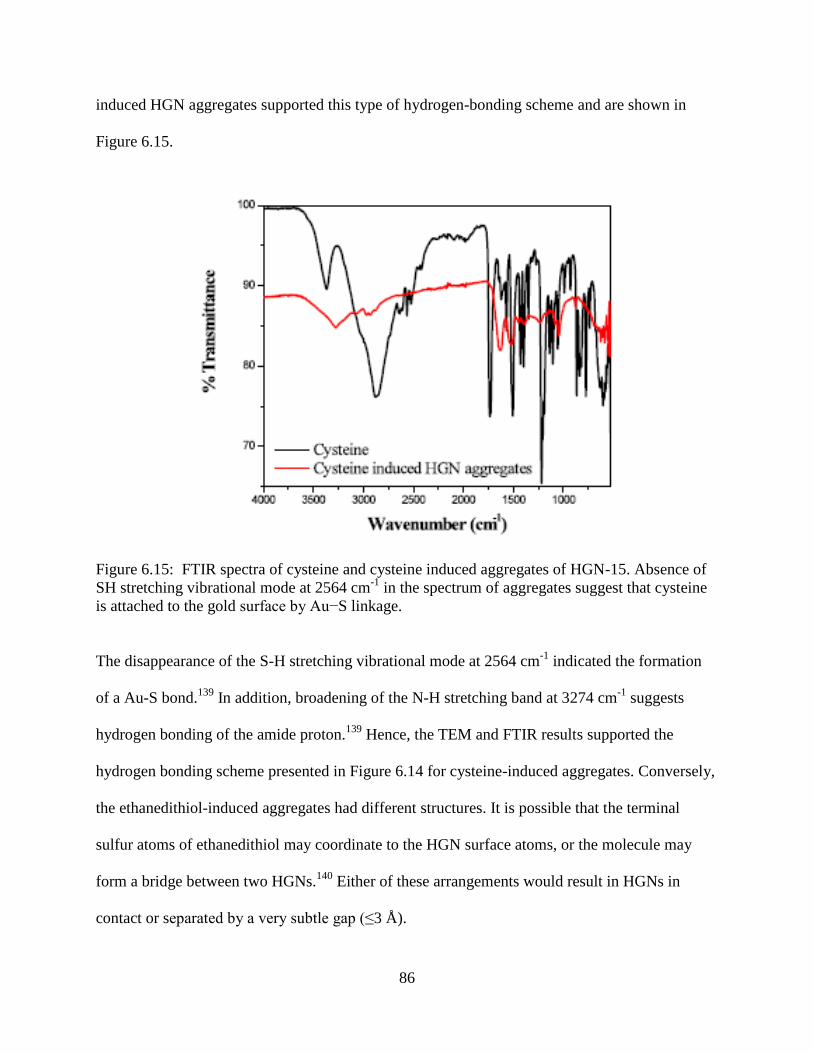
86
induced HGN aggregates supported this type of hydrogen-bonding scheme and are shown in
Figure 6.15.
Figure 6.15: FTIR spectra of cysteine and cysteine induced aggregates of HGN-15. Absence of
SH stretching vibrational mode at 2564 cm-1
in the spectrum of aggregates suggest that cysteine
is attached to the gold surface by Au−S linkage.
The disappearance of the S-H stretching vibrational mode at 2564 cm-1
indicated the formation
of a Au-S bond.139
In addition, broadening of the N-H stretching band at 3274 cm-1
suggests
hydrogen bonding of the amide proton.139
Hence, the TEM and FTIR results supported the
hydrogen bonding scheme presented in Figure 6.14 for cysteine-induced aggregates. Conversely,
the ethanedithiol-induced aggregates had different structures. It is possible that the terminal
sulfur atoms of ethanedithiol may coordinate to the HGN surface atoms, or the molecule may
form a bridge between two HGNs.140
Either of these arrangements would result in HGNs in
contact or separated by a very subtle gap (≤3 Å).
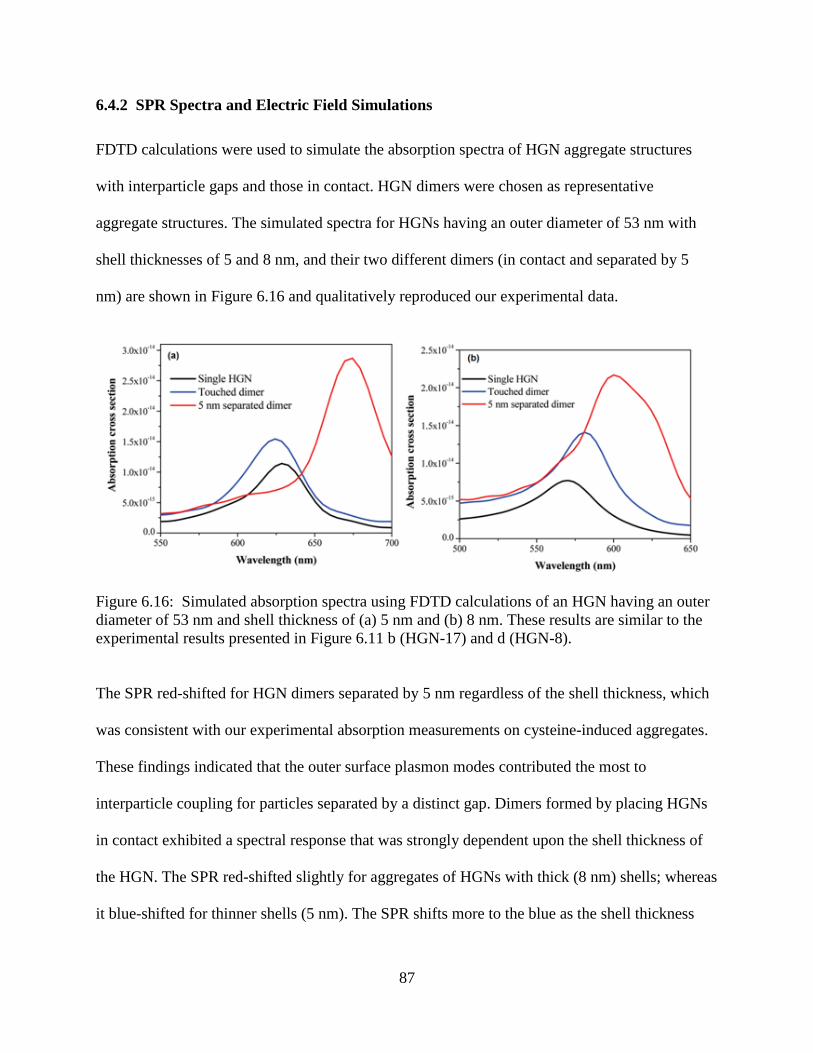
87
6.4.2 SPR Spectra and Electric Field Simulations
FDTD calculations were used to simulate the absorption spectra of HGN aggregate structures
with interparticle gaps and those in contact. HGN dimers were chosen as representative
aggregate structures. The simulated spectra for HGNs having an outer diameter of 53 nm with
shell thicknesses of 5 and 8 nm, and their two different dimers (in contact and separated by 5
nm) are shown in Figure 6.16 and qualitatively reproduced our experimental data.
Figure 6.16: Simulated absorption spectra using FDTD calculations of an HGN having an outer
diameter of 53 nm and shell thickness of (a) 5 nm and (b) 8 nm. These results are similar to the
experimental results presented in Figure 6.11 b (HGN-17) and d (HGN-8).
The SPR red-shifted for HGN dimers separated by 5 nm regardless of the shell thickness, which
was consistent with our experimental absorption measurements on cysteine-induced aggregates.
These findings indicated that the outer surface plasmon modes contributed the most to
interparticle coupling for particles separated by a distinct gap. Dimers formed by placing HGNs
in contact exhibited a spectral response that was strongly dependent upon the shell thickness of
the HGN. The SPR red-shifted slightly for aggregates of HGNs with thick (8 nm) shells; whereas
it blue-shifted for thinner shells (5 nm). The SPR shifts more to the blue as the shell thickness
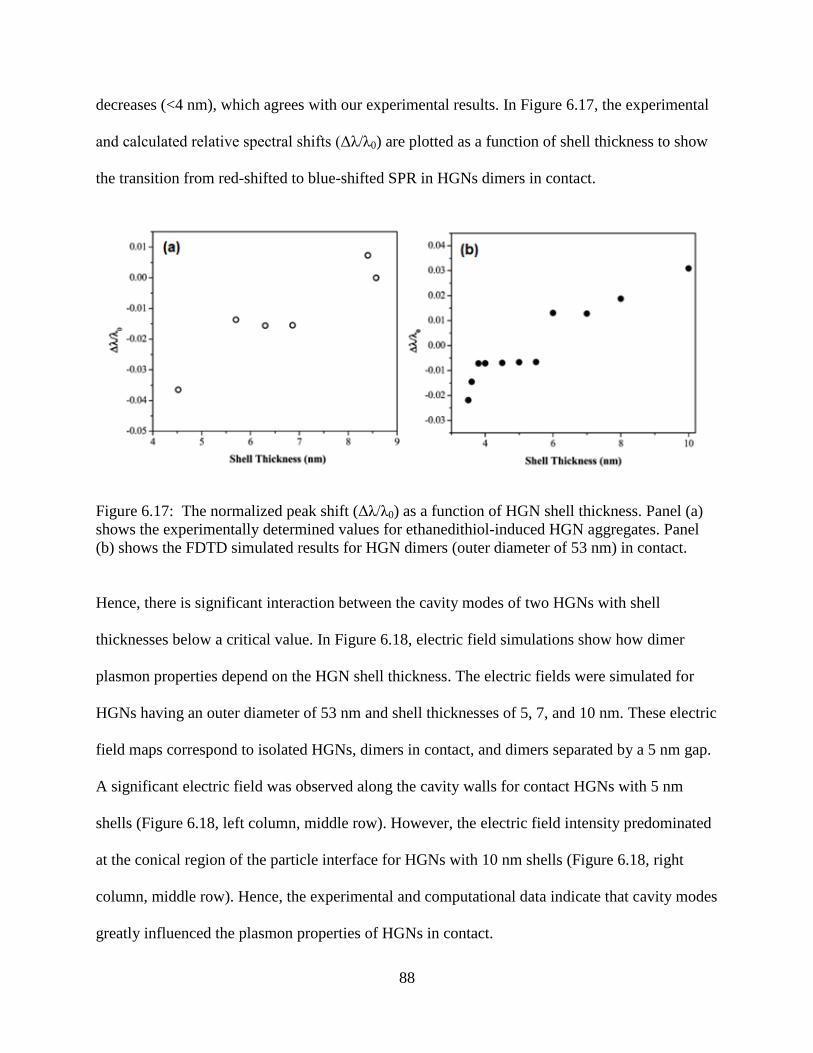
88
decreases (<4 nm), which agrees with our experimental results. In Figure 6.17, the experimental
and calculated relative spectral shifts (Δλ/λ0) are plotted as a function of shell thickness to show
the transition from red-shifted to blue-shifted SPR in HGNs dimers in contact.
Figure 6.17: The normalized peak shift (Δλ/λ0) as a function of HGN shell thickness. Panel (a)
shows the experimentally determined values for ethanedithiol-induced HGN aggregates. Panel
(b) shows the FDTD simulated results for HGN dimers (outer diameter of 53 nm) in contact.
Hence, there is significant interaction between the cavity modes of two HGNs with shell
thicknesses below a critical value. In Figure 6.18, electric field simulations show how dimer
plasmon properties depend on the HGN shell thickness. The electric fields were simulated for
HGNs having an outer diameter of 53 nm and shell thicknesses of 5, 7, and 10 nm. These electric
field maps correspond to isolated HGNs, dimers in contact, and dimers separated by a 5 nm gap.
A significant electric field was observed along the cavity walls for contact HGNs with 5 nm
shells (Figure 6.18, left column, middle row). However, the electric field intensity predominated
at the conical region of the particle interface for HGNs with 10 nm shells (Figure 6.18, right
column, middle row). Hence, the experimental and computational data indicate that cavity modes
greatly influenced the plasmon properties of HGNs in contact.
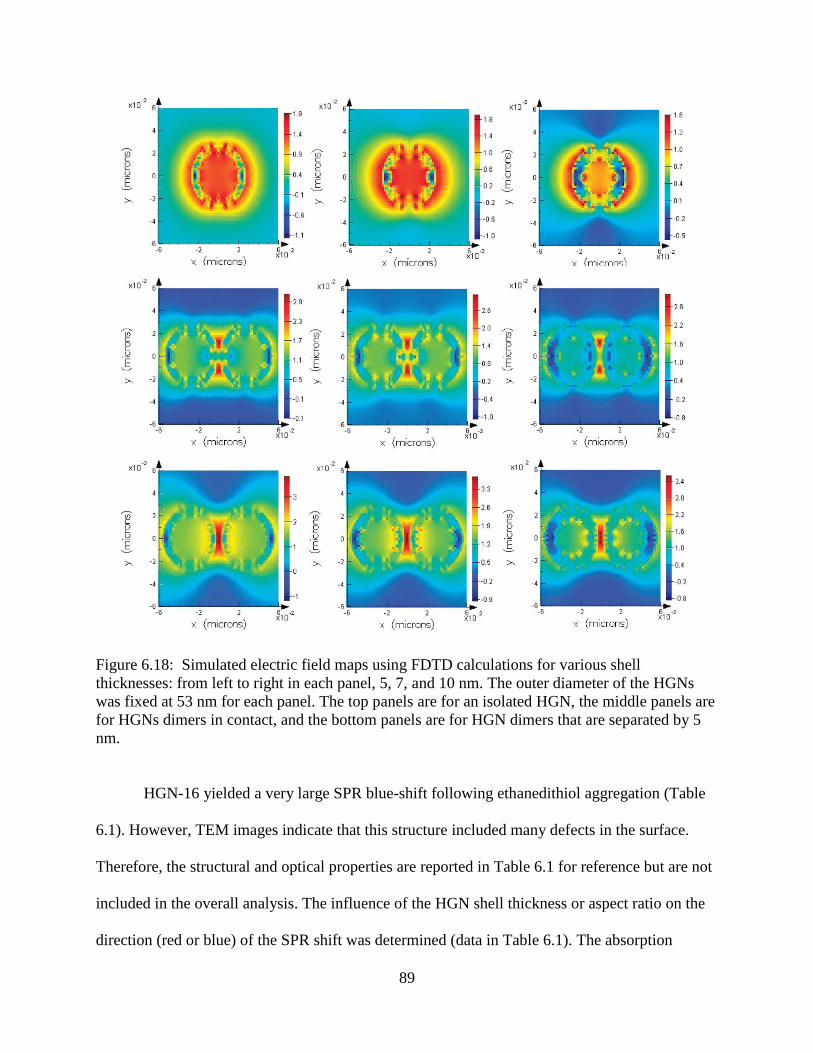
89
Figure 6.18: Simulated electric field maps using FDTD calculations for various shell
thicknesses: from left to right in each panel, 5, 7, and 10 nm. The outer diameter of the HGNs
was fixed at 53 nm for each panel. The top panels are for an isolated HGN, the middle panels are
for HGNs dimers in contact, and the bottom panels are for HGN dimers that are separated by 5
nm.
HGN-16 yielded a very large SPR blue-shift following ethanedithiol aggregation (Table
6.1). However, TEM images indicate that this structure included many defects in the surface.
Therefore, the structural and optical properties are reported in Table 6.1 for reference but are not
included in the overall analysis. The influence of the HGN shell thickness or aspect ratio on the
direction (red or blue) of the SPR shift was determined (data in Table 6.1). The absorption
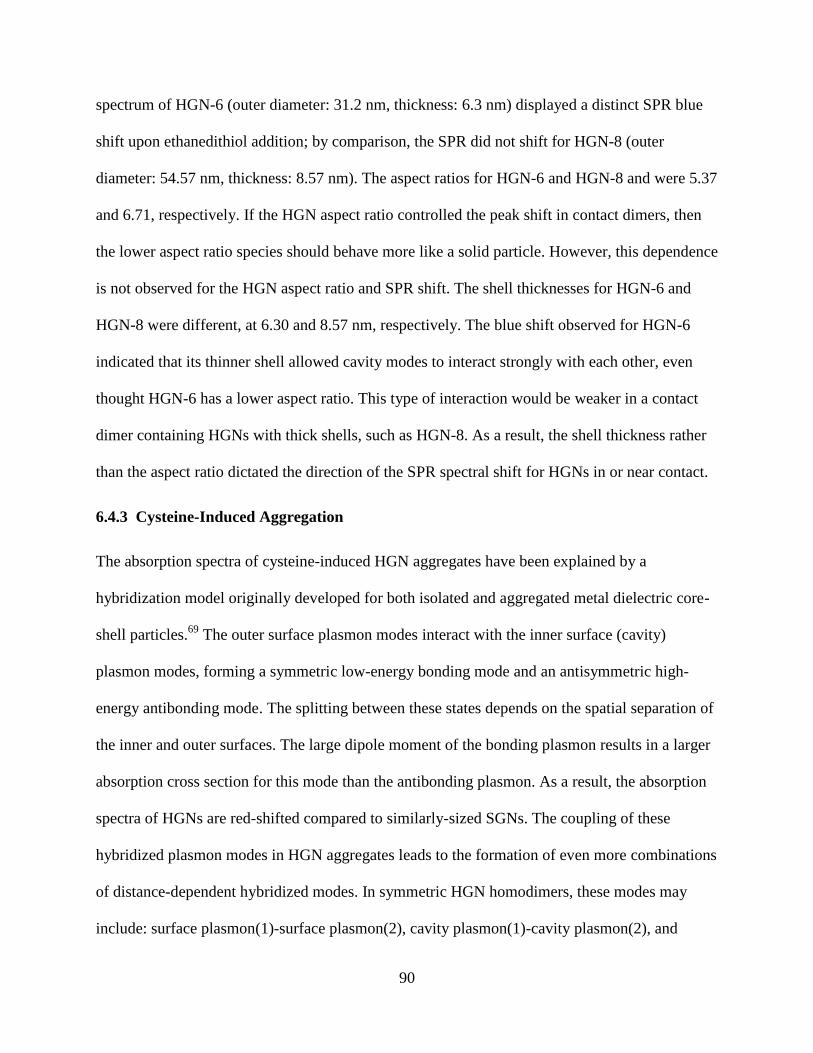
90
spectrum of HGN-6 (outer diameter: 31.2 nm, thickness: 6.3 nm) displayed a distinct SPR blue
shift upon ethanedithiol addition; by comparison, the SPR did not shift for HGN-8 (outer
diameter: 54.57 nm, thickness: 8.57 nm). The aspect ratios for HGN-6 and HGN-8 and were 5.37
and 6.71, respectively. If the HGN aspect ratio controlled the peak shift in contact dimers, then
the lower aspect ratio species should behave more like a solid particle. However, this dependence
is not observed for the HGN aspect ratio and SPR shift. The shell thicknesses for HGN-6 and
HGN-8 were different, at 6.30 and 8.57 nm, respectively. The blue shift observed for HGN-6
indicated that its thinner shell allowed cavity modes to interact strongly with each other, even
thought HGN-6 has a lower aspect ratio. This type of interaction would be weaker in a contact
dimer containing HGNs with thick shells, such as HGN-8. As a result, the shell thickness rather
than the aspect ratio dictated the direction of the SPR spectral shift for HGNs in or near contact.
6.4.3 Cysteine-Induced Aggregation
The absorption spectra of cysteine-induced HGN aggregates have been explained by a
hybridization model originally developed for both isolated and aggregated metal dielectric core-
shell particles.69
The outer surface plasmon modes interact with the inner surface (cavity)
plasmon modes, forming a symmetric low-energy bonding mode and an antisymmetric high-
energy antibonding mode. The splitting between these states depends on the spatial separation of
the inner and outer surfaces. The large dipole moment of the bonding plasmon results in a larger
absorption cross section for this mode than the antibonding plasmon. As a result, the absorption
spectra of HGNs are red-shifted compared to similarly-sized SGNs. The coupling of these
hybridized plasmon modes in HGN aggregates leads to the formation of even more combinations
of distance-dependent hybridized modes. In symmetric HGN homodimers, these modes may
include: surface plasmon(1)-surface plasmon(2), cavity plasmon(1)-cavity plasmon(2), and
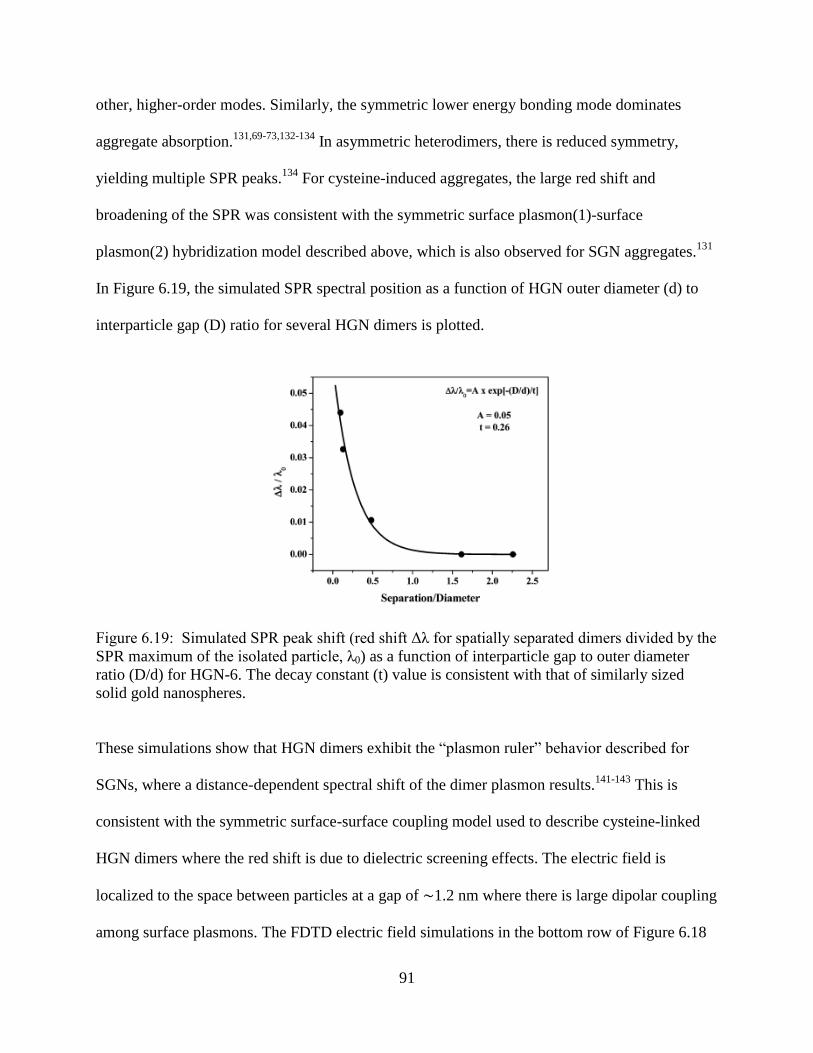
91
other, higher-order modes. Similarly, the symmetric lower energy bonding mode dominates
aggregate absorption.131,69-73,132-134
In asymmetric heterodimers, there is reduced symmetry,
yielding multiple SPR peaks.134
For cysteine-induced aggregates, the large red shift and
broadening of the SPR was consistent with the symmetric surface plasmon(1)-surface
plasmon(2) hybridization model described above, which is also observed for SGN aggregates.131
In Figure 6.19, the simulated SPR spectral position as a function of HGN outer diameter (d) to
interparticle gap (D) ratio for several HGN dimers is plotted.
Figure 6.19: Simulated SPR peak shift (red shift Δλ for spatially separated dimers divided by the
SPR maximum of the isolated particle, λ0) as a function of interparticle gap to outer diameter
ratio (D/d) for HGN-6. The decay constant (t) value is consistent with that of similarly sized
solid gold nanospheres.
These simulations show that HGN dimers exhibit the “plasmon ruler” behavior described for
SGNs, where a distance-dependent spectral shift of the dimer plasmon results.141-143
This is
consistent with the symmetric surface-surface coupling model used to describe cysteine-linked
HGN dimers where the red shift is due to dielectric screening effects. The electric field is
localized to the space between particles at a gap of ∼1.2 nm where there is large dipolar coupling
among surface plasmons. The FDTD electric field simulations in the bottom row of Figure 6.18
92
verify this behavior. Spectral broadening may have occurred due to the formation of large and
extended aggregate structures, as observed in the electron microscope images (Figure 6.12).
6.4.4 Ethanedithiol-Induced Aggregation
By comparison, ethanedithiol-induced aggregates resulted in HGNs that were in or near contact
and complex plasmonic behavior. In order to describe the plasmon properties of touching HGNs,
the following contributions were considered: (1) reduced dielectric screening which led to
decreased red shifting of the SPR, (2) increased contributions from antibonding or higher-order
modes, and (3) formation of a charge-transfer plasmon resonance. If dielectric screening effects
contributed, then a lower-frequency SPR (spectral red shift) would have been observed
(refractive index of ethanedithiol is 1.5589 and that of water is 1.33 at 20°C).144
However, this is
not consistent with either the experimental and theoretical data on ethanedithiol-induced
aggregates. Therefore, changes in dielectric screening alone cannot be used to account for the
experimentally observed SPR blue shift of HGN dimers in or near contact.
Thinner HGN shells allows cavity and surface plasmons to interact more, resulting in a
more dominant antibonding mode that gains spectral weight from the bonding mode.69-73,132-134
In
the case of an HGN dimer, the plasmon modes of one particle can interact with those of the other
particle. The hybridized symmetric bonding mode and antisymmetric antibonding mode of each
HGN should couple to their counterparts to give rise to the hybridized states of the dimer.73
A
red shift of the SPR would occur when the coupling involves only the bonding modes of two
HGNs.145
In contrast, a blue shift of the SPR would result when the coupling involves the
antibonding HGN modes. Higher order modes may also be present when two HGNs interact, and
would appear as several absorption peaks at SPR frequencies that depend on the aspect ratio and
the interparticle spatial separation. However, only a single SPR band upon surface contact was
93
observed and is not consistent with a system exhibiting higher-order modes. In heterodimers,
these interactions become increasingly significant due to the reduced symmetry.134
Although the
structures reported here were homodimers, it is possible that sample polydispersity led to
reduced symmetry.
A charge transfer plasmon resonance occurs when nanospheres are close enough to allow
a collective charge oscillation between the two particles.70,73
This charge oscillation results in a
time-varying total charge for each nanosphere, which is highly sensitive to the interfacial
structure of the dimer.73
The large interfacial volume of HGNs makes them ideal materials to
study collective charge oscillations. Figure 6.20 illustrates the charge cloud oscillation following
interaction with an EM wave having the electric field polarized parallel to the interparticle
longitudinal axis of the dimer.
Figure 6.20: Schematic of a stable charge-transfer plasmon where the incident electromagnetic
field is polarized parallel to the interparticle axis of the hollow gold nanospheres. The distance
between the two cavities is given by D.
Since the HGNs in the dimer are coupled within the near-field limit, the two surfaces in contact
will be instantaneously polarized with opposite signs for the charge, leading to a stable charge-
transfer configuration. This is consistent with the experimentally observed (Figure 6.17a) and
theoretically confirmed (Figure 6.17b) thickness dependence of the SPR shift. The coupling
strength increased as the spatial separation between the cavities decreased, or the shell became
94
thinner. Asymmetric hybridized plasmon modes are still considered as a possible contribution to
the observed blue shifting of the SPR of contact HGNs. However, the charge transfer plasmon
resonance may contribute to HGN contact dimer properties due to the strong shell thickness
dependence and the absence of higher-order plasmon frequencies in the aggregate absorption
spectra. Further studies using advanced spectroscopic techniques and rigorous quantum
mechanical calculations may provide more insight into the unique SPR properties of HGNs.
6.5 Conclusions
Both experimental and computational studies of SPR properties for small and extended HGN
aggregates have been described. The SPR spectral position of HGN aggregates could be tuned to
either higher or lower energies compared to those of the isolated HGNs, which is not observed
for solid nanospheres. A charge-transfer plasmon model involving interparticle coupling was
used to account for the SPR blue-shift that depended strongly on HGN shell thickness and aspect
ratio. These results are supported by earlier findings where the HGN aggregates formed through
KCl addition led to longer electron-phonon coupling times. Additionally, the direction of the
SPR shift (red or blue) was dictated by the interparticle gap separating the HGN dimers. All
examined aggregates that possessed a large gap (1.2 ± 0.7 nm) showed a broad and red-shifted
SPR peak, which was fully described by symmetric bonding plasmon modes. However,
aggregation of thin-shell, high-aspect-ratio HGNs using short-chain dithiols exhibited a
pronounced, newly formed longitudinal SPR that was blue-shifted with respect to the transverse
SPR of isolated HGNs. Aggregates of low-aspect ratio particles formed by the same manner did
not show any significant spectral change. FDTD simulations reproduced the experimental
measurements and also indicated that the resultant nanoscale electric field amplitudes and spatial
profiles were extremely sensitive to nanosphere shell thickness. These findings highlight the

95
critical role of the inner HGN cavity surface in composite nanostructures. Moreover, HGNs
provide a versatile platform not only for plasmonic engineering but also for developing coupled
composite plasmonic nanostructures.
96
CHAPTER SEVEN
GOLD NANOPARTICLE AND IRON PORPHYRIN
INTERACTION
7.1 Introduction
The addition of a cationic porphyrin, such as iron(III) tetrakis(1-methyl-4-pyridyl)porphine
(FeTMPyP), to a solid gold nanoparticle (SGN) or hollow gold nanoparticle (HGN) solution led
to the formation of SGN and HGN aggregates. The aggregation was indicated through the
observed spectral changes in the linear absorption spectrum of the nanoparticle solution. It is
important to note that FeTMPyP in aqueous solution undergoes several equilibria with changing
pH.132
At pH values less than 4, the porphyrin exists solely as the monoaquo ferric porphyrin
[FeTMPyP(H2O)] with spectral features at 400, 515, and 640 nm.147
At pH values greater than 4,
FeTMPyP forms a μ-oxo dimer species in aqueous solution.148
Our absorption spectrum showed
a strong peak corresponding to the Soret band at 425, a Q0 band at 600, and a Qb band at 630 nm.
These spectral positions are consistent with a system that contained both the monomer
(FeTMPyP(OH)2) and dimer ([FeTMPyP(OH)]2O) forms, where the Soret, Q0, and Qb bands
occurred at 424, 603, and 632 nm, respectively.147
The dimerization reaction
2[FeTMPyP(OH)2]3+
⇌ [[FeTMPyP(OH)]2O]6+
+ H2O
is believed to result in a low-spin, six-coordinate complex with the iron atoms bonded by an
Fe(III)-O-Fe(III) μ-oxo bridge.148
Hence, Raman experiments were carried out using porphyrin
solutions at pH 10 to ensure that there were predominantly FeTMPyP dimers. In addition,
evidence of strong antiferromagnetic coupling between the two Fe(III) ions results in much
lower magnetic susceptibilties for the μ-oxo bridged dimer than for the monomer.149
97
7.2 Materials and Methods
7.2.1 Aggregation Using FeTMPyP
HGNs were prepared according to Section 2.1.2. In order to form HGN aggregates, 10 μL of
6.25 x 10⁻⁵
M FeTMPyP in water (pH adjusted to 10 using sodium hydroxide) was added to 1
mL of the gold nanoparticle solution and vortexed. The aggregated sample was then used
immediately for the Raman experiments. Gold colloids were prepared by citrate reduction of
gold, following the method reported by Ghosh et al. and described in Section 2.1.2.74
Specifically, 50 mL of water containing 0.25 mM HAuCl4 was heated to boiling. Then, 0.50 mL
of 1% trisodium citrate was added to the boiling solution with vigorous stirring, reducing the
Au3+
and forming the gold nanoparticles. The solution was boiled for at least 10 minutes before
allowing the solution to cool to room temperature. This procedure resulted in solid gold
nanospheres having an average outer diameter of 38.4 ± 1.2 nm. In order to form the gold
nanoparticle aggregates, 4 μL of 6.25 x 10⁻⁵
M FeTMPyP in water (pH adjusted to 10 using
sodium hydroxide) was added to 1 mL of the gold nanoparticle solution and vortexed. The
aggregated sample was then used immediately for the Raman experiments.
7.2.2 Raman Spectroscopy
In order to observe the surface-enhanced Raman scattering (SERS) signal, the appropriate
excitation wavelength for the samples was determined based on resonance with the longitudinal
plasmon band. Hence, an excitation wavelength of 785 nm was used for the SGN aggregates,
which is close to the longitudinal plasmon band that occurred at 760 nm. For the HGN
aggregates, a laser excitation source at 633 nm was used because the longitudinal plasmon band
occurred at 685 nm.
98
Raman scattering measurements were carried out using a Horiba Jobin Yvon HR800 UV
microRaman spectrograph. The laser excitation source had a wavelength of either 632.8 nm or
784.65 nm. The 633 nm laser was a linearly polarized, 17 mW HeNe laser (Melles-Griot 25-
LHP-925-249) which gave about 4.5 mW of power at the sample. The 785 nm laser was also
linearly polarized, 80 mW grating stabilized diode laser (Toptica DL 100) and had about 5 mW
of power at the sample. The confocal microscope had a focal length of 800 nm and used two
Semrock filters: a bandpass filter to clean up the laser (LL01-633-12.5 for 633 nm, LL01-785-
12.5 for 785 nm) and an long-wave-pass edge filter (LP02-633RE-25 for 633 nm, LP02-785RU-
25 for 785 nm) to couple the laser into the microscope and reject the Rayleigh scattering while
allowing longer wavelengths (>50 cm-1
to the red of 633 nm, >110 cm-1
to the red of 785 nm) to
pass through to the spectrograph. The grating used had 600 lines/mm. An Olympus BX30M
microscope was used that had a macrosample mirror attachment to couple the microscope to a
cuvette holder (Quantum Northwest TLC 50-F, thermoelectric temperature control). The
temperature control feature of this cuvette holder was not used in the experiments described here.
The CCD detector was from Wright Instruments (ATECCD-1024X56-0), which was an 1024 x
256 pixel, open electrode EEV CCD, with 26 µm x 26 µm pixels, and four stage
thermoelectrically cooled to -70 deg °C. The computer software was LabSpec V4.08 from
Horiba JY. The Raman scattering signal was collected from 100 to 1700 cm-1 with an overlap of
244 pixels and 467 pixels for the experiments conducted using the 785 and 633 nm lasers,
respectively. The Raman scattering signal was collected for 180 and 240 seconds, three times
each and then averaged, for the experiments using the 785 and 633 nm lasers, respectively. These
experiments were carried out on both solid and hollow gold nanosphere solutions containing
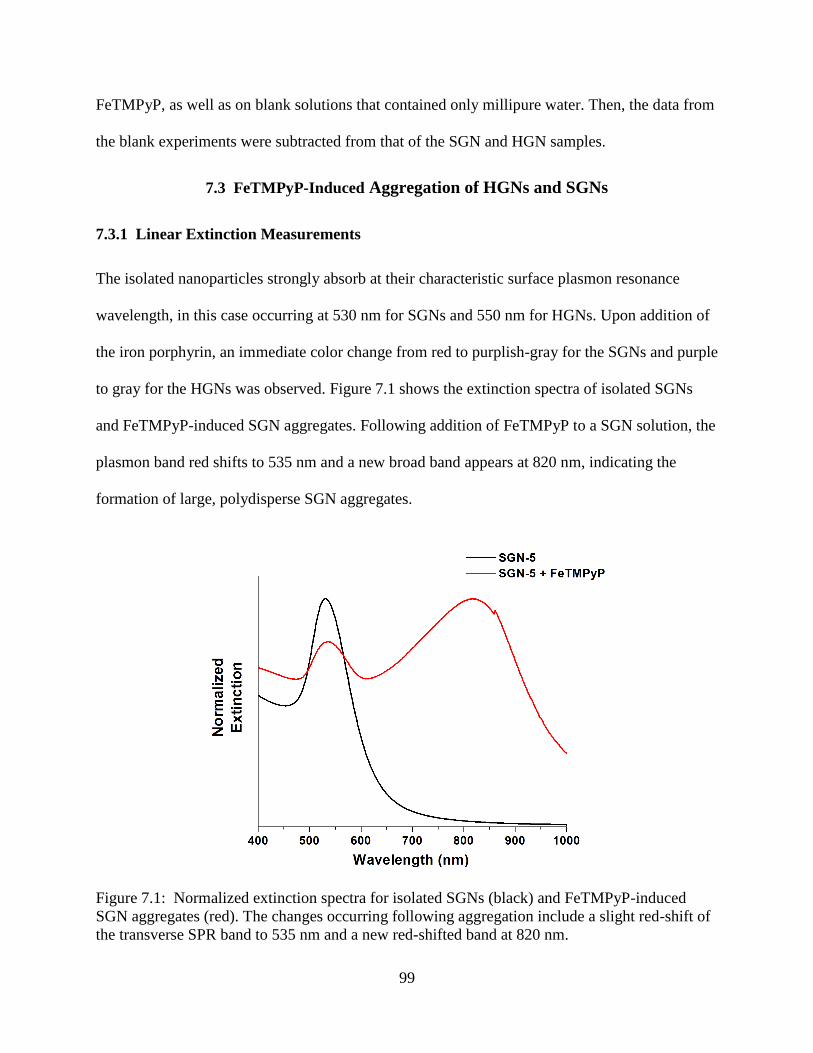
99
FeTMPyP, as well as on blank solutions that contained only millipure water. Then, the data from
the blank experiments were subtracted from that of the SGN and HGN samples.
7.3 FeTMPyP-Induced Aggregation of HGNs and SGNs
7.3.1 Linear Extinction Measurements
The isolated nanoparticles strongly absorb at their characteristic surface plasmon resonance
wavelength, in this case occurring at 530 nm for SGNs and 550 nm for HGNs. Upon addition of
the iron porphyrin, an immediate color change from red to purplish-gray for the SGNs and purple
to gray for the HGNs was observed. Figure 7.1 shows the extinction spectra of isolated SGNs
and FeTMPyP-induced SGN aggregates. Following addition of FeTMPyP to a SGN solution, the
plasmon band red shifts to 535 nm and a new broad band appears at 820 nm, indicating the
formation of large, polydisperse SGN aggregates.
Figure 7.1: Normalized extinction spectra for isolated SGNs (black) and FeTMPyP-induced
SGN aggregates (red). The changes occurring following aggregation include a slight red-shift of
the transverse SPR band to 535 nm and a new red-shifted band at 820 nm.
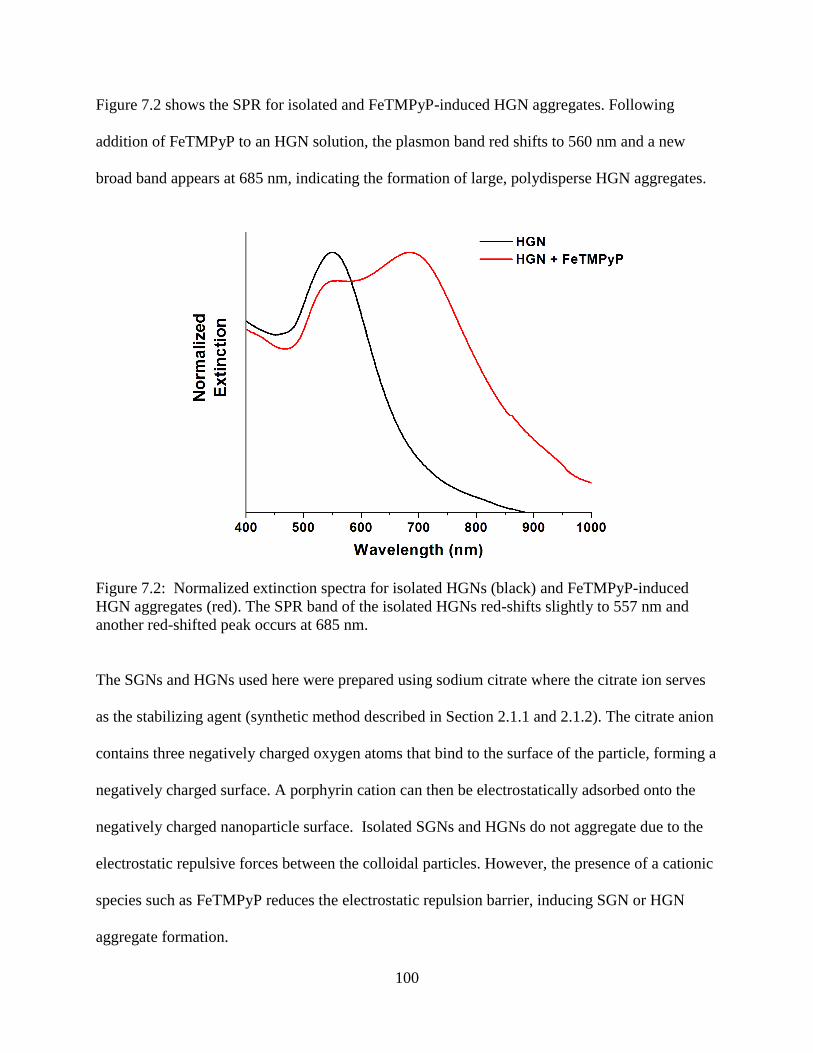
100
Figure 7.2 shows the SPR for isolated and FeTMPyP-induced HGN aggregates. Following
addition of FeTMPyP to an HGN solution, the plasmon band red shifts to 560 nm and a new
broad band appears at 685 nm, indicating the formation of large, polydisperse HGN aggregates.
Figure 7.2: Normalized extinction spectra for isolated HGNs (black) and FeTMPyP-induced
HGN aggregates (red). The SPR band of the isolated HGNs red-shifts slightly to 557 nm and
another red-shifted peak occurs at 685 nm.
The SGNs and HGNs used here were prepared using sodium citrate where the citrate ion serves
as the stabilizing agent (synthetic method described in Section 2.1.1 and 2.1.2). The citrate anion
contains three negatively charged oxygen atoms that bind to the surface of the particle, forming a
negatively charged surface. A porphyrin cation can then be electrostatically adsorbed onto the
negatively charged nanoparticle surface. Isolated SGNs and HGNs do not aggregate due to the
electrostatic repulsive forces between the colloidal particles. However, the presence of a cationic
species such as FeTMPyP reduces the electrostatic repulsion barrier, inducing SGN or HGN
aggregate formation.
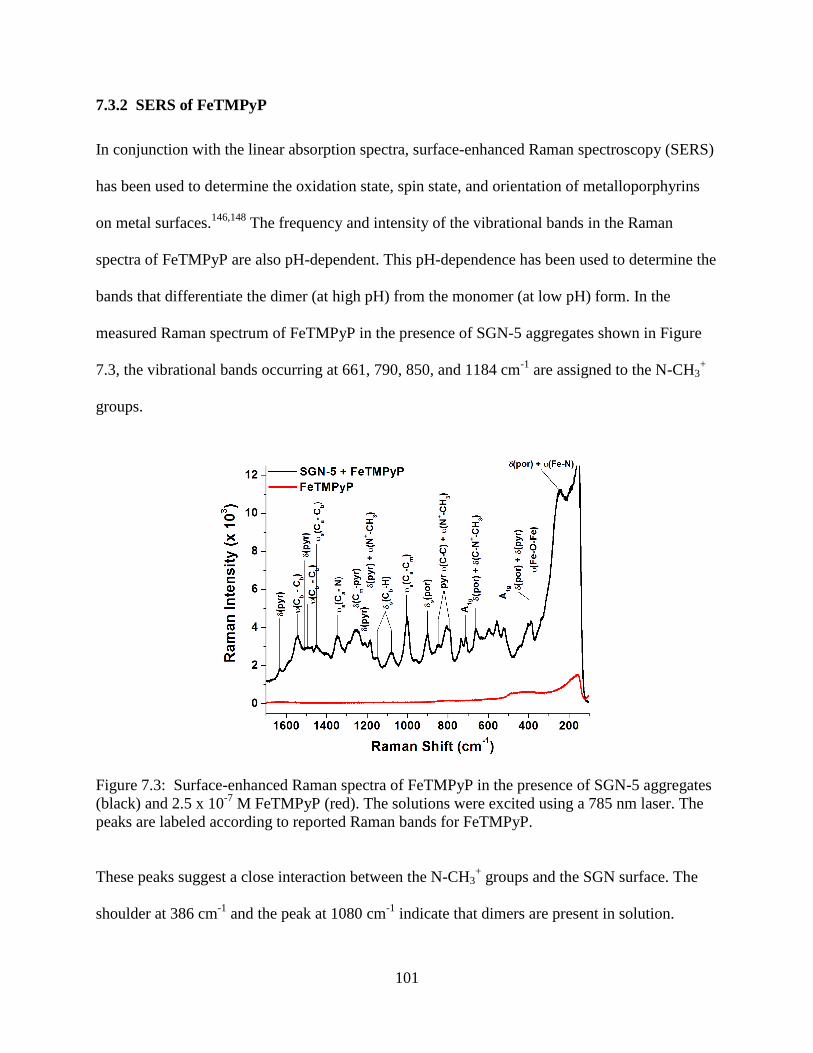
101
7.3.2 SERS of FeTMPyP
In conjunction with the linear absorption spectra, surface-enhanced Raman spectroscopy (SERS)
has been used to determine the oxidation state, spin state, and orientation of metalloporphyrins
on metal surfaces.146,148
The frequency and intensity of the vibrational bands in the Raman
spectra of FeTMPyP are also pH-dependent. This pH-dependence has been used to determine the
bands that differentiate the dimer (at high pH) from the monomer (at low pH) form. In the
measured Raman spectrum of FeTMPyP in the presence of SGN-5 aggregates shown in Figure
7.3, the vibrational bands occurring at 661, 790, 850, and 1184 cm-1
are assigned to the N-CH3+
groups.
Figure 7.3: Surface-enhanced Raman spectra of FeTMPyP in the presence of SGN-5 aggregates
(black) and 2.5 x 10⁻⁷
M FeTMPyP (red). The solutions were excited using a 785 nm laser. The
peaks are labeled according to reported Raman bands for FeTMPyP.
These peaks suggest a close interaction between the N-CH3+ groups and the SGN surface. The
shoulder at 386 cm-1
and the peak at 1080 cm-1
indicate that dimers are present in solution.
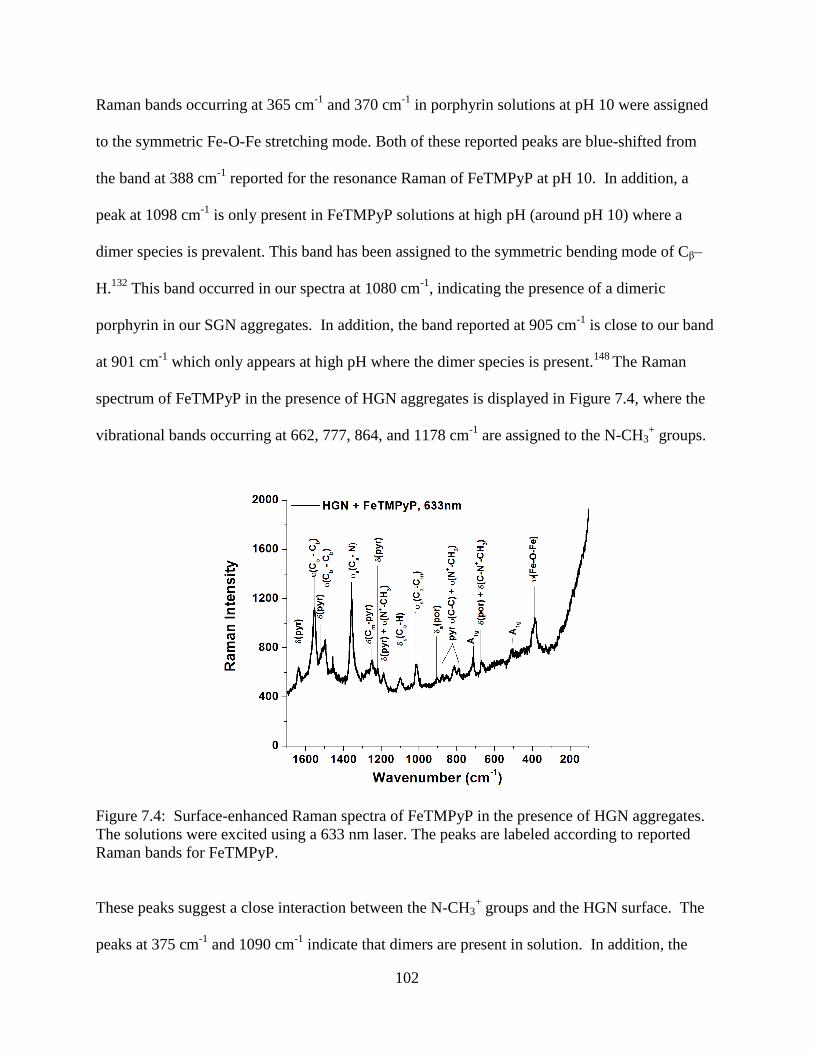
102
Raman bands occurring at 365 cm-1
and 370 cm-1
in porphyrin solutions at pH 10 were assigned
to the symmetric Fe-O-Fe stretching mode. Both of these reported peaks are blue-shifted from
the band at 388 cm-1
reported for the resonance Raman of FeTMPyP at pH 10. In addition, a
peak at 1098 cm-1
is only present in FeTMPyP solutions at high pH (around pH 10) where a
dimer species is prevalent. This band has been assigned to the symmetric bending mode of Cβ–
H.132
This band occurred in our spectra at 1080 cm-1
, indicating the presence of a dimeric
porphyrin in our SGN aggregates. In addition, the band reported at 905 cm-1
is close to our band
at 901 cm-1
which only appears at high pH where the dimer species is present.148
The Raman
spectrum of FeTMPyP in the presence of HGN aggregates is displayed in Figure 7.4, where the
vibrational bands occurring at 662, 777, 864, and 1178 cm-1
are assigned to the N-CH3+ groups.
Figure 7.4: Surface-enhanced Raman spectra of FeTMPyP in the presence of HGN aggregates.
The solutions were excited using a 633 nm laser. The peaks are labeled according to reported
Raman bands for FeTMPyP.
These peaks suggest a close interaction between the N-CH3+ groups and the HGN surface. The
peaks at 375 cm-1
and 1090 cm-1
indicate that dimers are present in solution. In addition, the
103
band reported at 905 cm-1
is close to the band we measure at 896 cm-1
which only appears at high
pH where the dimer species is present.148
The possible orientations of the FeTMPyP molecule on the SGN and HGN surfaces can
be described by using a nanoparticle dimer with a finite gap as a representative aggregate. When
FeTMPyP is present as a μ-oxo dimer species, both porphyrin molecular planes (the plane that
the porphyrin ring lies in) may be oriented parallel to the interparticle axis of the SGN dimer,
where four N-CH3+ groups (two from each porphyrin) would be electrostatically adsorbed on the
surface of each nanoparticle. In this “edge-on” configuration, the Fe-O-Fe bond would be
aligned perpendicular to the interparticle axis. In the Raman spectra of FeTMPyP in the
presence of SGN and HGN aggregates, a band appeared at 386 cm-1
and 375 cm-1
for SGNs and
HGNs, respectively, and was assigned to the stretching mode of the Fe-O-Fe bond. In a pH 10
solution, this band appeared at 365 cm-1
when the porphyrin was oriented “face-on” to a Ag
electrode surface.148
A “face-on” configuration would have the Fe-O-Fe bond parallel and the
porphyrin molecular plane perpendicular to the interparticle axis of an SGN or HGN dimer. In
addition, a “face-on” orientation would lead to a decrease in this vibrational frequency due to
surface interaction of the Fe atom. Hence, the Fe(III)TMPyP μ-oxo dimer is oriented “edge-on”
since our band occurred at a higher wavenumber (386 cm-1
for SGNs and 375 cm-1
for HGNs),
indicating that there was less interaction between the Fe atom and the gold surface.
Another piece of evidence for the “edge-on” configuration comes from the linear
absorption spectra of the HGN aggregates. Based on our earlier studies on HGN aggregate
formation, a red shift of the plasmon band accompanied by the appearance of a longer
wavelength band occurred when the HGNs were separated by a gap that was couple of
nanometers wide. However, when the HGNs are in contact with one another and separated by a
104
gap less than 5 Å, the plasmon band is instead blue-shifted and there is not a second band present
at longer wavelengths. When the iron porphyrin dimer is in an “edge-on” configuration, it would
create a gap of at least 1.5 nm, which is the length of one FeTMPyP molecule. The length of the
Fe-O-Fe bond is less than 0.5 nm, which would lead to a blue shift in the absorption spectrum if
the Fe-O-Fe bond was parallel to the interparticle axis; however, a blue shift was not observed.
Hence, the red-shifting of the plasmon band and appearance of a longitudinal band at longer
wavelengths in the HGN aggregates is consistent with a gap larger than 0.5 nm, which would be
created when the iron porphyrin dimer is oriented in an “edge-on” configuration.
7.4 Conclusions
Cationic FeTMPyP molecules can be used as aggregating agents for both solid and
hollow gold nanospheres. Aggregation was confirmed using linear absorption measurements as
well as surface-enhanced Raman scattering (SERS) measurements. It is believed that the
FeTMPyP dimer is oriented in an “edge-on” configuration with respect to the nanoparticle
surface for both solid and hollow gold nanospheres. This nanoparticle assembly may be useful
for understanding the influence of intense surface plasmon fields on molecular dynamics.
105
CHAPTER EIGHT
CONCLUSIONS AND FUTURE WORK
The goal of this dissertation is to describe energy relaxation mechanisms in nanoscale materials
in order to tailor their properties so that they can function as efficient transducers, such as a light-
harvesting antenna. In particular, plasmonic gold nanoparticles, both hollow and solid, have been
synthesized and characterized using transmission electron microscopy, energy dispersive
spectroscopy, dynamic light scattering, and UV/Vis absorption spectrophotometry. Femtosecond
pump-probe transient extinction experiments on both isolated and aggregated HGNs and SGNs
have been carried out in order to elucidate their electronic energy relaxation properties.
Transient extinction experiments were carried out at high pulse energies to analyze the
SPR to learn about the electronic and mechanical properties of HGNs following excitation by a
femtosecond laser pulse. The oscillation frequency and phase were determined for a wide range
of HGN sizes, revealing size-dependent vibrational modes. In addition, transient extinction
experiments were conducted at low pulse energies in order to determine the electron-phonon
coupling times for a wide range of sizes of HGN and SGN samples. As the aspect ratio of the
HGN increases, the electron-phonon coupling time decreases (or the electron-phonon coupling
increases), whereas for SGNs, the electron-phonon coupling remains constant with increasing
diameter. The electron-phonon coupling enhancement exhibited by high aspect ratio HGNs was
attributed to the large surface to volume ratio of these structures, which results in non-negligible
contributions from their environment. The electronic energy relaxation properties of HGNs were
investigated further by determining their phonon-phonon coupling times, which is the last step in
electronic energy relaxation in metal nanoparticles. The fluids confined to the hollow core of
106
HGNs have different properties compared to their bulk counterparts, thereby influencing the
particle-to-surroundings energy transfer rates.
While studying how aggregated nanostructures influence optical and electronic
properties, an unexpected spectral blue-shift of the surface plasmon resonance (SPR) occurred
upon aggregation of HGNs using a salt solution, which led to longer electronic energy relaxation
times compared to isolated HGNs. These findings were significant because previous studies have
found that SGNs red-shift upon aggregation and have faster electronic energy relaxation times.
In order to understand further the nature of the blue shift in HGN aggregates, alkane-thiols were
used to induce the aggregation, and at a critical thickness of the HGN shell, the SPR blue-shifts
due to the interaction of the electric fields within the hollow cavities of the nanoparticles. These
findings may indicate that confined fluids dramatically impact the HGN properties, and future
work in this area will be to understand the properties of confined fluids. The potential impact of
this further research may benefit applications beyond nanoscience, because water confined to
small volumes is thought to mediate many important chemical and biochemical processes.
The structural, optical, and electronic studies on the aforementioned types of metal
nanoparticles provide the basis for the research on molecule-plasmon interactions, where the
surface plasmons may influence light absorption in a nearby molecule. Specifically, future
studies will focus on the interaction between the surface plasmons of HGNs and their aggregates
with the discrete electric-dipole transitions of iron porphyrin molecules. These early studies on
the surface-enhanced Raman spectroscopy (SERS) of iron porphyrin molecules near SGN and
HGN aggregate surfaces will facilitate the understanding of the interaction between the strong
electric fields of HGNs and molecular electronic transitions.
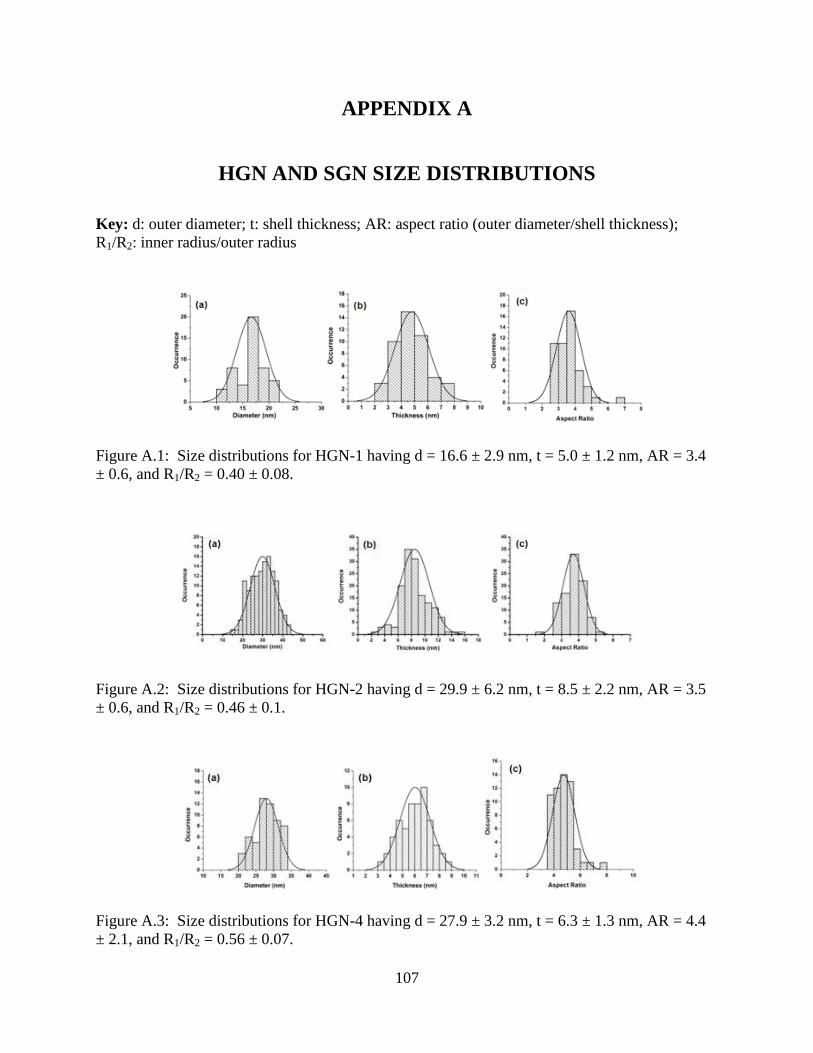
107
APPENDIX A
HGN AND SGN SIZE DISTRIBUTIONS
Key: d: outer diameter; t: shell thickness; AR: aspect ratio (outer diameter/shell thickness);
R1/R2: inner radius/outer radius
Figure A.1: Size distributions for HGN-1 having d = 16.6 ± 2.9 nm, t = 5.0 ± 1.2 nm, AR = 3.4
± 0.6, and R1/R2 = 0.40 ± 0.08.
Figure A.2: Size distributions for HGN-2 having d = 29.9 ± 6.2 nm, t = 8.5 ± 2.2 nm, AR = 3.5
± 0.6, and R1/R2 = 0.46 ± 0.1.
Figure A.3: Size distributions for HGN-4 having d = 27.9 ± 3.2 nm, t = 6.3 ± 1.3 nm, AR = 4.4
± 2.1, and R1/R2 = 0.56 ± 0.07.
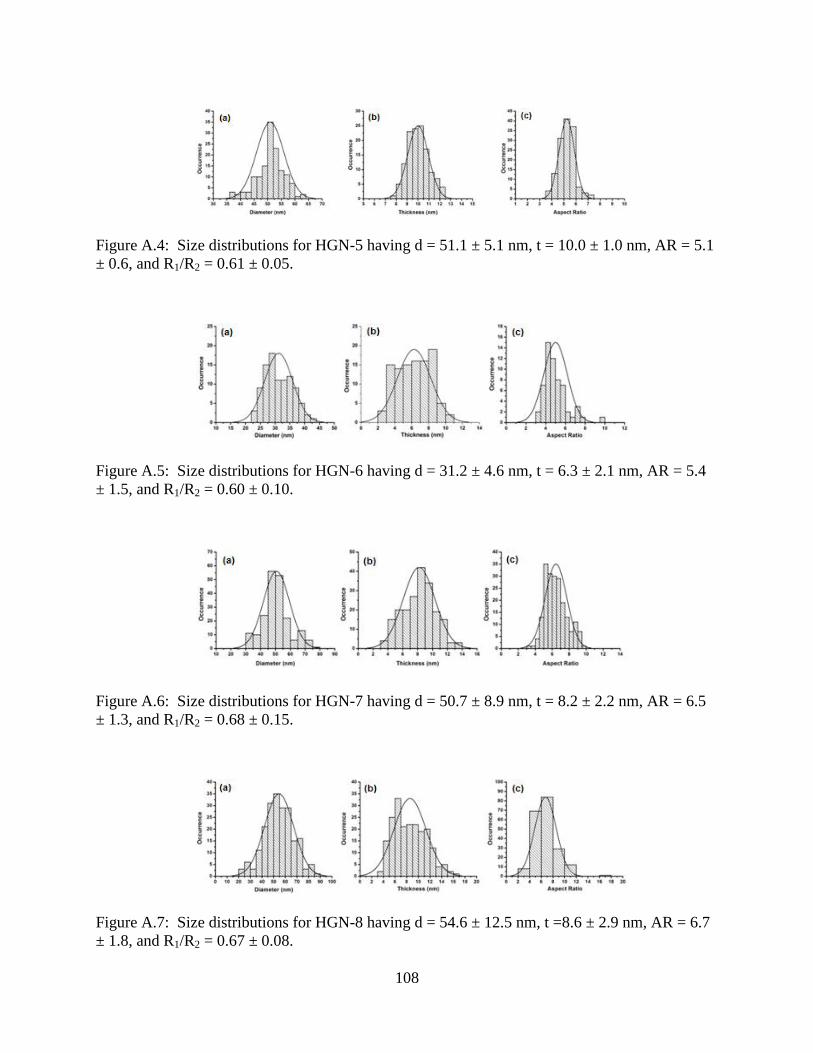
108
Figure A.4: Size distributions for HGN-5 having d = 51.1 ± 5.1 nm, t = 10.0 ± 1.0 nm, AR = 5.1
± 0.6, and R1/R2 = 0.61 ± 0.05.
Figure A.5: Size distributions for HGN-6 having d = 31.2 ± 4.6 nm, t = 6.3 ± 2.1 nm, AR = 5.4
± 1.5, and R1/R2 = 0.60 ± 0.10.
Figure A.6: Size distributions for HGN-7 having d = 50.7 ± 8.9 nm, t = 8.2 ± 2.2 nm, AR = 6.5
± 1.3, and R1/R2 = 0.68 ± 0.15.
Figure A.7: Size distributions for HGN-8 having d = 54.6 ± 12.5 nm, t =8.6 ± 2.9 nm, AR = 6.7
± 1.8, and R1/R2 = 0.67 ± 0.08.
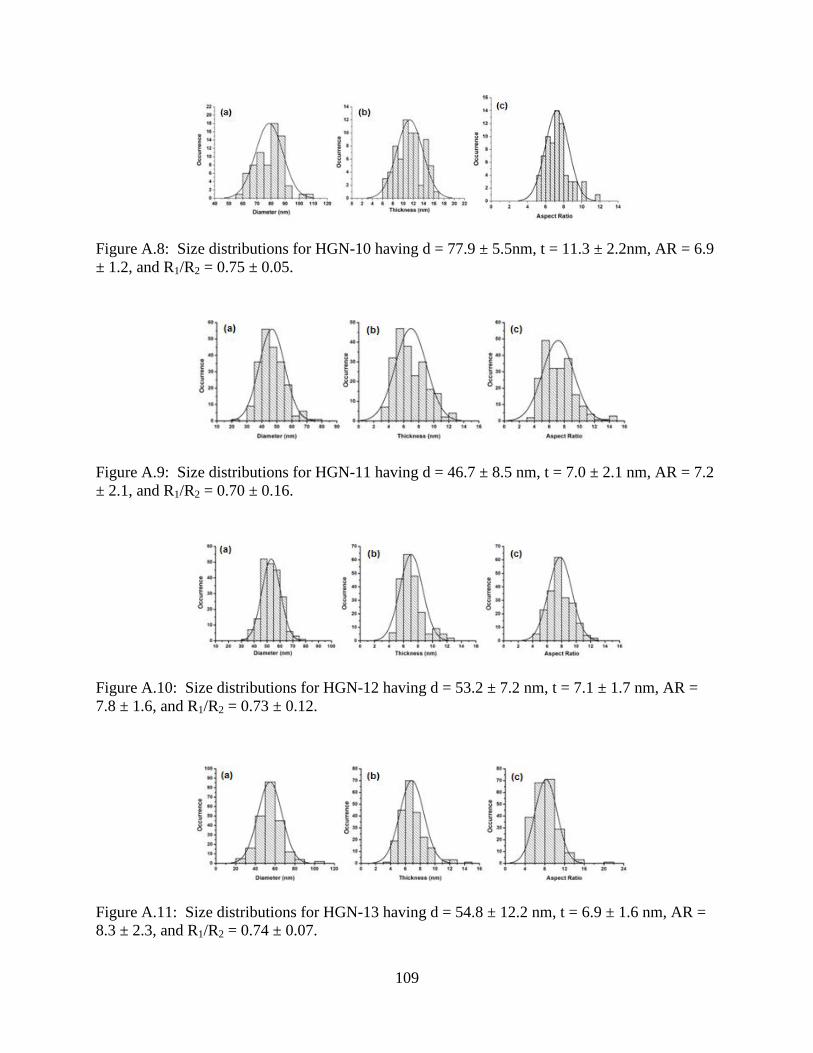
109
Figure A.8: Size distributions for HGN-10 having d = 77.9 ± 5.5nm, t = 11.3 ± 2.2nm, AR = 6.9
± 1.2, and R1/R2 = 0.75 ± 0.05.
Figure A.9: Size distributions for HGN-11 having d = 46.7 ± 8.5 nm, t = 7.0 ± 2.1 nm, AR = 7.2
± 2.1, and R1/R2 = 0.70 ± 0.16.
Figure A.10: Size distributions for HGN-12 having d = 53.2 ± 7.2 nm, t = 7.1 ± 1.7 nm, AR =
7.8 ± 1.6, and R1/R2 = 0.73 ± 0.12.
Figure A.11: Size distributions for HGN-13 having d = 54.8 ± 12.2 nm, t = 6.9 ± 1.6 nm, AR =
8.3 ± 2.3, and R1/R2 = 0.74 ± 0.07.
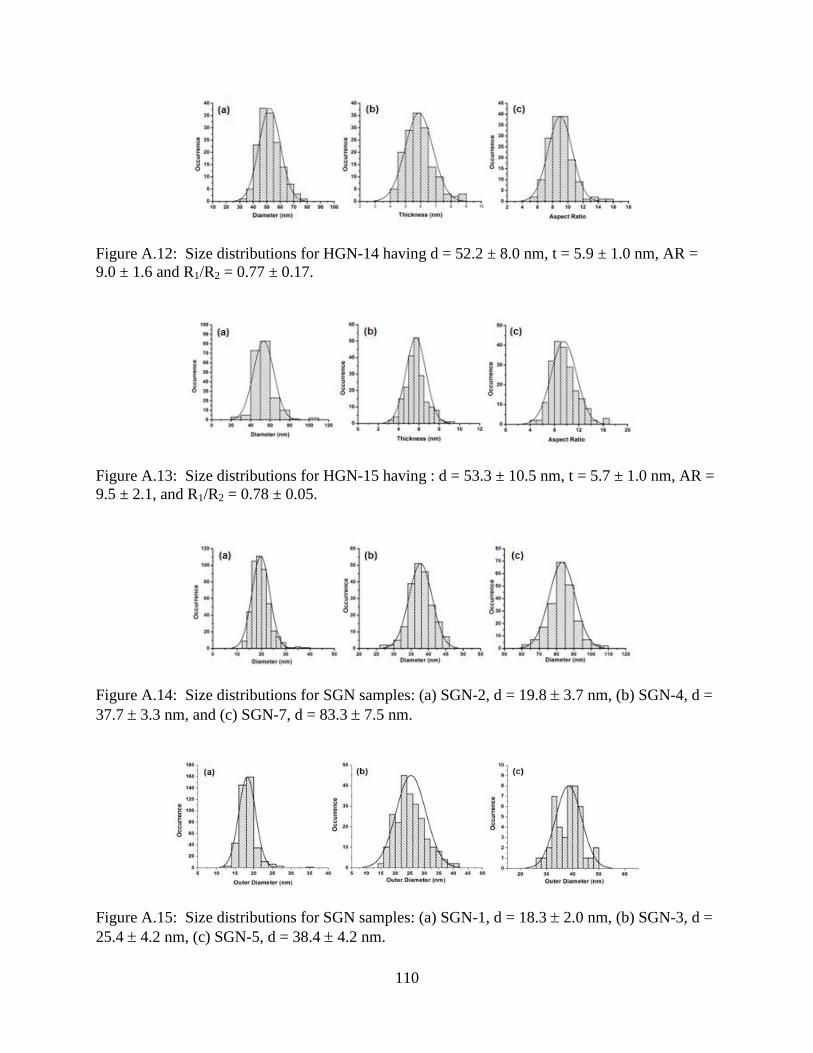
110
Figure A.12: Size distributions for HGN-14 having d = 52.2 ± 8.0 nm, t = 5.9 ± 1.0 nm, AR =
9.0 ± 1.6 and R1/R2 = 0.77 ± 0.17.
Figure A.13: Size distributions for HGN-15 having : d = 53.3 ± 10.5 nm, t = 5.7 ± 1.0 nm, AR =
9.5 ± 2.1, and R1/R2 = 0.78 ± 0.05.
Figure A.14: Size distributions for SGN samples: (a) SGN-2, d = 19.8 3.7 nm, (b) SGN-4, d =
37.7 3.3 nm, and (c) SGN-7, d = 83.3 7.5 nm.
Figure A.15: Size distributions for SGN samples: (a) SGN-1, d = 18.3 2.0 nm, (b) SGN-3, d =
25.4 4.2 nm, (c) SGN-5, d = 38.4 4.2 nm.
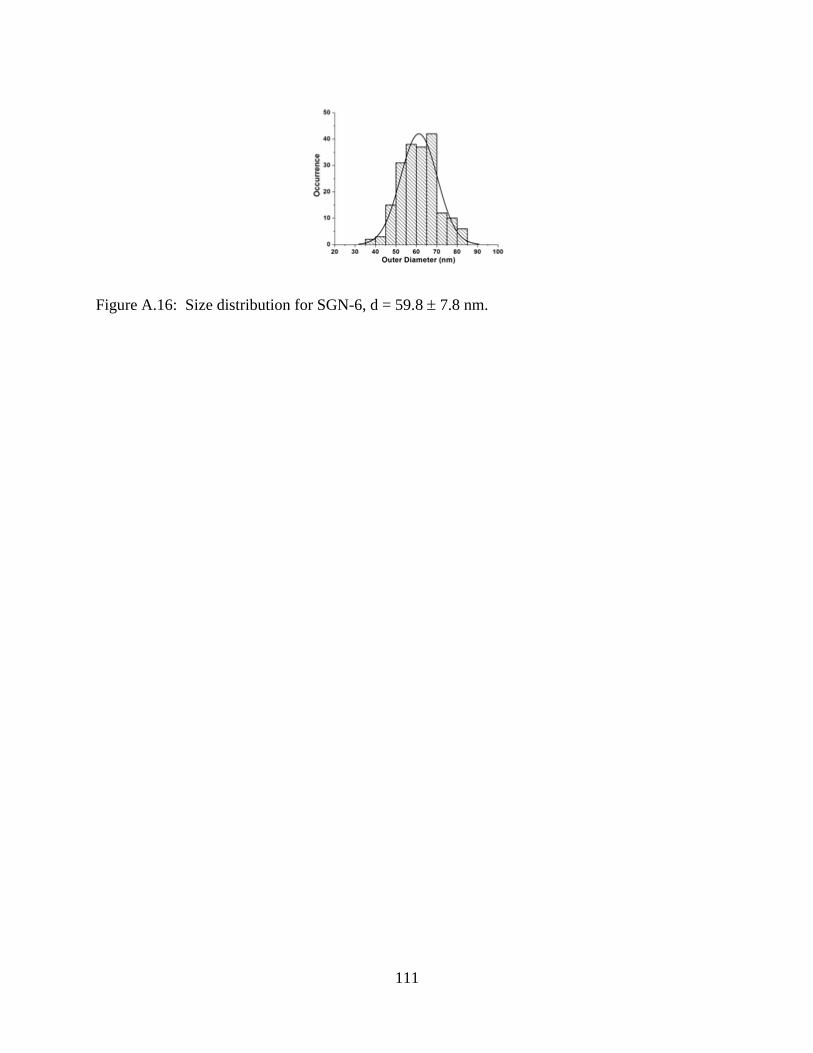
111
Figure A.16: Size distribution for SGN-6, d = 59.8 7.8 nm.
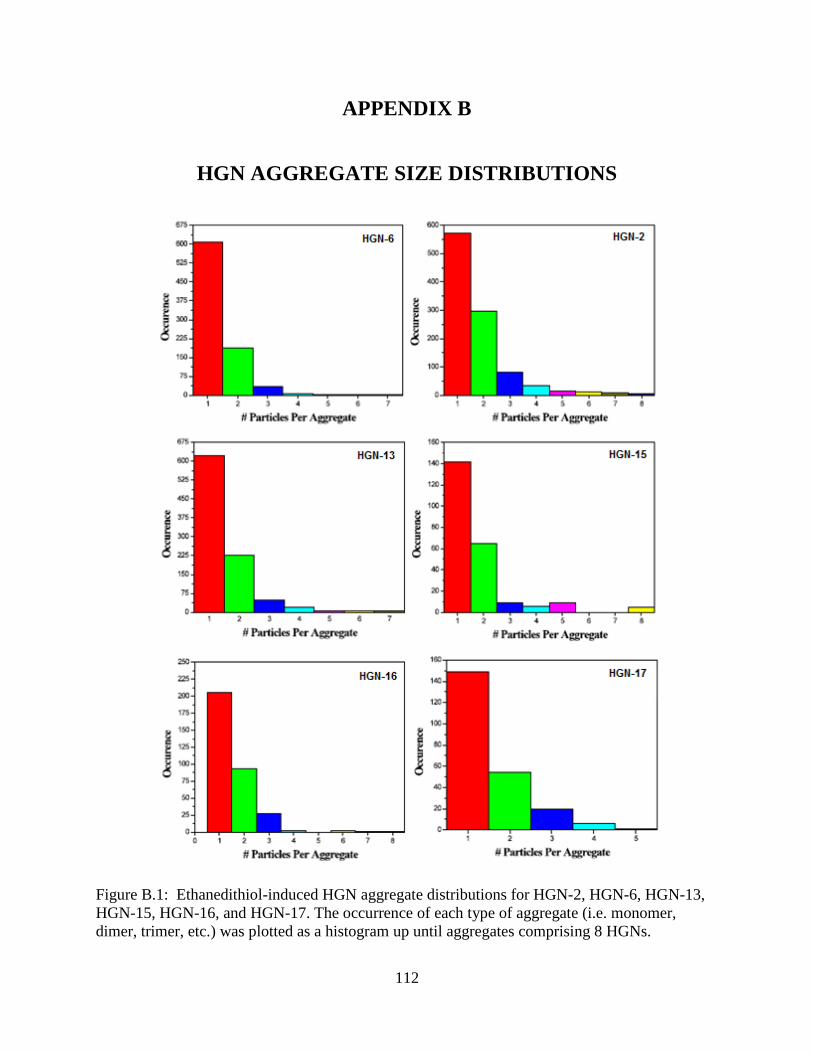
112
APPENDIX B
HGN AGGREGATE SIZE DISTRIBUTIONS
Figure B.1: Ethanedithiol-induced HGN aggregate distributions for HGN-2, HGN-6, HGN-13,
HGN-15, HGN-16, and HGN-17. The occurrence of each type of aggregate (i.e. monomer,
dimer, trimer, etc.) was plotted as a histogram up until aggregates comprising 8 HGNs.
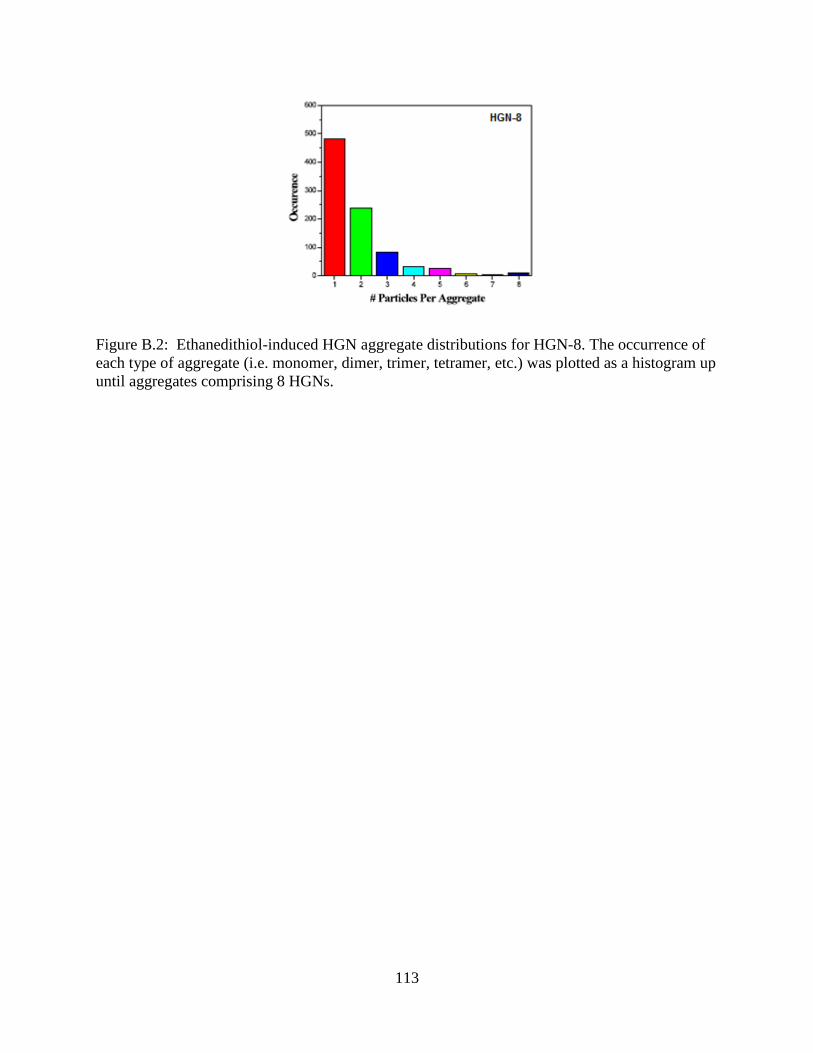
113
Figure B.2: Ethanedithiol-induced HGN aggregate distributions for HGN-8. The occurrence of
each type of aggregate (i.e. monomer, dimer, trimer, tetramer, etc.) was plotted as a histogram up
until aggregates comprising 8 HGNs.
114
APPENDIX C
COPYRIGHT PERMISSION INFORMATION
Title: Electronic Relaxation
Dynamics in Isolated and
Aggregated Hollow Gold
Nanospheres
Author: Kenneth L. Knappenberger, Jr.,
Adam M. Schwartzberg, Anne-
Marie Dowgiallo, and Casey
A. Lowman
Publication: Journal of the American
Chemical Society
Publisher: American Chemical Society
Date: Oct 1, 2009
Copyright © 2009, American Chemical
Society
Logged in as:
Anne-Marie Dowgiallo
Account #:
3000625138
PERMISSION/LICENSE IS GRANTED FOR YOUR ORDER AT NO CHARGE
This type of permission/license, instead of the standard Terms & Conditions, is sent to you
because no fee is being charged for your order. Please note the following:
Permission is granted for your request in both print and electronic formats, and
translations.
If figures and/or tables were requested, they may be adapted or used in part.
Please print this page for your records and send a copy of it to your publisher/graduate
school.
Appropriate credit for the requested material should be given as follows: "Reprinted
(adapted) with permission from (COMPLETE REFERENCE CITATION). Copyright
(YEAR) American Chemical Society." Insert appropriate information in place of the
capitalized words.
One-time permission is granted only for the use specified in your request. No additional
uses are granted (such as derivative works or other editions). For any other uses, please
submit a new request.
Copyright © 2013 Copyright Clearance Center, Inc. All Rights Reserved. Privacy statement
115
Title: Influence of Confined Fluids
on Nanoparticle-to-
Surroundings Energy Transfer
Author: Anne-Marie Dowgiallo and
Kenneth L. Knappenberger, Jr.
Publication: Journal of the American
Chemical Society
Publisher: American Chemical Society
Date: Nov 1, 2012
Copyright © 2012, American Chemical
Society
Logged in as:
Anne-Marie Dowgiallo
Account #:
3000625138
PERMISSION/LICENSE IS GRANTED FOR YOUR ORDER AT NO CHARGE
This type of permission/license, instead of the standard Terms & Conditions, is sent to you
because no fee is being charged for your order. Please note the following:
Permission is granted for your request in both print and electronic formats, and
translations.
If figures and/or tables were requested, they may be adapted or used in part.
Please print this page for your records and send a copy of it to your publisher/graduate
school.
Appropriate credit for the requested material should be given as follows: "Reprinted
(adapted) with permission from (COMPLETE REFERENCE CITATION). Copyright
(YEAR) American Chemical Society." Insert appropriate information in place of the
capitalized words.
One-time permission is granted only for the use specified in your request. No additional
uses are granted (such as derivative works or other editions). For any other uses, please
submit a new request.
Copyright © 2013 Copyright Clearance Center, Inc. All Rights Reserved. Privacy statement.
116
Title: Controlled Plasmon Resonance
Properties of Hollow Gold
Nanosphere Aggregates
Author: Manabendra Chandra, Anne-
Marie Dowgiallo, and Kenneth
L. Knappenberger, Jr.
Publication: Journal of the American
Chemical Society
Publisher: American Chemical Society
Date: Nov 1, 2010
Copyright © 2010, American Chemical
Society
Logged in as:
Anne-Marie Dowgiallo
Account #:
3000625138
PERMISSION/LICENSE IS GRANTED FOR YOUR ORDER AT NO CHARGE
This type of permission/license, instead of the standard Terms & Conditions, is sent to you
because no fee is being charged for your order. Please note the following:
Permission is granted for your request in both print and electronic formats, and
translations.
If figures and/or tables were requested, they may be adapted or used in part.
Please print this page for your records and send a copy of it to your publisher/graduate
school.
Appropriate credit for the requested material should be given as follows: "Reprinted
(adapted) with permission from (COMPLETE REFERENCE CITATION). Copyright
(YEAR) American Chemical Society." Insert appropriate information in place of the
capitalized words.
One-time permission is granted only for the use specified in your request. No additional
uses are granted (such as derivative works or other editions). For any other uses, please
submit a new request.
Copyright © 2013 Copyright Clearance Center, Inc. All Rights Reserved. Privacy statement.
Comments? We would like to hear from you. E-mail us at [email protected]
117
Title: Structure-Dependent Coherent
Acoustic Vibrations of Hollow
Gold Nanospheres
Author: Anne-Marie Dowgiallo, Adam
M. Schwartzberg, and Kenneth
L. Knappenberger, Jr.
Publication: Nano Letters
Publisher: American Chemical Society
Date: Aug 1, 2011
Copyright © 2011, American Chemical
Society
Logged in as:
Anne-Marie Dowgiallo
Account #:
3000625138
PERMISSION/LICENSE IS GRANTED FOR YOUR ORDER AT NO CHARGE
This type of permission/license, instead of the standard Terms & Conditions, is sent to you
because no fee is being charged for your order. Please note the following:
Permission is granted for your request in both print and electronic formats, and
translations.
If figures and/or tables were requested, they may be adapted or used in part.
Please print this page for your records and send a copy of it to your publisher/graduate
school.
Appropriate credit for the requested material should be given as follows: "Reprinted
(adapted) with permission from (COMPLETE REFERENCE CITATION). Copyright
(YEAR) American Chemical Society." Insert appropriate information in place of the
capitalized words.
One-time permission is granted only for the use specified in your request. No additional
uses are granted (such as derivative works or other editions). For any other uses, please
submit a new request.
Copyright © 2013 Copyright Clearance Center, Inc. All Rights Reserved. Privacy statement.
Comments? We would like to hear from you. E-mail us at [email protected]
118
American Chemical Society’s Policy on Theses and Dissertations
If your university requires you to obtain permission, you must use the RightsLink
permission system.
See RightsLink instructions at http://pubs.acs.org/page/copyright/permissions.html.
This is regarding request for permission to include your paper(s) or portions of text
from your paper(s) in your thesis. Permission is now automatically granted; please pay
special attention to the implications paragraph below. The Copyright Subcommittee of the
Joint Board/Council Committees on Publications approved the following:
Copyright permission for published and submitted material from theses and dissertations
ACS extends blanket permission to students to include in their theses and dissertations
their own articles, or portions thereof, that have been published in ACS journals or submitted to
ACS journals for publication, provided that the ACS copyright credit line is noted on the
appropriate page(s).
Publishing implications of electronic publication of theses and dissertation material
Students and their mentors should be aware that posting of theses and dissertation
material on the Web prior to submission of material from that thesis or dissertation to an ACS
journal may affect publication in that journal. Whether Web posting is considered prior
publication may be evaluated on a case-by-case basis by the journal’s editor. If an ACS journal
editor considers Web posting to be “prior publication”, the paper will not be accepted for
publication in that journal. If you intend to submit your unpublished paper to ACS for
publication, check with the appropriate editor prior to posting your manuscript electronically.
Reuse/Republication of the Entire Work in Theses or Collections: Authors may
reuse all or part of the Submitted, Accepted or Published Work in a thesis or dissertation that the
author writes and is required to submit to satisfy the criteria of degree-granting institutions.
Such reuse is permitted subject to the ACS’ “Ethical Guidelines to Publication of Chemical
Research” (http://pubs.acs.org/page/policy/ethics/index.html); the author should secure written
confirmation (via letter or email) from the respective ACS journal editor(s) to avoid potential
conflicts with journal prior publication*/embargo policies. Appropriate citation of the Published
Work must be made. If the thesis or dissertation to be published is in electronic format, a direct
link to the Published Work must also be included using the ACS Articles on Request author-
directed link − see http://pubs.acs.org/page/policy/articlesonrequest/index.html * Prior publication policies of ACS journals are posted on the ACS website at
http://pubs.acs.org/page/policy/prior/index.html
119
If your paper has not yet been published by ACS, please print the following credit line
on the first page of your article: "Reproduced (or 'Reproduced in part') with permission from
[JOURNAL NAME], in press (or 'submitted for publication'). Unpublished work copyright
[CURRENT YEAR] American Chemical Society." Include appropriate information.
If your paper has already been published by ACS and you want to include the text or
portions of the text in your thesis/dissertation, please print the ACS copyright credit line on the
first page of your article: “Reproduced (or 'Reproduced in part') with permission from [FULL
REFERENCE CITATION.] Copyright [YEAR] American Chemical Society." Include
appropriate information.
Submission to a Dissertation Distributor: If you plan to submit your thesis to UMI
or to another dissertation distributor, you should not include the unpublished ACS paper in
your thesis if the thesis will be disseminated electronically, until ACS has published your
paper. After publication of the paper by ACS, you may release the entire thesis (not the
individual ACS article by itself) for electronic dissemination through the distributor; ACS’s
copyright credit line should be printed on the first page of the ACS paper.
120
Royal Society of Chemistry
Thomas Graham House
Science Park
Milton Road
Cambridge CB4 0WF
Tel: +44 (0)1223 420 066
Fax: +44 (0)1223 423 623
Email: [email protected]
www.rsc.org
Acknowledgements to be used by RSC authors
Authors of RSC books and journal articles can reproduce material (for example a
figure) from the RSC publication in a non-RSC publication, including theses, without formally
requesting permission providing that the correct acknowledgement is given to the RSC
publication. This permission extends to reproduction of large portions of text or the whole
article or book chapter when being reproduced in a thesis.
The acknowledgement to be used depends on the RSC publication in which the
material was published and the form of the acknowledgements is as follows:
• For material being reproduced from an article in New Journal of Chemistry the
acknowledgement should be in the form:
o [Original citation] - Reproduced by permission of The Royal Society of
Chemistry (RSC) on behalf of the Centre National de la Recherche Scientifique
(CNRS) and the RSC
• For material being reproduced from an article Photochemical & Photobiological
Sciences the acknowledgement should be in the form:
o [Original citation] - Reproduced by permission of The Royal Society of
Chemistry (RSC) on behalf of the European Society for Photobiology, the
European Photochemistry Association, and RSC
• For material being reproduced from an article in Physical Chemistry Chemical
Physics the acknowledgement should be in the form:
o [Original citation] - Reproduced by permission of the PCCP Owner Societies
• For material reproduced from books and any other journal the acknowledgement
should be in the form:
o [Original citation] - Reproduced by permission of The Royal Society of
Chemistry
121
The acknowledgement should also include a hyperlink to the article on the RSC
website. The form of the acknowledgement is also specified in the RSC agreement/licence
signed by the corresponding author.
Except in cases of republication in a thesis, this express permission does not cover
the reproduction of large portions of text from the RSC publication or reproduction of the
whole article or book chapter.
A publisher of a non-RSC publication can use this document as proof that permission
is granted to use the material in the non-RSC publication.
VAT Registration Number: GB 342 1764 71 Registered Charity Number:
207890
122
REFERENCES
[1] Oldenburg, S. J., Averitt, R. D., Westcott, S. L. and Halas, N. J., Nanoengineering of
optical resonances, Chemical Physics Letters, 288 (1998) 243–247.
[2] Sau, T. K. and Murphy, C. J., Room temperature, high-yield synthesis of multiple shapes of
gold nanoparticles in aqueous solution, Journal of the American Chemical Society, 126
(2004) 8648–8649.
[3] Wang, H., Brandl, D. W., Nordlander, P. D. and Halas, N. J., Nanorice: a hybrid
nanostructure, Nano Letters, 6 (2006) 827–832.
[4] Kumar, P. S., Pastoiza-Santos, I., Rodriguez-Gonzalez, B., Garcia de Abajo, F. J. and Liz-
Marzan, L. M., High-yield synthesis and optical response of gold nanostars,
Nanotechnology, 19 (2008) 015606(1-6).
[5] Chen, J., Saeki, F., Wiley, B. J., Cang, H., Cobb, M. J., Li, Z. Y., Au, L., Zhang, H.,
Kimmey, M. B., Li, X. and Xia, Y., Gold nanocages: bioconjugation and their potential use
as optical imaging contrast agents, Nano Letters, 5 (2005) 473–477.
[6] Kneipp, K., Kneipp, H., Itzkan, I., Dasari, R. R. and Feld, M. S., Ultrasensitive chemical
analysis by Raman spectroscopy, Chemical Reviews, 99 (1999) 2957–2976.
[7] Geddes, C. D. and Lakowicz, J. R., Editorial: Metal-enhanced fluorescence, Journal of
Fluorescence, 12 (2002) 121–129.
[8] Ray, K., Badagu, R. and Lakowicz, J. R., Metal-enhanced fluorescence from CdTe
nanocrystals: a single-molecule fluorescen study, Journal of the American Chemical
Society, 128 (2006) 8998–8999.
[9] Bharadwaj, P. and Novotny, L., Spectral dependence of single molecule fluorescence
enhancement, Optics Express, 15 (2007) 14266–14274.
[10] Schwartzberg, A.M., Olson, T.Y., Talley, C.E. and Zhang., J.Z., Synthesis,
characterization, and tunable optical properties of hollow gold nanospheres, Journal of
Physical Chemistry B, 110 (2006) 19935–19944.
[11] Knappenberger, K. L., Jr., Schwartzberg, A. M., Dowgiallo, A. M. and Lowman, C. A.,
Electronic relaxation dynamics in isolated and aggregated hollow gold nanospheres,
Journal of the American Chemical Society, 131 (2009) 13892–13893.
[12] Chandra, M., Dowgiallo, A. M. and Knappenberger, K. L., Jr., Controlled plasmon
resonance properties of hollow gold nanosphere aggregates, Journal of the American
Chemical Society, 132 (2010) 15782–15789.
123
[13] Chandra, M., Dowgiallo, A. M. and Knappenberger, K. L., Jr., Two-photon Rayleigh
scattering from isolated and aggregated hollow gold nanospheres, Journal of Physical
Chemistry C, 114 (2010) 19971–19978.
[14] Zhang, J. Z. and Noguez, C., Plasmonic optical properties and applications of metal
nanostructures, Plasmonics, 3 (2008) 127–150.
[15] El-Sayed, M. A., Some interesting properties of metals confined in time and nanometer
space of different shapes, Accounts of Chemical Research, 34 (2001) 257–264.
[16] Schwartzberg, A. M. and Zhang, J. Z., Novel optical properties and emerging applications
of metal nanostructures, Journal of Physical Chemistry C, 112 (2008) 10323–10337.
[17] Zhang, J. Z., Biomedical applications of shape-controlled plasmonic nanostructures: a case
study of hollow gold nanospheres for photothermal ablation therapy of cancer, Journal of
Physical Chemistry Letters, 1 (2010) 686–695.
[18] Gobin, A. M., Lee, M. H., Halas, N. J., James, W. D., Drezek, R. A. and West, J. L., Near-
infrared resonant nanoshells for combined optical imaging and photothermal cancer
therapy, Nano Letters, 7 (2007) 1929–1934.
[19] Alpert, J. and Hamad-Schifferli, K., Effect of ligands on thermal dissipation from gold
nanorods, Langmuir, 26 (2010) 3786–3789.
[20] Yang, Y. T., Callegari, C., Feng, X. L., Ekinci, K. L. and Roukes, M. L., Surface adsorbate
fluctuations and noise in nanoelectromechanical systems, Nano Letters, 6 (2006) 583–586.
[21] Portales, H., Goubet, N., Saviot, L., Adichtchev, S., Murray, D. B., Mermet, A., Duval, E.
and Pileni, M. P., Probing atomic ordering and multiple twinning in metal nanocrystals
through their vibrations, Proceedings of the National Academy of Science of the United
States of America, 105 (2008) 14784–14789.
[22] Schwartzberg, A.M., Oshiro, T.Y., Zhang, J.Z., Huser, T. and Talley, C.E., Improving
nanoprobes using surface-enhanced Raman scattering from 30-nm hollow gold particles,
Analytical Chemistry, 78 (2006) 4732–4736.
[23] Guillon, C., Langot, P., Del Fatti, N., Vallee, F., Kirakosyan, A.S., Shahbazyan, C.T. and
Treguer, M., Coherent acoustic vibration of metal nanoshells, Nano Letters, 7 (2007) 138–
142.
[24] Newhouse, R.J., Wang, H., Hensel, J.K., Wheeler, D.A., Zou, S. and Zhang, J.Z., Coherent
vibrational oscillations of hollow gold nanospheres, Journal of Physical Chemistry Letters,
2 (2011) 228–235.
124
[25] Dowgiallo, A.M., Schwartzberg, A.M. and Knappenberger, K.L., Jr., Structure-dependent
coherent acoustic vibrations of hollow gold nanospheres, Nano Letters, 11 (2011) 3258–
3262.
[26] Jacob, Z. and Shalaev, V.M., Plasmonics goes quantum, Science 134 (2011) 463−464.
[27] Dai, Z., King, W. P. and Park, K., A 100 nanometer scale resistive heater-thermometer on a
silicon cantilever, Nanotechnology, 20 (2009) 095301(1–9).
[28] Hirsch, L. R., Stafford, R. J., Bankson, J. A., Sershen, S. R., Rivera, B., Price, R. E., Hazle,
J. D., Halas, N. J. and West, J. L., Nanoshell-mediated near-infrared thermal therapy of
tumors under magnetic resonance guidance, Proceedings of the National Academy of
Science of the United States of America, 100 (2003) 13549−13554.
[29] Feigenbaum, E. and Atwater, H.A., Resonant guided wave networks, Physical Review
Letters, 104 (2010) 147402(1–4).
[30] Daniel, M.C. and Astruc, D., Gold nanoparticles: assembly, supramolecular chemistry,
quantum-size-related properties, and applications toward biology, catalysis, and
nanotechnology, Chemical Reviews, 104 (2004) 293−346.
[31] Hartland, G.V., Measurements of the material properties of metal nanoparticles by time-
resolved spectroscopy, Physical Chemistry Chemical Physics, 6 (2004) 5263–5274.
[32] Hartland, G.V., Optical studies of dynamics in noble metal nanostructures, Chemical
Reviews, 111 (2011) 3858−3887.
[33] Hartland, G.V., Coherent excitation of vibrational modes in metallic nanoparticles, Annual
Review of Physical Chemistry, 57 (2006) 403−430.
[34] Del Fatti, N., Flytzanis, C. and all e, F., Ultrafast induced electron-surface scattering in a
confined metallic system, Applied Physics B Lasers and Optics, 68 (1999) 433−437.
[35] Maier, S.A., Brongersma, M.L., Kik, P.G., Meltzer, S., Requicha, A.A. G. and Atwater,
H.A., Plasmonics–a route to nanoscale optical devices, Advanced Materials, 13 (2001)
1501–1505.
[36] Gole, A. and Murphy, C.J., Seed-mediated synthesis of gold nanorods: role of the size and
nature of the seed, Chemical Materials, 16 (2004) 3633–3640.
[37] Nishida, N., Shibu, E., Yao, H., Oonishi, T., Kimura, K. and Pradeep, T., Fluorescent gold
nanoparticle superlattices, Advanced Materials, 20 (2008) 4719–4723 .
[38] Chen, C. L. and Rosi, N. L., Preparation of unique 1-D nanoparticle superstructures and
tailoring their structural features, Journal of the American Chemical Society, 132 (2010)
6902–6903.
125
[39] Chen, C. L., Zhang, P. and Rosi, N. L., A new peptide-based method for the design and
synthesis of nanoparticle superstructures: construction of highly ordered gold nanoparticles
double helices, Journal of the American Chemical Society, 130 (2008) 13555–13557.
[40] Rosi, N.L., Thaxton, C.S. and Mirkin, C.A., Control of nanoparticle assembly by using
DNA-modified diatom templates, Angewandte Chemie International Edition, 43 (2004)
5500–5503.
[41] Payne, E. K., Rosi, N. L., Xue, C. and Mirkin, C.A., Sacrificial biological templates for the
formation of nanostructures metallic microshells, Angewandte Chemie International
Edition, 44 (2005) 5064–5067.
[42] Chang, W. S., Slaughter, L. S., Khanal, B. P., Zubarev, E. R. and Link, S., One-
dimensional coupling of gold nanoparticle plasmons in self-assembled ring superstructures,
Nano Letters, 9 (2009) 1152–1157.
[43] Pryce, I. M., Koleske, D. D., Fischer, A. J. and Atwater, H. A., Plasmonic nanoparticles
enhanced photocurrent in GaN/InGaN/GaN quantum well solar cells, Applied Physics
Letters 96 (2010) 153501(1–3).
[44] Saeta, P. N., Ferry, V. E., Pacifici, D., Munday, J. N. and Atwater, H. A., How much can
guided modes enhance absorption in thin solar cells?, Optics Express, 17 (2009) 20975–
20990.
[45] Ray, P. C., Darbha, G. K., Ray, A., Walker, J., Hardy, W. and Perryman, A., Gold
nanoparticle based FRET for DNA detection, Plasmonics, 2 (2007) 173–183.
[46] Griffin, J. and Ray, P. C., Gold nanoparticle based NSET for monitoring Mg2+
dependent
RNA folding, Journal of Physical Chemistry B, 112 (2008) 11198–11201.
[47] Masia, F., Langbein, W., Watson, P. and Borri, P., Resonant four-wave mixing of gold
nanoparticles for three-dimensional cell microscopy, Optics Letters, 34 (2009) 1816–1818.
[48] Jung, Y., Chen, H., Tong, L. and Cheng, J. X., Imaging gold nanorods by plasmon-
resonance-enhanced four wave mixing, Journal of Physical Chemistry C, 113 (2009)
2657−2663.
[49] Maier, S. A., Kik, P. G., Atwater, H. A., Meltzer, S., Harel, E., Koel, B. E. and Requicha,
A.A.G., Local detection of electromagnetic energy transport below the diffraction limit in
metal nanoparticle plasmon waveguides, Nature Materials, 2 (2003) 229–232.
[50] Lindquist, N. C., Nagpal, P., Lesuffleur, A., Norris, D. J. and Oh, S.H., Three-dimensional
plasmonic nanofocusing, Nano Letters, 10 (2010) 1369–1373.
126
[51] Urzhumov, Y. A., Shvets, G., Fan, J., Capasso, F., Brandl, D. and Nordlander, P.,
Plasmonic nanoclusters: a path towards negative-index metafluids, Optics Express, 15
(2007) 14129–14145.
[52] Dionne, J. A., Verhagen, E., Polman, A. and Atwater, H. A., Are negative index materials
achievable with surface plasmon waveguides? A case study of three plasmonic geometries,
Optics Express, 16 (2008) 19001–19017.
[53] Nagpal, P., Lindquist, N. C., Oh, S. H. and Norris, D. J., Ultrasmooth patterned metals for
plasmonics and metamaterials, Science, 325 (2009) 594–597.
[54] Voisin, C., Del Fatti, N., Christofilos, D. and Vallee, F., Ultrafast electron dynamics and
optical nonlinearities in metal nanoparticles, Journal of Physical Chemistry B, 105 (2001)
2264–2280.
[55] Pelton, M., Sader, J. E., Burgin, J., Liu, M. Z., Guyot-Sionnest, P., and Gosztola, D.,
Damping of acoustic vibrations in gold nanoparticles, Nature Nanotechnology, 4 (2009)
492–495.
[56] Voisin, C., Del Fatti, N., Christofilos, D. and Vallee, F., Time-resolved investigation of the
vibrational dynamics of metal nanoparticles, Applied Surface Science, 164 (2000) 131–139.
[57] Zhang, J.Z., Ultrafast studies of electron dynamics in semiconductor and metal colloidal
nanoparticles: effects of size and surface, Accounts of Chemical Research, 30 (1997) 423–
429.
[58] Link, S. and El-Sayed, M.A., Spectral properties and relaxation dynamics of surface
plasmon electronic oscillations in gold and silver nanodots and nanorods, Journal of
Physical Chemistry B, 103 (1999) 8410–8426.
[59] Hartland, G.V., Coherent vibrational motion in metal particles: determination of the
vibrational amplitude and excitation mechanism, Journal of Chemical Physics, 116 (2002)
8048–8055.
[60] Averitt, R. D., Westcott, S. L. and Halas, N. J., Ultrafast electron dynamics in gold
nanoshells, Physical Review B, 58 (1998) R10203–10206.
[61] Averitt, R. D., Westcott, S. L. and Halas, N. J., Ultrafast optical properties of gold
nanoshells, Journal of the Optical Society of America B, 16 (1999) 1814–1823.
[62] Hartland, G. ., Hodak, J. H. and Martini, I., Comment on “Optically induced damping of
the surface plasmon resonances in gold colloids, Physical Review Letters, 82 (1999) 3188–
3188.
127
[63] Seferyan, H. Y., Zadoyan, R., Wark, A. W., Corn, R. M. and Apkarian, V.A., Diagnostics
of spectrally resolved transient absorption: surface plasmon resonance of metal
nanoparticles, Journal of Physical Chemistry C, 111 (2007) 18525–18532.
[64] Grant, C. D., Schwartzberg, A. M., Norman, T. J. and Zhang, J. Z., Ultrafast electronic
relaxation and coherent vibrational oscillations of strongly coupled gold nanoparticle
aggregates, Journal of the American Chemical Society, 125 (2003) 549–553.
[65] Zadoyan, R., Seferyan, H. Y., Work, A. W., Corn, R. M. and Apkarian, V.A., Interfacial
velocity-dependent plasmon damping in colloidal metallic nanoparticles, Journal of
Physical Chemistry C, 111 (2007) 10836–10840.
[66] Zijlstra, P., Tchebotareva, A. L., Chon, J.W.M., Gu, M. and Orrit, M., Acoustic oscillations
anf elastic moduli of single gold nanorods, Nano Letters, 8 (2008) 3493–3497.
[67] Link, S. and El-Sayed, M.A., Optical properties and ultrafast dynamics of metallic
nanocrystals, Annual Review Physical Chemistry, 54 (2003) 331–366.
[68] Kaganov, M.I., Lifshitz, I.M. and Tanatarov, L.V., Relaxation between electrons and
crystalline lattices, Soviet Physics JETP, 4 (1957) 173–178.
[69] Romero, I., Aizpurua, J., Bryant, G.W. and Garcia de Abajo, F.J., Plasmons in nearly
touching metallic nanoparticles: singular response in the limit of touching dimers, Optics
Express, 14 (2006) 9988–9999.
[70] Zuloaga, J., Prodan, E. and Nordlander, P., Quantum description of the plasmon resonances
of a nanoparticle dimer, Nano Letters, 9 (2009) 887–891.
[71] Wu, Y. and Nordlander, P. Finite-difference time-domain modeling of the optical
properties of nanoparticles near dielectric substrates, Journal of Physical Chemistry C, 114
(2010) 7302–7307.
[72] Malynych, S. and Chumanov, G., Light-induced coherent interactions between silver
nanoparticles in two-dimensional arrays, Journal of the American Chemical Society, 125
(2003) 2896–2898.
[73] Lassiter, J. B., Aizpurua, J., Hernandez, L. I., Brandl, D. W., Romero, I., Lal, S., Hafner, J.
H., Nordlander, P. and Halas, N. J., Close encounters between two nanoshells, Nano
Letters, 8 (2008) 1212–1218.
[74] Ghosh, S.K., Pal, A., Kundu, S., Nath, S. and Pal T., Fluorescence quenching of 1-
methylaminpyrene near gold nanoparticles: size regime dependence of the small metallic
particles, Chemical Physics Letters, 395 (2004) 366–372.
[75] Jana, N.R., Gearheart, L. and Murphy, C.J., Seeding growth for size control of 5 – 40 nm
diameter gold nanoparticles, Langmuir, 17 (2001) 6782–6786.
128
[76] Kiraosyan, A. S. and Shahbazyan, T.V., Vibrational modes of metal nanoshells and
bimetallic core-shell nanoparticles, Journal of Chemical Physics, 129 (2008) 034708(1-7).
[77] Petrova, H., Lin, C., de Liejer, S., Hu, M., McLellan, J. M., Siekkinen, S. R., Wiley, B. J.,
Marquez, M., Xia, Y., Sader, J. E. and Hartland, G.V., Time-resolved spectroscopy of
silver nanocubes: observation and assignment of coherent;y excited vibrational modes,
Journal of Chemical Physics, 126 (2007) 094709(1-8).
[78] Hodak, J. H., Henglein, A. and Hartland, G.V., Size dependent properties of Au particles:
coherent excitation and dephasing of acoustic vibrational modes, Journal of Chemical
Physics, 111 (1999) 8613–8621.
[79] Kreibig, U. and Vollmer, M., Optical Properties of Metal Clusters, Vol. 25 Springer Series
in Materials Science, Springer-Verlag, Berlin, Germany, 1995.
[80] Jin, R., Jureller, J.E., Kim, H.Y. and Scherer, N.F., Correlating second harmonic optical
responses of single Ag nanoparticles with morphology, Journal of the American Chemical
Society, 127 (2005) 12482–12483.
[81] Link, S. and El-Sayed, M.A., Shape and size dependence of radiative, non-radiative and
photothermal properties of gold nanocrystals, International Review Physical Chemistry, 19
(2000) 409–453.
[82] El Sayed-Ali, H.E., Juhasz, T., Smith, G.O. and Bron, W.E., Femtosecond
thermoreflectivity and thermotransmissivity of polycrystalline and single-crystalline gold
films, Physical Review B: Condensed Matter, 43 (1991) 4488–4491.
[83] Groeneveld, R. H. M., Sprik, R. and Lagendijk, A., Femtosecond spectroscopy of electron-
electron and electron-phonon energy relaxation in Ag and Au, Physical Review B, 51
(1995) 11433–11445.
[84] Hodak, J. H., Martini, I. and Hartland, G. V., Ultrafast study of electron-phonon coupling
in colloidal gold particles, Chemical Physics Letters, 284 (1998) 135–141.
[85] Ahmadi, T.S., Logonov, S.L. and El-Sayed, M.A., Picosecond dynamics of colloidal gold
nanoparticles, Journal of Physical Chemistry, 100 (1996) 8053.
[86] Logonov, S.L., Ahmadi, T.S., El-Sayed, M.A., Khoury, J.T. and Whetten, R.L., Electron
dynamics of passivated gold nanocrystals probed by subpicosecond transient absorption
spectroscopy, Journal of Physical Chemistry B, 101 (1997) 3713–3719.
[87] Link, S. Burda, C., Wang, Z.L. and El-Sayed, M.A., Electron dynamics in gold and gold-
silver alloy nanoparticles: the influence of a non-equilibrium electron distribution and the
size dependence of the electron-phonon relaxation, Journal of Chemical Physics, 111
(1999) 1255–1264.
129
[88] Hodak, J.H, Henglein, A. and Hartland, G.V., Electron-phonon coupling dynamics in very
small (between 2 and 8 nm diameter) Au nanoparticles, Journal of Chemical Physics, 112
(2000) 5942–5947.
[89] Hodak, J.H, Henglein, A. and Hartland, G.V., Photophysics of nanometer sized metal
particles: electron-phonon coupling and coherent excitation of breathing vibrational modes,
Journal of Physical Chemistry B, 104 (2000) 9954–9965.
[90] Arbouet, A., Voisin, C., Christofilos, D., Langot, P., Del Fatti, N., Vallée, F., Lermé, J.,
Celep, G., Cottancin, E., Gaudry, M., Pellarin, M., Broyer, M., Maillard, M., Pileni, M.P.
and Treguer, M., Electron-phonon scattering in metal clusters, Physical Review Letters, 90
(2003) 1774011(1–4).
[91] Roberti, T.W., Smith, B.A. and Zhang, J.Z. Ultrafast electron dynamics at the liquid-metal
interface: femtosecond studies using surface plasmons in aqueous silver colloid, Journal of
Chemical Physics, 102 (1995) 3860−3866.
[92] Smith, B.A., Zhang, J.Z., Giebel, U. and Schmid, G., Direct probe of size-dependent
electronic relaxation in single-sized Au and nearly monodisperse Pt colloidal nanoparticles,
Chemical Physics Letters, 270 (1997) 139−144.
[93] Hodak, J., Martini, I. and Hartland, G.V., Spectroscopy and dynamics of nanometer-sized
noble metal particles, Journal of Physical Chemistry B, 102 (1998) 6958−6967.
[94] Thomas, K.G. and Kamat, P.V., Chromophore-functionalized gold nanoparticles, Accounts
of Chemical Research, 36 (2003) 888−898.
[95] Wang, X., Summers, C.J. and Wang, Z.L., Large-scale hexagonal-patterned growth of
aligned ZnO nanorods for nano-optoelectronics and nanosensor arrays, Nano Letters, 4
(2004) 423−426.
[96] McLean, J.A., Stumpo, K.A. and Russell, D.H., Size-selected (2-10 nm) gold nanoparticles
for matrix assisted laser desorption ionization of peptides, Journal of the American
Chemical Society, 127 (2005) 5304−5305.
[97] Heltzel, A.J., Qu, L. and Dai, L., Optoelectronic property modeling of carbon nanotubes
grafted with gold nanoparticles, Nanotechnology, 19 (2008) 245702(1−8).
[98] Kane, D.J. and Trebino, R., Characterization of arbitrary femtosecond pulses using
frequency-resolved optical gating IEEE Journal of Quantum Electronics, 29 (1993)
571−579.
[99] Schoenlein, R.W., Lin, W.Z., Fujimoto, J.G. and Eesley, G.L., Femtosecond studies of non-
equilibrium electronic processes in metals, Physical Review Letters, 58 (1987) 1680−1683.
130
[100] Nisoli, M., Stagira, S., De Silvestri, S., Stella, A., Tognini, P., Cheyssac, P. and Kofman,
R., Ultrafast electron dynamics in solid and liquid gallium nanoparticles, Physical Review
Letters., 78 (1997) 3575−3578.
[101] Bauer, C., Abid, J.P. and Girault, H.H., Size dependence investigations of hot electron
cooling dynamics in metal/adsorbates nanoparticles, Chemical Physics, 319 (2005)
409−421.
[102] Eah, S.K., Jaeger, H.M., Scherer, N.F., Lin, X.M. and Wiederrecht, G.P., Femtosecond
transient absorption dynamics of close-packed gold nanocrystal monolayer arrays,
Chemical Physics Letters, 386 (2004) 390−395.
[103] Hopkins, P.E., Kassebaum, J.L. and Norris, P.M., Effects of electron-interface scattering
on electron-phonon equilibration in Au films, Journal of Applied Physics, 105 (2009)
023710(1–8).
[104] Feldstein, M.J., Keating, C.D., Liau, Y.H., Natan, M.J. and Scherer, N.F., Electronic
relaxation dynamics in coupled metal nanoparticles, Journal of the American Chemical
Society, 119 (1997) 6638−6647.
[105] Jain, P. K., Qian, W. and El-Sayed, M., Ultrafast electron relaxation dynamics in coupled
metal nanoparticles in aggregates, Journal of Physical Chemistry B, 110 (2006) 136−142.
[106] Gorban, S.A., Nepijko, S.A. and Tomchuk, P.M., Electron-phonon interaction in small
metal islands deposited on an insulating substrate, International Journal of Electronics,
70 (1991) 485−490.
[107] McLaughlin, E., The thermal conductivity of liquids and dense gases, Chemical Reviews,
64 (1964) 389−428.
[108] Yaws, C.L. and Hopper, J.R., Optimization of chemical processes with dependent
uncertain parameters, Chemical Engineering, 83 (1976) 119−127.
[109] Link, S., Furube, A., Mohamed, M.B., Asahi, T, Masuhara, H. and El-Sayed, M.A., Hot
electron relaxation dynamics of gold nanoparticles embedded in MgSO4 powder
compared to solution: the effect of the surrounding medium, Journal of Physical
Chemistry B, 106 (2002) 945–955.
[110] Dowgiallo, A. M. and Knappenberger, K. L., Jr., Ultrafast electron-phonon coupling in
hollow gold nanospheres, Physical Chemistry Chemical Physics, 13 (2011)
21585−21592.
[111] A.M. Dowgiallo and K.L. Knappenberger, Jr. “The Influence of Confined Fluids on
Nanoparticle-to-Surroundings Energy Transfer” J. Am. Chem. Soc., 2012, 134, 19393-
19400.
131
[112] Attar, A. R., Blumling, D. E. and Knappenberger, K. L., Jr., Photodissociation of
thioglycolic acid studied by femtosecond time-resolved transient absorption
spectroscopy, Journal of Chemical Physics, 134 (2011) 024514(1−8).
[113] Green, T. D. and Knappenberger, K. L., Jr., Relaxation dynamics of Au25L18 nanoclusters
studied by femtosecond time-resolved near infrared transient absorption spectroscopy,
Nanoscale, 4 (2012) 4111−4118.
[114] Hu, M. and Hartland, G. V., Heat dissipation for Au particles in aqueous solution:
relaxation time versus size, Journal of Physical Chemistry B, 106 (2002) 7029−7033; 107
(2003) 1284−1284.
[115] Hu, M., Wang, X., Hartland, G. V., Salgueirino-Maceira, V. and Liz-Marzan, L.M., Heat
dissipation in gold-silica core-shell nanoparticles, Chemical Physics Letters, 372 (2003)
767−772.
[116] Wilson, O. M., Hu., X., Cahill, D. G., and Braun, P.V., Colloidal metal particles as
probed of nanoscale thermal transport in fluids, Physical Review B, 66 (2002)
224301(1−6).
[117] Ge, Z., Cahill, D. G. and Braun, P.V., AuPd metal nanoparticles as probed of nanoscale
thermal transport in aqueous solution, Journal of Physical Chemistry B, 108 (2004)
18870−18875.
[118] Schmidt, A.J., Alper, J.D., Chiesa, M., Chen, G., Das, S.K., and Hamad-Schifferli, K.,
Probing the gold nanorod-ligand-solvent interface by plasmonic absorption and thermal
decay, Journal of Physical Chemistry C, 112 (2008) 13320−13323.
[119] Plech, A., Kotaidis, V., Gresillon, S., Dahmen, S. and von Plessen, G., Laser-induced
heating and melting of gold nanoparticles studied by time-resolved x-ray scattering,
Physical Review B, 70 (2004) 195423(1−6).
[120] Haynes, W.M., CRC Handbook of Chemistry and Physics: a ready-reference book of
chemical and physical data, 92nd
edition, CRC Press, Boca Raton, FL, 2011.
[121] Hu, M., Goicochea, J. V., Bruno, M. and Poulikakos, D., Water nanoconfinement
induced thermal enhancement at hydrophilic quartz interfaces, Nano Letters, 10 (2010)
279−285.
[122] Boyd, J. E., Briksman, A. and Colvin, V. L., Direct observation of terahertz surface
modes in nanometer-sized liquid water pools, Physical Review Letters, 87 (2001)
147401(1−3).
[123] Stagg, S. M., Knappenberger, K. L., Jr., Dowgiallo, A. M. and Chandra, M., Three-
dimensional interfacial structure determination of hollow gold nanosphere aggregates,
Journal of Physical Chemistry Letters, 2 (2011) 2946−2950.
132
[124] Mohamed, M. B., Ahmadi, T. S., Link, S., Braun, M. and El-Sayed, M.A., Hot electron
and phonon dynamics of gold nanoparticles embedded in a gel matrix, Chemical Physics
Letters, 343 (2001) 55−63.
[125] Tiggesbaumker, J., Koller, L., Meiwes-Broer, K. H. and Liebsch, A., Blue shift of the
Mie plasma frequency in Ag clusters and particles, Physical Review A, 48 (1993)
1749−1752.
[126] Prevel, B., Lerme, J., Gaudry, M., Cottancin, E., Pellarin, M., Treilleux, M., Melinon, P.,
Perez, A., Vialle, J. L. and Broyer, M., Optical properties of nanostructured thin films
containing noble metal clusters: AuN, (Au0.5Ag0.5)N and AgN, Scripta Materialia, 44
(2001) 1235−1238.
[127] Palomba, S., Novotny, L. and Palmer, R. E., Blue-shifted plasmon resonance of
individual size-selected gold nanoparticles, Optics Communications, 281 (2008)
480−483.
[128] Elsayed-Ali, H. E., Norris, T. B., Pessot, M. A. and Mourou, G. A., Time-resolved
observation of electron-phonon relaxation in copper, Physical Review Letters, 58 (1987)
1212−1215.
[129] Voisin, C., Christofilos, D., Del Fatti, N., Vallee, F., Prevel, B., Cottancin, E., Lerme, J.,
Pellanin, M. and Broyer, M., Size-dependent electron-electron interactions in metal
nanoparticles, Physical Review Letters, 85 (2000) 2200−2203.
[130] Zou, S., Janel, N. and Schatz, G.C., Silver nanoparticle array structures that produce
remarkably narrow plasmon lineshapes, Journal of Chemical Physics, 120 (2004)
10871(1−4).
[131] Jain, P. K., Eustis, S. and El-Sayed, M. A., Plasmon coupling in gold nanorod assemblies:
optical absorption, discrete dipole approximation simulation and exciton coupling model,
Journal of Physical Chemistry B, 110 (2006) 18243−18253.
[132] Mahmoud, M. and El-Sayed, M. A., Aggregation of gold nanoframes reduces, rather than
enhances, SERS efficiency due to the trade-off of the inter- and intraparticle plasmonic
fields, Nano Letters, 9 (2009) 3025−3031.
[133] Jain, P. K. and El-Sayed, M. A., Plasmonic coupling in noble metal nanostructures,
Chemical Physics Letters, 487 (2010) 153−164.
[134] Slaughter, L. S., Wu, Y., Willingham, B. A., Nordlander, P. and Link, S.A., Effects of
symmetry breaking and conductive contact on the plasmon coupling in gold nanorod
dimers, ACS Nano, 4 (2010) 4657−4666.
133
[135] Oubre, C. and Nordlander, P., Finite-difference time-domain studies of the optical
properties of nanoshell dimers, Journal of Physical Chemistry B, 109 (2005)
10042−10051.
[136] Johnson, P. B. and Christy, R.W., Optical constants of the noble metals, Physical Review
B, 6 (1972) 4370−4379.
[137] Mocanu, A., Cernica, I., Tomoaia, G., Bobos, L. D., Horovitz, O. and Tomoaia-Cotisel,
M., Self-assembly characteristics of gold nanoparticles in the presence of cysteine,
Colloids Surface A, 338 (2009) 93−101.
[138] Mandal, S., Gole, A., Lala, N., Gonnade, R., Ganvir, V. and Sastry, M., Studies on the
reversible aggregation of cysteine-capped colloidal silver particles interconnected via
hydrogen bonds, Langmuir, 17 (2001) 6262−6268.
[139] Wang, J., Li, Y. F., Huang, Z. and Wu, T., Rapid and selective detection of cysteine
based on its induced aggregates of cetyltrimethylammonium bromide capped gold
nanoparticles, Analytica Chimica Acta, 626 (2008) 37−43.
[140] Joo, S. W., Han, S. W. and Kim, K., Multilayer formation of 1,2-ethanedithiol on gold:
surface-enhanced Raman scattering and ellipsometry study, Langmuir, 16 (2000)
5391−5396.
[141] Reinhard, B. M., Siu, M., Agarwal, H., Alivisatos, A. P. and Liphardt, J., Calibration of
dynamic molecular rulers based on plasmon coupling between gold nanoparticles, Nano
Letters, 5 (2005) 2246–2252.
[142] Reinhard, B. M., Sheikholeslami, S., Mastroianni, A. and Alivisatos, A. P., Use of
plasmon coupling to reveal the dynamics of DNA bending and cleavage by single EcoRV
restriction enzymes, Proceedings of the National Academy of Science U.S.A., 104 (2007)
2667−2672.
[143] Jain, P. K., Huang, W. and El-Sayed, M. A., On the universal scaling behavior of the
distance dependence of plasmon coupling in metal nanoparticle pairs: a plasmon ruler
equation, Nano Letters, 7 (2007) 2080−2088.
[144] Lide D.R., CRC Handbook of Chemistry and Physics: a ready-reference book of
chemical and physical data, 90th ed., CRC Press, Taylor & Francis Publishing Group,
Boca Raton, FL, 2009.
[145] Prodan, E. and Nordlander, P., Plasmon hybridization in spherical nanoparticles, Journal
of Chemical Physics, 120 (2004) 5444−5454.
[146] Forshey, P.A. and Kuwana, T., Electrochemical and spectral speciation of iron tetrakis
(N-methyl-4-pyridyl) porphyrin in aqueous media, Inorganic Chemistry, 20 (1981)
693−700.
134
[147] Blom, N., Odo, J. and Nakamoto, K., Resonance Raman studies of metal tetrakis (4-N-
methylpyridyl)porphine: band assignments, structure-sensitive bands, and species
equilibria, Journal of Physical Chemistry, 90 (1986) 2847−2852.
[148] Rywkin, S., Hosten, C.M., Lombardi, J.R. and Birke, R.L., Surface-enhanced resonance
Raman scattering and voltammetry study of the electrocatalytic reduction of oxygen by
the μ-oxo dimer of iron(III) tetra-4-N-methylpyridylporphyrin, Langmuir, 18 (2002)
5869–5880.
[149] Goff, H. and Morgan, L.O., Magnetic properties of iron(III) porphyrin dimers in aqeous
solution, Inorganic Chemistry, 15 (1976) 3180-3181.
135
BIOGRAPHICAL SKETCH
EDUCATION
Florida State University; Tallahassee, FL
Physical Chemistry Graduate Student
Ph.D. program, degree expected May 2013
Advisor: Dr. Kenneth L. Knappenberger, Jr. 2008–present
Towson University; Towson, MD
B.S., Chemistry, May 2008
Magna cum laude 2004–2008
AWARDS
American Chemical Society (ACS) Physical Chemistry Division
Outstanding Student Poster Award 2011
Hoffman Teaching Merit Fellowship, Florida State University,
Department of Chemistry and Biochemistry 2008 –2009
Analytical Division (ACS) Award in Analytical Chemistry, Towson
University, Department of Chemistry 2008
Towson University Provost Scholarship 2004–2008
Maryland State Senatorial Scholarship 2004–2008
Towson University Department of Music Scholarship 2004–2005
EXPERIENCE
Research Assistant – to Dr. Kenneth L. Knappenberger, Jr., Assistant Professor, Florida
State University May 2009–Fall 2011, Summer 2012–Fall 2012
Understand electron and energy transfer processes in nanoscale systems using femtosecond
transient extinction spectroscopy
Characterize electric fields amplification by nanoparticle aggregates using single particle
second harmonic generation (SHG) microscopy, bright and dark field scattering
microscopy
Operation of pulsed femtosecond laser systems
Synthesis of plasmonic nanostructures
Nanostructure characterization by optical spectroscopy, transmission electron microscopy
(TEM), and dynamic light scattering (DLS)
Teaching Assistant – to Dr. David Gormin, Florida State University
Spring 2012, Spring 2013
Undergraduate physical chemistry II laboratory
Responsible for educating and ensuring the safety of one lab section, and grading lab
reports
136
Teaching Assistant – to Dr. Rafael Bruschweiler, Dr. Heidi Mattoussi, and Dr. Oliver
Steinbock, Florida State University
Spring 2012, Spring 2013
Undergraduate physical chemistry II course
Responsible for grading home-works, quizzes, and exams
Teaching Assistant – to Dr. Stephanie Dillon, Florida State University
August 2008-May 2009
Undergraduate general chemistry laboratory
Responsible for educating and ensuring safety of two lab sections and assigning/grading
lab reports
Biological Lab Technician, United States Department of Agriculture (USDA) College
Student Internship Program in Beltsville, MD
June 2006–August 2008
Research Aid for Microbiologist, Dr. Zafar A. Handoo, USDA-ARS Nematology
Laboratory
Processed soil and plant samples to recover nematode specimens
Maintained and established nematode cultures on plants in greenhouse and growth chamber
Prepared and performed routine maintenance for nematode slides for the USDA Nematode
Collection
Kept detailed records in USDA Nematode Collection of experimental data obtained from
host test experiments on various crops
PUBLICATIONS
K.L. Knappenberger, Jr., A.M. Dowgiallo, M. Chandra, and J.W. Jarrett “Optical Plasmonic
Nanoparticle Transducers Studied Using Femtosecond Laser-based Spectroscopy” J. Phys.
Chem. 2013, In Press.
A.M. Dowgiallo and K.L. Knappenberger, Jr. “The Influence of Confined Fluids on
Nanoparticle-to-Surroundings Energy Transfer” J. Am. Chem. Soc., 2012, 134, 19393-
19400.
M. Chandra, A.M. Dowgiallo, K. L. Knappenberger, Jr. “Magnetic Dipolar Interactions in
Solid Gold Nanosphere Dimers” J. Am. Chem. Soc., 2012, 134, 4477 – 4480.
S.M. Stagg, K. L. Knappenberger, Jr., A.M. Dowgiallo, M. Chandra “Three-Dimensional
Interfacial Structure Determination of Hollow Gold Nanosphere Aggregates” J. Phys.
Chem. Lett., 2011, 2, 2946 – 2950.
A.M. Dowgiallo and K. L. Knappenberger, Jr.”Ultrafast Electron-Phonon Coupling in Hollow
Gold Nanospheres” Phys. Chem. Chem. Phys., 2011, 13, 21585 – 21592.
A.M. Dowgiallo, A.M. Schwartzberg, K. L. Knappenberger, Jr.”Structure-Dependent Coherent
Acoustic ibrations of Hollow Gold Nanospheres” Nano Lett., 2011, 11 (8), 3258 – 3262.
137
M. Chandra, A.M. Dowgiallo, K. L. Knappenberger, Jr. “Controlled Plasmon Resonance
Properties of Hollow Gold Nanosphere Aggregates” J. Am. Chem. Soc., 2010, 132 (44),
15782–15789.
M. Chandra, A.M. Dowgiallo, K. L. Knappenberger, Jr. “Two-photon Rayleigh Scattering
from Isolated and Aggregated Hollow Gold Nanospheres” J. Phys. Chem. C, 2010, 114
(47), 19971–19978.
K. L. Knappenberger, Jr., A. M. Schwartzberg, A.M. Dowgiallo, C.A. Lowman “Electronic
Relaxation Dynamics in Isolated and Aggregated Hollow Gold Nanoparticles” J. Am.
Chem. Soc., 2009, 131 (39), 13892–13893.
PRESENTATIONS
A.M. Dowgiallo, K.L. Knappenberger, Jr. “Ultrafast Electronic Energy Relaxation in Hollow
Gold Nanospheres” Oral Presentation at Florida State University Department of Chemistry
and Biochemistry, Physical Chemistry Seminar, December 6, 2012, Tallahassee, FL.
A.M. Dowgiallo, K.L. Knappenberger, Jr. “Ultrafast Electron-Phonon Coupling in Hollow
Gold Nanospheres” Poster Presentation at the 63rd
Southeastern Regional Meeting
American Chemical Society (SERMACS), October 26 - 29, 2011, Richmond, VA.
A.M. Dowgiallo, K.L. Knappenberger, Jr. “Ultrafast Electron-Phonon Coupling in Hollow
Gold Nanospheres” Poster Presentation at the 242nd
American Chemical Society National
Meeting and Exposition, August 28 - September 1, 2011, Denver, CO, Section F: Excited
State Dynamics: Theory and Experiment.
A.M. Dowgiallo, M. Chandra, K.L. Knappenberger, Jr. “Spectroscopy of Tailored
Nanostructures” Oral Presentation at Towson University Department of Chemistry,
November 4, 2010, Towson, MD.
A.M. Dowgiallo, K.L. Knappenberger, Jr. “Spectroscopy of Tunable Plasmonic Nanoparticles”
Oral Presentation at Florida State University Department of Chemistry and Biochemistry,
Physical Chemistry Seminar, April 19, 2010, Tallahassee, FL.
A.M. Dowgiallo, C.A. Lowman, K.L. Knappenberger, Jr. “Interparticle Electromagnetic
Coupling Enhancement with Tunable Plasmon-Supporting Hollow Gold Nanospheres”
Poster Presentation at the 239th
American Chemical Society National Meeting and
Exposition, March 21-25, 2010, San Francisco, CA, Section N: Multiscale Nanomaterials,
Polymer, and Biomolecular Dynamics.
A.M. Dowgiallo, C.A. Lowman, K.L. Knappenberger, Jr. “Interparticle Electromagnetic
Coupling Enhancement with Tunable Plasmon-Supporting Hollow Gold Nanospheres”
Poster Presentation at the Inter-American Photochemical Society 20th
Winter Conference,
January 2-5, 2010, St. Petersburg Beach, FL.

138
A.M. Dowgiallo and K.L. Knappenberger, Jr. “Electronic Coupling Enhancement with
Tunable Plasmon-Supporting Hollow Gold Nanoparticles” Oral Presentation at the Florida
Annual Meeting and Exposition (FAME) of the American Chemical Society, May 14-16,
2009, Orlando, FL, Physical Chemistry II Symposium.