New Uracil Dimers Showing Erythroid Differentiation Inducing Activities
Upload
independentCategory
view
4download
0
Comparison investigation of near- and far-field properties
for plasmon resonance of silver nanosphere dimers
Lei Liu, Bin Wang, Xuewei Cao, Xiaoxuan Xu, Yufang Wang *
Department of Physics, Nankai University, Tianjin 300071, China
Received 2 October 2010; received in revised form 6 May 2011; accepted 7 June 2011
Available online 14 June 2011
Abstract
Near- and far-field plasmon resonance properties of silver nanospheres dimers are calculated and compared based on the
Generalized Multiparticle Mie-solution method. Greater differences between near- and far-field plasmon resonances are found than
those of silver single nanoparticle, while the dimer of strongest near-field electric field amplitude and the dimer of highest far-field
extinction coefficient almost have the same geometry parameter value under the illumination with fixed wavelength and polarization.
# 2011 Elsevier B.V. All rights reserved.
Keywords: Surface plasmons; Near-field mircroscopy; Mie theory; Multiple scattering; Surface enhanced Raman scattering
www.elsevier.com/locate/photonics
Available online at www.sciencedirect.com
Photonics and Nanostructures – Fundamentals and Applications 10 (2012) 16–24
1. Introduction
Accompanying advances in surface-enhancedspectro-
scopy, including surface-enhanced Raman Spectroscopy
(SERS) [1] and surface-enhanced fluorescence [2],
electromagnetic scattering of metallic nanoparticles
or nanostructures has attracted more and more
attentions. It is desirable to efficiently devise and
fabricate robust substrate with a large surface-
averaged electrical field enhancement (Eave) or a
large maximum point enhancement (Emax), so-called
hot-spot, both of which are most intimately tied with
the local field quantities of the scatter. However, far-
field scattering properties, including extinction,
scattering and absorption cross section (Cext, Csca,
Cabs), are conventional quantities characterizing the
plasmon resonance property of metallic nanoparticles
or nanostructures. For individual metallic nanosphere
* Corresponding author.
E-mail address: [email protected] (Y. Wang).
1569-4410/$ – see front matter # 2011 Elsevier B.V. All rights reserved.
doi:10.1016/j.photonics.2011.06.004
[3,4] and nanorod [5], exact electromagnetic calcula-
tions have showed that the plasmon resonance
deduced from the near-field enhancement can be
significantly red-shifted from the resonance in far-
field scattering. And recently, a theoretical model
based on mechanism of damped harmonic oscillator
has also well explained this shift of single metallic
nanosphere, nanorod and nanoshell caused by radia-
tion damping [6]. It is then spontaneously to ask what
is the feature of the shift between these two classes of
resonance properties in a metallic nanoparticles
cluster system, and what influence does dimer
geometry has on this shift, where coupled damped
harmonic oscillators sometimes result in chaotic
behavior.
Among the various nanoparticle geometries have
been developed, such as ellipsoids, rods, cubes, rice,
stars, shells and sphere chains [7–13], dimer of
nanospheres perhaps has been most widely theoretically
considered [14] and experimentally verified to be
suitable for near-field enhancement [15,16]. Here we
choose silver nanosphere dimer, which is the most
L. Liu et al. / Photonics and Nanostructures – Fundamentals and Applications 10 (2012) 16–24 17
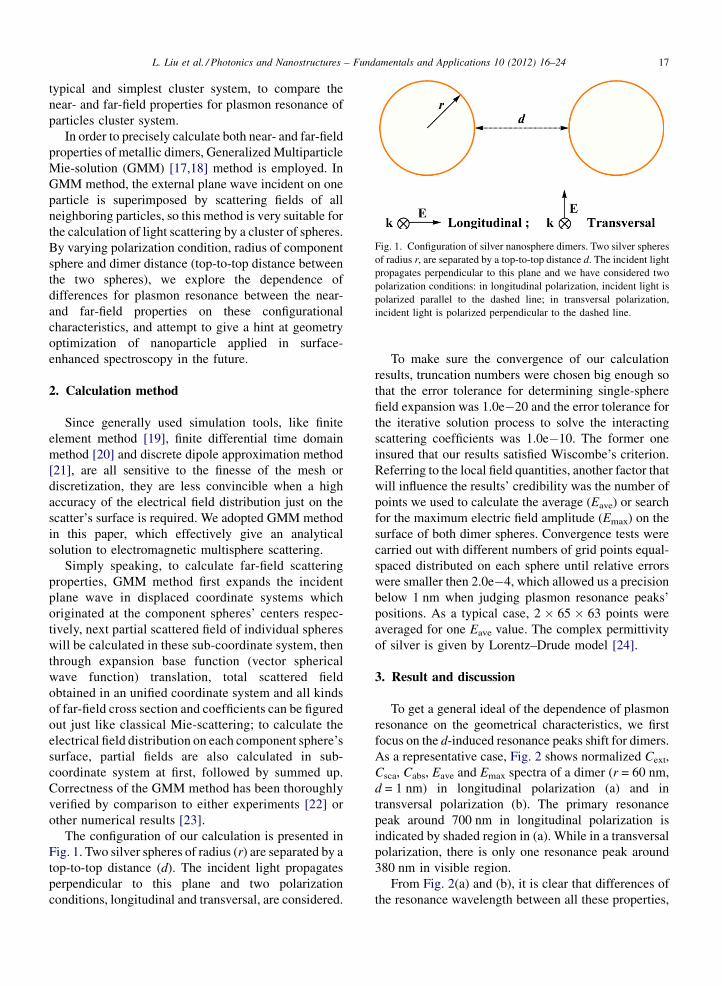
Fig. 1. Configuration of silver nanosphere dimers. Two silver spheres
of radius r, are separated by a top-to-top distance d. The incident light
propagates perpendicular to this plane and we have considered two
polarization conditions: in longitudinal polarization, incident light is
polarized parallel to the dashed line; in transversal polarization,
incident light is polarized perpendicular to the dashed line.
typical and simplest cluster system, to compare the
near- and far-field properties for plasmon resonance of
particles cluster system.
In order to precisely calculate both near- and far-field
properties of metallic dimers, Generalized Multiparticle
Mie-solution (GMM) [17,18] method is employed. In
GMM method, the external plane wave incident on one
particle is superimposed by scattering fields of all
neighboring particles, so this method is very suitable for
the calculation of light scattering by a cluster of spheres.
By varying polarization condition, radius of component
sphere and dimer distance (top-to-top distance between
the two spheres), we explore the dependence of
differences for plasmon resonance between the near-
and far-field properties on these configurational
characteristics, and attempt to give a hint at geometry
optimization of nanoparticle applied in surface-
enhanced spectroscopy in the future.
2. Calculation method
Since generally used simulation tools, like finite
element method [19], finite differential time domain
method [20] and discrete dipole approximation method
[21], are all sensitive to the finesse of the mesh or
discretization, they are less convincible when a high
accuracy of the electrical field distribution just on the
scatter’s surface is required. We adopted GMM method
in this paper, which effectively give an analytical
solution to electromagnetic multisphere scattering.
Simply speaking, to calculate far-field scattering
properties, GMM method first expands the incident
plane wave in displaced coordinate systems which
originated at the component spheres’ centers respec-
tively, next partial scattered field of individual spheres
will be calculated in these sub-coordinate system, then
through expansion base function (vector spherical
wave function) translation, total scattered field
obtained in an unified coordinate system and all kinds
of far-field cross section and coefficients can be figured
out just like classical Mie-scattering; to calculate the
electrical field distribution on each component sphere’s
surface, partial fields are also calculated in sub-
coordinate system at first, followed by summed up.
Correctness of the GMM method has been thoroughly
verified by comparison to either experiments [22] or
other numerical results [23].
The configuration of our calculation is presented in
Fig. 1. Two silver spheres of radius (r) are separated by a
top-to-top distance (d). The incident light propagates
perpendicular to this plane and two polarization
conditions, longitudinal and transversal, are considered.
To make sure the convergence of our calculation
results, truncation numbers were chosen big enough so
that the error tolerance for determining single-sphere
field expansion was 1.0e�20 and the error tolerance for
the iterative solution process to solve the interacting
scattering coefficients was 1.0e�10. The former one
insured that our results satisfied Wiscombe’s criterion.
Referring to the local field quantities, another factor that
will influence the results’ credibility was the number of
points we used to calculate the average (Eave) or search
for the maximum electric field amplitude (Emax) on the
surface of both dimer spheres. Convergence tests were
carried out with different numbers of grid points equal-
spaced distributed on each sphere until relative errors
were smaller then 2.0e�4, which allowed us a precision
below 1 nm when judging plasmon resonance peaks’
positions. As a typical case, 2 � 65 � 63 points were
averaged for one Eave value. The complex permittivity
of silver is given by Lorentz–Drude model [24].
3. Result and discussion
To get a general ideal of the dependence of plasmon
resonance on the geometrical characteristics, we first
focus on the d-induced resonance peaks shift for dimers.
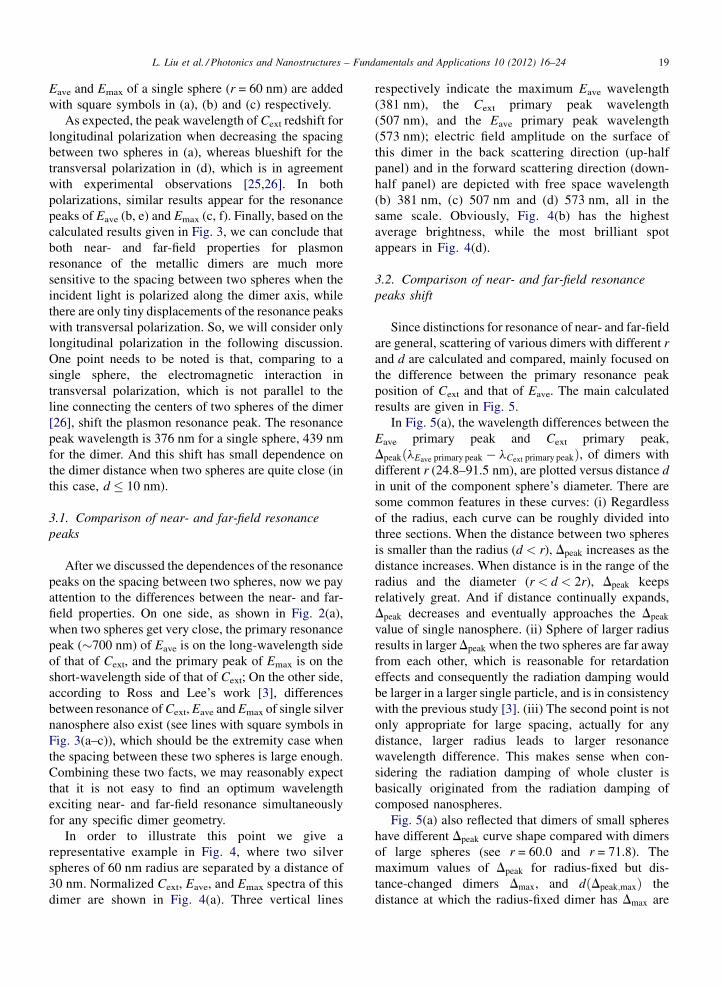
As a representative case, Fig. 2 shows normalized Cext,
Csca, Cabs, Eave and Emax spectra of a dimer (r = 60 nm,
d = 1 nm) in longitudinal polarization (a) and in
transversal polarization (b). The primary resonance
peak around 700 nm in longitudinal polarization is
indicated by shaded region in (a). While in a transversal
polarization, there is only one resonance peak around
380 nm in visible region.
From Fig. 2(a) and (b), it is clear that differences of
the resonance wavelength between all these properties,
L. Liu et al. / Photonics and Nanostructures – Fundamentals and Applications 10 (2012) 16–2418
Fig. 2. Normalized Cext, Csca, Cabs, Eave and Emax spectra of a dimer (r = 60 nm, d = 1 nm) in longitudinal polarization (a) and in transversal
polarization (b). Shaded region is added in (a) to indicate the primary resonance peak around 700 nm in longitudinal polarization. With a transversal
polarization, there is only one resonance peak around 380 nm in visible region.
including Cext, Csca, Cabs, Eave and Emax, occur for the
dimer with d = 1 nm in logitudinal and transversal
polarizations. This point is almost universal in a
metallic nanosphere dimer system of any geometry size,
which will be more evident in Sections 3.1 and 3.2.
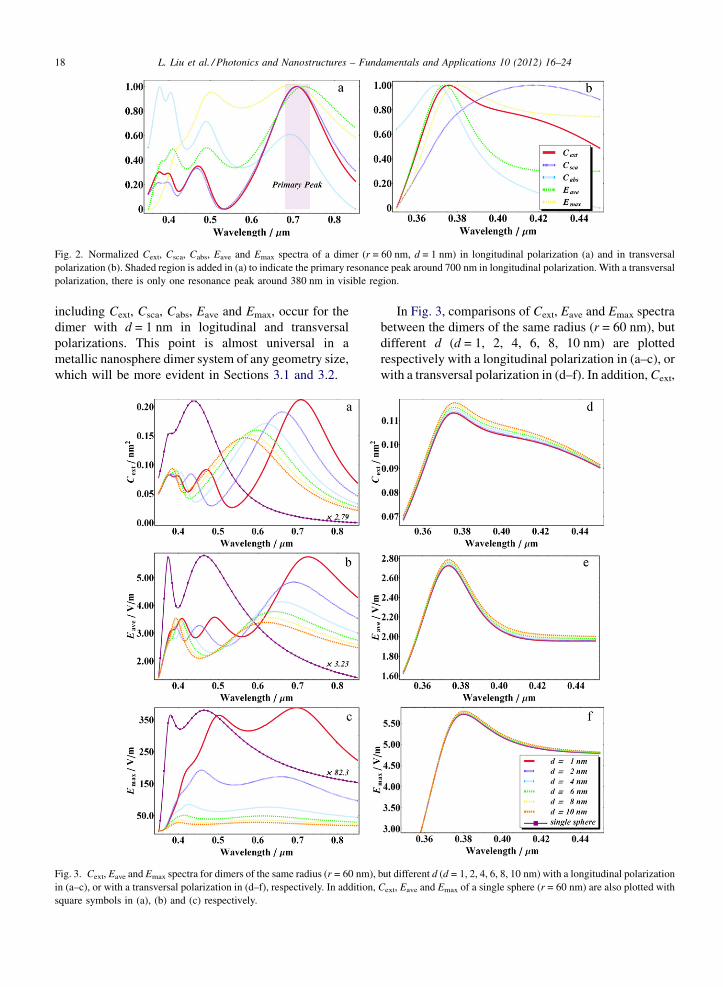
Fig. 3. Cext, Eave and Emax spectra for dimers of the same radius (r = 60 nm),
in (a–c), or with a transversal polarization in (d–f), respectively. In addition,
square symbols in (a), (b) and (c) respectively.
In Fig. 3, comparisons of Cext, Eave and Emax spectra
between the dimers of the same radius (r = 60 nm), but
different d (d = 1, 2, 4, 6, 8, 10 nm) are plotted
respectively with a longitudinal polarization in (a–c), or
with a transversal polarization in (d–f). In addition, Cext,
but different d (d = 1, 2, 4, 6, 8, 10 nm) with a longitudinal polarization
Cext, Eave and Emax of a single sphere (r = 60 nm) are also plotted with
L. Liu et al. / Photonics and Nanostructures – Fundamentals and Applications 10 (2012) 16–24 19
Eave and Emax of a single sphere (r = 60 nm) are added
with square symbols in (a), (b) and (c) respectively.
As expected, the peak wavelength of Cext redshift for
longitudinal polarization when decreasing the spacing
between two spheres in (a), whereas blueshift for the
transversal polarization in (d), which is in agreement
with experimental observations [25,26]. In both
polarizations, similar results appear for the resonance
peaks of Eave (b, e) and Emax (c, f). Finally, based on the
calculated results given in Fig. 3, we can conclude that
both near- and far-field properties for plasmon
resonance of the metallic dimers are much more
sensitive to the spacing between two spheres when the
incident light is polarized along the dimer axis, while
there are only tiny displacements of the resonance peaks
with transversal polarization. So, we will consider only
longitudinal polarization in the following discussion.
One point needs to be noted is that, comparing to a
single sphere, the electromagnetic interaction in
transversal polarization, which is not parallel to the
line connecting the centers of two spheres of the dimer
[26], shift the plasmon resonance peak. The resonance
peak wavelength is 376 nm for a single sphere, 439 nm
for the dimer. And this shift has small dependence on
the dimer distance when two spheres are quite close (in
this case, d � 10 nm).
3.1. Comparison of near- and far-field resonance
peaks
After we discussed the dependences of the resonance
peaks on the spacing between two spheres, now we pay
attention to the differences between the near- and far-
field properties. On one side, as shown in Fig. 2(a),
when two spheres get very close, the primary resonance
peak (�700 nm) of Eave is on the long-wavelength side
of that of Cext, and the primary peak of Emax is on the
short-wavelength side of that of Cext; On the other side,
according to Ross and Lee’s work [3], differences
between resonance of Cext, Eave and Emax of single silver
nanosphere also exist (see lines with square symbols in
Fig. 3(a–c)), which should be the extremity case when
the spacing between these two spheres is large enough.
Combining these two facts, we may reasonably expect
that it is not easy to find an optimum wavelength
exciting near- and far-field resonance simultaneously
for any specific dimer geometry.
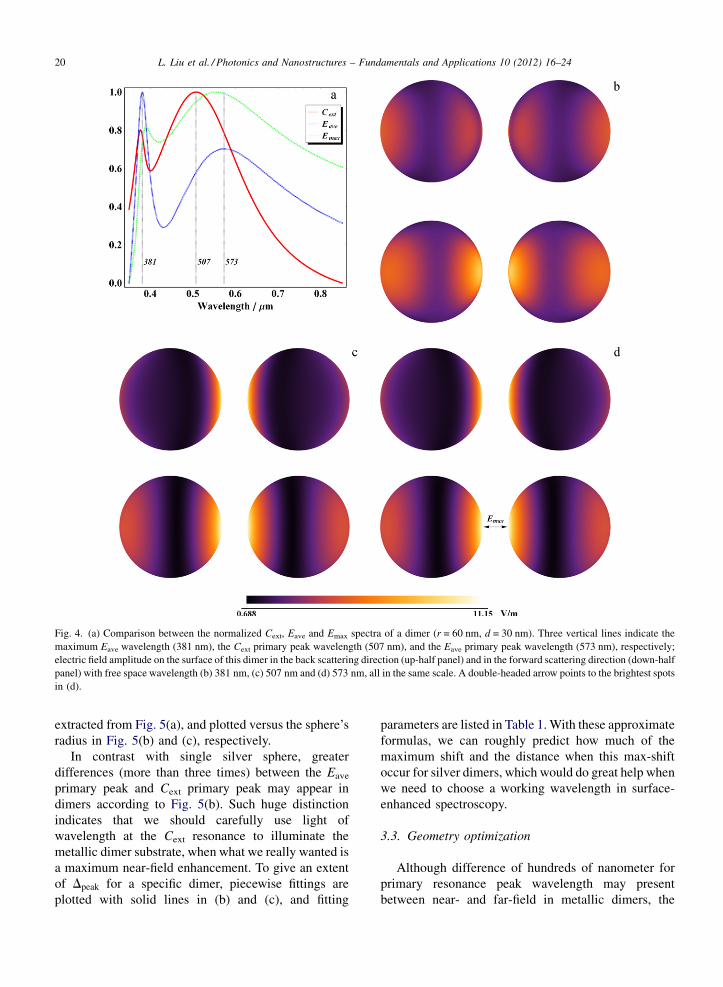
In order to illustrate this point we give a
representative example in Fig. 4, where two silver
spheres of 60 nm radius are separated by a distance of
30 nm. Normalized Cext, Eave, and Emax spectra of this
dimer are shown in Fig. 4(a). Three vertical lines
respectively indicate the maximum Eave wavelength
(381 nm), the Cext primary peak wavelength
(507 nm), and the Eave primary peak wavelength
(573 nm); electric field amplitude on the surface of
this dimer in the back scattering direction (up-half
panel) and in the forward scattering direction (down-
half panel) are depicted with free space wavelength
(b) 381 nm, (c) 507 nm and (d) 573 nm, all in the
same scale. Obviously, Fig. 4(b) has the highest
average brightness, while the most brilliant spot
appears in Fig. 4(d).
3.2. Comparison of near- and far-field resonance
peaks shift
Since distinctions for resonance of near- and far-field
are general, scattering of various dimers with different r
and d are calculated and compared, mainly focused on
the difference between the primary resonance peak
position of Cext and that of Eave. The main calculated
results are given in Fig. 5.
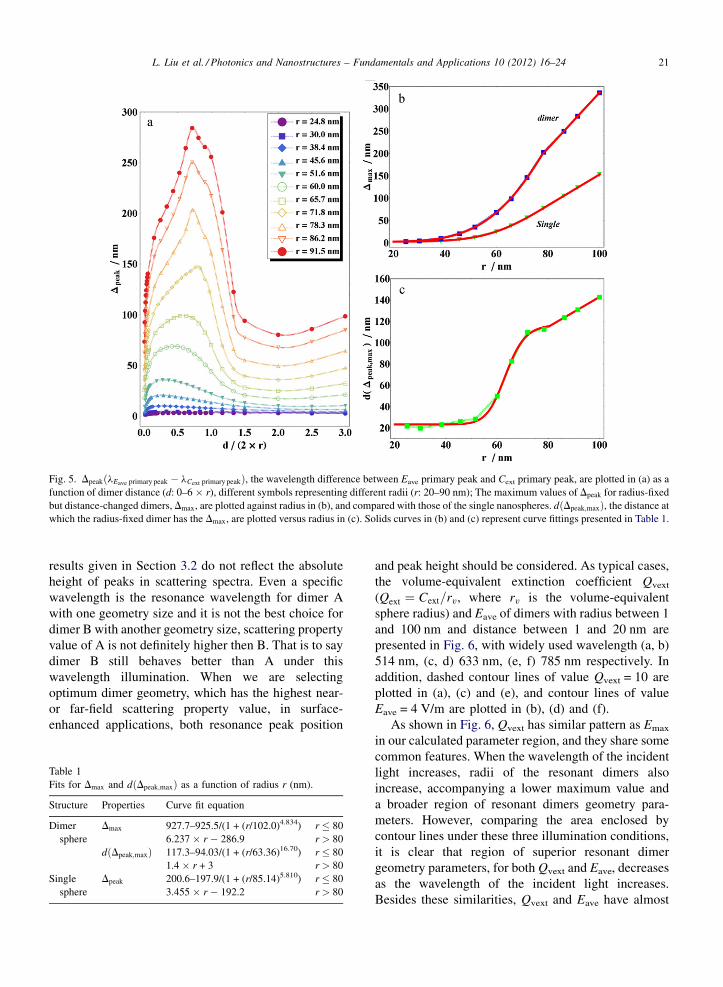
In Fig. 5(a), the wavelength differences between the
Eave primary peak and Cext primary peak,
DpeakðlEave primary peak � lCext primary peakÞ, of dimers with
different r (24.8–91.5 nm), are plotted versus distance d
in unit of the component sphere’s diameter. There are
some common features in these curves: (i) Regardless
of the radius, each curve can be roughly divided into
three sections. When the distance between two spheres
is smaller than the radius (d < r), Dpeak increases as the
distance increases. When distance is in the range of the
radius and the diameter (r < d < 2r), Dpeak keeps
relatively great. And if distance continually expands,
Dpeak decreases and eventually approaches the Dpeak
value of single nanosphere. (ii) Sphere of larger radius
results in larger Dpeak when the two spheres are far away
from each other, which is reasonable for retardation
effects and consequently the radiation damping would
be larger in a larger single particle, and is in consistency
with the previous study [3]. (iii) The second point is not
only appropriate for large spacing, actually for any
distance, larger radius leads to larger resonance
wavelength difference. This makes sense when con-
sidering the radiation damping of whole cluster is
basically originated from the radiation damping of
composed nanospheres.
Fig. 5(a) also reflected that dimers of small spheres
have different Dpeak curve shape compared with dimers
of large spheres (see r = 60.0 and r = 71.8). The
maximum values of Dpeak for radius-fixed but dis-
tance-changed dimers Dmax, and dðDpeak;maxÞ the
distance at which the radius-fixed dimer has Dmax are
L. Liu et al. / Photonics and Nanostructures – Fundamentals and Applications 10 (2012) 16–2420
Fig. 4. (a) Comparison between the normalized Cext, Eave and Emax spectra of a dimer (r = 60 nm, d = 30 nm). Three vertical lines indicate the
maximum Eave wavelength (381 nm), the Cext primary peak wavelength (507 nm), and the Eave primary peak wavelength (573 nm), respectively;
electric field amplitude on the surface of this dimer in the back scattering direction (up-half panel) and in the forward scattering direction (down-half
panel) with free space wavelength (b) 381 nm, (c) 507 nm and (d) 573 nm, all in the same scale. A double-headed arrow points to the brightest spots
in (d).
extracted from Fig. 5(a), and plotted versus the sphere’s
radius in Fig. 5(b) and (c), respectively.
In contrast with single silver sphere, greater
differences (more than three times) between the Eave
primary peak and Cext primary peak may appear in
dimers according to Fig. 5(b). Such huge distinction
indicates that we should carefully use light of
wavelength at the Cext resonance to illuminate the
metallic dimer substrate, when what we really wanted is
a maximum near-field enhancement. To give an extent
of Dpeak for a specific dimer, piecewise fittings are
plotted with solid lines in (b) and (c), and fitting
parameters are listed in Table 1. With these approximate
formulas, we can roughly predict how much of the
maximum shift and the distance when this max-shift
occur for silver dimers, which would do great help when
we need to choose a working wavelength in surface-
enhanced spectroscopy.
3.3. Geometry optimization
Although difference of hundreds of nanometer for
primary resonance peak wavelength may present
between near- and far-field in metallic dimers, the
L. Liu et al. / Photonics and Nanostructures – Fundamentals and Applications 10 (2012) 16–24 21
Fig. 5. DpeakðlEave primary peak � lCext primary peakÞ, the wavelength difference between Eave primary peak and Cext primary peak, are plotted in (a) as a
function of dimer distance (d: 0–6 � r), different symbols representing different radii (r: 20–90 nm); The maximum values of Dpeak for radius-fixed
but distance-changed dimers, Dmax, are plotted against radius in (b), and compared with those of the single nanospheres. dðDpeak;maxÞ, the distance at
which the radius-fixed dimer has the Dmax, are plotted versus radius in (c). Solids curves in (b) and (c) represent curve fittings presented in Table 1.
results given in Section 3.2 do not reflect the absolute
height of peaks in scattering spectra. Even a specific
wavelength is the resonance wavelength for dimer A
with one geometry size and it is not the best choice for
dimer B with another geometry size, scattering property
value of A is not definitely higher then B. That is to say
dimer B still behaves better than A under this
wavelength illumination. When we are selecting
optimum dimer geometry, which has the highest near-
or far-field scattering property value, in surface-
enhanced applications, both resonance peak position
Table 1
Fits for Dmax and dðDpeak;maxÞ as a function of radius r (nm).
Structure Properties Curve fit equation
Dimer
sphere
Dmax 927.7–925.5/(1 + (r/102.0)4.834) r � 80
6.237 � r � 286.9 r > 80
dðDpeak;maxÞ 117.3–94.03/(1 + (r/63.36)16.70) r � 80
1.4 � r + 3 r > 80
Single
sphere
Dpeak 200.6–197.9/(1 + (r/85.14)5.810) r � 80
3.455 � r � 192.2 r > 80
and peak height should be considered. As typical cases,
the volume-equivalent extinction coefficient Qvext
(Qext ¼ Cext=rv, where rv is the volume-equivalent
sphere radius) and Eave of dimers with radius between 1
and 100 nm and distance between 1 and 20 nm are
presented in Fig. 6, with widely used wavelength (a, b)
514 nm, (c, d) 633 nm, (e, f) 785 nm respectively. In
addition, dashed contour lines of value Qvext = 10 are
plotted in (a), (c) and (e), and contour lines of value
Eave = 4 V/m are plotted in (b), (d) and (f).
As shown in Fig. 6, Qvext has similar pattern as Emax
in our calculated parameter region, and they share some
common features. When the wavelength of the incident
light increases, radii of the resonant dimers also
increase, accompanying a lower maximum value and
a broader region of resonant dimers geometry para-
meters. However, comparing the area enclosed by
contour lines under these three illumination conditions,
it is clear that region of superior resonant dimer
geometry parameters, for both Qvext and Eave, decreases
as the wavelength of the incident light increases.
Besides these similarities, Qvext and Eave have almost

L. Liu et al. / Photonics and Nanostructures – Fundamentals and Applications 10 (2012) 16–2422
Fig. 6. Qvext and Eave of dimers with radius between 1 and 100 nm and distance between 1 and 20 nm with wavelength (a) and (b) 514 nm, (c) and (d)
633 nm, (e) and (f) 785 nm respectively. Dimers with geometry parameters in region enclosed by dashed line have a value of Qvext larger than 10 in
(a), (c) and (e), while similarly dimers in the enclosed region in (b), (d) and (f) have a value of Eave larger than 4 V/m.
L. Liu et al. / Photonics and Nanostructures – Fundamentals and Applications 10 (2012) 16–24 23
the same optimum geometry in all three incident light
conditions, with difference of only a few nanometers.
This result convinced us to optimize dimer geometry in
SERS with Qvext, for it is more complicated and time-
consuming to do this with local field electrical field
intensity.
4. Summary
Using GMM method, near- and far-field plasmon
resonance properties of silver nanosphere dimers are
calculated and compared with various dimer geometry
parameters. Plasmon resonance is insensitive to the
geometry features when incident light polarized
perpendicular to the dimer axis in neither far- nor
near-field. For any specified dimer system, larger
difference between the two classes of properties may
occur compared to single metal sphere in longitudinal
polarization, which indicates that exciting wavelength
for dimers utilized in surface-enhanced spectroscopy
should be more carefully chosen. Fitted formulas are
also given to judge the possible maximum peak position
shift. For three specified wavelength, optimum dimer
geometry for near-field property (Eave) has almost the
same size as that for far-field properties (Qvext).
Acknowledgements
This work is supported by the National Science
Foundation of China (60878025, 11074131), the
Doctoral Foundation of Education Ministry of China
(200800551053), the Fundamental Research Funds for
the Central Universities (10055-010-65010981,
65010821), the Major Research Plan of National
Natural Science Foundation of China (90923038). Y.
Wang would like to thank the Research Fund for the
Doctoral Program of Higher Education of China
(20100031110004). B. Wang would appreciate the
Open Research Fund of State Key Laboratory of
Precision Measuring Technology and Instruments and
Open Research Fund of Key Laboratory of Semicon-
ductor Materials Science of Institute of Semiconductors
CAS (KLSMS-1009).
References
[1] R. Aroca, Surface-enhanced Vibrational Spectroscopy, John
Willy & Sons, 2006.
[2] M.L. Brongersma, P.G. Kik, Surface Plasmon Nanophotonics,
Springer, 2007.
[3] B.M. Ross, L.P. Lee, Comparison of near- and far-field measures
of plasmon resonance of metallic nanoparticles, Opt. Lett. 34 (7)
(2007) 896–898.
[4] B.J. Messinger, K.U. von Raben, R.K. Chang, P.W. Barber, Local
fields at the surface of noble-metal microspheres, Phys. Rev. B
24 (1981) 649–657.
[5] G.W. Bryant, F.J.G. de Abajo, J. Aizpurua, Mapping the plasmon
resonances of metallic nanoantennas, Nano Lett. 8 (2008)
631–636.
[6] J. Zuloaga, P. Nordlander, On the energy shift between near-field
and far-field peak intensities in localized plasmon systems, Nano
Lett. 11 (2011) 1280–1283.
[7] J. Grand, P.M. Adam, Optical extinction spectroscopy of oblate,
prolate and ellipsoid shaped gold nanoparticles: experiments and
theory, Plasmonics 1 (2006) 35–140.
[8] M.N. Gom, S.Z. Li, G. Schatz, R. Erni, A. Agarwal, N. Kotov,
T.B. Norris, Electron-beam mapping of plasmon resonances in
electromagnetically interacting gold nanorods, Phys. Rev. B 80
(2009) 113411.
[9] J. Ren, R.D. Tilley, Preparation, self-assembly, and mechanistic
study of highly monodispersed nanocubes, J. Am. Chem. Soc.
129 (2007) 3287–3291.
[10] H. Wang, D.W. Brandl, F. Le, P. Nordlander, N.J. Pand Halas,
Nanorice: a hybrid plasmonic nanostructrue, Nano Lett. 6 (2006)
827–832.
[11] F. Hao, C.L. Nehl, J.H. Hafner, P. Nordlander, Plasmon reso-
nance of a gold nanostar, Nano Lett. 7 (2007) 729–732.
[12] J.F. Li, Y.F. Huang, Y. Ding, Z.L. Yang, S.B. Li, X.S. Zhou, F.R.
Fan, W. Zhang, Z.Y. Zhou, D.Y. Wu, B. Ren, Z.L. Wang, Z.Q.
Tian, Shell-isolated nanoparticle-enhanced Raman, Nature 464
(2010) 392–395.
[13] S.A. Maier, P.G. Kik, H.A. Atwater, S. Meltzer, E. Harel, B.E.
Koel, A.A.G. Requicha, Local detection of electromagnetic
energy transport below the diffraction limit in metal nanoparticle
plasmon waveguides, Nat. Mater. 2 (2003) 229–232.
[14] B. Khlebtsov, A. Melnikov, V. Zharov, N. Khlebtsov, Absorption
and scattering of light by a dimer of metal nanospheres: com-
parison of dipole and multipole approaches, Nanotechnology 17
(2006) 1437–1445.
[15] W. Li, P.H.C. Camargo, X. Lu, Y. Xia, Dimers of silver nano-
spheres: facile synthesis and their use as hot spots for surface-
enhanced Raman scattering, Nano Lett. 9 (2009) 485–490.
[16] D.K. Lim, K.S. Jeon, H.M. Kim, J.M. Nam, Y.D. Suh, Nanogap-
engineerable Raman-active nanodumbbells for single-molecule
detection, Nat. Mater. 9 (2010) 60–67.
[17] Y.L. Xu, Electromagnetic scattering by an aggregate of spheres,
Appl. Opt. 34 (1995) 4573–4588.
[18] M. Ringler, A. Schwemer, M. Wunderlich, A. Nichtl, K. Kur-
zinger, T.A. Klar, J. Feldmann, Shaping emission spectra of
fluorescent molecules with single plasmonic nanoresonators,
Phys. Rev. Lett. 100 (2008) 203002.
[19] P. Monk, Finite Element Method for Maxwell’s Equations,
Oxford University Press, 2003.
[20] D.M. Sullivan, Electromagnetic Simulation Using the FDTD
Method, IEEE Press, 2000.
[21] W.H. Yang, G.C. Schatz, R.P. Van Duyne, Discrete dipole
approximation for calculating extinction and Raman intensities
for small particles with arbitrary shapes, J. Chem. Phys. 103
(1995) 869–875.
[22] Y.L. Xu, B.A.S. Gustafson, Experimental and theoretical results
of light scattering by aggregates of spheres, Appl. Opt. 36 (1995)
8026–8030.
[23] Y.L. Xu, B.A.S. Gustafson, Comparison between multisphere
light-scattering calculations: rigorous solution and discrete-di-
pole approximation, Astrophys. J. 513 (1999) 894–909.

L. Liu et al. / Photonics and Nanostructures – Fundamentals and Applications 10 (2012) 16–2424
[24] A.D. Rakic, A.B. Djurisic, J.M. Elazar, M.L. Majewski, Optical
properties of metallic films for vertical-cavity optoelectronic
devices, Appl. Opt. 37 (1998) 5271–5283.
[25] L. Gunnarsson, T. Rindzevicius, J. Prikulis, B. Kasemo, M. Kall,
S. Zou, G.C. Schatz, Confined plasmons in nanofabricated single
silver particle pairs: experimental observations of strong inter-
particle interactions, J. Phys. Chem. B 109 (2005) 1079–1087.
[26] W. Rechberger, A. Hohenau, A. Leitner, J.R. Krenn, B. Lam-
precht, F.R. Aussenegg, Optical properties of two interacting
gold nanoparticles, Opt. Commun. 220 (2003) 137–141.
Copyright © 2022 FDOKUMEN