Unfolding Communities: imaging the Past, Envisioning the Future

Folding and Unfolding of gTIM Monomers and Dimers
Brijesh Patel and John M. FinkeDepartment of Chemistry, Oakland University, Rochester, Michigan
ABSTRACT Kinetic simulations of the folding and unfolding of triosephosphate isomerase (TIM) from yeast were conductedusing a single monomer gTIM polypeptide chain that folds as a monomer and two gTIM chains that fold to the native dimerstructure. The basic protein model used was a minimalist G�o model using the native structure to determine attractive energies inthe protein chain. For each simulation type—monomer unfolding, monomer refolding, dimer unfolding, and dimer refolding—thirtysimulations were conducted, successfully capturing each reaction in full. Analysis of the simulations demonstrates four mainconclusions. First, all four simulation types have a similar ‘‘folding order’’, i.e., they have similar structures in intermediate stagesof folding between the unfolded and folded state. Second, despite this similarity, different intermediate stages are more or lesspopulated in the four different simulations, with 1), no intermediates populated in monomer unfolding; 2), two intermediatespopulated with b2–b4 and b1–b5 regions folded in monomer refolding; 3), two intermediates populated with b2–b3 and b2–b4
regions folded in dimer unfolding; and 4), two intermediates populated with b1–b5 and b1–b5 1 b6 1 b7 1 b8 regions folded indimer refolding. Third, simulations demonstrate that dimer binding and unbinding can occur early in the folding process beforecomplete monomer-chain folding. Fourth, excellent agreement is found between the simulations and MPAX (misincorporationproton alkyl exchange) experiments. In total, this agreement demonstrates that the computational G�o model is accurate forgTIM and that the energy landscape of gTIM appears funneled to the native state.
INTRODUCTION
Many recent advances in understanding protein folding have
been provided by minimalist simulations (1–18). One funda-
mental idea guiding many simulations is that natural selec-
tion has evolved each protein such that amino acids found
in close proximity in the native structure of a protein are
attractive (16,19–25). The attractive energies between distant
residue pairs in the native protein structure of a protein have
been selected against so that they are zero (2). This basic
model has been called the G�o model (26).
The design and implementation of G�o-model simulations
is relatively straightforward (16,21,25). However, what is
intriguing about these simple models is that they reproduce
the structures and stability of transition states and transient
intermediate states in the folding of a number of proteins, as
confirmed with various experiments (16,17,19,21–23). Hav-
ing established this agreement with these small monomeric
proteins, theoretical biophysicists are currently pursuing
extensions of the G�o model to other, more complicated bio-
molecular interactions. The problems under study include
large protein monomers, protein binding and assembly, mul-
timeric protein complexes, protein-DNA complexes, and
chaperonins (16–18,27).
This study investigates a relatively unexplored area of
theoretical protein folding—the folding and binding of large
(.200 amino acid) proteins into the dimeric native state.
Thus far, many small protein folding simulations have been
published (19,21–23). In addition, a few theoretical simula-
tion studies of protein binding have also demonstrated the
success and future promise of the G�o model (17). Further-
more, a recent theoretical study of the a-subunit of tryp-
tophan synthase (aTS), a large triosephosphate isomerase
(TIM) barrel monomer, showed excellent agreement with a
number of equilibrium and kinetic experiments (16). As a
test case to investigate large protein dimers, the folding and
binding of TIM from yeast (gTIM) is explored in this study.
TIM catalyzes the fifth step in the glycolysis pathway
and converts dihydroxyacetone phosphate (DHAP) into
3-glyceralaldehyde phosphate (28). Since glycolysis is the
most fundamental pathway through which organisms derive
ATP from food sources, TIM proteins are found in nearly all
organisms on earth (28). Furthermore, the structure of TIM,
the TIM barrel, has proven to be useful in catalyzing many
other metabolic biochemical reactions as well (28). Conse-
quently, TIM has many paralogs within the same organism
and across the genomes of most living species. This struc-
tural promiscuity has resulted in the notable finding that 10%
of all protein structures in the Protein Data Bank (PDB) are
TIM barrels. Therefore, an understanding of the fundamental
physical forces that determine the folding and oligomer
assembly pathways of TIM barrels can be applied to many
known TIM barrel systems. Demonstration of the predictive
success of a biophysical model to a test set of TIM barrels
will provide the backbone for an exhaustive theoretical anal-
ysis of TIM barrel folding and binding across many ge-
nomes. This study investigates whether the G�o model is
capable of predicting the folding and binding of gTIM, a
TIM-barrel protein, using experimental data on the number
doi: 10.1529/biophysj.107.108068
Submitted March 5, 2007, and accepted for publication May 24, 2007.
Address reprint requests to John M. Finke, Dept. of Chemistry, Oakland
University, Rochester, MI 48309-4477. Tel.: 248-370-3088; E-mail:
Editor: John E. Straub.
� 2007 by the Biophysical Society
0006-3495/07/10/2457/15 $2.00
Biophysical Journal Volume 93 October 2007 2457–2471 2457

of folding intermediates in the folding pathway and also the
structures of these intermediates.
After the first TIM-barrel x-ray crystallographic structures
were obtained, the stability and folding pathways of TIM
barrel proteins became a subject of scientific interest. The
most simple TIM-barrel structure consists of eight repeating
ba units, with the b-strands linked through hydrogen bonds
like flat fence posts in a circular arrangement, such that the
N-terminal and C-terminal b-strand bend around to ‘‘close
the gate’’ by hydrogen-bonding with one another (28). The
eight a-helices lie on the outside of the barrel shape made by
the eight b-strands. At first glance, it might appear that all
eight ba units would be required for the protein to be stable,
since all eight strands are required to complete the TIM bar-
rel’s circular arrangement and connect the - and C-terminal
strands. Removal of any of the eight ba units would leave
the TIM-barrel protein too short to bend around and make the
N-C connection. Without this stabilizing connection, one
might think that truncation mutants of TIM barrels would
lack the stability to remain folded. However, truncation
mutants of TIM-barrels can exist as stable structures (29–
31). Thus, the stabilizing interactions may exist unequally
throughout the protein chain. During the folding of TIM
barrels, such interactions may give rise to unexpected folding
pathways and intermediates.
Folding experiments of monomeric TIM barrels have
been conducted on a number of TIM-barrel proteins. These
include folding studies of yeast TIM (gTIM), rabbit muscle
TIM (rTIM), and Trypanosoma brucei TIM (tbTIM), the
a-subunit of Escherichia coli tryptophan synthase (aTS),Sulfolobus solfataricus indole-3-glycerol phosphate syn-
thase (sIGPS), E. coli IGPS (eIGPS), E. coli phosphoribo-sylanthranilate isomerase (PRAI), and rabbit muscle aldolase
(29,31–48). These studies have revealed some similarities
between the TIM-barrel folding pathways but also many
differences.
A similarity between all TIM-barrel proteins studied is
that their folding pathways do not follow a simple two-state
mechanism and appear to always involve kinetic folding
intermediates. Kinetic folding studies of all TIM barrels
studied demonstrate multiphasic folding pathways that are
found to be consistent with folding intermediates(37–39,
41,42,46,47). In addition, thermodynamically stable inter-
mediates are also observed in equilibrium unfolding exper-
iments of most TIM barrels (33–35,38,39,41,45,48,49). The
possible exception of a TIM barrel with no thermodynamic
intermediate is rTIM (42).
However, from a structural standpoint, the folding path-
ways of TIM barrels appear to be as different from each other
as any one is from any group of unrelated proteins. Although
the TIM barrels fold through intermediates, these interme-
diates appear to be quite different in structure. The equilib-
rium intermediates of aTS indicate that folding initiates at
the N-terminus with an early folding intermediate, I2, within
the region a0–a4 (29,44), followed by an intermediate I1
comprising regions a0–b6 1 b7 (29,43,50). Kinetic folding
studies of aTS also indicate early N-terminal structure in
regions a0–b6 1 b7 (37,50). A similar ‘‘N-terminus first’’
equilibrium folding pathway was found in gTIM, the subject
of this study. With gTIM, folding initiates with an early
intermediate, I2, comprising the region b2–b4 followed by an
intermediate I1 comprising the region a1–b6 (34).
Although this folding pathway might be found in other
TIM barrels, it certainly does not apply to all TIM-barrel
proteins. For example, for rTIM, no intermediates are ob-
served in equilibrium unfolding, and in kinetic folding studies,
the C-terminal region b5–a8 appears to fold first (42). In
addition, a dialysis refolding experiment indicates that the
folding pathway of rabbit-muscle aldolase populates two
intermediates with nonadjacent folded regions of the protein
a0 1 b4a4 1 a5 1 a6b7 (I2) and a0 1 b4–b8 (I1) and (40).
These aldolase intermediates also demonstrate a preference
for early C-terminal folding.
The differences in these pathways suggest that a high de-
gree of structural diversity may exist within the TIM-barrel
fold family which is not conveyed with the simple (ba)8 folddescription. The folding mechanism must be determined by
more subtle structural properties in the TIM-barrel proteins,
such as 1), the slight differences in the contact topology due
to different position and lengths of thea-helices andb-strands,or 2), differences in hydrophobic-residue packing within
the barrel center. Although not addressed in this study, non-
native contacts, proline isomerization, and disulphide for-
mation can play an important role in TIM-barrel protein
folding (47,51,52).
The primary question addressed in this work is whether
the contacts determined from the x-ray crystal structure of
gTIM are by themselves sufficient to build an accurate
protein folding model. An accurate gTIM model, which
correctly selects the number of folding intermediates and
their structures, would support the hypothesis that contact
topology is the primary determinant of gTIM folding (2,
19,53). This would also support the conclusion that the
energy landscape of gTIM is highly funneled to the native
state.
Previous computational TIM-barrel folding studies have
investigated the folding of monomeric TIM barrels (16,54).
For this study of gTIM, the folding is complicated by a
binding event that is necessary to form the native dimer state.
Such a simulation involves simulating not just one large
protein chain but two. Fortunately, minimalist G�o models,
which approximate each amino acid with a single Ca atom,
are uniquely suited to successfully simulate this large protein
assembly system.
In this study, simulations were made to investigate both a
monomeric model (one chain) and a dimer model (two
chains) of gTIM barrel folding in the context of kinetic
protein folding and unfolding. To test the hypothesis that the
energy landscape of gTIM is funneled to the native state, the
following questions were investigated:
2458 Patel and Finke
Biophysical Journal 93(7) 2457–2471

1. Are the tertiary structures in progressive stages of fold-
ing similar to those of unfolding, and are these structures
similar between the monomer and dimer models?
2. Are conformations in the stages of folding populated dif-
ferently in simulations of monomer unfolding, dimer un-
folding, monomer refolding, and dimer refolding?
3. Is complete folding of the gTIM monomer required to
form the dimer or can the two chains commit to a bound
state before complete folding?
4. Do the structures and the basic pathway agree with the
currently available experimental data?
With respect to question 4, a number of experiments have
studied the equilibrium unfolding pathway of the gTIMdimer. A number of global structural probes have indicated
two-step equilibrium unfolding by chemical denaturants with
a single monomeric intermediate (DGH2ONI � 17 kcal=mol;
DGH2OIU � 4 kcal=mol) (33,55,56). Also, a residue-specific
misincorporation proton alkyl exchange (MPAX) study has
indicated a three-step unfolding mechanism with two
intermediates (DGH2ONI1� 5 kcal=mol; DGH2O
I1I2� 5 kcal=mol;
DGH2OI2U� 4 kcal=mol) (34). This MPAX study provides
detailed structural information on dominant intermediates in
the folding ensemble of gTIM but did not determine whether
these intermediates were monomeric or dimeric. By com-
paring this theoretical study to these experiments, this work
provides a complementary perspective on how the energy
landscape of gTIM guides its folding to the native state.
MATERIALS AND METHODS
Molecular dynamics
Molecular dynamics (MD) simulations were carried out using AMBER 6
software, compiled on a Linux platform, employing the sander_classic
program as an integrator for initial energy minimization and subsequent
molecular dynamics (57). The following describes the AMBER sander_
classic molecular dynamics parameters used in this study. The specific
parameter values are listed in parentheses. The time step was 0.001 ps (DT¼0.001). Translational and rotational motion was removed at the beginning of
each run and every 1000 time steps thereafter (NTCM ¼ 1, NSCM ¼ 1000,
NDFMIN ¼ 0). Initial velocities were randomly selected (INIT ¼ 3, IG ¼random). If the absolute value of the velocity of any atom exceeded 500 A/
time step, velocities were scaled such that the absolute value of the velocity
of that atom was 500 A/time step (VLIMIT ¼ 500). Temperature was
maintained with external bath using the method of Berendsen (58), with a
coupling constant of 0.2 ps (NTT¼ 5, TAUTP¼ 0.2, TAUTS¼ 0.2). If the
simulation temperature Tsim exceeded the average temperature T by .10 K,
velocities were scaled such that Tsim ¼ T. SHAKE was not used. Although
no electrostatics were involved in the molecular dynamics, a default constant
dielectric was used (IDIEL ¼ 1) with a default delectric constant of 1
(DIELC¼ 1). The particle mesh Ewald method was not used (IEWALD¼ 0).
During each integration step, interactions between all atom pairs were
calculated and this contact pairlist was updated only once at the beginning of
the simulation (CUT ¼ 9999, NSNB ¼ 9999). No periodic boundary or
pressure regulation was used (NTB ¼ 0, NTP ¼ 0). Structures and energies
were saved every 1.5 ps (NTPR ¼ 1500, NTWR ¼ 1500, NTWX ¼ 1500,
NTWV ¼ 1500, NTWE ¼ 1500).
For dimer simulations, two separate protein chains were simulated. To
prevent the chains from flying apart, a weak harmonic term was placed on the
center of mass of each protein chain shown below in Eq. 1 (59,60):
R ¼ kðD� D0Þ2: (1)
In Eq. 1, k is the spring constant (0.01 kcal/mol), D is the angstrom distance
between the center of masses of the two protein chains at a given point in the
simulation, and D0 ¼ 7.6 A (this is the distance between the two centers of
mass in the reduced dimer model, which is equivalent to 29 A in the real
protein dimer). This value of k ¼ 0.01 kcal/mol permits complete physical
separation, with free rotational freedom, of the unbound protein chains. For
dimer-unfolding trajectories, lower values of k yielded essentially the same
results as those with k ¼ 0.01 (data not shown). For dimer refolding
trajectories, lower values of k yielded a similar protein folding pathway as
those with k¼ 0.01. However, the rate of binding of the two gTIM chains is
slowed as k is decreased, so that fewer trajectories successfully reach the
native dimer state during the simulation timeframe. The spring constant of
k ¼ 0.01 kcal/mol was the best compromise between approximating a real
(i.e., more dilute) protein concentration and permitting enough simulations
to successfully refold. The magnitude of k in this study is consistent with
harmonic restraints used in previous studies (59,60).
G�o model
The PDB structure used to build the G�o model is 1YPI (Fig. 1). Fig. 1 shows
that, although the individual monomers are virtually identical and the
interface involves residues at the N-terminus of the protein, the structure is
not a symmetric dimer, since the two monomers (blue, monomer A; and red,
monomer B) do not orient as a mirror image of one another. As shown in
Fig. 1, the two monomers orient with residues on the side of each barrel, but
the barrel axes of each monomer are oriented at;90� to one another. In Fig.1, the dimer interface residues are shown in cyan for monomer A and in
yellow for monomer B. Residues at the dimer interface are defined as having
at least one atom in contact with the other chain and include residues 10 (b1),
12–17 (b1-a1 loop), 43–46 (b2-a2 loop), 48 (a2), 64–67 1 69–79 (b3-a3
loop), 82–83 1 85–86 (a3), 92 (b4), and 95 1 97–98 1 101–102 1 108
(a4).
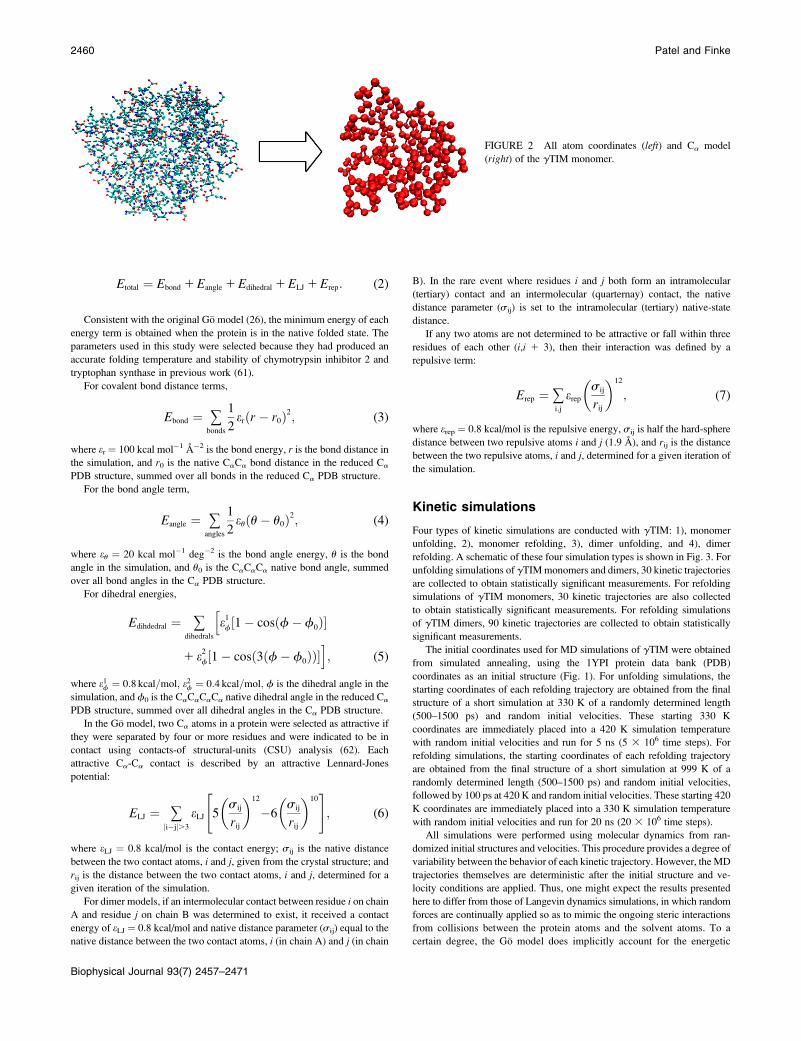
To model gTIM, each amino acid is approximated with its single
backbone Ca atom as shown in Fig. 2. To facilitate faster MD sampling, a
reduced protein model was used in which the distance between protein
atoms was reduced 3.8-fold so that the Ca-Ca bond length was equal to 1 A.
This 1-A bond-length model was shown to give identical folding behavior to
protein models with 3.8 A bond length, with a twofold increase in sampling
efficiency (data not shown). This modified model helped with the simulation
of the large gTIM protein system. The overall potential energy for a given
protein conformation is given by Eq. 2:
FIGURE 1 Triosephosphate isomerase dimer from PDB structure 1YPI.
One monomer is colored blue with interface residues in cyan. The other
monomer is colored red with interface residues in yellow.
Kinetic Folding Simulations of gTIM 2459
Biophysical Journal 93(7) 2457–2471
Etotal ¼ Ebond 1Eangle 1Edihedral 1ELJ 1Erep: (2)
Consistent with the original G�o model (26), the minimum energy of each
energy term is obtained when the protein is in the native folded state. The
parameters used in this study were selected because they had produced an
accurate folding temperature and stability of chymotrypsin inhibitor 2 and
tryptophan synthase in previous work (61).
For covalent bond distance terms,
Ebond ¼ +bonds
1
2erðr � r0Þ2; (3)
where er ¼ 100 kcal mol�1 A�2 is the bond energy, r is the bond distance inthe simulation, and r0 is the native CaCa bond distance in the reduced Ca
PDB structure, summed over all bonds in the reduced Ca PDB structure.
For the bond angle term,
Eangle ¼ +angles
1
2euðu� u0Þ2; (4)
where eu ¼ 20 kcal mol�1 deg�2 is the bond angle energy, u is the bond
angle in the simulation, and u0 is the CaCaCa native bond angle, summed
over all bond angles in the Ca PDB structure.
For dihedral energies,
Edihdedral ¼ +dihedrals
e1f½1� cosðf� f0Þ�h
1 e2f½1� cosð3ðf� f0ÞÞ�i; (5)
where e1f ¼ 0:8 kcal=mol; e2f ¼ 0:4 kcal=mol; f is the dihedral angle in the
simulation, and f0 is the CaCaCaCa native dihedral angle in the reduced Ca
PDB structure, summed over all dihedral angles in the Ca PDB structure.
In the G�o model, two Ca atoms in a protein were selected as attractive if
they were separated by four or more residues and were indicated to be in
contact using contacts-of structural-units (CSU) analysis (62). Each
attractive Ca-Ca contact is described by an attractive Lennard-Jones
potential:
ELJ ¼ +ji�jj.3
eLJ 5sij
rij
� �12
�6 sij
rij
� �10" #
; (6)
where eLJ ¼ 0.8 kcal/mol is the contact energy; sij is the native distance
between the two contact atoms, i and j, given from the crystal structure; and
rij is the distance between the two contact atoms, i and j, determined for a
given iteration of the simulation.
For dimer models, if an intermolecular contact between residue i on chain
A and residue j on chain B was determined to exist, it received a contact
energy of eLJ ¼ 0.8 kcal/mol and native distance parameter (sij) equal to the
native distance between the two contact atoms, i (in chain A) and j (in chain
B). In the rare event where residues i and j both form an intramolecular
(tertiary) contact and an intermolecular (quarternay) contact, the native
distance parameter (sij) is set to the intramolecular (tertiary) native-state
distance.
If any two atoms are not determined to be attractive or fall within three
residues of each other (i,i 1 3), then their interaction was defined by a
repulsive term:
Erep ¼ +i;j
erepsij
rij
� �12
; (7)
where erep ¼ 0.8 kcal/mol is the repulsive energy, sij is half the hard-sphere
distance between two repulsive atoms i and j (1.9 A), and rij is the distance
between the two repulsive atoms, i and j, determined for a given iteration of
the simulation.
Kinetic simulations
Four types of kinetic simulations are conducted with gTIM: 1), monomer
unfolding, 2), monomer refolding, 3), dimer unfolding, and 4), dimer
refolding. A schematic of these four simulation types is shown in Fig. 3. For
unfolding simulations of gTIMmonomers and dimers, 30 kinetic trajectories
are collected to obtain statistically significant measurements. For refolding
simulations of gTIM monomers, 30 kinetic trajectories are also collected
to obtain statistically significant measurements. For refolding simulations
of gTIM dimers, 90 kinetic trajectories are collected to obtain statistically
significant measurements.
The initial coordinates used for MD simulations of gTIM were obtained
from simulated annealing, using the 1YPI protein data bank (PDB)
coordinates as an initial structure (Fig. 1). For unfolding simulations, the
starting coordinates of each refolding trajectory are obtained from the final
structure of a short simulation at 330 K of a randomly determined length
(500–1500 ps) and random initial velocities. These starting 330 K
coordinates are immediately placed into a 420 K simulation temperature
with random initial velocities and run for 5 ns (5 3 106 time steps). For
refolding simulations, the starting coordinates of each refolding trajectory
are obtained from the final structure of a short simulation at 999 K of a
randomly determined length (500–1500 ps) and random initial velocities,
followed by 100 ps at 420 K and random initial velocities. These starting 420
K coordinates are immediately placed into a 330 K simulation temperature
with random initial velocities and run for 20 ns (20 3 106 time steps).
All simulations were performed using molecular dynamics from ran-
domized initial structures and velocities. This procedure provides a degree of
variability between the behavior of each kinetic trajectory. However, theMD
trajectories themselves are deterministic after the initial structure and ve-
locity conditions are applied. Thus, one might expect the results presented
here to differ from those of Langevin dynamics simulations, in which random
forces are continually applied so as to mimic the ongoing steric interactions
from collisions between the protein atoms and the solvent atoms. To a
certain degree, the G�o model does implicitly account for the energetic
FIGURE 2 All atom coordinates (left) and Ca model
(right) of the gTIM monomer.
2460 Patel and Finke
Biophysical Journal 93(7) 2457–2471

interactions between atoms of the solvent and atoms of the protein, par-
ticularly hydrophobic interactions. However, the random steric interactions
of Langevin dynamics simulations are not included when MD is used to
study the Ca G�o model. This study neglects these steric interactions to
explore the extent to which the gTIM folding pathway is guided through
deterministic interactions. Experimental features, such as populated inter-
mediate states, of the gTIM kinetic folding pathway that are not captured
by MD simulations may highlight the importance of stochastic events in
populating such states.
For unfolding trajectories, 5 ns of simulation time at 420 K was sufficient
to completely unfold all 30 monomer and 30 dimer gTIM proteins in the
simulations. Complete unfolding was determined by total contact energies
ELJ and values of Q close to 0 (typically ELJ � �30 kcal/mol and Q � 40
for an unfolded gTIM chain with 587 contacts). These values of ELJ and
Q are consistent with the infrequent interactions inherent in a randomly
moving freely jointed chain (data not shown). For refolding trajectories of
the monomer gTIM protein model, 20 ns of simulation time at 330 K
successfully refolded 90% of the simulations. For refolding trajectories of
the dimer gTIM protein model, 20 ns of simulation time at 330 K suc-
cessfully refolded 32% of the simulations. All refolding trajectories that
did not refold within 20 ns did not refold after an additional 10 ns of
simulation, indicating that they were trapped in a misfolded state, requiring
extensive simulation time to escape. As such, the data from incomplete
simulations were not included in the data analysis. Each simulation con-
dition studied—monomer unfolding (30 trajectories, 100% successful),
monomer refolding(30 trajectories, 90% successful), dimer unfolding (30
trajectories, 100% successful), and dimer refolding (90 trajectories, 32%
successful)—produced ;30 successful trajectories, which were used for
analysis.
Statistical errors reported throughout this article are based on the
following grouping of the kinetic trajectories. The trajectories are divided
into three groups: 1), trajectories 1–10, 11–20, and 21–30 for monomer
unfolding, monomer refolding, and dimer unfolding; 2), trajectories 1–30,
31–60, and 61–90 for dimer refolding. Within each group are ;10
successfully refolded or unfolded trajectories. Properties of each group are
averaged and these three separate averages are used to determine a global
average and standard deviation. The data reported in this study are the
averages of three separate analyses of each group. The errors shown in the
figures are the standard deviations of each data point.
Simulation analysis
Throughout each 5-ns unfolding simulation, 3330 structures were obtained
(one structure every 1.5 ps). Throughout each 20-ns refolding simulation,
13,320 structures were obtained (one structure every 1.5 ps). For each
structure sampled throughout the simulations, the total number of native
contacts (Q) formed was calculated according to where each native contact
was determined to be formed if it fell within 1.5 times the native distance.
The maximum number of tertiary native contacts (folding contacts within the
monomer) possible for each monomer simulation was 587. The maximum
number of tertiary native contacts possible for each dimer simulation was
1174, twice that of the monomer. The maximum number of intermolecular
native contacts (binding contacts at the dimer interface between the two
monomers) was 108.
In theory, the distance cutoff for contacts can be of any value as long as
different structural states (with different degrees of folding) can be
reasonably classified as different values of Q (or another order parameter,
such as Pfold). For G�o models, similar folding mechanisms have been
demonstrated during separate studies of chymotrypsin inhibitor 2 using
different contact cutoff values of 1.2 (53) and 1.5 (61). A distance cutoff is
only problematic when an excessive population of Q is found at Q ¼ 0
(cutoff is too small) or at Q ¼ Qmax (cutoff is too large), where significantly
different structures are placed in the same Q bin. Prior analysis has shown
that the changes in the cutoff range between 1.2 and 1.6 times the native
distance does not alter the interpretation of protein folding pathways,
although the Q distribution width of native, intermediate, and unfolded
populations will indeed change slightly (data not shown). As was done in
previous studies, this study uses a contact cutoff of 1.5* (native distance) to
produce a distribution of Q states that best approximates the relative
distribution widths of ELJ contact energies between the native and unfolded
ensembles (16,61). Using this cutoff of 1.5, no structures in the simulations
ever occupied values of Q at either Q ¼ 0 or Q ¼ Qmax, indicating that the
density of states was adequately binned in the intermediate values of Q
between 0 and Qmax.
For each simulation condition studied, the probability that the simulation
structure had a value of Q ¼ i was computed through Eqs. 8a and 8b:
ProbabilityðQ ¼ iÞ ¼+N
n¼1+T
t¼1dQðn;tÞ;i
NT; (8a)
where
dQðn;tÞ;i ¼ 1; if Qðn; tÞ ¼ i0; if Qðn; tÞ 6¼ i
:
�(8b)
In Eq. 8a, N is the total number of simulations in each group (10 maximum)
and T is the length of each simulation (3330 for unfolding, 13,320 for
refolding). For intramolecular contacts within each gTIM protein chain, i isvaried between 0 and 587 for monomer simulations and between 0 and 1174
for dimer simulations. For intermolecular contacts at the dimer interface, i is
varied between 0 and 108.
To identify the structures of intermediate stages of folding, the simulation
structures were grouped by similar values of Q tertiary contacts. Group A
consists of structures where Q ¼ 0–100 for the monomer and 0–200 for the
FIGURE 3 Schematic for folding (right arrows) and
unfolding (left arrows) for (top) gTIMG�o model monomer
and (bottom) gTIM G�o model dimer.
Kinetic Folding Simulations of gTIM 2461
Biophysical Journal 93(7) 2457–2471

dimer. Group B consists of structures where Q ¼ 101–200 for the monomer
and 201–400 for the dimer. Group C consists of structures where Q ¼ 201–
300 for the monomer and 401–600 for the dimer. Group D consists of
structures where Q ¼ 301–400 for the monomer and 601–800 for the dimer.
Group E consists of structures where Q ¼ 401–500 for the monomer and
801–1000 for the dimer. Group F consists of structures where Q ¼ 501–587
for the monomer and 1001–1174 for the dimer. Within groups A–F, the
probability that each residue i is folded is calculated through Eqs. 9a and 9b:
Probability Folded ðiÞ ¼+N
n¼1+T
t¼1+P
p¼0dDði;n;t;pÞ;Dði;X;pÞ
NTP; (9a)
where
djk ¼ 1; if Dði; n; t; pÞ# 1:5 � Dði;X; pÞ0; if Dði; n; t; pÞ . 1:5 � Dði;X; pÞ :
�(9b)
In Eq. 9a, N is the total number of simulations in each group (10 maximum),
T is the length of each simulation (3330 for unfolding, 13,320 for refolding),
P is the total number of contact pairs involving residue i (varies from 0 to
16), D(i,n,t,p) is the distance of Ca atoms of residue i and contact partner,
defined by p, in the simulation at a given set of n,t values, and D(i,X,p) is the
distance of Ca atoms of residue i and contact partner, defined by p, in the
reduced PDB structure 1YPI (denoted as X). In the case of dimer
simulations, the value reported is the average value of Probability Folded
(i) from each of the two monomer chains. For residues in gTIM, i is varied
between 1 and 247.
RESULTS
Fig. 4 shows representative trajectories of dimer unfolding
(Fig. 4 A) and dimer refolding (Fig. 4 B) of gTIM. Fig. 4 Aplots the total number of intramolecular native contacts (Q)within each monomer (black lines) and intermolecular native
contacts at the dimer interface (gray lines) as a function of
time steps in a simulation starting from a native dimer con-
formation and unfolding at 420 K. Fig. 4 B plots the total
number of intramolecular Q within each monomer (blacklines) and intermolecularQ at the dimer interface (gray lines)as a function of time steps in a simulation starting from an
unfolded monomer conformation and refolding at 330 K.
These simulations are representative of the 30 total simula-
tions acquired for each simulation type—monomer unfolding,
monomer refolding, dimer unfolding, and dimer refolding.
Although Fig. 4, A and B, is representative of many of the
other trajectories, it is important to note that each trajectory
samples its own unique set of intermediate states during
unfolding or refolding. Simulation trajectories of monomer
unfolding and refolding appear similar to the dimer intra-
molecular Q trajectories (black lines) in Fig. 4, A and B,albeit with slightly different intermediate folding stages
populated.
Structures from the trajectories can be grouped based on
which stage of folding they fall into (i.e., Q). The fraction of
each residue that is folded can be quantified for structures
within each range of Q. As discussed in Materials and
Methods, the structures in the trajectories fall into six folding
‘‘groups’’, A–F. Group A is the least folded and includes
largely unfolded structures. Group F is the most folded and
includes largely native structures. Groups B–E represent
intermediate stages of folding with increasing values of Q.The values of Q used to define groups A–F only involve
intramolecular contacts within monomer chains and do not
include dimer contacts at the interface.
Fig. 5 shows the degree of folding of each gTIM residue in
groups B–E. Fig. 5 A highlights the regions of secondary
structure throughout the gTIMmonomer. Fig. 5, B–E, showsthe fractions folded of each residue for groups B–E,
respectively. Since these groups are sampled through the
four different simulation types, all four are shown for
comparison: monomer unfolding (dashed gray lines), mon-
omer refolding (solid gray lines), dimer unfolding (dashedblack lines), and dimer refolding (solid black lines). With
minimal exception, all simulation types produced largely
similar results. Fig. 5 B shows that residues within regions
FIGURE 4 Sample trajectories of gTIM dimer (A) unfolding and (B) re-
folding. The left y axis shows the total number of intramolecular contacts
(black lines) for the two protein chains (587 maximum for each chain ¼1174 total). The right y axis shows the number of intermolecular contacts
(gray lines) at the dimer interface between the two chains (108 maximum).
2462 Patel and Finke
Biophysical Journal 93(7) 2457–2471

b2–b3 are the initial regions to fold in group B. Fig. 5 Cshows that folding has increased to involve residues within
regions b2–b4 in group C. Fig. 5 D shows that folding has
increased to residues within regions b1–b5 in group D. Fig. 5
E shows that folding increased to residues within regions
b1–b8 in group E, with some residues in a-helical regionsremaining unfolded. Residues in group A (not shown) are
mostly unfolded and residues in group F (also not shown) are
mostly folded.
The results shown in Fig. 5, A–E, indicate that the
simulation type (monomer unfolding, dimer refolding, etc.)
does not significantly change the folding order of residues
within the protein. However, the probability of populating
groups B–E does depend on the simulation type. Fig. 6, A–D,shows the probability that structures with each value of Qwill be populated during the course of the simulation. Fig. 6
A shows that the probability of finding intermediate values of
Q between the unfolded ensemble in group A and the folded
ensemble in group E is very low, indicating that no
intermediates exist in monomer unfolding. Fig. 6 B shows
two Q-probability peaks in groups C and D, indicating that
two intermediates exist in monomer refolding simulations.
Fig. 6 C shows twoQ-probability peaks, one between groupsA and B and the other in group C, indicating that two
intermediates exist in dimer-unfolding simulations. Fig. 6 Dshows two Q-probability peaks, in groups D and E,
indicating that two intermediates exist in dimer refolding
simulations. It should be noted that the ‘‘folded’’ ensemble
during unfolding simulations falls in group E (Fig. 6, A and
C) instead of group F (Fig. 6, B and D). This is because theincreased temperature of unfolding simulations makes the
weaker contacts of the folded structure less likely to be
formed, producing a lower value of Q for the folded state.
Fig. 7, A and B, shows the average number of intramo-
lecular (monomer) contacts and intermolecular (dimer-
interface) contacts that disappear during unfolding (Fig. 7
A) or accumulate during refolding (Fig. 7 B). Fig. 7, A and B,only applies to simulations of the dimer G�o models of gTIM,
FIGURE 5 Intermediate stages of gTIM monomer unfolding (dashedgray lines), dimer unfolding (dashed black lines), monomer refolding (solid
gray lines), and dimer refolding (solid black lines). (A) a-helix (black) and
b-sheet (gray) regions of gTIM. (B) Probability of residue folding in group
B: b2–b3. (C) Probability of residue folding in group C: b2–b4. (D)Probability of residue folding in group D: b1–b5. (E) Probability of residue
folding in group E: b1–b8.
FIGURE 6 (A) Probability of populating folding groups A–F during mono-
mer unfolding, (B) monomer refolding, (C) dimer unfolding, and (D) dimer
refolding. Error boundaries are indicated in gray.
Kinetic Folding Simulations of gTIM 2463
Biophysical Journal 93(7) 2457–2471

since monomer simulations do not have intermolecular
contacts. For dimer unfolding in Fig. 7 A, it can be seen that,on average, contacts associated with unfolding (monomer
contacts) decrease at a similar rate to contacts associated with
unbinding (dimer contacts). This finding suggests that dimer
unbinding occurs at the same time that the monomers unfold,
within the experimental error of the simulations. For dimer
refolding in Fig. 7 B, it can be seen that, on average, contactsassociated with folding (monomer contacts) increase at a
faster rate than contacts associated with binding (dimer
contacts). This finding is within the experimental error of the
simulations and suggests that a significant amount of folding
precedes dimer formation.
Table 1 gives a different presentation of the gTIM binding
versus folding data shown in Fig. 7, A and B. Table
1 indicates, for each folding group, the number of dimer-
unfolding simulations in which unbinding occurs (middlecolumn) and the number of dimer-refolding simulations in
which binding occurs (right-hand column). In Table 1, an
unbinding event occurs when the number of intermolecular
contacts between the two gTIM protein chains falls below 20
and a binding event occurs when the number of intermolec-
ular contacts between the two gTIM protein chains increases
to.20. The number 20 was arbitrarily selected to ensure that
the two gTIM protein chains were bound at a level of contact
above random collisions between two unfolded chains.
For dimer unfolding, Table 1 reinforces the data in Fig. 7
A by demonstrating that unbinding never completely occurs
until the gTIM protein chains completely unfold in group A
(middle column). In contrast, for dimer refolding, Table
1 shows that binding can occur in a number of different
folding groups. From Table 1, it is clear that no binding ever
occurs directly from the unfolded ensembles in group A
(through a ‘‘fly-casting’’ mechanism) and only occurs once
folding has led to group B (17). Therefore, some folding
must occur to facilitate binding. However, once the dimer
interface residues between b2 and b3 of group B have folded,
binding can readily occur in later stages of folding (groups
C–F). Therefore, the intermediate populations of groups B–E
in dimer refolding consist of a mixture of monomer and
dimer oligomeric states.
Fig. 8 displays previously published experimental data on
the folding/unfolding of gTIM using MPAX experiments
(34). The MPAX experiment measures the equilibrium
constant between the unfolded (assumed to be alkyl-
exchangeable) and folded (assumed to be unexchangable)
states of individual amino acids in the gTIM protein under
nativelike conditions (low-denaturant concentrations) (63). It
was found that the stability of the gTIM residues fell into
three classes: low (DG1 � 3.7 kcal/mol), medium (DG2 �6.5 kcal/mol), and high (DG3� 8.5 kcal/mol) (34). Since the
rates of iodoacetamide incorporation obey a first-order rate
for all residues studied, it was concluded that the sequential
model below was the most appropriate (34):
DG3 DG2 DG1���! ���! ���!U I2 I1 N ��� ��� ���
Although it is possible that one or both of the intermediates
might be off-pathway, the spatial clustering of medium- and
FIGURE 7 Average number of intramolecular (black lines) or intermo-
lecular (gray lines) contacts obtained from 30 trajectories of (A) dimer un-
folding and (B) dimer refolding. Error boundaries are indicated with black
points for intramolecular contacts and gray points for intermolecular contacts.
TABLE 1 Folding groups where binding or unbinding occurs in
dimer simulations
Folding group
Number of dimer
unfolding simulations
where unbinding occurs
Number of dimer
refolding simulations
where binding occurs
A 30 (100%) 0 (0%)
B 0 (0%) 1 (3%)
C 0 (0%) 8 (27%)
D 0 (0%) 10 (33%)
E 0 (0%) 6 (20%)
F 0 (0%) 5 (17%)
2464 Patel and Finke
Biophysical Journal 93(7) 2457–2471

high-stability residues in the gTIM chain (shown in Fig. 8)
suggests that the above model is reasonable.
Assuming that the above model is correct, the structures of
intermediates I2 and I1 can be deduced from Fig. 8. In Fig. 8,
residues of intermediate I2 are indicated in red and residues
of intermediate I1 in blue. Residues are assumed to be either
‘‘folded’’ or ‘‘unfolded’’ based on the MPAX study. This
large set of experimental data offers a unique opportunity to
evaluate whether the folding pathways predicted by simu-
lations in this study are correct.
Different experimental methods do not measure the pro-
perties of intermediate states with the same sensitivity (64).
For example, an MPAX experiment may not detect the same
number of intermediates as NMR peak shifts. Likewise,
properties measured by simulation, such as Q, may not be
directly proportional with alkyl-exchange propensity in the
MPAX experiment. To avoid such complications, this study
uses a simplistic approach to evaluate whether a residue is
folded or unfolded in a simulation:
Probability. 0:5 ¼ folded ðvalue ¼ 1Þ:Probability, 0:5 ¼ unfolded ðvalue ¼ 0Þ:
In a sense, the simulation must guess 0 or 1 for each of the 47
residues studied with MPAX in Fig. 8. For these 47 residues,
simulation guesses will be evaluated against the ‘‘real’’ 0 or
1 values determined from Fig. 8 for intermediates I2 and I1.
For a complete analysis, all folding groups, A–F, from the
simulation were compared. Furthermore, the four simulation
types (monomer unfolding, monomer refolding, dimer
unfolding, and dimer refolding) were compared. In Fig. 9,
A and B, the percentages of ‘‘correct’’ guesses for the four
simulation types and six folding groups are shown in terms
of how they compare to intermediates I2 (Fig. 9 A) and I1(Fig. 9 B). When the simulations are compared to I2 in Fig. 9
A, it is clear that the early folding groups, A–C, match very
well with the experimental results, whereas the more folded
groups, D–F, fit less well as the number of native contacts
increases. All four simulation types match equally well
within the error of the simulation method.
FIGURE 8 Residues folded in early-folding intermediate 2 (gray points)
and late-folding intermediate 1 (black points) for 47 residues studied with
alkyl-exchange experiments.
FIGURE 9 Percent match of simulation folding groups A–F (Fig. 5) at
predicting experimental intermediates (A) 2 and (B) 1 from Fig. 8. Data
points from simulations of monomer refolding, monomer unfolding, dimer
refolding, and dimer unfolding are slightly offset to aid the eye.
Kinetic Folding Simulations of gTIM 2465
Biophysical Journal 93(7) 2457–2471
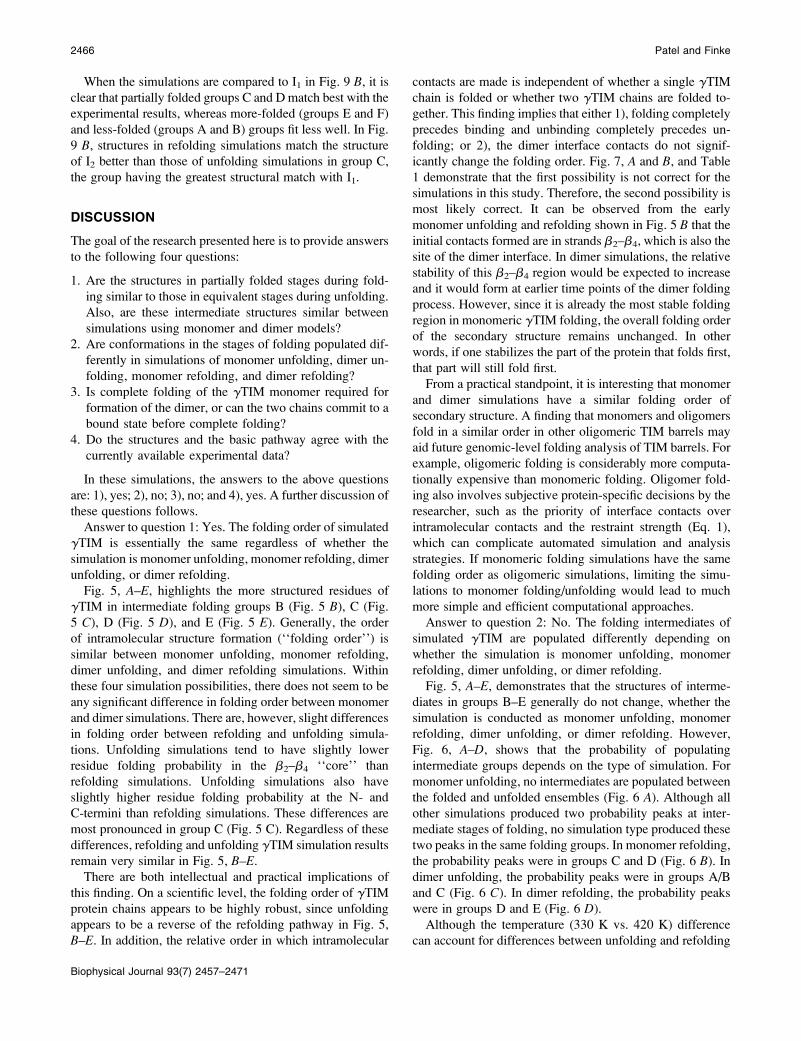
When the simulations are compared to I1 in Fig. 9 B, it isclear that partially folded groups C and D match best with the
experimental results, whereas more-folded (groups E and F)
and less-folded (groups A and B) groups fit less well. In Fig.
9 B, structures in refolding simulations match the structure
of I2 better than those of unfolding simulations in group C,
the group having the greatest structural match with I1.
DISCUSSION
The goal of the research presented here is to provide answers
to the following four questions:
1. Are the structures in partially folded stages during fold-
ing similar to those in equivalent stages during unfolding.
Also, are these intermediate structures similar between
simulations using monomer and dimer models?
2. Are conformations in the stages of folding populated dif-
ferently in simulations of monomer unfolding, dimer un-
folding, monomer refolding, and dimer refolding?
3. Is complete folding of the gTIM monomer required for
formation of the dimer, or can the two chains commit to a
bound state before complete folding?
4. Do the structures and the basic pathway agree with the
currently available experimental data?
In these simulations, the answers to the above questions
are: 1), yes; 2), no; 3), no; and 4), yes. A further discussion of
these questions follows.
Answer to question 1: Yes. The folding order of simulated
gTIM is essentially the same regardless of whether the
simulation is monomer unfolding, monomer refolding, dimer
unfolding, or dimer refolding.
Fig. 5, A–E, highlights the more structured residues of
gTIM in intermediate folding groups B (Fig. 5 B), C (Fig.
5 C), D (Fig. 5 D), and E (Fig. 5 E). Generally, the order
of intramolecular structure formation (‘‘folding order’’) is
similar between monomer unfolding, monomer refolding,
dimer unfolding, and dimer refolding simulations. Within
these four simulation possibilities, there does not seem to be
any significant difference in folding order between monomer
and dimer simulations. There are, however, slight differences
in folding order between refolding and unfolding simula-
tions. Unfolding simulations tend to have slightly lower
residue folding probability in the b2–b4 ‘‘core’’ than
refolding simulations. Unfolding simulations also have
slightly higher residue folding probability at the N- and
C-termini than refolding simulations. These differences are
most pronounced in group C (Fig. 5 C). Regardless of these
differences, refolding and unfolding gTIM simulation results
remain very similar in Fig. 5, B–E.There are both intellectual and practical implications of
this finding. On a scientific level, the folding order of gTIMprotein chains appears to be highly robust, since unfolding
appears to be a reverse of the refolding pathway in Fig. 5,
B–E. In addition, the relative order in which intramolecular
contacts are made is independent of whether a single gTIMchain is folded or whether two gTIM chains are folded to-
gether. This finding implies that either 1), folding completely
precedes binding and unbinding completely precedes un-
folding; or 2), the dimer interface contacts do not signif-
icantly change the folding order. Fig. 7, A and B, and Table
1 demonstrate that the first possibility is not correct for the
simulations in this study. Therefore, the second possibility is
most likely correct. It can be observed from the early
monomer unfolding and refolding shown in Fig. 5 B that the
initial contacts formed are in strands b2–b4, which is also the
site of the dimer interface. In dimer simulations, the relative
stability of this b2–b4 region would be expected to increase
and it would form at earlier time points of the dimer folding
process. However, since it is already the most stable folding
region in monomeric gTIM folding, the overall folding order
of the secondary structure remains unchanged. In other
words, if one stabilizes the part of the protein that folds first,
that part will still fold first.
From a practical standpoint, it is interesting that monomer
and dimer simulations have a similar folding order of
secondary structure. A finding that monomers and oligomers
fold in a similar order in other oligomeric TIM barrels may
aid future genomic-level folding analysis of TIM barrels. For
example, oligomeric folding is considerably more computa-
tionally expensive than monomeric folding. Oligomer fold-
ing also involves subjective protein-specific decisions by the
researcher, such as the priority of interface contacts over
intramolecular contacts and the restraint strength (Eq. 1),
which can complicate automated simulation and analysis
strategies. If monomeric folding simulations have the same
folding order as oligomeric simulations, limiting the simu-
lations to monomer folding/unfolding would lead to much
more simple and efficient computational approaches.
Answer to question 2: No. The folding intermediates of
simulated gTIM are populated differently depending on
whether the simulation is monomer unfolding, monomer
refolding, dimer unfolding, or dimer refolding.
Fig. 5, A–E, demonstrates that the structures of interme-
diates in groups B–E generally do not change, whether the
simulation is conducted as monomer unfolding, monomer
refolding, dimer unfolding, or dimer refolding. However,
Fig. 6, A–D, shows that the probability of populating
intermediate groups depends on the type of simulation. For
monomer unfolding, no intermediates are populated between
the folded and unfolded ensembles (Fig. 6 A). Although all
other simulations produced two probability peaks at inter-
mediate stages of folding, no simulation type produced these
two peaks in the same folding groups. In monomer refolding,
the probability peaks were in groups C and D (Fig. 6 B). Indimer unfolding, the probability peaks were in groups A/B
and C (Fig. 6 C). In dimer refolding, the probability peaks
were in groups D and E (Fig. 6 D).Although the temperature (330 K vs. 420 K) difference
can account for differences between unfolding and refolding
2466 Patel and Finke
Biophysical Journal 93(7) 2457–2471

simulations, the differences between monomer and dimer
group probabilities cannot be explained by thermal stability
differences. In the dimer-unfolding simulations, intermedi-
ates in groups A/B and C are stabilized, a situation which did
not exist in monomer unfolding. In dimer-refolding simula-
tions, intermediates in groups more likely to be involved in
dimer formation are stabilized (groups D and E) over inter-
mediate groups populated in monomer refolding (groups C
and D). Thus, although the folding order shown in Fig.
5, B–E, remains constant in the four different simulation
types, the stability of the intermediate groups B–E, shown in
Fig. 6, A–D, respectively, is not as robust.Answer to question 3: No. Complete folding of the gTIM
monomer is not required to form the dimer.
Fig. 7 A and Table 1 show that partial dimer unfolding can
occur without breaking all contacts at the dimer interface.
This is also directly observed in the sample trajectory in Fig.
4 A. In addition, Table 1 shows that binding can occur duringdimer refolding in the partially folded intermediate groups
B–E, although most binding occurs in groups C–E. Although
there are some differences in dimerized states between the
groups in the unfolding and refolding simulations, partially
unfolded dimers clearly exist in both unfolding and refolding
simulations. In dimer unfolding, partially folded dimers
appear to be obligatory, since dimer dissociation occurs in
group A only when complete unfolding has taken place
(Table 1, middle column). However, in dimer refolding,
partially folded dimers do not seem to be obligatory, since
five refolding trajectories completely fold into group F be-
fore dimerization (Table 1, right-hand column).In the simulations, the reason for this is straightforward.
Late unfolding and early refolding of residues in groups B
and C occurs in the dimer interface region b2–b4 (Fig. 5, Band C). In refolding, once this b2–b4 region is folded,
binding can occur. In unfolding, this b2–b4 region must
completely unfold to release the two bound protein chains.
Although this can explain the gTIM unfolding and folding
pathways in the simulations, experiments have not shown
any evidence of dimeric intermediates in gTIM folding
(33,55,56).
In terms of experimental comparison, equilibrium unfold-
ing experiments do not support a gTIM folding mechanism
involving a partially unfolded dimeric intermediate (33,55,
56). Instead, the proposed model of these studies involves a
single partially unfolded monomeric intermediate (33,55,
56). The experimental evidence for the monomeric interme-
diate rests in a decrease in hydrodynamic radius between the
native state and the intermediate state and also through data
fitting of multiple global spectroscopic probes (33,55,56).
In light of these experimental results, it would seem that
dimeric intermediates in the present simulation studies are
not physically realistic. However, for a number of reasons,
the jury remains out as to whether the experiments and
simulations of gTIM agree or disagree on dimeric interme-
diates.
1. The simulations described here are conducted under ki-
netic conditions and the experiments are conducted under
equilibrium conditions. Due to the size of thegTIMprotein
system, equilibrium simulations were too time-consuming
to be conducted in a reasonable amount of time for the
project, even using the simplified G�o model in this study
(16,65). To address gTIM folding, the simulations were
conducted as ‘‘kinetic experiments’’, involving both
thermal unfolding and refolding (16). These experiments,
which have identified monomeric intermediates, were
conducted under equilibrium conditions (33,55,56). There-
fore, these studies may not be completely appropriate for
a rigorous comparison with the simulations presented
here.
Unfolding and refolding kinetic studies of gTIM have
also been conducted and also support the presence of
intermediates in gTIM folding and unfolding (32,55,66).
However, the oligomeric nature of these kinetic interme-
diates is not known. Future kinetic studies of gTIM may
demonstrate the presence of dimeric intermediates.
2. Simulations are conducted under high protein concentra-
tion. For the dimer simulations to refold in a reasonable
amount of simulation time, a relatively tight restraint
must be employed (Eq. 1). The average distance between
the center of mass of the two unfolded monomers in the
simulations was ;80 A, which implies a highly concen-
trated protein solution. In the simulations, this will
promote binding at earlier times in refolding than would
occur in experiments. Under the more dilute conditions
of the experiments, the simulations will favor monomer
folding before dimerization (33,55,56). Alternatively, if
experiments (0.001–1.0% protein) were able to push the
gTIM concentration near that of the simulations (20–
30% protein), it might be possible to force the gTIMfolding energy landscape to favor a dimeric intermediate
state.
One caveat to this explanation lies in the kinetic sim-
ulations of dimer unfolding. Although equilibrium and
kinetic refolding of gTIM will be affected by gTIM con-
centration, gTIM dimer unfolding will not. Therefore, the
presence of dimeric intermediates in gTIM kinetic un-
folding simulations cannot be explained by the effective
protein concentration of the simulation. Future kinetic
unfolding experiments of gTIM are needed to verify this
finding.
3. Dimeric intermediates may exist in equilibrium experi-
ments. All the equilibrium folding experiments use global
spectroscopic probes that measure average properties of
the gTIM protein (33,55,56). The studies argue for a
monomeric intermediate through data fitting and mea-
surements of hydrodynamic radius, but do not establish a
homogeneous monomeric intermediate population (33,
55,56). Although it is true that these average properties
support the presence of some monomeric intermediates,
it has not been confirmed that this ensemble consists of
Kinetic Folding Simulations of gTIM 2467
Biophysical Journal 93(7) 2457–2471

100% monomeric intermediates. Future studies are
necessary to resolve this issue more clearly.
Answer to question 4: Yes. The folding order matches
well between simulations and MPAX experiments.
At this point, it should be noted that the MPAX study (34)
contrasts slightly with other protein folding studies of gTIM(33,55,56). The MPAX study identifies two equilibrium in-
termediates (34), whereas the other studies only identify one
intermediate (33,55,56). This discrepancy can be accounted
for by the nature of the experiments. MPAX measures the
stability of intermediates under nativelike conditions (,1 M
Gdn-HCl), whereas the other folding studies measure the
stability of intermediates near the unfolding transition
midpoint (1–2 M Gdn-HCl). Using the m-values, extrapo-lation of the DG of the two MPAX intermediates indicates
that their stability is very similar under the conditions of the
other folding studies (DGIU � 1 kcal/mol at 1.5 M Gdn-HCl
for the C41V/C126A variant) (34). Therefore, the 1.5 M
Gdn-HCl ensemble may appear as a single intermediate when
measured with global structural probes such as fluorescence,
circular dichroism, and size-exclusion chromatography. For
purposes of the following simulation-experiment compari-
son, it is assumed that the gTIM folding pathway consists
of the two intermediates I2 and I1 identified with MPAX
experiments (34).
Fig. 9, A and B, shows that the folding simulations have
the potential of being highly predictive of the MPAX ex-
perimental intermediates I2 and I1 in Fig. 8. In groups A–F,
which match best, the agreement is .80% in Fig. 9, A(groups A and B) and B (groups C and D).
The fact that the simulations match the experimental
intermediate structures in some of groups A–F is a first test of
the simulations. The second test is whether the highly pop-
ulated groups in Fig. 6, A–D, are those that match well with
the experiments. Table 2 shows which of groups A–F are
highly populated in each simulation type and their match
with the MPAX experiments. The least folded group iden-
tified with simulations is matched with MPAX experimental
intermediate I2 and the most folded is matched with MPAX
experimental intermediate I1.
Although monomer unfolding simulations passed through
structures with a good match to experimental intermediates
I2 and I1, no intermediates were populated (Fig. 6 A). As aresult, this simulation did not perform as well in predicting
intermediate structures I2 and I1 as the other simulation
types. In good agreement with the MPAX experiments, all
other simulations predicted two intermediates (two high
probability peaks each for Fig. 6, B–D) except for the groupsin which the peaks differ. Monomer refolding predicted
groups C and D (Fig. 6 B), each of which shows an 80%
match. Dimer unfolding predicted one intermediate peak on
the cusp of groups A and B (85% match) and another in
group C (65% match). Dimer refolding predicted groups D
(60% match) and E (65% match).
On the whole, all simulations appeared to capture an order
of folding events that is consistent with MPAX experiments.
However, some simulation types perform better at populat-
ing the intermediate states that match best with the MPAX
experimental intermediates. Clearly, monomer unfolding
was the least successful, since it did not populate any in-
termediates. Using the sum of the two percentage matches
between simulated and experimental intermediates in Table 2
as a score, the next best was dimer refolding (60% 1 65% ¼135%), the second best was dimer unfolding (85% 1 65% ¼150%), and the best predictor of the MPAX intermediates was
monomer refolding (80% 1 80% ¼ 160%).
The reasons for this order of the predictive success of
gTIM simulations—monomer_unfolding , dimer_refold-
ing , dimer_unfolding , monomer_refolding—is not
entirely clear. One would think that the dimer simulations
would be better than the monomer simulations, since this
is a more accurate representation of the gTIM protein in
experiments. One possible reason why monomer refolding
simulations provide a better match than dimer simulations is
that the nature of the MPAX experiment and that of the
simulations are not exactly the same. The MPAX experiment
probes the equilibrium unfolding pathway of gTIM under
conditions favoring the native state with DG , 0 (low
denaturant). No kinetic simulation in this study exactly re-
produces this experiment. Kinetic unfolding simulations
study the unfolding pathway, but under conditions favoring
the unfolded state (high temperature, native state, DG . 0).
On the other hand, kinetic refolding simulations are con-
ducted under conditions favoring the folded state (low
temperature, native state, DG , 0), but initiate from an un-
folded structure, which may lead to slight differences when
comparing simulations and experiments.
All folding and unfolding kinetic gTIM simulations
predict a very similar folding order, as shown in Fig. 5,
B–E. Therefore, it is likely that an equilibrium simulation,
if feasible, would also produce a similar folding order. In
previous studies using G�o models, the folding order has been
shown to be highly conserved between kinetic simulations
and equilibrium simulations (16,61). Therefore, the gTIMfolding order shown in Fig. 5, B–E, is likely to apply also to
the folding of gTIM in equilibrium simulations.
However, the probability of populating different values of
Q (Fig. 6, A–D) does change significantly between unfoldingand refolding simulations, as well as between monomer and
dimer simulations. Although folding order appears to be
robust between different simulation types (Fig. 5, B–E), thestability of the intermediate stages (i.e., ‘‘groups’’ in Fig. 6,
A–D) is not. The successful prediction of monomer refolding
over the dimer simulations may reflect a ‘‘lucky’’ shift in the
stability of Q populations in monomer simulations to regions
C and D, which match well with the MPAX experimental
intermediates.
Regardless of these differences, nearly all the simulation
types show remarkable success in predicting structures
2468 Patel and Finke
Biophysical Journal 93(7) 2457–2471

populated in the gTIM folding/unfolding pathway, as
determined by MPAX (34). Clearly, factoring in the effect
of polypeptide chain entropy between short-range and long-
range contacts through molecular dynamics simulations is
extremely important in capturing the correct folding mech-
anism of gTIM (67).
The generally good agreement between the folding
pathway predicted by G�o-model MD simulations and that
measured with MPAX experiments suggests that the dom-
inant interactions are largely captured through a determin-
istic series of events (MD simulations), since stochastic
events (used in Langevin simulations) were not explicitly
included in the simulation. However, this agreement is not
perfect, since the best match between the simulation and
MPAX experiment is no greater than 90% (region B in Fig. 9
A). Furthermore, the intermediates populated do not consis-
tently populate the regions that match best with experiments
(Fig. 6, A, C, and D). Finally, experiments indicate that the
two gTIM monomers bind later (and unbind earlier) than the
present MD simulations suggest (33,55,56). Including
stochastic events through Langevin simulations may provide
increased agreement with experimental results over the MD
simulations.
Stochastic simulation events would randomly push the
protein chain into conformations that a deterministic MD
simulation might neglect. The random forces in Langevin
simulations would likely alter the probability and structure of
intermediate states populated during an MD simulation,
although these differences are yet unknown. It may be found
that Langevin simulations further improve the match with
experiments compared to the simulations presented here.
On the other hand, increasing the damping constant g in
Langevin dynamics may result in a worse agreement be-
tween simulations and experiments, which would argue
against a significant role of stochastic events in guiding pro-
tein folding. In any case, the degree to which Langevin
dynamics and molecular dynamics (from random initial
conditions) differ for Ca G�o models has not been adequately
explored. A high level of structural detail has been provided
by solvent-exchange experiments, which have probed the
folding pathway of a number of TIM barrels (34,36,40,42).
These folding experiments provide a great opportunity to
systematically explore the role of stochastic events in the
folding of a related family of proteins. Future investigations
will use Langevin dynamics to investigate the impact of
increasing stochastic events on the simulated folding of these
TIM-barrel proteins.
CONCLUSIONS
Computational models of proteins offer many opportunities
to study the vast amount of sequence and structural infor-
mational available to the modern biochemist. Computer-based
studies offer the possibility of rapidly identifying correla-
tions and connections in vast data sets that are not often
realized at the level of the bench biochemist. For computa-
tional approaches to be used effectively, the fundamental
assumptions of the theoretical models employed must prove
to be accurate and reliable at predicting real experimental
results.
In predicting experimental protein folding pathways, the
theoretical G�o model has demonstrated remarkable success
(16,19–25). The G�o model is based on the assumption that
the protein structure has been optimized such that the native
structure is at the global energy minimum of all possible
conformations in aqueous solution (26). In practice, the G�omodel is tested by designing simulations in which all dihe-
drals and long-range contacts of the protein are set to have
minimal energy when they match the x-ray crystal structure.
This protein G�o model is then unfolded and refolded using
molecular dynamics, and the pathway of unfolding and
refolding in simulations is compared to experiments.
G�o models hold a great deal of promise as a key compu-
tational tool to investigate protein folding across different
genomes. A structural class of proteins that is ripe for this
genome-wide investigation is TIM barrels, predominantly
metabolic proteins found in every organism (28). If the G�omodel, or a modified version of the G�o model, is capable of
accurate and repeated prediction of TIM-barrel folding path-
ways, an accurate automated folding analysis of TIM barrel
structures in the PDB will be possible.
This study has performed such a comparison using a G�omodel of gTIM, and demonstrates that the match with
experiments is very good (34). A previous study using the
a-subunit of trptophyan synthase (aTS) also demonstrated
excellent agreement between simulations and experiments
(16). Thus far, the agreement appears excellent between G�o-model simulations, and experimental TIM-barrel folding
looks very promising. However, more work needs to be
done. The study of TIM barrels with residue-specific stru-
ctural information (indole-3-glycerol phosphate synthase
from Sulfolobus solfataricus, aldolase from rabbit, and TIM
from humans) is currently underway. These studies will
reveal whether the folding of other TIM barrels is equally
well captured by the funneled energy landscape of the G�omodel.
The fact that the gTIM G�o model matches the gTIMexperiments supports the idea of an energy landscape of the
TABLE 2 Match between the structures of high-population
folding groups in simulations and MPAX experiments
Simulation Group MPAX intermediate % match
Monomer unfolding No intermediates
Monomer refolding C 2 80
D 1 80
Dimer unfolding A/B 2 85
C 1 65
Dimer refolding D 2 60
E 1 65
The % match for all simulation groups are graphed in Fig. 9, A and B.
Kinetic Folding Simulations of gTIM 2469
Biophysical Journal 93(7) 2457–2471

gTIM protein that is ‘‘funneled’’ to the native state (2).
Furthermore, it also indicates that the energy of each residue-
residue contact is approximately equal throughout the
protein chain. It is conceivable that other non-G�o energy
parameters may also be successful in capturing the correct
folding pathway of gTIM (54,68). However, the fact that the
G�o model does work well at predicting the folding pathways
of gTIM, aTS, and many other proteins testifies to a general
applicability of this model (16,19–25).
We thank Dr. Robert Konecny and the W. M. Keck Foundation for
providing additional computational support through the Keck II Center.
We acknowledge financial support from the Camille and Henry Dreyfus
Foundation (J.M.F.).
REFERENCES
1. Bryngelson, J. D., and P. G. Wolynes. 1987. Spin glasses and thestatistical mechanics of protein folding. Proc. Natl. Acad. Sci. USA.84:7524–7528.
2. Onuchic, J. N., Z. Luthey-Schulten, and P. G. Wolynes. 1997. Theoryof protein folding: the energy landscape perspective. Annu. Rev. Phys.Chem. 48:545–600.
3. Leopold, P. E., M. Montal, and J. N. Onuchic. 1992. Protein foldingfunnels: a kinetic approach to the sequence-structure relationship. Proc.Natl. Acad. Sci. USA. 89:8721–8725.
4. Garel, T., and H. Orland. 1988. Mean-field model for protein folding.Europhys. Lett. (Switzerland). 6:307–310.
5. Shakhnovich, E. I., and A. M. Gutin. 1989. The nonergodic (spin-glass-like) phase of heteropolymer with quenched disordered sequenceof links. Europhys. Lett. (Switzerland). 8:327–332.
6. Dill, K. A., S. Bromberg, K. Yue, K. M. Fiebig, D. P. Yee, P. D.Thomas, and H. S. Chan. 1995. Principles of protein folding—aperspective from simple exact models. Protein Sci. 4:561–602.
7. Karplus, M., and A. Sali. 1995. Theoretical studies of protein foldingand unfolding. Curr. Opin. Struct. Biol. 5:58–73.
8. Camacho, C. J., and D. Thirumalai. 1996. Denaturants can acceleratefolding rates in a class of globular proteins. Protein Sci. 5:1826–1832.
9. Munoz, V., P. A. Thompson, J. Hofrichter, and W. A. Eaton. 1997.Folding dynamics and mechanism of b-hairpin formation. Nature.390:196–199.
10. Yang, W. Y., J. W. Pitera, W. C. Swope, and M. Gruebele. 2004.Heterogeneous Folding of the trpzip hairpin: full atom simulation andexperiment. J. Mol. Biol. 336:241–251.
11. Zagrovic, B., and V. S. Pande. 2003. Solvent viscosity dependenceof the folding rate of a small protein: distributed computing study.J. Comp. Chem. 24:1432–1436.
12. Bursulaya, B. D., and C. L. Brooks. 1999. The folding free energy sur-face of a three-stranded b-sheet protein. J. Am. Chem. Soc. 121:9947–9951.
13. Garcia, A. E., and K. Y. Sanbonmatsu. 2002. a-Helical stabilization byside chain shielding of backbone hydrogen bonds. Proc. Natl. Acad.Sci. USA. 99:2782–2787.
14. Daggett, V., and M. Levitt. 1992. Molecular dynamics simulations ofhelix denaturation. J. Mol. Biol. 223:1121–1138.
15. Garcia, A. E., and J. N. Onuchic. 2003. Folding a protein in acomputer: an atomic description of the folding/unfolding of protein A.Proc. Natl. Acad. Sci. USA. 100:13898–13903.
16. Finke, J. M., and J. N. Onuchic. 2005. Equilibrium and kinetic foldingpathways of a TIM barrel with a funneled energy landscape. Biophys.J. 89:488–505.
17. Levy, Y., S. S. Cho, J. N. Onuchic, and P. G. Wolynes. 2005. Asurvey of flexible protein binding mechanisms and their transition
states using native topology based energy landscapes. J. Mol. Biol.346:1121–1145.
18. Nguyen, H. D., and C. K. Hall. 2005. Kinetics of fibril formation bypolyalanine peptides. J. Biol. Chem. 280:9074–9082.
19. Cheung, M. S., J. M. Finke, B. Callahan, and J. N. Onuchic. 2003.Exploring the interplay between topology and secondary structural for-mation in the protein folding problem. J. Phys. Chem. B. 107:11193–11200.
20. Chan, H. S., and K. A. Dill. 1993. The protein folding problem. Phys.Today. 46:24–32.
21. Clementi, C., P. A. Jennings, and J. N. Onuchic. 2000. How native-state topology affects the folding of dihydrofolate reductase andinterleukin-1b. Proc. Natl. Acad. Sci. USA. 97:5871–5876.
22. Ding, F., N. V. Dokholyan, S. V. Buldyrev, H. E. Stanley, and E. I.Shakhnovich. 2002. Direct molecular dynamics observation of proteinfolding transition state ensemble. Biophys. J. 83:3525–3532.
23. Shea, J. E., J. N. Onuchic, and C. L. Brooks. 1999. Exploring theorigins of topological frustration: design of a minimally frustratedmodel of fragment B of protein A. Proc. Natl. Acad. Sci. USA. 96:12512–12517.
24. Klimov, D. K., and D. Thirumalai. 2000. Mechanisms and kinetics ofb-hairpin formation. Proc. Natl. Acad. Sci. USA. 97:2544–2549.
25. Nymeyer, H., N. D. Socci, and J. N. Onuchic. 2000. Landscapeapproaches for determining the ensemble of folding transition states:success and failure hinge on the degree of frustration. Proc. Natl. Acad.Sci. USA. 97:634–639.
26. Go, N. 1983. Theoretical studies of protein folding. Annu. Rev.Biophys. Bioeng. 12:183–210.
27. Klimov, D. K., and D. Thirumalai. 2003. Dissecting the assembly ofab(16–22) amyloid peptides into antiparallel b sheets. Structure. 11:295–307.
28. Sterner, R., and B. Hocker. 2005. Catalytic versatility, stability, andevolution of the (ba)8-barrel enzyme fold. Chem. Rev. 105:4038–4055.
29. Zitzewitz, J. A., P. J. Gualfetti, I. A. Perkons, S. A. Wasta, and C. R.Matthews. 1999. Identifying the structural boundaries of independentfolding domains in the a-subunit of tryptophan synthase, a b/a barrelprotein. Protein Sci. 8:1200–1209.
30. Eder, J., and K. Kirschner. 1992. Stable substructures of eightfold ba-barrel proteins: fragment complementation of phosphoribosylanthra-nilate isomerase. Biochemistry. 31:3617–3625.
31. Soberon, X., P. Fuentes-Gallego, and G. Saab-Rincon. 2004. In vivofragment complementation of a (b/a)(8) barrel protein: generation ofvariability by recombination. FEBS Lett. 560:167–172.
32. Benitez-Cardoza, C. G., A. Rojo-Dominguez, and A. Hernandez-Arana. 2001. Temperature-induced denaturation and renaturation oftriosephosphate isomerase from Saccharomyces cerevisiae: evidence ofdimerization coupled to refolding of the thermally unfolded protein.Biochemistry. 40:9049–9058.
33. Najera, H., M. Costas, and D. A. Fernandez-Velasco. 2003. Thermo-dynamic characterization of yeast triosephosphate isomerase refolding:insights into the interplay between function and stability as reasons forthe oligomeric nature of the enzyme. Biochem. J. 370:785–792.
34. Silverman, J. A., and P. B. Harbury. 2002. The equilibrium unfoldingpathway of a (b/a)8 barrel. J. Mol. Biol. 324:1031–1040.
35. Chanez-Cardenas, M. E., D. A. Fernandez-Velasco, E. Vazquez-Contreras, R. Coria, G. Saab-Rincon, and R. Perez-Montfort. 2002.Unfolding of triosephosphate isomerase from Trypanosoma brucei:identification of intermediates and insight into the denaturation path-way using tryptophan mutants. Arch. Biochem. Biophys. 399:117–129.
36. Vadrevu, R., C. J. Falzone, and C. R. Matthews. 2003. Partial NMRassignments and secondary structure mapping of the isolated a subunitof Escherichia coli tryptophan synthase, a 29-kD TIM barrel protein.Protein Sci. 12:185–191.
37. Beasty, A. M., and C. R. Matthews. 1985. Characterization of an earlyintermediate in the folding of the a subunit of tryptophan synthase byhydrogen exchange measurement. Biochemistry. 24:3547–3553.
2470 Patel and Finke
Biophysical Journal 93(7) 2457–2471

38. Forsyth, W. R., and C. R. Matthews. 2002. Folding mechanism ofindole-3-glycerol phosphate synthase from Sulfolobus solfataricus: atest of the conservation of folding mechanisms hypothesis in (b(a))(8)barrels. J. Mol. Biol. 320:1119–1133.
39. Jasanoff, A., B. Davis, and A. R. Fersht. 1994. Detection of an interme-diate in the folding of the (ba)8-barrel N-(59-phosphoribosyl)anthranilateisomerase from Escherichia coli. Biochemistry. 33:6350–6355.
40. Pan, H., and D. L. Smith. 2003. Quaternary structure of aldolase leadsto differences in its folding and unfolding intermediates. Biochemistry.42:5713–5721.
41. Deng, Y., and D. L. Smith. 1999. Rate and equilibrium constants forprotein unfolding and refolding determined by hydrogen exchange-mass spectrometry. Anal. Biochem. 276:150–160.
42. Pan, H., A. S. Raza, and D. L. Smith. 2004. Equilibrium and kineticfolding of rabbit muscle triosephosphate isomerase by hydrogenexchange mass spectrometry. J. Mol. Biol. 336:1251–1263.
43. Rojsajjakul, T., P. Wintrode, R. Vadrevu, C. Robert Matthews, andD. L. Smith. 2004. Multi-state unfolding of the a subunit of tryptophansynthase, a TIM barrel protein: insights into the secondary structure ofthe stable equilibrium intermediates by hydrogen exchange mass spec-trometry. J. Mol. Biol. 341:241–253.
44. Saab-Rincon, G., P. J. Gualfetti, and C. R. Matthews. 1996. Mutagenicand thermodynamic analyses of residual structure in the a-subunit oftryptophan synthase. Biochemistry. 35:1988–1994.
45. Gualfetti, P. J., O. Bilsel, and C. R. Matthews. 1999. The progressivedevelopment of structure and stability during the equilibrium folding ofthe a subunit of tryptophan synthase from Escherichia coli. ProteinSci. 8:1623–1635.
46. Bilsel, O., J. A. Zitzewitz, K. E. Bowers, and C. R. Matthews. 1999.Folding mechanism of the a-subunit of tryptophan synthase, an a/bbarrel protein: global analysis highlights the interconversion of mul-tiple native, intermediate, and unfolded forms through parallel chan-nels. Biochemistry. 38:1018–1029.
47. Wu, Y., and C. R. Matthews. 2003. Proline replacements and thesimplification of the complex, parallel channel folding mechanism forthe a subunit of Trp synthase, a TIM barrel protein. J. Mol. Biol. 330:1131–1144.
48. Sanchez del Pino, M. M., and A. R. Fersht. 1997. Nonsequential un-folding of the a/b barrel protein indole-3-glycerol-phosphate synthase.Biochemistry. 36:5560–5565.
49. Andreotti, G., M. V. Cubellis, M. D. Palo, D. Fessas, G. Sannia, and G.Marino. 1997. Stability of a thermophilic TIM-barrel enzyme: indole-3-glycerol phosphate synthase from the thermophilic archaeonSulfolobus solfataricus. Biochem. J. 323:259–264.
50. Tsuji, T., B. A. Chrunyk, X. Chen, and C. R. Matthews. 1993. Muta-genic analysis of the interior packing of an a/b barrel protein. Effectson the stabilities and rates of interconversion of the native and partiallyfolded forms of the a subunit of tryptophan synthase. Biochemistry.32:5566–5575.
51. Anderson, W. L., and D. B. Wetlaufer. 1976. The folding pathway ofreduced lysozyme. J. Biol. Chem. 251:3147–3153.
52. Finke, J. M., and P. A. Jennings. 2001. Early aggregated states in thefolding of interleukin-1b. J. Biol. Phys. 27:119–131.
53. Clementi, C., H. Nymeyer, and J. N. Onuchic. 2000. Topologicaland energetic factors: what determines the structural details of thetransition state ensemble and ‘‘en-route’’ intermediates for protein
folding? An investigation for small globular proteins. J. Mol. Biol. 298:937–953.
54. Godzik, A., J. Skolnick, and A. Kolinski. 1992. Simulations of thefolding pathway of triose phosphate isomerase-type a/b barrel proteins.Proc. Natl. Acad. Sci. USA. 89:2629–2633.
55. Vazquez-Contreras, E., R. A. Zubillaga, G. Mendoza-Hernandez, M.Costas, and D. A. Fernandez-Velasco. 2000. Equilibrium unfolding ofyeast triosephosphate isomerase: a monomeric intermediate in guani-dine-HCl and two-state behavior in urea. Protein Pept. Lett. 7:57–64.
56. Morgan, C. J., D. K. Wilkins, L. J. Smith, Y. Kawata, and C. M.Dobson. 2000. A compact monomeric intermediate identified by NMRin the denaturation of dimeric triose phosphate isomerase. J. Mol. Biol.300:11–16.
57. Pearlman, D. A., D. A. Case, J. W. Caldwell, W. R. Ross, T. E.Cheatham III, S. DeBolt, D. Ferguson, G. Seibel, and P. A. Kollman.1995. AMBER, a computer program for applying molecular mechan-ics, normal mode analysis, molecular dynamics and free energycalculations to elucidate the structures and energies of molecules.Comp. Phys. Commun. 91:1–41.
58. Berendsen, H. J. 1984. Molecular dynamics with coupling to an ex-ternal bath. J. Chem. Phys. 81:3684–3690.
59. Dima, R. I., and D. Thirumalai. 2002. Exploring protein aggregationand self-propagation using lattice models: phase diagram and kinetics.Protein Sci. 11:1036–1049.
60. Yang, S., S. S. Cho, Y. Levy, M. S. Cheung, H. Levine, P. G. Wolynes,and J. N. Onuchic. 2004. Domain swapping is a consequence ofminimal frustration. Proc. Natl. Acad. Sci. USA. 101:13786–13791.
61. Finke, J. M., M. S. Cheung, and J. N. Onuchic. 2004. A structuralmodel of polyglutamine determined from a host-guest method com-bining experiments and landscape theory. Biophys. J. 87:1900–1918.
62. Sobolev, V., A. Sorokine, J. Prilusky, E. E. Abola, and M. Edelman.1999. Automated analysis of interatomic contacts in proteins. Bioinfor-matics. 15:327–332.
63. Silverman, J. A., and P. B. Harbury. 2002. Rapid mapping of proteinstructure, interactions, and ligand binding by misincorporation proton-alkyl exchange. J. Biol. Chem. 277:30968–30975.
64. Finn, B. E., X. Chen, P. A. Jennings, S. M. Saalau-Bethel, and C. R.Matthews. 1992. Principles of protein stability. Part 1—reversibleunfolding of proteins: kinetic and thermodynamic analysis. In ProteinEngineering: A Practical Approach. A. R. Rees, R. Wetzel, and J. E.Sternberg, editors. JRL Press, Oxford, U.K. 167–189.
65. Gosavi, S., L. L. Chavez, P. A. Jennings, and J. N. Onuchic. 2006.Topological frustration and the folding of interleukin-1 b. J. Mol. Biol.357:986–996.
66. Gonzalez-Mondragon, E., R. A. Zubillaga, E. Saavedra, M. E. Chanez-Cardenas, R. Perez-Montfort, and A. Hernandez-Arana. 2004. Con-served cysteine 126 in triosephosphate isomerase is required not forenzymatic activity but for proper folding and stability. Biochemistry.43:3255–3263.
67. Suzuki, Y., and J. N. Onuchic. 2005. Modeling the interplay betweengeometrical and energetic effects in protein folding. J. Phys. Chem. BCondens. Matter Mater. Surf. Interfaces Biophys. 109:16503–16510.
68. Hardin, C., M. P. Eastwood, M. C. Prentiss, Z. Luthey-Schulten, andP. G. Wolynes. 2003. Associative memory Hamiltonians for structureprediction without homology: a/bproteins. Proc. Natl. Acad. Sci. USA.100:1679–1684.
Kinetic Folding Simulations of gTIM 2471
Biophysical Journal 93(7) 2457–2471
Copyright © 2022 FDOKUMEN