IMPROVE Unfolding next generation demand-side information ...
356
Department of the Environment, Transport, Energy and Communication DETEC Swiss Federal Office of Energy SFOE Energy Research Projet IMPROVE, S. Citherlet et al., HEIG-VD Final Report IMPROVE Unfolding next generation demand-side information (DSI) models for energy bills
-
Upload
khangminh22 -
Category
Documents
-
view
2 -
download
0
Transcript of IMPROVE Unfolding next generation demand-side information ...

Department of the Environment,
Transport, Energy and Communication DETEC
Swiss Federal Office of Energy SFOE
Energy Research
Projet IMPROVE, S. Citherlet et al., HEIG-VD
Final Report
IMPROVE
Unfolding next generation demand-side information (DSI) models for energy bills
Date: 15th January 2019
Place: Bern
Publisher:
Swiss Federal Office of Energy SFOE
Research Programme XY
CH-3003 Bern
www.bfe.admin.ch
Agents:
FHNW / IEBau, CH-4132 Muttenz
http://www.fhnw.ch
HEIG-VD / IGT-LESBAT
CH-1401 Yverdon-les-Bains
https://heig-vd.ch
SUPSI / ISAAC, CH-6952 Canobbio
http://www.supsi.ch/isaac
ZHAW / INE 8401 Winterthur
http://www.zhaw.ch/ine
Authors:
Roberta Castri, [email protected]
Francesca Cellina, [email protected]
Sara Eicher, [email protected]
Nikolett Kovacs, [email protected]
Jürg Bichsel, [email protected]
Vicente Carabias, [email protected]
Stephane Citherlet, [email protected]
Dominique Kunz, [email protected]
Pierryves Padey, [email protected]
Uros Tomic, [email protected]
SFOE Head of domain: A. Eckmanns, SFOE, CH-3003 Bern, [email protected]
SFOE Programme manager: R. Moser, Enerconom AG,CH-3001 Bern
SFOE contract number : SI/501481-01
The authors of this report bears the entire responsibility for the content and for the conclusions drawn therefrom.
Projet IMPROVE, S. Citherlet et al., HEIG-VD

3
Table des matières
1 RÉSUMÉ 4
2 ZUSAMMENFASSUNG 5
3 ABSTRACT 6
4 INTRODUCTION 7
5 GOALS OF THE PROJECT 8
6 ENERGY CONSUMERS BEHAVIOUR 10
7 EXISTING DSI IN SWITZERLAND 16
8 EXISTING DSI IN FOREIGN COUNTRIES 57
9 FROM THE BEST PRACTICES INTO IMROVE SOLUTIONS 98
10 CONSUMER SATISFACTION SURVEY 115
11 RECOMMENDATION FOR UTILITIES 162
12 NEXT STEP 177
13 CONCLUSION 188
14 ACKNOWLEDGMENTS 191
15 NATIONAL COLLABORATION 192
16 INTERNATIONAL COLLABORATION 193
17 REFERENCES 194
APPENDICES

4
1 Résumé
En Suisse, la plupart des informations relatives à la consommation d’énergie disponibles sur les factures
énergétiques correspondent aux exigences légales minimales imposées par les réglementations
nationales. Par conséquent, les factures suisses sont souvent très similaires en termes de contenu et de
présentation avec un tableau de données. Ils ne contiennent pratiquement jamais de point de comparaison
avec laquelle la consommation du ménage pourrait être comparée.
Ce manque d’information n’aide pas les clients à évaluer leur niveau de consommation d’énergie et donc
ne les encourage pas à changer leur comportement afin de réduir, pour le même confort, leurs besoins
énergétiques, comme requis par la stratégie énergétique 2050 fixée par le Conseil fédéral suisse.
L'objectif du projet IMPROVE est de collecter et d'identifier les meilleures pratiques en matière de factures
énergétiques suisses et étrangères, d'élaborer différentes présentations de ces factures et d'évaluer
l'intérêt des consommateurs resp. des fournisseurs d’énergie, à recevoir et à mettre en œuvre des
améliorations possibles sur les factures.
Pour atteindre cet objectif, plusieurs activités ont été menées, telles qu'une recherche bibliographique, la
collecte et l'analyse de 91 factures de services énergétiques suisses et de 175 factures de services
énergétiques étrangers, ou l'organisation d'entretiens et d'ateliers avec certains de ces fournisseurs. Sur
la base des résultats, différentes propositions d'amélioration des factures énergétiques ont été élaborées.
Un premier sondage national a été mené, pour analyser la perception qu'ont les consommateurs suisses
de leur facture énergétique actuelle, pour évaluer leur intérêt à recevoir des informations supplémentaires
concernant leur consommation énergétique sur leur facture et également pour avoir leur avis sur de
nouvelles propositions d’améliorations de leur facture. Puis, un second sondage national a été mené pour
évaluer l'intérêt des fournisseurs d’énergie ainsi que les avantages et inconvénients (coût, disponibilité des
données, etc.) de la mise en œuvre de chacune des factures énergétiques améliorées conçues dans le
cadre du projet IMPROVE.
Enfin, une liste de recommandations a été élaborée, tenant compte des idées et suggestions des
consommateurs et des fournisseurs énergétiques, indiquant les voies possibles pour une évaluation à
grande échelle de leur efficacité en therme de mesure d'économie d'énergie.

5
2 Zusammenfassung
In der Schweiz entsprechen die meisten auf den Energierechnungen verfügbaren energiebezogenen
Informationen den gesetzlichen Mindestanforderungen. Dadurch gleichen sich die Rechnungen
hinsichtlich Inhalt und werden meist in Form einer Datentabelle erstellt. Fast nie enthalten sie Benchmark-
Werte, mit denen der Haushaltsverbrauch verglichen werden kann.
Diese fehlenden Informationen behindern eine Beurteilung und Optimierung des Energiebedarfs durch die
Verbraucher. Damit tragen die Energierechnungen auch nicht dazu bei, die vom Bundesrat festgelegte
Energiestrategie 2050 zu erreichen.
Ziel des IMPROVE-Projekts war es, vorbildliche Ansätze bei Energierechnungen von Schweizer und
ausländischen Energieversorgern zu sammeln und zu analysieren, verschiedene Layouts von Rechnungen
zu entwickeln und die Interessen von Nutzern und Energiewerken bezüglich Verbesserungspotentialen auf
den Rechnungen zu erheben.
Als Beitrag zu diesem Ziel wurde eine Literaturrecherche durchgeführt, 91 Rechnungen von Schweizer und
175 Rechnungen von ausländischen Versorgern gesammelt und analysiert sowie Interviews und
Workshops mit einigen Schweizer Energieversorgern durchgeführt. Basierend auf den Ergebnissen wurden
verschiedene Vorschläge zur Verbesserung der Energierechnungen entwickelt.
Anschließend wurde eine erste nationale Umfrage durchgeführt, um die Wahrnehmung von Verbrauchern
ihrer heutigen Energierechnungen zu analysieren. Ebenfalls wurde erhoben, ob die Verbraucher Interesse
an zusätzlichen energiebezogenen Informationen auf ihrer Rechnung haben und wie sie die Vorschläge
des Projektes IMPROVE dazu beurteilen. In einer zweiten Umfrage wurden die Interessen der
Energieversorger und ihre Beurteilung der Projekt-Vorschläge zur Verbesserung der Energierechnungen
abgefragt. Der Fokus lag dabei unter anderem auf den Kosten und der Daten-Verfügbarkeit bei einer
allfälligen Umsetzung.
Abschließend wurde eine Liste mit Empfehlungen erstellt, in der die Rückmeldungen und Vorschläge von
Kunden und Versorgungsunternehmen berücksichtigt wurden. Diese beinhaltet die Angabe möglicher
Wege für eine umfassendere Bewertung ihrer Effizienz als Energiesparmaßnahme.

6
3 Abstract
In Switzerland, most of the energy related information available on the energy bills corresponds to the
minimum legal requirements imposed by national regulations. Consequently, Swiss bills are often very
similar in terms of contents and presentation with a table of data. They barely never include a benchmark
against which the household consumption could be compared.
This lack of information does not help consumers to evaluate their level of energy consumption and makes
an energy bill not particularly supportive of behaviour change to reduce, for the same confort, their energy
needs, which is required to achieve the Energy Strategy 2050 set by the Swiss Federal Council.
The aim of the IMPROVE project was to collect and identify best practices in Swiss and foreign energy bills,
to develop different energy bill’s layouts and to evaluate consumers’ and utilities’ interest to receive and
implement possible enhancement to energy bills.
To achieve this goal, several activities were conducted such as a literature review, collecting and analysing
91 bills from Swiss utilities and 175 from foreign utilities, or undertaking interviews and workshops with
some Swiss utilities. Based on the findings different proposals of energy bill enhancements were developed.
Then a first national survey was conducted to analyse the Swiss energy consumers’ perception of their
current energy bill and to gauge their interest to receive additional energy related information on their bill
and their acceptance of the proposed energy bill’s layouts. A second national survey was conducted to
assess utilities’ interest and the advantages and drawbacks (cost, data availability, etc.) to implement each
of the enhanced energy bill’s layouts designed during the IMPROVE project.
Finally, a list of recommendations was elaborated, taking into account insights and suggestions from both
customers and utilities, indicating possible pathways for a large scale assessment of their efficiency as an
energy saving measure.

7
4 Introduction
The Swiss Energy Strategy 2050 aims to increase the use of renewable energy and the energy efficiency of buildings, mobility, industry and appliances (Swiss Federal Office Of Energy, 2017). An additional important element of this strategy is the reduction of the energy demand in Swiss households, which requires a change in energy consumption behaviour. Consumer behaviour is also one of the main topics within the research program “Energy in Buildings” of the Swiss Federal Office of Energy (SFOE). The consumers are affecting the energy demand of modern buildings more than the construction quality. However the research of the relation between consumption behaviour and possible influences are still at the beginning.
An important driver for promoting the change of energy consumption behaviour of private households can be seen in the information available for the consumers on his energy consumption. This information can rise the consumer’s awareness on his level of energy consumption and, to encourage him to find information on how to reduce his energy consumption and at the end to target the most efficient measures he can enforce.
Before to go further, it is relevant to clarify the two following important concepts for a better understanding of the current report.
The demand-side information (DSI): energy DSI is defined as information about customers’ use of energy (Ford, 1990). It includes any possible mean to provide this information, including the energy bill, smart–meter reading, webportal recording the household energy consumption history, a dedicated smartphone app, etc.
The demand-side management (DSM): DSM is defined as planning, implementation, and monitoring of those utility activities designed to influence customer use of energy in ways that will produce desired changes in the utility`s load shape, i.e., changes in the time pattern and magnitude of a utility`s load (Gellings, 1985). For the consumers, it correspond as any information (leaflet, webpage, etc.) that could suggest a solution to reduce the energy consumption.
As DSI and DSM measures are mostly applied mutually, in some cases it is challenging to distinguish between these two concepts. In the IMPROVE project the considered DSI is the energy bill, as the invoice is the principal source of information for the consumers and any consumers received an invoice at a regular time step. In addition any enhancement of the energy bill information, will be visible for all consumers. This is not the case for other DSI or DSM, which requires a conscious desire for information seeking, and an addition physical action to get the information (connection to a webportal, access the smart-metering, consult a smartphone to access a dedicated application, ….). These additional actions to access the information requires additional infrastructure and are interesting for people who are sensitive to energy efficiency.
Figure 1 illustrates the distinction between DSI and DSM and used in the IMPROVE project. The DSI should raise the awareness of the consumer regarding tits energy consumption and the DSM will help the consumers to target possible solution that he can apply in his daily life based on addition information provided by utilities (DSM).
Figure 1: Distinction between DSI and DSM.
Research on ways to enhance the utility bill so as to give customers more control over their energy use has been going on since at least the 1980s, when utility companies first introduced Demand-Side Management (DSM) programmes which aimed at stimulating customers to modify their consumption patterns, both in the period of the day time and in the overall amount of energy consumed (Gellings and Chamberlin, 1988). Such DSM programmes have recently been regarded as even more valuable and powerful tools, now that it is widely acknowledged that the society as a whole, and therefore customers as well, play a role towards carrying out the energy transition and achieving international climate and environmental protection goals.
IMPROVE
Energy consumedInvoice sent by the utility
(billing + energy consumption information)
The consumer pays more attention to energy
saving solutions
The consumer undertakes actions to reduce his energy
consumption
Demand-Side information (DSI) Demand-Side Management (DSM)
The consumer process the invoice

8
Since the scope for motivating households to change their energy consumption through informative billing can dependent on national legislation and technology level, it is important to conduct country-specific analyses in order to develop tailored recommendations. Against this background, the potential of low cost, quickly realisable measures to improve information on energy bills in order to motivate households to reduce their energy consumption has been assessed for the Swiss context. As an outlook, some ideas of what the trends of digitalization and market evolution might imply for demand-side information (DSI) measures in general and energy billing in particular need to be clarified.
5 Goals of the project
The point of departure of the IMPROVE project is the information gap between utilities and their customers: the utilities possess more and more detailed energery metering data, out of which only a minor part is provided to the customers through billing. They also provide more and more DSM to help consumers to reduce their energy consumption. On the one hand customers strive for simplicity and transparency but do not want to be overloaded with the information regarding their own consumption in too much detail. However, by deploying appealing visual elements, designs and taking advantage of new IT and metering technologies it becomes possible to present a large quantity of information in a simple, transparent and appealing way, which could increase perceptiveness of the customers and possibly motivate them to rethink their energy-related behaviour.
In order to get an overview of the state of the art in the demand-side information (DSI) field in Switzerland and abroad and to identify improvement potentials, the project IMPROVE has been initiated by four Swiss universities of applied sciences: HES-SO, SUPSI, FHNW and ZHAW. This project also includes eleven energy utilities disseminated around Switzerland, who kindly accepted to share their vision to enhance the information provided on their clients’ energy bill and to disseminate a consumers’ survey developed during the project to better understand the consumer’s expectation in term of energy related information available on their bill, in the national context.
The objectives of the IMPROVE project is to assess the interest of enhancing the information available on the energy bill (DSI) of the swiss households as a trigger to rise their awareness on their energy consumption level and to encourage them for changing their behaviour by applying energy efficient solutions provided by the energy utilities (DSM). Therefore, it becomes essential understanding if and how utility companies are providing customers with information on their energy consumption patterns or if the way such information is provided is effective in increasing customer awareness and in motivating them to engage in energy-saving actions. It is therefore relevant to gain a broader insight into the information contents and design elements of energy bill currently provided by energy utilities in Switzerland, Europe and overseas, in order to allow the identification and categorization of existing practices. This review of existing energy bill practice, will then be used to evaluate the potential of creating consumer’s awareness regarding its level of energy consumption. Based on these results, different DSI for energy bills will be proposed and submitted to a panel of consumers to evaluate their relevance. The results of the consumers’ survey will be used to support the elaboration of recommendations for energy utilities.
The present report is divided into the following chapters:
The chapter 6 presents a literature review on the important factors affecting the energy consumers’ behaviour, including different approaches (models) developed to better evaluate the connection between the level of information and the consumer’s attitude in the energy context.
The chapter 7 aims to analyze the DSI practice on energy utilities’ bill in Switzerland. In order to identify and characterize DSI practice in Switzerland, a literature review, an online survey for energy utilities finally some interviews with decision makers in energy utilities have been carried out. This allowed to identify a set of indicators used in the energy bills and to make a categorization of proposed energy related information, as a frame of reference to assess energy bills.
The chapter 8 presents DSI practice from on energy utilities’ bill from European and overseas countries. First, a literature review was carried out, in order to identify practices and elements characterizing DSI practice. This allowed to identify a set of indicators used in the energy bills and to make a categorization of proposed energy related information, as a frame of reference to assess energy bills. In parallel, the data collection was also performed with an online survey questionnaire

9
targeting European and overseas utility companies, an Internet search on utility companies’ websites and an informal collection of energy bills from the networks of personal contacts of the researchers involved in the IMPROVE projects.
The aim of the chapter 9 is to developed different information layout to be displayed on energy bill to help consumers to have a better evaluation of their energy consumption level. To achieve this sensitive goal, several activates have been performed. First, a literature review has been undertake on energy-related behaviour, behaviour change models and energy feedback in order to better understand which elements constitute an effective DSI for energy consumers and their relative importance from the scientific point of view. Secondly, a complementary desk (analysis of DSI pilot projects) and field (expert interviews with representatives of two utilities from north-eastern Switzerland) has been conducted. Finally all the previous findings have used to suggest five different enhanced energy related information for energy bill. The consumers’ interest in these solution has been evaluated in the customer satisfaction survey (chapter 6)
The chapter 10 presents the procedure and the results of a national survey that was conducted to gauge energy users’ opinion on the type of energy related information currently available in their energy bill. The survey aims also to evaluate consumers’ interest to improve knowledge and behaviours towards their energy consumption. The focus is both on electricity and on heating consumption information as evidence suggests that little effort has been made to improve household heating information due to difficulties in getting appropriate feedback. In addition, the survey gathers views on medium and mode of presentation preferences of consumers as research indicated that most experimental studies do not seem to reflect these aspects.
The chapter 11 aimed to frame utilities’ needs and concerns in the context of enhanced energy billing and possible recommendations to be made to Swiss utilities for future improvements of DSI. Thus, an online survey was launched involving a wide network of Swiss utilities to explore their position in regards to the feasibility, data availability, potential costs and benefits related to the implementation of the six IMPROVE Solutions proposed within this research project as possible approaches to improve energy billing information. In total, 48 energy utilities from all over Switzerland replied to the survey, making it possible to gather some useful insights on the matter. This input was further enriched with feedback gathered from specific workshops hosting those energy utilities officially collaborating as partners in the research project. In this occasion, a more in-depth discussion of the IMPROVE Solutions occurred and results gathered from the customers’ perspective (chapter 10) were also presented and integrated. This enabled the elaboration of final recommendations, which take into account both customers’ and utilities’ insights and suggestions.
The final chapter 12 aims to suggest some pathways in order to develop, implement and test advanced DSI in Switzerland, based on the results collected in the present project. Regarding DSI and future possible implementation, both applications (electricity and thermal) have been considered. Based on an identification of the key aspects to consider when developing DSI approach for energy, two possible implementation ways have been proposed regarding 1) electricity and 2) thermal energy consumption. It describes why thermal energy DSI might be harder to implement since it requires to collect and process more data while it also requires to interact with more stakeholders and heterogeneity of situations. Conversely, DSI related to electricity appear to be “simpler” to implement even if it requires to deal with more constrained communication’s channel (billing format constrained also). Both implementations are of interest and could be tested as depicted in this final chapter.
All these chapters are detailed here after.

10
6 Energy consumers behaviour
The energy consumption behaviour of consumers is determined by a complex interaction of different influencing factors. Behavioural models can help to deal with this complexity and accordingly to understand why consumers act as they do. Selected models and applied approaches are shown in the following sections for giving an insight of what determines energy consumption behaviour and how behaviour change can be initiated.
In many behaviour change models information is an important factor. As in the below shown model of pro-environmental behaviour, these models are linear: Information generates knowledge, knowledge forms attitudes, attitudes trigger behaviours (Kollmuss and Agyeman, 2002). The popular AIDA model in marketing theory (Awareness, Interest, Decision, Action) is another example of such an information-based rational choice model (Darnton, 2008).
Environmental knowledge
Environmental attitude
Pro-environmental behaviour
Figure 2: model of pro-environmental behaviour (Kollmuss and Agyeman, 2002).
In practice, information alone is insufficient to lead to an action. Also, the relationship between attitudes and behaviour is often less strong. Usually attitudes affect the behaviour, but sometimes it seems to be the other way around. This can exemplarily be observed in environmental issues. As an example: “…why, if people care about polar bears, they still drive SUVs” (Monroe et al., 2008). The “Value Action Gap” describes this difference between attitudes and behaviour. Therefore, other models are used in social-psychology, which consider the “Value Action Gap” and other factors determining the behaviour (Darnton, 2008). A widely used social-psychological model is the “Theory of Planned Behaviour” (TPB), illustrated in Figure 3. It states that not only the attitude towards the behaviour but the subjective norms and perceived behavioural control as well, influence behavioural intention and behaviour. The attitudes toward the behaviour are shaped by the beliefs about the outcomes and their evaluation. The relative importance of the attitude and the norm is further influencing the behavioural intention, which leads to behaviour (Ajzen, 1991).
Figure 3: Theory of Planned Behaviour (TPB) (Darnton, 2008).

11
Due to their strong focus on psychological factors, most of the social-psychological models such as the TPB do not include external factors. However, to describe the energy consumption behaviour of household consumers, external factors can play a considerable role. Therefore, the European Environment Agency adapted the “Needs Opportunities Abilities” model of consumer behaviour (Gatersleben and Vlek, 1998) for the use in the energy consumption context.
Figure 4: Main factors influencing consumer behaviour and emergence of consumption (European Environment Agency, 2013).
This model includes external factors in addition to behavioural determinants suggested by the TPB. It states that the relationships between the various factors influencing behaviour and consumption practices are dynamic. They change over time and are somewhat irrational and to some extent unpredictable (European Environment Agency, 2013).
A different approach is suggested by the Norm Activation Model. This model acknowledges that in order to sustain pro-environmental behaviour, consumers need to be motivated by normative reasons instead of incentives to prevent reversal to the original behaviour (De Young, 2000). As illustrated in Figure 5, the model suggests that information influences personal norms and values. These are weighted in conjunction with other motivational factors, such as social norms and values and external incentives. This weighting process results in a decision, which in turn leads to action.
Figure 5: Norm activation model, interpreted by Hemmes et al. (2012).

12
As it can be seen, social science models like these can improve our understanding of individual and societal responses to behaviour change initiatives (European Environment Agency, 2013). These models can be used in the field of energy consumption behaviour for conceiving effective consumer information models. And there will be used in the current project to propose new possible DSI for energy bill, called here after IMPROVE solutions, that has been evaluated with a national survey that was sent by the partner utilities to a panel of consumers.
6.1 Feedback and Demand-Side Information (DSI)
As stated in behavioural models and in behaviour change approaches, information and feedback are important elements to enable behaviour change. Information, as a widely used strategy to promote efficient energy consumption behaviour, can be classified in general information about energy-related problems, or specific information about possible solutions, such as information about possible energy-saving measures (Abrahamse et al., 2005). Information is also necessary to make consumers aware of their current use, link their behaviour and consumption and reduce energy consumption (Matthies, 2005). Therefore feedback is often applied to promote an efficient energy consumption by giving households information about their consumption or energy savings (Abrahamse et al., 2005). In accordance with a study of the European Environment Agency (Darby, 2006), the following main types of feedback can be used to change behaviour.
Direct feedback: available on demand. Learning by looking or paying.
Self-meter-reading
Direct display
Interactive feedback via computer
Indirect feedback: raw data processed by the utility and sent out to customers. Learning by reading and reflecting.
More frequent bills
Bills including historical feedback
Bills including comparative/normative feedback
Bills including disaggregated feedback
Inadvertent feedback: learning by association.
With the advent of microgeneration, the home becomes a site for generation
Community energy conservation projects
Utility controlled feedback
Via smart meters with a view to better load management
Energy audits
Undertaken by a surveyor
On an informal basis by using a software (e.g. carbon calculators)
Studies on the effect of feedback on energy consumption behaviour are numerous and differ widely in their methods and results. However, there are a several factors that constantly appear in these studies, despite the different results of the studies regarding their relative importance for an effective energy feedback. Findings regarding these reoccurring factors are summarised in the subsequent assessment based on the analysis of meta-studies.
6.2 Feedback Frequency
It can be stated that the frequency has an impact on the energy consumption behaviour. Most of the studies listed below report a positive effect of a high feedback frequency. A further study in 1995 (Wilhite and Ling, 1995) resulted in energy conservation of 10% after three years, if the bill is sent two-monthly instead of yearly. A shorter period makes energy consumption more visible and increases both the consumer`s awareness and his understanding of consumption and costs (Wilhite and Ling, 1995). It can be concluded that frequent information is highly important for an effective DSI.

13
Study Findings
Karlin et al. 2015 There is no significant effect apparent.
Erhardt-Martinez et al. 2010
Daily/weekly feedback and real-time plus feedback generates he highest savings per household (“plus” means, that useful details on energy are provided additionally to the consumption).
Neenan 2009 There are little differences in savings between studies using various levels of feedback frequency.
Fischer 2008 Daily or more frequent feedback are associated with the highest savings compared to weekly to monthly and less then monthly.
Darby 2006 Direct feedback provided by the meter or an associated display monitor results in more savings (5-15%) compared to indirect feedback provided by the billing (0-10%).
Abrahamse et al. 2005 The more frequent feedback is given, the more effective it is.
Table 1: The effect of feedback frequency on energy consumption behaviour, literature review.
6.3 Feedback Medium
A further influencing factor of feedback effectiveness is the medium through which the feedback is provided. These mediums can be categorised as utility bill, card (e.g. door hanger), monitor (e.g. electronic device that provides energy information), or computer (e.g. software or web-enabled program) (Neenan, 2009). (Fischer, 2008) states in a meta-analysis that computerised or interactive feedback will be more effective at stimulating behaviour change as it enhances the opportunity for users to engage with feedback. Karlin et al. Karlin et al. (2015) on the other hand did not find a significant effect of the medium when comparing billing with door hanger, monitor and online tool/software. However, the advantages of electronic feedback as its flexibility and ability to quickly process and present actual consumption are mentioned. Furthermore, interactive tools may stimulate users’ curiosity. Based on these findings it can be concluded, that the effect of the medium on the effectiveness of a DSI is existing, although not highly important.
6.4 Feedback Content
All of the analysed studies provide information about both energy consumption and costs, so that a differentiation between these two aspects is not possible. An effect of additional environmental information is either not found (Fischer, 2008; Karlin et al., 2015) or not clear (Abrahamse et al., 2005). A possible reason might be target-group specific differences in responsiveness to different feedback contents. The knowledge about energy consumption and energy-saving possibilities can be already present to some households. In this situation, additional information may cause an information overload. Moreover, the usefulness of information depends strongly on how it is presented and whether it is specific to the needs of the target group (Fischer, 2008).
6.5 Comparison
Comparison can be divided in three basic types. Historical comparison relates actual to prior consumption. Normative comparison compares consumption to that of other households (e.g. regional average, households in the neighbourhood, similar households). Goal based comparison compares the consumption to a defined consumption goal. Comparison may stimulate specific motives for energy conservation (e.g. competition and ambition) and may reveal whether the consumption in a certain period is “out of the norm” (Fischer, 2008). Normative comparisons may be problematic because the consumers may be unhappy with the comparison group they are assigned in or do not accept being compared with others (Darby, 2006). It is also questionable, whether the consumers would be motivated to reduce consumption further if they are already consuming less than the comparison group. The study review below shows ambiguous results regarding the effect of different comparison forms on energy consumption.

14
Study Findings
Karlin et al. 2015 Goal based comparison has a significant and positive effect on energy consumption. There is no significant effect of historical and normative comparison.
Fischer 2008 There is no effect of normative comparison. A conclusion regarding historical comparison is not possible since all studies include them.
Darby 2006 Historical feedback is more effective than goal based comparison.
Abrahamse et al. 2005 There is no difference between the effect of comparative and individual feedback.
Table 2: The effect of comparison on energy consumption behaviour, literature review.
6.6 Aggregation
Providing disaggregated information, for example for specific rooms, appliances or times of the day is almost the only way of providing a direct link between action and result (Fischer, 2008). As it can be seen in Table 3, most studies reported a positive effect of disaggregated information.
Study Findings
Karlin et al. 2015 There is no significant effect apparent.
Neenan 2009 Appliance level information shows a positive effect.
Fischer 2008 Evidence for a positive effect.
Darby 2006 “is seen as useful by customers”
Table 3: The effect of aggregation of information on energy consumption behaviour (literature review).
6.7 Feedback Duration
The findings concerning feedback duration state, that after an initial learning phase, user stops engaging with the feedback and the energy conservation decreases (Karlin et al., 2015) However, feedback which is given over a longer time may result in persistent effects because new habits can be created during that time (Fischer, 2008). The findings regarding feedback duration vary (Table 4) and the applicability to billing DSI is limited since billing is continuous per definition.
Study Findings
Karlin et al. 2015
The effect is marginally significant and follows a U-type curve. The minimum of the effect is situated at a duration of the feedback of 3-12 months. The effect is higher for a feedback duration of less than 3 months and more than 12 months.
Erhardt-Martinez et al. 2010
Shorter studies tend to be associated with more savings than the longer ones. However, this is more likely due to ignoring seasonal differences than due to higher effectiveness of short term feedback.
Fischer 2008 There is no clear indication that long term feedback lead to more savings than short term.
Darby 2006 Feedback is more effective, if it is provided over a period longer than 3 months.
Table 4: The effect of feedback duration on energy consumption behaviour (literature review).
In summary, it can be acknowledged that the feedback frequency is a highly important determinant for effective DSI models. Moreover, there is also a strong evidence for the positive effect of providing

15
disaggregated information, preferably at the appliance level. Potential of computerised and interactive elements could be also considered as rather high as well as target-group-specific tailoring of feedback content. Finally, despite the undeniable potential of comparisons (historical, normative or goal-based) arising from theoretical literature, empirical evidence of their effect on energy consumption is still ambiguous, resulting at least partly from differing quality and limited number and comparability of existing evaluation studies.
Finally, it has to be highlighted that, although insightful, the findings from the meta-studies on energy feedback have to be interpreted with some caution. The reasons for this lie primarily in the limited number of evaluation studies, variety of different approaches and consequently limited comparability as well as in some cases sub-optimal experimental designs not allowing to distinguish between a pure feedback effect and the effect of other applied intervention strategies such as goal setting, general information, financial incentives etc.
These factors will be taking into account during the different activities undertaken within the frame work of the IMPROVE project to have a better understanding of their influences in the national context.

16
7 Existing DSI in Switzerland
The energy sources considered in the Improve project - electricity, gas and district heating - are supplied in Switzerland by a large number of energy utilities. The supply situation for private households differs greatly from the European and global environment in terms of the density and size of energy utilities (electricity supply in 2016 with 645 electricity network operators (ElCom, 2016), including many very small suppliers) and the market situation (no free choice of supplier for consumers under 100 MWh/a (StromVG, 2015). chapter 7 of the project therefore separately examines billing by Swiss energy utilities; the situation outside Switzerland is considered in chapter 8.
The objective of this chapter is to describe the current format of the energy bills, sent by Swiss energy utilities to private households. The following factors in particular have been taken into account:
Information content
Presentation of information (type and location)
Billing (delivery method, billing interval, type of payment)
Examples of best practice
Possibilities for further improvements
7.1 Approach and Methodology
The study of current billing by energy utilities in Switzerland is divided into the following steps:
1. Basic principles: analysis of the informative elements and invoice procedures commonly applied to energy bills
First, existing properties of bills (information content, presentation and billing) that are used in
Switzerland are explored Special attention is also paid to the specific Swiss market situation, the
legal requirements, the technical (information available) and legal (e.g. information usable with
regard to data protection) framework conditions. The basis for this is a literature review and a first
review of bills, which are personally collected in the circle of acquaintances. In step 3, further bills
are collected via the Energy utilities.
2. Survey of energy utilities via online survey
Based on the previously defined characteristics, a survey was developed, which contained further
questions (e.g. type and frequency of bills, other sources of information, use of additional consumer
information, etc.) to complete the picture and gather more in-depth information form Swiss energy
utilities. Participants to the survey were asked to provide also a bill sample from their company, if
possible.
The survey was translated (de, fr, it) and distributed by the academic partners in cooperation with
the partner energy utilities to a total of 185 Swiss energy utilities via e-mail.
3. Collection of bills from energy utilities
Bills were collected on the websites of the energy utilities, among friends and colleagues (step 1)
and via the online survey. A total of 91 bills have been collected from 47 different energy utilities.
This provides a reasonable overview of current energy bills in Switzerland.
4. Evaluation and results
The responses to the survey and evaluation of the collection of bills are statistically evaluated and
compared. Excerpts from bills (good practice) are shown for illustration.

17
7.2 Basic principles: analysis of the informative elements and invoice procedures commonly applied to energy bills
The analysis of the informative elements and invoice procedures commonly applied to energy bills developed are based on a literature review and are supplemented by a random check of already personally collected bills. The literature review aims at elaborating the following topics within the context of energy billing practices:
General studies on energy bills
Factors influencing information-induced changes with regard to increased household efficiency
Energy-saving potentials of households and information required for presentation
Legal basis of energy billing
Special characteristics of the Swiss market
The last two points focus on the supply of households with electricity.
Greater focus is placed on household electricity consumption (excluding heat generation) than the supply of gas and district heating in this work for the following reasons:
Household energy consumption depends very much on the user (Frequency of use, but also on the quality of the installed devices). The strong influence of the user can be seen, for example, in the fact that inefficient single-family houses consume up to 14 times more household electricity than efficient ones (Gasser, 2014).
In addition to user behaviour, heating consumption depends mainly on the quality of the building envelope (thermal insulation) and building technology (e.g. comfort ventilation with heat recovery) and can therefore only be influenced to a limited extent by the user.
Heat generation with electricity (heat pumps) is increasingly replacing fossil fuels, and district heating is often only widely available in densely populated areas.
The result of the review is a catalogue of content elements and billing procedures, which are used as the basis for the survey and analysis of the collected bills.
For this purpose, the content elements and billing procedures are divided into the following groups:
Energy sources
Billing
Statutory requirements
Comparative values
Potential savings
Environmental impact
Tips and recommendations
Billing explanations
Presentation
Technical requirements
Additional information about customers
Additional information for customers
Energy utilities in Switzerland
7.2.1 Energy sources
The energy sources of electricity, gas and district heating are considered. Some questions are only useful for one or two energy sources or must be formulated differently. Information on the quantity of energy supplied per energy source allows a statement to be made about the representativeness of the energy utilities in comparison with the Swiss market structure (cf. section 7.2.13.2).

18
7.2.2 Billing
Billing is relevant for the options for presenting information, determining its delivery and frequency, as well as for its perception by the customer.
Billing format
In this context, format refers to the medium of presentation and delivery.
With regard to the format, the following features are taken into account (Karlin et. al., 2015 and Duscha et. al., 2007):
Colours used. Colors can help to understand more easily diagrams and other data presentation. (due to printing costs, paper bills are usually two-colour, see chapter 11)
Printing resolution used. Higher printing resolution helps to read characters more easily and makes it more appealing for the recipient to read. However often printers are used with lower printing resolution.
Static/interactive presentation (static: all necessary information is presented invariantly, interactive: consumption can e.g. be presented in real time, detailed information is presented on request, etc.)
The technical options open to the recipient (not every customer has an email account or can handle an application)
The option to collect specific customer data and thus to generate specific comparisons (with online accounts and applications specific data can be collected, cf. also section 7.2.12). It is to be assumed that energy utilities can use the data collected in this way and thus create a motivation to offer corresponding options.
Costs (postage costs, online portals generate more maintenance costs than email mailing lists, etc.)
The most common formats and properties important for presentation are shown in Table 5.
Description Specifications
Paper bill with postage For cost reasons black and white only, shipping costs are
incurred, static presentation, possible for all customers
Email with attachment (PDF) Static presentation, email account required
E-bill (e-banking, postal finance) Static presentation, details usually visible in attached PDF, e-
banking required
Online account Interactive, collection of customer data possible, Internet access
required
App on mobile device As with online account
Table 5: Format and properties for billing
Some energy utilities are increasingly interested in encouraging customers to switch to online bills (e.g. by charging for postage or with premiums switching, as shown in Figure 6).
Figure 6: Excerpt from EKZ bill, 2016, page 2
“Switch now to online bills and receive a 10.- CHF bonus”

19
Payment method
The payment method is relevant for the perceptibility of information presented on the bill (see Table 6).
Description
Perception of presented information
Normal bill (payment slip) Direct perception of energy and total costs, information visible, as bills
usually have to be browsed through (payment slip often at the end)
E-bill (e-banking, postal
finance)
Direct perception of total costs, bill details do not have to be viewed
(PDF available, but must be opened)
Direct debit procedure Automatic payment, no perception of costs or bill details
Pre-paid counter Direct perception of costs, further information only observable under
certain conditions
Table 6: Payment methods
Payment type
The payment type is relevant for the frequency of the bills and the amount charged per bill, as well as the information presented on the bill. Since only part of the total bill amount is charged per bill for advance payments, changes (for example, due to an increase in consumption) to the total amount on the individual bill result in a smaller change and are therefore less noticeable.
The three most common payment types are shown in
Description Specifications
Normal bill Regular billing in the accounting period. Consumption is presented, and
information based on it can be presented
Advance payment (payment
on account)
Regular prepayment of a fixed amount. Effective consumption and
values based on it are only visible in the final bill
Pre-Paid Advance payment with irregular frequency, according to current
consumption, current consumption can be presented, additional
information based on this only under certain conditions
Table 8Table 7: Payment type
Description Specifications
Normal bill Regular billing in the accounting period. Consumption is presented, and
information based on it can be presented
Advance payment (payment
on account)
Regular prepayment of a fixed amount. Effective consumption and
values based on it are only visible in the final bill
Pre-Paid Advance payment with irregular frequency, according to current
consumption, current consumption can be presented, additional
information based on this only under certain conditions
Table 8: Payment type
From the energy utilities' point of view, it is probably not the frequency of billing of the various payment methods that is decisive, but rather whether and how reliably customers settle their bills or not.

20
Frequency
As found in Artho et. al. (2012), Wilhite and Ling (1995) and Suter (2017) information provided more frequently leads to a greater change in behaviour, and thus to greater energy savings as when information is provided rarely.
Frequency is influenced by the payment type, which each energy utility can freely choose, and the reading interval, which is influenced by the meter used. Meters with remote reading can be read more often due to the lower degree of effort required, and offer better conditions for more frequent billing.
7.2.3 Statutory requirements
Consumption and costs
Billing in Switzerland is regulated by ElCom (ElCom, 2014), at least for electrical utilities. The following minimum requirements for information presented must be observed (see Figure 7).
Figure 7: Minimum billing requirements (ElCom, 2014)
According to Laurich and Lamieri (2008), much of the information that is required by law is of little interest to the customer (cf.
Figure 8).
Figure 8: Importance of further information on the bill (Laurich and Lamieri, 2008)

21
Energy mix (electricity labelling)
In addition, requirements for Fuel Mix Disclosure must be met (UVEK, 2016). In accordance with the Energy Act (EnG) and the Energy Ordinance (EnV), all end-users must be informed at least once per year about the percentage shares of the energy sources used and the origin of the electricity. In addition to the content of a declaration, also minimum requirements are defined for the format (table format) cf.
Figure 9.
Figure 9: Example of a table for labelling electricity according to the minimum requirements (supplier mix) according to (B. Karlin et. al. , 2015)
7.2.4 Comparative values
Comparisons of one's own consumption are an effective means of initiating behaviour changes (Suter, 2017 and Karlin et. al., 2015). A difficult to grasp unit, e.g. energy (kWh), can be easily understood by comparisons. The essential part is to recognize, if the consumption is high or low, without necessarily understanding what a kWh is.
Comparisons of consumption always require a reference value. Typically, these are the value for one's own consumption in a previous measurement period, standard values (e.g. SIA standards), or statistically collected averages (general, such as e.g. the Swiss average, but also specific, e.g. averages of similar households in the immediate vicinity).
Comparison of consumption with one's own consumption from previous periods
Since the energy utility usually knows the consumption of a customer’s previous metering periods (or billing periods), this comparison is easy to present.
In order to allow meaningful comparisons, according to Dunnhoff and Palm (2016) and Gallati, M. and Knüsel, P. (2011) following prerequisites must be met, for example:
No change of measuring point (change of residence)
Same measuring period
Same season (if measuring period is less than one year)
Comparable climatic conditions (e.g. heating degree days for heating consumption)
Familiar or equal living conditions (number of people in household, etc.)
In Laurich and Lamieri (2008), 30% of respondents stated that they consider the comparison with the previous year's consumption. According to Dunnhoff and Palm (2016), 80% of respondents in Germany considered a comparison with the consumption of a previous period important, although 30% of respondents find this information difficult or impossible to find. The percentage change in consumption, which is also easy to present, can also be helpful.

22
Comparison with other values
As a rule, energy utilities do not have sufficient information about the building type or the household components to be able to make detailed comparisons. According to Danov, et. al. (2015), for example, comparison with similar households is effective and therefore desirable. If additional information is available to the energy utility, it could be analysed to provide more specific comparisons. However, this is complex and requires expertise in energy in buildings and free access to specific household data (e.g.: heating system, number of people etc.).
7.2.5 Savings potential
Savings potential primarily starts with "Can" (Artho et. al., 2012) by showing consumption by other reference groups, and how much it differs from one's own consumption, and how the other reference group can do. More specific savings potentials (comparison with similar households in the immediate vicinity) are more effective than general ones (average consumption of the Swiss resident population).
By showing how much can be saved (e.g. 1 t CO2 p.a. or CHF 100 p.a.), they also stimulate "Want" (Artho et. al., 2012).
Basis for comparison
Savings potential can be calculated based on comparisons. This then makes the information on, for example, how much higher consumption is compared to a similar household, and how much can therefore be saved, more easily accessible to laypeople. As explained in Gallati and Knüsel (2011), the degree of consumer knowledge about saving potentials is very low. The explicit presentation of savings potentials can provide a remedy, and thus generate additional motivation.
Unit
Savings potentials can relate to different variables such as energy (kWh), environmental impact (e.g. CO2 or energy consumed by number of halogen light bulbs, etc.) or financial aspects (CHF). The unit in which saving potential are most appealing depends on the motivation and different sensitivity of each individual customer.
7.2.6 Environmental indicators
Environmental indicators can be used to express variables that are difficult to grasp in terms of clear, measurable alternative variables. The difficult-to-grasp variable "energy" and the environmental effects caused by its use can thus be described in a way that is comprehensible. This lack of transparency ("electricity is invisible and apparently always available") is an obstacle to saving energy (VSE, 2015). A survey by the German Federal Environment Agency shows that more compensation payments were made after these were renamed from "financial compensation (compensation payment) for self-induced greenhouse gases, for example transport" to voluntary compensation payments for carbon dioxide emissions (cf. Umwelt Bundsamt, 2016). Apparently, the term "carbon dioxide emissions" is more comprehensible than "self-induced greenhouse gases".
7.2.7 Tips and recommendations
General energy saving tips and recommendations can include simple behavioural changes (e.g. sudden ventilation instead of tilted windows) or recommendations for action (replacement of incandescent/halogen lamps by LEDs). According to the "Want-Can-Do" action chain (Artho et. al., 2012), the concrete feasibility (“Can”) is a compelling prerequisite for it to have an effect.
Although personalised energy-saving tips are rarely found on bills due to the necessary data basis (see section 7.2.11), according to Danov, et. al. (2015) they are very effective. Personalised savings tips are often available in online portals or through personal consultation (by telephone or in the advice centre). According to Artho et. al. (2012), personal energy audits are the most effective measure with regard to increasing efficiency (reduction of up to 20% in electricity consumption).

23
7.2.8 Billing explanations
Energy bills are often difficult for laypeople to understand; according to one study from Austria, various terms important for understanding energy bills are not comprehensible for large numbers if customers (Bernhard et. al., 2010). Understanding a bill is a prerequisite for changing one's behaviour. The bill can trigger the process by showing the need or the possibility to improve the energy consumption and motivate a “want” to change one’s behaviour, according to the socio-psychological mechanisms of deliberate action (Artho et. al., 2012).
7.2.9 Presentation of information
Type of presentation
A significant improvement in comprehensibility is achieved by visualising the presented information, e.g. with diagrams (Wilhite and Ling, 1995). According to Danov, et. al. (2015), the visualisation of consumption is an appropriate means of achieving behavioural changes, and therefore highly desirable for improved billing.
Scope
An analysis of electricity bills from Germany (Dunnhoff and Palm, 2016) showed that an electricity bill contains on average five pages. If additional services (other forms of energy or water) are charged, the number of pages can easily increase to ten to thirteen. With increasing volume, it becomes increasingly difficult and complex for customers to find relevant information. A short, concise bill is therefore useful.
Location of information
According to the principle of the inverted pyramid, important information should be presented first. Essential information - the billed amount - can therefore usually be found on the first page of the bill. According to Laurich and Lamieri (2008), consumers want central information to be placed on the first page so that it can be read quickly.
A representative survey in Germany shows a clear relationship between the importance of information and how easy it is to find it on the bill, which should also be taken into account when improving the bill (
Figure 10).
Figure 10: Relationship between importance and findability of information on bills (taken from G. Laurich and L. Lamieri, 2008)
Information should therefore be presented in the order of its importance to the customer.
24
7.2.10 Technical requirements
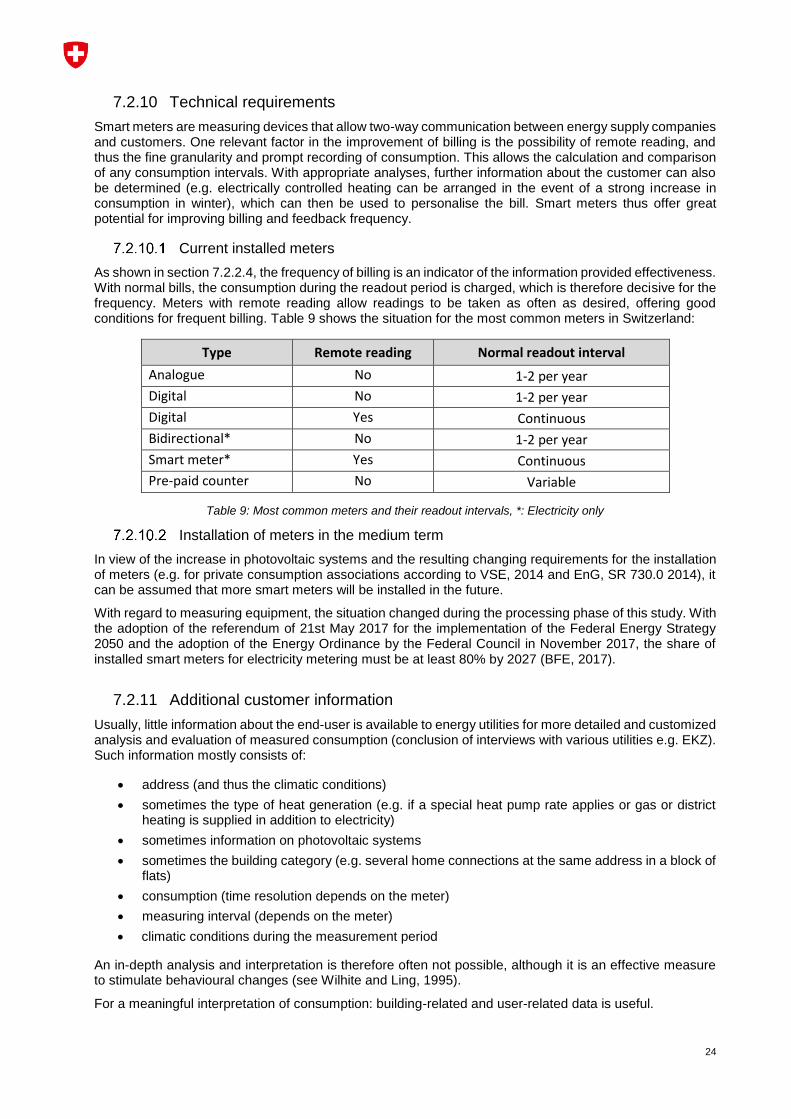
Smart meters are measuring devices that allow two-way communication between energy supply companies and customers. One relevant factor in the improvement of billing is the possibility of remote reading, and thus the fine granularity and prompt recording of consumption. This allows the calculation and comparison of any consumption intervals. With appropriate analyses, further information about the customer can also be determined (e.g. electrically controlled heating can be arranged in the event of a strong increase in consumption in winter), which can then be used to personalise the bill. Smart meters thus offer great potential for improving billing and feedback frequency.
Current installed meters
As shown in section 7.2.2.4, the frequency of billing is an indicator of the information provided effectiveness. With normal bills, the consumption during the readout period is charged, which is therefore decisive for the frequency. Meters with remote reading allow readings to be taken as often as desired, offering good conditions for frequent billing. Table 9 shows the situation for the most common meters in Switzerland:
Type Remote reading Normal readout interval
Analogue No 1-2 per year
Digital No 1-2 per year
Digital Yes Continuous
Bidirectional* No 1-2 per year
Smart meter* Yes Continuous
Pre-paid counter No Variable
Table 9: Most common meters and their readout intervals, *: Electricity only
Installation of meters in the medium term
In view of the increase in photovoltaic systems and the resulting changing requirements for the installation of meters (e.g. for private consumption associations according to VSE, 2014 and EnG, SR 730.0 2014), it can be assumed that more smart meters will be installed in the future.
With regard to measuring equipment, the situation changed during the processing phase of this study. With the adoption of the referendum of 21st May 2017 for the implementation of the Federal Energy Strategy 2050 and the adoption of the Energy Ordinance by the Federal Council in November 2017, the share of installed smart meters for electricity metering must be at least 80% by 2027 (BFE, 2017).
7.2.11 Additional customer information
Usually, little information about the end-user is available to energy utilities for more detailed and customized analysis and evaluation of measured consumption (conclusion of interviews with various utilities e.g. EKZ). Such information mostly consists of:
address (and thus the climatic conditions)
sometimes the type of heat generation (e.g. if a special heat pump rate applies or gas or district heating is supplied in addition to electricity)
sometimes information on photovoltaic systems
sometimes the building category (e.g. several home connections at the same address in a block of flats)
consumption (time resolution depends on the meter)
measuring interval (depends on the meter)
climatic conditions during the measurement period
An in-depth analysis and interpretation is therefore often not possible, although it is an effective measure to stimulate behavioural changes (see Wilhite and Ling, 1995).
For a meaningful interpretation of consumption: building-related and user-related data is useful.

25
Building-related data
It includes data such as:
building category and condition of building
energy reference area
type of heat generation (heating and hot water)
use of solar energy (photovoltaics, solar thermal energy)
special (type of energy measurement, storage, etc.)
Since, in addition to the energy reference area, the quality of the envelope has a decisive influence on the heating demand, the use-related influence on consumption cannot be assessed on a sound basis without corresponding supplementary information (see Figure 11).
Figure 11: Proportions of heat energy consumption according to different construction standards
(source: Faktor 2009)
It is highly desirable to divide total consumption into energy consumption for heat generation and household electricity. It was shown in Wilhite and Ling (1995) that showing the proportion for heating led to a reduction in heating consumption. If it is assumed that the share of consumption required for heat generation is shown, and thus the amount of household electricity becomes calculable, further decisive variables for a meaningful comparison of household electricity are nevertheless missing. Figure 12 illustrates the dependence of energy demand on the number of persons and the building category.
Figure 12: Typical power consumption of Swiss households (as per EnergieSchweiz, 2016)
What follows, is an example of some of the required information needed to obtain this kind of computation.

26
User-related data
It includes data such as
number of persons in household:
information on work situation (level of employment, home office, etc.)
special (e.g. electric car, etc.)
A final list can hardly be defined; Gallati and Knüsel (2011) contains a comprehensive summary of factors relevant to consumption. Essentially, the more information is available, the more detailed and specific the analysis, comparison and information given.
Some of the above information is available to the energy utility depending on the situation (heat generation: e.g. when a special heat pump rate applies or gas is supplied).
Although some further information may be available in principle, the energy utilities are not permitted to use it for assessment due to data protection law. Data on buildings and technology is available, for example, in the Federal Register of Buildings and Housing (GWR), and information on the number of residents is available from local authorities.
Although, this involves a great deal of effort for the energy utility, access to certain data can be made legally permissible with a declaration of consent from the owner or the user. This can also be achieved if a corresponding declaration is requested when opening an online account.
7.2.12 Additional information for customers
General, non-personalised information can be sent in addition to the bill, e.g. as a bill insert, newsletter, or sent by email, or presented on the website. These can contain specific elements if, for example, the average consumption relation to the number of persons and the building type is presented in a table and the customer can read the comparison value relevant to them:
Figure 13: Excerpt from the EKZ website: Compare power consumption (source: EKZ)
Many energy utilities offer applications for mobile devices (e.g. Basil by IWB) or online portals with personal login (e.g. Home Energy by BKW). In doing so, the consumer discloses their personal data and thus enables the energy utility to make a personalised assessment of their consumption.
Customers also have the option of interactively assessing their consumption in more detail, even without a personal login. For example, Energybox.ch (www.energybox.ch) or the Energie Uster website (https://mypower.energieuster.ch/de/services/strombedarf.php\) can be used to calculate a household's electricity requirements in detail. The personal data collected will then not be stored and the customer must themselves make the comparison with their own consumption.

27
In particular, solutions with personal customer access can be clearly assigned to Demand Side Management (DSM) as a category. For solutions without login, the boundary between DSI and DSM is fluid. As this study focuses on the calculation, the technical possibilities of other media and their potential are not discussed in detail.
7.2.13 Energy utilities in Switzerland
The situation of energy utilities in Switzerland is special in several respects compared to other countries:
Market situation: the market is not fully liberalised
Market structure: large number of very small energy utilities
Many energy utilities have a political or performance mandate
Comprehensive services offered: district heating, gas, electricity, water, multimedia, or any combination thereof
These peculiarities have an influence on the actions of the energy utilities and their motivation to encourage efficient behaviour on the part of their customers. As the evaluation of the survey and the bills (see chapter 7.4) focuses on billing, these special features are not further investigated.
Market situation
In contrast to the greater part of the European countries, the Swiss electricity market is still only partially liberalised. Although large consumers are free to choose their supplier, if they consume less than 100 MWh/a ("private customers"), they must purchase electricity from their local supplier.
The lack of competition and the resulting "secured" customer base of private customers puts less pressure on Swiss energy utilities to retain customers with innovative services (e.g. improved billing) and products (e.g. energy-saving contracts).
Market structure
In 2016, electricity was supplied in Switzerland by 645 network operators (ElCom, 2016), plus further suppliers of gas and district heating. Compared with other countries (e.g. Germany 888 network operators, (Bundesnetzagentur, 2018)), these include a very large number of small energy utilities (with a market coverage of 58% according to M. Mühlebach (2012): a large proportion of energy utilities supply less than 30 GWh/a, and 12% more than 300 GWh/a.
Figure 14 clearly illustrates the inhomogeneous market structure in Switzerland.
Figure 14: Distribution system operators in Switzerland (2013, source: VSE)

28
The size of the energy utilities in terms of resources and competencies has a significant influence on bill processing:
Large energy utilities have the know-how and the necessary resources to improve billing on their own.
The larger the customer base, the larger the database, which, if required, can only be used for specific analyses and comparisons.
Many small energy utilities outsource their accounting to external, specialised companies due to a lack of resources or competence. However, this can also be an opportunity, as these entities can sell billing better as a product, and thus benefit several energy utilities and their customers.
Different motivation depending on the size of the energy utility (cf. section 7.2.13.5).
Performance mandate of energy utilities
Around 70% of energy utilities in Switzerland are wholly or partly publicly owned (Municipalities, Cities, Cantons), see Figure 15.
Figure 15: Ownership of Swiss energy utilities (from M. Mühlebach, 2012,2)
According to Zweifel (2012), 67% of central power stations and 50% of municipal energy utilities have a public sector performance mandate (cf. Figure 16), and are thus obliged to commit themselves to energy efficiency.
Figure 16: Public sector performance mandate regarding energy efficiency (taken from Zweifel, 2012)

29
Services offered
Regional or locale energy utilities in particular usually offer not only the supply of energy, but also water and/or multimedia services. If all services are billed in one bill, the bill volume increases accordingly and the easiness of finding important information decreases.
According to Dunnhoff and Palm (2016), in Germany, for example, the average page count of an electricity bill is five pages and ten pages if gas, district heating or water is added.
Motivation to increase efficiency
According to a survey of Swiss energy energy utilities (Zweifel, 2012), the extent to which energy efficiency is dealt with and to which business fields it is assigned also depend on their size:
Figure 17: Engagement with energy efficiency (taken from Zweifel, 2012)
According to Zweifel (2012), the primary benefits of energy efficiency for energy utilities can be found in the areas of communication and customer loyalty (see Figure 18).
Figure 18: Benefits of energy efficiency for energy utilities (Source: Zweifel, 2012)

30
7.3 Data collection
7.3.1 Survey
Procedure
An invitation to participate in the survey (according to Table 12) was sent via e-mail to at least 185 Swiss energy utilities (see Appendix 2). Surveys were distributed through partner universities in each language region. A short description of the project was added to the invitation (see Appendix 3).
Language region Partner ESCs Member of
VSE1
Personal
contacts Quantity
German 3 134 unknown min. 137
French 3 34 unknown min. 37
Italian 5 6 unknown min. 11
Total min. 185
Table 10: Recipient questionnaire by language region
The survey asked Swiss energy utilities about their current billing system. In addition to exploring content elements and billing procedure of participating energy utilities (Table 12), supplementary and further questions (e.g. on the type of billing or further information available) can thus be asked.
The survey was translated into three national languages (de, fr, it). The questionnaire with questions for all energy sources is attached in Appendix 1.
A questionnaire must be completed for each form of energy supplied (electricity, gas, district heating); this is selected at the beginning of the survey. The following questions are partially adapted to the previous answers (e.g. no question about smart meters for gas, or no question about the location of the presentation if no environmental impacts are presented). The size of the survey is therefore variable: the survey contains a minimum of 25 pages with 21 questions and a maximum of 36 pages with 32 questions.
At the end of the survey respondents had the option of uploading an example of a current bill.
Responses
The survey achieved the following results:
137 logins to the survey were registered.
89 logins were not considered in the evaluation (no or insufficient answers, test logins, multiple answers from the same person or energy utility 2).
The questionnaire was completed by 41 energy utilities.
6 replies were sent by email (some partner energy utilities also received the questionnaire as a text).
1 Based on the list of members on the homepage of the VSE [28](VSE, 2017), cf. Appendix 4
2 If the questionnaire was completed several times by employees of the same ESC using the same energy source, those answers
were counted once. In this way, the number of ESCs can be referred to in the evaluation without it being falsified by multiple
answers.

31
For the analysis, 54 answers were considered (although not all questions were necessarily answered), which corresponds to a response rate of max. 30%. The following number of responses were evaluated per energy source:
Electricity : 46
Gas : 7
District heating : 1
When analysing the survey, each answer was given equal weighting, irrespective of the energy utility’s size or number of customers. Multiple responses on the same energy source of the same energy utility were only counted once. Thus, each evaluated answer corresponds to one energy utility or one bill, which is relevant for the evaluation portion per ECU and energy source. Due to the low number of usable responses for district heating, for this energy source no evaluation was carried out.
A brief analysis of the survey was sent to participants on request. This can be found in the Appendix 6.
7.3.2 Bills
To complete the picture, an additional collection of Swiss bills was undertaken in the following ways:
Website of energy utilities
Personal contacts
Upload by energy utilities participating in the survey
The analysis refers to the number of energy utilities or bills, which assumes that only one bill per energy source is recorded per energy utility. This leads to a reduction of the 117 collected bills to 91 bills for use in the analysis (see Table 11).
Source Quantity Of which, those used
for evaluation
Used for evaluation
Electricity Gas District
heating
Power grid 57 49 35 13 1
Personal
contacts
33 17 16 4 0
Survey 25 25 22 3 0
Total 117 91 70 20 1
Table 11: Number of bills collected and used
7.4 Evaluation and findings
Based on chapter 7.2 and 7.3, the informative content elements and billing procedures (Table 12) were defined for the questionnaire and the analysis of the bills.

32
7.4.1 Overview of indicators used
3 For some questions, it makes sense to differentiate between energy sources. These are indicated with index 1. When analysing
bills, a distinction was always made between energy sources.
4 If it was visible on the bill, the option of payments on account was recorded in the analysis of the bills.
5 The number of readout intervals was recorded for bills.
Area Number Indicator Specification
Application in
Survey Bills
Energy sources
01 Supplied energy3
1: Electricity
2: Gas
3: District heating
x x
02 Quantity of energy supplied 1: GWh/a x
Billing
03 Billing format
1: Paper bill
2: Email (with PDF)
3: E-bill
4: Online account
5: Mobile application
6: Other (text input)
x
04 Type and percentage of
using payment method
1: Payment slip
2: E-bill
3: QR code
4: Direct debit
5: Pre-paid counter
6: Pre-paid online
7: Other (text input)
x
05 Type and percentage of
using payment method
1: Standard bill
2: Advance payment (on account)
3: Pre-paid
4: Other (text input)
x x4
06 Frequency of billing
1: Monthly
2: 4 times per year
3: 2 times per year
4: 1 time per year
5: Irregular
6: Other (text input)
x x5
Statutory
requirements
07 Illustration of consumption
1: Total consumption in kWh
2: Consumption according to tariff levels in kWh
x
08 Illustration of costs
1: Total consumption in CHF (energy)
2: Consumption according to tariff levels in kWh
x
33
Environmental
impact
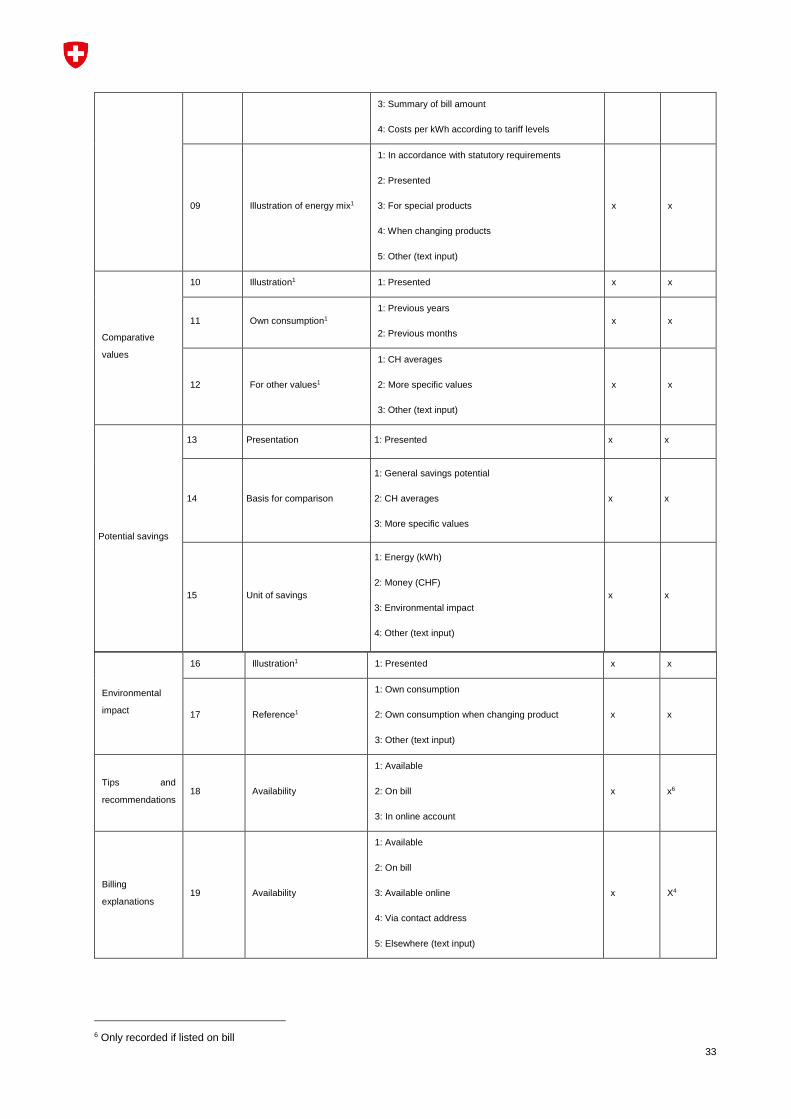
16 Illustration1 1: Presented x x
17 Reference1
1: Own consumption
2: Own consumption when changing product
3: Other (text input)
x x
Tips and
recommendations 18 Availability
1: Available
2: On bill
3: In online account
x x6
Billing
explanations 19 Availability
1: Available
2: On bill
3: Available online
4: Via contact address
5: Elsewhere (text input)
x X4
6 Only recorded if listed on bill
3: Summary of bill amount
4: Costs per kWh according to tariff levels
09 Illustration of energy mix1
1: In accordance with statutory requirements
2: Presented
3: For special products
4: When changing products
5: Other (text input)
x x
Comparative
values
10 Illustration1 1: Presented x x
11 Own consumption1
1: Previous years
2: Previous months
x x
12 For other values1
1: CH averages
2: More specific values
3: Other (text input)
x x
Potential savings
13 Presentation 1: Presented x x
14 Basis for comparison
1: General savings potential
2: CH averages
3: More specific values
x x
15 Unit of savings
1: Energy (kWh)
2: Money (CHF)
3: Environmental impact
4: Other (text input)
x x

34
Presentation
20
Type of presentation
(numbers and text or
graphic)
1: Total consumption
2. Total energy costs
3: Energy mix
4: Comparative values
5: Savings potential
6: Comparative values, costs
7: Environmental impact
8: Energy saving tips
x x7
21 Scope (number of pages)
1. Bill
2: Bill appendix
x
22 Place of presentation
(page 1, 2 or 3)
1: Total consumption
2. Total energy costs
3: Energy mix
4: Comparative values
5: Savings potential
6: Comparative values, costs
7: Environmental impact
8: Energy saving tips
x x8
Technical
requirements
23 Types and proportions of
meters installed today1
1: Analogue
2: Digital, without remote reading
3: Digital, with remote reading
4: Smart meter9
5: Other (text input)
x
24 Installation of meters in
the medium term1
1: Analogue
2: Digital, without remote reading
3: Digital, with remote reading
4: Bidirectional, if PV present7
5: Smart meter, building with PV7
6: Smart meter, building without PV7
7: Other (text input)
x
Additional
customer
information
25 Application and source
1: Are used
2: Customer must provide information
3: Customer can provide information
x x10
7 When analysing bills, the type of presentation (numerical or graphic) was also recorded for the following indicators: consumption
according to tarif levels (KWh), energy costs (CHF), composition of bill amount (energy, fees, etc.)
8 When analysing bills, the presentation page was recorded for all indicators
9 For electricity only
10 Recorded if printed on bill

35
4: Other (text input)
26 Further use by energy
utility
1: Customer must agree
2: Customer can agree
x
Additional
information for
customers
27
Availability and content of
additional information in
online account
1: Not available
2: Available
3: Content (text input)
28 Availability, type and
medium
1: Available
2: General information
3: Personalised information
4. Newsletter
5: Email
6: Homepage
7: Other (text input)
x
Table 12: Summary of indicators
In the following analysis, the results are presented in sequence if the indicators listed in Table 12 were relevant for the questionnaire and the bills. The survey’s reached 41 valid energy utility responses within a market of 645 companies. The result points out some trends and anomalies in the observed samples. Where appropriate and relevant, a distinction between energy sources is made. Otherwise, the analysis applies to all three energy sources.
7.4.2 Indicators 01: Energy type
Indicator 01 is not relevant for comprehensibility; rather, it is necessary in order to
allow differentiation according to energy source when analysing bills.
differentiate according to the energy source where necessary and to allow the corresponding adaptation of the presented questions while analysing the questionnaires.
7.4.3 Indicators 02: Energy quantity
Indicator 02 enables assessment of the survey's representativeness (comparing size of the recorded energy utilities to the Swiss average). In the survey, delivery quantities were stated according to Table 13.
Energy sources Energy supplied
annually in GWh
CH average11 Survey
Proportion of energy
utilities in %
Proportion of energy
utilities in %
Quantity of energy
utilities
Electricity 0 - 30 48 26 12
<30 - 100 28 39 18
<100 - 300 24 24 11
<300 - 1600 11 5
Gas 0 - 100 29 2
<100 - 300 42 3
<300 - 4600 29 2
Table 13: Analysis of survey: delivered energy quantities
11 According to M. Mühlebach, (2012,2)
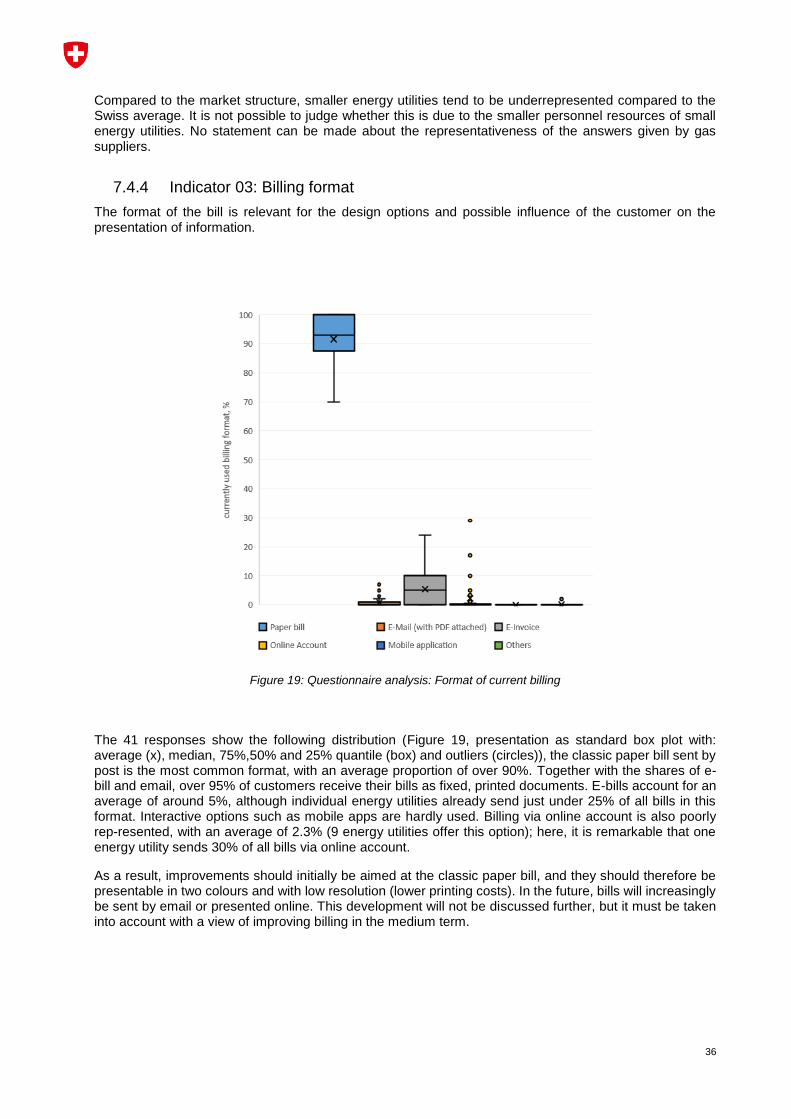
36
Compared to the market structure, smaller energy utilities tend to be underrepresented compared to the Swiss average. It is not possible to judge whether this is due to the smaller personnel resources of small energy utilities. No statement can be made about the representativeness of the answers given by gas suppliers.
7.4.4 Indicator 03: Billing format
The format of the bill is relevant for the design options and possible influence of the customer on the presentation of information.
Figure 19: Questionnaire analysis: Format of current billing
The 41 responses show the following distribution (Figure 19, presentation as standard box plot with: average (x), median, 75%,50% and 25% quantile (box) and outliers (circles)), the classic paper bill sent by post is the most common format, with an average proportion of over 90%. Together with the shares of e-bill and email, over 95% of customers receive their bills as fixed, printed documents. E-bills account for an average of around 5%, although individual energy utilities already send just under 25% of all bills in this format. Interactive options such as mobile apps are hardly used. Billing via online account is also poorly rep-resented, with an average of 2.3% (9 energy utilities offer this option); here, it is remarkable that one energy utility sends 30% of all bills via online account.
As a result, improvements should initially be aimed at the classic paper bill, and they should therefore be presentable in two colours and with low resolution (lower printing costs). In the future, bills will increasingly be sent by email or presented online. This development will not be discussed further, but it must be taken into account with a view of improving billing in the medium term.

37
Indicator 04: invoice settlement
Whether a bill is viewed by the customer strongly depends on the payment option used, and is an important factor impacting the way the information is perceived by the end-user.
Figure 20: Questionnaire analysis: invoice settlement
Figure 20 shows that in almost 95% of cases (payment slip and e-bill together), the customer explicitly perceives the bill amount (and thus any changes in consumption) and further information contained in the bill is accessible to the customer without additional effort. It is noteworthy that 50% of one energy utility's bills are paid by e-bill. In the direct debit procedure (6% of all bills, in exceptional cases more than 30% of an energy utility's bills), additional information can be viewed by the customer only with additional effort. Changes in costs (and thus in consumption) are presumably only perceived above a certain level.
It was shown that, in practice, information contained in current bills can reach the customer, who can perceive it without being hindered by any additional effort. An improvement of the printed bill reaches a large proportion of customers, and therefore makes sense.
Indicator 05: Payment method
In addition to the frequency of billing, the amount of the billed amount is influenced by the payment type - the more often bills are issued, the smaller the billed amount and the smaller the changes made (e.g. as an indicator for the increase in consumption).
Figure 21: Payment method’s share of the energy bill in Switzerland

38
Figure 21 shows that, according to the survey’s results, either one bill is issued for the entire accounting period or payments on account are made in almost equal proportions. Other payment methods are barely relevant.
The analysis of the collected bills shows a slightly different picture - 67% of advance payments are made for electricity and 65% for gas (see Figure 22). For the portion designated as "unknown", an advance payment is not mandatory; based on the analysed bill, payment on account is merely not explicitly listed.
Figure 22: Collected bills: share of bills with payments on account, % (left for electricity, right for gas)
Indicator 06: Frequency of billing
The bill can contain additional information as energy usage and comparison. To trigger a behaviour change
in energy consumption it is relevant how often this information is presented to the customer. Consequently,
the frequency of how often the costumer receives the bill is important in terms of behavioural change
potential.
Figure 23: Questionnaire analysis (49 responses): Frequency of billing
It turns out (cf. Figure 23) that in more than 50% of all cases energy utilities bill their customers twice a year on average. With an average of 25% or 20%, quarterly and annual bills almost make up the remainder. It is interesting to note that some energy utilities issue annual bills to more than 85% of their customers.

39
The results of the survey are confirmed by the analysis of the collected bills ran alongside (cf.Figure 23).
Figure 24 : Analysis of bills: Frequency of bill delivery, % (left: electricity, right: gas)
The majority receives the bill on an annual basis as shown in Figure 24.
7.4.5 Indicators 07 to 09: Statutory requirements
According to section 7.2.3, the minimum requirements for the information presented are clearly defined. There is a scope for the type (numerical or graphic) and location (on which page) of the presentation of relevant indicators according to section 7.2.9.1 and section 7.2.9.3.
Figure 25 shows that, according to the survey, consumption according to tariff levels (according to statutory requirements) is (almost) always presented numerically, while graphically on less than 5% of bills. Total consumption is presented numerically in slightly more than 60% of bills and graphically in approbatively 10% of bills. Tariffs are presented numerically in almost 100% of bills, but graphically only in less than 5% of bills. Graphic representation of costs is rare and, if available, it is often linked to representation of the proportions of fees, energy costs, grid usage, etc.
Figure 25: Analysis of bills: presented values (electricity)
Indicator 07: Representation of consumption
Consumption during the measurement period can be presented either as total consumption or according to rate levels (high and low rate). When comparing total consumption, only one value needs to be compared, and general and specific comparisons usually refer to total consumption. When comparing

40
according to rate levels, it is easier to limit changes in terms of time (e.g. an increase in the low rate means a change in behaviour at night or on public holidays).
The evaluation of the collected bills shows that in most cases the total consumption of the measuring period in kWh is presented on the second page. The total consumption (electricity) is graphically presented on about 10% of bills, whereby the presentation of the total consumption is always part of a consumption comparison (cf. Chap.7.2.4). For gas, the rate level is the standard rate (price per m3). This is usually shown (over 50%) on page 2, and graphically on just under 5% of collected bills (as a comparison of consumption).
Figure 26: Analysis of bills: Location and distribution of the presentation of total consumption in kWh
The location and frequency of the presentation of consumption according to tariff levels (high and low tariff or unit tariff for gas) can be seen in Figure 27.
Figure 27: Analysis of bills: Location and distribution of consumption by tariff levels
The analysis of the survey shows that the self-perception of the energy utilities differs slightly from the analysis of the bills: around 17% of energy utilities (47 relevant responses) state that the total consumption is presented graphically, which is a higher proportion than was determined during the analysis of the bills.
Figure 26 shows for the survey, on which page the energy consumption is presented. In accordance with the analysis of the bills, consumption is usually presented on page 2 of the bill.

41
Figure 28: Analysis of survey (48 responses): Presentation of consumption
The survey shows significantly higher proportions for the presentation of energy consumption on page 2 (80%) than the analysis of the collected bills (more than 40%). The numerical values of the results are only partially comparable. On the one hand, in the analysis of the survey only responses are considered, which responded on that question (100% of respondents, with 48 bills). On the other hand, in the survey, the question on which page the consumption is stated is not posed precisely. Because the respondent can answer according to the place of total consumption and or consumption according to tariff levels. Consequently, this leads to different results in the analysis of the survey and bills.
A graphic comparison of total annual consumption is shown in the calculation of Gruyère Energie SA GESA (Figure 29).
Figure 29: Excerpt of GESA (electricity) bill graphic, 2016, page 2
An example of numerical and graphic presentation of consumption according to tariffs is shown in the bill from Technische Betriebe Glarus TGB ().
Figure 30: Excerpt from TBG (electricity) bill, 2013, page 2

42
Prominent presentation of consumption on the front pages is desirable and useful. The proportion of graphs is small, and when used as part of a comparison, it contributes to understanding one's own consumption. A combination of total consumption and consumption according to tariff levels can contain additional information and may be useful.
Indicator 08: Presentation of costs
The allocation of costs (in energy costs, fees, levies, etc.) is prescribed by law according to section 7.2.3. Presentation of a large amount of additional information makes comprehensibility and clarity difficult (Figure 7).
As the most important information on the bill, the total energy costs are shown numerically on the first page in over 50% and on page 2 in over 30% of the electricity bills. For gas bills, the total energy costs are slightly more often shown on page 2 (see Figure 31).
Figure 31: Analysis of bills, presentation of total cost
The composition of costs (energy, fees, charges, etc.) is usually shown numerically on the first two pages of electricity bills. In the case of gas bills, the proportion shifts slightly to the third page (cf. Figure 32).
Figure 32: Analysis of bills, Presentation of cost composition

43
The analysis of the survey (Figure 33) shows that over 90% of the bills show the costs on the first page (over 50% on page 2) and over 15% on the third page. The bills may repeat the total costs on several pages, consequently is the sum of the proportion higher than 100%.
Figure 33: Analysis of survey (47 responses): Presentation of costs
Since only answers that specified the location, where the costs are presented (100% = 47 bills), were evaluated in the survey, the result is significantly higher than in the analysis of the collected bills. The analysis of the bills also differentiated between energy costs (= share of energy in total costs) and total bill amount (=energy costs plus charges, fees, etc.); the survey asked for costs that were not further specified.
A graphic breakdown of the individual cost proportions appears to be particularly helpful here, but according to the survey it is only shown for electricity on about 5% of the bills (cf. Figure 25). An example of graphic presentation can be found, for instance, in the bill of Romande Energie as shown in Figure 34.
Figure 34: Excerpt from a Romande Energie Commerce SA bill (electricity), 2015, page 2
The analysis of the survey is well in line with the separate analysis of the bills with regard to the way costs are presented: just under 5% of energy utilities out of 47 state that costs are also presented graphically.
With regard to increasing efficiency, knowledge of cost components is barely relevant and information about them does not meet any customer needs. Bills can be improved by presenting relevant information more prominently and by moving this information to the back pages, which are given less attention.
Indicator 09: Energy mix
In accordance with the requirements for electricity labelling (cf. Chap. 7.2.3), customers must be informed at least once a year about the origin of the electricity supplied. As shown in
Figure 35, this labelling is rarely printed on the bill. Some energy utilities offer different, more sustainable products, e.g. "ewz solartop" electricity or "IWB Biogas Plus" gas. In just under 5% of bills (electricity), electricity labelling is then presumably presented somewhat more frequently for marketing reasons (cf. Figure 39 Erreur ! Source du renvoi introuvable.).

44
Figure 35: Analysis of collected bills, Electricity production’s mix
The analysis of the survey for electricity shows a somewhat different picture (Figure 36), according to the responses, the energy mix should be shown on around 30% of the electricity bills. The random comparison of answers and bills from the same energy utilities suggests that the question in the survey may have been misunderstood by the utilities or that self-perception may differ from reality.
Figure 36: Analysis of survey (36 responses): Electricity production’s mix
Due to the small number of usable responses (2 or 1), no analysis of the survey for gas and district heating was carried out.
When asked about the representation of the energy mix, 84% of energy utilities stated that they presented it numerically (graphic presentation: 18%). And 12% of energy utilities reported energy mix information on the first page, and the remaining show the energy mix on the second or third page on equal proportion.
In view of the differing results of the separate bill analysis and the questionnaire, it can be assumed that the questionnaire answers refer to the availability of information (e.g. incl. website, or also to rate levels) and not only, as intended, to the information on electricity labelling shown on the bill (electricity labelling).
Figure 37 shows an example for the numerical and graphic presentation of special products of the energy mix.

45
Figure 37: Excerpt from GESA (electricity) bill, 2016, page 3
The bill of Repower allocates consumption to products purchased (Figure 38). The electric energy, the tariff and the total costs are listed according to the energy products derived from hydro power systems (Aquapower), mixed ecological power systems (Purepower) and solar power systems (Solarpower) dependent on day- and night- time.
Figure 38: Excerpt from Repower (electricity) bill, 2015, page 2
If the energy utilities has a higher gain margin on eco products then it can be of interest that the costumers switches the energy product to such one. Some energy utilities deliver comparison and estimations how much the additional costs are (cf. Figure 39Erreur ! Source du renvoi introuvable.) or by pointing to an improvement in the customer's own ecological assessment (cf. Figure 40), if switched to an eco product to trigger a consideration.
Figure 39: Excerpt from bill insert 4_2016 of the Nidwalden cantonal power station

46
Figure 40: Excerpt from IWB (gas) bill; 2016, switch to biogas to improve personal ecological assessment, page 3
If information on the energy mix is presented more frequently and ideally also graphically on bills, this can
increase the customer's motivation to change their behaviour. If this results in a change to another
product, this can also be financially interesting for the energy utility.
7.4.6 Indicators 10 to 12: Comparative values
The comparison of one's own consumption is a useful mean of classifying one's own consumption, and thus identifying any potential savings (see section 7.2.4). A comparison with one's own consumption in past periods is easy to present; comparison with e.g. Swiss average values, or more specific values such as e.g. consumption by similar households, is more complex.
The analysis of the bills shows accordingly that, in over 50% of bills (electricity), the comparison with the customer's own historical consumption is presented (Figure 41), whereby more than 10% of electricity bills also opt for graphic presentation (derived from section 7.4.5.1).
Figure 41: Analysis of collected bills: Historical comparison with customer's own consumption (electricity)
However, none of the analysed bills compare the customer's own consumption with Swiss averages or more specific values. This essentially corresponds to the results’ analysis of the survey (cf. Figure 42).
Figure 42: Analysis of survey (50 responses): Comparison with customer's own consumption (electricity)

47
The analysis of the location of comparative value presentation follows a similar tendency as the analysis of bills, but the proportions are somewhat higher as shown in Figure 43.
Figure 43: Analysis of survey (27 responses): Presentation of comparative values
Example of comparison of the customer's own consumption with consumption in previous periods are shown in section 7.4.5.1.
The Industrielle Werke Basel (IWB) bill shows the difference to consumption in the previous year as a percentage and (although the basis for the assessment is unclear) indicates whether the change lies within the "tolerance range" or gives a reason for an in-depth analysis (Figure 44). For example, according to a study from Sweden, 80% of households want to be warned, if their electricity consumption suddenly rises (Duscha et. al., 2007).
Figure 44: Excerpt from IWB (electricity) bill, 2017, page 4
The comparison of consumption with previous periods is useful and desired by the customer and is easy to include in a bill by simply entering the percentage change. Please note the comparable reference basis (reference period, climatic conditions, etc.). Even better are comparisons with other reference values, which allow a classification of one's own consumption in comparison to other customers. Comparisons should be presented more graphically to improve comprehensibility, and placed on the first pages for good visibility.
7.4.7 Indicators 13 to 15: Savings potential
Only one of the analysed bills provides some general savings potential tips, cf. Figure 45. More specific potentials, e.g. compared to the Swiss average or more specific values, or as cost savings or environmental impacts, are never stated.

48
Figure 45: Excerpt from group-e (electricity) bill, 2015, page 2
Savings potentials are based on comparisons and simultaneously stimulate the motivational factors of "Can" and "Want". They therefore stimulate a change in behaviour for greater efficiency. An improvement of bills can be achieved by showing more savings potentials, especially if these are graphically presented.
7.4.8 Indicators 16 to 17: Environmental impact
The analysis of the collected bills shows that no environmental impact indicators (e.g. eco-indicator 99, environmental impact point, CO2 emission, etc.) were stated for electricity, gas or district heating.
Due to statutory requirements in Switzerland (ElCom, 2016), however, the costs of the CO2 tax are listed for gas bills, which can be understood in a broader sense as an environmental impact.
An example of a general statement on the effect of an energy vector change can be found in the bill presented in Figure 46.
Figure 46: Excerpt from IWB (gas) bill, 2016, page 3
The survey showed that only about 5% of energy utilities include in the bill the environmental impact of customer's own consumption. Due to the small number of responses, the location of the presentation of such information on the bill’s pages was not analysed.
As the statement of environmental impact makes the abstract quantity "energy" easier to grasp, its presentation can help customers to understand their own consumption, and thus stimulate a change in behaviour.
7.4.9 Indicator 18: Availability of tips and recommendations
In the separate analysis of bills, general hints and tips were only found in two bills (electricity) (example in Figure 45). Explanations of bills were listed on 20% of bills, on the back pages (cf. Figure 47).

49
Figure 47: Analysis of bills (electricity), presentation of tips
The analysis of the survey conveys a different picture. According to the responses, energy-saving tips are presented on around 20% of bills, and around 20% of energy utilities offer tips on their websites. The random check showed that the question may have been misunderstood by energy utilities and, for example, bill inserts (additional information on additional paper, supplements) were considered. However, bill inserts are not an integral part of a bill and should not be considered.
Figure 48: Analysis of survey (49 responses): Presentation of energy-saving tips (electricity)
According to analysis of the survey, tips tend to be shown on page 3 (75%), which corresponds to the
analysis of the collected bills (Figure 49).
Figure 49: Analysis of the survey (8 responses): Place of presentation of energy-saving tips
General tips can provide impulses and point out motivational possibilities for "Can". An increase in presentation on the consumers’ bill is desirable, as this is a way to reach a large number of customers.

50
7.4.10 Indicator 19: Availability of explanations on bills
According to the analysis of the collected bills, explanations are presented on 20% of bills (Figure 50). This is considerably more than the value determined by the survey (around 5%, cf. Figure 51).
Figure 50: Analysis of bills (electricity): Explanations and tips on the bill
The offer to provide explanations on the website (>60%) or via a contact address (just under 50%) is widespread (cf. Figure 51).
Figure 51: Analysis of survey (49 responses): Presentation of explanations on bills (electricity)
Explanations should be included in bills in order to improve comprehensibility, but can also be presented on the back pages.

51
7.4.11 Indicator 21: Volume (number of pages)
The analysis of the survey (Figure 52) shows that an average bill contains 2.7 pages, with an additional page as an attachment. The longest bill contains 9 pages, and the shortest a single page. Attachments are not always provided. Attachments contain a maximum of six pages.
Figure 52: Analysis of survey (48 responses): Number of pages
Essentially, short and concise bills are desirable with regard to the findability of information. Compliance with this requirement is often difficult due to statutory requirements (statement of cost components) and customer needs (e.g. explanations).
7.4.12 Indicator 20, 22: Type of presentation, location of presentation
These indicators are integrated into the other appropriate indicators where they make use of it.
7.4.13 Indicator 23: Installed meters
According to the survey, the following meters are currently installed according to Figure 53.
Figure 53: Analysis of survey (44 responses): Meters currently installed (left: electricity, 44 responses, right: gas and
district heat-ing, 8 responses)

52
It can be seen from Figure 53, that more than 90% of the currently installed electricity meters do not allow remote reading. Nevertheless, for some energy utilities, 100% of the devices they operate have remote reading (digital meters or smart meters).
Gas and district heating are always measured using analogue devices. Only one energy utility has installed 45% of digital meters with and without remote reading.
The effort for taking a reading is directly related to the meter. If more frequent readings are possible, the consumption of shorter intervals can be compared.
The example of Repower's bill (Figure 54) shows that consumption can be presented in more detail (monthly and aggregation to quarters (Q)). However, it is not known which type of meters were used.
Figure 54: Excerpt from Repower (electricity) bill, 2015, page 4, reworked
Indicator 24: Installation of meters in the medium term
According to the survey, energy utilities will install significantly more meters with remote reading in the medium term. Analogue measuring devices are operated by only 10% of energy utilities and digital measuring devices without remote reading by over 30% of energy utilities (Figure 55).
Figure 55: Analysis of the survey (43 responses): Meters installed in the medium term (electricity)
Meters for gas and district heating installed in the medium term (7 responses) will be analogue (almost 30% of energy utilities), digital without remote reading (almost 15%) or digital with remote reading (>70%). Here there is too a trend towards remote reading.
It can be assumed that the proportion of smart meters will increase significantly, as there has been an obligation to increase the roll-out of smart meters since adoption and implementation of the Energy Strategy 2050.

53
Indicators 25 and 26: Additional customer information
Additional information about the customer enables further analysis and evaluation of consumption (see section 7.2.11). The survey’s question about additional information on the customer was only answered twice, with one energy utility stating that the customer can provide the information him/herself.
No examples of the inclusion of additional information about the customer were found in the bills. This is probably due to the obstacles linked to obtaining such information and described in section 7.2.11.
In the EKZ bill (cf. Figure 56), the consumption comparison is related to the same historical reference period, it is visualised as a bar chart and the percentage change is also presented. The customer can thus quickly read whether and by how much his/her consumption has changed.
Figure 56: Excerpt from EKZ (electricity) bill, 2016, page 2
The IWB bill (Figure 57) refers to the dependence of heating consumption on climate. However, additional information (e.g. conversion based on publicly available information on the heating degree days of the site) is not used. In the IWB bill (Figure 44), it is also stated whether the change is within normal bounds (although the basis of this statement is unknown).
Figure 57: Excerpt from IWB (gas) bill, 2016, page 4
While additional information about the customer should not be presented on an improved bill, its availability is crucial for the energy utility's ability to analyse and present more customized information.
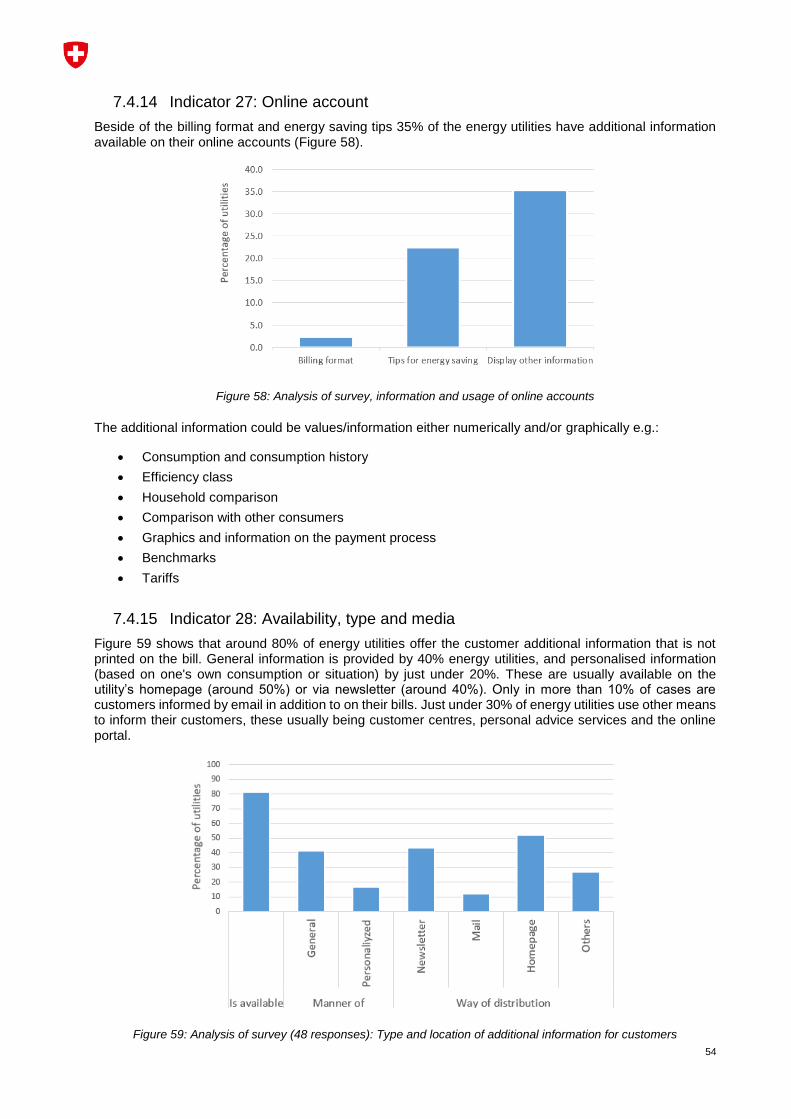
54
7.4.14 Indicator 27: Online account
Beside of the billing format and energy saving tips 35% of the energy utilities have additional information available on their online accounts (Figure 58).
Figure 58: Analysis of survey, information and usage of online accounts
The additional information could be values/information either numerically and/or graphically e.g.:
Consumption and consumption history
Efficiency class
Household comparison
Comparison with other consumers
Graphics and information on the payment process
Benchmarks
Tariffs
7.4.15 Indicator 28: Availability, type and media
Figure 59 shows that around 80% of energy utilities offer the customer additional information that is not printed on the bill. General information is provided by 40% energy utilities, and personalised information (based on one's own consumption or situation) by just under 20%. These are usually available on the utility’s homepage (around 50%) or via newsletter (around 40%). Only in more than 10% of cases are customers informed by email in addition to on their bills. Just under 30% of energy utilities use other means to inform their customers, these usually being customer centres, personal advice services and the online portal.
Figure 59: Analysis of survey (48 responses): Type and location of additional information for customers

55
7.5 Chapter’s conclusions
The bills of Swiss energy supply companies are often difficult to understand and unclear for laypeople. The evaluation of 91 bills and 54 (valid) responses (to the survey) shows a great potential for improvement in many areas.
The most widespread type of billing today is paper bill with payment slip. Although other digital delivery methods (online account, e-bill, etc.) are increasingly being used in other markets (e.g. telecommunication). Improving billing with regards to printed bills (paper or in PDF format) is potentially the most effective solution, as over 90% of customers currently receive their bills in this form.
Information about one's own consumption and energy costs is of great interest to the customer, so the actual placement on the first page makes sense. Much of the information provided due to statutory requirements (allocation of costs, consumption according to rate, etc.) is also often presented on the first page, but can also be presented on the back page of the bill, which has received less attention due to the low level of interest shown by customers.
Easy-to-understand graphic presentations are rare and often do not appear on the first pages, where the attention of the customer is higher. The bills contain hardly any information that helps customers to compare their consumption to a reference value and that encourages them to reduce it.
Comparison with one's own previous historical consumption is common, but comparisons that allow a classification of one's own consumption (e.g. with the average Swiss consumption of similar households) are never made. One major obstacle for providing such data by energy utilities is the difficulty in retrieving such additional information about the consumer (e.g. number of persons in the household) or the building (e.g. type of hot water supply).
In particular, graphic comparison with one's own historical consumption is now usually easy to implement by energy utilities, along with information desired by the customer. Today, it is presented on more than half of all bills in numeric form, but in graphic form, on only ca 10% of bills. Helpful information on the correct interpretation of changes, e.g. whether fluctuations, are caused by different climates ("cold winters") or different measuring times, or are within the usual range, is only provided in individual cases.
Further comparisons (to the Swiss average, or more specifically, depending on the building or the number of residents) are not offered (Figure 42) on bills due to a lack of information about the customer. The lack of comparisons is probably also the reason for the complete lack of presenting savings potentials, which are effective in stimulating efficiency increases.
Information on environmental impact that makes it easier to "grasp" the consumption of energy, which is otherwise difficult to understand, is practically never shown on bills, although corresponding information (e.g. CO2 balance of the consumer mix) is available for energy utilities.
Electricity labelling, as required by law, is used only in individual cases. However, particularly with regard to special products, such as "Nature made" electricity, presentation on the bill makes sense and can also be financially interesting for energy utilities in the event of a consequent product change.
General energy saving tips and recommendations (e.g. intermittent full ventilation instead of tilted windows) are simple and may affect behavioural changes. The bill is an appropriate media to communicate such information and reach a large proportion of customers. This option is rarely used (around 3% according to the analysis of the bills).
Energy utilities with a high proportion of smart meters with remote reading are not increasing the use of electronic bills or online accounts. However, one energy utility with 100% installed smart meters also accounts for, by far, the highest proportion of bills delivered via online account (29%). There is no correlation between the type of meter and the frequency of bills or information on bills.
As many energy utilities seem to be aware that electricity bills are difficult to understand, they offer explanations to bills. Explanations are usually available on energy utilities' websites (60%) or through personal contact (50%), and not on the bill itself. This seems to make sense with regard to the volume of the bill.
Additional information (e.g. graphics and information on the payment process, benchmarks, tariffs…) is offered by many energy utilities (>80%), albeit usually not on the bill, but online (website: 50%), or in

56
newsletters (40%). In this case, personalised information is provided much less frequently (just under 20%) than general information (more than 40%).
Many energy utilities meet only statutory requirements, but provide hardly any further information. Consequently, bills are often very similar in terms of content and presentation. By adding further information, tips, graphical representation of information etc. the energy utilities can establish customer retention, position themselves and aim at triggering a behavioural change in energy consumption, which can result in energy saving.

57
8 Existing DSI in foreign countries
Research on ways to improve the utility bill so as to give residential customers more control over their energy use has been going on since at least the 1980s, when utility companies first introduced Demand-Side Management (DSM) programmes aimed at stimulating customers to modify their consumption patterns, both in the period of the day time and in the overall amount of energy consumed (Gellings and Chamberlin, 1988). Such DSM programmes have recently been regarded as even more valuable and powerful tools, now that it is widely acknowledged that the society as a whole, and therefore customers as well, play a role towards carrying out the energy transition and achieving international climate and environmental protection goals.
Thanks to the fast diffusion of Information and Communication Technologies, and the related diffusion of smart metering systems, detailed information on individual consumption patterns is nowadays becoming easily available to utility companies. A basic understanding of individual monthly and possibly daily or even hourly energy consumption would represent a large shift of awareness for private customers, possibly acting as trigger towards energy saving. In fact, many companies started offering innovative DSM programmes for their customers, not only providing them with information on their energy consumption patterns (by means of web and mobile platforms), but also stimulating them to energy saving by means of customized behaviour change programmes and home automation control tools.
In such a framework, in order to build effective DSM programmes, it becomes essential understanding:
if and how utility companies are providing customers with information on their energy consumption patterns,
if the way such information is provided is effective in increasing customer awareness and in motivating them to engage in energy-saving activities,
and identifying possible ways to improve common current little effective practices.
Therefore, the provision of information to customers is refered as “Demand-Side Information (DSI) programmes”.
In this document, the results of a comparative analysis on DSI programmes in Europe and overseas are presented; in particular, it has been focused on the most common DSI programme, which is the energy bill itself: a simple, low cost solution, which is provided to the entire customer base (Dromacque et al., 2013), therefore particularly appropriate to a comparison at the international level. Such an analysis was carried out in parallel to a matching analysis performed at the national level, within chapter 7 of the IMPROVE project.
8.1 Methodology
Main aim of this research was to gain a broader insight into the main informative contents and design elements of electricity, gas and district heating DSI programmes currently provided by energy utilities across Europe and overseas, in order to allow the identification of:
widespread practices, tools and activities,
possible future trends,
thus supporting elaboration of recommendations for three IMPROVE solutions.
It is important to remark that energy utilities are increasingly promoting and expecting customers to move on-line to access more detailed information about their consumption and bills. In fact, online tools (webportals, smartphone applications, In-Home Displays, etc.) enable the exploitation of (near) real-time consumption data from smart meters and a more personalized monitoring and targeting. In the present research, however, it is not possible to systematically analyze web portal functionalities and electronically-accessed DSI programmes offered by current energy utilities, as these need a personal account and password for access.
Consequently, main focus in this research refers to energy bills, despite the proliferation of smart meters and smartphones, with only marginal and partial analysis of webportals and other DSI programmes. Yet, energy bills still represent a cost-effective feedback device with a broad reach and the principles of information design that make a good energy bill likely also make a good website and webportal.

58
Also, it has been noticed that the present data collection and assessment intentionally focuses only on DSI programmes targeting residential customers, as said with a main focus on their energy bills. Business energy bills and DSI programmes largely differ both in context and in possibilities to save energy, therefore will need further separate investigation.
Collection and analysis of information regarding energy bills was performed according to the methodology summarized in Figure 60. First, a literature review has been carried out, in order to identify general past and present practices and elements characterizing “good” DSI programmes, with a focus on energy bills. This allowed us to identify a set of indicators, as a frame of reference to assess energy bills. Then, in parallel, the following data collection activities has been performed:
an online survey questionnaire targeting European and overseas utility companies;
an Internet search on utility companies’ websites directly aimed at collecting demonstration bills and, whenever possible, also information on other DSI programmes they offered;
an informal collection of bills from the networks of personal contacts of the whole group of IMPROVE researchers.
As a result, a number of energy billshas been collected from utility companies worldwide (in some cases also accompanied by information on their webportals and other DSI tools), which were analysed by means of the set of indicators indicated above. The resulting matrices of assessment allowed us to:
investigate widespread practices, tools and activities;
highlight good practices and particularly innovative DSI elements.
Figure 60 The methodology used to identify and analyze existing DSI programmes abroad, with specific focus on energy bills.
8.2 Literature review
Literature review was performed with the aim of identifying a series of billing content and design elements a «good» Demand-Side Information (DSI) programme should contemplate to encourage also energy-saving and management.

59
To this purpose, the review took into account:
legal billing requirements;
current scientific literature on the efficacy of different energy feedback mechanisms and good practice experiences;
recommendations, suggested templates, self-regulations etc. elaborated by service providers, national energy regulatory authorities, and consumer protection associations.
In regards to what kind of information the energy bill should provide to their respective consumers, every nation has some kind of regulations in place – from minimum legal requirements or recommendations, to more prescriptive approaches. This depends not only on regulatory traditions, but also on the type and level of energy market development each nation is experiencing.
With the progressive liberalization of the energy market in general, various efforts are being made to create and promote a competitive retail market, as well as to guarantee the protection of consumer interests. This has led to a widespread development of recommendations for consumer-friendly electricity and gas bills. Of course, the ultimate challenge being to strike a balance between too much versus too little information appearing on energy bills. At European level, with the introduction of Directive 2009/72/EC and Directive 2009/73/EC concerning common rules for the internal energy market first, and Directive 2012/27/EU as a follow up on strengthening or providing new measures to improve energy efficiency in energy supply and demand, various efforts have been made to improve informative contents of energy bills, also by means of participatory stakeholder approaches.
For instance, already in 2009, on the basis of recommendations made by a European Commission working group on billing, created in response to the 1st Citizens’ Energy Forum, a voluntary “Good Practice Guidance for Billing” was developed (ERGEG, 2010). Even though here improving market transparency remains the focal point, with priority billing items being those referring to accounting details and key information on comparability of offers, secondary billing items actually include also information on (i) evolution of consumption during last year(s), (ii) tips on energy-savings or green tips and (iii) product mix per energy source and global mix of supplier.
8.2.1 A frame of reference to analyze DSI programmes (with a focus on energy bills)
The performed review has confirmed that, next to guaranteeing transparent accounting of charges for obvious retail market reasons and customers’ trust-levels, an improved energy bill should also include innovative energy feedback elements such as comparative statistics, information on climate and environmental impacts (eco-feedback), pro-active (possibly personalized) energy-efficiency tips and advices, as well as specific contact information. Availability of such elements is found to be capable of motivating the customer to take concrete action and engage in energy-saving practices at home (Foster & Alschuler, 2011; Dromacque et al., 2013).
Figure 61 summarizes the key categories of DSI elements which characterize effective DSI programmes, and in particular energy bills, as identified in the literature review. They have beenused as a frame of reference for classifying energy bills collected during this research.
Figure 61 Main categories of DSI elements characterizing effective DSI programmes, in particular energy bills.

60
More in detail, each category can be split in a number of indicators, which account for specific aspects. The full list of considered indicators is represented in Table 14. As a reference, only the indicators for electricity (E) bills are shown here. Corresponding lists of indicators were considered for gas (G) and district heating (DH) bills, adjusted with minor differences in order to take into account of peculiarities of each form of energy. The full list of indicators is presented in Appendix 5.
Besides the four categories indicated in Figure 61, an additional indicator has been included in order to take into account any innovative DSI element that, though not directly included in the bill, the utility company presents to customers through the bill or the website, such as for example webportals, customer fidelity schemes or home automation programmes.
TRANSPARENT ACCOUNTING
E01. Meter reading type (estimated or actual) E02. Total amount due E03. Disaggregation of billing costs (energy usage, taxes, network charges etc.) E04. Energy usage in kilowatt-hour [kWh] E05. Unit rate of energy [costs/kWh] E06. Visual chart breakdown of billing costs into its different components (retailer, state taxes, distribution
system operators, etc.) E07. Other (specify)
COMPARATIVE STATISTICS
E08. Average daily energy use and costs (over the given billing period) E09. Graph of energy use over billing period E10. Graph of historical energy use over past 12-14 months E11. a - Current energy usage compared to previous month E11. b - Current energy usage compared to previous year (same period) E12. Current energy usage compared to other similar households E13. Current energy usage compared to average consumption of similar households in the same area E14. Energy consumption pattern variation according to different seasons E15. Correlation between energy consumption and temperature/weather conditions over billing period E16. Average account of electricity use by major appliances E17. Household specific account of electricity use by major appliances E18. Other (specify)
ECO-FEEDBACK ON CLIMATE AND ENVIRONMENTAL IMPACT
E19. Breakdown of fuel mix used as energy sources for the given bill E20. Alternative metrics (e.g. CO2 equivalent emissions, carbon footprint or other eco-feedback) based on
current billing period E21. Other (specify)
TIPS & ADVICE
E22. One-size-fits-all, general energy-saving tips and advices E23. Customized, actionable insights to manage energy costs & consumption E24. Advice on time-of-day tariffs or other dynamic tariffs (e.g. cost of running appliances at different times of
day) E25. Explanation of key terms (e.g. kWh, m3, specific surcharges etc.) E26. Contact info on customer service offering customized energy-efficiency specific consultancy E27. Other (specify)
INNOVATION
E28. Innovative approaches
NOTES AND COMMENTS
E29. General comments
Table 14 The list of indicators used to assess energy bills, grouped per category. As an example, only the set of
indicators used to assess electricity (E) bills is shown here.

61
8.3 Data collection
8.3.1 Online survey/questionnaire
The online survey was designed in order to collect information regarding the key elements emerged from the literature review, with specific reference for the indicators shown in Table 14. Actually, three separate online questionnaires were designed, all sharing the same structure and questions, though customized in order to get specific information respectively regarding Electricity, Gas and District Heating bills and the related DSI programmes offered by the company to their customers.
The complete questionnaire is made available in Appendix 6. A few introduction questions asked about billing format (paper bill, electronic bill, webportal, etc.), plan (balanced, pre-paid, etc.), paying scheme (availability of direct debit schemes) and billing frequency (monthly, bi-monthly, irregular, etc.) and the percentages of the residential customers of the company adopting each of them.
Then, the questionnaire asked about feedback elements they offer in bills for residential customers (transparent accounting, comparative statistics, climate and environmental impacts, energy saving tips and advices): do they provide any of the following information? And, if so, how? A set of multiple choice questions were used. Also, possibility to indicate specific information elements they offer was made available by means of an open-ended question. The utility company was also invited to upload an anonymized copy of their residential customer energy bill.
Then, the questionnaire investigated whether the company offers any smart home devices or functionalities, such as webportals/interactive online tools, mobile phone applications or In-Home Displays (IHD) allowing nearly real-time monitoring of energy consumption, or even remote control systems (smart thermostats, smart plugs, lighting or solar production control systems). Again, a set of multiple choice questions was offered, accompanied by an open-end questions allowing the company to present any innovative programmes they are offering to their private customers in order to engage or support them in energy-saving actions at home. In particular, the questionnaire asked to focus on Information/Education campaigns, gamified energy-saving programmes (e.g. utility-sponsored energy competitions for customers, either individually or in teams, games that employ real-time granular data on player’s energy use as feedback, quizzes, etc.), and customer fidelity programmes (points and prizes).
Finally, the questionnaire investigated the availability of specific studies and analyses performed by the company to assess effectiveness of any of the energy saving measures they had activated by means of enhanced bills or DSI tools, both from the quantitative point of view (effectiveness in terms of energy saved) and from the qualitative point of view (effectiveness in terms of customer satisfaction and/or customer feedback). Also for such questions, the company was invited to upload any documents available to this purpose.
All in all, the questionnaire was made of twenty questions, requesting around fifteen minutes for completion, provided that the related information was already available to the person charged with providing answers.
To collect answers to the questionnaire, first a general search of utilities on the Internet, mainly throughout Europe, was carried out. Thereupon, the selected utilities were contacted via e-mail and invited to complete the online survey and to provide an anonymized bill sample for assessment. The questionnaire was built in English and then also translated in German, French and Italian. Whenever the questionnaire was available in the official country language, invitation to take part in the survey and questionnaire used the local language; otherwise, both invitation and questionnaire were sent in English.
Unfortunately, without the availability of selected reference persons from back-end offices of foreign energy utilities, the only possible interaction point for launching the online survey was their general customer service, advertised on the utilities’ websites. Yet, in many cases, utilities do not even provide a direct e-mail address for contacts on their website, but either request the completion of an online form (with an automated notification system, stating to have received the request and to process it) or provide a customer hotline number with rather long waiting times. Not surprisingly, the online survey did not bring many results. Out of the 200 utilities contacted online via “customer service” (see Table 15 and Appendix 7 for their detailed list), actually no one did answer the survey. So, this activity did not provide us with any bill sample nor data regarding billing information content.

62
Country Electricity Gas Electricity and Gas
District heating
Electricity and District heating
Electricity, Gas and District heating
Total
Austria 12 1 17 4 34
Belgium 12 12
Denmark 1 3 1 5
France 6 1 6 13
Germany 1 33 1 35
Italy 23 23
Poland 1 1
Portugal 9 4 7 20
Rep. Ireland 3 1 4 8
Spain 4 4
Sweden 3 1 1 4 9
The Netherlands 9 21 1 31
United Kingdom 5 5
Total 44 11 133 3 0 9 200
Table 15 Number of contacted utilities to complete the online survey.
8.3.2 Internet search on utility companies’ websites
In parallel to the launch of the online survey, a review of the websites of the 200 foreign utilities contacted was carried out to collect possible standard bill format samples any innovative DSI elements they offered to their customers. For around 60% of such utility websites, it was actually possible to access some form of information and explanation in regards to the general contents and layout of their energy bills. In most cases, the sample bill delivered refers to the annual adjustment balance (subsequent to advanced payment schemes throughout the year). However, some websites only show partial bill samples, usually merely reporting details about the accounting procedure of the bill, but not accessory information on energy consumption and savings. As such, in these particular cases, a more thorough assessment was not possible.
Electricity Gas Electricity and Gas
District heating
Electricity and District
heating
Electricity, Gas and District
heating Total
Australia 2 1 3
Austria 14 9 2 4 29
Belgium 2 2
Canada 1 1
Denmark 1 2 1 4
France 2 2
Germany 19 12 4 35
Italy 4 2 1 7
Portugal 1 1
Ireland 2 3 1 6
Spain 1 1
Sweden 2 1 1 4
Turkey 1 1
UK 2 1 8 11
USA 3 2 2 7
Total 54 33 19 7 0 1 114
Table 16 Number of foreign utility websites reviewed showing samples of the energy bill.

63
Also, as said above, only in some cases information regarding DSI webportals or other innovative tools was
available without password restrictions. Despite this, in some cases interesting practices appeared, as
documented in section 0.
8.3.3 Informal collection of bills from personal contacts abroad
Next to the collection of bill samples via utilities’ websites search, also a more informal gathering system, exploiting the international network of professional contacts, as well as relational (friends, colleagues, family, relatives, etc.) of the whole IMPROVE research team, was adopted. This particular channel contributed to the collection of 67 additional paper bills from all over the world (Table 17).
Electricity Gas Electricity and Gas
District heating
Electricity and District Heating
Electricity, Gas and District
heating Total
Australia 1 1
Austria 1 1
Brazil 1 2 3
Chile 1 1
China 1 1 2
Columbia 1 1
Cyprus 1 1
Czech Republic
3 1 4
Denmark 3 3
Finland 1 1
France 2 2 4
Germany 3 1 4
Greece 1 1
Hungary 1 1 2
Italy 3 3 6
Japan 1 1
Malta 1 1
Netherlands 1 1 2
Norway 2 2
Portugal 5 3 1 9
Ireland 1 1
Romania 1 1 2
Rwanda 1 1
Spain 2 2 4
Sweden 2 2
United Kingdom
2 1 3 6
USA 1 1
Total 41 16 9 0 1 0 67
Table 17 Number of foreign bills collected via friends, family or colleagues abroad.

64
8.3.4 Limitations of the present data collection and final sample of data
An important limitation in this data collection is represented by the language and/or script barrier existing for some foreign countries. While it was easy to review and retrieve targeted information from utility websites and bills of English-, French-, German-, Italian-, Spanish- and Portuguese-speaking countries, websites and bills from, for example, Scandinavian countries were less accessible, as well as countries using non-Latin script systems (Greece, Cyprus, Turkey, Japan, China, etc.). This has unavoidably led to a bias in the selection of information and of bill samples: the bulk of information collected derives especially from English-, French-, German-, Italian- and Spanish-speaking countries (Italy, Germany, Austria, UK, France, Belgium, Spain).
Moreover, some of the bills received from contacts abroad were of low visual quality and consequently difficult to read and/or assess.
Finally, another important factor affecting the final sample of the analyzed energy bills has a more structural nature: the energy market liberalization, as well as the roll-out timing of smart meters throughout Europe and abroad, has reached different levels and consequently depicts a rather patchy situation also at the retailers’ level, as each country approaches these processes in a different way. Consequently, the retail market is very heterogeneous, changing from country to country, offering respectively a higher/lower number of service providers, as well as of service portfolios, infrastructures, legal requirements etc. For this reason, the number of energy bills collected widely differs from country to country.
In conclusion, Table 18 summarizes the sample of energy bills effectively analyzed and assessed.
Electricity Gas Electricity and Gas
District heating
Electricity and District heating
Electricity, Gas and District
heating Total
Australia 3 1 4
Austria 15 9 2 4 30
Belgium 2 2
Brazil 1 2 3
Canada 1 1
Chile 1 1
Columbia 1 1
Czech Republic 3 1 4
Denmark 4 2 1 7
Finland 1 1
France 4 2 6
Germany 22 13 4 39
Hungary 1 1 2
Italy 7 5 1 13
Malta 1 1
Netherlands 1 1 2
Norway 2 2
Portugal 5 4 1 10
Ireland 3 3 1 7
Romania 1 1 2
Rwanda 1 1
Spain 3 2 5
Sweden 4 1 1 6
United Kingdom 4 2 11 17
USA 3 2 3 8
Total 91 48 27 7 1 1 175
Table 18 Number of foreign bills that were effectively analyzed and assessed.

65
Overall, the folowwing bills have been analyzed:
120 bills containing electricity billing data and information;
76 bills containing gas data and information;
9 bills containing district heating data and information.
Due to the limitations above, the present study is not meant to serve as an extensive, quantitative and representative analysis of the energy billing scenario currently present across Europe and overseas. Rather, it is to be interpreted as a qualitative, spot check and collection of energy billing approaches currently offered outside Switzerland: a starting point for suggesting possible contents and design elements to improve energy billing in Switzerland as a measure to enhance residential customers’ energy awareness and motivation towards a more pro-active adoption of energy-efficient practices at home.
8.4 Findings
All the energy bills collected have been analysed on the basis of the indicators shown in Table 14, which resulted in the assessment matrices shown in Appendix 8.
Analysis of such matrices allows us to understand general energy billing tendencies regarding presence and frequency of DSI elements belonging to each of the four categories of indicators (Transparent accounting, Comparative statistics, Eco-feedback on climate and environmental impact, Tips and Advices), together with any other DSI innovative element that the utility company puts into practice.
In particular, it allows us to:
- understand what information is currently commonly included in the energy bill, - and detect possible innovative, intuitive and user friendly contents and design elements, capable
of further motivating residential customers to energy saving.
Hereafter the results obtained are presented, specifically focusing on each category of indicators and each form of energy (electricity, gas and district heating). As indicated above, even though quantitative charts are shown, they cannot be regarded as representative of the whole energy system abroad, and should not be approached from a strict statistical point of view. Rather, they can suggest trends and possible tendencies.
8.4.1 Transparent accounting
Accurate, transparent and understandable accounting is being acknowledged as the primary function of energy bills. In fact, it is the mean by which consumers receive information and understand the price they pay for the service they receive.
Since 2012, in the framework of the respective Energy Efficiency Directive, energy billing is now required to base on real consumption and to provide complementary information on historical energy consumption. However, this latter aspect is being promoted by the European Commission and the Citizens’ Energy Forum more specifically at the level of electronic bills, considered as an effective tool for both payment control and personal energy data management (see: EC’s practical guidelines and Infographs, retrieved online on July 2017 at : http://ec.europa.eu/consumers/archive/citizen/my_rights/energy_en.htm).
Electricity bills
Figure 62 shows the percentage frequency of a series of billing items that have been identified in this study as characterising transparent accounting. Considering the primary accounting function of energy bills, it is not surprising to find that most of the transparent accounting billing items – amount due, disaggregation of billing costs (taxes, network charges, etc.), energy usage in kWh, unit rate (cost/kWh) - are to be found as a regular practice (indicators E02, E03, E04 and E05 are all well above 90%, see list of indicators in Table 14 and Appendix 5). The type of meter reading (indicator E01), i.e. whether estimated or actual, so far prevails in 89% of energy bills assessed. It can surely be considered a common billing feature.

66
Figure 62 Assessment of electricity bills – Diffusion of “Transparent accounting” elements.
Bearing in mind the many actors taking part in energy distribution and supply and composing the wholesale cost of electricity, an accurate, but numeric disaggregation of billing costs alone, might render electricity bills more complicated and unclear. Thus, considering that visual information can help make energy bills more consumer-friendly and improve understanding, it is interesting to notice that a visual chart breakdown of billing costs emerges as a rather rare and/or innovative practice (indicator E06, only 15%, see list of indicators in Table 14 and Appendix 5). However, some countries (e.g. UK, Italy, Germany and Spain), have made the visual chart breakdown of billing costs a rather mainstream practice, as it is shown in Section 8.4.1.4. In Italy, for example, it was made compulsory since 2016 by a national resolution by the Authority for Electricity Gas and Water, under the so-called “Billing 2.0” framework regulation (AAEG, 2014).
Gas bills
Findings for gas bills are similar to those for electricity bills (see Table 14 and the full list of indicators presented in Appendix 5), with the exception that the visual chart breakdown of billing costs is even less practiced here (indicator G06, 10%). This somehow reflects the fact that more innovative elements at first appear in electricity bills and subsequently are replicated in gas bills.
In Germany and the UK, the gas usage is formally converted from m3 into kWh. Accordingly, the accounting section also reports the exact calculations made to reach the energy usage in kWh.
Figure 63 Assessment of gas bills – Diffusion of “Transparent accounting” elements.

67
District heating bills
The number of gathered district heating bills is very low (equal to 9), one reason more not to attribute the data below any representative meaning. Most of the “Transparent accounting” elements are found in 89% of the cases (indicators DH01, DH02, DH03 and DH04, shown in Figure 64; see the full list of indicators presented in Appendix 5). The unit rate of energy costs (indicator DH05) is indicated only in the 78% of the cases. No visual chart breakdown of billing costs has been reported in the district heating billing samples analysed. This is probably due to the lack of distinction between energy and infrastructure and for the lack of specific taxes regarding district heating.
Figure 64 Assessment of district heating bills – Diffusion of “Transparent accounting” elements.
Some good practice examples
The aim of this analysis of utility bills was not only to find which elements are currently commonly included in energy bills, but also to identify innovative elements that are expected to trigger changes in households consumption patterns. Thus, for each category of indicators, innovative elements, as “good practice” examples inspiring the IMPROVE solutions are presented.
ENERGY USE IN kWh
Endesa, Spain. Electricity, 2017 (only in the bill of open market electricity customers).
Generally, private customers are not very familiar with energy consumption data expressed in term of physical units of measurement [kWh]. Instead, they are much more familiar with monetary values. To support customers in understanding kWh and assessing their level of consumption, this bills provides some alternative metrics, which are intuitive and easier to be understood. Energy consumption is in fact expressed as number of days of use of light bulbs. With the aim of also introducing the concept of efficiency as well, three types of bulbs are used as a reference: incandescent bulbs, low consumption bulbs and efficient LED bulbs.

68
VISUAL CHART BREAKDOWN OF COSTS
Enel Energia, Italy. Electricity bill, 2017
A summary is shown in the first page of the bill. Customers interested in more details, can find them in the internal pages of the bill.
Iberdrola, Spain. Electricity bill, 2017
Not all the charts are equally intuitive: the more the details introduced, the less immediate the charts. This example by Iberdrola is simple and easy to read, since if just focuses on main data.
Vattenfall, Germany. Electricity bill, 2017
This example by Vattenfall is very detailed, though probably too rich in numbers and percentages to be easily understood by all private customers: there is the risk that they do not even look at the information provided by the chart, considering it too complex.

69
Prioenergie, Germany. Electricity, 2017
With the aim of providing as much information as possible, though maintaining it easy to understand, this utility company
opted for splitting the costs breakdown pie chart in two charts: with the main pie chart, the company manages to show
that majority of the costs are outside their competence, being imposed by law, and they cannot influence them. With the
bar-chart, instead, they provide details on such law-imposed costs.
British Gas, United Kingdom. Electricity and gas bills, 2017
Abandoning the traditional pie chart representation, this utility company opts for a bar-chart style representation of the cost breakdown, making it more user friendly by replacing bars with icons aimed at intuitively representing gas and electricity consumption.
8.4.2 Comparative statistics
Comparative statistics (both historical and normative) provide the consumer with an effective frame of reference in regards to his/her consumption patterns and performance, allowing for self-evaluation and self-improvement (see for example Wilhite and Ling, 1994 and Fischer, 2008). In this context, the EC’s working group involved in the drafting of the European Good Practice Guidance for Billing, recommend, for example, the adoption of a clear visual presentation of both (i) how the use of energy has evolved during the year and (ii) how the annual consumption compares to the previous year, as visual information can help improve understanding. Drawing from social psychology and behavioural science in general, the most innovative approaches, however, also offer comparisons with similar households living in the same region, in order to activate competitive mechanics and motivating customers to energy efficiency.

70
Electricity bills
In regards to the sample of electricity bills analyzed in the present study, a growing practice emerging is that of comparing the electricity consumption of the given billing period with that of the previous year (indicator E11b, 46%, see list of indicators in Table 14 and Appendix 5). Here approaches on the electricity bill vary from providing just a numeric information to that of a graphical visualization (histograms). As for the visual presentation of the energy usage evolution during the year or during the billing period (indicators E09, E10 and E11b), this seems a rather rare occurrence (4 – 24%).
Figure 65 Assessment of electricity bills – Diffusion of “Comparative statistics” elements.
Next, most “popular”, although still rather occasional, comparative items adopted are the presentation of average daily use and cost calculations (indicator E09, 20% of the cases) and the comparison of the customer’s energy usage with that of similar households (indicator E12, 20% of the cases). Indeed, as for the application of normative comparison (peer households) to energy consumption, recent studies on behavioral change have shown it to be a rather effective motivational trigger (Faruqui et al., 2010; Alcott, 2011; Wemyss et al., 2016).
Another interesting element of those of the “Comparative statistics” group is the correlation of consumptions with temperature and weather conditions (indicator E15), that appears in 15% of the analyzed bills. Consumption variations related to the season (indicator E14) and the typical or household-specific energy usage caused by appliances (indicators E16 and E17) are still niche informative elements, which seem to be in their infancy in regards to their integration as an informative element in electricity billing. However, worth noticing is the fact that various energy utilities invite customers to sign up for an online account to access information on historical and monthly energy usage, seasonal variation and real-time consumption data (e.g N-Power – United Kindgom, Enel Energia - Italy, Synergy - Australia).
Gas bills
As for the electricity bills, the most common comparative statistics element is the current energy use compared to the consumptions of the last year (indicator G11b, 44% of the cases). It is followed by the historical energy usage over the last year (indicator G10, 26%) and consumptions compared to similar households (indicator G12, 21%), while the average daily energy use and costs (indicator G08) and the current energy usage compared to the previous months (G11a) are respectively indicated in around 11 and 14% of the cases. As for gas bills, surely season, temperature and weather conditions impact much more significantly energy usage. Nevertheless, this kind of information (indicators G14 and G15) does not seem to be at all widespread (1%) and might present margin for improvement.

71
Figure 66 Assessment of gas bills – Diffusion of “Comparative statistics” elements.
District heating bills
Respect to electricity and gas bills, district heating bills contain less comparative statistic information, mainly focusing on the historic consumptions over the last year and the current energy usage compared to the previous month and year (indicators DH10, DH11a and DH11b, all registered in 22% of the cases analyzed). Furthermore, average daily energy use and costs (indicator DH08) and current energy usage compared to similar households (indicator DH12) are indicated in 11% of the district heating bills analyzed.
Figure 67 Assessment of district heating bills – Diffusion of “Comparative statistics” elements.

72
Some good practice examples
AVERAGE DAILY ENERGY USE AND COST
Origin Energy, Australia. Sample electricity bill, retrieved online 2017
Customers receive information
on their average daily usage
costs, broken down by tariffs:
peak and off peak tariff.
(respectively, circle on the left
and circle on the right).
Ireland, sample electricity bill used in a large-scale consumer behavior trial, 2011 (CER, 2011a)
These pictures are not taken from actual energy bills used by a company, but were used in a large scale electricity consumer behavior trial in Ireland in 2011, involving more than 4’000 residential customers. Besides the traditional electricity bill, the trial customers also received information on their average daily
consumption patterns, in terms of average cost of the electricity they consumed, per day of the week and hourly
tariff. To better understand differences in electricity cost according to the time of the day, customers were also
provided with a fridge sticker of the chart represented below on the right, which intuitively shows how hourly
tariffs evolve throughout the day.
Ireland, sample gas bill used in a large-scale consumer behavior trial, 2011 (CER, 2011b)
These pictures are not taken from actual energy bills used by a company, but were used in a large scale gas consumer behavior trial in Ireland in 2011, involving around 2’000 residential customers. Besides the traditional gas bill, in the trial customers also received information on their average hourly
consumption patterns (average cost of the gas they consumed), per hour of the day, for average week and week-
end days.

73
AEP, Ohio (USA). Electricity, 2011 (based on OPower Home Energy Report)
This chart shows average daily electricity consumption patterns [kWh]. The chart is also accompanied by a comment indicating the period of the day when consumption is higher, with the goal of stimulating customer awareness (“think of what uses electricity during this time”) and motivating them to energy saving.
CONSUMPTION EVOLUTION DURING THE BILLING PERIOD
Iberdrola, Spain. Electricity, 2017
The chart shows monthly electricity consumptions
[kWh] over the last 14 months, also representing
their average value. Also, it indicates the
corresponding average daily electricity cost and
provides the customer with basic explanations to
grasp the meaning of the unit of measurement of
electricity consumption [kWh], by referring it to
consumption of a bulb.

74
Endesa, Spain. Electricity, 2017
The chart shows monthly energy consumptions [kWh] over the last 14 months, also indicating the total breakdown values per time band and related tariff (peak hour 18-22, off-peak hour 22-8, intermediate peak 8-18).
è nostra, Italy. Electricity, 2017
The chart on the left shows monthly energy consumptions [kWh] in the last 12 months, directly breaking them down per time band and related tariff. The chart on the right shows breakdown of total electricity consumption in the last 12 months, per time band and related tariff.

75
CONSUMPTION COMPARED TO PREVIOUS YEAR
Scottish Power, United Kingdom. Electricity and gas, 2017
The charts provide energy consumption values both in physical [kWh] and in monetary [£] units of Measurement.
Lyse, Norway. Electricity, 2017
This bill shows electricity consumptions on a monthly basis (dark green bars), comparing them with consumptions registered the previous year in the same month (light green bars). The dark green bars show the last twelve months, and the light green bars show consumption from two years ago. Interestingly, focus of this information is on energy-saving activities: instead of neutrally reporting consumptions compared with the previous year, the chart explicitly titles “Have you saved electricity?”, thus stimulating customers to get aware of their consumption level and engage in energy-saving practices.

76
Endesa, Spain. Electricity, 2017 (only in the bill of open market electricity customers).
Red box at top left: The chart shows both monthly evolution of electricity consumption [kWh] over the year and a comparison with the monthly evolution in the twelve previous months.
Red box at bottom right: the bill also offers an aggregate indicator to assess evolution over the seasons (increase or decrease of consumption respect to the previous year and the same billing period in the previous year).
COMPARISON WITH SIMILAR HOUSEHOLDS
Scottish Power, United Kingdom. Electricity and gas, 2017
The chart compares average daily energy consumption respect to similar households, both in physical [kWh] and
monetary [£] units of measurement. It also provides a scale to support customers in assessing their consumption
level (high, medium, low consumption). As for identifying similar households: they are those with the same tariff plan.
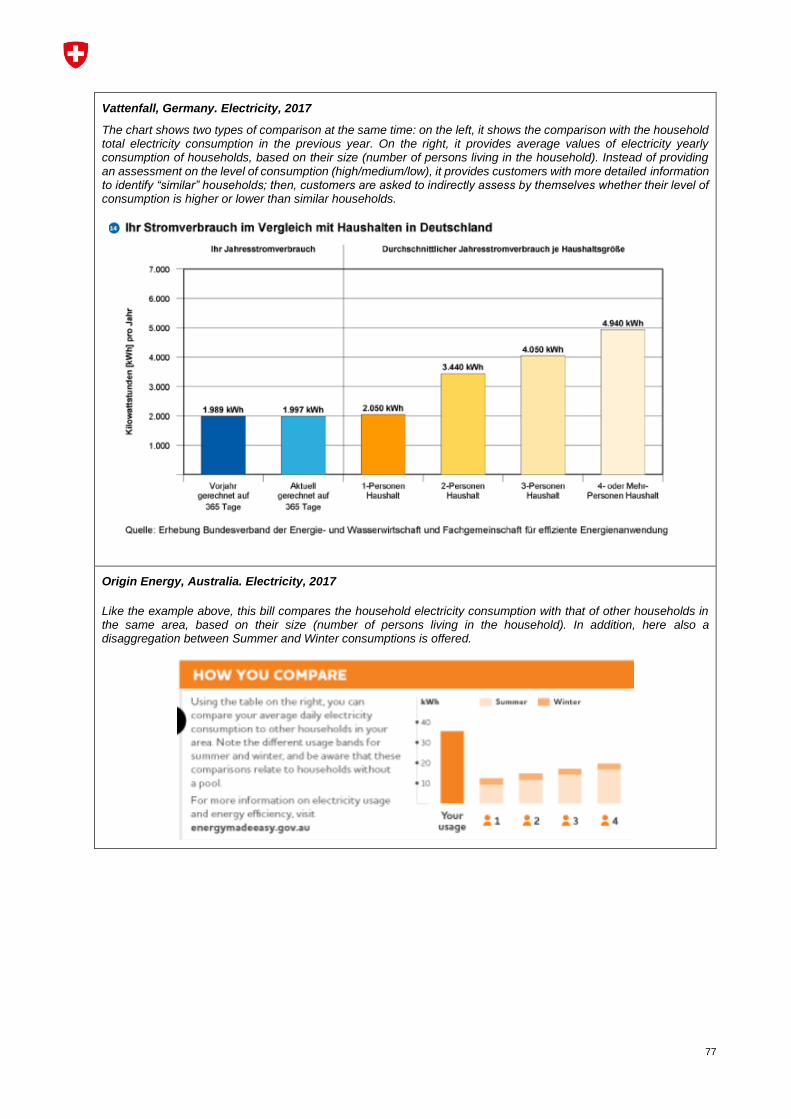
77
Vattenfall, Germany. Electricity, 2017
The chart shows two types of comparison at the same time: on the left, it shows the comparison with the household total electricity consumption in the previous year. On the right, it provides average values of electricity yearly consumption of households, based on their size (number of persons living in the household). Instead of providing an assessment on the level of consumption (high/medium/low), it provides customers with more detailed information to identify “similar” households; then, customers are asked to indirectly assess by themselves whether their level of consumption is higher or lower than similar households.
Origin Energy, Australia. Electricity, 2017
Like the example above, this bill compares the household electricity consumption with that of other households in the same area, based on their size (number of persons living in the household). In addition, here also a disaggregation between Summer and Winter consumptions is offered.

78
Stadtwerke Düsseldorf, Germany. Electricity, 2017
This utility company wants to provide customers with further information, by showing average electricity consumptions per household size (number of persons) and also per level of consumption (very low, low, average and above average). The resulting chart should however be improved in readability, in order to stimulate more customers to actively engage with the information it provides.
Stadtwerke Düsseldorf, Germany. Gas, 2017
Since gas is often used for heating purposes, for gas bills an effective comparison with similar households can be based on the surface of their home, in square meters. This utility company provides customers with average gas consumption values for six different home sizes, which they can use to indirectly assess their level of energy consumption.

79
Prioenergie, Germany. Gas, 2017
This utility company opted for providing as information as possible: customers are provided with average gas consumption values which consider both average household size (expressed by both the square meters of the home and the number of persons) and levels of consumption (very high, high, low and very low). Charts are easier to read and more attractive, but probably they are not fully understandable yet, since in any case they include a lot of numbers. Also, comparison with the customer’s own consumption is not provided, being left to the customer, who might not like to engage in such an activity.
Uon, The Netherlands. Electricity and District heating, 2017
This bill is pretty interesting, since it adopts a different approach respect to the dominant one: instead of charts, the bill opts for a plain text, accompanied by a table. The result is a pretty informative element, since text is very simple and easy to understand.
The text indicates the present consumption and compares it with the year before, also indicating the expected cost of the bill, in case the same level of consumption of the previous year is maintained. Interestingly, here monetary costs are given as well: this is meant to raise the interest in customers with low environmental awareness – which are the majority of them.

80
AEP Ohio, USA. Electricity, 2011 (based on OPower Home Energy Report)
This chart shows electricity consumption in the billing period comparing it with both similar households in general and “efficient” similar households. In this case, the comparison with the customer’s own consumption value is directly provided in the bill, by a simple bar-chart. Such a chart is also accompanied by a congratulation message (in case the user consumes less electricity than average or average efficient households), or an encouragement message to improve performances by saving energy in the next billing period (in case the user consumes more energy than average). Such a message is essential in order to avoid rebound effects which might happen by just showing that a customer is more efficient than average.
OPower Home Energy Report sample bill, USA. Electricity, 2011
Besides providing the customer with overall electricity consumption values during the billing period, estimates of disaggregation of consumptions per type of electric appliance/use could be made. In this example, based on external temperature data and energy consumption values and a comparison with the previous year, customers are provided with an estimate of their electricity consumption for cooling and with a comparison with similar households living in the same area.

81
AEP Ohio, USA. Electricity, 2011 (based on OPower Home Energy Report)
Besides providing total electricity consumption values [kWh] during the billing period, this bill also shows evolution of consumption over time [kWh], on a monthly basis. Interestingly, again a comparison with “similar” and “efficient similar” households is offered. Also, a message indicates the amount of electricity saved respect to similar households, expressing it as money saved as well.
VARIATIONS WITH SEASON, TEMPERATURE, WEATHER
Endesa, Spain. Electricity, 2017 (only in the bill of open market electricity customers).
Besides a chart showing the evolution of the household consumption over time (both the last twelve months and also the other previous twelve months), the bill shows aggregate indicators assessing overall evolution of consumption over the seasons: in fact, it shows percentage differences between seasonal electricity consumption (Spring, Summer, Autumn and Winter) in the billing year and seasonal electricity consumption in the previous year.
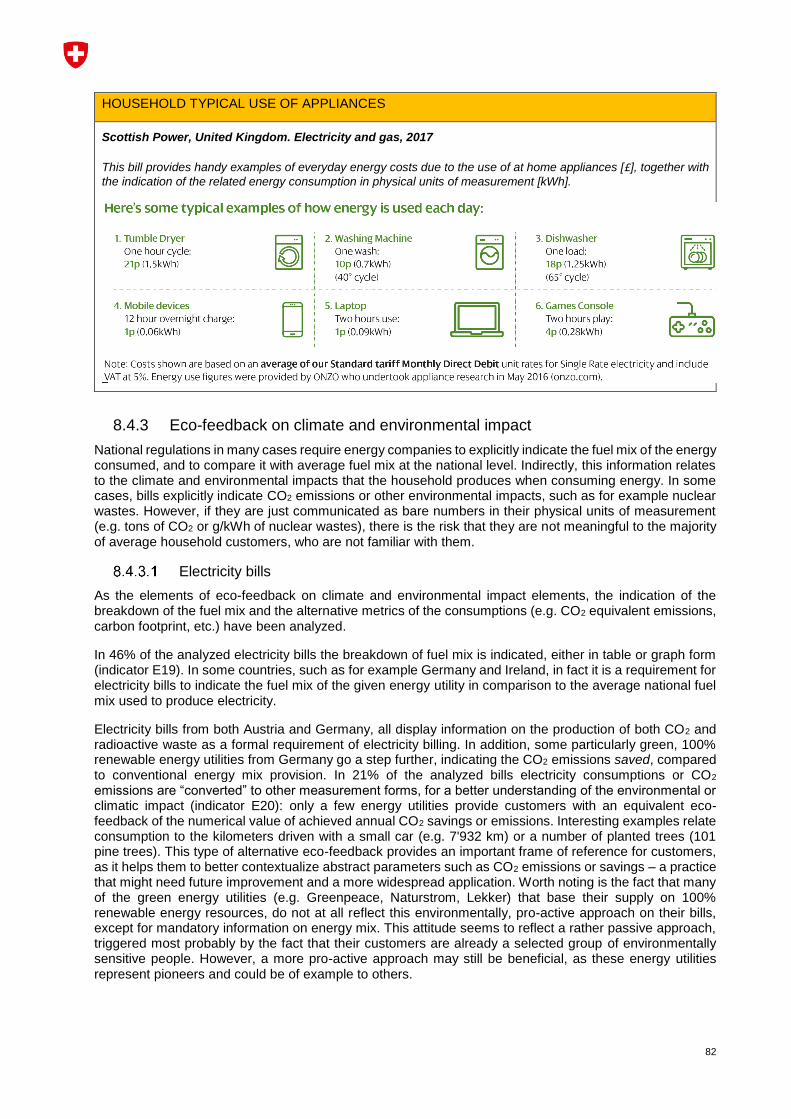
82
HOUSEHOLD TYPICAL USE OF APPLIANCES
Scottish Power, United Kingdom. Electricity and gas, 2017
This bill provides handy examples of everyday energy costs due to the use of at home appliances [£], together with
the indication of the related energy consumption in physical units of measurement [kWh].
8.4.3 Eco-feedback on climate and environmental impact
National regulations in many cases require energy companies to explicitly indicate the fuel mix of the energy consumed, and to compare it with average fuel mix at the national level. Indirectly, this information relates to the climate and environmental impacts that the household produces when consuming energy. In some cases, bills explicitly indicate CO2 emissions or other environmental impacts, such as for example nuclear wastes. However, if they are just communicated as bare numbers in their physical units of measurement (e.g. tons of CO2 or g/kWh of nuclear wastes), there is the risk that they are not meaningful to the majority of average household customers, who are not familiar with them.
Electricity bills
As the elements of eco-feedback on climate and environmental impact elements, the indication of the breakdown of the fuel mix and the alternative metrics of the consumptions (e.g. CO2 equivalent emissions, carbon footprint, etc.) have been analyzed.
In 46% of the analyzed electricity bills the breakdown of fuel mix is indicated, either in table or graph form (indicator E19). In some countries, such as for example Germany and Ireland, in fact it is a requirement for electricity bills to indicate the fuel mix of the given energy utility in comparison to the average national fuel mix used to produce electricity.
Electricity bills from both Austria and Germany, all display information on the production of both CO2 and radioactive waste as a formal requirement of electricity billing. In addition, some particularly green, 100% renewable energy utilities from Germany go a step further, indicating the CO2 emissions saved, compared to conventional energy mix provision. In 21% of the analyzed bills electricity consumptions or CO2 emissions are “converted” to other measurement forms, for a better understanding of the environmental or climatic impact (indicator E20): only a few energy utilities provide customers with an equivalent eco-feedback of the numerical value of achieved annual CO2 savings or emissions. Interesting examples relate consumption to the kilometers driven with a small car (e.g. 7'932 km) or a number of planted trees (101 pine trees). This type of alternative eco-feedback provides an important frame of reference for customers, as it helps them to better contextualize abstract parameters such as CO2 emissions or savings – a practice that might need future improvement and a more widespread application. Worth noting is the fact that many of the green energy utilities (e.g. Greenpeace, Naturstrom, Lekker) that base their supply on 100% renewable energy resources, do not at all reflect this environmentally, pro-active approach on their bills, except for mandatory information on energy mix. This attitude seems to reflect a rather passive approach, triggered most probably by the fact that their customers are already a selected group of environmentally sensitive people. However, a more pro-active approach may still be beneficial, as these energy utilities represent pioneers and could be of example to others.
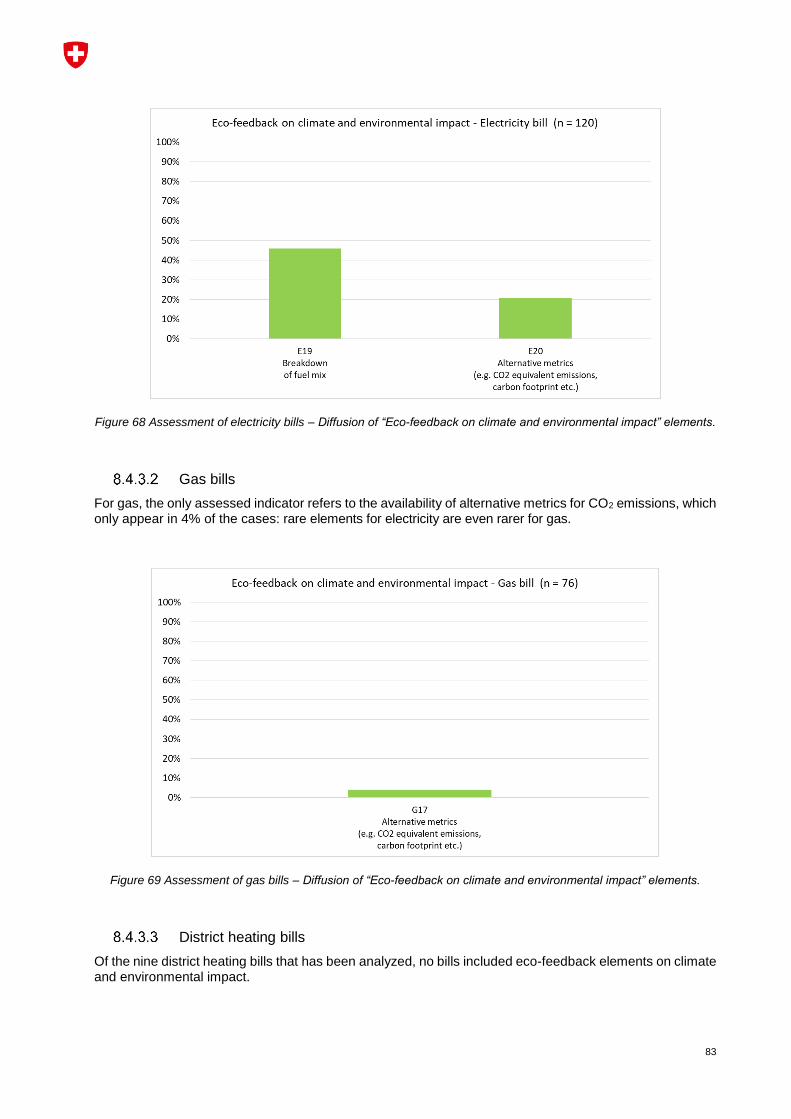
83
Figure 68 Assessment of electricity bills – Diffusion of “Eco-feedback on climate and environmental impact” elements.
Gas bills
For gas, the only assessed indicator refers to the availability of alternative metrics for CO2 emissions, which only appear in 4% of the cases: rare elements for electricity are even rarer for gas.
Figure 69 Assessment of gas bills – Diffusion of “Eco-feedback on climate and environmental impact” elements.
District heating bills
Of the nine district heating bills that has been analyzed, no bills included eco-feedback elements on climate and environmental impact.

84
Figure 70 Assessment of district heating bills – Diffusion of “Eco-feedback on climate and environm. impact” elements.
Some good practice examples
FUEL MIX BREAKDOWN
Vattenfall, Germany. Electricity, 2017
The bill shows the composition of the electricity mix consumed, according to the tariff plans offered by the energy company, and compared to average electricity mix at the national level. Besides the fuel mix breakdown, the bill provides customers with the indication of the tons of C02 and grams of nuclear wastes that are produced by each fuel mix (values in physical units of measurement).

85
Endesa, Spain. Electricity, 2017
This example shows an attempt to provide both a pie chart and a table representation, in order to satisfy more segments of customers (those who prefer intuitive charts and those who are interested in numerical values). Also, it just offers two elements for the comparison (the company’s fuel mix and the average national one), thus reducing the amount of information at the same time offered to the customer.
Prioenergy, Germany. Electricity, 2017
This example shows an attempt to make pie charts a bit more user friendly than plain technical charts.

86
ALTERNATIVE METRICS
Iberdrola, Spain. Electricity, 2017
This chart goes beyond pure indication of the climate and environmental impact of the electricity consumed, expressed in physical units of measurement, such as tons of CO2 or grams of nuclear wastes per kilowatthour. An assessment scale like the one of the “Energy label”, which is familiar to private customers since it has been used for years for electrical appliances and also for cars, supports customers in understanding the intensity of their climate and environmental impact when consuming electricity.
ESTIMATE OF EMISSIONS
Origin Energy, Australia. Electricity,2013 (on the left) and 2017 (on the right)
The chart on the right (2017) is an evolution of the information elements
already included in the electricity bill in 2013: it is clearly more
communicative, thanks to graphical improvements, however it lacks
details such as the units of measurement and the legend. For this
reason, both versions have been included.
These charts show monthly electricity consumptions during the billing period and the related CO2 emissions. There is a comparison with emissions produces in the same period during the previous year and, interestingly, also the indication of the avoided emissions, respect to average national emissions, thanks to consumption of “GreenPower”, that is renewable electricity sold by the company.

87
ESTIMATE OF AVOIDED EMISSIONS
è nostra, Italy. Electricity, 2017
This utility company only sells 100% renewable electricity, that is a fuel mix that does not produce direct CO2 emissions or air pollution. In such a case, they opted for reporting the avoided emissions, respect to average national electricity mix, instead of just reporting that consumed electricity produces zero emissions: this is probably more effective from the communication point of view.
8.4.4 Energy-saving tips and advice
The provision of energy-saving tips and advices may help stimulate pro-active energy-efficient behavior in households. The more customized and actionable, the better.
Electricity bills
Findings from our data collection show that including general energy tips and advices on the electricity bill is not at all a common practice (indicator E22, 3% of the analyzed bills). It is more widespread that utilities dedicate a separate section to these tips and advices on their websites, in a non-personalized form. German electricity bills tend to simply refer to general websites on national policies towards energy efficiency, i.e. a very formal, not very appealing and communicative act.
It is even rare that electricity utilities include customized, actionable energy-tips (indicator E23, 1% of the analyzed electricity bills) in their bills if not on their webportal, entering by one’s personal account. It is not surprising as customized tips require additional information than just the consumptions.
In 10% of the considered bills utilities help understanding the voices of the bill by explaining the key terms connected to energy usage (for eg. kWh, m3, surcharges, etc.) (indicator E25), while giving advice on time-of-day-tariffs or other dynamic tariffs (indicator E24, 2%) or indicating contact information for customer service offering customized energy-efficiency specific consultancy (indicator E25, 5%) is still quite rare.
Figure 71 Assessment of electricity bills – Diffusion of “Energy-saving tips and advice” elements.

88
Gas bills
As for electricity bills, gas bills also lack tips and advice on energy consumptions. The most common element appearing in the bills is the explanation of the key terms connected to energy usage (e.g. kWh, m3, surcharges, etc.), that appear in 25% of the analyzed bills (indicator G22). Contact information for customer service offering customized energy-efficiency specific consultancy was indicated in 8% of the gas bills (indicator G23), while general energy-saving tips and customized, actionable energy-tips (indicators G19 and G20) are only shown in 3% and less than 1% of the gas bills.
Figure 72 Assessment of gas bills – Diffusion of “Energy-saving tips and advice” elements.
District heating bills
The analyzed district heating bills do not include any energy-saving tips and advices. Only contact information for customer service offering customized energy-efficiency specific consultancy (indicator DH23) and explanation of the key terms connected to energy usage (for eg. kWh, m3, surcharges, etc., indicator DH22) appear in the analyzed bills, both in 11% of them.
Figure 73 Assessment of district heating bills – Diffusion of “Energy-saving tips and advice” elements.
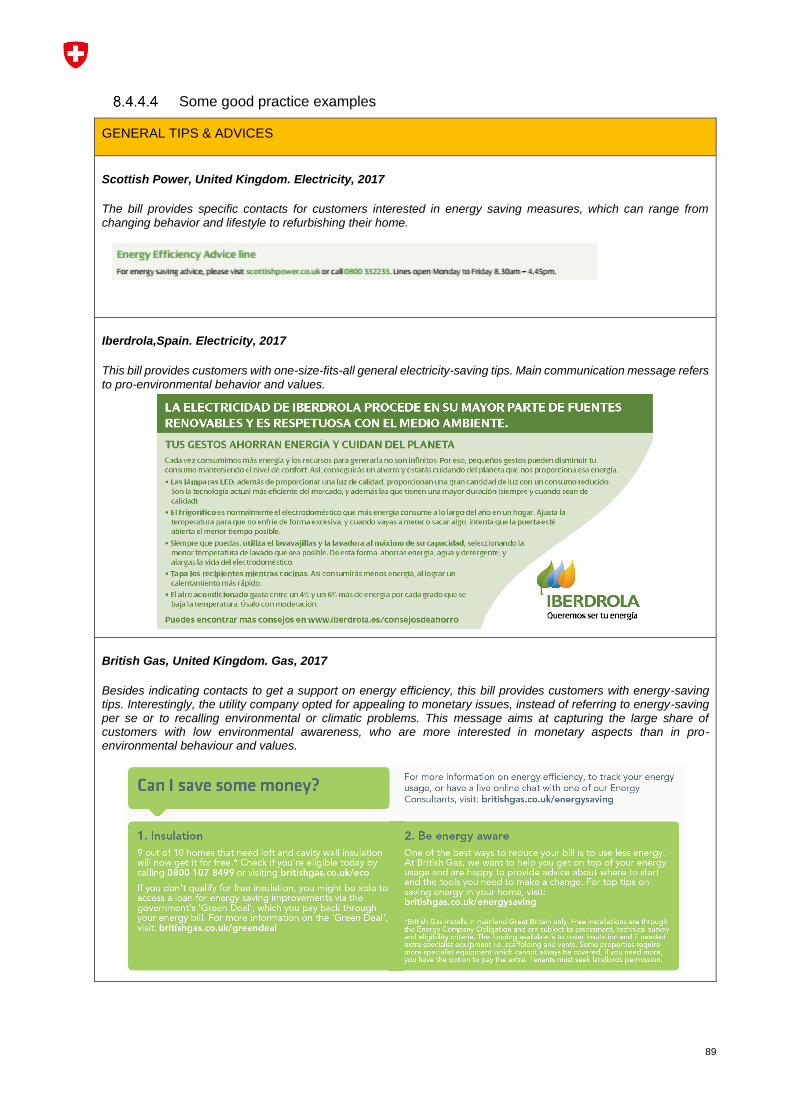
89
Some good practice examples
GENERAL TIPS & ADVICES
Scottish Power, United Kingdom. Electricity, 2017
The bill provides specific contacts for customers interested in energy saving measures, which can range from changing behavior and lifestyle to refurbishing their home.
Iberdrola,Spain. Electricity, 2017
This bill provides customers with one-size-fits-all general electricity-saving tips. Main communication message refers to pro-environmental behavior and values.
British Gas, United Kingdom. Gas, 2017
Besides indicating contacts to get a support on energy efficiency, this bill provides customers with energy-saving tips. Interestingly, the utility company opted for appealing to monetary issues, instead of referring to energy-saving per se or to recalling environmental or climatic problems. This message aims at capturing the large share of customers with low environmental awareness, who are more interested in monetary aspects than in pro-environmental behaviour and values.

90
AEP Ohio and SMUD, California (USA). Electricity, 2011 and 2013 (based on OPower Home Energy Report)
These utility companies provide customers with personalized, actionable tips, based on their electricity use and the household profile. Though such tips still maintain a pretty general appeal and actual personalization is still far-off, this is definitely the direction for the future. Note that tips in the figure on the left basically propose the same measures as the tips on the top. However, they were re-designed in order to enhance communication: they are more direct and immediate, which increases chances that they are put into practice. Finally, also these utility companies opted for focusing on monetary aspects, as figures indicating potential money savings, indicating inn large characters, show: they were favoured respect to indication of reduction in CO2 emissions.

91
TIME OF DAY TARIFF ADVICE
Ireland, sample electricity bill used in large-scale consumer behavior trial, 2011 (CER, 2011a)
Tips and advice not only refer to energy-saving measures but also to load shifting to off-peak periods. This example, which comes from a bill used in a large scale consumer behavior trial in Ireland, presents colorful charts and pictures to stimulate off-peak electricity consumption, by highlighting differences in electricity tariffs (monetary motivational aspect). Customers are also provided with awareness on how much on average they are currently paying for common domestic activities, such as showering or washing clothes, and indications on the potential money saving they would get in case they perform the same activities in off-peak periods of the day.
8.4.5 Other innovative DSI elements
When analyzing the energy bills collected, other interesting DSI elements were found, which were not directly accounted for by the indicators above. Whenever when any of them is founded, it has been registered under the “Innovative approaches“ indicator. Such an indicator was used in a qualitative way: instead of presenting quantitative charts, for this indicator only good practice examples are shown, as suggestions for future activities.

92
PARTICIPATORY PROCESSED TO CO-DESIGN THE ENERGY BILL
è nostra, Italy. Electricity, 2017
This small cooperative company, only selling renewable electricity, decided to define bill contents in direct collaboration with their customers. It is a good example for implementing a participatory approach, as they invited the interested customers to co-design bill contents and graphical look, with the aim of making it easier to be understood and to include the specific information customers are looking for. The picture shows an excerpt from a newsletter of the company, by which they invited citizens to join the participatory design of the bill.
DESIGN AND AESTHETICS OF THE BILL
Nuon, The Netherlands. Electricity and district heating, 2017
Increasingly, bills are moving from black and white documents filled with numbers and long, small written, technical and bureaucratic texts, to colored, appealing and engaging documents with pictures and charts. The following example, containing two pages taken from an electricity bill, shows a different type of innovative bill: there is more text than tables and charts. It's very easy to read, since a plain, non-technical language is used. In some cases, for example regarding the composition of the fuel mix, the company chose not to provide all the information directly on the bill, indicating though links to their website, where interested customers can find more details.

93
ENHANCED, CUSTOMIZED INFORMATION VIA WEBPORTALS OR APPS
Enel Energia, Italy. Electricity and gas, 2017
The majority of companies are now offering detailed information on energy consumptions via webportals or smartphone apps, on whom customers are invited to create an account and frequently log. Usually, webportals allow online consultation of the bills; increasingly, they are offering additional data (such as possibilities to compare consumptions with longer series of data respect to the bill) or customized comparison with other “similar” customers. In fact, webportals allow interaction with the customer: simple questions can be made to the customers, when they access the portal, in order to keep the set of their personal information updated. Moreover, questions on energy consumption patterns might be asked as well. The elements gathered this way can be related to energy consumption data provided by the smart meters, so to identify the specific consumption profile of the customer and to provide her with even more customized energy-saving suggestions.
This portal (Enel Energia, My Energy webportal) asks the customer if she wants to better understand her energy consumptions. To this purpose, she is invited to answer a few simple questions regarding her household (number of persons, type of home, size of the home, type of heating system and electric appliances generally used), directly interacting with the website.
Once the customer has answered, immediately a comparison chart is updated, highlighting consumptions of similar households at the national level (based on the size of the house and the number of persons, on the type of heating system and on the main electric appliances used). The customer is also allowed to select similar households by considering only those living in the same area (same city or geographical location in Italy: Northern, Central or Southern), and the chart updates accordingly.
In the case of this utility company, who sells both electricity and gas, data regarding all types of energy consumption in the household (electricity and heating) are available, thus offering a global overview of the energy performances of the customer.

94
CUSTOMER FIDELITY PROGRAMMES
Enel Energia, Italy. Electricity and gas, 2017
In a liberalized energy market, maintaining and acquiring customers has become a priority for utility companies. For this reason, besides operating on the energy tariffs and on marketing aspects, they also activated customer fidelity programmes, offering tangible prizes to their customers. For example, this utility company developed a programme of quests, resulting in point acquisition, that the customer can then redeem with real life prizes (Enelpremia 3.0).
Points can be obtained by completing some basic operations related to bill (such as for instance, regularly paying them, or sending self-reading data of their consumptions), and by answering to quizzes offered in the customer section of the webportal.
Total points obtained are indicated in the first page of the energy bill; more details are given if the customer logs in to the utility company webportal.

95
EVN, Austria. Electricity and gas, 2017
This company offers a customer fidelity programme by which customers get points by simply consuming energy: as soon as they consume 10 kwh of electricity or 50 kWh of gas, they obtain one point. If the energy they consumed was an ecological one (depending on the energy product they chose to buy), they get a double number of points. Additional points can be earned by taking part in promotions offered by the company or in exploiting additional services they offer. Points can be redeemed in selected partner shops, who offer energy efficient appliances(A++). Note however that such a programme can produce rebound effects, since it stimulates customers to increase their consumptions, in order to get additional points.
Oekostrom AG, Austria. Electricity and gas, 2017
Customers are offered an online shop where they can buy energy-efficient products (from led bulbs, portable solar rechargers and smart plugs, to larger appliances such as washing machines) and increase their awareness on savings potential and climate protection. For every product available in the shop, in fact, they get the information on how much energy they would save and how many CO2 emissions they would avoid. Also, the more the products they buy, the more the points they earn, to be redeemed with further energy-saving products.

96
HOME AUTOMATION PROGRAMMES
Enel Energia, Italy. Electricity and gas, 2017
Webportals and smartphone apps allow fully exploitation of the power of smart meters: customers can read their energy consumption in (nearly) real time, and thus increase their energy awareness. Building on such information, utility companies can then offer additional services.
For example, this utility company offers a smart kit that integrates the smart meter (InHome display, sensors and smart plugs). Thanks to disaggregation algorithms and smart plugs, the company is able to estimate disaggregated electricity consumptions per appliance. Once customers get to understand how their electricity consumptions are structured, by means of an app they can activate automatic rules and consumption thresholds for remote control of lightings, electric appliances and alarm systems. The app also gives feedback on real time consumption and allows to set energy-
saving goals and check their level of achievement.
Also, the company offers additional services, useful when customers are outside their house, such as information on public transport strikes, shopping from home facilities, meteorological previsions and navigation system. Since uptake of such services is still limited among customers, to promote them the company also offers a dedicated customer fidelity programme (goal setting, quests, challenges, points), which again adopts a gamification approach, that rewards customers based on their level of activity with the app.

97
8.5 Chapter’s conclusions
This chapter summarizes the analysis that was carried out on DSI (Demand Side Information) programmes existing abroad, with a specific focus on energy bills. Aim of such analyses was to understand how utility companies provide their customers with information on their energy consumptions.
Based on an online questionnaire targeting utility companies themselves, on a web search and on personal contacts abroad of the parterners of the present project, it was possible to analyze a sample of energy bills for electricity (120 bills), gas (76 bills) and district heating (9 bills). Such bills were assessed by means of a set of indicators mainly identified by a literature review in this field. Such indicators aimed at assessing the level of effectiveness of energy bills in providing DSI information of the four following categories:
Transparent accounting;
Comparative statistics;
Eco-feedback on climate and environmental impact;
Energy-saving tips and advice.
Though based on a structured set of indicators, it has been not consider such an analysis as a purely quantitative one: in fact, the energy bills collection process could not follow a systematic rationale, and does not allow representativeness for every country. In many cases, in fact, accessing a bill from a specific country merely happened by chance, depending on personal contacts abroad. For this reason, even though it has been possible to quantitatively assessed values of the indicators and elaborated numerical charts. It has been agreed to mainly focus on the qualitative suggestions that can be extracted from such analysis, in particular understanding general trends and good practices regarding energy bills and, more in general, DSI elements provided by utility companies.
In general, it has been acknowledge there is a need to rethink and improve billing information, if the role of energy bills is to change from purely representing a transparent accounting tool to one also contributing to raise household customer’s energy awareness and possibly triggering pro-active motivation to save energy. This general concept is already being put into practice by many utility companies, especially those selling electricity. In particular, many of them started introducing comparisons, mainly comparisons with the past consumptions registered by the same customer household. Innovative companies are also offering comparisons with other households, even though this kind of information is definitely rarer. Even more uncommon is finding alternative metrics aiming at supporting customers in understanding their level of energy consumption or CO2 emissions. Energy-saving tips are popular, even though usually they are still general, one-size-fits-all, non-customized tips. Diffusion of ICT technologies (smart metering, smart plugs/sensors and smart disaggregation algorithms) will swiftly favour higher customization. Considering the present diffusion of webportals and online tools, it can be expected that more customization will increasingly be offered online, instead of traditional energy bills. Webportals and online tools, in fact, guarantee easier and faster possibilities of interaction with the customer, thus facilitating customer segmentation and greater customization. Also, with the introduction of gamification schemes and attribution of points when certain types of actions are performed, through webportals utility companies can increase the chance that customers actually access the information they are offering them – which cannot be taken for granted with traditional bills, since customers might not even open them, in case they have activated automatic direct debit systems.
An element that is still lacking in our analysis is the assessment of the effectiveness of the DSI elements in stimulating actual behavior change in customers’ energy consumption patterns. Apart for quantitative assessments regarding more informative energy bills in general [Wilhite and Ling, 1995], and comparison of consumptions with similar households (use of social norms, [Alcott, 2011] and reports produced by OPower for the utility companies which exploited their Home Energy Reports), in fact no other systematic assessments of the effectiveness of DSI tools introduced has been found. When launching DSI programmes, utility companies should also sustain them by large-scale analyses to assess their effectiveness over time, for example by means of randomized controlled trials.

98
9 From the best practices into IMROVE solutions
The Swiss Energy Strategy 2050 aims to increase the use of renewable energy and the energy efficiency of buildings, mobility, industry and appliances [1]. An additional important element of this strategy is the reduction of the energy demand in Swiss households, which requires a change in energy consumption behaviour. Consumer behaviour is also one of the main topics within the research program “Energy in Buildings” of the Swiss Federal Office of Energy (SFOE). The consumers are affecting the energy demand of modern buildings more than the construction quality. However the research of the relation between consumption behaviour and possible influences are still at the beginning [2].
An important driver for promoting the change of energy consumption behaviour of private households can be seen in demand-side information (DSI). In order to get an overview of the state of the art in the DSI field in Switzerland and abroad and to identify improvement potentials, the project “IMPROVE – Unfolding next generation demand-side information (DSI) models” has been initiated by 4 Swiss universities of applied sciences: HES-SO, SUPSI, FHNW and ZHAW.
The point of departure of the IMPROVE project is the information gap existing between utilities and their customers: The utilities possess the information needed to allow customers to make the connection between energy usage and the amount due, as well as to possibly help manage it better. Yet, overly detailed information increases the risk of reducing bill comprehension, since customers strive for simplicity, transparency or are simply not interested to be overloaded with the information regarding their own consumption in much detail. However, by deploying appealing visual elements, designs and taking advantage of new IT and metering technologies it becomes possible to present a large quantity of information in a simple, transparent and appealing way, which could increase perceptiveness of the customers and possibly motivate them to rethink their energy-related behaviour.
Against this background, the present chapter focuses on:
reviewing literature on energy-related behaviour, its determinants, behaviour change models and
energy feedback in order to better understand which elements constitute an effective DSI measure
and their relative importance from the scientific point of view (introduction chapter to the main body
of the final report)
conducting complementary desk (analysis of DSI pilot projects) and field (expert interviews with
representatives of two utilities from north-eastern Switzerland) research to chapters 7 and 8 (review
of best DSI practices in Switzerland and abroad) with the focus on north-eastern Switzerland due
to the regional expertise (section 9.2)
synthesising these findings as well as the findings of chapters 7 and 8 into six IMPROVE solutions,
that are enhanced and synthetic layouts for energy bill, that will be used in the customers’
satisfaction survey conducted in chapter 10 (section 9.3).
9.1 Method
In addition to reviewing, chapters 7 and 8 reports dealing with best practices in Switzerland and abroad
respectively, own desk and field research was conducted within the chapter 9. The research included in
particular: 1) analysis of utilities’ websites; 2) detailed analysis of selected DSI-related pilot projects; 3)
expert interviews. The findings from this research together with the insights from chapters 7 and 8 reports
reports served as a basis for the development of the first draft of IMPROVE solutions within an internal
workshop with the ZHAW project team. These draft solutions were then further developed together with
project partners from HES-SO, FHNW and SUPSI in an iterative process that was started with a joint
workshop and continued through an intensive e-mail exchange. The process resulted in six visual
IMPROVE solutions which were included in the customer satisfaction survey (chapter 10) in order to get
feedback on them from the customers’ point of view.

99
9.1.1 Detailed analysis of selected Swiss and foreign DSI-related pilot projects
The review of best documented DSI-related projects is based on web and literature research as well as on
expert interviews. Each model was analysed in a standardised template. The structure of the template is
outlined in Appendix 9. Based on information collected in the template, clustering of the analysed best
practices was conducted within an internal workshop with the ZHAW project team.
9.1.2 Analysis of utilities’ websites in north-eastern Switzerland
The analysis of websites included all utilities which are active in the north-eastern part of Switzerland
according to the SFOE (Elcom, 2015) and focused on applied cases, studies, initiatives and tools. In
addition to the research conducted within chapter 7 with the focus on energy bills, this analysis includes
also other DSI and DSM measures often conveyed on new digital media, since from those pilot project it
can be learned a lot how to enhance energy bills.
9.1.3 Expert Interviews (from Switzerland)
For getting an insight in how utilities are dealing with DSI, qualitative guideline interviews with experts of
two partner utilities from north-eastern Switzerland were hold. The interview guideline was organised
around the following questions:
Which DSI models are used?
Which are the objectives in applying specific DSI models?
Which information about the energy consumption of consumers is available?
What is the motivation of the utility and the consumers to improve energy efficiency?
What are the consumers’ actual and future needs for information?
What kind of ideas and projects related to DSI are pursued at the utility?
Which objectives are pursued by applying enhanced DSI models?
The findings out of the interviews were integrated in the analysis of the existing DSI models and were further
used as inputs for the development of enhanced DSI models.
9.2 Results
Around 650 utilities are responsible for the electricity supply in Switzerland (S.A.F.E., 2005). For the
analysis in north-eastern Switzerland, all utilities which are active in the cantons of Appenzell, Glarus,
Graubünden, St. Gallen, Schaffhausen, Schwyz, Thurgau, Uri, Zug and Zurich have been included. In total
309 utilities are included in the analysis of the DSI and DSM models.
9.2.1 Detailed analysis of selected Swiss and foreign DSI-related pilot projects
The assessment contains 27 different DSI or DSM models. A detailed documentation is available in the
Appendix 10. The evaluated models can be clustered as illustrated in Figure 74. The numbers are eferring
to the list in the detailed documentation. Only the invoice can be stated as a DSI solution referring to the
definition within the IMPROVE project (see introduction chapter to the main body of the final report). All
other cluster categories also include DSM elements. In what follows, the clustering of the assessed models
is determined and the main strengths and weaknesses of the assessed DSI/DSM models are outlined. The
cluster “invoice” is thereby enriched by the findings of the chapter 8 regarding the best invoicing practices
abroad.

100
Figure 74 Cluster of existing and collected DSI/DSM models.
Invoice
Two main types of billing models can be distinguished. The paper invoice is the actual market standard for
informing consumers about the energy consumption and costs and for charging the consumption. For the
paper invoice, it is not distinguished between an invoice by post and an invoice by e-mail as they only differ
in the distribution channel. The second possible type of charging the energy is e-invoicing. The e-invoice
has to be differentiated from the paper invoice due to the fact that it is possible to pay the invoice without
having a look at the detailed invoice. In this case, the consumer only notices the costs of the energy in total
and no detailed information, as for example the consumption in kilowatt-hours. It needs more effort to open
the detailed invoice in this approach. The detailed information can be seen by opening the e-invoice on the
e-banking account and then additionally opening the detailed invoice. The content of an e-invoice is mostly
identical to the paper invoice. A strength of e-invoicing is that the information is received on the e-banking
platform which is used by the customers for all payment transactions. Therefore no additional platform is
used and the consumers are accustomed to the use of it.
Most of the utilities invoice one time a year with a different number of payments in account. The paper
invoice of repower (Repower, 2017) is delivered two times a year with additional four times a payment on
account. Current consumption is graphically compared with the historical one and costs are also graphically
split up into different services as grid costs, taxes, legal fees or high- and low-rate energy. This gives a
visual overview and makes the invoicing transparent. A weakness of the nowadays DSI by invoice models
is the use of static consumption information. For consumers, it is difficult to attribute their consumption to
the behaviour if they get one or two invoices per year.
More specific feedback is provided in several invoicing models in foreign countries by illustrating the
average costs and consumption per month or per hour of the day (Endesa, 2017). Figure 75 (in Spanish)
shows an example which combines historical and normative comparison (with the average consumption of
the city) with a more disaggregated (seasonal and monthly) consumption.
Furthermore, individual energy conserving advices are made, for example how many days a LED lamp
could be operated with the amount of electricity of this invoice. This advice helps consumers to understand
what the number of kilowatt-hours represents.

101
Figure 75 Energy info by Endesa [7].
The same utility in Spain provides a comparison by classifying the consumer’s consumption with an energy
label (Endesa, 2017). With this illustration (Figure 76), the consumer is able to evaluate his energy
efficiency.
Figure 76 Energy label by Endesa [7].
Further information on the invoice about the environmental impact such as the CO2 emissions or nuclear
waste (see Origin Energy, 2017) caused by the own consumption can initiate behaviour change of
environmentally-conscious consumers. It is also possible to additionally provide an appreciation notice if
the energy efficiency of the consumer is high.

102
Web Platform
Online efficiency and customer service platforms can be aggregated to the term “web platform”. As web
platforms provide more than DSI, for example the possibility to change the tariff, it is classified as a DSM.
On the online efficiency platform “Munx” (Repower, 2017), the consumer receives a specific feedback about
his consumption. The self-metering process can increase the awareness for energy consumption but also
present a barrier. It is a very simple method of tracking electricity consumption because no installation is
needed. The knowledge of the consumer about energy is improved with quizzes in a playful way and the
behaviour change is initiated also with material incentives. The tool is interactive and contains also
normative comparison (to neighbours). A weakness of this efficiency platform is that it is not connected to
the online customer service platform and therefore there is no link to the invoicing process. Furthermore,
the normative comparison can have a negative effect. If a consumer sees that others consume more than
himself, his motivation for saving energy may decrease.
“MySGSW” (St.Galler Stadtwerke, 2017) is an online customer service platform that includes all customer
services which are available online on a single point of contact. All information such as consumption, costs
or purchased products are available simultaneously. The platform enables a bidirectional communication
between consumers and the utility. Service requests as a relocation announcement or the choice of another
electricity product can be conducted online. With an online customer service platform, DSI can be combined
with DSM and customer service processes. Due to the fact that the mentioned platform uses the same
static consumption information as used in paper invoices, the feedback is not particularly specific.
Web platforms are solutions which can only be applied for a part of the consumers because not all
consumers are able to use it (e.g. they do not have an internet connection or do not dispose of a high digital
literacy). As a further weakness, it can be pointed out that the consumer has to be active in order to get the
information.
Additional Hardware
Models which are applied by implementing additional hardware (e.g. smart meters) can be classified by the
level of break down (aggregation) or the energy carrier on which the model is based.
Smart meters, as they are used in the Smart Metering study (EKZ, 2011), provide aggregated information
about the total energy consumption in a household with a periodicity of 15 minutes. The consumption can
be displayed on an in-home display. In this case, the consumption is available for the consumer while using
energy. If the information is published on a web platform, it is additionally retrievable at every time and
everywhere. The smart meter data can also be used for providing more detailed information in the paper
invoice (e.g. consumption per day or hour with the highest consumption).
Disaggregated information regarding the energy consumption of specific appliances are available with the
“EMU check USB” energy meter (EW Höfe, 2008). The energy meter has to be plugged in between the
power socket and the specific device (e.g. television). The energy meter logs detailed real-time information
about the power, the current and the consumed energy. The information can be displayed on the energy
meter or can be analysed with a software. Additional available information are the calculated costs and
CO2 emissions (calculated with a static factor). As the energy meters have to be plugged in per analysed
device, a high number of energy meters would be needed to equip a single household. Furthermore, the
information can only be retrieved at the energy meter actively.
“Amphiro” (Fischli et al., 2011) is an intelligent display which provides live energy and water consumption
feedback when taking a shower. The device has to be plugged in manually between the showerhead and
the water pipe. It provides a direct feedback when energy is used. The consumer is thus able to immediately
check the impact of the behaviour on the energy consumption. Also, a gamification element is included by
showing a polar bear on a melting ice floe. If more hot water is used, the floe is melting. The information is
only retrievable directly on the display.

103
“Nest” (Nest Labs, 2015) is another energy-carrier-specific DSM model. It is a smart home device which
controls the room temperature automatically based on weather forecast and further collected data. The
thermostat provides continuous feedback on the heating energy. The information is available on a mobile
app on which historical comparison is possible as well. The device has to be manually installed in every
room. Applying additional hardware is always related with either manual installation or an installation by a
professional. The need of investments in hardware and data security is unavoidable.
Consulting
Energy consulting services can be classified in thermal or electrical. The advantage of thermography is the
possibility to depict the energy. It is simply understandable for consumers if a picture of the house is
presented with the illustrated energy consumption by different colours. Consulting services provide a
personal interaction between the consumer and energy experts. In personal interaction, it is simpler to
understand consumer needs. The advices are provided directly from experts and are further personalised.
The weakness lies on the high costs and the fact that consulting services are time consuming. The
necessity of an appointment could build an entrance barrier. Furthermore, the feedback is not continuous.
Mobile App
Mobile applications vary dependent on the focussed topic. The focus by implementing mobile apps can be
set on customer service, gamification elements or on information about the consumption. Customer service
mobile apps such as “WaZapp” (Werke am Zürichsee, 2016) show the same strengths and weaknesses as
online customer service platforms. Push-notifications are additionally possible with mobile apps. The
consumer has thereby not to be active to receive information. A weakness is the necessity of an installation
on the mobile device of the consumer.
9.2.2 Analysis of utilities’ websites in north-eastern Switzerland
Figure 77 shows that most of the utilities do not provide any information about DSI or DSM measures online.
A significant share of the utilities (9%) is not present online. As the invoice by post is provided by every
utility, this form of DSI is not included in the rough analysis. The following lines offer a short evaluation of
analysed model categories.
Figure 77: Existing DSI/DSM measures in the northeast of Switzerland (N=309, multiple entry possible, data source: online presence of the utilities).
1
2
3
4
4
5
5
6
11
23
25
28
29
193
0 20 40 60 80 100 120 140 160 180 200
Prepaid electricity
Consumption control (written)
Mobile app
Thermography
Online price calculation
Energy efficiency platform
Energy meter
Energybox
Smart metering
Online customer service platform
Energy consulting
E-invoicing
No online presence
No infos about DSI available online
Count

104
E-Invoicing
The most used form of billing beside paper bill is e-invoicing. E-invoicing usually involves replacing invoicing
by post by sending the invoice to the e-banking platform of the customer’s bank. The invoice is thereby
available online and replaces the paper form. The content on the e-invoice is mostly identical to the paper
invoice.
Energy Consulting
25 out of 309 utilities provide a certain form of energy consulting services. The consulting services differ
widely and can be characterised with the parameters and forms listed below.
Parameter Form
Place At home Online At the utility By telephone
Price Free of charge At cost Blanket Modular
Measurements None Standby consumption Individual appliances All appliances
Delivery Verbal Report
Table 19: Characteristics of energy consulting.
Possible contents of the energy consulting services are an efficiency rating, building information, appliance
selection or consumption behaviour.
Online Customer Service Platform
An online platform on which the customers can receive any type of services is regarded as online customer
service platform. The platform can provide information about the invoices, contracts, consumption and costs
or the possibility to announce relocations, report meter readings or to choose another electricity product.
23 customer service platforms of utilities are online in the northeast of Switzerland.
Smart Metering
A share of 4% (11 utilities) is already using smart meters and provides information concerning the
application online.
Energybox
“Energybox” is an online-based energy calculator for households. With this tool, it is possible for customers
to analyse the energy consumption of the household on their own by filling out a questionnaire (S:A:F:E.,
2005). It is possible for utilities to label the “Energybox” and provide it to their customers, which is actually
done by 6 utilities.
Energy Meter
In this category, energy meters which are additionally available to the obligatory energy meter of the
household are counted. The energy meters mostly show the actual electricity consumption of the household
or a specific appliance on a display. It is possible to store the consumption data and analyse it with a
software. Five of the analysed utilities sell or lease energy meters, or provide them for free.
Energy Efficiency Platform
An energy efficiency platform aims to improve the energy efficiency of the consumers by different measures
(e.g. interactive learning, energy challenges, social comparisons, goal-setting, incentives etc.). Mostly the
customers are asked to enter metering data periodically (e.g. weekly) and learn something about their own
consumption and energy conservation possibilities (Schneiker, 2015). It differs from the “Energybox” by the
interactivity. There are five energy efficiency platforms of utilities online in the northeast of Switzerland.

105
Online Price Calculation
Four utilities provide an online tool for calculating the energy price for the household with different energy
products.
Thermography
Thermography includes services, as provided by four utilities, in which infra-red pictures of the building are
recorded. Thermography recordings can indicate bad heat insulation on houses. The recordings are mostly
assessed by experts and a report is handed out to the customer.
Mobile App
Three utilities use mobile apps for the consumers, available for mobile devices as smartphones. In
particular, mobile apps include similar services as an online customer service platform. Furthermore, for
example push notifications can be received by the consumers on the mobile device.
Consumption Control (written)
Two utilities provide a paper form for controlling the own energy consumption. Meter readings can be
reported manually by the consumer and so a possible change in consumption over time is visible.
Prepaid Electricity
Prepaid electricity is similar to the prepaid model in telecommunications. In this model, it is only possible to
use the electricity if it is paid in advance. If the amount of purchased electricity is used, the power supply of
the household is switched off. The model is used by one utility in the Northeast of Switzerland.
9.2.3 Expert Interviews (from Switzerland)
In the following lines, main findings from the expert interviews with the representatives of the two partner
utilities from north-eastern Switzerland are presented. Although these qualitative findings provide valuable
insights regarding the utilities’ perspective on DSI, they cannot have any pretence regarding generalisability
for Switzerland. In the following, the main findings are pointed out. Detailed answers to the asked questions
and the interview guideline are enclosed in the Appendix 11.
What Utilities Aim with DSI
For the interviewees, the primary goal of DSI is to satisfy the needs of the consumers. Utilities want to
deliver transparent information and still possess an efficient invoicing process. They also have to comply
legal requirements. Further the marketing effect is mentioned as an important goal by applying DSI. Energy
efficiency is regarded as secondary.
Available DSI
Actually, there is not much information available from the demand-side. Meter readings once a year are
usual. The only information about the consumed energy is the yearly consumption and the purchased
energy product (for example solar electricity or water electricity). Projects for smart metering are ongoing
in some extent, but not yet realised. Further on, the utilities do not hold information about needs and
expectations of the consumers.
The Customer Viewpoint
Household consumers seem not to be willing to engage themselves in detail with the topic of energy. The
energy efficiency is secondary and it is important for the consumers, that their comfort is not restricted by
energy conservation. The profile of household customers of utilities differ widely. Some of the consumers
are driven by an ideological view regarding the environment. Others can be motivated by applying new
technologies. It was also mentioned that despite the influence of information and education on raising
customers’ awareness, the last step for a decision will be made by financial considerations.

106
Requirements of Effective DSI
A DSI model has to be realisable for the utility. The consumer should be able to monitor the energy
consumption in real-time, individualised and disaggregated (on appliance level). The required periodicity of
the information depends on the consumer. The invoice has to be transparent and it should be possible to
get the desired information by low effort. Many consumers claim that there is too much information on the
bill. Therefore, the information should be provided in stages, so that the essential information is on the top
and interested consumers have the possibility to inform themselves in detail by moving on to the next
stages. On a long term, the information should make consumers aware of the topic of energy and the
efficient use of it.
Solution Ideas
An interviewee conceives a mobile app which combines different services for the everyday life with the
topic of energy. For example, a sharing platform within the neighbourhood could be combined with the
washing plan of the house, a notice board and information concerning energy consumption. The app
thereby has to be detached from firms so that it is not an advertising platform.
Another idea mentioned is to send push notifications to the consumers individually and at the right time.
So, consumers could benefit by paying less for the energy or consuming less by a more efficient use.
It can be concluded, that the main goal of an effective DSI is to inform consumers in a transparent way
without obstructing an efficient invoicing process. The information should be available at the right time and
meet the consumers’ needs. A customer segmentation seems to be useful. Therefore, it would be
necessary to get more information about the consumers, for example regarding interests or preferred
channels of information. Further, more detailed DSI regarding the consumed energy (disaggregated and
with a higher periodicity) would be valuable.
9.3 Towards the IMPROVE solutions
From the results in section 9.2 it is evident that some utility initiatives in the field of interaction with customers
combine DSM with DSI measures. The obligatory invoice is the only pure DSI model which is available for
all household consumers within the field of study. Comparing the invoices of Swiss utilities with foreign
countries and approaches in the literature, a substantial potential for improvement becomes evident, mainly
in the frequency of the feedback and the aggregation. The findings of the Swiss expert interviews show
furthermore a potential in improving the informative content and in providing segment-oriented or
personalised feedback in invoices. Moreover, information provided in stages could meet better the different
needs of consumers. The first stage should contain only the most important information in very concise
form for those who are not particularly interested in energy issues. In addition, in the first stage a short
reference should be made to the next stages providing more detailed information for those who want to
know more. Thereby, the stages can be the different pages of the paper bill as well as different elements
of the app or web portal. By applying enhanced invoices, it is important to consider the fact that the
dissemination of e-invoicing will continue. Thus, the risk of unread invoices and consequently not perceived
energy feedbacks increases The reason is that in the case of e-invoicing interested customers have to open
a PDF attachment for any information going beyond the mere payment details and are consequently forced
to execute an “additional click”.
Online customer service platforms are a viable form of DSI because feedback about the energy
consumption can be provided combined with customer services, DSM measures and gamification elements
(e.g. efficiency competitions) on a single point of contact. Thereby, it has to be ensured that there is no
entrance barrier for the consumer to get the information. Mobile apps provide the possibility to lower this
entrance barrier by push-notifications. For providing disaggregated and more specific feedback it is
unavoidable to invest in additional hardware for collecting the required data. These data require increased
diffusion of new metering technologies such as smart meters.

107
Against this background, three possible approaches for development of IMPROVE solutions can be
deducted. Since classical paper bill is presumably going to continue to play a role in the near future, the
first IMPROVE solutions could focus on combining the best Swiss and international practices of designing
an energy bill. Two additional approaches could then address two major developments with high influencing
potential for DSI: 1) increased roll-out of smart meters allowing for more real-time data and more
customization; 2) market liberalization leading to more pressure for utilities to satisfy different needs of
different consumer segments having presumably as a consequence increased segmentation in
communication and marketing strategies including DSI. These could be particularly interesting for the
utilities seeing themselves as pioneers in altered political and market conditions associated with the Energy
Strategy 2050 in Switzerland.
9.3.1 Three possible approaches for development of IMROVE solutions
Optimised Invoice with historical overview of the consumption
The optimised invoice is charged monthly with consumption data, so that the consumer is informed
frequently about his consumption. In addition, each consumer receives a reduction goal (e.g. 2% less
energy consumption compared to the previous-year value). The content of the invoice is divided in two
levels of informative content. The first level contains consumption, costs, payment period and payment
information as for example the pay-in slip (see Figure 78 element 1&2, in German).
Figure 78: First level information of an optimised invoice, own illustration based
on documents (Repower, 2017 and Endesa, 2017).

108
Additional information on the first level is the history of the consumption in a time diagram, which shows the
continuous graph (updated monthly) of the actual consumption compared to the same graph of the last
year (see Figure 78, element 3). With this diagram, current month consumptions can be compared
simultaneously to the previous month consumptions as well to the consumption level of the corresponding
month in the previous year. A further element of the first level information is a normative message in form
of a tick mark, a smiley or a traffic light (see Figure 78, element 4, in German). Herewith, the achievement
of the target is rewarded. The last first level information is a personalised energy saving advice (see Figure
78, element 5, in German).
On the second level, detailed information concerning the consumption (e.g. cost-sharing, tariff-sharing,
meter readings) are listed. Not well-known terms are explained or there exists a link to the explanation on
the web. Then, the reduction goal is explained in detail and smart meter information such as energy peaks
are showed if they are available.
In the case of e-invoicing, the “optimised invoice” is sent by e-mail additionally to the publication on the e-
banking account. This approach reduces the risk of unread invoices.
The approach “optimised invoice” is an indirect feedback model (see introduction chapter to the main body
of the final report) which is mainly based on nowadays available information. Only the monthly consumption
data has to be collected additionally, if it is not already available for the utility. Therefore, it is possible to
implement this two-level-information-based optimised invoice with low effort. This DSI model is suitable for
an immediate and cost-effective improvement of the existing invoicing model, which is regulated by law.
Online Customer Platform
The second enhanced solution is based on an interactive web platform. Each customer possesses his
personal account on the utility’s platform. The invoices are available on the platform monthly. For this, the
consumer receives an e-mail including a link to the invoice on the platform. That way, every consumer has
to enter the platform for paying the invoice. The invoice itself is reduced to the minimum of information
which is legally prescribed. All additional information is provided on the platform. The consumption is
illustrated in an interactive time diagram (Figure 79).
2016
2015
Figure 79: Interactive energy consumption diagram, own illustration based on
documents (Endesa, 2017 and Umweltschulen, 2017).

109
The diagram shows the continuous graph of the actual consumption compared to the graph of the past
year. It can be zoomed in and out to gather more fine-grained information about the consumption and
conduct more specific historical comparisons. Individual power peaks can be recognised for example by
zooming in on a one-day zoom-level. Personalised energy conservation advices are provided and
personalised reduction goals can be optionally set by consumers. Explanations concerning the invoicing or
the used terms, as well as the tutorials regarding energy efficiency are available on the platform in different
forms of presentation (e.g. video, interactive illustrations, questionnaires). Herewith, the informative content
can be increased and learning effects can be obtained. Additionally, customer services as used in today’s
online customer service platforms can be implemented. By combining the platform with a mobile app, push
notifications can be provided additionally.
The “Online customer platform” is based on existing web technologies and smart meters. Therefore,
investment in smart meters and in development of the platform is necessary. Internet access and e-mail
are further mandatory requirements for this DSI model. As 90% of the Swiss population uses the internet
(BFS, 2016), this is not a considerable weakness. With that, feedback can be provided individually, in a
timely manner and in an interactive form. The platform can be combined with customer services and form
the single point of contact for the consumers. It is a future-oriented and expandable approach, which could
replace the commonly used paper invoice as the main source of information.
Segment-Oriented Customer Information
Another approach which can be used to enhance DSI is segment-orientated costumer information, which
is likely going to become increasingly important with the market liberalisation and the corresponding
increased competition for customers. With segment-oriented information, the risk of information overload
can be reduced and the feedback content can be specified to the needs of the consumers.
In (Klöckner, 2015), four basic segmentation approaches are identified: demographic, geographic,
behavioural and psychometrical. While the main advantage of demographic and geographic approach is
the high accessibility of data, they serve normally only as proxies for the actual segmentation criterion, so
that segmentation accuracy is sometimes challenged. On the other hand, behavioural and psychometrical
approaches are proximate to or match exactly the segmentation criterion. However, they are associated
with costly data collection efforts, since they require very detailed personal data. Examples for
psychometrical segmentation approach include value-based segmentation, personality-based
segmentation, lifestyle-based segmentation or stage-of-behaviour-change-based segmentation according
to Bamberg’s stage model of behaviour change (Bamberg, 2013).
Figure 80: Value-based segmentation approach inspired by the Theory of Basic Human Values ([20]) and its applications in environmental psychology (e.g. [21], [22], [23])

110
In Figure 80, a value-based psychometric segmentation approach based on the Theory of Basic Human
Values (Schwartz, 1992) is illustrated. It shows four basic human values commonly considered as the most
relevant for energy-related behaviour as well as their respective implications for the DSI framing. Thereby,
Framing 1 corresponds to egoistic values, Framing 2 to hedonic, Framing 3 to biospheric and finally
Framing 4 to altruistic ones. Two DSI features, where value-based framing can be well applied are DSI
content and design. For example, DSI for the “egoistic segment” could be framed like it currently is in the
common energy bill in Switzerland, where consumers are informed regarding the costs of their energy
consumption and the consumed energy quantity. “Biospheric segment” could be informed additionally about
the CO2 emissions or nuclear waste provided by the own energy consumption. DSI for the “altruistic
segment” could remind the customer that every CHF saved on energy consumption could otherwise be
donated to a charity organization in addition to standard information about energy costs and quantity.
Finally, DSI for the “hedonic segment” could be addressed through an appealing design focusing on fun
and pleasure no matter what information is included.
The purpose of the above example is just to illustrate how a specific segmentation approach can be applied
to DSI and not to suggest any specific segmentation concept to the utiolities. As already mentioned above,
there is always a certain trade-off between segmentation accuracy and costs. Hence, which approach is
chosen by a certain utility will depend on its specific goals as well as available data and resources.
Moreover, which segmentation approach is chosen also depends on the characteristics of the customer
base, which additionally leads to differential approaches chosen by different utilities.
9.3.2 Development of the first visual drafts
The three approaches for the development of the IMPROVE solutions described in the previous section
served as a basis for drafting specific designs jointly with the project partners from HES-SO, SUPSI and
FHNW. In an iterative process which started in a workshop with all project partners and continued via e-
mail exchange, the decision was made to substantially narrow the focus on:
(1) easy-to-implement, low-cost solutions (implementable as of tomorrow);
(2) solutions, which do not involve any loss of information if provided in form of conventional, black-and-
white paper bill;
(3) helping customers to rank their consumption (rather high, rather low, rather “normal”) without
necessarily specifying what is the baseline (an issue to deal with in consecutive working packages and
possibly in a follow-up project);
Pursuing this narrower focus resulted in 6 visualisations presented in Figure 81 to Figure 86 to be included
in the consumer survey conducted in chapter 10 in order to get customers feedback on them.
Solution 1 presents the typical paper bill commonly deployed by most Swiss utilities having as the main
goal complying with national legislation. The idea behind it is to find out the level of customer satisfaction
with the current solution and to give the customers a reference point for evaluating other, more advanced
solutions.

111
Figure 81: Solution 1
Figure 82: Solution 2
Energy
Distribution
Swissgrid
Taxes & fees
Billing period
Billing period
Billing period
Billing period
Subtotal energy (excl. VAT)
Subtotal distribution (excl. VAT)
Subtotal Swissgrid (excl. VAT)
Subtotal taxes (excl. VAT)
Total (excl. VAT)
Quantity Unit priceCHF
AmountCHF (No VAT)
% VAT
Federal taxe
Cantonal taxe
Cantonal fees
Communal fees
Rainbow electricity
Rainbow abonnement
Rainbow electricity
Rainbow electricity
Mean national energy consumption 2'320
Quantity
Quantity
Unit priceCHF
Unit priceCHF
Unit priceCHF
AmountCHF (No VAT)
AmountCHF (No VAT)
% VAT
% VAT
% VATAmountCHF (No VAT)
Quantity
Efficient
Not efficient
Your level ofenergy consumption
Average of all households similar to mine, in my region
Your annual energy consuption

112
Solution 2 depicts the customer’s consumption level on the energy efficiency level and compares it with the
consumption level of average similar household without explicitly specifying how the “similar household” is
defined. The focus here is to get a very simple and fast overview of the own consumption including a
normative message without going much into the detail.
Figure 83: Solution 3
Solution 3 offers a visual comparison of the own energy consumption with the average consumption of
household with different household sizes, as the number of occupants is a private information that utilities
are not able to have (privacy laws). This solution thus specifies what is meant by “similar households”:
household with the same household size. It contains more information for the customer and simultaneously
requires less data on customers from the utility, since the utility doesn’t need to know how large the
household is.
Figure 84: Solution 4
1 2 3 1 > 4
Your levelof energy
consumption
Level of energy consumption for different occupency in the households
Number of persons in the household
1 2 3 4 > 4
Your levelof energy
consumption
Low
Normal
High
Low
Normal
High
Low
Normal
High
Low
Normal
High
Low
Normal
High
Your level ofenergy consumption
Your level of energy consumption
Number of persons in the household
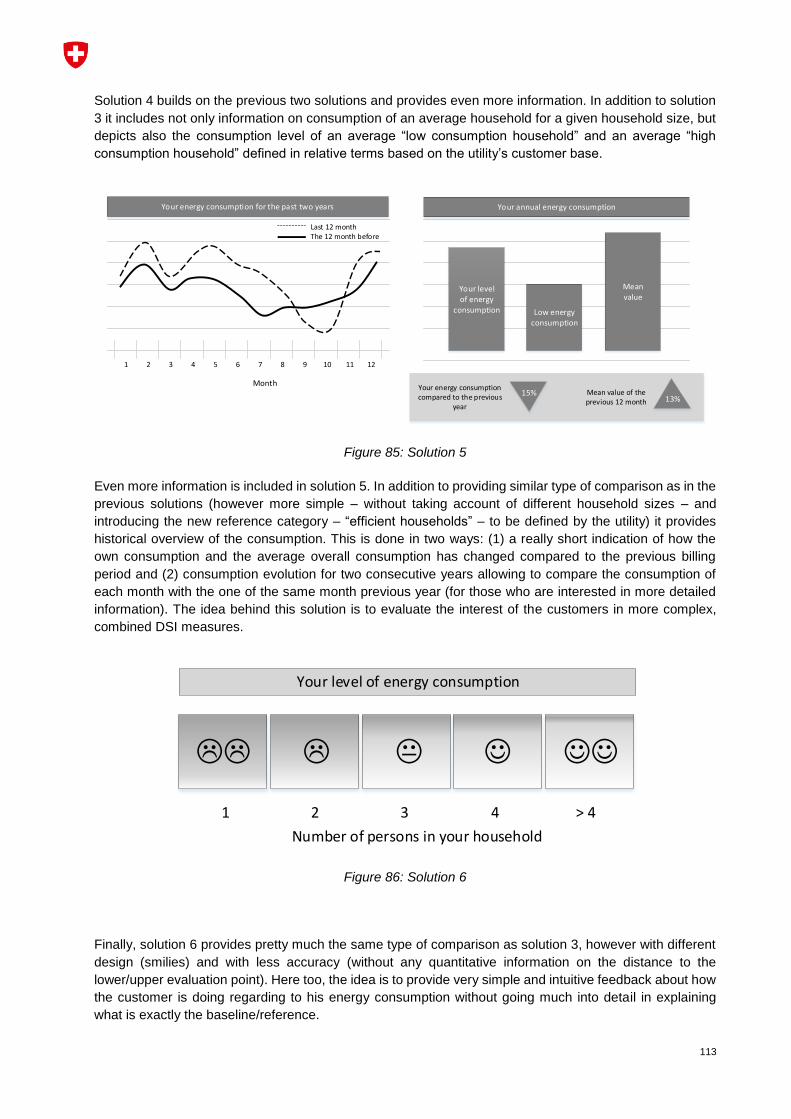
113
Solution 4 builds on the previous two solutions and provides even more information. In addition to solution
3 it includes not only information on consumption of an average household for a given household size, but
depicts also the consumption level of an average “low consumption household” and an average “high
consumption household” defined in relative terms based on the utility’s customer base.
Figure 85: Solution 5
Even more information is included in solution 5. In addition to providing similar type of comparison as in the
previous solutions (however more simple – without taking account of different household sizes – and
introducing the new reference category – “efficient households” – to be defined by the utility) it provides
historical overview of the consumption. This is done in two ways: (1) a really short indication of how the
own consumption and the average overall consumption has changed compared to the previous billing
period and (2) consumption evolution for two consecutive years allowing to compare the consumption of
each month with the one of the same month previous year (for those who are interested in more detailed
information). The idea behind this solution is to evaluate the interest of the customers in more complex,
combined DSI measures.
Figure 86: Solution 6
Finally, solution 6 provides pretty much the same type of comparison as solution 3, however with different
design (smilies) and with less accuracy (without any quantitative information on the distance to the
lower/upper evaluation point). Here too, the idea is to provide very simple and intuitive feedback about how
the customer is doing regarding to his energy consumption without going much into detail in explaining
what is exactly the baseline/reference.
Low energy consumption
Meanvalue
Your levelof energy
consumption
Your annual energy consumptionYour energy consumption for the past two years
Month
1 2 3 4 5 6 7 8 9 10 11 12
Last 12 monthThe 12 month before
Your energy consumptioncompared to the previous
year
Mean value of the previous 12 month 13%
15%
1
Number of persons in your household
2 3 4 > 4
JJ L K JLL
Your level of energy consumption

114
9.4 Chapter’s conclusions
Behaviour change models from the field of behavioural economics and social-psychology illustrate how
behaviour change in energy consumption can be achieved through behavioural interventions. One of the
intervention strategies is energy feedback, whose effectiveness depends mainly on its frequency,
informative content, specificity, comparison, interactivity and customization. The analysis of utilities in the
Northeast of Switzerland shows that the potential for improved DSI models is existent mainly in relation to
feedback frequency, level of specificity, market structure and roll-out of smart meters.
Based on the list of criteria defined within the study, three possible approaches for the development of
enhanced DSI models were drafted. The three approaches are not meant as substitutes: on the contrary,
they could be perfectly combined. The optimised invoice is an effective approach to enhance today’s energy
invoices by more frequent invoicing and by providing stage-based information as well as specific feedback.
Interactive feedback and different modes of presentation are used on the online customer platform. With
the possibility of bidirectional communication, the platform builds a single point of contact for the household
consumers to the utility. Another possibility to improve the effectiveness of a DSI model is to provide
segment-oriented information. Within this approach, framed information and feedback is provided,
dependent on the consumers’ characteristics.
The above approaches together with the feedback from project partners served as viable guidelines for
developing specific visualisations of DSI models for the IMPROVE project. In the next project steps, these
visualisations will be verified by Swiss household consumers within a survey and then further discussed
with partner utilities. The last step includes formulating recommendations for the potential implementation
of the most promising approaches within a larger pilot study to be considered as a potential follow-up
project.

115
10 Consumer satisfaction survey
Improving consumption information to energy users could potentially lead to a decrease in household energy consumption and ultimately in overall energy savings (Dromacque C. et al., 2013; Fischer, 2008). Surveys on energy users’ knowledge and understanding of present energy information offer some insights on what energy information users currently have and what could be improved. The evidence is that energy users have incomplete information for making energy choices (Burger, 2017; Castri et al., 2017; National Research Council (US), 1984)
Saving energy and energy efficiency measures have been of interest to researchers since the 1970s oil price crisis, when energy conservation programs were conducted to encourage consumers to reduce their energy consumption (Martiskainen, 2007). Numerous experimental studies have shown that improved delivery of information could certainly speed the rate of adoption of sustainable consumption behaviours. For example, feedback and more informative billing studies have shown an average of 5 -10% energy savings at least in the short-term, some of which without any investment in technology (Martiskainen, 2007; National Research Council (US), 1984).
However, it is recognised that energy use in the home is, most of the time, invisible to consumers and that energy consuming behaviours are based on routine and habit (Fischer, 2008; Torriti, 2016). Research conducted in the 1990s found that, in general, people fail to link their everyday actions to their energy consumption pattern and this trend is still true today. For a review of the literature please refer to (Martiskainen, 2007). Today, to make energy use visible, improvement of the energy consumption feedback to the user must be considered.
Despite being complex and difficult to change, behaviours can still be influenced with the aim of reducing energy consumption. Several studies that look at the impact of various intervention measures including improved feedback through better and more informative bills, suggest that this latter has great potential to influence household energy consumption behaviours. A comprehensive review of feedback measures and their impacts is given in (Martiskainen, 2007).
However, existing research fails also to provide a clear evidence on which measure or combination of measures is most effective in changing energy consuming behaviours and provide largest and long-term energy savings. Today the key question is how to make energy use visible to the householder so they can consume less. The evidence from various studies is that making energy information available to people is not enough (National Research Council (US), 1984).
According to (Fischer, 2008), better information on billing, through increased feedback frequency, historical consumption data and the provision of appropriate benchmarks is thought to make a difference if it is presented in an understandable and appealing format, if it is available through several media and if it comes from a trusted source. In this review, a highly motivating design bill, as a carrier of feedback information, could result in considerable savings with little implementation effort. In addition, the bill could be designed to be a long-term tool in reinforcing energy-conscious habits over time and consequently changing users’ energy wasting behaviour to more positive behaviour (Fischer, 2008). This points out the potential of improved billing information in providing more meaningful energy feedback to the consumer.
It is the purpose of this chapter to conduct a national survey to gauge energy users’ opinion on the type of information currently available in their energy bill and their interest to improve knowledge, attitudes and behaviours towards energy consumption. The focus is both on electricity and on heating consumption information as evidence suggests that little effort has been made to improve household heating information due to difficulties in getting appropriate feedback. In addition, the survey gathers views on medium and mode of presentation preferences of consumers as research indicated that most experimental studies do not seem to reflect these aspects (Fischer, 2008).
This document presents the data analysis of the responses obtained in this survey that was undertaken from October 2017 until the end of January 2018. From this survey, information was gathered on:
what and how energy consumption information is available to Swiss energy customers
consumer satisfaction regarding the current information received from the utilities about their energy consumption
consumer level of understanding of current energy consumption information
consumer level of interest in more effective presentation mode solutions on energy consumption

116
10.1 Methodology
10.1.1 The survey contents
The survey contains a maximum of 71 questions, which focus on:
information available on household electricity consumption
information available on household heating consumption
customers’ preferences regarding six different energy consumption displays for the energy bill
social and demographic information of respondents
The recorded social and demographic data includes gender, age profile, employment status, education level, type of dwelling, annual household income, household type, canton and postcode.
A total of 1937 energy consumers completed this survey.
10.1.2 Data collection procedure
To reach as much Swiss energy consumers as possible and avoid any misunderstandings due to language barriers, the questionnaire was available in the three official Swiss languages: German, French and Italian, see Appendix 12 for the French version, as an example.
The questionnaire was implemented in SurveyMonkey (SurveyMonkey Inc., 2018), a low cost online survey service offering easy question implementation, the ability to collect data in a consistent and quick manner and with mobile-friendly capabilities. To maximise response rate and reliability of answers, the online questionnaire was designed with three type of questions: multiple-choice, close questions and open questions.
Communication and promotion of the survey was made via emails, advertised in newsletters and embedded in the energy bills, in partnership with the utility partners through their extensive customer network. The survey was also available in the websites of some utility partners, inviting in this way website visitors to complete the survey. The survey was equally announced in the social media and networks for further visibility. To improve response rate, participants were given the opportunity to win CHF150.- in a random draw.
10.1.3 The sample description
The sample is not representative of the Swiss population because it was not randomly selected nor divided into homogenous groups. In this study, the respondents do not represent the real proportion of each Swiss region, see Figure 87.
Figure 87 Survey sample versus Swiss population
This is one of the major drawbacks of online surveys as no master list of email addresses or contacts is available for the entire Swiss energy consumer population, not to mention those with no access to the internet. This type of survey is based on participant self-report and no control is possible over the sample selection. It is also acknowledged that the sample here corresponds to consumers who decide voluntarily to take part in the survey. These are likely to be more interested or enthusiastic about this topic, therefore more willing to complete the survey. For all these reasons, the results of this analysis are biased.

117
Nevertheless, in reality completely unbiased, independent samples are hard to find and results can still reveal interesting trends on the type of information currently available in the energy bill of Swiss consumers and their interest to improve knowledge, attitudes and behaviours towards energy consumption.
10.1.4 The data cleaning process
Statistical analysis requires a so-called data processing step to obtain quality data that can provide relevant results and consequently generate sound evidence. In this study, the three datasets, one for each Swiss region, were integrated and translated into one English dataset to finally undergo a manual cleansing process that dealt with missing values and noisy elements. In addition, the data was fitted into specific tabular formats for subsequent analysis. This pre-processing task corresponds to more than 70% of the overall analysis work.
10.1.5 Data analysis
In this study, data exploration uses mostly a combination of summary data (percentages) and visualisation graphs (bar chart). The analysis was performed with R, a language and tool dedicated for statistical analysis (The R Project for Statistical Computing).
The data analysis was performed using plain descriptive analysis and a multiple correspondence analysis (MCA). This latter allows investigating patterns of relationships of several dependent variables.
The descriptive statistics method
Descriptive statistics is a method that helps to quantitatively describe and summarise data in a simple and meaningful way. It allows a simpler interpretation of the data by looking at its distribution and spread parameters. The outcome of this analysis is presented in a combination of percentages and bar charts.
The Multiple Correspondence analysis method
The Multiple Correspondence Analysis (MCA) is a statistical approach to describe qualitative data. It is used to identify underlying structures in the dataset.
MCA is a generalisation of Principal Component Analysis when the variables to be analysed are categorical (classes) instead of quantitative. In MCA, the categorical variables assessed are represented as a point in a low-dimensional orthogonal space (generally 2 dimensions) with a maximum of inertia i.e. the largest variability in the data is captured in the first dimension, the next largest variability in the second dimension.
MCA allows assessing the links and intensity between several categorical dependent variables. It allows to visualise the relationships among categorical elements (classes) of variables. Based on this, it is thus possible to identify clusters of respondents as well as categorical elements (classes) that “drive” to an answer (for example, the class “Bachelor Degree and higher” of the variable “Education level” could lead to a more positive or negative appreciation of one of the IMPROVE solutions). More details on the MCA method can be read in (Baccini, 2010).
Within this chapter, MCA will be applied for all the solutions regarding the two questions “level of understanding” and “level of interest”. Then, based on these results, clusters of respondents will be proposed in order to identify if, for some visual solutions, part of the respondent with specific socio-demographic classes would have a more positive or negative perception of the solutions. However, prior to apply MCA to our survey answers, some of the classes with too few answers were merged to make the assessment more clear. Thus, by merging the classes, the following socio-demographic categories were retained for the MCA assessment:
Gender: 2 classes (male, female)
Age profile: 3 classes (18-35 years old, 36-55 years old, 56 years or older)
Employment status: 2 classes ("Employed", "Not Employed)
Education level: 3 classes ("Technical training", "Bachelor degree and higher", " Primary school or High school graduate")
Dwelling type: 2 classes (MFH, SFH)
Household type: 3 classes ("1 person", "2 persons", "Above 2 persons ")
Household annual income: 3 classes ("less than 80'000 CHF”, "btw. 80'000 et 99'999 CHF", "over 100'000 CHF")

118
The number of observations per classes is more homogenous, however, for some of them, there is still a small sample size. However, it is not possible to merge more classes without losing too much information. In addition to these modifications related to socio-demographic attributes, the answers related to the attractiveness of each IMPROVE solution have been organised as followed:
Level of understanding of the visual solutions: 3 classes (“Good”, “Neutral”, “Not Good”)
Interest for the visual solutions: 4 classes (“Interest”, “Neutral” , “No Interest”, “No Opinion”)
These simplifications were made for better understanding of the socio-demographic classes influences on the IMPROVE proposals. Ideally, it would be necessary to get higher answer rates per classes (or at least more homogenous rates) in order to get a better representativeness of the MCA for the sample of respondents. However, the proposed method should give a global vision of the influence of the socio-demographic classes on the perception (understanding and interest) of the six IMPROVE solutions.
From the MCA, two types of results are displayed:
MCA graphics representing data as points in a low-dimensional Euclidean space with a maximum of inertia. In this representation, the categorical variables are displayed according to the principle axis (2 dimensions here) enabling to identify the association between the categories.
Table results of the questions related to the IMPROVE solutions for clusters defined via the MCA. The clusters represent sub-samples with relatively homogeneous comportments.
10.2 Results and discussion
The purpose of this section is to explore the data to discover useful information in order to meet the goal of providing conclusions and supporting decision-makers to improve the consumption information available on the energy bill. Hereafter, the results of the survey are presented, starting with the demographic profile of respondents and followed by the responses to the three other sections of the survey. Results are given in terms of the whole sample. Overall, no significant differences were observed between the three Swiss regions.
10.2.1 Social demographic profile
Figure 88 presents the social demographic profile of the survey’s participants
Figure 88 Demographic breakdown
Typical respondents of the survey are male (66%), older than 25 years (98%), employed or retired (91%). Nearly half of the respondents (48%) report to have a high level of education (bachelor degree and higher) in accordance with the actual Swiss situation which points for an even balance (45%) between secondary and tertiary education (Office Fédéral de la Statistique, 2017). The majority of respondents live in multi-family houses (52%) with mostly 1 to 2 persons per household (60%) with an annual income lower than 100’000 CHF (50%).
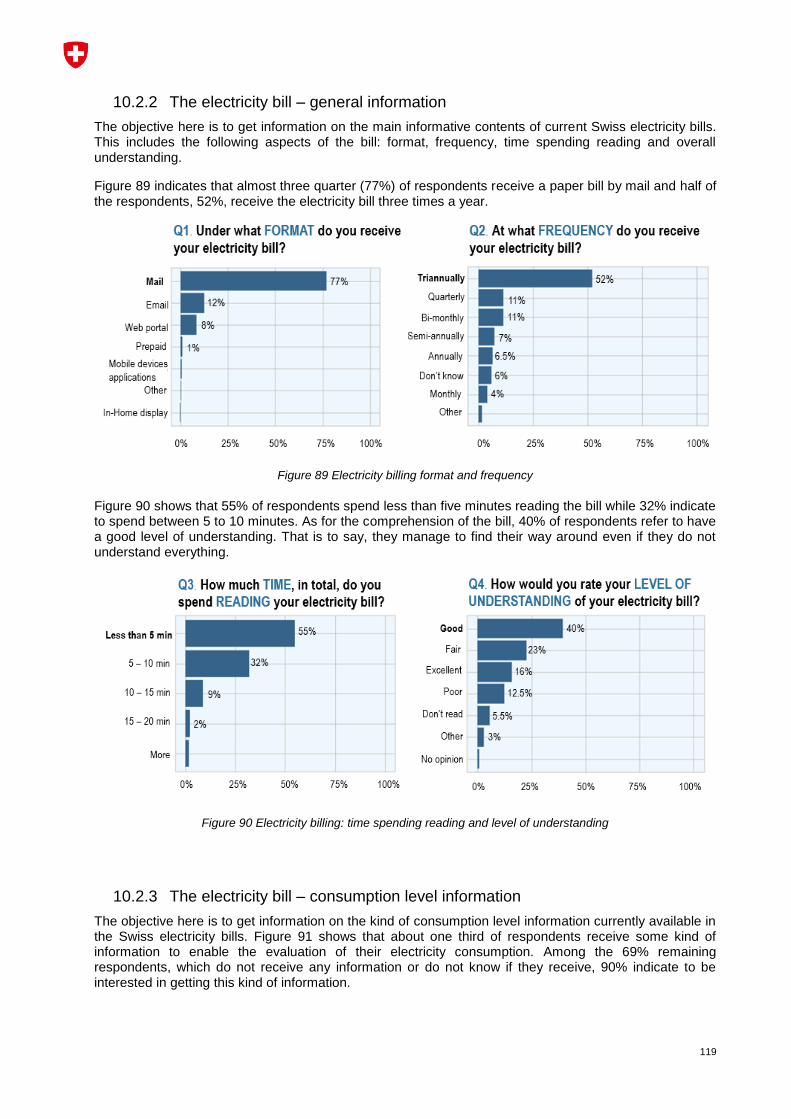
119
10.2.2 The electricity bill – general information
The objective here is to get information on the main informative contents of current Swiss electricity bills. This includes the following aspects of the bill: format, frequency, time spending reading and overall understanding.
Figure 89 indicates that almost three quarter (77%) of respondents receive a paper bill by mail and half of the respondents, 52%, receive the electricity bill three times a year.
Figure 89 Electricity billing format and frequency
Figure 90 shows that 55% of respondents spend less than five minutes reading the bill while 32% indicate to spend between 5 to 10 minutes. As for the comprehension of the bill, 40% of respondents refer to have a good level of understanding. That is to say, they manage to find their way around even if they do not understand everything.
Figure 90 Electricity billing: time spending reading and level of understanding
10.2.3 The electricity bill – consumption level information
The objective here is to get information on the kind of consumption level information currently available in the Swiss electricity bills. Figure 91 shows that about one third of respondents receive some kind of information to enable the evaluation of their electricity consumption. Among the 69% remaining respondents, which do not receive any information or do not know if they receive, 90% indicate to be interested in getting this kind of information.

120
Figure 91 Qualitative or quantitative information on electricity consumption level
Figure 92 shows the type of information that might interest consumers. More than 80% of the respondents would be interested or very interested to get a comparison of their energy consumption with an average household. However, no further details could be obtained regarding the type of desired information, as the level of interest between the three proposed options are nearly identical.
Figure 92 Information of interest expected in the electricity bill
In any case, as shown in Figure 93, nearly 60% of respondents prefer an energy consumption comparisons at local level, typically against the neighbourhood average with a marked decline of interest for comparisons at larger scales: cantonal and national.
Figure 93 Comparison preferences for the electricity bill
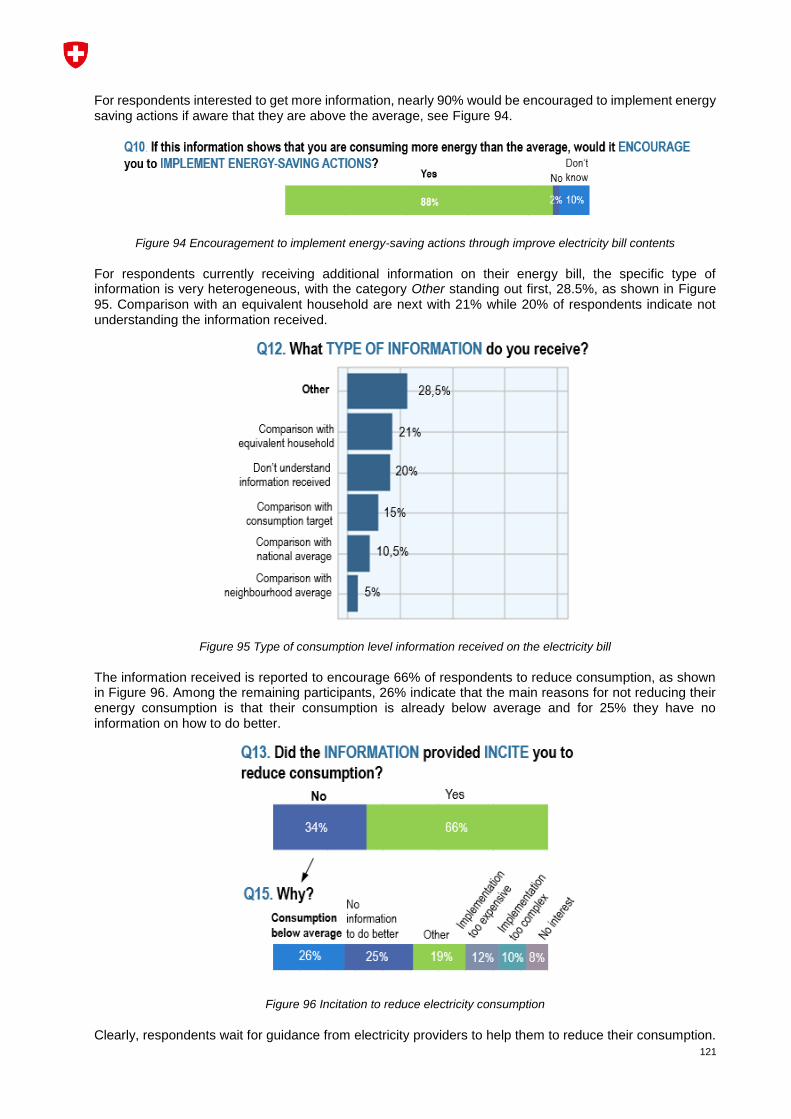
121
For respondents interested to get more information, nearly 90% would be encouraged to implement energy saving actions if aware that they are above the average, see Figure 94.
Figure 94 Encouragement to implement energy-saving actions through improve electricity bill contents
For respondents currently receiving additional information on their energy bill, the specific type of information is very heterogeneous, with the category Other standing out first, 28.5%, as shown in Figure 95. Comparison with an equivalent household are next with 21% while 20% of respondents indicate not understanding the information received.
Figure 95 Type of consumption level information received on the electricity bill
The information received is reported to encourage 66% of respondents to reduce consumption, as shown in Figure 96. Among the remaining participants, 26% indicate that the main reasons for not reducing their energy consumption is that their consumption is already below average and for 25% they have no information on how to do better.
Figure 96 Incitation to reduce electricity consumption
Clearly, respondents wait for guidance from electricity providers to help them to reduce their consumption.

122
10.2.4 The heating bill
In this section, the heating bill will be studied. The analysis was divided into tenants and homeowners, as the availability of information to these two categories is rather different. Approximately 42% of tenants and 57% of owners are recorded in the survey.
Heating bill of tenants
The objective here is to get information on the main informative contents and level of understanding of current tenants’ heating bills. The questions formulated resemble those formulated in the electricity bill section. Figure 97 shows that two thirds of tenants have the heating bill included in the rent.
Figure 97 Tenants heating bill
Half of these indicate to receive some kind of information regarding heating consumption, see Figure 98. Over 80% of the remaining, half are interested in getting this kind of data.
Figure 98 Tenant information on heating consumption level
The type of information for which respondents seem to have an interest is very heterogeneous as shown in Figure 99. It starts from simple heating consumption information, through cost of consumption to comparisons of different kinds. As for the electricity bill, nearly 90% report that they would be more encouraged to implement energy-saving actions if better informed.

123
Figure 99 Information of interest expected by tenants in the heating bill
In terms of heating consumption level, it is clear from Figure 100 that nearly two thirds of tenants do not get enough information to allow an evaluation of their level of consumption. From these two thirds, about 90% indicate an interest to get this information.
Figure 100 Information on heating consumption level
As far as getting some kind of comparison with an average household, Figure 101 shows that more than 80% of tenants are clearly interested.

124
Figure 101 Information of interest expected in the tenant heating bill
Tenants prefer to have a comparison of their energy consumption at local, neighbourhood level and report a declining interest in cantonal or national comparison levels. 90% of tenants report that this kind of information would encourage them to implement energy-saving actions, see Figure 102.
Figure 102 Comparison preferences in the tenant heating bill
For the 34% of tenants currently receiving some sort of consumption level data (c.f. Figure 100), comparisons with an equivalent average household stands as the first type of information received followed by historic comparisons, as shown in Figure 103. 60% of tenants report that this information has encouraged them to implement energy-saving actions.

125
Figure 103 Type of consumption level information received on the tenant heating bill
Heating bill of homeowners
Figure 104 shows that, as for electricity billing, the paper bill dominates and annual billing concerns nearly 40% of homeowners.
Figure 104 Home owner heating billing format and frequency
About 50% of homeowners spend less than 5 minutes reading the bill. The level of understanding is reported to be good to excellent for over 50% of them, see Figure 105.

126
Figure 105 Homeowner heating billing: time spending reading and level of understanding
As far as the consumption level information is concerned, findings for the heating bills are similar to those of electricity bills, except that the breakdown of costs is even less stated. This seems to reflect the fact that heating bills do not yet have such a detailed and standardised format in place as electricity bills for displaying informative contents.
In Figure 106 less than 15% of homeowners receive some kind of information enabling the evaluation of their heating consumption. 75% of the remaining respondents, that do not receive information or do not know if they receive it, indicate to be interested in getting this information.
Figure 106 Qualitative or quantitative information on heating consumption level
As for electricity billing, interest from respondents to get comparisons with an average household are evident but little detail could be obtained from the responses, as the level of interest between the three proposed options remains quite close, see Figure 107. Yet, a slight advantage for comparisons in terms of equivalent surface area is observed.

127
Figure 107 Information of interest expected in the heating bill
In any case, over 60% of respondents prefer comparisons at local level, typically against the neighbourhood average with a marked decline of interest for comparisons at larger scales: cantonal and national, see Figure 108.
Figure 108 Comparison preferences for the heating bill
For respondents interested to get information, nearly 90% would be encouraged to implement energy saving actions if aware that they are above the average, see Figure 109.
Figure 109 Encouragement to implement energy-saving actions through improve heating bill contents

128
10.2.5 Consumer visual preferences
The aim of this survey was not only to assess Swiss energy users’ opinion on the type of information currently available in their energy bill and their interest to improve knowledge, attitudes and behaviours towards energy consumption. It was also to gather views on improved displays for the energy billing information, in order to make the customer more aware of his level of energy consumption.
Thus, the six IMPROVE display proposals, as defined in chapter 9 of the current project, were included in the survey and compared. The proposals consist of one table format (proposal 1), four graphical formats (proposals 2 to 5) and one emoticon label (proposal 6) as shown in Appendix 13.
Descriptive analysis results
In terms of overall understanding of the proposals, Figure 110 indicates that proposals 1 and 6 received 70% or less of “good to excellent” level of understanding. All other four options get more than 85% of “good to excellent” understanding score. In order to better assess responses, the understanding scales were ranking from Excellent (1) to No opinion (5). The idea is to put into evidence excellent and good scores in the overall analysis. Based on this ranking, the weighted mean is calculated along with the standard deviation (SD) that indicates the data spread.
Results from this simple descriptive analysis show that, on average, proposals 1 and 6 obtain a good to fair understanding score while the other proposals obtain, on average, excellent to good. It also reveals a slight advantage for proposal 2, closely followed by proposals 3 to 5 that are nearly identical in terms of SD and mean and cannot be really differentiated. This seems to point out that despite a good understanding of the table display, as currently found, for instance, in most Swiss electricity bills (proposal 1), the informative contents could be improved by using more graphical elements.
As for the interest in receiving these visualisation proposals in their bills, results shows that none of the proposals receives the very interested score and only proposal 6 was clearly of no interest at all for respondents, see Figure 111. As before, a ranking scale was applied to the proposed interest categories, with values ranging from Very interested (1) to No opinion (6). The calculated weighted mean and SD indicate that, on average, energy consumers appreciate better proposals 1 to 5 with a slight preference for proposals 2 to 5. These latter present nearly identical mean and SD and cannot be differentiated at this point.
In all cases, consumers wish to receive this kind of information with the energy bill. No significant differences were observed between the sample results and the data derived from the three Swiss regions.

129
Figure 110 Level of understanding of thevisualisation proposals

130
Figure 111 Level of interest in receiving the visualisation proposals

131
Multiple correspondence analysis results
In order to identify potential associations between the visualisation results and socio-demographic factors, a multiple correspondence analysis was performed. The aim is to verify if certain groups of respondents present similar profiles in their responses to the questions.
Within the consumer survey, six different visual solutions were proposed to the respondents. For each of them, two questions were asked:
How would you rate the level of understanding of proposals? o 5 possible answers (levels): “Poor”, "Fair", “Good”, "Excellent", "No opinion"
Describe your interest in receiving this visual format? o 6 possible answers (levels): "Not interested at all", "Not interested", "Neutral",
"Interested", "Very interested", "No opinion"
The previous chapters that described the survey results showed that among the six visual solutions:
proposal 1 (table format) was less understood than the others and interest was lower than proposals 2 to 5
proposal 6 (emoticon label) was also not really understood
all other proposals were interesting and understood.
In addition to this global analysis, an additional assessment of the evaluation of the six visual solutions has been undertaken in order to deepen the analysis based on the respondents’ socio-demographic attributes. The following seven attributes, named later variables, have been used with, for each of them, different classes:
Gender: 3 classes (male, female, do not want to answer)
Age profile: 6 classes (18-25 years, 26-35 years, 36-45 years, 46-55 years, 56-65 years, 66 years or older)
Employment status: 5 classes ("Employed", "Out of work/Homemaker", "Retired", "Other, "Student”)
Education level: 5 classes ("Technical training", "Bachelor degree and higher", "High school graduate", "Other", "Primary school")
Dwelling type: 3 classes (MFH, SFH, other)
Household type: 6 classes ("1 person", "2 persons", "3 persons", "4 persons", "5 persons", "Other")
Household annual income: 7 classes ("less than 60'000 CHF","btw. 60'000 et 79'999 CHF","btw. 80'000 et 99'999 CHF", "btw. 100'000 et 119'999 CHF", "btw. 120'000 et 149'999 CHF", "over 150'000 CHF", "Do not want to answer")
With the help of these different variables, it is possible to refine the answers related to the IMPROVE solutions in correspondence with these socio-demographic attributes.
Results are presented in a combination of tables and factor maps that show a global pattern within the data. Grey points represent individual answers while socio-demographic categories are coloured words. In the factor map, grey points with similar profiles are closed and variable categories with similar profiles are grouped together. The first axis (x-axis) represents the maximum of inertia and the second axis (y-axis) represents the second principal component (lower inertia than x-axis). In order to interpret a MCA plot:
Regarding the points (individual answers): o The distance between points is related to their homogeneity. Two points close will have
similarities in their profiles.
Regarding the variable: o Classes that are farther away from the origin indicate categories that are more
influential. o Among one variable, two classes on opposite sides of the plot indicate that a component
contrasts these classes.
Based on these two interpretations, cluster will then be defined and represent sub-sample with homogeneous behaviour regarding the IMPROVE solutions.
A. MCA for Proposal 1 Proposal 1 in the survey corresponds to the table format already provided by the Swiss utilities on the electricity bill. The MCA results are presented in Figure 112 and Figure 113.

132
Figure 112 MCA, understanding of proposal 1

133
Figure 113 MCA, interest for proposal 1

134
It can be seen that some levels of the variable influence the answer. For example, it appears that people living in MFH buildings understand less the IMPROVE proposal 1 (MFH level close to “Not good” level). Younger people (18 to 35 years old) are also less interested or have less understanding of proposal 1 than others have.
Based on these results and for each question (level of understanding and interest) two clusters of respondents were defined. The level of understanding’s percentage as well as the socio-demographic structure are presented in the Table 20:
Table 20 Level of understanding of proposal 1 by clustering the sample via MCA
In the cluster “Understand more”, the appreciation “Good” represents 75.4% of the answers while in the cluster “Understand less”, the appreciation “Good”, only represents 54.1%. By looking at the socio-demographic characteristics, it can be seen that the cluster “Understand less” has a bigger proportion of young single people (18-35 years old, one person per household), living in MFH with smaller incomes. Obviously, these observations are coherent with the results of Figure 112 since the clusters were defined according to the MCA. It is also possible that older people categories (who understands more the solution) are more used to this type of table format and reflect a rather conservative attitude, more reluctant to change. The gender and the activity status variables are also different in percentage between the two clusters. Thus, it seems that, according to the socio-demographic levels among each variable, the level of understanding for proposal 1 varies.
By looking at the level of interest of proposal 1, clusters were also defined according to the MCA (Figure 113), the results are provided in the Table 21.
Cluster
"Understand less"
Cluster
"Understand more"
All
sample
Not Good 45,9% 23,5% 30,4%
Good 54,1% 75,4% 68,9%
Neutral 0,0% 1,0% 0,7%
Female 56,9% 23,3% 33,6%
Male 43,1% 76,7% 66,4%
18-35 years old 67,1% 3,8% 23,2%
36-55 years old 24,9% 50,3% 42,5%
56 years or older 8,0% 45,9% 34,3%
Employed 91,8% 61,8% 70,9%
Not Employed 8,2% 38,2% 29,1%
Bachelor degree and higher 56,9% 50,2% 52,2%
Primary_highSchool_Graduate 11,3% 9,1% 9,8%
Technical training 31,8% 40,7% 38,0%
Multi-family house 83,8% 42,8% 55,3%
Single-family house 16,2% 57,2% 44,7%
1 person 50,4% 10,4% 22,6%
Above 2 persons 15,3% 48,5% 38,3%
2 persons 34,4% 41,1% 39,1%
btw. 80'000 et 99'999 CHF 23,1% 17,4% 19,1%
less than 80'000 CHF 56,7% 35,8% 42,2%
over 100'000 CHF 20,2% 46,8% 38,7%
425 965 1390Sample size
Dwelling type
Level of understanding
Gender
Age profile
Employment status
Education level
Household type
Shousehold annual
income

135
Table 21 Level of interest of proposal 1 by clustering the sample via MCA
As for the level of understanding, the younger age category, living in MFH with lower level of income is less interested in this solution. One possible explanation for these important differences between the clusters in terms of understanding and interest might be the level of complexity and low attractiveness of this visual solution. Indeed, among the six proposed IMPROVE solutions, proposal 1 (which corresponds to an improved version of the actual information provided on the bills) is rather difficult to interpret with the level of consumption (low, average or high) appearing as a very hidden element. Thus while most respondents understand the solution, some socio-demographic categories are less interested in it.
From this assessment, it is possible to confirm that the level of understanding and interest related to the IMPROVE proposal 1 is not homogeneous among the sample and the socio-demographic variables. It seems that there is not one single homogeneous visual solution able to please all energy consumers.
B. MCA for Proposals 2 and 3
In here, the same procedure as presented for the proposal 1 was applied. Since the results were similar between the two solutions, it has been decided to present them together. The level of understanding and the interest is presented in the Table 22 and Table 23:
Cluster
"Less interest"
Cluster
"Most interest"
All
sample
Interest 36,4% 57,4% 51,2%
Neutral 35,9% 26,7% 29,4%
No Interest 26,9% 14,7% 18,3%
No opinion 0,7% 1,2% 1,1%
Female 56,1% 24,1% 33,6%
Male 43,9% 75,9% 66,4%
18-35 years old 71,1% 3,0% 23,2%
36-55 years old 21,4% 51,4% 42,5%
56 years or older 7,5% 45,6% 34,3%
Employed 91,7% 62,2% 70,9%
Not Employed 8,3% 37,8% 29,1%
Bachelor degree and higher 56,3% 50,5% 52,2%
Primary_highSchool_Graduate 10,9% 9,3% 9,8%
Technical training 32,8% 40,2% 38,0%
Multi-family house 82,5% 43,9% 55,3%
Single-family house 17,5% 56,1% 44,7%
1 person 49,3% 11,3% 22,6%
Above 2 persons 16,3% 47,6% 38,3%
2 persons 34,5% 41,0% 39,1%
btw. 80'000 et 99'999 CHF 20,9% 18,4% 19,1%
less than 80'000 CHF 58,0% 35,5% 42,2%
over 100'000 CHF 21,1% 46,1% 38,7%
412 978 1390
Gender
Age profile
Employment status
Education level
Sample size
Dwelling type
Household type
Shousehold annual
income
Level of interest

136
Table 22 Level of understanding of proposals 2 and 3 by clustering the sample via MCA
Cluster
"Understand less"
Cluster
"Understand more"
All
sampleCluster
"Understand less"
Cluster
"Understand more"
All
sample
Not Good 9,3% 8,4% 9,1% 11,7% 9,9% 10,9%
Good 89,3% 91,6% 89,9% 87,2% 88,7% 87,8%
Neutral 1,4% 0,0% 1,1% 1,1% 1,4% 1,2%
Female 29,1% 48,6% 33,6% 39,9% 24,7% 33,6%
Male 70,9% 51,4% 66,4% 60,1% 75,3% 66,4%
18-35 years old 0,0% 99,7% 23,2% 39,1% 0,7% 23,2%
36-55 years old 55,4% 0,0% 42,5% 10,1% 88,4% 42,5%
56 years or older 44,6% 0,3% 34,3% 50,9% 10,9% 34,3%
Employed 64,8% 91,3% 70,9% 52,8% 96,5% 70,9%
Not Employed 35,2% 8,7% 29,1% 47,2% 3,5% 29,1%
Bachelor degree and higher 48,4% 65,0% 52,2% 46,9% 59,7% 52,2%
Primary_highSchool_Graduate 10,1% 8,7% 9,8% 10,1% 9,4% 9,8%
Technical training 41,5% 26,3% 38,0% 43,0% 30,9% 38,0%
Multi-family house 48,9% 76,5% 55,3% 63,6% 43,6% 55,3%
Single-family house 51,1% 23,5% 44,7% 36,4% 56,4% 44,7%
1 person 19,4% 33,1% 22,6% 33,2% 7,6% 22,6%
Above 2 persons 41,9% 26,6% 38,3% 17,0% 68,6% 38,3%
2 persons 38,7% 40,2% 39,1% 49,9% 23,8% 39,1%
btw. 80'000 et 99'999 CHF 18,7% 20,7% 19,1% 17,6% 21,4% 19,1%
less than 80'000 CHF 40,1% 48,9% 42,2% 59,6% 17,5% 42,2%
over 100'000 CHF 41,2% 30,3% 38,7% 22,9% 61,1% 38,7%
1067 323 1390 814 576 1390
Proposal 3
Level of understanding
Gender
Age profile
Employment status
Education level
Dwelling type
Sample size
Household type
Shousehold annual
income
Proposal 2

137
Table 23 Level of interest of proposals 2 and 3 by clustering the sample via MCA
Cluster
"Less interest"
Cluster
"Most interest"
All
sample
Cluster
"Less interest"
Cluster
"Most interest"
All
sample
Interest 59,5% 62,9% 61,4% 54,0% 57,1% 55,7%
Neutral 21,9% 22,4% 22,2% 28,0% 28,1% 28,1%
No Interest 17,9% 14,5% 16,0% 16,9% 14,1% 15,4%
No opinion 0,6% 0,3% 0,4% 1,1% 0,7% 0,9%
Female 30,8% 35,9% 33,6% 30,2% 36,5% 33,6%
Male 69,2% 64,1% 66,4% 69,8% 63,5% 66,4%
18-35 years old 0,2% 42,2% 23,2% 0,2% 42,7% 23,2%
36-55 years old 91,3% 2,1% 42,5% 89,2% 2,8% 42,5%
56 years or older 8,6% 55,7% 34,3% 10,6% 54,5% 34,3%
Employed 95,9% 50,3% 70,9% 96,7% 49,0% 70,9%
Not Employed 4,1% 49,7% 29,1% 3,3% 51,0% 29,1%
Bachelor degree and higher 57,0% 48,3% 52,2% 58,4% 47,0% 52,2%
Primary_highSchool_Graduate 10,0% 9,6% 9,8% 9,9% 9,7% 9,8%
Technical training 33,0% 42,1% 38,0% 31,8% 43,3% 38,0%
Multi-family house 48,3% 61,2% 55,3% 48,5% 61,1% 55,3%
Single-family house 51,7% 38,8% 44,7% 51,5% 38,9% 44,7%
1 person 15,9% 28,2% 22,6% 15,8% 28,4% 22,6%
Above 2 persons 63,0% 17,9% 38,3% 61,3% 18,8% 38,3%
2 persons 21,1% 53,9% 39,1% 22,8% 52,9% 39,1%
btw. 80'000 et 99'999 CHF 21,0% 17,6% 19,1% 20,8% 17,7% 19,1%
less than 80'000 CHF 23,8% 57,4% 42,2% 22,7% 58,7% 42,2%
over 100'000 CHF 55,2% 25,0% 38,7% 56,5% 23,6% 38,7%
630 760 1390 639 751 1390
Level of understanding
Sample size
Shousehold annual
income
Proposal 2 Proposal 3
Gender
Age profile
Employment status
Education level
Dwelling type
Household type

138
For the two solutions, the MCA gave the same conclusion. The level of understanding was not significantly driven by any of the socio demographic categories or classes. In other words, it seems that the entire sample had a good understanding of these two solutions. Indeed, by looking at the value among the level of understanding for the two clusters, the percentage of answers “good” and “not good” is very close. Thus, it appears that these two solutions might be the widely understood solutions for the sample.
Regarding the level of understanding, the same trend is observed. The interest rates are close among the clusters for each solutions, thus the socio-demographic variables are not driving this question. However, proposal 3 seems to have a lower interest level for respondents.
Among the six proposed IMPROVE solutions, proposals 2 and 3 are relatively simple to understand but not simplistic. Moreover, proposal 2 is a well-known solution since it has a design close to the energy labelling of electric appliances on which respondents might be used to interpret. Proposal 3 is also simple but not simplistic as it provides the information about the consumption level without requiring a time consuming interpretation.
Thus, from the MCA, it can be concluded that these two solutions (and proposal 2 in particular) are solutions not significantly driven by the socio-demographic attributes and should be further developed to be proposed as one IMPROVE solution to consumers.
C. MCA for proposals 4 and 5
Regarding proposals 4 and 5, the socio-demographic characteristics were found to have a significant influence on the questions and thus clusters were created.
Indeed, for proposal 4 a good understanding of this solution, as well as an interest on receiving, is driven by:
The higher salary classes;
Bachelor or higher diploma;
Age class between 36 and 55 years, employed;
Household size above 2 persons;
On the opposite, older or younger respondents with lower incomes and technical training are less interested in this solution.
Regarding proposal 5, it appears that a good level of understanding and an interest in the solution are only slightly influenced by the socio-demographic classes. Regarding the “good” understanding, the same trend as for proposal 4 is observed.
The lower level of understanding (i.e. “not good”) and “neutral” level of interest are more driven by the socio-demographic classes and mostly by older age categories and technical training with lower incomes. By clustering the sample into two categories, it is possible to confirm these perceptions for proposals 4 and 5, see Table 24 and Table 25:

139
Table 24 Level of understanding of proposals 4 and 5 by clustering the sample via MCA
Cluster
"Understand less"
Cluster
"Understand more"
All
sampleCluster
"Understand less"
Cluster
"Understand more"
All
sample
Not Good 19,2% 14,4% 15,9% 13,3% 12,7% 13,0%
Good 79,7% 84,7% 83,2% 85,8% 86,3% 86,0%
Neutral 1,2% 0,8% 0,9% 0,9% 0,9% 0,9%
Female 27,3% 36,5% 33,6% 36,5% 30,2% 33,6%
Male 72,7% 63,5% 66,4% 63,5% 69,8% 66,4%
18-35 years old 0,0% 33,6% 23,2% 42,7% 0,0% 23,2%
36-55 years old 4,8% 59,6% 42,5% 2,9% 89,5% 42,5%
56 years or older 95,2% 6,8% 34,3% 54,4% 10,5% 34,3%
Employed 18,0% 94,9% 70,9% 49,1% 96,9% 70,9%
Not Employed 82,0% 5,1% 29,1% 50,9% 3,1% 29,1%
Bachelor degree and higher 33,9% 60,5% 52,2% 46,9% 58,5% 52,2%
Primary_highSchool_Graduate 10,4% 9,5% 9,8% 9,7% 9,9% 9,8%
Technical training 55,7% 30,0% 38,0% 43,4% 31,6% 38,0%
Multi-family house 49,0% 58,2% 55,3% 61,1% 48,4% 55,3%
Single-family house 51,0% 41,8% 44,7% 38,9% 51,6% 44,7%
1 person 24,5% 21,7% 22,6% 28,4% 15,7% 22,6%
Above 2 persons 13,4% 49,6% 38,3% 19,0% 61,3% 38,3%
2 persons 62,1% 28,6% 39,1% 52,7% 23,0% 39,1%
btw. 80'000 et 99'999 CHF 15,5% 20,8% 19,1% 17,9% 20,6% 19,1%
less than 80'000 CHF 65,8% 31,5% 42,2% 58,6% 22,6% 42,2%
over 100'000 CHF 18,7% 47,8% 38,7% 23,5% 56,8% 38,7%
433 957 1390 754 636 1390
Proposal 4 Proposal 5
Level of understanding
Gender
Age profile
Employment status
Education level
Dwelling type
Household type
Shousehold annual
income
Sample size

140
Table 25 Level of interest of proposals 4 and 5 by clustering the sample via MCA
Cluster
"Less interest"
Cluster
"Most interest"
All
sample
Cluster
"Less interest"
Cluster
"Most interest"
All
sample
Interest 56,4% 64,4% 61,9% 54,0% 60,1% 55,4%
Neutral 24,7% 23,6% 24,0% 29,9% 26,6% 29,1%
No Interest 18,0% 11,3% 13,4% 15,2% 12,7% 14,6%
No opinion 0,9% 0,7% 0,8% 0,9% 0,6% 0,9%
Female 27,3% 36,5% 33,6% 29,1% 48,6% 33,6%
Male 72,7% 63,5% 66,4% 70,9% 51,4% 66,4%
18-35 years old 0,0% 33,6% 23,2% 0,0% 99,7% 23,1%
36-55 years old 4,8% 59,6% 42,5% 55,4% 0,0% 42,6%
56 years or older 95,2% 6,8% 34,3% 44,6% 0,3% 34,4%
Employed 18,0% 94,9% 70,9% 64,8% 91,3% 70,9%
Not Employed 82,0% 5,1% 29,1% 35,2% 8,7% 29,1%
Bachelor degree and higher 34,2% 60,4% 52,2% 48,4% 65,0% 52,2%
Primary_highSchool_Graduate 10,2% 9,6% 9,8% 10,1% 8,7% 9,8%
Technical training 55,7% 30,0% 38,0% 41,5% 26,3% 38,0%
Multi-family house 49,4% 58,0% 55,3% 48,9% 76,5% 55,3%
Single-family house 50,6% 42,0% 44,7% 51,1% 23,5% 44,7%
1 person 24,5% 21,7% 22,6% 19,4% 33,1% 22,6%
Above 2 persons 12,7% 49,9% 38,3% 41,9% 26,6% 38,4%
2 persons 62,8% 28,3% 39,1% 38,7% 40,2% 39,1%
btw. 80'000 et 99'999 CHF 15,5% 20,8% 19,1% 18,7% 20,7% 19,1%
less than 80'000 CHF 65,1% 31,8% 42,2% 40,1% 48,9% 42,1%
over 100'000 CHF 19,4% 47,4% 38,7% 41,2% 30,3% 38,7%
433 957 1390 1067 321 1388
Proposal 4 Proposal 5
Level of understanding
Gender
Sample size
Age profile
Employment status
Education level
Dwelling type
Household type
Shousehold annual
income

141
Regarding the proposal 4, the two clusters for the level of understanding and the level of interest are driven by the socio-demographic factor. For proposal 5, the clusters do not give any difference for the level of understanding (i.e. this level is not driven by socio-demographic attributes) while the level of interest seems to be slightly influenced by the socio-demographic attributes. Both solutions, are well understood and of interest according to the sample. The level of complexity of the visual solutions, as well as the amount of information provided, can be a possible explanation of this difference.
Indeed, compared to proposals 2 and 3, proposal 5 is a little bit more complex since the consumers should look at their consumption level and interpret it as a function of their household size. This additional step for interpreting solution 5 might be a reason why respondents understand the solution at the same level as solutions 2 and 3 (with no influence of the socio-demographic attributes) but, when looking on the level of interest, the socio-demographic attributes induce sensible differences.
The influence of the level of complexity is more sensitive for proposal 4 between the two clusters. Indeed, solution 4 can be seen as more complex than solution 5 since there are two graphics and statistics on the consumption (time series and bar plot). Thus, since proposal 4 tends to be more detailed (and/or complex) than 5, the differences between the two clusters on the level of understanding as well as the level of interest are more important.
It seems thus possible to assume that the level of complexity is a factor of differentiation between the clusters and the socio-demographic classes. This observation was also made when looking at solution 1. Globally, i.e., at the level of the respondents’ sample, solution 4 has the highest interest level compared to all other solutions. However, from the MCA, it is observed that this level of interest is quite dependant of the socio-demographic variables linked to the sample and might represent a limitation for using this solution. Indeed, the IMPROVE project aims at finding a visual representation that is suitable for a large audience, i.e., all the customers receiving an energy bill. Thus, it would be of interest to have a visual solution that is not influenced (or as little as possible) by the socio-demographic characteristics (consensual solution).
D. MCA for proposal 6
MCA results for proposal 6 are presented in Figure 114 and Figure 115:
From these figures, it is possible to observe a clear differentiation of the level of understanding and the level of interest due to the socio-demographic classes. Indeed, in Figure 114, the level of understanding is clearly influenced on the first principal axis. The left part of the graphic presents respondents who do not understand the solution while the right part of the graphic presents respondents who understand it. Among this segmentation, the socio-demographic classes are also spread.

142
Figure 114 MCA, understanding of proposal 6

143
Figure 115 MCA, interest of proposal 6

158
On the right part, the classes shown are related to older respondents, with technical training, lower incomes and two persons in the household. Conversely, on the left part, younger age classes with bachelor or higher degree and higher incomes. The same trend is observed in Figure 115. Based on these observations, it has been possible, again, to separate the respondents into two clusters, see Table 26 and Table 27:
Table 26 Level of understanding of proposal 6 by clustering the sample via MCA
Table 27 Level of interest of proposal 6 by clustering the sample via MCA
Cluster
"Understand less"
Cluster
"Understand more"
All
sample
Not Good 37,0% 23,4% 32,7%
Good 58,1% 69,7% 61,7%
Neutral 4,9% 6,9% 5,5%
Female 36,5% 27,3% 33,6%
Male 63,5% 72,7% 66,4%
18-35 years old 33,8% 0,0% 23,2%
36-55 years old 59,7% 4,8% 42,5%
56 years or older 6,5% 95,2% 34,3%
Employed 94,9% 18,6% 70,9%
Not Employed 5,1% 81,4% 29,1%
Bachelor degree and higher 60,3% 34,6% 52,2%
Primary_highSchool_Graduate 9,6% 10,1% 9,8%
Technical training 30,1% 55,3% 38,0%
Multi-family house 57,8% 50,0% 55,3%
Single-family house 42,2% 50,0% 44,7%
1 person 21,7% 24,5% 22,6%
Above 2 persons 50,1% 12,6% 38,3%
2 persons 28,2% 62,8% 39,1%
btw. 80'000 et 99'999 CHF 20,8% 15,6% 19,1%
less than 80'000 CHF 31,9% 64,7% 42,2%
over 100'000 CHF 47,4% 19,7% 38,7%
954 436 1390
Gender
Age profile
Employment status
Education level
Sample size
Household type
Shousehold annual
income
Dwelling type
Level of understanding
Cluster
"Less interest"
Cluster
"Most interest"
All
sample
Interest 17,3% 24,3% 19,5%
Neutral 20,6% 25,2% 22,0%
No Interest 60,0% 47,0% 56,0%
No opinion 2,1% 3,5% 2,5%
Female 36,3% 27,5% 33,6%
Male 63,7% 72,5% 66,4%
18-35 years old 33,6% 0,0% 23,2%
36-55 years old 59,5% 4,9% 42,5%
56 years or older 6,9% 95,1% 34,3%
Employed 94,9% 17,8% 70,9%
Not Employed 5,1% 82,2% 29,1%
Bachelor degree and higher 60,4% 34,0% 52,2%
Primary_highSchool_Graduate 9,6% 10,2% 9,8%
Technical training 30,0% 55,8% 38,0%
Multi-family house 57,8% 49,8% 55,3%
Single-family house 42,2% 50,2% 44,7%
1 person 21,7% 24,5% 22,6%
Above 2 persons 49,9% 12,7% 38,3%
2 persons 28,4% 62,7% 39,1%
btw. 80'000 et 99'999 CHF 20,8% 15,5% 19,1%
less than 80'000 CHF 31,7% 65,3% 42,2%
over 100'000 CHF 47,5% 19,2% 38,7%
958 432 1390Sample size
Education level
Dwelling type
Household type
Shousehold annual
income
Level of interest
Gender
Age profile
Employment status
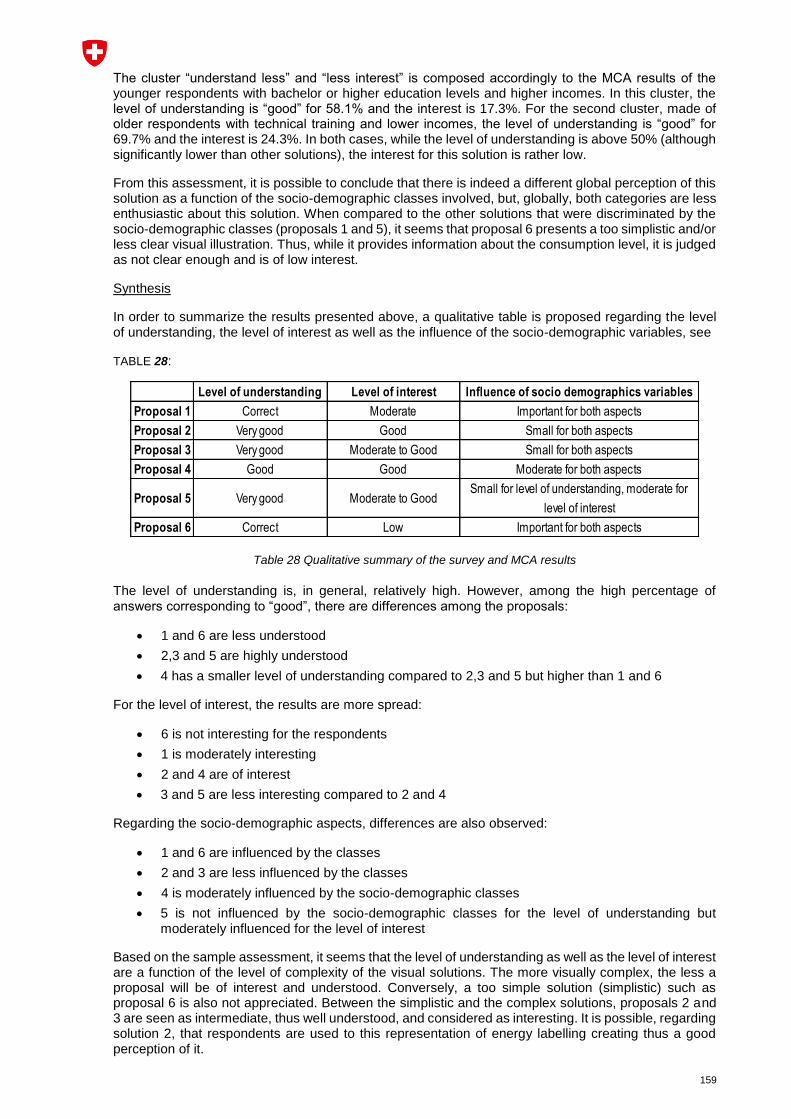
159
The cluster “understand less” and “less interest” is composed accordingly to the MCA results of the younger respondents with bachelor or higher education levels and higher incomes. In this cluster, the level of understanding is “good” for 58.1% and the interest is 17.3%. For the second cluster, made of older respondents with technical training and lower incomes, the level of understanding is “good” for 69.7% and the interest is 24.3%. In both cases, while the level of understanding is above 50% (although significantly lower than other solutions), the interest for this solution is rather low.
From this assessment, it is possible to conclude that there is indeed a different global perception of this solution as a function of the socio-demographic classes involved, but, globally, both categories are less enthusiastic about this solution. When compared to the other solutions that were discriminated by the socio-demographic classes (proposals 1 and 5), it seems that proposal 6 presents a too simplistic and/or less clear visual illustration. Thus, while it provides information about the consumption level, it is judged as not clear enough and is of low interest.
Synthesis
In order to summarize the results presented above, a qualitative table is proposed regarding the level of understanding, the level of interest as well as the influence of the socio-demographic variables, see
TABLE 28:
Table 28 Qualitative summary of the survey and MCA results
The level of understanding is, in general, relatively high. However, among the high percentage of answers corresponding to “good”, there are differences among the proposals:
1 and 6 are less understood
2,3 and 5 are highly understood
4 has a smaller level of understanding compared to 2,3 and 5 but higher than 1 and 6
For the level of interest, the results are more spread:
6 is not interesting for the respondents
1 is moderately interesting
2 and 4 are of interest
3 and 5 are less interesting compared to 2 and 4
Regarding the socio-demographic aspects, differences are also observed:
1 and 6 are influenced by the classes
2 and 3 are less influenced by the classes
4 is moderately influenced by the socio-demographic classes
5 is not influenced by the socio-demographic classes for the level of understanding but moderately influenced for the level of interest
Based on the sample assessment, it seems that the level of understanding as well as the level of interest are a function of the level of complexity of the visual solutions. The more visually complex, the less a proposal will be of interest and understood. Conversely, a too simple solution (simplistic) such as proposal 6 is also not appreciated. Between the simplistic and the complex solutions, proposals 2 and 3 are seen as intermediate, thus well understood, and considered as interesting. It is possible, regarding solution 2, that respondents are used to this representation of energy labelling creating thus a good perception of it.
Level of understanding Level of interest Influence of socio demographics variables
Proposal 1 Correct Moderate Important for both aspects
Proposal 2 Very good Good Small for both aspects
Proposal 3 Very good Moderate to Good Small for both aspects
Proposal 4 Good Good Moderate for both aspects
Proposal 5 Very good Moderate to GoodSmall for level of understanding, moderate for
level of interest
Proposal 6 Correct Low Important for both aspects

160
Last, but not least, in some cases the level of understanding and interest seems also to be influenced by the socio-demographic background of the recipient. Considering that the IMPROVE projects aims to find a possible low cost solutions to all for a higher aggregated result in enhancing the understanding of energy bills, another possible approach in selecting viable solutions could be that of choosing those that are less bound to socio-demographic aspects. Or else, propose the contrary: introduce different segment-oriented solutions, depending on the different socio-demographic classes being addressed. However, this latter option becomes more complex to implement in practice.
Since proposals 2 and 3 seem to obtain good results from the survey in terms of understanding, interest and influence from socio-demographic variables, it should be necessary to investigate more in depth these solutions in order to confirm these trends and maybe identify which one could be implemented in the energy bills.
10.3 Key findings
The key findings of this survey are summarised here.
10.3.1 Electricity bill
Responses reveal that Swiss electricity consumers:
receive bill most frequently by mail, three times a year
spend less than 5 minutes to read it
manage to find their way around the bill even if they don’t understand everything
do not receive much information from the provider to evaluate their consumption level
would like more information
wish to compare their consumption with equivalent households of the neighbourhood
are willing to put into place energy-saving actions if their consumption is above average
10.3.2 Heating bill of tenants
Responses reveal that for Swiss tenants:
heating costs are usually included in the rent
receive some information but clearly incomplete to determine consumption level
wish more information enabling them to compare with equivalent households of the neighbourhood
are willing to put into place energy-saving actions if their consumption is above average
10.3.3 Heating bill of homeowners
Responses reveal that Swiss homeowners:
receive heating bill most frequently by mail, once a year
spend less than 5 minutes to read it
manage to find their way around the bill even if they don’t understand everything
do not receive much information from the provider to evaluate their consumption level
would like more information
wish to compare their consumption with equivalent households of the neighbourhood
are willing to put into place energy-saving actions if their consumption is above average
161
10.3.4 Visualisation preferences
The descriptive analysis reveal that Swiss energy users:
have a good understanding of proposals 1 (table format) and 6 (emoticon label)
have an excellent understanding of proposals 2 to 5 (graphical format)
slight advantage for proposal 2 in terms of understanding, followed by 5, 3 and 4
are interested in receiving proposals 1 to 5
are not particularly interested in proposal 6
slight advantage for proposal 4 in terms of interest, followed by 2,5 and 3
The MCA analysis reveals that results are correlated with socio-demographic aspects:
1 and 6 are influenced by the classes
2 and 3 are less influenced by the classes
4 is moderately influenced by the socio-demographic classes
5 is not influenced by the socio-demographic classes for the level of understanding but moderately influenced for the level of understanding
so that proposal 4 has a smaller level of understanding compared to 2,3 and 5 and that proposal 2 and 3 seem to present a more consensual opinion among respondents.
10.4 Chapter’s conclusions
This chapter has presented the results of a national survey conducted to evaluate energy consumers’ opinion on the type of information currently available in their energy bill and their interest to improve knowledge, attitudes and behaviours towards energy consumption.
The survey indicates that the paper bill is still the main communication tool between the energy utilitie and the consumer. Still, most energy consumers spend less than five minutes to read it. The majority of energy consumers do not receive energy consumption information from the provider to evaluate their consumption level and many tenants do not know their actual energy consumption. Most consumers wish to compare energy consumption with equivalent households of the neighbourhood and are willing to put into place energy-saving actions if their consumption is above average.
To comply with current legislation, Swiss electricity bills contain obligatory information in table format. However, obligatory content in heating bills still lacks and efforts are necessary to regulate them if improved billing content is sought. The level of understanding of the current energy bill is considered good by both electricity and heating consumers. However, it could clearly be improved with the use of charts instead of tables.
Overall, the survey indicates that there is a great potential to improve energy bills and billing content in Switzerland. A more consumer-friendly bill could turn a traditional bill into an important communication vehicle to influence household energy consuming behaviours.

162
11 Recommendation for Utilities
To date, the energy bill still represents the most common channel used by utilities to provide customers with information about their energy usage. Nevertheless, in this context, very often the bill has acted primarily as an accounting and payment tool and its potential implications in giving customers better control over their energy use and to support utilities’ goals for more actively engaging customers, are frequently overlooked (Foster & Alschuler, 2011).
As a result, in the past, the informative content of the energy bill has often tended to be shaped primarily by mandatory legal requirements – focusing on improving transparency on rate structure and charges - on one hand, and the utility’s more specific billing system requirements on the other. Instead of making energy bills more user-friendly, unfortunately this kind of approach has often contributed to the proliferation of line items (different taxes, facilities’ charges, energy generation and transmission costs, etc.) provided in a mainly “tabular format” to better trace computations, though adding frequently more complexity and confusion to the bill than understanding (EC, 2016).
It should though always be kept in mind that utilities and customers have both ingrained interests in enhancing the design and informative content of current energy bills. Even though goals might seem slightly different, they nevertheless intersect in regard to the following aspects:
bill payment;
customers’ understanding of how charges are calculated;
meaningful information to better manage and even reduce energy consumption;
Ultimately, the energy bill also represents a viable mean for improving utility-customer relations. Thus, any future bill redesign and enhancement should take into account needs and requirements of both consumers and utilities.
Yet, the generation of the energy bill involves and impacts significantly the operations of a variety of different units and departments within a utility, from the customer service, to the accounting and data processing IT department etc. Thus, making changes to the current energy bill design and content implies willingness to activate decision-making and overcoming operational barriers by the energy utilities, as well as to provide sufficient and adequate human, financial and technical resources.
In order to favour a more strategic way of handling possible improvements to future energy bills by utilities, the main aim of the present work is to get hold of utilities’ point of view in this matter as to understand possible drivers and barriers and to formulate useful recommendations for utilities in the context of currently evolving concepts of demand-side information (DSI) in the energy billing scenario.
In particular, the present analysis aims to explore:
main factors and motivations pushing Swiss energy utilities to improve the informative content of residential customers’ energy bills;
utilities’ current availability of a series of raw data items to possibly enhance and customise billing information. This type of data is not strictly limited to information regarding customers’ energy usage over time, but extends also to other information fields, such as, for example, sourcing meteorological data, profiling the existing building stock, the heating systems employed by households for both space heating and hot water, the numerical composition of households and goes even as far as categorizing the type of electrical appliances equipment provided in the different residential households;
utilities’ feasibility to organise and process such raw data, in order to be able to work out and provide more targeted information such as the disaggregation of consumption data for electrical appliances for instance, introduce comparative statistics, provide more segment-oriented information in regard to energy consumption levels, make correlations between meteorological data and energy consumption etc.;
possible barriers in the implementation of the six IMPROVE solutions provided as a conceivable approach to enhance energy billing information;
utilities’ perceived difference in related costs and benefits in regard to the implementation of a more traditional tabular bill format and a more innovative, graphical format of presenting energy-related data.
The feedback presented in this report has been gathered from a wide network of Swiss utilities by means of an online survey. In total, 48 out of 185 energy utilities from all over Switzerland answered.

163
11.1 Methodology
11.1.1 Online survey
At the beginning of the present research activity, all the Swiss energy utilities that had already taken part in the previous survey of the IMPROVE Project aimed to explore the current state of the art of DSI models in Switzerland (see chapter 7), and that had acknowledged their availability to take part in a second project survey as planned, were contacted via e-mail. Thus 185 energy utilities (see Appendix 15) were invited to complete an online survey containing mainly close-ended questions and the possibility to add some open comments in regard to the six IMPROVE solutions elaborated within this research project in order to enhance energy billing. The survey content can be found in Appendix 16.
The survey was subdivided into the following 7 sections:
1. General information
2. Motivations for improving information for residential households
3. What data is available?
4. General assessment of the six IMPROVE solutions
5. Cost evaluation of the IMPROVE solutions
6. Benefit evaluation of the IMPROVE solutions
7. Final evaluation
Table 29 reports the survey response rate recorded, both in total numbers and differentiated per
language region. Out of the 185 energy utilities contacted, 42 completed the survey, 6 replied partially
to the survey.
Language
region
Surveys
sent
Reply
complete
Reply
partial
Response
rate
German 141 28 4 23%
French 34 8 2 29%
Italian 10 6 - 60%
TOTAL 185 42 6 26%
Table 29 Survey response rate.
11.1.2 Workshops involving partner utilities
Beside gathering general feedback from a wider network of Swiss energy utilities in regard to the six
proposed IMPROVE solutions, the present analysis also took into account a more in-depth input on the
matter by discussing it directly with partner energy utilities during a workshop (the second and final
workshop of the whole IMPROVE project). This final workshop was organized in all three language
regions.
Main aim of these workshops was to present to the involved utility project partners the results of the
earlier project activities and to discuss with them more in-depth the main findings emerging from both
the customers’ and utilities’ surveys. In particular, this helped to gather more accurate and operational
suggestions, direct in-depth comments and concrete insights in regard to the strengths, weaknesses,
opportunities and risks of enhanced DSI from a utility’s perspective. This qualitative analysis
subsequently allowed to elaborate some general “Recommendations for utilities” regarding the
implementation of enhanced DSI models in the near future.

164
11.2 Findings from the online survey
11.2.1 General information about the participating energy utilities
Nearly half (46%) of the energy utilities participating in this survey supply exclusively electricity as a
service to residential customers (see Table 30).
Energy services provided
Electricity (only) 46%
Electricity + gas 12%
Electricity + district heating 19%
Electricity + gas + district heating 23%
Table 30 Utilities' service profile.
The size of the energy utilities varies greatly (see Table 31). This reflects the heterogeneity of the Swiss energy market, which is characterized by utilities of different sizes, ranging from small municipal utilities supplying single communities to larger, even internationally operating companies (see chapter 6). In the present survey sample, the two largest energy utilities report to be supplying respectively approx. 300’000 and 350’000 households with electricity. Both of them do not supply gas, nor provide any major district heating service.
Those energy utilities in the sample supplying also gas, next to electricity, again, involve rather small numbers of households, ranging from approx. 400 to 10’000 customers. As for district heating, the largest energy utility supplies approximately 30’000 households, next to the 170’000 customers provided with electricity.
No. of households served Min. Max.
Electricity 300 350’000
Gas 400 10’678
District heating 20 30’000
Table 31 Range of household nos. served per energy service.
11.2.2 Motivations for improving information for residential households
Table 32 shows the motivational factors for a possible improvement in the provision of energy consumption data provided to residential households. The highest overall rating was assigned to the factor ”Customer satisfaction”, followed by ”Need for transparency”, “Promotion of utility’s energy consulting services” and “Reduction of energy consumption”. “Compliance with federal legal requirements” received a slightly higher rating than “Reduction of energy consumption”, however, the standard deviation in the sample is higher and thus, less univocal.

165
MOTIVATIONS MEAN ST. DEV
Customer satisfaction 4.08 0.92
Need for transparency 4.04 0.90
Promotion of utility’s energy consulting services 3.83 0.86
Compliance with federal legal requirements 3.69 1.24
Reduction of energy consumption 3.65 0.93
Marketing strategy and customer fidelity programmes 3.54 1.15
Profiling of customers’ consumption patterns 3.52 1.03
Observance Energy Strategy 2050 3.44 1.07
Promotion of load shifting 3.38 1.00
Compliance with Municipal mandate 3.27 1.27
Table 32 Motivations for improving information for residential households (5= high; 1 = low).
Less priority is given to “Marketing strategies and customer fidelity programmes” and the “Profiling of customers’ consumption patterns”, followed by the “Observance of the Energy Strategy 2050” and the “Promotion of load shifting”. “Compliance with Municipal mandate” is the factor associated with the lowest rating. The fact that marketing strategies are associated with a rather low rating may reflect the fact that – contrary to the European Union countries - energy market liberalization in Switzerland is still on the early outset and does not yet represent a compelling circumstance for utilities.
“Observance of the Energy Strategy 2050” has been rated as slightly more motivating for encouraging improved energy billing than the “Promotion of load shifting”. This latter result might imply that the communicative impact of energy bills in this regard is felt by utilities to be secondary and less important. Indeed, increasingly, load shifting is being dealt by utilities by means of promoting economic incentives such as differentiating tariffs.
Ultimately, all these findings relate motivation for improving energy billing information prevalently to the domain of (i) customer satisfaction, (ii) correct accounting measures (need for transparency, compliance with federal legal requirements) and (iii) energy efficiency measures (reduction of energy consumption and promotion of utility’s energy consulting services).
The fact that Customer satisfaction received the lead in motivating Swiss utilities to improve the information provided to residential household customers, implies that - even in the absence of liberalized markets – Swiss utilities are nevertheless driven to enhance their relationship with the customer (satisfaction, consulting services, fidelity programme) as a measure of performance and a sort of loyalty-enhancing strategy, to pave the way for the future market liberalization.
11.2.3 Data availability
Raw Data
Raw data - also known as source data or primary data - is unstructured or unformatted repository data that hasn’t yet undergone thorough processing, either manually or through automated computer software. The “availability of raw data” is an important prerogative for utilities to be able to extract, analyze and process specific records and be able to draw particular conclusions, make projections and/or extract meaningful information.
Responses to the question on raw data availability (see Table 33) indicate that Annual consumption data is considered as the most easily retrieved data. This is followed by a rather high level of data availability concerning the “Type of building (single house or apartment, etc.)” involved. Information regarding the “Type of heating system used for both hot water” and “Space heating” are rated similarly (middle level of difficulty in obtaining it).
The type of raw data that is rated by utilities rather univocally (84%) as “difficult” to retrieve is “Type of electrical appliances equipment provided”. What follows is “Real-time consumption data”, the “Share of consumption data for hot water” and the “Share of consumption data for space heating”. Here, standard deviation in the sample is rather low, indicating that utilities are all rather in line with this general statement. Finally, also the “Energy reference surface” is considered as a rather difficult type of data to be obtained.

166
The collection of “Monthly consumption data” is rated as rather difficult. The same is true for retrieving information on the “Number of household members”. Instead, “Meteorological data” and the “Number of rooms” are rated as slightly easier to retrieve. However, standard deviation within the sample is rather high in these cases.
Overall, only two energy utilities report ability to retrieve easily real-time consumption data. Of course, this reflects the fact that there is currently a lack in the provision of smart meter infrastructure across the participating energy utilities. Without smart meters it is rather problematic to retrieve consumption data on a monthly base. This all reflects important limitations both in the “data granularity” (how precise?) and “billing frequency” (how often?) with which energy usage data can be currently provided to residential customers. The former implies limitations in the chronological display of consumption data, thus not allowing for a richer set of data for enhancing customers’ self-monitoring and evaluation. The latter implies limitations in the so-called indirect energy feedback provision (Darby, 2007), a factor that has shown to impact end-users’ energy awareness and enables consumers to better link their energy consumption and expenditures (Dromaque, et al., 2013).
Table 33 Evaluation of “raw data” availability for residential households in utilities’ supply area (5 = high; 1 = low).
Processed data
Processed data is the type of data that is processed from raw data. Generally, it involves the collection, cleaning and transformation of specific data items into a format that can be analyzed and visualized. It thus enables utilities to produce a set of meaningful information.
As for the feasibility of estimating processed data, our findings reveal that for the utilities, the most accessible data is the “Change in energy consumption (%) over a given billing period”, followed by “Energy usage compared to previous months/previous year – same billing period” (see Table 34). The latter record must surely refer to annual rather than monthly data, considering the response given in the previous section on “raw data availability”, where it appears that monthly consumption data is considered to be of rather low availability.
RAW DATA MEAN ST. DEV
Annual consumption data 4.76 0.57
Type of building (single house, apartment etc.) 3.53 1.20
Type of heating system for space heating 2.72 1.28
Type of heating system for hot water 2.70 1.33
Meteorological data 2.38 1.42
Number of rooms 2.30 1.38
Number of household members 2.02 1.15
Monthly consumption data 2.00 1.17
Energy reference surface (SRE) 1.83 1.20
Share of consumption data for space heating 1.73 0.94
Share of consumption data for hot water 1.57 0.83
Real-time consumption data 1.52 0.84
Type of electrical appliances equipment provided 1.20 0.50

167
Exploring utilities’ feasibility of providing “processed data”, the lowest score is associated to information regarding the “Disaggregation of consumption data”. This record is followed by the computation of data in regard to the “Profiling of households based on the level of consumption of peers (A-G energy label classes, average/efficient/intensive consumption)” and “Profiling of similar households (no. of occupants, type of building, surface)”. Though the processing of these latter two data sets is rated mainly as rather challenging, some utilities do not completely abandon the idea, giving it a middle rating.
Interestingly, there seems to be more confidence by the utilities in calculating the “Correlation between energy consumption and temperature/weather conditions” than profiling households’ energy usage: this result may open better accuracy in the future bill enhancement.
PROCESSED DATA MEAN ST. DEV
Change in energy consumption (%) over a given billing period 4.19 2.06
Energy usage compared to previous month / previous year – same period 3.93 1.44
Correlation between energy consumption and temperature /weather conditions over billing period 2.23 1.25
Profiling similar households (no. of occupants, type of building, surface) 2.19 1.18
Profiling of households based on level of consumption of peers (A-G energy label classes, average/ efficient/ intensive consumption) 1.95 1.00
Disaggregation of consumption data 1.10 0.30
Table 34 Evaluation of the feasibility of estimating the following “processed data” for residential households in utilities’ supply area (5 = high; 1 = low).
Overall, responses of energy utilities to the questions on data availability seem to reflect an initial barrier in retrieving more frequent and segment-oriented energy consumption data. In fact, the provision of more detailed and customized energy usage information would assume, first of all, the availability of smart meters to enhance billing frequency. In addition, there seems to be a rather important difficulty in retrieving and processing the data needed to provide comparative statistics to the end-users. At the moment, comparative statistics seem to be limited to merely historical consumption data of the customer. No peer household comparisons seem to be in place within this sample of utilities. The participating utilities seem to find it easier to collect data regarding meteorological conditions and energy consumption of households than profiling the residential households on the basis of their average energy consumption and building characteristics. Consequently, efforts made to improve billing content in the future might need to explore first the option of providing households with more insights on their own consumption (such as correlating it with external temperature trends) rather than comparisons with similar households.
11.2.4 General assessment of the IMPROVE solutions
As to the questions in the survey related to whether the participating utilities already implement some kind of the six proposed IMPROVE solutions (Table 35), it results that solution 1 is the most widely adopted approach, as confirmed by 52% of the respondents. This result confirms the dominance of a rather traditional, tabular form of illustrating energy consumption data to customers, according to the Swiss regulation in the electricity sector. However, it is not clear whether this response by the involved utilities just plainly refers to the implementation of a “tabular format“ (which distinguishes solution 1 from the other IMPROVE solutions, and simply represents today’s most common, standard format of displaying energy usage data in general) or whether respondents more correctly caught on the actual innovating aspect of solution 1 (i.e. the integration of information regarding “average consumption of a similar household”) and refer to this specific aspect when reporting its implementation.
Such concern arises from the fact that in chapter 11.2.3, utilities actually report problems in retrieving more segment-oriented, comparative energy usage data in general. In terms of comparative statistics, currently, utilities seem to be mainly able to provide historical data (on an annual basis). This reasoning thus also applies to the answers provided by utilities in reference to solutions 2 to 6.

168
Solution 1 is followed by solution 4, with 12% of involved utilities declaring to have implemented such approach. Solutions 2 and 3 have been implemented by 5% of utilities surveyed. Solution 6 is rare, however 2% of utilities stated to have adopted a similar approach. Finally, the approach proposed in solution 5 is the only one that has not been yet applied by any of the participating energy utilities.
Solution 1 Solution 2 Solution 3
Solution 4 Solution 5 Solution 6
Table 35 Evaluation of the feasibility of estimating the following “processed data” for residential households in utilities’ supply area (5 = high; 1 = low).
11.2.5 Cost evaluation of the IMPROVE solutions
Utilities were also asked to run a qualitative cost analysis of the six IMPROVE solutions. This cost analysis was conducted by differentiating between a solution with a tabular information display (solution 1) from those with a graphical information display (solutions 2-6). The reason for this separation is due to the fact that the tabular format still represents the more common and traditional approach of displaying energy usage data. Consequently, this latter format is subject to a different cost evaluation than that for a visually more innovative, graphical format, even when displaying similar back-end data items.
Indeed, overall, the tabular form always received a lower cost rating than its graphical equivalent. On average, it seems that hardware and software equipment are seen as the most important cost weight (see Table 37). However, answers remain rather disparate, as they record a rather high standard deviation.

169
TA
BU
LA
R
COST ITEM MEAN ST. DEV.
1. Hardware 3.33 1.49
2. Software 3.12 1.25
3. Planning 2.88 1.35
4. Management 2.71 1.22
5. Human resources 2.52 1.13
Table 36 Cost evaluation of the tabular form of IMPROVE solution 1.
Loking at the cost rating of the graphical way of illustrating energy consumption data, some cost items seem to slightly change in weight and thus in priority (see Table 37).
GR
AP
HIC
AL
COST ITEM MEAN ST. DEV.
1. Hardware 4.00 1.10
2. Planning 3.79 0.90
3.Software 3.76 0.79
4. Management 3.33 1.12
5. Human resources 3.10 1.03
Table 37 Cost evaluation of the graphical form of IMPROVE Solutions 2 to 6.
In the case of implementing a graphical illustration of energy consumption data, utilities rate planning costs as higher than in the tabular illustration, and similar to software costs.
11.2.6 Benefit evaluation of the IMPROVE solutions
In regards to the benefit-analysis run by the participating energy utilities in regards to the six proposed IMPROVE solutions, from the responses given, it results that utilities confer a higher benefit rating in terms of customer satisfaction, fidelity and utility reputation to the graphical illustration form than to the tabular form (see Table 38 and Table 39). In other words, utilities are aware of the fact that a more user-friendly visualization of energy consumption data might grant advantages from a communication point of view between the company and the customer.
In general, the aspect of increasing “Customer fidelity” is seen as the least important element by the participating utilities. In fact, this aspect is associated with a middle rating in both the tabular form and in the graphical form, though the latter seems to be slightly higher than the former (see Table 38 and Table 39).
“Customer satisfaction” and “Utility’s reputation” are rated as slightly more important than “Customer fidelity” in this benefit analysis. Regarding the tabular form these two factors are associated with an extremely similar weighting. In the graphical form, “Customer satisfaction“ is slightly more important than “Utility’s reputation”.

170
TA
BU
LA
R BENEFITS MEAN ST. DEV.
1. Customer satisfaction 2.57 1.04
2. Utility’s reputation 2.52 1.02
3. Customer fidelity 2.40 1.08
Table 38 Benefit analysis of the tabular form of IMPROVE solution 1.
GR
AP
HIC
AL
BENEFITS MEAN ST. DEV.
1. Customer satisfaction 3.14 1.18
2. Utility’s reputation 3.02 0.95
3. Customer fidelity 2.81 1.15
Table 39 Benefit analysis of the graphical form of IMPROVE Solutions 2 to 6.
Overall, from the utilities’ point of view, none of the three benefit elements (customer satisfaction, customer fidelity, utility’s reputation) seem to particularly stand out as a high advantage resulting from the implementation of the proposed IMPROVE solutions and enhanced energy billing. Nevertheless, the graphical display receives, on average, a higher benefit rating than the tabular form.
It is interesting to compare these findings with those collected in chapter 11.2.2, which aimed at detecting possible motivational triggers for utilities to improve energy billing information for residential households. At first glance, there seems to be some kind of incongruence in the responses given. In fact, in chapter 11.2.2, the one motivational trigger receiving the highest rating by the participating utilities was “Customer satisfaction” (M = 4.08). However, in the benefit analysis, “Customer satisfaction“ is associated in both tabular and graphical form with a lower score (M = 2.85). This is an interesting point as it might reflect both a more theoretical position by utilities, where they rate “Customer satisfaction“ as an important motivational trigger for inducing change. On the other hand, in practical terms, when confronted with the possible IMPROVE solutions presented in this research project, utilities see a limited impact of these solutions in raising “Customer satisfaction“.
Possible reasons for this incongruence could in future be further investigated as it might help to gain a better understanding of utilities’ doubts in this regard and ensure a higher implementation possibility for the future. In turn, informing utilities about the fact that their customers assessed the IMPROVE solutions as effective during the Consumer satisfaction survey (chapter 10), might provide some additional information for utilities to rethink their current position.
11.2.7 Open comments in regards to the IMPROVE solutions
Utilities were also requested to provide open comments in regard to the possible needs or constraints precluding the implementation of the IMPROVE solutions presented in Table 35.
In this context, many comments in regard to solution 1 (tabular form) highlight that this approach represents most closely the current status of utilities’ energy bills. Some utilities state that in this approach they also include comparison of historical consumption data of the customer. This is thus regarded as rather easy and cheap to implement. The idea of including peer comparative statistics has been appreciated as a neutral, non-judgmental approach for informing customers. However, some utilities point out to the difficulty of (i) how to profile reference households for peer and (ii) how to manage information updating.
Comments provided in regard to solution 2 (energy label model), consider it on the one hand clear and easy-to-understand; on the other hand, it is criticized as being “hackneyed”, i.e. overused, trite, and confusing, providing insufficient and insignificant information, since inconsistent with the official energy

171
label system of electrical appliances. This result contrasts with the results of the consumers’ satisfaction survey. Indeed, for consumers, the level of understanding of solution 2 was excellent for 54%, while for solution 1 it was only 20%. However, numerous utilities highlight also in this case a problem in benchmarking and defining the energy classes (A – G). But this kind of objections were also existing when the energy label for electrical appliances or for cars was under development.
As for solution 3, positive remarks emphasize the simple, neutral, non-judgmental character of this resolution. Furthermore, it presents a way of solving the critical problem of classifying households according to the household size (number of occupants). However, a series of critical aspects seem to outweigh the positive ones: for utilities, retrieving information in regard to the number of occupants is difficult due to privacy concerns and to the fact that there is no obligation to register such data. In addition to the problem of profiling households and updating the related information, cross-comparisons might be biased, since each household reports different consumption behavior and possesses different electrical appliances. Finally, it is also not clear whether this data includes also energy consumption for hot water and heating, but this could be clarified in the bill.
Solution 4 is appreciated for its graphical approach and for introducing historical consumption data into the billing content. Most remarks though consider the implementation of this solution as rather critical, in the sense that it is only possible if the utility is equipped with smart metering infrastructure, since monthly reading is required - otherwise reporting will remain annual.
Solution 5 is considered very similar to solution 3 but more detailed. Again, the positive aspect praised by some utilities is the non-judgmental nature of this representation. Yet, most comments highlight the problem of benchmarking energy profiles in order to be able to compare similar households.
Interestingly, most observations regarding solution 6 are negative, defining it as not meaningful, not possible, not effective, confusing and, above all, judgmental towards the customer – an aspect that should be avoided. This outcome seems very much in line with the results gathered in the Consumer satisfaction survey (chapter 10), where 55% of respondents were “not interested” or “not interested at all” in receiving solution 6 as a billing format.
11.3 Final evaluation of the six IMPROVE solutions by utilities
Finally, for each IMPROVE solution, utilities were asked to rate the likelihood with which they would implement each of the six IMPROVE solutions (Table 40).
IMPROVE Solutions - Likelihood of being implemented MEAN ST. DEV
Solution 1 3.00 1.50
Solution 4 2.69 1.30
Solution 2 2.45 1.19
Solution 5 2.40 1.15
Solution 3 2.33 1.12
Solution 6 2.05 1.23
Table 40 Descending likelihood of implementing the IMPROVE solutions (5 = very likely; 1 = very unlikely).
Solution 1 received the highest likelihood rating from respondents. However, the score corresponds to a “medium” rating and the standard deviation within the sample is also the highest of all. Of course, Solution 1 represents the least extravagant solution, which, according to the cost-benefit analysis ran, implies relatively low implementation efforts.
Solution 4 follows Solution 1. It reports trends in historical consumption data, a format that has been reported to be already in place in 12% of energy utilities surveyed. It is unclear, though, whether utilities would be currently able to implement the more innovative aspects of Solution 4, i.e. the monthly consumption data, the peer comparison statistics and related energy-savings, thus overcoming the difficulties in gathering the needed data highlighted in chapter 11.2.3. Results from the Consumer satisfaction survey (chapter 10), confirm that this format is very appealing to customers: 62% of respondents stated to be “very interested” to “interested” in receiving such billing format.

172
Solution 2, introducing an energy label to improve the informative content of energy bills, even though very much appreciated by customers (61%), has been rated as a less likely solution to be implemented from a utility’s perspective, as it seems to pose implementation problems.
The least likely solution to be implemented is Solution 6. From comments made by the participating utilities, the reason for refusing solution 6 is that it is judgmental towards the customer (displaying a sad or happy emoticon). Interestingly, the same solution has also been refused by customers (55%). As such, in regard to solution 6 both utilities and customers seem to be in line.
Since needs and expectations of customers in regard to energy billing information may differ depending on the customers’ socio-demographic and educational background, participating energy utilities were also asked to evaluate the likelihood of providing different graphical billing solutions depending on the customer segment that is being addressed (Appendix 17 – Q7.2).What emerged is that, for the time being, going to provide segment-oriented solutions in the near future, is a rather unlikely implementation scenario for utilities (M = 2.2.6; SD = 1.31).
11.4 IMPROVE Workshop 2 - insights gained
The present research activity also included the running of a second set of workshops and conducted in the three language regions. These provided an important opportunity for exchange between researchers and utilities. Indeed, these meetings were very useful for collecting more qualitative information in regard to how utilities perceive the question of enhancing billing information to raise customers’ energy awareness and what barriers are currently hindering this process in their perception.
Overall, 4 utilities from Ticino (AEM SA; AIL; SES; AMB), 2 utilities from Romandie (SIL; SEY) and 3 utilities from Deutsche Schweiz (EKS; BKW; SGSW) took part in these workshops.
11.4.1 Data availability and customer segmentation
All participating partner utilities expressed interest and acknowledged the importance of proposing more personalized and segment-oriented billing information in future. However, two main critical points were mentioned, currently delaying the achievement of this goal:
difficulties in defining segmentation criteria and setting a benchmark for different consumer classes, based on their household’s structural energy consumption level (e.g. type of building; electrical appliances equipment; type of heating system, etc.);
difficulties in accessing personal data that falls beyond the mere information of one’s household energy consumption (e.g. number of occupants; socio-demographic information; habits; energy awareness, etc.), especially in the context of new privacy data protection regulations;
Indeed, the more data is available to the utility, the more personalized and detailed the informative content of the bill can get. However, this crucial aspect does not depend solely on the utility itself, but also on the willingness of the customer to provide this personal data. This requires pro-active customers who are willing to provide data to the utility for the processing of more personalized information. This latter outlook remains also true in the light of future technological development and a nationwide smart meter roll-out. As one partner utility highlighted, even though smart meters make real-time energy consumption data (every 15 minutes) available, for privacy reasons, customers must still give their consent to use this data. It’s the paradox of today’s society: a growing number of people seeks to receive services with personalized data, but at the same time, is often not very willing to give consent to the processing of their own data.
Yet, even if the problem of data protection is by-passed, defining customer segments represents probably one of the greatest challenges to utilities. In fact, one big concern of utilities participating in the workshops was that households are too differentiated to be able to correctly profile appropriate energy-related categories and provide peer comparative statistics taking into account all the possible combinations of household types. Just to cite a few examples, the type of electrical equipment held by a household impacts significantly energy consumption. However, as this latter aspect varies significantly from household to household, if comparative statistics are wrongly applied, the risk is that the information provided to the customer is not meaningful.
What has also to be taken into account is the fact that data collection is an investment. First of all, the right data must be collected, then cleaned, then processed and, especially, regularly updated. Thus, implementation costs unavoidably increase and utilities, as suggested by one partner, need to find ways of covering these costs.

173
11.4.2 Secondary data sources
During the workshops, a series of useful suggestions were made with regard to secondary data sources for defining customer segments based on both non-energy-related, open-access data, and generic energy consumption estimates in order to bypass possible privacy problems in retrieving more segment-oriented data.
Energy consumption estimates at Swiss level:
consult ELCOM12 standard load profile or VSE table (e.g. the “H4 category” provides indications on
the type of building (single-family house versus apartment) and the category of electrical appliances
equipment held);
Possible open-access data for customizing information:
consult federal building statistics (indicates the heating system of a building), address real estate
brokers, consider a GIS browser (which includes age of the building, heating system etc.), identify
the presence of special heat pump tariffs (will disappear in due time in some supply regions) or of
separate tariffs for e.g. the electro boiler and basis versus choice tariffs in general;
provide meteorological /climatic data in conjunction to the energy bill in order to allow customers the
identification of possible higher consumption rates due to a higher use of the air conditioner or the
heating system, without having to retrieve more precise and personalized data;
Furthermore, it has to be considered that the continuous rise of building digitalization, will help the utilities to collect the secondary data source, over the next decade.
11.4.3 IMPROVE solutions and utilities’ expectations
The time for enhancing billing information seems to be ripe. During the workshops, partner utilities reported about efforts being made to implement changes. Indeed, some partner utilities are currently conducting surveys with customers, others are promoting more ecological services, developing more personalized web portals, planning to improve data availability by means of smart meter installations or adopting more innovative services for marketing reasons to engage also with liberalized energy market needs in Europe.
Consequently, there is an interest in general to integrate graphical and personalized, segment-oriented information into their energy bill. Interestingly, in regard to the six IMPROVE solutions proposed, a solution similar to Solution 5 is soon going to be implemented by one of the contacted utility. Despite recognizing the problematic of accessing household/personal data, Solutions 1, 3 and 4 were also appreciated. Comments in regard to Solution 6 highlighted the negative and judgmental nature of this approach, thus suggesting to opt for more neutral solutions.
In more practical terms, providing a new bill format obviously implies cost investments and efforts that need to be discussed internally (see chapter 7 Existing DSI in Switzerland ). Some utilities highlighted the fact that a new paper bill format would interfere with their automatic bill generation tool, something they are reluctant to. In addition, for many utilities a new bill format would imply additional costs since an external, private company is often partially or completely in charge of the billing process. Changing the display of the paper bill would therefore require an additional budget, making the entire process of enhancing bills more complex and expensive. Even the use of colored charts already causes operational problems for some utilities, because files become too “heavy” and lead to additional processing costs. Some utilities highlighted that current paper bills contain too many pages (in order to report all the necessary accounting information). Thus, many efforts are presently being made to shorten the current versions. Even testing a new paper bill format may cause some problems, since this would imply having two formats in place at the same time. Also, customers get used to the information provided on their bill and thus, changing too often information would be counterproductive.
12 https://www.strompreis.elcom.admin.ch/Map/ShowSwissMap.aspx

174
Nevertheless, in regard to the possible enhancement of future paper bills, partner utilities made the following suggestions:
if a new bill format is introduced, it would be better to change the bill format for all clients, rather than testing in parallel different billing programmes;
in regard to a possible enhancement of the paper bill according to the proposed IMPROVE solutions, the use of a supplemental sheet is suggested, since it doesn’t underlie regulation and doesn’t imply update of billing procedures, which seems to be rather effortful;
comparison of electricity and gas consumption would be important to highlight the relevance of heating energy consumption;
in addition, respective energy-saving tips should be provided;
Yet, many utilities remarked that improving the paper bill represents the most expensive and the most limiting option. Instead, the use of an online portal allows to collect data at a lower cost and with fewer management problems. One utility highlighted the fact that with a nationwide roll-out of smart meters, this will automatically become the future billing evolution.
And indeed, some utilities already report that:
their company’s current focus is on developing web portals to provide historical consumption data to customers;
they have already introduced comparative statistics;
they have registered an increase in web portal users in the last few years;
they are engaged in some “Smart City” pilot project involving online digitalization of energy consumption data.
In general, therefore, utilities seemed to be:
more reluctant to investing into improvements to the paper bill, because it’s associated with a series of limitations (space, format, paper printing) and additional, higher costs;
more eager to promote their web portal, also for marketing purposes.
11.5 Chapter’s conclusions
The main aim of this report was to frame and summarize utilities’ needs and concerns in the context of
enhanced energy billing in general, and of the six IMPROVE solutions proposed within this research
project in particular. In regard to the inputs received from partner utilities by means of both the online
survey and the IMPROVE workshops, both general and more specific conclusions (in regard to the
IMPROVE solutions) can be summarized as follows:
GENERAL CONCLUSIONS
utilities seem to agree upon the fact that a more user-friendly, graphical visualization of energy consumption data may be of advantage from the customer’s point of view; at the same time a graphical format will imply higher hardware, planning and software costs;
currently, one of the most pressing problems seems to be utilities’ difficulty in retrieving the necessary data to make billing information more personalized and segment-oriented. Indeed, to improve the informative content of energy bills, the data provided to the customer is no longer strictly limited to information regarding customer’s energy usage over time, but needs to extend also to other information fields (building type, number of occupants, electrical appliances equipment, heating system, socio-demographic information about the customer, education, energy awareness, etc.).
for the majority of utilities involved in this study, the availability of high frequency energy data (real-time or monthly interval) is still difficult due to a low smart meter coverage present in the sample. This reflects important limitations to both the “granularity” and “frequency” with which energy usage data can be currently provided to residential customers;
undeniably, a new customer role is also required, i.e. one of the so-called “active” customer, where the involved person is willing to provide data to the utility for the processing of more personalized information. This latter outlook remains true also in the light of future technological development and a nationwide smart meter roll-out: even though smart meters allow the collection of real-time energy consumption data (every 15 minutes), for privacy reasons, customers must still give their consent in order for utilities to use this data.

175
due to the above mentioned methodological and technical barriers in retrieving the necessary data sets, no example of peer household comparison is yet in place or reported by the utilities taking part in the present survey;
providing historical (annual) consumption data is a practice on the rise in Switzerland;
focusing on the improvement of the paper bill is being regarded by utilities as the most expensive and most limiting option. Utilities seem to be more open and eager to promote web portals, also for marketing reasons;
in general, partner utilities reported to be interested in cooperating in possible follow-up activities of the present IMPROVE research project and to be willing to test some enhanced bill version accompanied by scientific evaluation.
SPECIFIC CONCLUSIONS (linked to the IMPROVE Solutions):
no clear preference for a particular IMPROVE solution resulted. However, Solution 1 has been rated as the most likely to be implemented (easy to update the existing bill format) and Solution 6 as the most unlikely (too judgmental towards the customer).
Solution 4 is the one IMPROVE solution explicitly reporting also trends in historical consumption data. This approach seems to align demand and supply, since it has been appreciated very much by both customers and utilities. However, the current version (based on monthly consumption data) is yet only feasible in those cases in which utilities are provided with smart meters;
Solution 2, introducing an energy efficiency label to improve the informative content of energy bills, is very much appreciated by customers (61%), however, from a utility’s perspective this approach causes implementation problems and, on average, is rated as a rather “unlikely” Solution to be implemented;
when confronted with the possible IMPROVE solutions presented in this research project, utilities seem to see a limited impact of these solutions in raising customer satisfaction, even though findings from the (chapter 10) customer survey show that solution 2 and 4 have gained a much higher acceptance compared to the existing tabular format currently used to communicate energy usage information.
Although utilities agree upon the fact that a more user-friendly, graphical visualization of energy consumption data may be of advantage towards their customers, utilities find it difficult to retrieve and process precisely that data needed to profile and consequently differentiate households on the basis of their energy usage levels (real-time data, building type, number of occupants, electrical appliances equipment, heating system, socio-demographic information, etc.). This aspect thus still remains an important challenge.
Due to this methodological and technical barrier, peer household comparison is not yet affirmed as a common practice in Switzerland and some more efforts are needed to be made in this direction.
Overall, the findings allow to identify a series of recommendations to Swiss utilities for future improvements of DSI:
more efforts are needed to develop a methodology for defining and benchmarking the different possible customer segments based on their household’s energy consumption level (e.g. type of building, electrical appliances equipment, type of heating system, number of occupants, socio-demographic information, education, energy awareness, habits, etc.) - one possible solution to overcome this issue could be that the SFOE or FSO provide such reference households’ data, which could then be used by utilities;
more efforts are needed to involve customers as “active players” in this billing enhancement process in order to be able to access personal data that falls beyond the mere information of one’s household energy consumption, especially in the light of both new privacy data protection regulations and increased smart meter roll-out;
it seems that, currently, the easiest data computation for utilities to deliver is the change in energy consumption (%) over a given billing period and historical comparison of annual consumption data. This represents thus a first, possible cost-effective and feasible way of enhancing energy bills;

176
at the moment, as utilities seem to be more confident in calculating the correlation between energy consumption and temperature/weather conditions than profiling customer segments based on different energy consumption levels, this latter kind of approach might reflect a viable opportunity of billing enhancement worth investigating further for possible future DSI strategies’ development;
even though implying higher hardware, planning and software costs, the graphical illustration of energy consumption data presented by the IMPROVE solutions seems to be the way forward and has been rated as slightly more beneficial in terms of customer satisfaction, fidelity and utility reputation;
a monitoring and evaluation process should also be put into place, in order to be able to investigate on the real impact of the enhanced energy bill on energy consumption and energy-saving behavior of customers;
Utilities need to clarify internally if it is cost-effective and feasible for the company to invest in paper bill enhancement. Currently, the tendency seems to be that of investing in the development of an improved online web portal, which would allow to overcome difficulties of collecting user profiling data, by asking them directly through the web portal. On the other hand, paper (or digital) bills still represent an important contact point between utilities and consumers. Thus, a more in-depth consideration of the matter surely needs to be made.
considering that the energy bill (paper or digital) is, so far, still the only systematic contact reaching every utility’s customer, its role as an energy feedback device should not be undermined and should somehow continue to be included into utilities overall strategies. Despite a growing electronically mediated access to energy information, providing additional energy information near the invoice amount, may still rise the consumers’ energy awareness and/or be a mean to drive customers to the utility’s web portal containing more information and analytical resources.
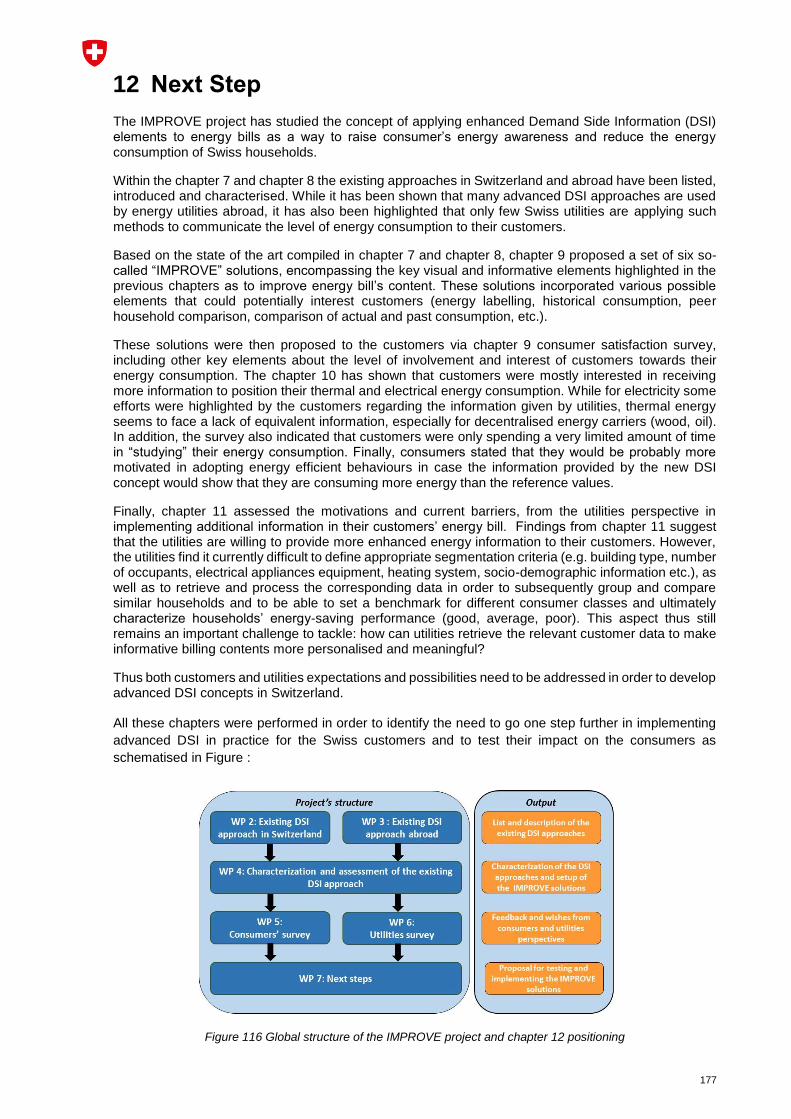
177
12 Next Step
The IMPROVE project has studied the concept of applying enhanced Demand Side Information (DSI) elements to energy bills as a way to raise consumer’s energy awareness and reduce the energy consumption of Swiss households.
Within the chapter 7 and chapter 8 the existing approaches in Switzerland and abroad have been listed, introduced and characterised. While it has been shown that many advanced DSI approaches are used by energy utilities abroad, it has also been highlighted that only few Swiss utilities are applying such methods to communicate the level of energy consumption to their customers.
Based on the state of the art compiled in chapter 7 and chapter 8, chapter 9 proposed a set of six so-called “IMPROVE” solutions, encompassing the key visual and informative elements highlighted in the previous chapters as to improve energy bill’s content. These solutions incorporated various possible elements that could potentially interest customers (energy labelling, historical consumption, peer household comparison, comparison of actual and past consumption, etc.).
These solutions were then proposed to the customers via chapter 9 consumer satisfaction survey, including other key elements about the level of involvement and interest of customers towards their energy consumption. The chapter 10 has shown that customers were mostly interested in receiving more information to position their thermal and electrical energy consumption. While for electricity some efforts were highlighted by the customers regarding the information given by utilities, thermal energy seems to face a lack of equivalent information, especially for decentralised energy carriers (wood, oil). In addition, the survey also indicated that customers were only spending a very limited amount of time in “studying” their energy consumption. Finally, consumers stated that they would be probably more motivated in adopting energy efficient behaviours in case the information provided by the new DSI concept would show that they are consuming more energy than the reference values.
Finally, chapter 11 assessed the motivations and current barriers, from the utilities perspective in implementing additional information in their customers’ energy bill. Findings from chapter 11 suggest that the utilities are willing to provide more enhanced energy information to their customers. However, the utilities find it currently difficult to define appropriate segmentation criteria (e.g. building type, number of occupants, electrical appliances equipment, heating system, socio-demographic information etc.), as well as to retrieve and process the corresponding data in order to subsequently group and compare similar households and to be able to set a benchmark for different consumer classes and ultimately characterize households’ energy-saving performance (good, average, poor). This aspect thus still remains an important challenge to tackle: how can utilities retrieve the relevant customer data to make informative billing contents more personalised and meaningful?
Thus both customers and utilities expectations and possibilities need to be addressed in order to develop advanced DSI concepts in Switzerland.
All these chapters were performed in order to identify the need to go one step further in implementing
advanced DSI in practice for the Swiss customers and to test their impact on the consumers as
schematised in Figure :
Figure 116 Global structure of the IMPROVE project and chapter 12 positioning

178
Within the chapter 12 “Next Step”, the IMPROVE partners propose some follow-up pathways in order to develop, implement and test advanced DSI in Switzerland, based on the results of the previous chapter.
In this next step, the focus is put on bill as the vector to disseminate the advanced DSI concept. Indeed, while other solution (dedicated communication on energy of web-based) could be in principle considered, it could either face a lack of interest from the consumers (chapter 10 highlighted the limited time invested regarding document sent by utilities) or either exclude a part of the population which would not be used to internet based solutions. For the following description of the next step, advanced DSI concept refers thus to a solution to be implemented on energy bills.
12.1 Preliminary remarks regarding advanced DSI implementation in Switzerland
The chapter 12 “Next step” proposal is developed based on the findings of the previous chapters. In order to incorporate a more informative and user-friendly content and visual display of household energy consumption in future energy bills, the consumer survey has highlighted several elements to consider in the next project steps focusing on the development of a more enhanced Swiss DSI model:
The respondents are willing to get more information regarding their energy consumption level;
This information should allow the consumers to position themselves against a reference group; in addition, the reference group should be as specific and geographically proximate as possible (e.g. neighbourhood);
The information needs to be rapidly perceived by customers since they spend a very limited time reading their bills;
The IMPROVE solutions are well understood by and interesting for consumers (see chapter 10 chapter); however, none of them was clearly identified as the solution to be implemented and tested; refining the visual solution to be implemented is thus necessary;
The current energy information displayed to consumers varies with the type of energy: thermal energy vs. electricity.
It appears that the owners are by far less informed about their energy consumption level than tenants are.
The utilities’ survey and interviews have also highlighted elements to be considered in the next steps proposal:
Utilities are willing to implement new DSI concepts mainly to address customer satisfaction and to promote new energy services;
Utilities identify the data collection for creating customer profiles as a major issue when developing new DSI concepts; this is largely due to 1) the low level of smart meter roll-out, which limits the time resolution of the data and 2) possible confidentiality issues regarding the necessary data from the households;
Developing new DSI concepts requires robust and reliable calculation procedures which are, from the utilities perspective not available yet;
The cost of developing new billing formats is a major concern for the utilities;
Utilities are more willing to develop additional web-based solutions to display information related to energy consumption level than improving bill contents.
In addition, the work done and presented in the previous chapters, highlights the needs for improved billing formats (e.g. frequency, format, etc.). For more details, please refer to chapter 7, subchapters 7.2 and 7.3. All these aspects should be considered in the definition of next steps.
12.2 DSI general methodology
Based on the elements highlighted in the previous chapters (briefly summarised above), the general
implementation methodology for possible next step to improve the quality of the energy consumption
level of the consumers is described in the four following steps which are illustrated in Figure 117.

179
Figure 117 Overall proposed chapter 11 methodology
1. Co-creation phase for the refinement of the information and visual solution to be implemented
in the advanced DSI concepts;
o In this phase the co-creation consist in a joint development of the information and
solution to be implemented on the bill. The co-creation consists in workshops (and
eventually survey) involving all stakeholders (utilities, real estate companies,
households, etc.) in order to propose an acceptable solution for all parties.
2. Design and development of the energy consumption reference value;
o In this phase, based on the output of the co-creation phase, the calculation procedure
that enable positioning the households’ energy consumption levels toward reference
value will be established. The reference values calculation procedure will also be
developed and computed.
3. Experimentation ;
o In this phase, the procedure developed above will be implemented over a sample of
household in order to test the influence of this enhanced information over their energy
consumption level.
4. Feedback and evaluation.
o In this phase, based on the experimentation results, the feedbacks from all stakeholders
will be collected in order to identify if the proposed approach is suitable for reducing the
households’ consumption level. Based on this feedbacks, a complete evaluation of the
developed solution will be proposed and finally a set of recommendation will be made.

180
For each of these steps, a general description as well as the key elements to be considered are provided
below. This is followed by the milestones list for each step as well as a descriptive assessment of the
risks and opportunities.
It is worth to mention that a critical issue for the application of this framework has to be considered only
if at least one utility agrees to develop such advanced DSI concepts. Indeed, it will imply a strong
involvement from their side and a real motivation to co-create solutions with their customers.
Hereafter, each of the four phases listed above (see grey boxes) in Figure 117 are presented in more
details.
12.2.1 Co-creation phase
The IMPROVE project has provided a strong basis for the development of new possible DSI solutions (format, content, practical needs, etc.). However, as summarised above, results gathered from chapter 10 and chapter 11 have highlighted some critical aspects that will have to be addressed in a follow-up project.
Particularly, it appears that utilities and customers have different expectations in terms of format, content and dissemination means. In addition, the utilities have highlighted a list of operational concerns, in terms of data collection, segmentation criteria, reliable benchmarking methods, costs etc. that need to be considered. At the same time, for innovation to set off in the energy bill panorama, also end-user collaboration and involvement in producing content are essential. Based on these observations, it is necessary to work closely on needs-finding, participatory design, and lead-user involvement to reach an acceptable solution for both parties.
A possible way for reaching an innovative consensus solution is to set up workshops and discussions (online or in real life) including utilities and customers, as well as researchers from various fields (engineering, social sciences, etc.) to exchange ideas about advanced DSI concepts. These open discussions will be used to co-create bill contents including all requirements, expectations and practical limitations. The innovative solution that will emerge from these co-creation workshops will thereafter be tested in a real-world setting with the aim of capturing user behavior.
This participative decision-making approach, named “co-creation step” is of strong interest since it allows a common agreement and development of the proposed solutions by all stakeholders. It also contributes to validating the innovation potential of the proposed solution in a “as-real-life-as-possible” context, ultimately, helping to minimize the high risks, costs and the unpredictability that characterizes in general all innovation processes.
Key points to be considered in the ”co-creation phase” discussions
First, as stated above, it has been identified within the chapter 10 survey that customers spend a very limited amount of time reading their bills. Thus, it is necessary to ensure that the visual representation of the energy consumption level will be rapidly perceived and understood by the consumer.
The feasibility of this requirement needs to be validated by the utilities for which the billing format has been developed according to legal requirements, communication departments and sometimes externalised to other companies. It is thus necessary to identify if the modification of the bill format can be accepted by the utilities, in terms of cost, legal compliance and involvement to achieve the new bill format.
If it is not possible, it would be the utility’s choice to add the visual representation on an additional page of the bill but it would decrease its impact on the customer’s awareness. In any case (the consumption level representation according to one of the 6 IMPROVE solutions on the 1st page or later in the bill documentation), a description of the representation and how to interpret it should be added to the bill in order to ensure a good level of understanding of the displayed information.
Another important issue to consider, still in line with the time spent by the customer in analysing bills, is related to the bill support. While paper bills come into the mailbox and are, in general, manually opened, e-bills can sometimes appear only in the bank portal and be thus skipped, since the customer only needs to accept the payment. A large communication campaign might be necessary to inform the customers that new information regarding the energy consumption level is now displayed on the bills (specific initial communication per mail for example).
181
The frequency of the communication needs also to be considered. Indeed, in the previous activities of the present project, it has been identified that this aspect could play a significant role in the customer involvement. So far, when only considering paper bills, many of the utilities provide two types of documents, periodic instalments (prior to the previous year consumption) and once a year, a correction bill with the final account for the real consumption. Thus, the consumption level can only be calculated on an annual measurement basis. This frequency is not sufficient for ensuring the customer involvement in their energy consumption management (Serrenho et al., 2016). Indeed, if customers only receive once a year their consumption level, it might reduce their motivation to implement energy efficiency actions since they will not measure the influence of their efforts in a short-term perspective. In this case, it might be possible, either to increase the frequency of the bills (manually or with smart-meter), to work jointly with utilities that would have a higher frequency for their bills’ release or to have a dedicated communication (for example on a monthly basis) on the energy consumption level. However, this dedicated communication plan could face a lack of interest from the customers, depending of the information pathway used and should be already addressed in the co-creation phase and subsequently be tested in the experimental phase.
A possible solution could be to send a monthly notification to the customer (smartphone, computer, etc. …). The feasibility and interest of such approach should be tackled before implementation, with communication’s experts (from the utilities or external professionals) and a panel of consumers. For the time being, the smart meter coverage in Switzerland is relatively low but it can be expected to evolve rapidly in a near future for the progressive replacement of the current metering systems.
Risks and opportunities
The risk related to this subtask is to have difficulties in:
Reaching a common agreement between the involved stakeholders of the co-creation phase regarding the visual representation and final format of the new DSI concepts to be tested in a later phase;
Implementing the innovative solution in practical terms by the energy utilities. Indeed, while it has been noticed during the project, that the utilities would be motivated in implementing on the bill more information of the consumer’s energy consumption the shift between theoretical concepts toward practical execution could be complex since several utilities’ departments would be involved with possibly different point of view on the proposed innovative solution.
Indeed, from the utilities survey, it has been identified that advanced DSI concepts, even if of strong interest for the energy provider, may face operational hurdles regarding the modification process of the billing format and the collection of the data, since these modifications imply new operational methods, as well as involve different units/departments of the utility or even support from external companies, as for instance for modifying the bill content and the printing. In any cases, the calculation methods and the data needs will be clearly characterised in the next proposed task. However, by engaging in an initial co-creation phase involving relevant stakeholders, it is possible to target and tackle these aspects more in-depth and to minimize risks. Thanks to the co-creation approach and the participative decision-making process applied, one can expect to find an acceptable and feasible solution for all involved stakeholders. With utilities and consumers both contributing to the development of the innovation proposal, participation and engagement will be high and solutions will better reflect and mediate stakeholders’ actual needs. At the same time, the involved utilities will be highly interested in applying such solution. Thus, the effect of this new DSI concept could be enhanced by this initial step.
Milestones
From this first task, the following mandatory milestones are necessary in order to develop a possible implementation phase to improve the information on the bill and test on a large panel of consumers with motivated utilities:
Selection and commitment of a group of partners, such as energy utilities, customers, psychologists, designers, to be involved in the co-creation group
Definition of a protocol for collecting background information and insights around the topic and conducting co-creation workshops;
Benchmark of the “current state” of energy-related behaviour and associated bill information, as to allow the measurement of the potential impact and effects of the subsequent experimentation phase of the possible next step;
Clear definition of the DSI solution (visual solution and informative content) to be implemented on the bills;
Characterisation of all bill format specifications (frequency, position on the bill, etc.)

182
12.2.2 Design and development phase
Once the visual elements and the structure of the new DSI concept, to be implemented with the bills, are fully defined (co-creation phase), the reference values that will be used to position the consumers’ energy level, will have to be set. This implies (i) identifying household segmentation criteria and subsequently (ii) setting up a benchmarking process to be able to rank and classify households’ energy performance (good, average, poor). To do so, two steps need to be considered:
Definition of a calculation framework: propose reliable and transparent methods to calculate the reference values with the appropriate parameters influencing the energy consumption
Collection of data and quality check: collect the parameters to be used for the reference values calculation and ensure their representativeness and quality.
It has to be noticed that these two elements, in order to be reliable, will have to rely on a large number of data to be statistically significant.
The utilities’ survey has identified these two elements as the major issues, from their perspective, to implement advanced DSI concepts. The following sections of this chapter will draw the first considerations regarding these subtasks but should not be considered as exhaustive and fully set.
Definition of the calculation methods
In Switzerland, internet-based platforms exist and propose energy calculators or reference values for energy consumption of the households (e.g. Romande energie, ESR13, etc.). Sometimes, some information related to the equipment or households profile is asked, the lists of parameters are not fully consistent between platforms and the calculation method does not seems transparent enough.
Thus, it appears that the calculations of the energy reference values are not straightforward. Indeed, it requires to identify the parameters that influence the energy consumption and then to develop methods to adjust the consumption according to these parameters.
Considering electricity and thermal energy, as first insight (to be refined and enhanced in this next step subtask), some elements that drive the energy consumption are given in Table 41.
Factors
Heat consumption
Electricity appliances’ consumption
Building / Dwellings related factors
- Building characteristics - Energy carrier
- Density and age of electrical equipment
User-related factors - Household structure
Climatic factor - Meteorological conditions -
Table 41 Issues to consider for the development of the reference values calculation method
Regarding the building/dwelling related factors, the influence of the building characteristics (insulation level, construction period, etc.) appears to be critical when considering the energy consumption level regarding space heating (Heeren et al., 2009). Thus, in this case it is necessary to get access to the building attributes. For the electricity consumption related to the appliances, the quantity and age of the electrical equipment is also a key element.
Regarding the user-related factors, the household structure (number of occupants, age, etc.) has an influence on the thermal and electric energy consumption (Jones et al., 2015). In addition, Serrenho et al. (2016) have shown that so far this aspect has been slightly neglected when considering energy feedback. Thus, the reference value to be provided to customers should consider these issues.
13 https://www.romande-energie.ch/particuliers/electricite-compte-et-factures/tarifs-et-simulateur/simulateur-facture
https://www.esr.ch/fr/calculateur/

183
The information regarding meteorological conditions should also be provided to customers, since they may largely affect heating consumptions. Lacking knowledge about them could lead consumers to wrongly assess the differences in their consumption levels between historical periods.
For this non-exhaustive list of factors, reference values should be set in order to finally achieve typical energy consumption levels. In addition to this, harmonisation procedures should be proposed for each of these factors. Indeed, these values have to be tailored to the local conditions or the household profile (to be defined according to the “guideline” provided by the co-creation phase i.e. the previous task). These adjustments would ensure meaningful comparison for the consumers.
For example, regarding thermal energy, adjustment of this needs also considering climate conditions. This climate harmonisation can appear as relatively simple to describe, however, other parameters will need much complex models and assumptions (e.g. construction period of the building and corresponding thermal energy needs).
Finally, once the reference values are defined, it will be necessary, depending of the DSI solution adopted in the co-creation phase, to characterise classes. Indeed, for example, in the IMPROVE solution 2 (energy labelling such as for electric appliances), there are 7 energy categories to be characterised. So depending on the solution agreed upon between consumers and utilities, this aspect will also have to be considered in this step.
Data collection for the reference values calculations
Once the parameters to be used for the calculation and the harmonisation methods are defined, it is necessary to characterise and collect them. This part of the new DSI implementation is complex and might be a major issue to solve.
Indeed, the relevant parameters can be numerous and need to be collected among different actors (utilities, households, real estate companies, etc.). The utilities must be able to collect data regarding consumers with a good time resolution. In addition, regarding the reference values calculation, the utilities should assess the feasibility of geo-dependant energy comparison for the energy consumption. This later element is not fixed yet, since the advanced DSI requirements will be set during the co-creation phase. However, it is worth to mention that the results of the consumers’ survey oriented this preference towards a rather local level of comparison. The real estate companies and cooperatives could also be involved in providing data for the reference value calculation. Indeed, they could provide the details regarding the building envelope (e.g. past renovations) and technical installation management. Finally the households would have to agree in providing some data regarding their composition (e.g. number of adults, children) and their electrical equipment. This agreement could be proposed to the consumer via a letter of intend to return if they are willing to participate to the experiment (next project phase).
In addition, the issue regarding willingness to transmit this information from the stakeholders to the utilities and related privacy concerns has to be solved. The polemic of the data collection related to the new “Linky” smartmeter in France14 is an example of the issues the utilities can face regarding the data collection from the households. In any case, the co-creation task proposed as a first step of the advanced DSI implementation, could facilitate the data collection by offering an acceptable solution for the energy consumers.
In order to ensure the collection of the relevant parameters for the advanced DSI implementation, the energy consumers should agree in providing the data enabling to position their energy consumption level. Based on this agreement, the utilities could setup a platform to collect the data.
Once statistically significant data has been collected, their post-processing will be required. Sets of data will have to be cleaned from incomplete information and possible outliers. Thereafter, a comparative analysis of households’ groups with similar characteristics or with an energy best-practise will need to be run in order to be able to benchmark energy performance and set classification schemes.
Risks and opportunities
The implementation of the energy bill improvement aims at providing meaningful information towards households to position their energy consumption. It requires to find the appropriate format for the communication and the information to be displayed (as set, in principle) in the co-creation phase, but it also requires to develop models that provides correct information regarding “typical energy consumption level”. Gathering such values implies a close collaboration between all the stakeholders and especially
14 https://www.liberation.fr/checknews/2018/03/29/quelles-sont-exactement-les-polemiques-autour-des-compteurs-linky-
lesquelles-sont-justifiees_1653329
184
between the utilities and the households. Without this collaboration and the data exchange, the reference values could be non-representative and thereby difficult if not impossible in influencing the energy consumption level of the households.
The main risk for this step is thus to fail in finding an appropriate way to collaborate between the stakeholders. However, this risk should be overcome by an appropriate selection of partners, motivated to improve the current situation. Indeed, while in the first phase of the proposed “next step”, the stakeholders are involved in the co-creation phase of the DSI concept, in the second phase of methodology development, the same stakeholders could improve the data exchange.
Milestones
Calculation methods for defining the reference values regarding the typical thermal energy and electricity consumption level;
Identification of the parameters to be collected for the reference value calculation;
Setup of a data collection protocol agreeable for all stakeholders;
Comparative analysis of energy use in households with similar characteristics or with a best-practise household obtained from the database created for benchmarking process.
12.2.3 Experimentation phase
The experimental phase consists in the implementation and testing of the enhanced energy bill developed during the two previous phase in a real-life context. The experimentation phase will thus involve:
An inclusive and representative constituency of end-users in the testing:
o In this step of the experimentation phase, it would be necessary to constitute the testing
group. To do so, it is necessary to identify first one or more utilities that would be willing to
modify their bills for some consumers in order to include the co-created concept.
o Then, it would be necessary to constitute the experimental sample, made of households.
Indeed, as the proposed solution has been co-created during the respective workshops by
a restricted group of stakeholders, the upscaling, to a representative sample enabling a
reliable assessment of the advanced DSI concept, could help to identify some issues
regarding the developed structure. The upscaling could be made by involving the
stakeholders of the co-creation phase (real estate companies, utilities, consumers), and/or
via an advertisement campaign.
Quantifying the energy-saving effect of enhanced billing/DSI:
o The households have stated in the IMPROVE project, that they would like to receive
information enabling to position their energy consumption level. They also stated that in case
this information would show a higher consumption than a reference, it would drive them into
a more efficient behaviour. The quantification of the energy saving potential has to be made
to confirm the relevance of the developed concept.
Structure of the experimental phase
Within the experimental phase, three subtasks are proposed:
Communication and recruitment of end-users;
o The utilities involved in this phase should be the communication vector toward the
households in order to recruit a sufficiently large number of participant. Based on the
IMPROVE project experience, it has been seen that with the help of motivated utilities, it is
possible to achieve an important participation rate. Moreover, if real estate companies would
be involved within the co-creation phase, it could be possible to communicate via their
network about the experimental phase. Finally, advertisement campaign could also be
considered;

185
Presentation of the new “energy bill prototype” to its users;
o Once the consumers’ sample have been defined, it would then be necessary to develop a
specific initial communication in order to present them the experimentation and also to collect
the necessary data to position their energy consumption level. For this later point, a
framework specifying the data needs and the confidentiality concerns will have to be
specified. This specific communication will have to be discussed by the experiment
managers in order to avoid introducing bias over the sample (Hawthorne effect) ;
Setup of the experimental sample protocol:
o Within this phase, the characterisation (number, eventually household characteristics) and
the identification of the participation group has to be made. The involved utilities would be in
charge of the communication towards their customers in order to enrol a large sample of
participants;
o Once the participation group is defined, it will have to be segmented into two homogeneous
sub-groups. The first one will be the control group (i.e. still receiving the standard energy
bill), and the second will be the test group (i.e. receiving the advanced DSI bill);
o Moreover, the duration of the experiment will have to be defined in order to measure the
energy saving and the persistence over the time regarding the energy saving potential;
Experiment:
o Establish a baseline in regard to energy consumption of the experimental groups (treatment
and control group) in order to be able to monitor and evaluate changes prior and after the
intervention;
o During the experiment, the household structure could change (e.g. additional children, move
into a new dwelling, etc.) thus it will be necessary to ensure a follow up of the participation
group in order to adjust the energy consumption reference value and also to capture external
factors (i.e. not related to the advanced DSI concept) that could influence the energy
consumption level;
Measurement and monitoring of the energy savings achieved:
o Energy consumption (kWh) of involved households is recorded pre- and post-intervention in
order to assess if the advanced DSI concept over the bills would have an influence on the
energy consumption level of households. It might be interesting to have two different
consumers’ population. One with and one without smart-meter, to analyse if this technology
may influence the consumers behaviour in his energy consumption, due to a better accuracy
in recording the energy consumption for short time period billing ;
Monitoring trough time energy-related behaviour of some households (socio-demographic, psychological) with contextual and structural factors :
o Elaboration of a questionnaire to be launched for a pre- and post-intervention survey to
assess the potential savings as a function of the households attributes could also be
investigated in order to identify the population segments that could be more or less sensitive
to the DSI communication;
Optionally, it could also be possible to improve or develop new links between the proposed DSI and DSM (i.e. implementation of energy efficiency measures). Indeed, from the survey it has been highlighted that the customers would get information regarding their energy consumption level but they would also eventually get information regarding ways to reducing it. Single information, by itself might be not enough and it could be necessary to offer a “one step further approach” including energy coaching, as it may already exist in some institutional utilities.

186
Risks and opportunities
The involvement of a representative number of participants willing to provide the necessary data to the utilities (to setup the advanced DSI concept) is necessary. The major risks of this step are low level of participation and/or low involvement from the households (required data not provided). However, it has been seen in the IMPROVE project that with the utility’s help, it is possible to encourage a significant number of participants to answer the consumers’ survey. It is thus possible to expect that, with an appropriate communication scheme and pedagogy and with motivated utilities, these risks may be overcome.
Regarding the field of application of the developed DSI (thermal or electricity), it seems that thermal energy is slightly more complex to address than electricity. Indeed, it requires to collect more data for characterising the energy consumption but also to take into consideration the specific interaction between the various stakeholders. Moreover, the ownership structure makes the application of DSI for thermal energy more complex to implement. This might be the reason why less experiments appear to have been implemented in this domain. While it is challenging, the proposed possible next step could be an interesting opportunity to assess the feasibility and relevance of applying DSI to thermal energy.
Developing such advanced DSI experiments in Switzerland involving the scientific community, utilities and other partners such as real estate companies or public authorities would be a great opportunity to involve the population in the energy transition. Switching from a “top-down” approach (i.e. scientists or utilities developing concepts for energy savings of households) to a “bottom-up” approach (development of concepts considering the households practical expectation) could be an interesting paradigm shift to be tested in Switzerland.
Milestones
Measurement of energy saving impact of the innovative energy bill proposed is assessed for the implemented DSI solution;
Survey of energy-related behaviour of participating households before and after the introduction of the enhanced bill;
Comparative analysis (qualitative and quantitative) with the reference control group (receiving the old version of the bill) in terms of:
o Energy-saving;
o Energy-related behaviour;
12.2.4 Feedback and evaluation phase
The main aim of this final feedback and evaluation phase is to analyse the energy consumption evolution of the involved consumers over a certain period (at least two years). These results will be analysed with all stakeholders involved and, if needed, it may require to revisit the bill format. This continuous feedback process could be proposed to a reduced sample of participant, to study the influence of the communication on their energy consumption level and also to assess the persistence of this influence over the time. In complement to the continuous feedback process, a general feedback survey should be proposed to all participant at the end of the experiment. This survey, made on consumers which would not have been following during the experimental period would allow to identify the perception over a large sample which has not been disturbed by regular exchange with the experiment managers.
Structure of the feedback phase
Based on the experiment results, it would be necessary to collect utilities and households feedback by means of post-intervention interviews and focus groups with end-users and utilities in order to evaluate and validate the tested energy billing innovation solution. This feedback would enable identifying the perception of the participants regarding the new proposed way of communication, through either a survey or specific interviews. Ideally, the feedback would be correlated with the energy saving achieved by the household as well as its socio-demo characteristics. Based on this cross-assessment, it could be possible to propose modifications in the DSI concept in order to increase the energy saving potential. A complete feedback should be collected at the end of the experiment. In addition, during the experiment, it would be necessary to select a reduced sample of participant that could be interviewed periodically (rolling survey) in order to assess their perceptions on the communicated information over the time.

187
Moreover, ex-post discussions with the utilities should be conducted. These discussions could also highlight some possible improvements and refinements of the tested solution. They could also serve to assess if the visual communication had an influence on the interaction with the customers (increase of questions regarding energy consumption or increase participation to energy efficiency programs).
Developing an advanced DSI concept can hardly be a silver bullet. The collection of feedback could help to identify the weaknesses of the developed solution and improve its reliability and effectiveness towards reduction of the energy consumption. Based on the feedback and the developed methodology (presented above), a guideline with recommendations to synthetize the good practices to apply when developing advanced DSI concepts considering the Swiss context could be published.
Milestones
Feedback from all stakeholders involved in the process;
Guidelines with recommendations;
12.3 Perspectives: linking DSI to DSM
The IMPROVE project focused its research on Demand Side Information (DSI), especially on improving the information on the consumer’s energy bill, to allow him to better evaluate its level of energy consumption. DSI has been identified as an interesting way to increase the consumer awareness about their energy consumption levels.
From previous existing research work, it has been found that DSI can enable reductions in energy consumption since the consumers would have a comparison value and implicitly, an incentive to do better and therefore would be keener for more information on energy efficiency at home. While behavioural change can reduce energy consumption, it will consequently be necessary to link it with Demand Side Management (DSM).
DSM would help the consumers to get a more in depth knowledge on their energy consumption and the possibility to reduce it. It seems highly plausible that DSI will lead to the implementation of DSM concepts. Thus, assuming that the proposed “next steps” are implemented in practice, assessing the perception of the consumers and the utilities on the way to bring these two concepts together consistently will be relevant.
12.4 Chapter’s conclusions
The IMPROVE project has addressed several aspects related to Demand Side Information (DSI) on energy consumption. The project paved the way to implement advanced DSI in a test phase. The Chapter 12 “Next Step” proposes a possible way to test new DSI concepts regarding the level of consumption of energy consumers, based on the elements collected in the previous chapter.
It has been identified that advanced DSI concepts strongly rely on the implication of the various stakeholders of the energy field (mainly the utilities and the consumers). Thus, the proposed implementation scheme is based on this observation and requires a collaborative approach. The “co-creation phase” concept is a promising concept to create this synergy and collaboration between the partners. Indeed, this bottom-up concept, while potentially more time consuming than the traditional top-down approach, shows great advantage to bind the partners together and to create a common vision on a given problematic, here the need for more information regarding the energy consumption level.
Based on this central concept of co-creating a solution that would be acceptable for all, the requirements of reliable methods for calculating meaningful energy consumption levels have been discussed. The complementary need of data collection has been discussed. For both aspects, first insights were highlighted and discussed.
Finally, based on the co-creation phase and the reliable methods developed, the experimental phase is considered, representing a first step in the road of success towards a better information given to households.
Developing advanced DSI concepts in Switzerland can appear a complex task, however, it answers a need expressed by both the utilities and the households. All the elements are available to achieve a significant energy savings but further investigation is needed to reach this goal.

188
13 Conclusion
The Swiss Energy Strategy 2050 aims to increase the use of renewable energy and the energy efficiency
of buildings, mobility, industry and appliances. An additional important element of this strategy is the
reduction of the energy demand in Swiss households, which requires a change in energy consumption
behaviour.
An important driver for promoting the change of energy consumption behaviour of private households
can be seen in the information available to the consumer. This information could raise the consumers’
awareness on their level of energy consumption and, encourage them to search for tips on how to
reduce their energy consumption and to target the most efficient measures they can enforce.
The point of departure of the IMPROVE project is the lack of information, on the energy bill, to help
consumers to position their level of energy consumption as a trigger to encourage them for changing
their behaviour.
The objectives of the project were to collect best practices on presenting households’ consumption in
Switzerland and abroad, to assess the consumers’ interest on enhancing the information available on
the energy bill of the Swiss households, to rank proposals of enhanced energy bills as well as to evaluate
their implementation potential with energy utilities. The following activities have been undertaken to meet
these objectives:
A literature review on the important factors affecting the energy consumers’ behaviour,
An assessment of energy bills in Switzerland and abroad, in order to identify and characterise
current practices, main informative contents and design elements,
The development of six different information layouts for improved energy bills, helping
consumers to have a better evaluation of their energy consumption level,
A national survey conducted to evaluate energy users’ opinion on the type of information
currently available in their energy bill and to gauge their interest among the six enhanced layouts
developed previously,
A survey targeting all Swiss utilities and three workshops involving a selection of them, aimed
at exploring their viewpoint on the six enhanced bill layouts, according to a cost-benefit
approach and the feasibility of implementation,
The development of recommendations for the Swiss energy utilities for possible improvements
of their energy bill from the customers’ point of view, and possible pathways to develop and
implement enhanced energy bills and to test their effectiveness in a large scale intervention.
These activities have led to the following main findings:
Consumer’s point of view
A national survey conducted to evaluate the consumer’s satisfaction regarding the information currently
available on their energy bill, has shown that:
Over 90% of customers currently receive paper bills,
Almost half of the consumers spend less than five minutes to read their energy bill,
Only 14% of the consumers receive a qualitative or quantitative information to position their energy consumption. And 75% of the remaining consumers, are interested to receive such additional information,
Information about one's own consumption and energy costs is of great interest to the customer. Two thirds of the energy consumers wish to compare their energy consumption with equivalent households of the neighbourhood and are willing to put into place energy-saving actions if their consumption is above average,
Two third of the consumers who would receive additional information regarding their level of energy consumption are incited to reduce their consumption.

189
In summary, current bills contain hardly any information that could rise customers’ awareness on their
energy consumption. Despite a good understanding of the current energy bill, consumers are interested
in bill’s enhancement with more information on their level of energy consumption, including a reference
energy consumption, for instance the average energy consumption of their neighbours, , to encourage
them to implement energy saving actions.
Utilities point of view
In order to assess the point of view of the Swiss energy utilities, a national survey and workshops were
conducted. The aim was to evaluate their motivations and the cost/benefits for enhancing information
on their energy bill. The energy utilities’ survey has pointed out the following issues:
The three main motivations to enhance the information in the bill are 1) consumers satisfaction, 2) need for transparency and 3) promotion of utility’s energy consulting services.
Utilities agree on the need for more user-friendly visualisations of energy data (even if associated to higher costs) and segment-oriented, comparative statistics. The graphical illustration of energy data is beneficial in terms of customer satisfaction, fidelity and reputation,
The availability of high frequency energy data is difficult due to a low smart meter coverage and its slow dissemination. Many years are still required in order to get all Swiss households connected to a smart meter.
The energy utilities are putting efforts in the development of their web portals and are mostly reluctant to change the bill content, as it is a complex internal process involving different services within the company and has some indirect costs when the bill layout development is outsourced.
Currently, for energy utilities, the easiest data computation to deliver is the change in energy consumption over a given billing period and historical comparison of annual consumption data.
The utilities are more confident in taking into account the weather correction than profiling customer segments based on different socio-economics or location.
Currently, the utility tendency is to invest in the development of their web portal and not to improve the bill layout.
In summary, the energy utilities are aware of the consumers’ need for additional energy information on
their consumption and are interested in providing them with information allowing comparisons with
reference energy consumptions. However, their capability of retrieving the necessary data (e.g. socio-
demographic) to make billing information more personalised and segment-oriented is limited due to
privacy and the slow diffusion of smart meters.
Whatever the enhancement provided by utilities in the future regarding the billing information, there is a
clear need from the consumers’ side to have more information on their energy consumption, and the
utilities agree upon the fact that a more user-friendly, graphical visualisation of energy consumption data
may be of advantage from the customer’s point of view. Even if for utilities the cost of enhancing the
energy bill may be a barrier, for the national energy policy the potential energy saving might be
interesting.
In addition, the slow smart meters rollout along with limitations regarding household data access due to
personal privacy are also issues to consider when developing a methodology for defining and
benchmarking different customer segments. In contrast, some foreign energy utilities have already
overcome these issues and are already offering enhanced information energy bills to allow consumers
to compare their level of energy consumption with a reference energy consumption. These examples
might lead the Swiss energy utilities to rethink some aspects of their communication strategy, if not
business model, and to find rapid solutions for the near future.
The six enhanced energy bill proposals
To evaluate the consumers’ interest in additional energy information on the bill, six different layouts have
been designed based on best practices observed in the collected bills. The goal was to present a
selection of proposals covering a range of different levels of information detail, as well as different
possible layouts (e.g. diagram, table, etc.). This lead to the following six layouts:
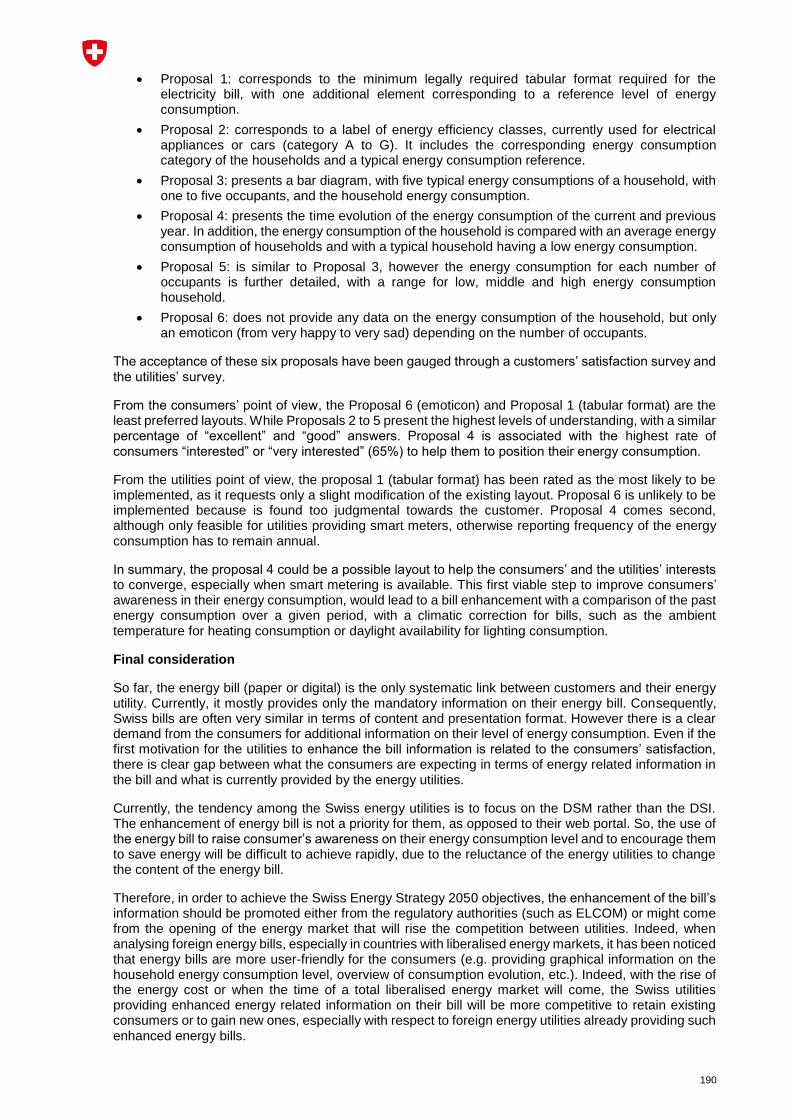
190
Proposal 1: corresponds to the minimum legally required tabular format required for the electricity bill, with one additional element corresponding to a reference level of energy consumption.
Proposal 2: corresponds to a label of energy efficiency classes, currently used for electrical appliances or cars (category A to G). It includes the corresponding energy consumption category of the households and a typical energy consumption reference.
Proposal 3: presents a bar diagram, with five typical energy consumptions of a household, with one to five occupants, and the household energy consumption.
Proposal 4: presents the time evolution of the energy consumption of the current and previous year. In addition, the energy consumption of the household is compared with an average energy consumption of households and with a typical household having a low energy consumption.
Proposal 5: is similar to Proposal 3, however the energy consumption for each number of occupants is further detailed, with a range for low, middle and high energy consumption household.
Proposal 6: does not provide any data on the energy consumption of the household, but only an emoticon (from very happy to very sad) depending on the number of occupants.
The acceptance of these six proposals have been gauged through a customers’ satisfaction survey and the utilities’ survey.
From the consumers’ point of view, the Proposal 6 (emoticon) and Proposal 1 (tabular format) are the least preferred layouts. While Proposals 2 to 5 present the highest levels of understanding, with a similar percentage of “excellent” and “good” answers. Proposal 4 is associated with the highest rate of consumers “interested” or “very interested” (65%) to help them to position their energy consumption.
From the utilities point of view, the proposal 1 (tabular format) has been rated as the most likely to be implemented, as it requests only a slight modification of the existing layout. Proposal 6 is unlikely to be implemented because is found too judgmental towards the customer. Proposal 4 comes second, although only feasible for utilities providing smart meters, otherwise reporting frequency of the energy consumption has to remain annual.
In summary, the proposal 4 could be a possible layout to help the consumers’ and the utilities’ interests to converge, especially when smart metering is available. This first viable step to improve consumers’ awareness in their energy consumption, would lead to a bill enhancement with a comparison of the past energy consumption over a given period, with a climatic correction for bills, such as the ambient temperature for heating consumption or daylight availability for lighting consumption.
Final consideration
So far, the energy bill (paper or digital) is the only systematic link between customers and their energy utility. Currently, it mostly provides only the mandatory information on their energy bill. Consequently, Swiss bills are often very similar in terms of content and presentation format. However there is a clear demand from the consumers for additional information on their level of energy consumption. Even if the first motivation for the utilities to enhance the bill information is related to the consumers’ satisfaction, there is clear gap between what the consumers are expecting in terms of energy related information in the bill and what is currently provided by the energy utilities.
Currently, the tendency among the Swiss energy utilities is to focus on the DSM rather than the DSI. The enhancement of energy bill is not a priority for them, as opposed to their web portal. So, the use of the energy bill to raise consumer’s awareness on their energy consumption level and to encourage them to save energy will be difficult to achieve rapidly, due to the reluctance of the energy utilities to change the content of the energy bill.
Therefore, in order to achieve the Swiss Energy Strategy 2050 objectives, the enhancement of the bill’s information should be promoted either from the regulatory authorities (such as ELCOM) or might come from the opening of the energy market that will rise the competition between utilities. Indeed, when analysing foreign energy bills, especially in countries with liberalised energy markets, it has been noticed that energy bills are more user-friendly for the consumers (e.g. providing graphical information on the household energy consumption level, overview of consumption evolution, etc.). Indeed, with the rise of the energy cost or when the time of a total liberalised energy market will come, the Swiss utilities providing enhanced energy related information on their bill will be more competitive to retain existing consumers or to gain new ones, especially with respect to foreign energy utilities already providing such enhanced energy bills.

191
14 Acknowledgments
The present project was carried out with the kind support of the Swiss Federal Office of Energy (SFOE).
And this project would not have been possible without the involvement of the following energy utilities, by alphabetic order:
Azienda Elettrica Massagno (AEM),
Aziende Industriali di Lugano (AIL),
Aziende Industriali Mendrisio (AIM),
Aziende Municipalizzate Bellinzona (AMB),
Berner Kraftwerke (BKW),
Elektrizitätswerk des Kantons Schaffhausen (EKS),
Energies Sion Région (ESR),
Service de l’Energie d’Yverdon (SEY),
Services industriels de Lausanne (SIL),
Società Elettrica Sopracenerina (SES),
St.Galler Stadtwerke (SGSW).
The support and feedbacks from all these entities and their representatives were greatly appreciate during the project. As the help they provide to disseminate the consumers’ satisfaction survey through a panel of own consumers.
Finally, thanks to the kind help of some colleagues and friends abroad, it has been possible to collect 175 energy bills from foreign countries from Canada to Chile and from Brazil to Australia.

192
15 National collaboration
The present project has involved the following academic partners:
FHNW : Jürg Bichsel, Bastian Burger, Dominique Kunz
HES-SO : Stéphane Citherlet, Sara. Eicher, Pierryves Padey.
SUPSI : Francesca Cellina, Roberta Castri, Roman Rudel
ZHAW : Vicente Carabias, Uros Tomic, Evelyn Lobsiger
Two workshops have been organised with the following utilities to presents the outcomes of the project, to share their expectation in term of energy bill enhancement and to gather their feedbacks on the project:
Utility name Canton
AEM – Azienda Elettrica di Massagno TI
AIL – Azienda Industriali di Lugano TI
AIM – Aziende Industriali Mendrisio TI
AMB – Aziende Municipalizzate Bellinzona TI
BKW – Berner Kraftwerke BE
EKS – Elektrizitätswerke Schaffhausen SH
ESR – Energie Sion Région VS
SES – Società Elettrica Sopracenerina TI
SEY – Service des Energies d’Yverdon VD
SGSW – St. Galler Stadtwerke SG
SiL – Services Industriels de Lausanne VD
Mutual knowledge exchange with partners from other projects such as SCCER CREST, “Social Power”, “Energy chance” and “Promoting energy-sufficient behaviour in cities” has been continued for the benefit of the project progress.
Finally, the following paper has been submitted and presented:
IMPROVE - Unfolding next generation demand-side information (DSI) models, 20. Status-Seminar «Forschen für den Bau im Kontext von Energie und Umwelt», Zurich, 6-7 September 2018.

193
16 International collaboration
The established contact with the operator of the IEA DSM - Task 24 Phase II could be used to gather additional international feedback and insights from related activities. Moreover, the international community in this field is also considered through participation at international conferences, such as ECEEE or ENRI 2017. In addition, ZHAW managed to be organizer of the next year’s Behave edition: Behave 2018, the fifth European Conference on Behaviour and Energy Efficiency shall be held from 5th to 7th September 2018 in Zurich, Switzerland at ZHAW Zurich University of Applied Sciences (cf. www.zhaw.ch/behave)
SUPSI is involved in the EU H2020 project enCOMPASS which will implement and validate an integrated socio-technical approach to behavioural change for energy saving, by developing innovative user-friendly digital tools to make energy consumption data available and understandable for different stakeholders.
At the CISBAT international conference (6-8 September 2017, Lausanne) a poster has been displayed by ZHAW, in which the IMPROVE project has been presented in a wider context “PVopti – hourly based energy balance for building design, Bastian Burger (main author), Monika Hall, University of Applied Sciences and Arts of Northwestern Switzerland, Institute Energy in Building“
The paper “How to improve energy billing information to induce energy savings ? - Insights from
Switzerland” has been submitted and a poster has been presented at BEHAVE 2018, 5th European
Conference on Behaviour and Energy Efficiency, Zurich, 6-7 September 2018.
Fianly the paper “IMPROVE - Unfolding next generation demand-side information (DSI) models” has
been submitted and a presentation has been given during the 20th Status-Seminar «Forschen Für Den
Bau Im Kontext von Energ. Und Umwelt», in Zurich, the 6th September 2018 (Proceedings pp. 260–
274).

194
17 References
AAEG, 2014. Delibera 16 ottobre 2014 501/2014/R/com Bolletta 2.0: criteri per la trasparenza delle bollette per i consumi di elettricità e/o di gas distribuito a mezzo di reti urbane, Autorità per l’energia, elettrica il gas e il sistema idrico, Italy
Abrahamse, W., Steg, L., Vlek, C., Rothengatter, T., 2005. A review of intervention studies aimed at household energy conservation. J. Environ. Psychol. 25, 273–291
Ajzen, I., 1991. The theory of planned behavior. Organ. Behav. Hum. Decis. Process. 50, 179–211
Allcott, H., 2011. Social norms and energy conservation, Journal of public Economics 95.9, 1082-1095
Artho, J, Jenny, A., Karlegger, A., 2012. “Wissenschaftsbeitrag. Energieforschung der Stadt Zürich, Bericht Nr.6, Forschungsprojekt FP 1-4”
Baccini, A., 2010. Statistique Descriptive Multidimensionnelle (pour les nuls). Institut de Mathématiques de Toulouse
Bamberg, S., 2013. “Changing environmentally harmful behaviors: A stage model of self-regulated behavioral change,” J. Environ. Psychol., vol. 34, pp. 151–159
Bernhard, P., Bernhard, M., Blazek, P., 2010. “Umfrage zur Verständlichkeit von Stromrechnungen”
Bundesamt für Energie BFE 2017. Wichtigste Neuerungen im Energierecht ab 2018.
Bundesamt für Statistik Schweiz, “Entwicklung der Internetnutzung in der Schweiz nach Häufigkeit von Oktober 2008 bis März 2016,” Statista - Das Statistik-Portal
Bundesnetzagentur, 2018, “Übersicht Stromnetzbetreiber“
Castri, R., Cellina, F., Kovacs, N., 2017. IMPROVE – Unfolding next generation demand-side information ( DSI ) models chapter 7 – Existing DSI programmes abroad. Final report
Commission for Energy Regulation, 2011a. Smart Metering Information Paper. Electricity Customer Behaviour Trial Findings Report and Appendices, Ireland
Commission for Energy Regulation, 2011b. Smart Metering Information Paper. Gas Customer Behaviour Trial Findings Report and Appendices, Ireland
Danov, S. et. al., 2015. “Empowering customers to save energy by informative billing”
Darby, S., 2006. The Effectiveness of Feedback on Energy Consumption: A Review for Defra of the Literature on Metering , Billing and Direct Displays. Environ. Chang. Inst. Univ. Oxford 22, 1–21
Darnton, A., 2008. Reference report: An Overview of behaviour change models and their uses, Government Social Research Behaviour Change Knowledge Review. Center for Sustainable Development, University of Westminster
https://www.gov.uk/government/uploads/system/uploads/attachment_data/file/498065/Behaviour_change_reference_report_tcm6-9697.pdf
De Young, R., 2000. New Ways to Promote Proenvironmental Behavior: Expanding and Evaluating Motives for Environmentally Responsible Behavior. J. Soc. Issues 56, 509–526
Defra, A. 2006. “An environmental behaviours strategy for Defra,” London
Defra, A. 2008. "Framework for pro-environmental behaviours." Department for Environment, Food and Rural Affairs, London
De Groot, J. I. M., and Steg, L., 2007. “Value Orientations and Environmental Beliefs in Five Countries,” J. Cross. Cult. Psychol., vol. 38, no. 3, pp. 318–332
De Groot, J. I. M. and Steg, L., 2008. “Value Orientations to Explain Beliefs Related to Environmental Significant Behavior,” pp. 330–354,

195
Directive 2009/72/EC of the European Parliament and the Council of 13 July 2009 concerning common rules for the internal market in electricity and repealing directive 2003/54/EC. Directive 2009/73/EC of the European Parliament and the Council of 13 July 2009 concerning common rules for the internal market in natural gas and repealing directive 2003/54/EC
Dromacque, C., Xu S. and Baynes, S., 2013. Case study on innovative smart billing for household consumers. Prepared by VaasaETT for the World Energy Council and ADEME. VasasaETT Global Energy Think Tank, July 15th, 2013.ERGEG (2010) Status Review on Implementation of EC Good Practice Guidance for Billing. ERGEG Status Review. European Regulators Group for Electricity & Gas. Ref: E10-CEM-36-03, 8 September 2010
Dunnhoff, E. and Palm, A., 2016. “Verständlichkeit von Stromrechnungen Ergebnisse einer repräsentativen Verbraucherbefragung und der ergänzenden Auswertung von Stromrechnungen”
Duscha, M.,Dünnhoff, E., 2007. “Innovative Stromrechnungen als Beitrag zur nachhaltigen Transformation des Elektrizitätssystems”
EC 2016. Evaluation of the EU Framework for Metering and Billing of Energy Consumption Accompanying the document Proposal for a Directive of the European Parliament and of the Council amending Directive 2012/27/EU on Energy Efficiency. European Commission Staff Working Document
Ehrhardt-Martinez, A.K., Donnelly, K. a, 2010. Advanced Metering Initiatives and Residential Feedback Programs: A Meta-Review for Household Electricity-Saving Opportunities. Energy 123, 128
EKZ, 2011. “Einfach sichtbar - So wird Storm gespart,” Zurich, pp. 2–4
ElCom, 2014. Weisung 1/2014 der ElCom Transparente und vergleichbare Rechnungsstellung
ElCom, 2015. “Schweizerische Gemeinden und zuständige Stromnetzbetreiber,” Berne
ElCom, 2016, “Schweizerische Gemeinden und zuständige Stromnetzbetreiber,” Berne
Endesa, 2017. «Endesa».
EnergieSchweiz 2016. “Energieeffizienz im Haushalt” 805.902.D
EnG, 2014. SR 730.0, “Vollzugshilfe für die Umsetzung des Eigenverbrauchs nach Art. 7 Abs. 2 bis und Art. 7a Abs. 4”
European Environment Agency, 2013. “Achieving energy efficiency through behaviour change: What does it take ?” Publications Office of the European Union, Luxembourg
EW Höfe, 2008. https://ewh.ch/energieservices/energieberatung “Broschüre Energieberatung,” Freienbach,
Faruqui, A., Sergici, S., Sharif, A., 2010. The impact of informational feedback on energy consumption—A survey of the experimental evidence. Energy, 35(4), 1598-1608
Fischer, C., 2008. Feedback on household electricity consumption: A tool for saving energy? Energy Effic. 1, 79–104
Fischli, C., Staake, T., Stiefmeier, T., Tröster, G., and Fleisch, E., 2011. “Steigerung der Energieeffizienz durch Verbrauchsfeedback bei der Warmwassernutzung,” Zurich
Ford, A., 1990. A method for approximating the value of demand-side information. Energy Syst. policy an Int. Interdiscip. J. 14, 135–152
Foster, B. and Alschuler, E.,2011. The State of the Utility Bill, Research Report Number B111, American Council for an Energy-Efficient Economy, ACEEE
French, J., Blair-Stevens, C., 2005. Social marketing pocket guide. London Natl. Soc. Mark. Cent. Excell
Gallati, M. and Knüsel, P., 2011. “Schlussbericht Nutzerverhalten beim Wohnen“
Gasser, S., 2014. “Revision SIA 380/4 teilprojekt 8: Strombilanzmodell für Wohnbauten“

196
Gatersleben, B., Vlek, C., 1998. Household consumption, quality of life, and environmental impacts: A psychological perspective and empirical study. Green households 141–183
Gellings, C., and Chamberlin, J., 1988. Demand-side management, Boca Raton, FL, USA, CRC Press
Gellings, C.W., 1985. The concept of demand-side management for electric utilities. Proc. IEEE 73, 1468–1470
Heeren, N., Gabathuler, M., Wallbaum, H., Jakob, M., Martius, G., and Gross, N. 2009. “Gebäudeparkmodell SIA Effizienzpfad Energie Dienstleistungs- und Wohngebäude Vorstudie zum Gebäudeparkmodell Schweiz – Grundlagen zur Überarbeitung des SIA Effizienzpfades Energie.”
Hemmes, F., Papyrakis, E., van Beukering, P., 2012. Waste Not, Want Not: How Utilities Can Help Consumers Save Energy. J. Sustain. Dev. 7, 1–16
HM Government, 2005. Securing the future: Delivering UK sustainable development strategy
Holtz-Bacha, C., Kutsch, A., 1999. “PUBLIZISTIK Vierteljahreshefte für Kommunikationsforschung” Publizistik, vol. 2, no. 44
Jones, Rory V., Alba Fuertes, and Kevin J. Lomas. 2015. “The Socio-Economic, Dwelling and Appliance Related Factors Affecting Electricity Consumption in Domestic Buildings.” Renewable and Sustainable Energy Reviews 43 (March): 901–17. https://doi.org/10.1016/j.rser.2014.11.084
Karlin, B., Zinger, J.F., and Rebecca, F., 2015. “The Effects of Feedback on Energy Conservation: A Meta-Analysis” Psycologiocal Bull., vol. 141, no. 6
Klöckner. C. A., 2015. The Psychology of Environmental Communication. Beyond Standard Information Strategies. Palgrave Macmillan,
Kollmuss, A., Agyeman, J., 2002. Mind the Gap: Why do people act environmentally and what are the barriers to pro-environmental behavior? Environ. Educ. Res. 8, 239–260
Laurich, G., and Lamieri, L.,2008. “Strom-Rechnungen: Was will Ihr Kunde lesen?”
Lewin, K., 1951. Field theory in social science: Selected theoretical papers. Harper, New York
Martiskainen, M., 2007. Affecting consumer behaviour on energy demand. Final report to EdF Energy. University of Sussex. Brighton (UK)
Matthies, E., 2005. How can psychologists better put across their knowledge to practioners? Suggesting a new, integrative influence model of pro-environmental everyday behaviour. Umweltpsychologie 9
Monroe, M.C., Andrews, E., Biedenweg, K., 2008. A Framework for Environmental Education Strategies. Appl. Environ. Educ. Commun. 6, 205–216
Moser, R., Eckmanns A., 2017. “Aufruf zur Projekteingabe im Forschungsprogramm „ Energie in Gebäuden “,” Berne
Mühlebach, M., 2012, 1. “Stromeffizienz-Dienstleistungen, Zusammenfassung der wichtigsten Ergebnisse”, ETHZ
Mühlebach, M. , 2012, 2. “Power efficiency services in Switzerland – what motivates utilities to engage?” ETHZ
National Research Council (US), 1984. Improving energy demand analysis. National Academy Press
Neenan, B., 2009. Residential Electricity Use Feedback: A Research Synthesis and Economic Framework. Palo Alto
Nest Labs, 2015. “Energy Savings from the Nest Learning Thermostat: Energy Bill Analysis Results,” Palo Alto,
Office Fédéral de la Statistique, 2017. Perspectives de la formation. Scénarios 2016 - 2025 pour le système de formation
Origin Energy, 2017. “Origin Energy,”

197
Repower, 2017. “Repower - Ihre Stromrechnung im Detail”
Schneiker, J., 2015 .“Case Study: OSCAR energy efficiency web portal,” Munich
Schwartz, S. H., 1992. “Universals in the content and structure of values: Theoretical advances and empirical tests in 20 countries,” Adv. Exp. Soc. Psychol., vol. 25, no. C, pp. 1–65
Schweizersche Agentur für Energieeffizienz, 2005. “www.energybox.ch - Auswertung der Nutzerdatenbank,” Zurich
Serrenho, T., Zangheri, P., and Bertoldi, B. 2016. “Energy Feedback Systems: Evaluation of Meta-Studies on Energy Savings through Feedback.” Website. July 19, 2016. https://publications.europa.eu/en/publication-detail/-/publication/2b02642e-4e3c-11e6-89bd-01aa75ed71a1/language-en
St.Galler Stadtwerke, 2017. “MySGSW,”
Steg, L., Bolderdijk, J. W., Keizer K., and Perlaviciute G., 2014. “An integrated framework for encouraging pro-environmental behaviour: The role of values, situational factors and goals,” J. Environ. Psychol., vol. 38, pp. 104–115
StromVG, 2015. Bundesversammlung der Schweizerischen Eidgenossenschaft, Bundesgesetz über die Stromversorgung (Stromversorgungsgesetz, StromVG)
SurveyMonkey Inc. [WWW Document], San Mateo, California, USA. URL www.surveymonkey.com
Suter, D., 2017. “Development of Enhanced Demand-Side Information (DSI) Models for Utilities” ZHAW
Swiss Federal Office Of Energy, 2017. Energy strategy 2050 after the popular vote. Berne
The R Project for Statistical Computing [WWW Document]. URL www.r-project.org
Torriti, J., 2016. Peak energy demand and demand side response. Routledge
Umwelt Bundsamt, 2016. “Bereitschaft zu klimaschonendem Handeln im Zeitvergleich” [Online]. Available:https://www.umweltbundesamt.de/daten/private-haushalte-konsum/umweltbewusstsein-umweltverhalten#textpart-5
Umweltschulen, 2017. “Lastganganalyse”
UVEK, 2016. B. für E. B. Eigenössisches Departement für Umwelt, Verkehr, Energie und Kommunikation UVEK, Leitfaden Stromkennzeichnung
VSE, 2014. “Handbuch Eigenverbrauchsregelung (HER)”
VSE 2015. “Energiesparen durch Verhaltensänderung, Basiswissen-Dokument”
VSE 2017. “Mitgliederliste VSE”, [Online]. Available: https://www.strom.ch/de/verband/mitglieder/mitgliederliste.html.
Wemyss, D., Castri, R., De Luca, V., Cellina, C., Frick, V., Lobsiger-Kägi, E., Galbani Bianchi, P., Hertach, C., Kuehn, T., Carabias, V., 2016. Keeping up with the Joneses: examining community-level collaborative and competitive game mechanics to enhance household electricity-saving behaviour. In the Proceedings of the 4th European Conference on Behaviour & Energy Efficiency (Behave 2016). Coimbra, Portugal, 8-9 September, 2016
Werke am Zürichsee, 2016. “aktuell - Das Informationsmagazin der Werke am Zürichsee AG,” no. 16, Küssnacht
Wilhite, H., Ling, R., 1995. Measured energy savings from a more informative energy bill. Energy Build. 22, 145–155
Zweifel, U,. 2012. “Energieeffizienz Vorschau 2012, Bericht“

A-1
Appendices

A-2
APPENDIX 1. ONLINE SURVEY FOR SWISS UTILITIES’ PROFILE 3
APPENDIX 2. ENERGY UTILITIES CONTACTED FOR SURVEY (VSE MEMBERS) 9
APPENDIX 3. PROJECT INFORMATION TO PARTICIPATE IN THE SURVEY 10
APPENDIX 4. RESULTS OF THE UTILITIES’ SURVEY FOR PARTICIPANTS 11
APPENDIX 5. LIST OF INDICATORS USED TO ASSESS ENERGY BILLS 15
APPENDIX 6. ONLINE SURVEY FOR FOREIGN UTILITIES 18
APPENDIX 7. FOREIGN UTILITIES CONTACTED TO JOIN THE SURVEY 55
APPENDIX 8. MATRICES OF ASSESSMENT OF ENERGY BILLS 59
APPENDIX 9. CATEGORIES OF THE ANALYSIS TEMPLATE 94
APPENDIX 10. COMPLETED ANALYSIS TEMPLATE OF ASSESSED DSI/DSM MODELS 95
APPENDIX 11. UTILITIES’ INTERVIEW QUESTIONNAIRES (IN GERMAN ONLY) 115
APPENDIX 12. ONLINE SURVEY FOR CONSUMERS’ SATISFACTION ASSESSEMENT 120
APPENDIX 13. IMPROVE PROPOSALS 134
APPENDIX 14. STATISTICAL ANALYSIS REPORT 135
APPENDIX 15. LIST OF UTILITIES CONTACTED BY REGIONS 136
APPENDIX 16. THE QUESTIONNAIRE FOR UTILITIES ON DSI MODELS 142
APPENDIX 17. RESPONSES TO THE QUESTIONNAIRES 154

A-3
Appendix 1. Online survey for Swiss utilities’ profile
Demand side information in Switzerland: Questionnaire for utilities 1. About this questionnaire
To answer the questionnaire will take you about 15 minutes.
This survey only considers the private sector of your company.
If your company supplies more than one energy form (electricity, gas or district heating), please fill in one
separate survey for each energy form supplied. Please click again on the internet link we sent you.
All answers will be treated confidential and anonymous and will not be available to third parties.
2. General information
2.1 About your company
Company name:_________________________________________
Contact person
o Name:____________________________________
o E-Mail:___________________________________
o Phone number:______________________________
2.2 Please choose one energy form by declaring which amount of it your company supplies to households. The following questions will refer to this energy form. 1
Form of energy Amount of energy supplied per year
Electricity GWh/year
Gas GWh/year
District heating GWh/year
2.3 What percentage of meter types do you use at present (percentage of all meters installed, check all that apply)?
Meter type Not available Percentage (%)
Analog meters
Digital meters without remote readout
Digital meters with remote readout
Smart meters23
Others, namely:_______________________________________
1 If your company supplies more than one energy form (electricity, gas or district heating), please fill in one separate survey for each energy form
supplied
2 Only for electricity (0)
3 Smart meters allow two-way communication with utility

A-4
2.4 What meter types do you plan to install in mid-term future (~5 years) for new installation and / or replacement (check all that apply)?
Analog meters
Digital meters (without remote readout
Digital meters with remote readout
Bidirectional meters for buildings with photovoltaic plants4
Smartmeters for buildings with photovoltaic plants (two way communication with utility)5
Smartmeters for buildings without photovoltaic plants (two way communication with utility)6
Others, please specify:_______________________________________
3. Billing practice
3.1 What percentage of households receives information about their energy consumption by the following format (check all that apply)?
Energy Information format Not available Percentage of households (%)
Paper bill by postage
E-Mail (with bill as PDF attached)
E-invoice (directly via e-banking /
posfinance)
Online account (Web portal)
Mobile application
Others, please specify:_______________
3.2 What percentage of households uses the following payment method (check all that apply)?
Payment method Not available Percentage of households (%)
Standard bill (payment slip)
E-Invoice (directly via e-banking /
posfinance)
E-invoice with QR-Code
Direct debit system (LSV)
Pre-paid meter
Pre-paid online service
Others, please specifiy:_______________
3.3 What percentage of households receives the following billing plan?
Billing plan Characteristics Not available Percentage of
households (%)
4 Only for electricity (2.2)
5 Only for electricity (0)
6 Only for electricity (0)

A-5
Standard bill =regular charging frequency of
actual consumption
Payment on account =regular charging frequency of
estimated consumption by means of
advance payments and an annual
adjustment balance
Pre-paid7 =irregular charging frequency,
depending on actual consumption,
paid as-you-go
Other (please,
specify):
_______________________
3.4 What percentage of households receives billing information in the following frequency?
Billing frequency Monthly Quarterly Biannual Yearly Irregular Other
Percentage of
households (%)
3.5 What information do you display about the energy mix of the energy supplied (check all that apply)?
Information about energy mix according to legal requirements
Information about energy mix (e.g. part of water power, part of solar power, …)8
Information about energy mix (e.g. part of natural gas, part of biogas, …)9
Information about energy mix (e.g. part of waste combustion, …)10
Information about energy mix only if a special energy product (e.g. naturemade star) is demanded11
Information about energy mix only if a special energy product (e.g. biogas) is demanded12
Information about energy mix only if a special energy product (e.g. 100% renewable) is demanded13
Change of energy mix if another energy product would be demanded
Others, please specify:______________________________________
3.6 Do you display comparative energy consumption values (check all that apply)?
No
Actual consumption compared to own consumption of previous periods
to previous year/years
to previous months
Comparison to historical mean values (e.g. mean swiss consumption for households)
Comparison to more specific mean values (e.g. mean consumption of households in the neighborhood, to
similar building types like single or multifamily buildings, …)
Others, please specify:________________________________________
7 A prepaid charging system that gives customers the faculty to decide how much energy to purchase.
8 Only for electricity (0)
9 Only for gas (0)
10 Only for district heating (0)
11 Only for electricity (0)
12 Only for gas (0)
13 Only for district heating

A-6
3.7 Do you display the energy saving potential (check all that apply)?
No energy saving potential display
Energy saving potential (percentage of consumption or kWh) display according
to general potential (e.g. by replacing bulbs with LED more than 80% of energy used can be saved, …)14
to general potential (e.g. reducing room temperature by one degree in winter time saves about 6% of
energy for heating, …)15
to mean values for consumption (e.g. mean swiss consumption for households)
to more specific mean values (e.g. mean consumption of households in the neighborhood, to similar
building types like single or multifamily buildings, …)
others, please specify;______________
Display of the amount of energy that could be saved
Display of cost that could be saved
Display of environmental impacts that could be avoided
Others, please specify:____________________________________
3.8 Do you display information about the environmental impact (check all that apply)?
No
Display of environmental impact of consumption (e.g. CO2-emission, …)
Display of reduction of environmental impact if a specific energy product is supplied (e.g. reduction of CO2-
Emission if electricity "nature made star" instead of "nature made basic" is supplied)16
Display of reduction of environmental impact if a specific energy product is supplied (e.g. reduction of CO2-
Emission if biogas instead of natural gas is supplied)17
Display of reduction of environmental impact if a specific energy product is supplied (e.g. reduction of CO2-
Emission if district heating 100% renewable instead of district heating basic is supplied)18
Others, please specify:_____________________________________
3.9 Do you give tips to save energy with the bill (check all that apply)?
No
Yes, tips are provided in the bill (or as attachment to the bill)
Yes, tips are provided in the online account
14 Only for electricity (0)
15 Only for gas AND district heating (0)
16 Only for electricity (0)
17 Only for gas (0)
18 Only for district heating (0)

A-7
3.10 Do you explain the displayed values (check all that apply)?
No
Explanations are added directly to the bill
Explanations are available online
Explanations are available only by personal contact (E-Mail address or phone-number)
Other (please, specify): ____________________________________________
3.11 Regarding the information provided, what type of display forms do you use? (check all that apply)?
Type of information Numeric or text display Graphic display
Own consumption
Cost
Energy mix
Comparative values
Saving potential
Environmental impact
3.12 Please specify the number of pages of the customer's bill:19
One page (inkl. Attachments and payment slips)
Two pages (inkl. Attachments and payment slips)
If more than 2 pages, please type in the number:___________
How many pages are attachments and payment slips?____
3.12.1 Please mark on which page of the invoice you display information (check all that apply)20:
Information21 Displayed on
Page 1 Page 2 Page 3 or later
Own consumption
Cost
Production mix
Comparative values
Saving potential
Comparative values for costs
Environmental impact
Tips to save energy
19 Only for printed bill or bill as PDF (0), for payment on account: we look at the annual adjustment balance
20 Only if two or more than two pages is ticked in (0)
21 Row displayed in the table correspond to the choice 0 -0: if no is ticked, the value will not be displayed in the table

A-8
3.13 Do you use information about the customer (additional to metering, e.g. number of persons in the household, living space, type of building services, …) to display more specific / personalized information?
No
Yes
3.13.1 How do you obtain this additional information?22
They must be given by customer
They can be given by customer
They are available from other sources, namely:___________
3.13.2 Do the customers have to agree to use this additional information for further purposes? 23
Yes
No
3.14 Do you display more information in the online account than on the bill itself?
No
Yes, there is additional information, please specify:________________
3.15 Do you provide supplementary information about consumption in addition to the bill (check all that apply)?
No
General (not personalized) information is provided (e.g. tips how to save energy)
Personalized feedback (concerning own consumption or energy demanded) is provided
General information with printed media is provided (e.g. newsletter)
Information is provided by e-mail
Information is provided on the utility’s website
Information is provided on other ways, namely:________________
4. Miscellaneous
4.1 If possible, please send a copy of an anonymized bill
4.2 Feedback (check all that apply)?
Please send me the analysis of this questionnaire.
Please send me the link to the final report of the IMPROVE project.
You may contact me if there are further questions on my answers.
Thank you for your participation!
22 Only if Yes in 0
23 Only if Yes in 0
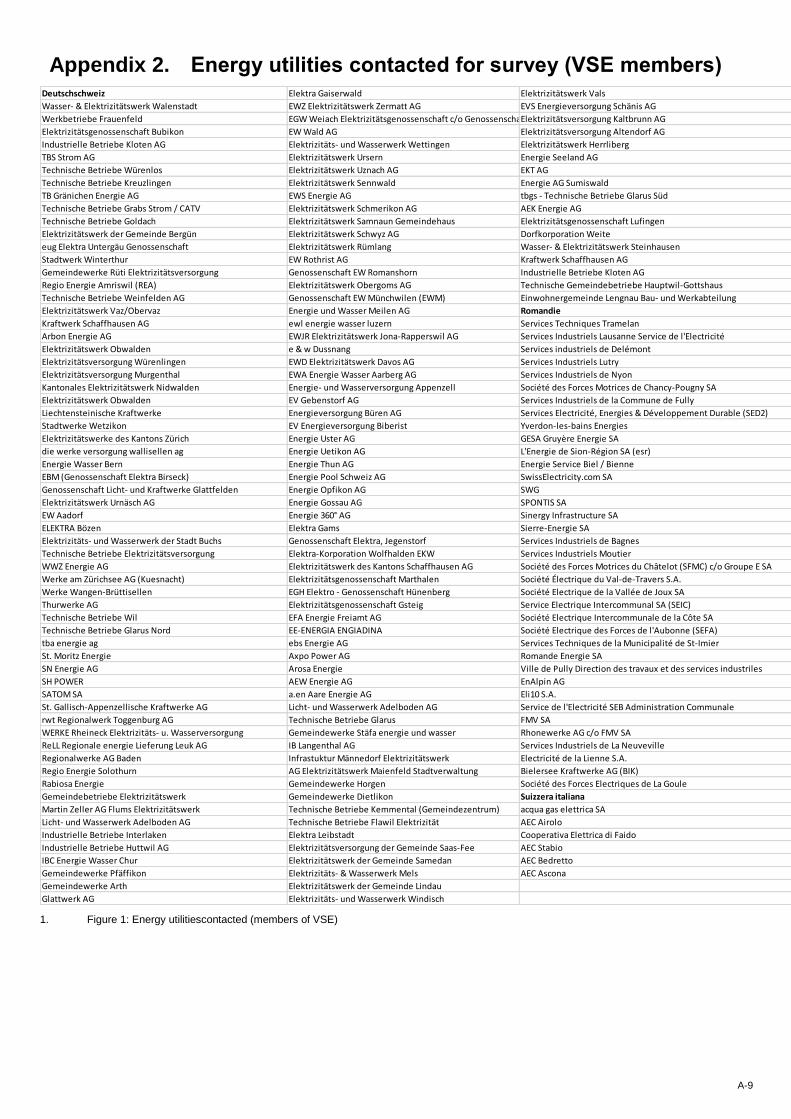
A-9
Appendix 2. Energy utilities contacted for survey (VSE members)
1. Figure 1: Energy utilitiescontacted (members of VSE)
Deutschschweiz Elektra Gaiserwald Elektrizitätswerk Vals
Wasser- & Elektrizitätswerk Walenstadt EWZ Elektrizitätswerk Zermatt AG EVS Energieversorgung Schänis AG
Werkbetriebe Frauenfeld EGW Weiach Elektrizitätsgenossenschaft c/o Genossenschaft Licht- und Kraftwerke GlattfeldenElektrizitätsversorgung Kaltbrunn AG
Elektrizitätsgenossenschaft Bubikon EW Wald AG Elektrizitätsversorgung Altendorf AG
Industrielle Betriebe Kloten AG Elektrizitäts- und Wasserwerk Wettingen Elektrizitätswerk Herrliberg
TBS Strom AG Elektrizitätswerk Ursern Energie Seeland AG
Technische Betriebe Würenlos Elektrizitätswerk Uznach AG EKT AG
Technische Betriebe Kreuzlingen Elektrizitätswerk Sennwald Energie AG Sumiswald
TB Gränichen Energie AG EWS Energie AG tbgs - Technische Betriebe Glarus Süd
Technische Betriebe Grabs Strom / CATV Elektrizitätswerk Schmerikon AG AEK Energie AG
Technische Betriebe Goldach Elektrizitätswerk Samnaun Gemeindehaus Elektrizitätsgenossenschaft Lufingen
Elektrizitätswerk der Gemeinde Bergün Elektrizitätswerk Schwyz AG Dorfkorporation Weite
eug Elektra Untergäu Genossenschaft Elektrizitätswerk Rümlang Wasser- & Elektrizitätswerk Steinhausen
Stadtwerk Winterthur EW Rothrist AG Kraftwerk Schaffhausen AG
Gemeindewerke Rüti Elektrizitätsversorgung Genossenschaft EW Romanshorn Industrielle Betriebe Kloten AG
Regio Energie Amriswil (REA) Elektrizitätswerk Obergoms AG Technische Gemeindebetriebe Hauptwil-Gottshaus
Technische Betriebe Weinfelden AG Genossenschaft EW Münchwilen (EWM) Einwohnergemeinde Lengnau Bau- und Werkabteilung
Elektrizitätswerk Vaz/Obervaz Energie und Wasser Meilen AG Romandie
Kraftwerk Schaffhausen AG ewl energie wasser luzern Services Techniques Tramelan
Arbon Energie AG EWJR Elektrizitätswerk Jona-Rapperswil AG Services Industriels Lausanne Service de l'Electricité
Elektrizitätswerk Obwalden e & w Dussnang Services industriels de Delémont
Elektrizitätsversorgung Würenlingen EWD Elektrizitätswerk Davos AG Services Industriels Lutry
Elektrizitätsversorgung Murgenthal EWA Energie Wasser Aarberg AG Services Industriels de Nyon
Kantonales Elektrizitätswerk Nidwalden Energie- und Wasserversorgung Appenzell Société des Forces Motrices de Chancy-Pougny SA
Elektrizitätswerk Obwalden EV Gebenstorf AG Services Industriels de la Commune de Fully
Liechtensteinische Kraftwerke Energieversorgung Büren AG Services Electricité, Energies & Développement Durable (SED2)
Stadtwerke Wetzikon EV Energieversorgung Biberist Yverdon-les-bains Energies
Elektrizitätswerke des Kantons Zürich Energie Uster AG GESA Gruyère Energie SA
die werke versorgung wallisellen ag Energie Uetikon AG L'Energie de Sion-Région SA (esr)
Energie Wasser Bern Energie Thun AG Energie Service Biel / Bienne
EBM (Genossenschaft Elektra Birseck) Energie Pool Schweiz AG SwissElectricity.com SA
Genossenschaft Licht- und Kraftwerke Glattfelden Energie Opfikon AG SWG
Elektrizitätswerk Urnäsch AG Energie Gossau AG SPONTIS SA
EW Aadorf Energie 360° AG Sinergy Infrastructure SA
ELEKTRA Bözen Elektra Gams Sierre-Energie SA
Elektrizitäts- und Wasserwerk der Stadt Buchs Genossenschaft Elektra, Jegenstorf Services Industriels de Bagnes
Technische Betriebe Elektrizitätsversorgung Elektra-Korporation Wolfhalden EKW Services Industriels Moutier
WWZ Energie AG Elektrizitätswerk des Kantons Schaffhausen AG Société des Forces Motrices du Châtelot (SFMC) c/o Groupe E SA
Werke am Zürichsee AG (Kuesnacht) Elektrizitätsgenossenschaft Marthalen Société Électrique du Val-de-Travers S.A.
Werke Wangen-Brüttisellen EGH Elektro - Genossenschaft Hünenberg Société Electrique de la Vallée de Joux SA
Thurwerke AG Elektrizitätsgenossenschaft Gsteig Service Electrique Intercommunal SA (SEIC)
Technische Betriebe Wil EFA Energie Freiamt AG Société Electrique Intercommunale de la Côte SA
Technische Betriebe Glarus Nord EE-ENERGIA ENGIADINA Société Electrique des Forces de l'Aubonne (SEFA)
tba energie ag ebs Energie AG Services Techniques de la Municipalité de St-Imier
St. Moritz Energie Axpo Power AG Romande Energie SA
SN Energie AG Arosa Energie Ville de Pully Direction des travaux et des services industriles
SH POWER AEW Energie AG EnAlpin AG
SATOM SA a.en Aare Energie AG Eli10 S.A.
St. Gallisch-Appenzellische Kraftwerke AG Licht- und Wasserwerk Adelboden AG Service de l'Electricité SEB Administration Communale
rwt Regionalwerk Toggenburg AG Technische Betriebe Glarus FMV SA
WERKE Rheineck Elektrizitäts- u. Wasserversorgung Gemeindewerke Stäfa energie und wasser Rhonewerke AG c/o FMV SA
ReLL Regionale energie Lieferung Leuk AG IB Langenthal AG Services Industriels de La Neuveville
Regionalwerke AG Baden Infrastuktur Männedorf Elektrizitätswerk Electricité de la Lienne S.A.
Regio Energie Solothurn AG Elektrizitätswerk Maienfeld Stadtverwaltung Bielersee Kraftwerke AG (BIK)
Rabiosa Energie Gemeindewerke Horgen Société des Forces Electriques de La Goule
Gemeindebetriebe Elektrizitätswerk Gemeindewerke Dietlikon Suizzera italiana
Martin Zeller AG Flums Elektrizitätswerk Technische Betriebe Kemmental (Gemeindezentrum) acqua gas elettrica SA
Licht- und Wasserwerk Adelboden AG Technische Betriebe Flawil Elektrizität AEC Airolo
Industrielle Betriebe Interlaken Elektra Leibstadt Cooperativa Elettrica di Faido
Industrielle Betriebe Huttwil AG Elektrizitätsversorgung der Gemeinde Saas-Fee AEC Stabio
IBC Energie Wasser Chur Elektrizitätswerk der Gemeinde Samedan AEC Bedretto
Gemeindewerke Pfäffikon Elektrizitäts- & Wasserwerk Mels AEC Ascona
Gemeindewerke Arth Elektrizitätswerk der Gemeinde Lindau
Glattwerk AG Elektrizitäts- und Wasserwerk Windisch

A-10
Appendix 3. Project information to participate in the survey

A-11
Appendix 4. Results of the utilities’ survey for participants

A-12

A-13

A-14

A-15
Appendix 5. List of indicators used to assess energy bills
A) Electricity
The full list of indicators used to assess electricity (E) bills.
TRANSPARENT ACCOUNTING
E01. Meter reading type (estimated or actual) E02. Total amount due E03. Disaggregation of billing costs (energy usage, taxes, network charges etc.) E04. Energy usage in kilowatt-hour [kWh] E05. Unit rate of energy [costs/kWh] E06. Visual chart breakdown of billing costs into its different components (retailer, state taxes,
distribution system operators, etc.) E07. Other (specify)
COMPARATIVE STATISTICS
E08. Average daily energy use and costs (over the given billing period) E09. Graph of energy use over billing period E10. Graph of historical energy use over past 12-14 months E11. a - Current energy usage compared to previous month E11. b - Current energy usage compared to previous year (same period) E12. Current energy usage compared to other similar households E13. Current energy usage compared to average consumption of similar households in the
same area E14. Energy consumption pattern variation according to different seasons E15. Correlation between energy consumption and temperature/weather conditions over billing
period E16. Average account of electricity use by major appliances E17. Household specific account of electricity use by major appliances E18. Other (specify)
ECO-FEEDBACK ON CLIMATE AND ENVIRONMENTAL IMPACT
E19. Breakdown of fuel mix used as energy sources for the given bill E20. Alternative metrics (e.g. CO2 equivalent emissions, carbon footprint or other eco-feedback)
based on current billing period E21. Other (specify)
TIPS & ADVICE
E22. One-size-fits-all, general energy-saving tips and advices E23. Customized, actionable insights to manage energy costs & consumption E24. Advice on time-of-day tariffs or other dynamic tariffs (e.g. cost of running appliances at
different times of day) E25. Explanation of key terms (e.g. kWh, m3, specific surcharges etc.) E26. Contact info on customer service offering customized energy-efficiency specific
consultancy E27. Other (specify)
INNOVATION
E28. Innovative approaches
NOTES AND COMMENTS
E29. General comments

A-16
B) Gas
The full list of indicators used to assess gas (G) bills.
TRANSPARENT ACCOUNTING
DH1. Meter reading type (estimated or actual) DH2. Total amount due DH3. Disaggregation of billing costs (energy usage, taxes, network charges etc.) DH4. Energy usage in cubic meter [m3] or kilowatt-hour [kWh] DH5. Unit rate of energy [costs/kWh] DH6. Visual chart breakdown of billing costs into its different components (retailer, state taxes,
distribution system operators, etc.) DH7. Other (specify)
COMPARATIVE STATISTICS
DH8. Average daily energy use and costs (over the given billing period) DH9. Graph of energy use over billing period DH10. Graph of historical energy use over past 12-14 months DH11. a - Current energy usage compared to previous month G11. b - Current energy usage compared to previous year (same period) G12. Current energy usage compared to other similar households G13. Current energy usage compared to average consumption of similar households in the
same area G14. Energy consumption pattern variation according to different seasons G15. Correlation between energy consumption and temperature/weather conditions over billing
period G16. Other (specify)
ECO-FEEDBACK ON CLIMATE AND ENVIRONMENTAL IMPACT
G17. Alternative metrics (e.g. CO2 equivalent emissions, carbon footprint or other eco-feedback) based on current billing period
G18. Other (specify)
TIPS & ADVICE
G19. One-size-fits-all, general energy-saving tips and advices G20. Customized, actionable insights to manage energy costs & consumption G21. Advice on time-of-day tariffs or other dynamic tariffs G22. Explanation of key terms (e.g. kWh, m3, specific surcharges etc.) G23. Contact info on customer service offering customized energy-efficiency specific
consultancy G24. Other (specify)
INNOVATION
G25. Innovative approaches
NOTES AND COMMENTS
G26. General comments

A-17
C) District Heating
The full list of indicators used to assess district heating (DH) bills.
TRANSPARENT ACCOUNTING
DH1. Meter reading type (estimated or actual) DH2. Total amount due DH3. Disaggregation of billing costs (energy usage, taxes, network charges etc.) DH4. Energy usage in cubic meter [m3] or kilowatt-hour [kWh] DH5. Unit rate of energy [costs/kWh] DH6. Visual chart breakdown of billing costs into its different components (retailer, state taxes,
distribution system operators, etc.) DH7. Other (specify)
COMPARATIVE STATISTICS
DH8. Average daily energy use and costs (over the given billing period) DH9. Graph of energy use over billing period DH10. Graph of historical energy use over past 12-14 months DH11. a - Current energy usage compared to previous month DH11. b - Current energy usage compared to previous year (same period) DH12. Current energy usage compared to other similar households DH13. Current energy usage compared to average consumption of similar households in the
same area DH14. Energy consumption pattern variation according to different seasons DH15. Correlation between energy consumption and temperature/weather conditions over billing
period DH16. Other (specify)
ECO-FEEDBACK ON CLIMATE AND ENVIRONMENTAL IMPACT
DH17. Alternative metrics (e.g. CO2 equivalent emissions, carbon footprint or other eco-feedback) based on current billing period
DH18. Other (specify)
TIPS & ADVICE
DH19. One-size-fits-all, general energy-saving tips and advices DH20. Customized, actionable insights to manage energy costs & consumption DH21. Advice on time-of-day tariffs or other dynamic tariffs DH22. Explanation of key terms (e.g. kWh, m3, specific surcharges etc.) DH23. Contact info on customer service offering customized energy-efficiency specific
consultancy DH24. Other (specify)
INNOVATION
DH25. Innovative approaches
NOTES AND COMMENTS
DH26. General comments

A-18
Appendix 6. Online survey for foreign utilities
A) THE RESIDENTIAL ELECTRICITY BILL
This survey is part of a research project called “IMPROVE: Unfolding next generation demand-side information models”, funded by the Swiss Federal Office for Energy (SFOE) in collaboration with four Universities of Applied Sciences from Switzerland (HES-SO, FHNW, SUPSI and ZHAW).
The aim of the survey is to capture the current demand-side information (DSI) models used by energy utilities worldwide to enhance the electricity bill and to provide better indirect feedback to residential customers .
We would be glad if you could support us by answering the following questions and, if possible, attaching an anonymized copy of a current residential paper bill. Answering this survey will take around 20 minutes.
Deadline: 30th of June 2017 .
Thank you for your collaboration!
For any queries, please, contact [email protected] or [email protected]
Institute of Applied Sustainability to the Built Environment ISAAC - Department for
Environment Constructions and Design
University of Applied Sciences and Arts of Southern Switzerland
Campus Trevano
CH-6952 Canobbio (TI)
Switzerland
www.supsi.ch/isaac
There are 34 questions in this survey

A-19
GENERAL INFORMATION
1 [11]Utility name
Please write your answer here:
2 [12] Address / Location
Please write your answer here:
4 [14] Contact person
Please write your answer here:
5 [15] E-mail address
Please write your answer here:
3 [13] Country
Please write your answer here:

A-20
7 [22] What percentage of your households receives information about their energy consumption the following formats (may total more than 100%)? Please write your answer(s) here:
Paper bill
Electronic bill
Web portal
Smartphone application
In-Home Display
Pre-paid meter
Other (please, specify type and
percentage):
INFORMATION ON ELECTRICITY CONSUMPTION
Please write your answer here:
utility 6 [21] Total number of residential electricity customers served by your

A-21

A-22
8 [31] What percentage of your households receives the following billing plan ?
Please write your answer(s) here:
Standard
(regular charging frequency of estimated
or actual consumption)
Balanced or leveled
(regular charging frequency of a fixed
payment amount)
Pre-paid
(irregular charging frequency, depending
on actual consumption, paid as-you-go)
Other (please, specify):
ELECTRICITY BILLING PLAN
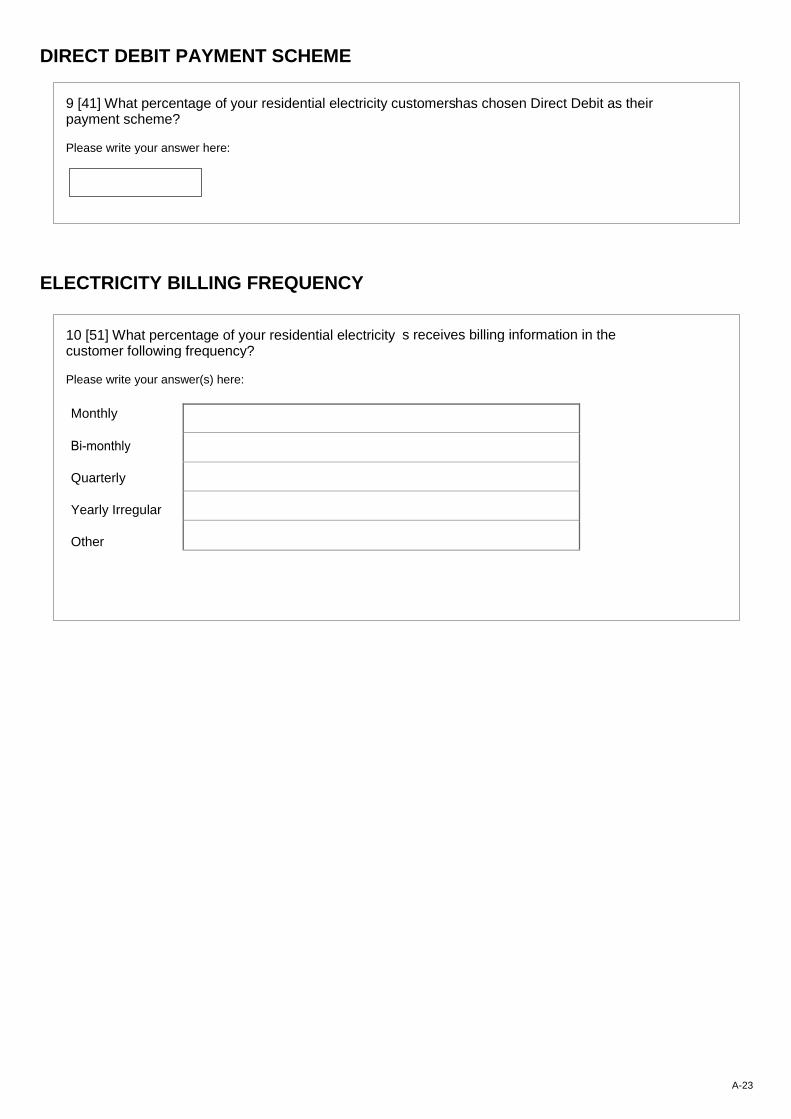
A-23
10 [51] What percentage of your residential electricity customer following frequency?
s receives billing information in the
Please write your answer(s) here:
Monthly
Quarterly
Yearly Irregular
Other
DIRECT DEBIT PAYMENT SCHEME
ELECTRICITY BILLING FREQUENCY
Please write your answer here:
has chosen Direct Debit as their 9 [41] What percentage of your residential electricity customers payment scheme?

A-24
FEEDBACK TYPE USED ON THE PAPER OR ELECTRONIC BILL

A-25
16 [62] Please upload an anonymized copy of your current residen tial customer paper billor indicate a link to
download it.
Kindly attach the aforementioned documents along with the survey
Please write your answer here:
ere we can download it: 17 [63]In case no upload is possible, please indicate a link wh

A-26
SMART HOME DEVICES & FUNCTIONALITIES FOR ELECTRICITY CUSTOMERS
Please write your answer here:
omers do you have access to smart 18 [71] For what percentage of your residential electricity cust metering data?
Web portals / Interactive online tools
Mobile phone applications
Traditional In-Home Display (IHD)
Prepayment In-Home Display (IHD)
Remote temperature control system (smart thermostats)
Remote appliances control system (smart plugs)
Remote lighting control system
Solar energy production control system
Service promoted by incentives
Service on payment Service for free No
Please choose the appropriate response for each item:
additional retail- and consumer- ta (check all that apply)?
19 [72]Where applicable, are you offering one or more of these friendly functionalities or devices, based on smart-metering da
20 [721] Other , please, specify:
Please write your answer here:

A-27
OTHER INNOVATIVE PROGRAMMES FOR ELECTRICITY CUST OMERS
21 [81]
Is your utility currently running (or has terminated or is planning in the near future) any innovative pilot
project or service to engage and support residential customers in energy-saving actions at home?
Please choose all that apply:
Information/ Education campaigns
Gamified energy-saving programmes (e.g. utility-sponsored energy competitions for customers, either
individually or on teams; games that employ real-time granular data on player’s energy use as
feedback, quizzes, etc.)
Customer fidelity programmes (points and prizes)
Other (please, specify):
Please choose only one of the following:
Yes
No
23 [83]
May we contact a reference person for a follow-up in this regards ?
24 [831] Contact person
Only answer this question if the following conditions are met:
Answer was 'Yes' at question '23 [83]' (May we contact a reference person for a follow-up in this regards? )
Please write your answer here:
22 [82] Please, provide the name of the most relevant initiative(s) and a link to access related information:
Please write your answer(s) here:
Name of initiative (1):
Name of initiative (2):
Link (2)
Link (1)

A-28
BILL DESIGN EVALUATION
25 [832] E-mail address
Only answer this question if the following conditions are met:
Answer was 'Yes' at question '23 [83]' (May we contact a reference person for a follow-up in this regards? )
Please write your answer here:
Only answer this question if the following conditions are met:
Answer was 'Yes' at question '23 [83]' (May we contact a reference person for a follow-up in this regards? )
Please write your answer here:
26 [833] Phone (please insert phone number in format "country code, prefix and phone number")
Please choose only one of the following:
Yes
No
27 [91] Has your utility conducted research addressing enhanced billing and user-friendly bill design related to electricity bills in the last 5 years?
28 [92]Did this involve customer participation / feedback?
Only answer this question if the following conditions are met:
Answer was 'Yes' at question '27 [91]' (Has your utility conducted research addressing enhanced billing and user-friendly bill design related to electricity bills in the last 5 years? )
Please choose only one of the following:
Yes
No

A-29
Only answer this question if the following conditions are met:
Answer was 'Yes' at question '27 [91]' (Has your utility conducted research addressing enhanced billing and user-friendly bill design related to electricity bills in the last 5 years? )
Please write your answer here:
: 30 [94] Please outline briefly the evaluation research conducted
Only answer this question if the following conditions are met:
Answer was 'Yes' at question '27 [91]' (Has your utility conducted research addressing enhanced billing and user-friendly bill design related to electricity bills in the last 5 years? )
Please choose only one of the following:
Yes
No
, in terms of energy savings
29 [93]
Has your utility performed analyses on the results you obtained
produced by enhanced billing and user-friendly bill design?
31 [95] May we contact you for follow-up in this regards?
Only answer this question if the following conditions are met:
Answer was 'Yes' at question '27 [91]' (Has your utility conducted research addressing enhanced billing and user-friendly bill design related to electricity bills in the last 5 years? )
Please choose only one of the following:
Yes
No
32 [951] Name
Only answer this question if the following conditions are met:
Answer was 'Yes' at question '31 [95]' (May we contact you for follow-up in this regards?)
Please write your answer here:

A-30
Only answer this question if the following conditions are met:
Answer was 'Yes' at question '31 [95]' (May we contact you for follow-up in this regards?)
Please write your answer here:
Please write your answer here:
34 [953] Phone (please insert phone number in format "country code, prefix and phone number")
33 [952] E-mail address
Only answer this question if the following conditions are met:
Answer was 'Yes' at question '31 [95]' (May we contact you for follow-up in this regards?)
Please write your answer here:

A-31
B) THE RESIDENTIAL GAS BILL
This survey is part of a research project called “IMPROVE: Unfolding next generation demand-side information models”, funded by the Swiss Federal Office for Energy (SFOE) in collaboration with four Universities of Applied Sciences from Switzerland (HES-SO,
FHNW, SUPSI and ZHAW). The aim of the survey is to capture the current demand-side information (DSI) models used by energy utilities abroad to enhance the gas bill and to provide better indirect feedback to residential customers .
We would be glad if you could support us by answering the following questions and, if possible, attaching an anonymized copy of a current residential paper bill. Answering this survey will take around 20 minutes.
Deadline: 30th of June 2017 .
Thank you for your collaboration!
For any queries, please, contact [email protected] or [email protected]
Institute of Applied Sustainability to the Built Environment - ISAAC
Department for Environment Constructions and Design
University of Applied Sciences and Arts of Southern Switzerland
Campus Trevano
CH-6952 Canobbio (TI)
Switzerland
www.supsi.ch/isaac
There are 34 questions in this survey

A-32
GENERAL INFORMATION
3 [13] Country
Please write your answer here:
1 [11]Utility name
Please write your answer here:
2 [12] Address / Location
Please write your answer here:
4 [14] Contact person
Please write your answer here:
5 [15] E-mail address
Controllare il formato della risposta.
Please write your answer here:

A-33
7 [22] What percentage of your residential gas customers receives information about their energy
use in the following formats (may total more than 100%)?
Please write your answer(s) here:
Paper bill
Electronic bill
Web portal
Smartphone application
In-Home Display
Pre-paid meter
Other (please, specify type and percentage):
INFORMATION ON GAS CONSUMPTION
6 [21] Total number of residential gas customers served by your utility
Please write your answer here:

A-34
8 [31]What percentage of your residential gas customers receives the following billing plan?
Please write your answer(s) here:
Standard
(regular charging frequency of estimated
or actual consumption)
Balanced or leveled
(regular charging frequency of a fixed
payment amount)
Pre-paid
(irregular charging frequency, depending
on actual consumption, paid as-you-go)
Other (please, specify):
GAS BILLING PLAN

A-35
10 [51] What percentage of your residential gas customers following frequency?
receives billing information in the
Please write your answer(s) here:
Monthly
Quarterly
Yearly
Irregular
Other
DIRECT DEBIT PAYMENT SCHEME
GAS BILLING FREQUENCY
Please write your answer here:
en Direct Debit as their payment 9 [41] What percentage of your residential gascustomers has chos scheme?

A-36
GAS BILLING FEEDBACK TYPE USED ON THE PAPER OR ELECTRONIC BILL

A-37
16 [62] Please upload an anonymized copy of your current residential customerpaper billor indicate a link to
download it.
Kindly attach the aforementioned documents along with the survey
13 [6123]
Current energy usage compared to:
Only answer this question if the following conditions are met:
Answer was at question '12 [612]' ( Which of the following COMPARATIVE STATISTICS do you currently provide on your residential customer gas bill? )
Please choose all that apply:
Previous month
Previous year (same period)
14 [613]
Which of the following features on ENVIRONMENT AL IMPACT do you currently provide on your
residential customer gas bill?
Please choose all that apply:
Alternative metrics (e.g. CO2 equivalent emissions, carbon footprint or other eco-feedback) based on current
billing period
Other (please, specify)::
Please choose all that apply:
One-size-fits-all, general energy-saving tips and advices
Customized, actionable insights to manage energy costs & consumption
Advice on time-of-day tariffs or other dynamic tariffs (e.g. cost of running appliances at different times of day)
Explanation of key terms (e.g. kWh, m3, specific surcharges etc.)
Contact info on customer service offering customized energy-efficiency specific consultancy
Other (please, specify):
n your residential customer gas
15 [614]
Which of the following TIPS & ADVICE do you currently provide o
bill?
Please write your answer here:
17 [63] In case no upload is possible, please indicate a link wh ere we can download it:

A-38
SMART HOME DEVICES & FUNCTIONALITIES FOR GAS COSTUMERS
Please write your answer here:
you have access to smart 18 [71] For what percentage of your residential gas customers do metering data?
Web portals / Interactive online tools
Mobile phone applications
Traditional In-Home Display (IHD)
Prepayment In-Home Display (IHD)
Remote temperature control system (smart thermostats)
Service promoted by incentives
Service on payment Service for free No
19 [72]Where applicable, are you deploying smart metering toget her with one or more of these additional retail- and consumer-friendly functionalities (check all that apply)?
Please choose the appropriate response for each item:
20 [721] Other, please, specify:
Please write your answer here:

A-39
22 [82] Please, provide the name of the most relevant initiative information:
(s) and a link to access related
Please write your answer(s) here:
Name of initiative (1):
Link (1)
Name of initiative (2):
Link (2)
OTHER INNOVATIVE PROGRAMMES FOR GAS CUSTOMERS
21 [81] Is your utility currently running (or has terminated or is planning in the near future) any
innovative pilot project or service to engage and support resid ential gas customers in energy- saving
actions at home?
Please choose all that apply:
Information/ Education campaigns
Gamified energy-saving programmes (e.g. utility-sponsored energy competitions for customers, either
individually or on teams; games that employ real-time granular data on player’s energy use as
feedback, quizzes, etc.)
Customer fidelity programmes (points and prizes)
Other (please, specify):
Please choose only one of the following:
Yes
No
23 [83]
May we contact a reference person for a follow-up in this regards ?
24 [831] Contact person
Only answer this question if the following conditions are met:
Answer was 'Yes' at question '23 [83]' ( May we contact a reference person for a follow-up in this regards? )
Please write your answer here:

A-40
BILL DESIGN EVALUATION
25 [832] E-mail address
Only answer this question if the following conditions are met:
Answer was 'Yes' at question '23 [83]' ( May we contact a reference person for a follow-up in this regards? )
Controllare il formato della risposta.
Please write your answer here:
Only answer this question if the following conditions are met:
Answer was 'Yes' at question '23 [83]' (May we contact a reference person for a follow-up in this regards? )
Please write your answer here:
de, prefix and phone number") 26 [833] Phone (please insert phone number in format "country co
Please choose only one of the following:
Yes
No
billing and user-friendly bill design
27 [91]
Has your utility conducted research addressing enhanced
related to gas bills in the last 5 years?
28 [92] Did this involve customer participation / feedback?
Only answer this question if the following conditions are met:
Answer was 'Yes' at question '27 [91]' ( Has your utility conducted research addressing enhanced billing and user-friendly bill design related to gas bills in the last 5 years? )
Please choose only one of the following:
Yes
No

A-41
Only answer this question if the following conditions are met:
Answer was 'Yes' at question '27 [91]' ( Has your utility conducted research addressing enhanced billing and user-friendly bill design related to gas bills in the last 5 years? )
Please write your answer here:
: 30 [94] Please outline briefly the evaluation research conducted
Only answer this question if the following conditions are met:
Answer was 'Yes' at question '27 [91]' ( Has your utility conducted research addressing enhanced billing and user-friendly bill design related to gas bills in the last 5 years? )
Please choose only one of the following:
Yes
No
, in terms of energy savings
29 [93]
Has your utility performed analyses on the results you obtained
produced by enhanced billing and user-friendly bill design?
31 [95]
May we contact you for follow-up in this regards?
Only answer this question if the following conditions are met:
Answer was 'Yes' at question '27 [91]' ( Has your utility conducted research addressing enhanced billing and user-friendly bill design related to gas bills in the last 5 years? )
Please choose only one of the following:
Yes
No

A-42
Thank you for your collaboration!
For any queries, please, contact [email protected] or [email protected]
Institute of Applied Sustainability to the Built Environment - ISAAC
Department for Environment Constructions and Design
University of Applied Sciences and Arts of Southern Switzerland
Campus Trevano
CH-6952 Canobbio (TI)
Switzerland
www.supsi.ch/isaac
31/08/2017 – 00:00
Submit your survey. Thank you for completing this survey
Only answer this question if the following conditions are met:
Answer was 'Yes' at question '31 [95]' (May we contact you for follow-up in this regards? )
Please write your answer here:
de, prefix and phone number") 34 [953] Phone (please insert phone number in format "country co
32 [951] Name
Only answer this question if the following conditions are met:
Answer was 'Yes' at question '31 [95]' (May we contact you for follow-up in this regards? )
Please write your answer here:

A-43
C) THE RESIDENTIAL DISTRICT HEATING BILL
This survey is part of a research project called “IMPROVE: Unfolding next generation demand-side information models”, funded by the Swiss Federal Office for Energy (SFOE) in collaboration with four Universities of Applied Sciences from Switzerland (HES-SO, FHNW, SUPSI and ZHAW). The aim of the survey is to capture the current demand-side information (DSI) models used by energy utilities abroad to enhance the district heating bill and to provide better indirect feedback to residential customers .
We would be glad if you could support us by answering the following questions and, if possible, attaching an anonymized copy of a current residential paper bill. Answering this survey will take around 15 minutes.
Deadline: 30th of June 2017 . Thank you for your collaboration!
For any queries, please, contact [email protected] or [email protected]
Institute of Applied Sustainability to the Built Environment - ISAAC
Department for Environment Constructions and Design
University of Applied Sciences and Arts of Southern Switzerland
Campus Trevano
CH-6952 Canobbio (TI) Switzerland www.supsi.ch/isaac
There are 34 questions in this survey

A-44
GENERAL INFORMATION
3 [13] Country
Please write your answer here:
1 [11] Utility name
Please write your answer here:
2 [12] Address / Location
Please write your answer here:
4 [14] Contact person
Please write your answer here:
5 [15] E-mail address
Please write your answer here:
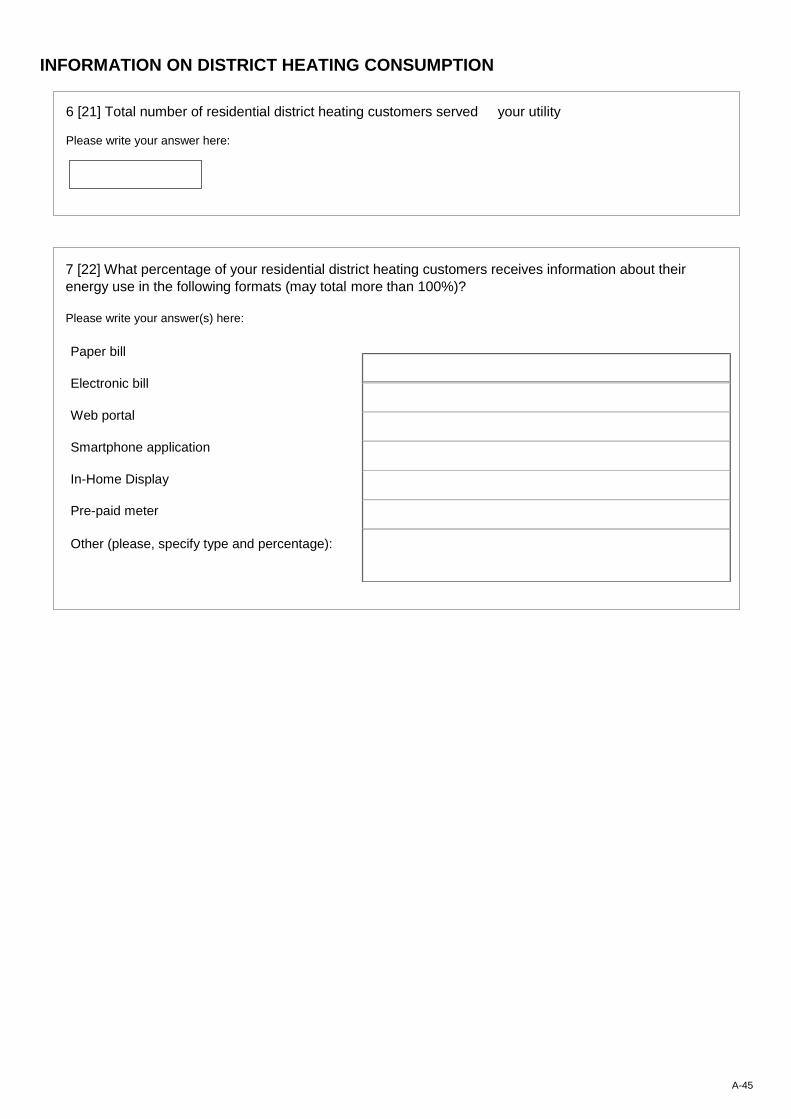
A-45
7 [22] What percentage of your residential district heating customers receives information about their
energy use in the following formats (may total more than 100%)?
Please write your answer(s) here:
Paper bill
Electronic bill
Web portal
Smartphone application
In-Home Display
Pre-paid meter
Other (please, specify type and percentage):
INFORMATION ON DISTRICT HEATING CONSUMPTION
Please write your answer here:
your utility 6 [21] Total number of residential district heating customers served by

A-46
8 [31] What percentage of your residential district heating customers receives the following billing your plan?
Please write your answer(s) here:
Standard
(regular charging frequency of estimated
or actual consumption)
Balanced or leveled
(regular charging frequency of a fixed
payment amount)
Pre-paid
(irregular charging frequency, depending
on actual consumption, paid as-you-go)
Other (please, specify):
DISTRICT HEATING BILLING PLAN

A-47
10 [51] What percentage of your residential district heating cus in the following frequency?
tomers receives billing information
Please write your answer(s) here:
Monthly
Quarterly
Yearly
Irregular
Other
DIRECT DEBIT PAYMENT SCHEME
DISTRICT HEATING BILLING FREQUENCY
Please write your answer here:
9 [41] What percentage of your residential district heating customers has chosen Direct Debit as their payment scheme?

A-48
BILLING FEEDBACK TYPE USED ON THE PAPER OR ELECTRONIC BILL

A-49
16 [62] Please upload an anonymized copy of your current residential customer paper bill or indicate a link to download it.
Kindly attach the aforementioned documents along with the survey
13 [6123]
Current energy usage compared to:
Only answer this question if the following conditions are met:
Answer was at question '12 [612]' ( Which of the following COMPARATIVE STATISTICS do you currently provide on your residential customer district heating bill? )
Please choose all that apply:
Previous month
Previous year (same period)
14 [613]
Which of the following features on ENVIRONMENTAL IMPACT do you currently provide on your
residential customer district heating bill?
Please choose all that apply:
Alternative metrics (e.g. CO2 equivalent emissions, carbon footprint or other eco-feedback) based on current
billing period
Other (please, specify):
Please choose all that apply:
One-size-fits-all, general energy-saving tips and advices
Customized, actionable insights to manage energy costs & consumption
Advice on time-of-day tariffs or other dynamic tariffs
Explanation of key terms (e.g. kWh, m3, specific surcharges etc.)
Contact info on customer service offering customized energy-efficiency specific consultancy
Other (please, specify):
15 [614] Which of the following TIPS & ADVICE do you currently provide on your residential customer district heating bill?
Please write your answer here:
17 [63] In case no upload is possible, please indicate a link where we can download it:

A-50
SMART HOME DEVICES & FUNCTIONALITIES FOR DISTRICT HEATING COSTUMER
Please write your answer here:
18 [71] For what percentage of your residential district heating customers do you have access to smart metering data?
Web portals / Interactive online tools
Mobile phone applications
Traditional In-Home Display (IHD)
Prepayment In-Home Display (IHD)
Remote temperature control system (smart thermostats)
Service promoted by incentives
Service on payment Service for free No
19 [72]
Where applicable, are you deploying smart metering together with one or more of these additional
retail- and consumer-friendly functionalities (check all that apply)?
Please choose the appropriate response for each item:
20 [721] Other , please, specify:
Please write your answer here:

A-51
22 [82] Please, provide the name of the most relevant(s) and a link to access related initiative information:
Please write your answer(s) here:
Name of initiative (1):
Link (1)
Name of initiative (2):
Link (2)
OTHER INNOVATIVE PROGRAMMES FOR DISTRICT HEATING CUSTOMERS
21 [81]Is your utility currently running (or has terminated or is planning in the near future) any
innovative pilot project or service to engage and support residential district heating customers in
energy-saving actions at home?
Please choose all that apply:
Information/ Education campaigns
Gamified energy-saving programmes (e.g. utility-sponsored energy competitions for customers, either individually or on teams; games that employ real-time granular data on player’s energy use as feedback, quizzes, etc.)
Customer fidelity programmes (points and prizes)
Other (please, specify):
Please choose only one of the following:
Yes
No
ds?
23 [83]
May we contact a reference person for a follow-up in this regar
24 [831] Contact person
Only answer this question if the following conditions are met:
Answer was 'Yes' at question '23 [83]' ( May we contact a reference person for a follow-up in this regards? )
Please write your answer here:

A-52
BILL DESIGN EVALUATION
25 [832] E-mail address
Only answer this question if the following conditions are met:
Answer was 'Yes' at question '23 [83]' (May we contact a reference person for a follow-up in this regards? )
Controllare il formato della risposta.
Please write your answer here:
Only answer this question if the following conditions are met:
Answer was 'Yes' at question '23 [83]' (May we contact a reference person for a follow-up in this regards? )
Please write your answer here:
de, prefix and phone number") 26 [833] Phone (please insert phone number in format "country co
Please choose only one of the following:
Yes
No
billing and user-friendly bill design
27 [91]
Has your utility conducted research addressing enhanced
related to district heating bills in the last 5 years?
28 [92]
Did this involve customer participation / feedback?
Only answer this question if the following conditions are met:
Answer was 'Yes' at question '27 [91]' ( Has your utility conducted research addressing enhanced billing and user-friendly bill design related to district heating bills in the last 5 years? )
Please choose only one of the following:
Yes
No

A-53
Only answer this question if the following conditions are met: Answer was 'Yes' at question '27 [91]' ( Has your utility conducted research addressing enhanced billing and user-friendly bill design related to district heating bills in the last 5 years? )
Please write your answer here:
: 30 [94] Please outline briefly the evaluation research conducted
Only answer this question if the following conditions are met:
Answer was 'Yes' at question '27 [91]' ( Has your utility conducted research addressing enhanced billing and user-friendly bill design related to district heating bills in the last 5 years? )
Please choose only one of the following:
Yes
No
, in terms of energy savings
29 [93]
Has your utility performed analyses on the results you obtained
produced by enhanced billing and user-friendly bill design?
31 [95]
May we contact you for follow-up in this regards?
Only answer this question if the following conditions are met:
Answer was 'Yes' at question '27 [91]' ( Has your utility conducted research addressing enhanced billing and user-friendly bill design related to district heating bills in the last 5 years? )
Please choose only one of the following:
Yes
No

A-54
Only answer this question if the following conditions are met:
Answer was 'Yes' at question '31 [95]' ( May we contact you for follow-up in this regards? )
Please write your answer here:
de, prefix and phone number") 34 [953]Phone (please insert phone number in format "country co
32 [951]Name
Only answer this question if the following conditions are met:
Answer was 'Yes' at question '31 [95]' ( May we contact you for follow-up in this regards? )
Please write your answer here:
33 [952]E-mail address
Only answer this question if the following conditions are met:
Answer was 'Yes' at question '31 [95]' ( May we contact you for follow-up in this regards? )
Controllare il formato della risposta.
Please write your answer here:

Appendices - IMPROVE
A-55
Appendix 7. Foreign utilities contacted to join the survey
ID Utility name Country Energy source
1 Acea Energia Italy Electricity & Gas
2 Agsm Energia Italy Electricity & Gas
3 AIM Energy Italy Electricity & Gas
4 Ascopiave Italy Electricity & Gas
5 Pasubioservizi Italy Electricity & Gas
6 Bluenergy Group Italy Electricity & Gas
7 E.ON Energia Italy Electricity & Gas
8 Enel Energia Italy Electricity & Gas
9 ENERcom Italy Electricity & Gas
10 Eni Italy Electricity & Gas
11 Enerxenia Italy Electricity & Gas
12 E-nostra Italy Electricity & Gas
13 Estra Italy Electricity & Gas
14 Europe Energy Italy Electricity & Gas
15 EVIVA Italy Electricity & Gas
16 Gas Natural Italy Electricity & Gas
17 Green Network Italy Electricity & Gas
18 Metaenergia Italy Electricity & Gas
19 Optima Italia Italy Electricity & Gas
20 Sorgenia Italy Electricity & Gas
21 Trenta Italy Electricity & Gas
22 Unogas Energia Italy Electricity & Gas
23 Wekiwi Italy Electricity & Gas
24 Endesa Energia Spain Electricity & Gas
25 Iberdrola Spain Electricity & Gas
26 Unión Fenosa Spain Electricity & Gas
27 Gas Natural Spain Electricity & Gas
28 Coopérnico - CRL Portugal Electricity
29 Elusa Comercialização de Eletricidade Portugal Electricity
30 Elygas Power, S.L. Portugal Gas
31 Enat – Energias Naturais, Lda. Portugal Electricity
32 Endesa – Endesa Energia Sucursal Portugal Portugal Electricity & Gas
33 ENFORCESCO, SA Portugal Electricity
34 Galp Power S.A. Portugal Electricity & Gas
35 GOLD ENERGY – Comercializadora de Energia, S.A. Portugal Electricity & Gas
36 HEN - Serviços Energéticos, Lda. Portugal Electricity
37 Iberdrola Clientes Portugal, Unipessoal, Lda. Portugal Electricity & Gas
38 Jafplus Energia Portugal Electricity
39 Logica Energy Portugal Electricity
40 LUZBOA - Comercialização de Energia, Lda. Portugal Electricity
41 LUSIADAENERGIA, S.A. Portugal Electricity & Gas
42 PH Energia, Lda. Portugal Electricity
43 Rolear - Automatizações, Estudos e Representações Portugal Electricity & Gas
44 Union Fenosa Comercial, S.L. – Suc. Em Portugal Portugal Electricity & Gas
45 Energia Simples Portugal Gas
46 Investigacion, Criogenia y Gas, S.A. - sucursal INCRYGAS
Portugal Gas
47 Molgas, Energia Portugal S.A. Portugal Gas

A-56
48 British Gas UK Electricity & Gas
49 E.ON UK Electricity & Gas
50 EDF UK Electricity & Gas
51 Npower UK Electricity & Gas
52 SSE UK Electricity & Gas
53 Bord Gáis Energy Rep. Ireland Electricity & Gas
54 Energia Rep. Ireland Electricity & Gas
55 Electric Ireland Rep. Ireland Electricity & Gas
56 SSE Airtricity Rep. Ireland Electricity & Gas
57 Pinergy Rep. Ireland Electricity
58 PrePayPower Rep. Ireland Electricity
59 Panda Power Ltd Rep. Ireland Electricity
60 Flogas Natural Gas Ltd Rep. Ireland Gas
61 Allure Energie The Netherlands Electricity & Gas
62 Anode Energie The Netherlands Electricity
63 Budget Energie The Netherlands Electricity & Gas
64 De Groene Belangenbehartiger The Netherlands Electricity
65 De Vastelastenbond The Netherlands Electricity & Gas
66 easyEnergy The Netherlands Electricity & Gas
67 Endesa The Netherlands Electricity & Gas
68 EnergieFlex The Netherlands Electricity & Gas
69 Engie The Netherlands Electricity & Gas
70 Essent The Netherlands Electricity & Gas
71 Fenor BV The Netherlands Electricity & Gas
72 Greenchoice The Netherlands Electricity & Gas
73 Greenfoot Energy The Netherlands Electricity
74 Huismerk Energie The Netherlands Electricity
75 Homestrom The Netherlands Electricity & Gas
76 HVC The Netherlands Electricity & Gas
77 InEnergie The Netherlands District heating
78 Leon The Netherlands Electricity
79 Main Energie The Netherlands Electricity & Gas
80 Nedergie The Netherlands Electricity & Gas
81 Noordelijk Lokaal Duurzaam The Netherlands Electricity
82 Nuon The Netherlands Electricity & Gas
83 Powerpeers The Netherlands Electricity & Gas
84 Pure Energie The Netherlands Electricity & Gas
85 Qwint The Netherlands Electricity
86 Robin energie The Netherlands Electricity & Gas
87 Sepa green The Netherlands Electricity & Gas
88 United Consumers The Netherlands Electricity & Gas
89 Vandebron The Netherlands Electricity
90 Vrijopnaam The Netherlands Electricity & Gas
91 Windunie The Netherlands Electricity
92 GÖTEBORG ENERGI AB Sweden Electricity & Gas & District heating
93 VASTRA ORUSTS ENERGITJANST EK.FOREN Sweden Electricity
94 ÖRESUNDS KRAFT AB Sweden Electricity & Gas & District heating
95 FILIPSTAD ENERGINAT AB Sweden Electricity
96 OSKARSHAMN ENERGI NAT AB Sweden Electricity & Gas & District heating
97 LULEA ENERGI AB Sweden Electricity & Gas & District heating
98 VARBERGSORTENS ELKRAFT EK.FOR. Sweden Electricity
99 EMMABODA ELNAT AB Sweden District heating

A-57
100 AGA GAS AB Sweden Gas
101 Coretec Energy Poland Electricity & Gas
102 DGD Dansk Gas Distribution Denmark Gas
103 HMN Naturgas Denmark Gas
104 NGF Natur Energy Distribution A/S Denmark Gas
105 HOFOR Denmark District heating
106 DONG Energy A/S Denmark Electricity
107 Sibelga Belgium Electricity & Gas
108 Power Online (Mega) Belgium Electricity & Gas
109 OCTA+ Belgium Electricity & Gas
110 Luminus Belgium Electricity & Gas
111 Lampiris (Total gas & power9 Belgium Electricity & Gas
112 Essent Belgium (RWE) Belgium Electricity & Gas
113 ENI Gas & Power Belgium Electricity & Gas
114 ENGIE Electrabel Belgium Electricity & Gas
115 Eneco België Belgium Electricity & Gas
116 Elexys Belgium Electricity & Gas
117 Elegant Belgium Electricity & Gas
118 Direct Energie Belgium (Poweo) Belgium Electricity & Gas
119 Alterna France Electricity & Gas
120 Direct Énergie France Electricity & Gas
121 Enercoop France Electricity
122 Lampiris France Electricity
123 Planète Oui France Electricity
124 Eni France Gas
125 Engie France Electricity & Gas
126 Proxelia France Electricity & Gas
127 Enalp France Electricity
128 Lucia Energie France Electricity
129 Energem France Electricity & Gas
130 Selia France Electricity
131 Ekwateur France Electricity & Gas
132 E.ON Germany Electricity & Gas
133 EnBW AG Germany Electricity & Gas
134 Vattenfall Europe AG Germany Electricity & Gas
135 123energie Germany Electricity & Gas
136 Die Energievorsorger GmbH Germany Electricity & Gas
137 Energy2day GmbH Germany Electricity & Gas
138 energieGUT GmbH Germany Electricity & Gas
139 ENSTROGA AG Germany Electricity & Gas
140 ENTEGA Energie GmbH Germany Electricity & Gas
141 eprimo GmbH Germany Electricity & Gas
142 e-regio GmbH & Co. KG Germany Electricity & Gas
143 E wie Einfach Germany Electricity & Gas
144 EVD GmbH Germany Electricity & Gas
145 Grünwelt Energie Germany Electricity & Gas
146 Greenpeace Energy eG Germany Electricity & Gas
147 Hitenergie Germany Electricity & Gas
148 Hamburg Energie Germany Electricity & Gas
149 Innogy SE Germany Electricity & Gas
150 lekker Energie GmbH Germany Electricity & Gas
151 LichtBlick SE Germany Electricity & Gas
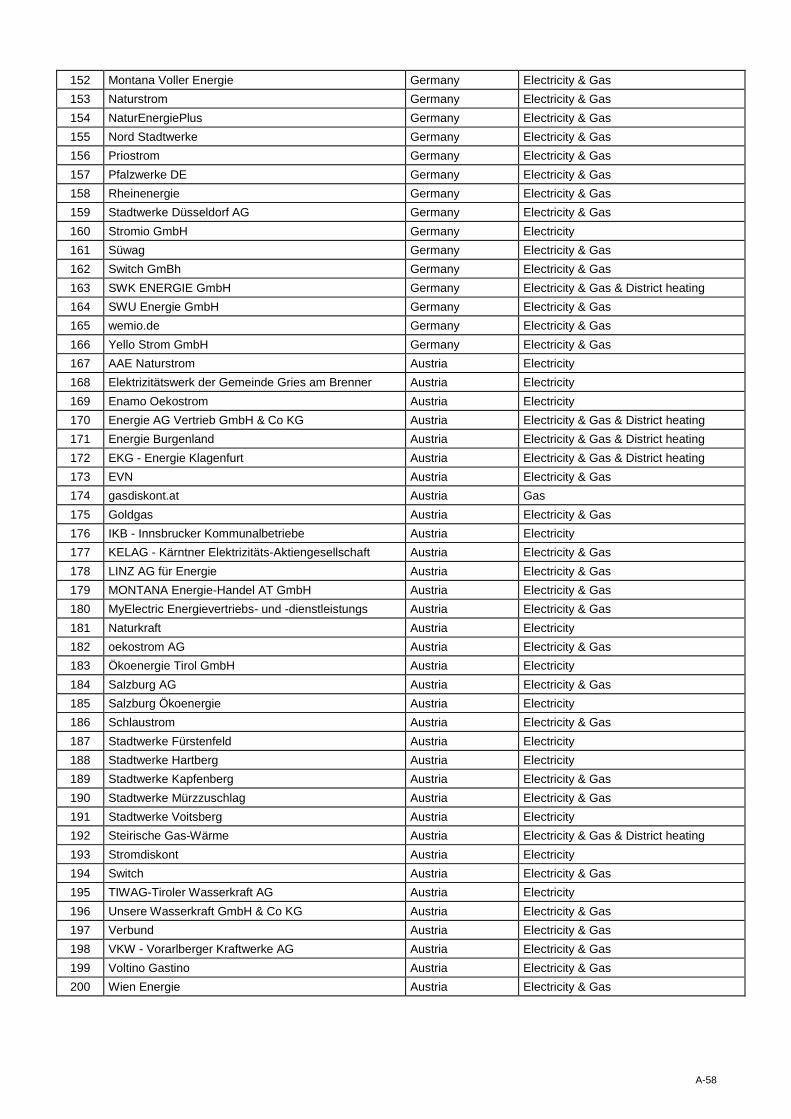
A-58
152 Montana Voller Energie Germany Electricity & Gas
153 Naturstrom Germany Electricity & Gas
154 NaturEnergiePlus Germany Electricity & Gas
155 Nord Stadtwerke Germany Electricity & Gas
156 Priostrom Germany Electricity & Gas
157 Pfalzwerke DE Germany Electricity & Gas
158 Rheinenergie Germany Electricity & Gas
159 Stadtwerke Düsseldorf AG Germany Electricity & Gas
160 Stromio GmbH Germany Electricity
161 Süwag Germany Electricity & Gas
162 Switch GmBh Germany Electricity & Gas
163 SWK ENERGIE GmbH Germany Electricity & Gas & District heating
164 SWU Energie GmbH Germany Electricity & Gas
165 wemio.de Germany Electricity & Gas
166 Yello Strom GmbH Germany Electricity & Gas
167 AAE Naturstrom Austria Electricity
168 Elektrizitätswerk der Gemeinde Gries am Brenner Austria Electricity
169 Enamo Oekostrom Austria Electricity
170 Energie AG Vertrieb GmbH & Co KG Austria Electricity & Gas & District heating
171 Energie Burgenland Austria Electricity & Gas & District heating
172 EKG - Energie Klagenfurt Austria Electricity & Gas & District heating
173 EVN Austria Electricity & Gas
174 gasdiskont.at Austria Gas
175 Goldgas Austria Electricity & Gas
176 IKB - Innsbrucker Kommunalbetriebe Austria Electricity
177 KELAG - Kärntner Elektrizitäts-Aktiengesellschaft Austria Electricity & Gas
178 LINZ AG für Energie Austria Electricity & Gas
179 MONTANA Energie-Handel AT GmbH Austria Electricity & Gas
180 MyElectric Energievertriebs- und -dienstleistungs Austria Electricity & Gas
181 Naturkraft Austria Electricity
182 oekostrom AG Austria Electricity & Gas
183 Ökoenergie Tirol GmbH Austria Electricity
184 Salzburg AG Austria Electricity & Gas
185 Salzburg Ökoenergie Austria Electricity
186 Schlaustrom Austria Electricity & Gas
187 Stadtwerke Fürstenfeld Austria Electricity
188 Stadtwerke Hartberg Austria Electricity
189 Stadtwerke Kapfenberg Austria Electricity & Gas
190 Stadtwerke Mürzzuschlag Austria Electricity & Gas
191 Stadtwerke Voitsberg Austria Electricity
192 Steirische Gas-Wärme Austria Electricity & Gas & District heating
193 Stromdiskont Austria Electricity
194 Switch Austria Electricity & Gas
195 TIWAG-Tiroler Wasserkraft AG Austria Electricity
196 Unsere Wasserkraft GmbH & Co KG Austria Electricity & Gas
197 Verbund Austria Electricity & Gas
198 VKW - Vorarlberger Kraftwerke AG Austria Electricity & Gas
199 Voltino Gastino Austria Electricity & Gas
200 Wien Energie Austria Electricity & Gas
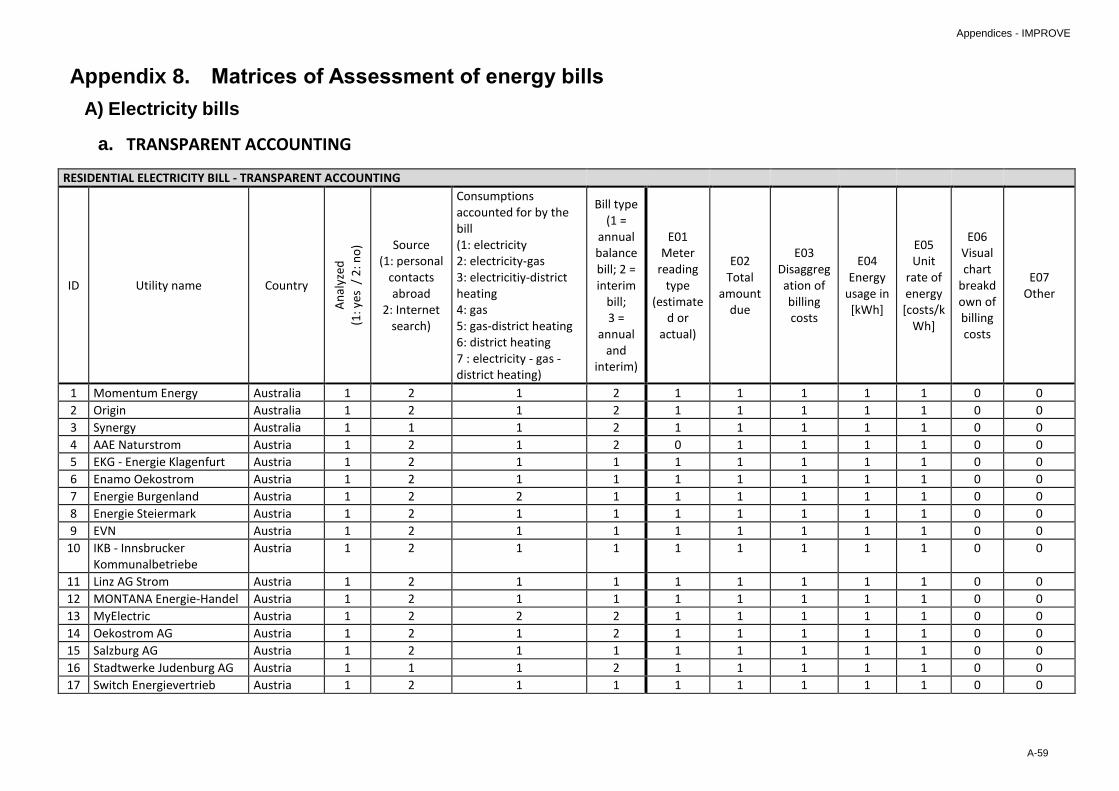
Appendices - IMPROVE
A-59
Appendix 8. Matrices of Assessment of energy bills
A) Electricity bills
a. TRANSPARENT ACCOUNTING
RESIDENTIAL ELECTRICITY BILL - TRANSPARENT ACCOUNTING
ID Utility name Country
An
alyz
ed
(1: y
es /
2: n
o) Source
(1: personal contacts abroad
2: Internet search)
Consumptions accounted for by the bill (1: electricity 2: electricity-gas 3: electricitiy-district heating 4: gas 5: gas-district heating 6: district heating 7 : electricity - gas - district heating)
Bill type (1 =
annual balance bill; 2 = interim
bill; 3 =
annual and
interim)
E01 Meter
reading type
(estimated or
actual)
E02 Total
amount due
E03 Disaggregation of billing costs
E04 Energy
usage in [kWh]
E05 Unit
rate of energy [costs/k
Wh]
E06 Visual chart
breakdown of billing costs
E07 Other
1 Momentum Energy Australia 1 2 1 2 1 1 1 1 1 0 0
2 Origin Australia 1 2 1 2 1 1 1 1 1 0 0
3 Synergy Australia 1 1 1 2 1 1 1 1 1 0 0
4 AAE Naturstrom Austria 1 2 1 2 0 1 1 1 1 0 0
5 EKG - Energie Klagenfurt Austria 1 2 1 1 1 1 1 1 1 0 0
6 Enamo Oekostrom Austria 1 2 1 1 1 1 1 1 1 0 0
7 Energie Burgenland Austria 1 2 2 1 1 1 1 1 1 0 0
8 Energie Steiermark Austria 1 2 1 1 1 1 1 1 1 0 0
9 EVN Austria 1 2 1 1 1 1 1 1 1 0 0
10 IKB - Innsbrucker Kommunalbetriebe
Austria 1 2 1 1 1 1 1 1 1 0 0
11 Linz AG Strom Austria 1 2 1 1 1 1 1 1 1 0 0
12 MONTANA Energie-Handel Austria 1 2 1 1 1 1 1 1 1 0 0
13 MyElectric Austria 1 2 2 2 1 1 1 1 1 0 0
14 Oekostrom AG Austria 1 2 1 2 1 1 1 1 1 0 0
15 Salzburg AG Austria 1 2 1 1 1 1 1 1 1 0 0
16 Stadtwerke Judenburg AG Austria 1 1 1 2 1 1 1 1 1 0 0
17 Switch Energievertrieb Austria 1 2 1 1 1 1 1 1 1 0 0

A-60
18 TIWAG-Tiroler Wasserkraft AG
Austria 1 2 1 1 1 1 1 1 1 0 0
19 Unsere Wasserkraft GmbH Austria 1 2 1 1 1 1 1 1 1 0 0
20 VKW Strom Austria 1 2 1 1 1 1 1 1 1 0 0
21 ENI Gas & Power Belgium 1 2 2 2 1 1 1 1 1 0 0
22 Luminus Belgium 1 2 2 1 1 1 1 1 1 1 0
23 CEB Distribuicao Brazil 1 1 1 2 1 1 1 1 0 0 0
24 Hydro Québec Canada 1 2 1 2 1 1 1 1 1 0 0
25 Superintendencia de Electricidad
Chile 1 1 1 2 1 1 1 1 1 0 0
26 UNKNOWN UTILITY China 2 1 1
27 Codensa SA Columbia 1 1 1 2 1 1 1 1 1 0 0
28 Electricity Authority of Cyprus
Cyprus 2 1 1
29 Bohemia Energy Czech Republic
1 1 1 2 1 1 0 1 1 0 0
30 Fonergy Czech Republic
1 1 1 1 0 1 1 1 1 0 0
31 Statni Energeticka Inspekce Czech Republic
1 1 1 2 1 1 1 1 1 0 0
32 Dong Energy Denmark 1 1 1 2 1 1 1 1 1 0 0
33 SE Energi & Klima Denmark 1 2 1 2 1 1 1 1 1 0 0
34 SEAS NVE Denmark 1 1 1 2 1 1 1 1 1 0 0
35 SK Forsyning Denmark 1 1 1 2 1 1 1 1 1 1 0
36 Caruna Finland 1 1 1 2 1 1 1 1 1 0 0
37 Direct Energie France 1 1 2 2 1 1 1 1 1 0 0
38 EDF France 1 1 1 2 1 1 1 1 1 0 0
39 EnerCOOP France 1 1 1 2 1 1 1 1 1 0 0
40 Engie France 1 1 2 2 1 1 1 1 1 0 0
41 Proxelia France 1 2 1 2 1 1 1 1 1 0 0
42 Selia France 1 2 1 2 1 1 1 1 1 0 0
43 Badenova Germany 1 1 1 2 1 1 1 1 1 0 0
44 BS Energy Germany 1 2 2 2 1 1 1 1 1 0 0
45 Discounter-Energie Germany 1 2 1 2 1 1 1 1 1 0 0
46 E.ON Energie Germany 1 2 1 1 1 1 1 1 1 1 0
47 Eins - Energie in Sachsen Germany 1 2 1 2 0 1 1 1 1 0 0
48 EnBW Germany 1 2 1 1 0 1 1 1 1 0 0
49 Enstroga AG Germany 1 2 1 1 0 1 1 1 1 0 0

A-61
50 Entega Germany 1 2 2 1 0 1 1 1 1 0 0
51 Eprimo GmbH Germany 1 2 1 2 1 1 0 1 1 0 0
52 EVO Germany 1 2 1 1 0 1 1 1 1 0 0
53 EWE Germany 1 2 1 1 1 1 1 1 1 0 0
54 Goldpower Germany 1 1 1 1 0 1 1 1 1 0 0
55 Greenpeace Energy AG Germany 1 2 1 1 1 1 1 1 1 0 0
56 Hamburg Energie Germany 1 2 1 2 1 1 1 1 1 0 0
57 Lekker.de Germany 1 2 1 1 0 1 1 1 1 0 0
58 Mainova Germany 1 2 1 1 1 1 1 1 1 0 0
59 MONTANA Energie-Handel Germany 1 2 2 1 1 1 0 1 1 0 0
60 Naturstrom Germany 1 1 1 1 1 1 1 1 1 0 0
61 Prioenergie Germany 1 2 1 1 1 1 1 1 1 1 0
62 Rheinenergie Germany 1 2 1 1 0 1 1 1 1 0 0
63 Stadtwerke Düsseldorf Germany 1 2 1 1 1 1 1 1 1 0 0
64 Switch Germany 1 2 1 2 1 1 1 1 1 0 0
65 SWK Germany 1 2 2 1 0 1 1 1 1 1 0
66 TEAG Germany 1 2 1 1 1 1 1 1 1 0 0
67 Vattenfall Germany 1 2 1 1 0 1 1 1 1 1 0
68 Voltera Germany 1 2 1 2 1 1 1 1 1 0 0
69 Watt + Volt Greece 2 1 1
70 E.ON Hungary 1 1 1 2 1 1 1 1 1 0 0
71 A2A Italy 1 2 1 2 1 1 1 1 1 1 0
72 Dolomiti Energia Italy 1 2 1 2 1 1 1 1 1 0 0
73 È nostra Italy 1 1 1 2 1 1 1 1 1 1 0
74 Enel Energy Italy 1 1 1 2 1 1 1 1 1 1 0
75 Enerxenia Italy 1 2 1 2 1 1 1 1 1 0 0
76 Hera Comm Italy 1 2 1 2 1 1 1 1 1 0 0
77 Servizio Elettrico Nazionale Italy 1 1 1 2 1 1 1 1 1 1 0
78 Tokyo Gas Japan 2 1 2
79 Automated Revenue Management Services Limited
Malta 1 1 1 2 1 1 1 1 1 0 0
80 Essent Netherlands
1 1 2 1 1 1 1 1 1 0 0
81 Nuon Netherlands
1 1 3 1 1 1 1 1 0 0 0
82 Lyse Norway 1 1 1 2 1 1 0 1 1 0 0
83 Norges Energi Norway 1 1 1 2 1 1 1 1 1 0 0

A-62
84 Coopernico Portugal 1 1 1 2 1 1 1 1 1 0 0
85 EDA Portugal 1 1 1 2 1 1 1 1 1 0 0
86 EDP Portugal 1 1 1 2 1 1 1 1 1 0 0
87 Endesa Portugal 1 1 1 2 1 1 1 1 1 1 0
88 Galp on Portugal 1 1 2 2 1 1 1 1 1 0 0
89 Gas Natural Fenosa Portugal 1 1 1 2 1 1 1 1 1 0 0
90 Bord Gàis Energy Rep. Ireland 1 2 1 2 1 1 1 1 1 0 0
91 Electric Ireland SmarterLiving
Rep. Ireland 1 1 1 2 1 1 1 1 1 0 0
92 Energia Switched On Rep. Ireland 1 2 1 2 1 1 1 1 1 0 0
93 SSE Airtricity Rep. Ireland 1 2 2 2 1 1 1 1 1 0 0
94 Enel Romania 1 1 1 2 1 1 1 0 0 0 0
95 UNKNOW UTILITY Rwanda 1 1 1 0 1 0 1 0 0 0
96 Endesa Spain 1 2 1 2 1 1 1 1 1 1 0
97 Iberdola Spain 1 1 1 2 1 1 1 1 1 1 0
98 Som Energia Spain 1 1 1 2 1 1 1 1 1 1 0
99 BestEl Sweden 1 2 1 2 1 1 1 1 1 0 0
100 E.ON Sweden 1 1 1 1 1 1 1 1 1 0 0
101 öresunds Kraft AB Sweden 1 2 7 2 1 1 1 1 1 0 0
102 Oskarshamn Energi Sweden 1 2 1 2 1 1 1 1 1 0 0
103 Skanska Sweden 1 1 1 1 1 1 1 1 0 0
104 Yagmur Group Turkey 2 2 1 2
105 Bristol Energy UK 1 2 2 2 1 1 1 1 1 0 0
106 British Gas UK 1 2 2 2 1 1 1 1 1 1 0
107 Coop energy UK 1 2 2 1 1 1 1 1 1 0 0
108 E.ON UK 1 1 2 2 1 1 1 1 1 0 0
109 Ecotricity UK 1 2 2 2 1 1 1 1 1 0 0
110 EDF UK 1 1 2 3 1 1 1 1 1 0 0
111 First Utility UK 1 2 2 2 1 1 1 1 1 0 0
112 GB Energy Supply UK 1 1 1 2 1 1 1 1 1 0 0
113 iSupply Energy UK 1 2 1 3 1 1 1 1 1 1 0
114 Npower UK 1 2 2 3 1 1 1 1 1 0 Visual breakdown of energy costs is on the utilities website
115 OVO Energy UK 1 1 2 2 1 1 1 1 1 0 0
116 Scottish Power UK 1 1 1 3 1 1 1 1 1 1 0

A-63
117 So Energy UK 1 2 2 2 1 1 1 1 1 0 0
118 Spark Energy UK 1 2 2 2 1 1 1 1 1 0 0
119 SSE UK 1 2 1 2 1 1 1 1 1 0 0
120 AEP Ohio USA 1 2 1 2 1 1 0 1 0 0 0
121 Con Edison USA 1 2 2 2 1 1 1 1 1 0 0
122 Memphis Light, Gas and Water
USA 1 1 2 2 1 1 1 1 1 0 Visual breakdown of energy costs is on the utilities website
123 National Grid USA 1 2 1 2 1 1 1 1 1 0 0
124 PECO Energy Company USA 1 2 2 2 1 1 1 1 1 0 0
125 SMUD (Sacramento Muni. Utility Dist.)
USA 1 2 1 2 1 1 1 1 1 1 0

A-64
b. COMPARATIVE STATISTICS
RESIDENTIAL ELECTRICITY BILL - COMPARATIVE STATISTICS
ID Utility name Country Analyzed (1: yes,
2: no)
Source (1: personal
contacts abroad
2: Internet search)
Consumptions accounted for by the bill (1: electricity 2: electricity-gas 3: electricitiy-district heating 4: gas 5: gas-district heating 6: district heating 7 : electricity - gas - district heating)
Bill type (1 =
annual balance
bill; 2 =
interim bill; 3 = annual
and interim)
E08 Avera
ge daily
energy use and
costs
E09 Graph
of curren
t energy usage
E10 Graph
of histori
cal energy
use
E11 a Current energy usage
compared to
previous
month
E11 b Current energy usage
compared to
previous year (same
period)
E12 Current energy usage
compared to
similar househol
ds
E13 Current energy usage
compared to
similar household
s in the
same area
E14 Energy usage
pattern variation according
to seasons
E15 Correlation between
energy usage and
temperature/
weather conditions
E16 Average account
of energy usage
by major
appliances
E17 Househo
ld specific account
of energy usage
by major applianc
es
E18 Other
1 Momentum Energy Australia 1 2 1 2 1 0 1 1 1 1 0 1 1 0 1 1
2 Origin Australia 1 2 1 2 1 0 1 0 1 0 1 1 0 0 0 0
3 Synergy Australia 1 1 1 2 1 0 1 0 1 1 1 0 1 0 1 0
4 AAE Naturstrom Austria 1 2 1 2 0 0 0 0 0 0 0 0 0 0 0 0
5 EKG - Energie Klagenfurt Austria 1 2 1 1 0 0 0 0 0 0 0 0 0 0 0 0
6 Enamo Oekostrom Austria 1 2 1 1 0 0 0 0 0 0 0 0 0 0 0 0
7 Energie Burgenland Austria 1 2 2 1 0 0 0 0 1 0 0 0 0 0 0 0
8 Energie Steiermark Austria 1 2 1 1 1 0 0 0 1 0 0 0 1 0 0 0
9 EVN Austria 1 2 1 1 1 0 0 0 1 0 0 0 1 0 0 0
10 IKB Austria 1 2 1 1 1 0 0 0 1 0 0 0 1 0 0 0
11 Linz AG Strom Austria 1 2 1 1 0 0 1 0 1 0 0 0 0 0 1 0
12 MONTANA Energie-Handel Austria 1 2 1 1 1 0 0 0 1 0 0 0 1 0 0 0
13 MyElectric Austria 1 2 2 2 1 0 0 0 1 0 0 0 1 0 0 0
14 Oekostrom AG Austria 1 2 1 2 1 0 0 0 1 0 0 0 1 0 0 0
15 Salzburg AG Austria 1 2 1 1 1 0 0 0 1 0 0 0 1 0 0 0
16 Stadtwerke Judenburg AG Austria 1 1 1 2 1 0 0 1 0 0 0 0 0 0 0 0
17 Switch Energievertrieb Austria 1 2 1 1 1 0 0 0 0 0 0 0 1 0 0 0
18 TIWAG-Tiroler Wasserkraft AG Austria 1 2 1 1 0 0 0 0 0 0 0 0 0 0 0 0
19 Unsere Wasserkraft GmbH Austria 1 2 1 1 0 0 0 0 0 0 0 0 0 0 0 0
20 VKW Strom Austria 1 2 1 1 0 0 1 0 1 0 1 0 0 0 1 0
21 ENI Gas & Power Belgium 1 2 2 2 0 0 0 0 0 0 0 0 0 0 0 0
22 Luminus Belgium 1 2 2 1 0 0 1 0 1 0 0 0 0 0 0 0
23 CEB Distribuicao Brazil 1 1 1 2 0 0 0 1 1 0 0 0 0 0 0 0
24 Hydro Québec Canada 1 2 1 2 1 0 0 1 0 0 0 0 0 0 0 0
25 Superintendencia de Electricidad
Chile 1 1 1 2 0 0 1 1 1 0 0 0 0 0 0 0
26 UNKNOWN UTILITY China 2 1 1
27 Codensa SA Columbia 1 1 1 2 0 0 1 1 1 0 0 0 0 0 0 0
28 Electricity Authority of Cyprus Cyprus 2 1 1
29 Bohemia Energy Czech Republic
1 1 1 2 0 0 0 1 1 0 0 0 0 0 0 0

A-65
30 Fonergy Czech Republic
1 1 1 1 0 0 0 0 1 0 0 0 0 0 0 0
31 Statni Energeticka Inspekce Czech Republic
1 1 1 2 0 0 0 1 0 0 0 0 0 0 0 0
32 Dong Energy Denmark 1 1 1 2 0 0 0 0 0 0 0 0 0 0 0 0
33 SE Energi & Klima Denmark 1 2 1 2 0 0 0 0 0 0 0 0 0 0 0 0
34 SEAS NVE Denmark 1 1 1 2 0 0 0 0 1 0 0 0 0 0 0 0
35 SK Forsyning Denmark 1 1 1 2 0 0 0 0 0 0 0 0 0 0 0 0
36 Caruna Finland 1 1 1 2 0 0 0 1 0 0 0 0 0 0 0 0
37 Direct Energie France 1 1 2 2 0 0 0 0 0 0 0 0 0 0 0 0
38 EDF France 1 1 1 2 0 0 0 0 0 0 0 0 0 0 0 0
39 EnerCOOP France 1 1 1 2 0 0 0 0 0 0 0 0 0
40 Engie France 1 1 2 2 0 0 0 0 0 0 0 0 0 0 0 0
41 Proxelia France 1 2 1 2 0 0 0 0 0 0 0 0 0 0 0 0
42 Selia France 1 2 1 2 0 0 0 1 0 0 0 0 0 0 0 0
43 Badenova Germany 1 1 1 2 0 0 0 1 0 1 0 0 0 0 0 0
44 BS Energy Germany 1 2 2 2 0 0 0 0 1 1 0 0 0 0 0 0
45 Discounter-Energie Germany 1 2 1 2 0 0 0 0 0 0 0 0 0 0 0 0
46 E.ON Energie Germany 1 2 1 1 0 0 0 0 1 1 0 0 0 0 0 0
47 Eins - Energie in Sachsen Germany 1 2 1 2 0 0 0 0 0 1 0 0 0 0 0 0
48 EnBW Germany 1 2 1 1 0 0 0 0 1 1 0 0 0 0 0 0
49 Enstroga AG Germany 1 2 1 1 0 0 0 0 1 1 0 0 0 0 0 0
50 Entega Germany 1 2 2 1 0 0 0 0 1 1 0 0 0 0 0 0
51 Eprimo GmbH Germany 1 2 1 2 0 0 0 0 0 0 0 0 0 0 0 0
52 EVO Germany 1 2 1 1 0 0 0 0 1 1 0 0 0 0 0 0
53 EWE Germany 1 2 1 1 0 0 0 0 1 1 0 0 0 0 0 0
54 Goldpower Germany 1 1 1 1 0 0 0 0 1 1 0 0 0 0 0 0
55 Greenpeace Energy AG Germany 1 2 1 1 1 0 0 0 1 0 0 0 1 0 0 0
56 Hamburg Energie Germany 1 2 1 2 1 0 0 0 0 1 0 0 0 0 0 0
57 Lekker.de Germany 1 2 1 1 0 0 0 0 1 0 0 0 0 0 0 0
58 Mainova Germany 1 2 1 1 0 0 0 0 0 1 0 0 0 0 0 0
59 MONTANA Energie-Handel Germany 1 2 2 1 0 0 0 0 0 0 0 0 0 0 0 0
60 Naturstrom Germany 1 1 1 1 0 0 0 0 1 1 0 0 0 0 0 0
61 Prioenergie Germany 1 2 1 1 0 0 0 0 0 1 0 0 0 0 0 0
62 Rheinenergie Germany 1 2 1 1 0 0 0 0 1 1 0 0 0 0 0 0
63 Stadtwerke Düsseldorf Germany 1 2 1 1 0 0 0 0 1 1 0 0 0 0 0 0
64 Switch Germany 1 2 1 2 1 0 0 0 1 0 0 0 1 0 0 0
65 SWK Germany 1 2 2 1 0 0 0 0 0 1 0 0 0 0 0 0
66 TEAG Germany 1 2 1 1 0 0 0 0 0 1 0 0 0 0 0 0
67 Vattenfall Germany 1 2 1 1 1 0 0 0 1 1 0 0 1 0 0 0
68 Voltera Germany 1 2 1 2 0 0 0 0 0 0 0 0 0 0 0 0
69 Watt + Volt Greece 2 1 1
70 E.ON Hungary 1 1 1 2 0 0 0 0 1 1 0 0 0 0 0 0
71 A2A Italy 1 2 1 2 0 1 1 1 1 0 0 0 0 0 0 0
72 Dolomiti Energia Italy 1 2 1 2 0 0 1 1 0 0 0 0 0 0 0 0
73 È nostra Italy 1 1 1 2 0 1 1 1 1 0 0 0 0 0 0 0
74 Enel Energy Italy 1 1 1 2 0 0 1 1 1 0 0 0 0 0 0 0

A-66
75 Enerxenia Italy 1 2 1 2 0 0 1 1 0 0 0 0 0 0 0 0
76 Hera Comm Italy 1 2 1 2 0 0 1 0 0 0 0 0 0 0 0 0
77 Servizio Elettrico Nazionale Italy 1 1 1 2 0 0 0 1 0 0 0 0 0 0 0 0
78 Tokyo Gas Japan 2 1 2
79 Automated Revenue Management Services Limited
Malta 1 1 1 2 1 0 1 0 0 0 0 0 1 0 1 0
80 Essent Netherlands 1 1 2 1 0 0 0 1 1 1 0 0 0 0 0 0
81 Nuon Netherlands 1 1 3 1 0 0 0 1 0 1 0 0 0 0 0 0
82 Lyse Norway 1 1 1 2 0 0 1 1 1 0 0 0 0 0 0 0
83 Norges Energi Norway 1 1 1 2 0 0 0 1 0 0 0 0 0 0 0 0
84 Coopernico Portugal 1 1 1 2 0 0 1 1 0 0 0 0 0 0 0 0
85 EDA Portugal 1 1 1 2 0 0 1 0 0 0 0 0 0 0 0 0
86 EDP Portugal 1 1 1 2 0 0 0 0 0 0 0 0 0 0 0 0
87 Endesa Portugal 1 1 1 2 0 0 1 0 0 0 0 0 0 0 0 0
88 Galp on Portugal 1 1 2 2 0 0 1 1 0 0 0 0 0 0 0 0
89 Gas Natural Fenosa Portugal 1 1 1 2 0 0 0 0 0 0 0 0 0 0 0 0
90 Bord Gàis Energy Rep. Ireland 1 2 1 2 1 0 0 0 0 0 0 0 1 0 0 0
91 Electric Ireland SmarterLiving
Rep. Ireland 1 1 1 2 0 0 0 0 0 0 0 0 0 0 0 0
92 Energia Switched on Rep. Ireland 1 2 1 2 0 0 0 0 0 0 0 0 0 0 0 0
93 SSE Airtricity Rep. Ireland 1 2 2 2 0 0 0 0 0 0 0 0 0 0 0 0
94 Enel Romania 1 1 1 2 0 0 0 0 0 0 0 0 0 0 0 0
95 UNKNOW UTILITY Rwanda 1 1 1 0 0 0 0 0 0 0 0 0 0 0 0
96 Endesa Spain 1 2 1 2 1 0 1 1 0 0 0 0 0 0 0 0
97 Iberdola Spain 1 1 1 2 0 0 1 1 0 0 0 0 0 0 0 0
98 Som Energia Spain 1 1 1 2 0 0 1 1 0 0 0 0 0 0 0 0
99 BestEl Sweden 1 2 1 2 0 0 0 1 1 0 0 0 0 0 0 0
100 E.ON Sweden 1 1 1 1 0 1 1 0 1 0 0 0 0 1 1 0
101 öresunds Kraft AB Sweden 1 2 7 2 0 0 0 0 0 0 0 0 0 0 0 0
102 Oskarshamn Energi Sweden 1 2 1 2 0 0 0 0 0 0 0 0 0 0 0 0
103 Skanska Sweden 1 1 1 0 0 0 0 0 0 0 0 0 0 0 0
104 Yagmur Group Turkey 2 2 1 2
105 Bristol Energy UK 1 2 2 2 0 0 0 0 0 0 0 0 0 0 0 0
106 British Gas UK 1 2 2 2 0 0 0 0 1 0 0 0 0 0 0 0
107 Coop energy UK 1 2 2 1 0 0 0 0 0 0 0 0 0 0 0 0
108 E.ON UK 1 1 2 2 0 0 0 0 1 0 0 0 0 0 0 0
109 Ecotricity UK 1 2 2 2 0 0 0 0 1 0 0 0 0 0 0 0
110 EDF UK 1 1 2 3 0 0 0 0 1 0 0 0 0 0 0 0
111 First Utility UK 1 2 2 2 0 0 0 0 1 0 0 0 0 0 0 0
112 GB Energy Supply UK 1 1 1 2 0 0 0 0 0 0 0 0 0 0 0 0
113 iSupply Energy UK 1 2 1 3 0 0 0 0 0 0 0 0 0 0 0 0
114 Npower UK 1 2 2 3 1 0 0 0 1 0 0 0 1 0 0 0
115 OVO Energy UK 1 1 2 2 0 0 0 0 0 0 0 0 0 0 0 0
116 Scottish Power UK 1 1 1 3 0 0 0 0 1 0 0 0 0 0 0 0
117 So Energy UK 1 2 2 2 0 0 0 0 0 0 0 0 0 0 0 0
118 Spark Energy UK 1 2 2 2 0 0 0 0 1 0 0 0 0 0 0 0
119 SSE UK 1 2 1 2 0 0 0 0 1 0 0 0 0 0 0 0

A-67
120 AEP Ohio USA 1 2 1 2 1 0 1 0 0 0 1 0 0 0 0 0
121 Con Edison USA 1 2 2 2 0 1 1 0 0 0 0 0 0 1 1 0
122 Memphis Light, Gas and Water USA 1 1 2 2 0 0 0 0 0 0 0 0 0 0 0 0
123 National Grid USA 1 2 1 2 1 0 1 1 1 0 0 0 1 0 1 1
124 PECO Energy Company USA 1 2 2 2 0 0 1 1 1 0 0 0 0 0 1 1
125 SMUD USA 1 2 1 2 1 1 1 1 1 0 0 0 1 1 1 1
c. ECO-FEEDBACK ON CLIMATE AND ENVIRONEMENTAL IMPACT
RESIDENTIAL ELECTRICITY BILL -ECO-FEEDBACK ON CLIMATE AND ENVIRONEMENTAL IMPACT
ID Utility name Country
An
alyz
ed (
1: y
es,
2: n
o)
Source (1: personal contacts
abroad 2: Internet search)
Consumptions accounted for by the bill (1: electricity 2: electricity-gas 3: electricitiy-district heating 4: gas 5: gas-district heating 6: district heating 7 : electricity - gas - district heating)
Bill type (1 = annual balance bill;
2 = interim bill; 3 = annual and
interim)
E19 Breakdown of fuel mix
E20 Alternative metrics (e.g. CO2 equivalent
emissions, carbon footprint etc.)
E21 Other
1 Momentum Energy Australia 1 2 1 2 1 1 0
2 Origin Australia 1 2 1 2 0 0 0
3 Synergy Australia 1 1 1 2 1 1 1
4 AAE Naturstrom Austria 1 2 1 2 0 0 0
5 EKG - Energie Klagenfurt Austria 1 2 1 1 0 0 0
6 Enamo Oekostrom Austria 1 2 1 1 0 0 0
7 Energie Burgenland Austria 1 2 2 1 1 0 0
8 Energie Steiermark Austria 1 2 1 1 1 0 0
9 EVN Austria 1 2 1 1 1 0 0
10 IKB Austria 1 2 1 1 1 0 0
11 Linz AG Strom Austria 1 2 1 1 1 0 0
12 MONTANA Energie-Handel Austria 1 2 1 1 1 0 0
13 MyElectric Austria 1 2 2 2 1 0 0
14 Oekostrom AG Austria 1 2 1 2 1 0 0
15 Salzburg AG Austria 1 2 1 1 1 0 0
16 Stadtwerke Judenburg AG Austria 1 1 1 2 0 0 0
17 Switch Energievertrieb Austria 1 2 1 1 0 0 0
18 TIWAG-Tiroler Wasserkraft AG
Austria 1 2 1 1 0 0 0
19 Unsere Wasserkraft GmbH Austria 1 2 1 1 0 0 0

A-68
20 VKW Strom Austria 1 2 1 1 1 0 1
21 ENI Gas & Power Belgium 1 2 2 2 0 0 0
22 Luminus Belgium 1 2 2 1 1 0 0
23 CEB Distribuicao Brazil 1 1 1 2 0 0 0
24 Hydro Québec Canada 1 2 1 2 0 0 0
25 Superintendencia de Electricidad
Chile 1 1 1 2 0 0 0
26 UNKNOWN UTILITY China 2 1 1
27 Codensa SA Columbia 1 1 1 2 0 0 0
28 Electricity Authority of Cyprus
Cyprus 2 1 1
29 Bohemia Energy Czech Republic
1 1 1 2 0 0 0
30 Fonergy Czech Republic
1 1 1 1 0 0 0
31 Statni Energeticka Inspekce Czech Republic
1 1 1 2 0 0 0
32 Dong Energy Denmark 1 1 1 2 0 0 0
33 SE Energi & Klima Denmark 1 2 1 2 0 0 0
34 SEAS NVE Denmark 1 1 1 2 0 0 0
35 SK Forsyning Denmark 1 1 1 2 0 0 0
36 Caruna Finland 1 1 1 2 0 0 0
37 Direct Energie France 1 1 2 2 0 0 0
38 EDF France 1 1 1 2 0 0 0
39 EnerCOOP France 1 1 1 2 0 0 0
40 Engie France 1 1 2 2 1 0 0
41 Proxelia France 1 2 1 2 0 0 0
42 Selia France 1 2 1 2 0 0 0
43 Badenova Germany 1 1 1 2 1 0 0
44 BS Energy Germany 1 2 2 2 1 1 0
45 Discounter-Energie Germany 1 2 1 2 0 0 0
46 E.ON Energie Germany 1 2 1 1 1 1 0
47 Eins - Energie in Sachsen Germany 1 2 1 2 0 1 0
48 EnBW Germany 1 2 1 1 1 1 0
49 Enstroga AG Germany 1 2 1 1 1 1 0
50 Entega Germany 1 2 2 1 1 1 0
51 Eprimo GmbH Germany 1 2 1 2 0 0 0
52 EVO Germany 1 2 1 1 1 1 0
53 EWE Germany 1 2 1 1 1 1 0
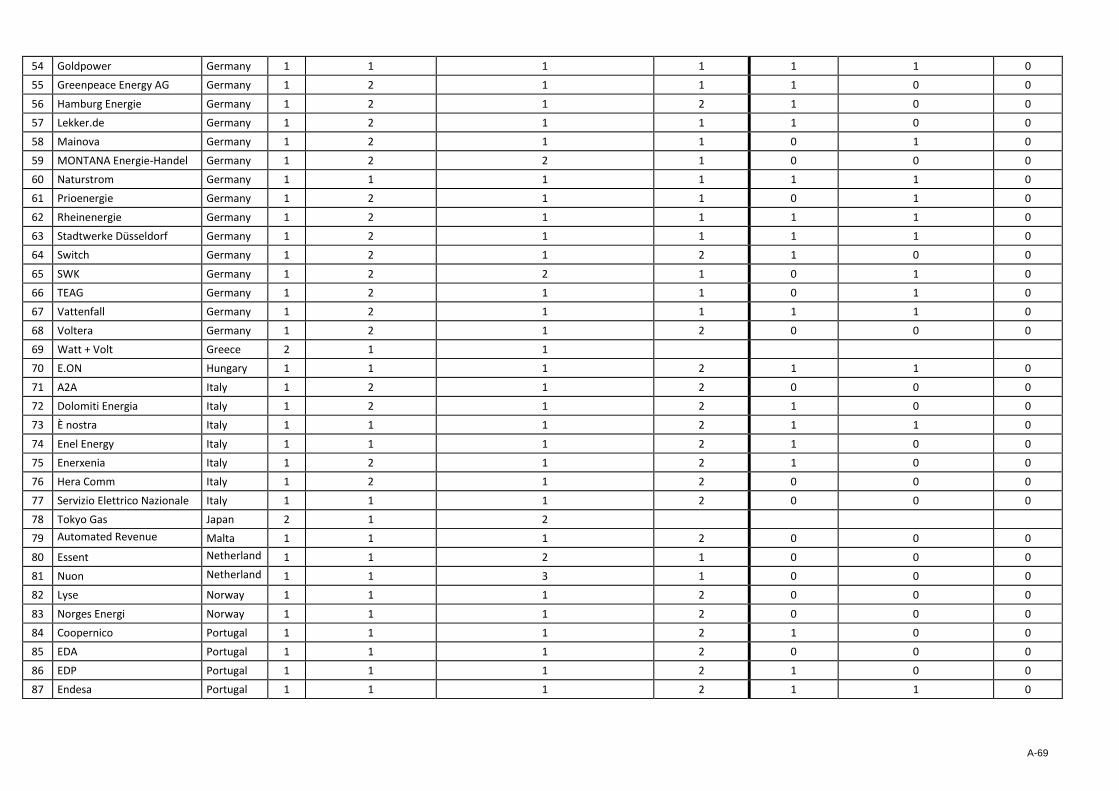
A-69
54 Goldpower Germany 1 1 1 1 1 1 0
55 Greenpeace Energy AG Germany 1 2 1 1 1 0 0
56 Hamburg Energie Germany 1 2 1 2 1 0 0
57 Lekker.de Germany 1 2 1 1 1 0 0
58 Mainova Germany 1 2 1 1 0 1 0
59 MONTANA Energie-Handel Germany 1 2 2 1 0 0 0
60 Naturstrom Germany 1 1 1 1 1 1 0
61 Prioenergie Germany 1 2 1 1 0 1 0
62 Rheinenergie Germany 1 2 1 1 1 1 0
63 Stadtwerke Düsseldorf Germany 1 2 1 1 1 1 0
64 Switch Germany 1 2 1 2 1 0 0
65 SWK Germany 1 2 2 1 0 1 0
66 TEAG Germany 1 2 1 1 0 1 0
67 Vattenfall Germany 1 2 1 1 1 1 0
68 Voltera Germany 1 2 1 2 0 0 0
69 Watt + Volt Greece 2 1 1
70 E.ON Hungary 1 1 1 2 1 1 0
71 A2A Italy 1 2 1 2 0 0 0
72 Dolomiti Energia Italy 1 2 1 2 1 0 0
73 È nostra Italy 1 1 1 2 1 1 0
74 Enel Energy Italy 1 1 1 2 1 0 0
75 Enerxenia Italy 1 2 1 2 1 0 0
76 Hera Comm Italy 1 2 1 2 0 0 0
77 Servizio Elettrico Nazionale Italy 1 1 1 2 0 0 0
78 Tokyo Gas Japan 2 1 2
79 Automated Revenue Management Services Limited
Malta 1 1 1 2 0 0 0
80 Essent Netherlands
1 1 2 1 0 0 0
81 Nuon Netherlands
1 1 3 1 0 0 0
82 Lyse Norway 1 1 1 2 0 0 0
83 Norges Energi Norway 1 1 1 2 0 0 0
84 Coopernico Portugal 1 1 1 2 1 0 0
85 EDA Portugal 1 1 1 2 0 0 0
86 EDP Portugal 1 1 1 2 1 0 0
87 Endesa Portugal 1 1 1 2 1 1 0

A-70
88 Galp on Portugal 1 1 2 2 0 0 0
89 Gas Natural Fenosa Portugal 1 1 1 2 0 0 0
90 Bord Gàis Energy Rep. Ireland
1 2 1 2 0 0 0
91 Electric Ireland Rep. Ireland
1 1 1 2 0 0 0
92 Energia Switched On Rep. Ireland
1 2 1 2 0 0 0
93 SSE Airtricity Rep. Ireland
1 2 2 2 0 0 0
94 Enel Romania 1 1 1 2 0 0 0
95 UNKNOW UTILITY Rwanda 1 1 1 0 0 0
96 Endesa Spain 1 2 1 2 1 1 0
97 Iberdola Spain 1 1 1 2 1 0 0
98 Som Energia Spain 1 1 1 2 1 0 0
99 BestEl Sweden 1 2 1 2 0 0 0
100 E.ON Sweden 1 1 1 1 1 0 0
101 öresunds Kraft AB Sweden 1 2 7 2 0 0 0
102 Oskarshamn Energi Sweden 1 2 1 2 0 0 0
103 Skanska Sweden 1 1 1 0 0 0
104 Yagmur Group Turkey 2 2 1 2
105 Bristol Energy UK 1 2 2 2 0 0 0
106 British Gas UK 1 2 2 2 1 0 0
107 Coop energy UK 1 2 2 1 0 0 0
108 E.ON UK 1 1 2 2 1 0 0
109 Ecotricity UK 1 2 2 2 1 0 0
110 EDF UK 1 1 2 3 1 0 0
111 First Utility UK 1 2 2 2 1 0 0
112 GB Energy Supply UK 1 1 1 2 0 0 0
113 iSupply Energy UK 1 2 1 3 0 0 0
114 Npower UK 1 2 2 3 1 0 0
115 OVO Energy UK 1 1 2 2 0 0 0
116 Scottish Power UK 1 1 1 3 1 0 0
117 So Energy UK 1 2 2 2 0 0 0
118 Spark Energy UK 1 2 2 2 1 0 0
119 SSE UK 1 2 1 2 1 0 0
120 AEP Ohio USA 1 2 1 2 0 0 0
121 Con Edison USA 1 2 2 2 0 0 0

A-71
122 Memphis Light, Gas and Water
USA 1 1 2 2 0 0 0
123 National Grid USA 1 2 1 2 1 0 0
124 PECO Energy Company USA 1 2 2 2 1 0 0
125 SMUD (Sacramento Municipal Utility District)
USA 1 2 1 2 1 0 0
d. TIPS & ADVICES
RESIDENTIAL ELECTRICITY BILL - TIPS & ADVICES
ID Utility name Country
An
alyz
ed (
1: y
es,
2: n
o)
Source (1: personal
contacts abroad
2: Internet search)
Consumptions accounted for by the bill (1: electricity 2: electricity-gas 3: electricitiy-district heating 4: gas 5: gas-district heating 6: district heating 7 : electricity - gas - district heating)
Bill type (1 =
annual balance bill; 2 = interim
bill; 3 =
annual and
interim)
E22 One-size-
fits-all, general energy-
saving tips and
advices
E23 Customized, actionable
insights to manage
energy costs &
consumption
E24 Advice
on time-of-day tariffs
or other
dynamic tariffs
E25 Explanatio
n of key terms (e.g. kWh,
m3, specific
surcharges etc.)
E26 Contact info on
customer service offering
customized energy-efficiency specific
consultancy
E27 Other
1 Momentum Energy Australia 1 2 1 2 1 1 0 1 1 A link on the bill is indicated, refering to energy-saving tips on the utility's website
2 Origin Australia 1 2 1 2 0 0 0 0 0 0
3 Synergy Australia 1 1 1 2 0 1 0 1 0 0
4 AAE Naturstrom Austria 1 2 1 2 0 0 0 0 0 0
5 EKG - Energie Klagenfurt
Austria 1 2 1 1 0 0 0 0 0 0
6 Enamo Oekostrom Austria 1 2 1 1 0 0 0 0 0 0
7 Energie Burgenland Austria 1 2 2 1 0 0 0 0 0 A link on the bill is indicated, refering to energy-saving tips on the utility's website
8 Energie Steiermark Austria 1 2 1 1 0 1 0 0 0 0
9 EVN Austria 1 2 1 1 0 1 0 0 0 A link on the bill is indicated, refering to energy-saving tips on the utility's website
10 IKB - Innsbrucker Kommunalbetriebe
Austria 1 2 1 1 0 1 0 0 0 0
11 Linz AG Strom Austria 1 2 1 1 0 0 0 1 0 0

A-72
12 MONTANA Energie-Handel
Austria 1 2 1 1 0 1 0 0 0 0
13 MyElectric Austria 1 2 2 2 0 1 0 0 0 0
14 Oekostrom AG Austria 1 2 1 2 0 1 0 0 0 A link on the bill is indicated, refering to a point collection programme to buy energy-saving appliances
15 Salzburg AG Austria 1 2 1 1 0 1 0 0 0 0
16 Stadtwerke Judenburg AG
Austria 1 1 1 2 0 0 0 0 0 0
17 Switch Energievertrieb Austria 1 2 1 1 0 1 0 0 0 0
18 TIWAG-Tiroler Wasserkraft AG
Austria 1 2 1 1 0 0 0 0 0 0
19 Unsere Wasserkraft GmbH
Austria 1 2 1 1 0 0 0 0 0 0
20 VKW Strom Austria 1 2 1 1 0 0 0 1 0
A link on the bill is indicated, inviting to switch to the online bill in order to receive more detailed energy consumption info
21 ENI Gas & Power Belgium 1 2 2 2 0 0 0 0 0 0
22 Luminus Belgium 1 2 2 1 0 0 0 0 0 0
23 CEB Distribuicao Brazil 1 1 1 2 0 0 0 0 0 0
24 Hydro Québec Canada 1 2 1 2 0 0 0 0 0 0
25 Superintendencia de Electricidad
Chile 1 1 1 2 1 0 0 0 0 0
26 UNKNOWN UTILITY China 2 1 1
27 Codensa SA Columbia 1 1 1 2 0 0 0 1 0 0
28 Electricity Authority of Cyprus
Cyprus 2 1 1
29 Bohemia Energy Czech Republic
1 1 1 2 0 0 0 0 0 0
30 Fonergy Czech Republic
1 1 1 1 0 0 0 0 0 0
31 Statni Energeticka Inspekce
Czech Republic
1 1 1 2 0 0 0 0 0 0
32 Dong Energy Denmark 1 1 1 2 0 0 0 0 0 0
33 SE Energi & Klima Denmark 1 2 1 2 0 0 0 0 0 0
34 SEAS NVE Denmark 1 1 1 2 0 0 0 0 0 0
35 SK Forsyning Denmark 1 1 1 2 0 0 0 0 0 0
36 Caruna Finland 1 1 1 2 0 0 0 0 0 0
37 Direct Energie France 1 1 2 2 0 0 0 0 0 0
38 EDF France 1 1 1 2 0 0 0 0 0 0
39 EnerCOOP France 1 1 1 2 0 0 0 0 0 0
40 Engie France 1 1 2 2 0 0 0 0 0 0

A-73
41 Proxelia France 1 2 1 2 0 0 0 0 0 0
42 Selia France 1 2 1 2 0 0 0 0 0 0
43 Badenova Germany 1 1 1 2 0 0 0 0 0 0
44 BS Energy Germany 1 2 2 2 0 0 0 0 0 Refers to general websites on national policies towards energy efficiency
45 Discounter-Energie Germany 1 2 1 2 0 0 0 0 0 0
46 E.ON Energie Germany 1 2 1 1 0 0 0 0 0
A link on the bill is indicated, refering to energy-saving tips on the utility's website, as well as to national policies towards energy efficiency
47 Eins - Energie in Sachsen
Germany 1 2 1 2 0 0 0 0 0
A link on the bill is indicated, refering to energy-saving tips on the utility's website, as well as to national policies towards energy efficiency
48 EnBW Germany 1 2 1 1 0 0 0 0 0
A link on the bill is indicated, refering to energy-saving tips on the utility's website, as well as to national policies towards energy efficiency (www.enbw.com/edl-g)
49 Enstroga AG Germany 1 2 1 1 0 0 0 0 0 Refers to general websites on national policies towards energy efficiency
50 Entega Germany 1 2 2 1 0 0 0 0 0 0
51 Eprimo GmbH Germany 1 2 1 2 0 0 0 0 0 0
52 EVO Germany 1 2 1 1 0 0 0 0 0
A link on the bill is indicated, refering to energy-saving tips on the utility's website, as well as to national policies towards energy efficiency
53 EWE Germany 1 2 1 1 0 0 0 0 0 0
54 Goldpower Germany 1 1 1 1 0 0 0 0 0 Refers to general websites on national policies towards energy efficiency
55 Greenpeace Energy AG Germany 1 2 1 1 0 1 0 0 0 0
56 Hamburg Energie Germany 1 2 1 2 0 0 0 1 1 0
57 Lekker.de Germany 1 2 1 1 0 0 0 0 0 A link on the bill is indicated, refering to energy-saving tips on the utility's website
58 Mainova Germany 1 2 1 1 0 0 0 0 0
A link on the bill is indicated, refering to energy-saving tips on the utility's website, as well as to national policies towards energy efficiency
59 MONTANA Energie-Handel
Germany 1 2 2 1 0 0 0 0 0 0
60 Naturstrom Germany 1 1 1 1 0 0 0 0 0 Refers to general websites on national policies towards energy efficiency

A-74
61 Prioenergie Germany 1 2 1 1 0 0 0 0 0 Refers to general websites on national policies towards energy efficiency
62 Rheinenergie Germany 1 2 1 1 0 0 0 0 0 Refers to general websites on national policies towards energy efficiency
63 Stadtwerke Düsseldorf Germany 1 2 1 1 0 0 0 0 0 Refers to general websites on national policies towards energy efficiency
64 Switch Germany 1 2 1 2 0 1 0 0 0 -
65 SWK Germany 1 2 2 1 0 0 0 0 0 0
66 TEAG Germany 1 2 1 1 0 0 0 0 0 Refers to general websites on national policies towards energy efficiency
67 Vattenfall Germany 1 2 1 1 0 1 0 0 0
A link on the bill is indicated, refering to energy-saving tips on the utility's website, as well as to national policies towards energy efficiency
68 Voltera Germany 1 2 1 2 0 0 0 0 0 0
69 Watt + Volt Greece 2 1 1
70 E.ON Hungary 1 1 1 2 0 0 0 0 0 0
71 A2A Italy 1 2 1 2 0 0 0 0 0 0
72 Dolomiti Energia Italy 1 2 1 2 0 0 0 0 0 0
73 È nostra Italy 1 1 1 2 0 0 0 0 0 0
74 Enel Energy Italy 1 1 1 2 0 0 0 0 0 0
75 Enerxenia Italy 1 2 1 2 0 0 0 0 0 0
76 Hera Comm Italy 1 2 1 2 0 0 0 0 0 0
77 Servizio Elettrico Nazionale
Italy 1 1 1 2 0 0 0 0 0
78 Tokyo Gas Japan 2 1 2
79 Automated Revenue Management Services Limited
Malta 1 1 1 2 0 1 0 1 0
80 Essent Netherlands
1 1 2 1 0 0 0 0 0 0
81 Nuon Netherlands
1 1 3 1 0 0 0 1 1 0
82 Lyse Norway 1 1 1 2 0 0 0 0 0 0
83 Norges Energi Norway 1 1 1 2 0 0 0 0 0 0
84 Coopernico Portugal 1 1 1 2 0 0 0 0 0 0
85 EDA Portugal 1 1 1 2 0 0 0 0 0 0
86 EDP Portugal 1 1 1 2 1 0 0 0 0 0
87 Endesa Portugal 1 1 1 2 0 0 0 0 0 0
88 Galp on Portugal 1 1 2 2 0 0 0 0 0 0
89 Gas Natural Fenosa Portugal 1 1 1 2 0 0 0 0 0 0
90 Bord Gàis Energy Rep. Ireland
1 2 1 2 0 1 0 0 0 0

A-75
91 Electric Ireland SmarterLiving
Rep. Ireland
1 1 1 2 0 0 0 0 0 0
92 Energia Switched On Rep. Ireland
1 2 1 2 0 0 0 0 0 0
93 SSE Airtricity Rep. Ireland
1 2 2 2 0 0 0 0 0 0
94 Enel Romania 1 1 1 2 0 0 0 0 0 0
95 UNKNOW UTILITY Rwanda 1 1 1 0 0 0 0 0 0
96 Endesa Spain 1 2 1 2 1 0 0 0 0 0
97 Iberdola Spain 1 1 1 2 0 0 0 0 0 0
98 Som Energia Spain 1 1 1 2 0 0 0 0 0 0
99 BestEl Sweden 1 2 1 2 0 0 0 0 0 0
100 E.ON Sweden 1 1 1 1 0 0 0 0 0 0
101 öresunds Kraft AB Sweden 1 2 7 2 0 0 0 0 0 0
102 Oskarshamn Energi Sweden 1 2 1 2 0 0 0 0 0 0
103 Skanska Sweden 1 1 1 0 0 0 0 0 0
104 Yagmur Group Turkey 2 2 1 2
105 Bristol Energy UK 1 2 2 2 0 0 0 0 0 0
106 British Gas UK 1 2 2 2 0 0 0 0 0 0
107 Coop energy UK 1 2 2 1 0 0 0 0 0 0
108 E.ON UK 1 1 2 2 0 0 0 0 0 0
109 Ecotricity UK 1 2 2 2 0 0 0 0 0 0
110 EDF UK 1 1 2 3 0 0 0 0 0 0
111 First Utility UK 1 2 2 2 0 0 0 0 0 0
112 GB Energy Supply UK 1 1 1 2 0 0 0 0 0 0
113 iSupply Energy UK 1 2 1 3 0 0 0 0 0 0
114 Npower UK
1 2 2 3 0 1 0 0 0 A link on the bill is indicated, refering to energy-saving tips on the utility's website
115 OVO Energy UK 1 1 2 2 0 0 0 0 0 0
116 Scottish Power UK 1 1 1 3 0 0 0 0 0 0
117 So Energy UK 1 2 2 2 0 0 0 0 0 0
118 Spark Energy UK 1 2 2 2 0 0 0 0 0 0
119 SSE UK 1 2 1 2 0 0 0 0 0 0
120 AEP Ohio USA 1 2 1 2 0 1 0 0 0 0
121 Con Edison USA 1 2 2 2 0 0 1 1 0 0
122 Memphis Light, Gas and Water
USA 1 1 2 2 0 0 0 0 0 0
123 National Grid USA 1 2 1 2 0 1 0 1 1 0
124 PECO Energy Company USA 1 2 2 2 0 0 0 1 1 0
125 SMUD USA 1 2 1 2 0 1 1 1 1 0

A-76
B) Gas bills
a. TRANSPARENT ACCOUNTING
RESIDENTIAL GAS BILL- TRANSPARENT ACCOUNTING
ID Utility name Country
An
alyz
ed
(1: y
es, /
2: n
o) Source
(1: personal contacts abroad
2: Internet search)
Consumptions accounted for by the bill (1: electricity 2: electricity-gas 3: electricitiy-district heating 4: gas 5: gas-district heating 6: district heating 7 : electricity - gas - district heating)
Bill type (1 = annual balance bill; 2 = interim
bill; 3 = annual
and interim)
G01 Meter
reading type (estimated or actual)
G02 Total
amount due
G03 Disaggregatio
n of billing costs
G04 Energy
usage in [kWh]
G05 Unit rate of energy [costs/kW
h]
G06 Visual chart
breakdown of
billing costs
G07 Other
1 Momentum Energy Australia 1 2 4 2 1 1 1 1 1 0 0
2 EKG - Energie Klagenfurt
Austria 1 2 4 1 1 1 1 1 1 0 0
3 Energie AG Austria 1 2 4 1 1 1 1 1 1 0 0
4 Energie Burgenland Austria 1 2 2 1 1 1 1 1 1 0 0
5 Energie Steiermark Austria 1 2 4 1 1 1 1 1 1 0 0
6 EVN Austria 1 2 4 1 1 1 1 1 1 0 0
7 Linz AG Austria 1 2 4 1 1 1 1 1 1 0 0
8 MONTANA Energie-Handel
Austria 1 2 4 1 1 1 1 1 1 0 0
9 MyElectric Austria 1 2 2 2 1 1 1 1 1 0 0
10 Oekostrom AG Austria 1 2 4 2 1 1 1 1 1 0 0
11 Switch Energievertrieb Austria 1 2 4 1 1 1 1 1 1 0 0
12 Unsere Wasserkraft GmbH
Austria 1 2 4 1 1 1 1 1 1 0 0
13 ENI Gas & Power Belgium 1 2 2 2 1 1 1 1 0 0 0
14 Luminus Belgium 1 2 2 1 1 1 1 1 1 1 0
15 GasNatural Fenosa Brazil 1 1 4 2 1 1 1 1 0 0 0
16 SuperGasBras Brazil 1 1 4 2 1 1 0 1 0 0 0
17 UNKNOWN UTILITY China 2 1 4
18 Prazska Plynarenska Czech Republic
1 1 4 1 0 1 1 1 1 0 0

A-77
19 DGD Danks Gas Distribution
Denmark 1 2 4 1 1 1 1 1 1 0 0
20 HMN Naturgas Denmark 1 2 4 2 1 1 1 1 1 0 0
21 Direct Energy France 1 1 2 2 1 1 1 1 1 0 0
22 Engie France 1 1 2 1 1 1 1 1 1 0 0
23 BS Energy Germany 1 2 2 2 1 1 1 1 1 0 0
24 Eins - Energie in Sachsen
Germany 1 2 4 2 0 1 1 1 1 0 0
25 Entega Germany 1 2 2 1 0 1 1 1 1 0 0
26 Eprimo Germany 1 1 4 1 1 0 1 1 1 0 0
27 EVO Germany 1 2 4 1 0 1 1 1 1 0 0
28 EWE Germany 1 2 4 1 1 1 1 1 1 0 0
29 Greenpeace Energy Germany 1 2 4 1 1 1 1 1 1 0 0
30 Hamburg Energie Germany 1 2 4 1 0 1 1 1 1 0 0
31 Lekker.de Germany 1 2 4 1 0 1 1 1 1 0 0
32 MAINOVA Germany 1 2 4 1 1 1 1 1 1 0 0
33 MONTANA Energie-Handel
Germany 1 2 2 1 1 1 1 1 1 0 0
34 Naturstrom Biogas Germany 1 2 4 1 1 1 1 1 1 0 0
35 Prioenergie Germany 1 2 4 1 1 1 1 1 1 1 0
36 Rheinenergie Germany 1 2 4 1 0 1 1 1 1 0 0
37 Stadtwerke Düsseldorf Germany 1 2 4 1 1 1 1 1 1 0 0
38 SWK Germany 1 2 2 1 0 1 1 1 1 1 0
39 TEAG Germany 1 2 4 1 1 1 1 1 1 0 0
40 Fogaz Hungary 1 1 4 3 1 1 1 1 1 0 0
41 A2A Energia Italy 1 2 4 2 1 1 1 1 1 1 0
42 Dolomiti Energia Italy 1 2 4 2 1 1 1 1 1 0 0
43 Enel Energy Italy 1 1 4 2 1 1 1 1 1 1 1
44 Enerxenia Italy 1 1 4 2 1 1 1 1 1 0 0
45 Eni spa Italy 1 1 4 2 1 1 1 1 1 0 0
46 Tokyo Gas Japan 2 1 2
47 Essent Netherlands
1 1 2 1 1 1 1 1 1 0 0
48 EDP Portugal 1 1 4 2 1 1 1 1 1 1 0
49 Endesa Portugal 1 2 4 2 1 1 1 1 1 1 0

A-78
50 Galp Energia Portugal 1 1 4 2 1 1 1 1 1 0 0
51 Galp on Portugal 1 1 2 2 1 1 1 1 1 0 0
52 Gascan Portugal 1 1 4 2 1 1 1 1 0 0 0
53 Bord Gàis Energy Rep. Ireland
1 2 4 2 1 1 1 1 1 0 0
54 Electric Ireland SmarterLiving
Rep. Ireland
1 2 4 2 1 1 1 1 1 0 0
55 Energia Switched on Rep. Ireland
1 2 4 2 1 1 1 1 1 0 0
56 SSE Airtricity Rep. Ireland
1 2 2 2 1 1 1 1 1 0 0
57 EON Romania 1 1 4 2 1 1 1 1 1 0 0
58 EDP Spain 1 1 4 2 1 1 1 1 1 0 0
59 Endesa Spain 1 1 4 2 1 1 1 1 1 0 0
60 öresunds Kraft AB Sweden 1 2 7 2 1 1 1 1 1 0 0
61 Bristol Energy UK 1 2 2 2 1 1 1 1 1 0 0
62 British Gas UK 1 2 2 2 1 1 1 1 1 0 0
63 Coop energy UK 1 2 2 1 1 1 1 1 1 0 0
64 E.ON UK 1 1 2 2 1 1 1 1 1 0 0
65 Ecotricity UK 1 2 2 2 1 1 1 1 1 0 0
66 EDF UK 1 1 2 3 1 1 1 1 1 0 0
67 First Utility UK 1 2 2 2 1 1 1 1 1 0 0
68 iSupply Energy UK 1 2 4 3 1 1 1 1 1 0 0
69 Npower UK 1 2 2 3 1 1 1 1 1 1 0
70 OVO Energy UK 1 1 2 2 1 1 1 1 1 0 0
71 Scottish Power UK 1 1 4 3 1 1 1 1 1 0 0
72 So Energy UK 1 2 2 2 1 1 1 1 1 0 0
73 Spark Energy UK 1 2 2 2 1 1 1 1 1 0 0
74 Con Edison USA 1 2 2 2 1 1 1 1 1 0 0
75 Memphis Light, Gas and Water
USA 1 1 2 2 1 1 1 1 1 0 0
76 National Grid USA 1 2 4 2 1 1 1 1 1 0 0
77 PECO Energy Company USA 1 2 2 2 1 1 1 1 1 0 0
78 SMUD USA 1 2 4 2 1 1 1 1 1 0 0

A-79
b. COMPARATIVE STATISTICS
RESIDENTIAL GAS BILL - COMPARATIVE STATISTICS
ID Utility name Country
An
alyz
ed
(1
: yes
, 2: n
o)
Sou
rce
(1: p
erso
nal
co
nta
cts
abro
ad
2: I
nte
rnet
sea
rch
)
Consumptions accounted for by the bill (1: electricity 2: electricity-gas 3: electricitiy-district heating 4: gas 5: gas-district heating 6: district heating 7 : electricity - gas - district heating)
Bill type (1 =
annual balance bill; 2 = interim
bill; 3 =
annual and
interim)
G08 Average daily energy
use and
costs
G09 Graph
of curren
t energy usage
G10 Graph
of histori
cal energy
use
G11 a Current energy usage
compared to
previous
month
G11 b Current energy usage
compared to
previous year
(same period)
G12 Current energy usage
compared to
similar household
s
G13 Current energy usage
compared to similar
households in the same
area
G14 Energy usage
pattern variatio
n according to
seasons
G15 Correlation
between energy usage and
temperature/
weather conditions
G16 Other
1 Momentum Energy Australia 1 2 4 2 1 0 1 0 1 1 0 1 0 0
2 EKG - Energie Klagenfurt
Austria 1 2 4 1 0 0 0 0 0 0 0 0 0 0
3 Energie AG Austria 1 2 4 1 1 0 0 0 1 0 0 0 0 0
4 Energie Burgenland Austria 1 2 2 1 0 0 0 0 1 0 0 0 0 0
5 Energie Steiermark Austria 1 2 4 1 0 0 0 0 1 0 0 0 0 0
6 EVN Austria 1 2 4 1 1 0 0 0 1 0 0 0 0 0
7 Linz AG Austria 1 2 4 1 0 0 1 0 1 0 0 0 0 0
8 MONTANA Energie-Handel
Austria 1 2 4 1 1 0 0 0 1 0 0 0 0 0
9 MyElectric Austria 1 2 2 2 1 0 0 0 1 0 0 0 1 0
10 Oekostrom AG Austria 1 2 4 2 0 0 0 0 0 0 0 0 0 0
11 Switch Energievertrieb Austria 1 2 4 1 1 0 0 0 0 0 0 0 0 0
12 Unsere Wasserkraft GmbH
Austria 1 2 4 1 0 0 0 0 0 0 0 0 0 0
13 ENI Gas & Power Belgium 1 2 2 2 0 0 0 0 0 0 0 0 0 0
14 Luminus Belgium 1 2 2 1 0 0 1 0 1 0 0 0 0 0
15 GasNatural Fenosa Brazil 1 1 4 2 0 0 1 0 0 0 0 0 0 0
16 SuperGasBras Brazil 1 1 4 2 0 0 0 0 0 0 0 0 0 0
17 UNKNOWN UTILITY China 2 1 4
18 Prazska Plynarenska Czech Republic
1 1 4 1 0 0 0 0 0 0 0 0 0 0
19 DGD Danks Gas Distribution
Denmark 1 2 4 1 0 0 0 0 0 0 0 0 0 0
20 HMN Naturgas Denmark 1 2 4 2 0 0 0 0 0 0 0 0 0 0

A-80
21 Direct Energy France 1 1 2 2 0 0 0 0 0 0 0 0 0 0
22 Engie France 1 1 2 1 0 0 0 0 0 0 0 0 0 0
23 BS Energy Germany 1 2 2 2 0 0 0 0 1 1 0 0 0 0
24 Eins - Energie in Sachsen
Germany 1 2 4 2 0 0 0 0 0 1 0 0 0 0
25 Entega Germany 1 2 2 1 0 0 0 0 1 1 0 0 0 0
26 Eprimo Germany 1 1 4 1 0 0 0 0 1 1 0 0 0 0
27 EVO Germany 1 2 4 1 0 0 0 0 1 1 0 0 0 0
28 EWE Germany 1 2 4 1 0 0 0 0 1 1 0 0 0 0
29 Greenpeace Energy Germany 1 2 4 1 1 0 0 0 1 0 0 0 0 0
30 Hamburg Energie Germany 1 2 4 1 0 0 0 0 1 1 0 0 0 0
31 Lekker.de Germany 1 2 4 1 0 0 0 0 1 0 0 0 0
States the % saved ((or wasted) in regards to past consumption
32 MAINOVA Germany 1 2 4 1 0 0 0 0 0 1 0 0 0
Comparison of households is based on building type (passive house, refurbished, new etc.) and kWh/m2 consumed
33 MONTANA Energie-Handel
Germany 1 2 2 1 0 0 0 0 0 1 0 0 0 0
34 Naturstrom Biogas Germany 1 2 4 1 0 0 0 0 1 1 0 0 0 0
35 Prioenergie Germany 1 2 4 1 0 0 0 0 0 1 0 0 0
Comparison of households is based on building type (single, appartment, duplex etc.) and kWh/m2 consumed
36 Rheinenergie Germany 1 2 4 1 0 0 0 0 1 1 0 0 0 0
37 Stadtwerke Düsseldorf Germany 1 2 4 1 0 0 0 0 1 1 0 0 0 0
38 SWK Germany 1 2 2 1 0 0 0 0 0 1 0 0 0 0

A-81
39 TEAG Germany 1 2 4 1 0 0 0 0 0 1 0 0 0
Comparison of households is based on building type (year of construction, refurbishment, etc.) and kWh/m2 consumed
40 Fogaz Hungary 1 1 4 3 0 0 0 0 0 0 0 0 0 0
41 A2A Energia Italy 1 2 4 2 0 1 1 1 1 0 0 0 0 0
42 Dolomiti Energia Italy 1 2 4 2 0 0 1 1 0 0 0 0 0 0
43 Enel Energy Italy 1 1 4 2 0 0 1 1 1 0 0 0 0 0
44 Enerxenia Italy 1 1 4 2 0 0 1 1 0 0 0 0 0 0
45 Eni spa Italy 1 1 4 2 0 0 1 1 0 0 0 0 0 0
46 Tokyo Gas Japan 2 1 2
47 Essent Netherlands
1 1 2 1 0 0 0 1 1 1 0 0 0 0
48 EDP Portugal 1 1 4 2 0 0 0 0 0 0 0 0 0 0
49 Endesa Portugal 1 2 4 2 0 0 1 0 0 0 0 0 0 0
50 Galp Energia Portugal 1 1 4 2 0 0 1 0 0 0 0 0 0 0
51 Galp on Portugal 1 1 2 2 0 0 1 1 0 0 0 0 0 0
52 Gascan Portugal 1 1 4 2 0 0 1 0 0 0 0 0 0 0
53 Bord Gàis Energy Rep. Ireland
1 2 4 2 0 0 0 0 0 0 0 0 0 0
54 Electric Ireland SmarterLiving
Rep. Ireland
1 2 4 2 0 0 0 0 0 0 0 0 0 0
55 Energia Switched on Rep. Ireland
1 2 4 2 0 0 0 0 0 0 0 0 0 0
56 SSE Airtricity Rep. Ireland
1 2 2 2 0 0 0 0 0 0 0 0 0 0
57 EON Romania 1 1 4 2 0 0 0 0 0 0 0 0 0 0
58 EDP Spain 1 1 4 2 1 0 1 0 0 0 0 0 0 0
59 Endesa Spain 1 1 4 2 0 0 1 0 0 0 0 0 0 0
60 öresunds Kraft AB Sweden 1 2 7 2 0 0 0 0 0 0 0 0 0 0
61 Bristol Energy UK 1 2 2 2 0 0 0 0 0 0 0 0 0 0
62 British Gas UK 1 2 2 2 0 0 0 1 0 0 0 0 0 0
63 Coop energy UK 1 2 2 1 0 0 0 0 0 0 0 0 0 0
64 E.ON UK 1 1 2 2 0 0 0 0 1 0 0 0 0 0
65 Ecotricity UK 1 2 2 2 0 0 0 0 1 0 0 0 0 0
66 EDF UK 1 1 2 3 0 0 1 0 1 0 0 0 0 0
67 First Utility UK 1 2 2 2 0 0 0 0 1 0 0 0 0 0

A-82
68 iSupply Energy UK 1 2 4 3 0 0 0 0 0 0 0 0 0 0
69 Npower UK 1 2 2 3 0 0 0 0 1 0 0 0 0 0
70 OVO Energy UK 1 1 2 2 0 0 0 0 0 0 0 0 0 0
71 Scottish Power UK 1 1 4 3 0 0 0 0 1 0 0 0 0 0
72 So Energy UK 1 2 2 2 0 0 0 0 0 0 0 0 0 0
73 Spark Energy UK 1 2 2 2 0 0 0 0 1 0 0 0 0 0
74 Con Edison USA 1 2 2 2 0 1 1 0 0 0 0 0 0 0
75 Memphis Light, Gas and Water
USA 1 1 2 2 0 0 0 0 0 0 0 0 0 0
76 National Grid USA 1 2 4 2 1 0 1 1 1 0 0 0 0 0
77 PECO Energy Company USA 1 2 2 2 0 0 1 1 1 0 0 0 0 0
78 SMUD USA 1 2 4 2 1 1 1 1 1 0 0 0 0 0

A-83
c. ECO-FEEDBACK ON CLIMATE AND ENVIRONEMENTAL IMPACT
RESIDENTIAL GAS BILL - CLEAN ENERGY SECTION
ID Utility name Country
An
alyz
ed
(1: y
es, 2
: no
)
Sou
rce
(1: p
erso
nal
co
nta
cts
abro
ad
2: I
nte
rnet
sea
rch
) Consumptions accounted for by the bill (1: electricity 2: electricity-gas 3: electricitiy-district heating 4: gas 5: gas-district heating 6: district heating 7 : electricity - gas - district heating)
Bill type (1 = annual
balance bill; 2 = interim bill;
3 = annual and interim)
G17 Alternative
metrics (e.g. CO2
equivalent emissions,
carbon footprint etc.)
G18 Other
1 Momentum Energy Australia 1 2 4 2 0 0
2 EKG - Energie Klagenfurt
Austria 1 2 4 1 0 0
3 Energie AG Austria 1 2 4 1 0 0
4 Energie Burgenland Austria 1 2 2 1 0 0
5 Energie Steiermark Austria 1 2 4 1 0 0
6 EVN Austria 1 2 4 1 0 0
7 Linz AG Austria 1 2 4 1 0 0
8 MONTANA Energie-Handel
Austria 1 2 4 1 0 0
9 MyElectric Austria 1 2 2 2 0 0
10 Oekostrom AG Austria 1 2 4 2 0 0
11 Switch Energievertrieb Austria 1 2 4 1 0 0
12 Unsere Wasserkraft GmbH
Austria 1 2 4 1 0 0
13 ENI Gas & Power Belgium 1 2 2 2 0 0
14 Luminus Belgium 1 2 2 1 1 0
15 GasNatural Fenosa Brazil 1 1 4 2 0 0
16 SuperGasBras Brazil 1 1 4 2 0 0
17 UNKNOWN UTILITY China 2 1 4
18 Prazska Plynarenska Czech Republic
1 1 4 1 0 0
19 DGD Danks Gas Distribution
Denmark 1 2 4 1 0 0

A-84
20 HMN Naturgas Denmark 1 2 4 2 0 0
21 Direct Energy France 1 1 2 2 0 0
22 Engie France 1 1 2 1 0 0
23 BS Energy Germany 1 2 2 2 0 0
24 Eins - Energie in Sachsen
Germany 1 2 4 2 0 0
25 Entega Germany 1 2 2 1 0 0
26 Eprimo Germany 1 1 4 1 0 0
27 EVO Germany 1 2 4 1 0 0
28 EWE Germany 1 2 4 1 0 0
29 Greenpeace Energy Germany 1 2 4 1 0 0
30 Hamburg Energie Germany 1 2 4 1 0 0
31 Lekker.de Germany 1 2 4 1 0 0
32 MAINOVA Germany 1 2 4 1 0 0
33 MONTANA Energie-Handel
Germany 1 2 2 1 0 0
34 Naturstrom Biogas Germany 1 2 4 1 0 0
35 Prioenergie Germany 1 2 4 1 0 0
36 Rheinenergie Germany 1 2 4 1 0 0
37 Stadtwerke Düsseldorf Germany 1 2 4 1 0 0
38 SWK Germany 1 2 2 1 0 1
39 TEAG Germany 1 2 4 1 0 0
40 Fogaz Hungary 1 1 4 3 0 0
41 A2A Energia Italy 1 2 4 2 0 0
42 Dolomiti Energia Italy 1 2 4 2 0 0
43 Enel Energy Italy 1 1 4 2 0 0
44 Enerxenia Italy 1 1 4 2 0 0
45 Eni spa Italy 1 1 4 2 0 0
46 Tokyo Gas Japan 2 1 2
47 Essent Netherlands
1 1 2 1 0 0
48 EDP Portugal 1 1 4 2 0 0
49 Endesa Portugal 1 2 4 2 1 0
50 Galp Energia Portugal 1 1 4 2 0 0

A-85
51 Galp on Portugal 1 1 2 2 0 0
52 Gascan Portugal 1 1 4 2 0 0
53 Bord Gàis Energy Rep. Ireland
1 2 4 2 0 0
54 Electric Ireland SmarterLiving
Rep. Ireland
1 2 4 2 0 0
55 Energia Switched on Rep. Ireland
1 2 4 2 0 0
56 SSE Airtricity Rep. Ireland
1 2 2 2 0 0
57 EON Romania 1 1 4 2 0 0
58 EDP Spain 1 1 4 2 0 0
59 Endesa Spain 1 1 4 2 0 0
60 öresunds Kraft AB Sweden 1 2 7 2 0 0
61 Bristol Energy UK 1 2 2 2 0 0
62 British Gas UK 1 2 2 2 0 0
63 Coop energy UK 1 2 2 1 0 0
64 E.ON UK 1 1 2 2 0 0
65 Ecotricity UK 1 2 2 2 0 0
66 EDF UK 1 1 2 3 0 0
67 First Utility UK 1 2 2 2 0 0
68 iSupply Energy UK 1 2 4 3 0 0
69 Npower UK 1 2 2 3 0 0
70 OVO Energy UK 1 1 2 2 0 0
71 Scottish Power UK 1 1 4 3 0 0
72 So Energy UK 1 2 2 2 0 0
73 Spark Energy UK 1 2 2 2 0 0
74 Con Edison USA 1 2 2 2 0 0
75 Memphis Light, Gas and Water
USA 1 1 2 2 0 0
76 National Grid USA 1 2 4 2 0 0
77 PECO Energy Company USA 1 2 2 2 0 0
78 SMUD USA 1 2 4 2 0 0

A-86
d. TIPS & ADVICES
RESIDENTIAL GAS BILL - TIPS & ADVICES
ID Utility name Country
An
alyz
ed
(1: y
es, 2
: no
)
Sou
rce
(1: p
erso
nal
co
nta
cts
abro
ad
2: I
nte
rnet
sea
rch
)
Consumptions accounted for by the bill (1: electricity 2: electricity-gas 3: electricitiy-district heating 4: gas 5: gas-district heating 6: district heating 7 : electricity - gas - district heating)
Bill type (1 = annual balance bill; 2 = interim
bill; 3 = annual
and interim)
G19 One-size-
fits-all, general energy-saving
tips and advices
G20 Customize
d, actionable
insights to manage
energy costs &
consumption
G21 Advice on time-of-
day tariffs or other dynamic
tariffs
G22 Explanatio
n of key terms (e.g. kWh,
m3, specific
surcharges etc.)
G23 Contact info on customer
service offering
customized energy-
efficiency specific
consultancy
G23 Other
1 Momentum Energy Australia 1 2 4 2 0 0 0 0 0 0
2 EKG - Energie Klagenfurt
Austria 1 2 4 1 0 0 0 1 0 0
3 Energie AG Austria 1 2 4 1 0 0 0 0 0 0
4 Energie Burgenland Austria 1 2 2 1 0 1 0 0 0 0
5 Energie Steiermark Austria 1 2 4 1 0 0 0 0 0 0
6 EVN Austria 1 2 4 1 0 0 0 1 1 A link on the bill is indicated, refering to energy-saving tips on the utility's website
7 Linz AG Austria 1 2 4 1 0 0 0 0 0 0
8 MONTANA Energie-Handel
Austria 1 2 4 1 0 0 0 0 0 0
9 MyElectric Austria 1 2 2 2 1 0 0 0 1 0
10 Oekostrom AG Austria 1 2 4 2 0 0 0 1 0 0
11 Switch Energievertrieb Austria 1 2 4 1 0 0 0 1 0 0
12 Unsere Wasserkraft GmbH
Austria 1 2 4 1 0 0 0 1 0 0
13 ENI Gas & Power Belgium 1 2 2 2 0 0 0 0 0 0
14 Luminus Belgium 1 2 2 1 0 0 0 0 0 0
15 GasNatural Fenosa Brazil 1 1 4 2 0 0 0 0 0 0
16 SuperGasBras Brazil 1 1 4 2 0 0 0 0 0 0
17 UNKNOWN UTILITY China 2 1 4
18 Prazska Plynarenska Czech Republic
1 1 4 1 0 0 0 0 0 0
19 DGD Danks Gas Distribution
Denmark 1 2 4 1 0 0 0 0 0 0
20 HMN Naturgas Denmark 1 2 4 2 0 0 0 0 0 0
21 Direct Energy France 1 1 2 2 0 0 0 0 0 0

A-87
22 Engie France 1 1 2 1 0 0 0 0 0 0
23 BS Energy Germany 1 2 2 2 0 0 0 0 0 Refers to general websites on national policies towards energy efficiency
24 Eins - Energie in Sachsen
Germany 1 2 4 2 0 0 0 1 0
A link on the bill is indicated, refering to energy-saving tips on the utility's website, as well as to national policies towards energy efficiency
25 Entega Germany 1 2 2 1 0 0 0 0 0 0
26 Eprimo Germany 1 1 4 1 0 0 0 1 1
A link on the bill is indicated, refering to energy-saving tips on the utility's website, as well as to national policies towards energy efficiency
27 EVO Germany 1 2 4 1 0 0 0 1 1
A link on the bill is indicated, refering to energy-saving tips on the utility's website, as well as to national policies towards energy efficiency
28 EWE Germany 1 2 4 1 0 0 0 0 0
29 Greenpeace Energy Germany 1 2 4 1 0 0 0 0 0
30 Hamburg Energie Germany 1 2 4 1 0 0 0 1 0
A link on the bill is indicated, refering to energy-saving tips on the utility's website, as well as to national policies towards energy efficiency
31 Lekker.de Germany 1 2 4 1 1 0 0 1 0 A link on the bill is indicated, refering to energy-saving tips on the utility's website
32 MAINOVA Germany 1 2 4 1 0 0 0 1 1
A link on the bill is indicated, refering to energy-saving tips on the utility's website, as well as to national policies towards energy efficiency
33 MONTANA Energie-Handel
Germany 1 2 2 1 0 0 0 1 0 Refers to general websites on national policies towards energy efficiency
34 Naturstrom Biogas Germany 1 2 4 1 0 0 0 1 0 Refers to general websites on national policies towards energy efficiency
35 Prioenergie Germany 1 2 4 1 0 0 0 1 0 Refers to general websites on national policies towards energy efficiency

A-88
36 Rheinenergie Germany 1 2 4 1 0 0 0 1 0 Refers to general websites on national policies towards energy efficiency
37 Stadtwerke Düsseldorf Germany 1 2 4 1 0 0 0 1 1 Refers to general websites on national policies towards energy efficiency
38 SWK Germany 1 2 2 1 0 0 0 0 0 0
39 TEAG Germany 1 2 4 1 0 0 0 1 0 Refers to general websites on national policies towards energy efficiency
40 Fogaz Hungary 1 1 4 3 0 0 0 0 0 0
41 A2A Energia Italy 1 2 4 2 0 0 0 0 0 0
42 Dolomiti Energia Italy 1 2 4 2 0 0 0 0 0 0
43 Enel Energy Italy 1 1 4 2 0 0 0 0 0 0
44 Enerxenia Italy 1 1 4 2 0 0 0 0 0 0
45 Eni spa Italy 1 1 4 2 0 0 0 0 0 0
46 Tokyo Gas Japan 2 1 2
47 Essent Netherlands 1 1 2 1 0 0 0 0 0 0
48 EDP Portugal 1 1 4 2 1 0 0 0 0 0
49 Endesa Portugal 1 2 4 2 0 0 0 0 0 0
50 Galp Energia Portugal 1 1 4 2 0 0 0 0 0 0
51 Galp on Portugal 1 1 2 2 0 0 0 0 0 0
52 Gascan Portugal 1 1 4 2 0 0 0 0 0 0
53 Bord Gàis Energy Rep. Ireland 1 2 4 2 0 0 0 0 0 0
54 Electric Ireland Rep. Ireland 1 2 4 2 0 0 0 0 0 0
55 Energia Switched on Rep. Ireland 1 2 4 2 0 0 0 0 0 0
56 SSE Airtricity Rep. Ireland 1 2 2 2 0 0 0 1 0 0
57 EON Romania 1 1 4 2 0 0 0 0 0 0
58 EDP Spain 1 1 4 2 0 0 0 0 0 0
59 Endesa Spain 1 1 4 2 0 0 0 0 0 0
60 öresunds Kraft AB Sweden 1 2 7 2 0 0 0 0 0 0
61 Bristol Energy UK 1 2 2 2 0 0 0 0 0 0
62 British Gas UK 1 2 2 2 0 0 0 0 0 0
63 Coop energy UK 1 2 2 1 0 0 0 0 0 0
64 E.ON UK 1 1 2 2 0 0 0 0 0 0
65 Ecotricity UK 1 2 2 2 0 0 0 0 0 0
66 EDF UK 1 1 2 3 0 0 0 0 0 0
67 First Utility UK 1 2 2 2 0 0 0 0 0 0
68 iSupply Energy UK 1 2 4 3 0 0 0 0 0 0
69 Npower UK 1 2 2 3 0 0 0 0 0 0
70 OVO Energy UK 1 1 2 2 0 0 0 0 0 0
71 Scottish Power UK 1 1 4 3 0 0 0 0 0 0

A-89
72 So Energy UK 1 2 2 2 0 0 0 0 0 0
73 Spark Energy UK 1 2 2 2 0 0 0 0 0 0
74 Con Edison USA 1 2 2 2 0 0 0 0 0 0
75 Memphis Light, Gas and Water
USA 1 1 2 2 0 0 0 0 0 0
76 National Grid USA 1 2 4 2 0 0 0 0 0 0
77 PECO Energy Company USA 1 2 2 2 0 0 0 1 0 0
78 SMUD USA 1 2 4 2 0 0 0 0 0 0

A-90
C) District Heating bills
a. TRANSPARENT ACCOUNTING
RESIDENTIAL DISTRICT HEATING BILL - TRANSPARENT ACCOUNTING
ID Utility name Country
An
alyz
ed
(1
: yes
, 2: n
o)
Sou
rce
(1: p
erso
nal
co
nta
cts
abro
ad
2: I
nte
rnet
sea
rch
)
Consumptions accounted for by the bill (1: electricity 2: electricity-gas 3: electricitiy-district heating 4: gas 5: gas-district heating 6: district heating 7 : electricity - gas - district heating)
Bill type (1 = annual
balance bill; 2 = interim bill;
3 = annual and interim)
DH01 Meter
reading type
(estimated or actual)
DH02 Total
amount due
DH03 Disaggregation of billing costs
DH04 Energy usage
in [m3] or [kWh]
DH05 Unit rate of
energy [costs/kWh]
or [costs/m3]
DH06 Visual chart breakdown
of billing costs
DH07 Other
1 EKG - Energie Klagenfurt
Austria 1 2 6 1 1 1 1 1 1 0 0
2 Energie Burgenland Austria 1 2 6 1 1 1 1 1 1 0 0
3 Energie Steiermark Austria 1 2 6 1 1 1 1 1 1 0 0
4 Linz AG Wärme Austria 1 2 6 1 1 1 0 1 1 0 0
5 HOFOR Denmark 1 2 6 1 0 0 1 0 0 0 0
6 Hera Comm Italy 1 2 6 2 1 1 1 1 1 0 0
7 Nuon Netherlands 1 1 3 1 1 1 1 1 0 0 0
8 öresunds_Kraft Sweden 1 2 7 2 1 1 1 1 1 0 0
9 Oskarshamn Energi Sweden 1 2 6 2 1 1 1 1 1 0 0

A-91
b. COMPARATIVE STATISTICS
RESIDENTIAL DISTRICT HEATING BILL - COMPARATIVE STATISTICS
ID Utility name Country
An
alyz
ed
(1: y
es, 2
: no
)
Sou
rce
(1: p
erso
nal
co
nta
cts
abro
ad
2: I
nte
rnet
sea
rch
)
Consumptions accounted for by the bill (1: electricity 2: electricity-gas 3: electricitiy-district heating 4: gas 5: gas-district heating 6: district heating 7 : electricity - gas - district heating)
DH08 Average
daily energy use and costs
DH09 Graph of current energy usage
DH10 Graph of historical
energy use
DH11 a Current energy usage
compared to
previous month
DH11 b Current energy usage
compared to
previous year (same
period)
DH12 Current energy usage
compared to
similar households
DH13 Current energy usage
compared to
similar households in the same
area
DH14 Energy usage
pattern variation according to seasons
DH15 Correlation
between energy usage and
temperature/
weather conditions
DH16 Other
1 EKG - Energie Klagenfurt
Austria 1 2 6 0 0 0 0 0 0 0 0 0 0
2 Energie Burgenland Austria 1 2 6 0 0 0 0 0 0 0 0 0 0
3 Energie Steiermark Austria 1 2 6 0 0 0 0 0 0 0 0 0 0
4 Linz AG Wärme Austria 1 2 6 0 0 1 0 1 0 0 0 0 0
5 HOFOR Denmark 1 2 6 0 0 0 0 0 0 0 0 0 0
6 Hera Comm Italy 1 2 6 1 0 1 1 1 0 0 0 0 0
7 Nuon Netherlands 1 1 3 0 0 0 1 0 1 0 0 0 0
8 öresunds_Kraft Sweden 1 2 7 0 0 0 0 0 0 0 0 0 0
9 Oskarshamn Energi Sweden 1 2 6 0 0 0 0 0 0 0 0 0 0

A-92
c. ECO-FEEDBACK ON CLIMATE AND ENVIRONEMENTAL IMPACT
RESIDENTIAL DISTRICT HEATING BILL - CLEAN ENERGY SECTION
ID Utility name Country
An
alyz
ed
(1: y
es, 2
: no
)
Sou
rce
(1: p
erso
nal
co
nta
cts
abro
ad
2: I
nte
rnet
sea
rch
) Consumptions accounted for by the bill (1: electricity 2: electricity-gas 3: electricitiy-district heating 4: gas 5: gas-district heating 6: district heating 7 : electricity - gas - district heating)
Bill type (1 = annual
balance bill; 2 = interim bill;
3 = annual and interim)
DH17 Alternative metrics
(e.g. CO2 equivalent emissions,
carbon footprint etc.)
DH18 Other
1 EKG - Energie Klagenfurt Austria 1 2 6 1 0 0
2 Energie Burgenland Austria 1 2 6 1 0 0
3 Energie Steiermark Austria 1 2 6 1 0 0
4 Linz AG Wärme Austria 1 2 6 1 0 0
5 HOFOR Denmark 1 2 6 1 0 0
6 Hera Comm Italy 1 2 6 2 0 0
7 Nuon Netherlands 1 1 3 1 0 0
8 öresunds_Kraft Sweden 1 2 7 2 0 0
9 Oskarshamn Energi Sweden 1 2 6 2 0 0
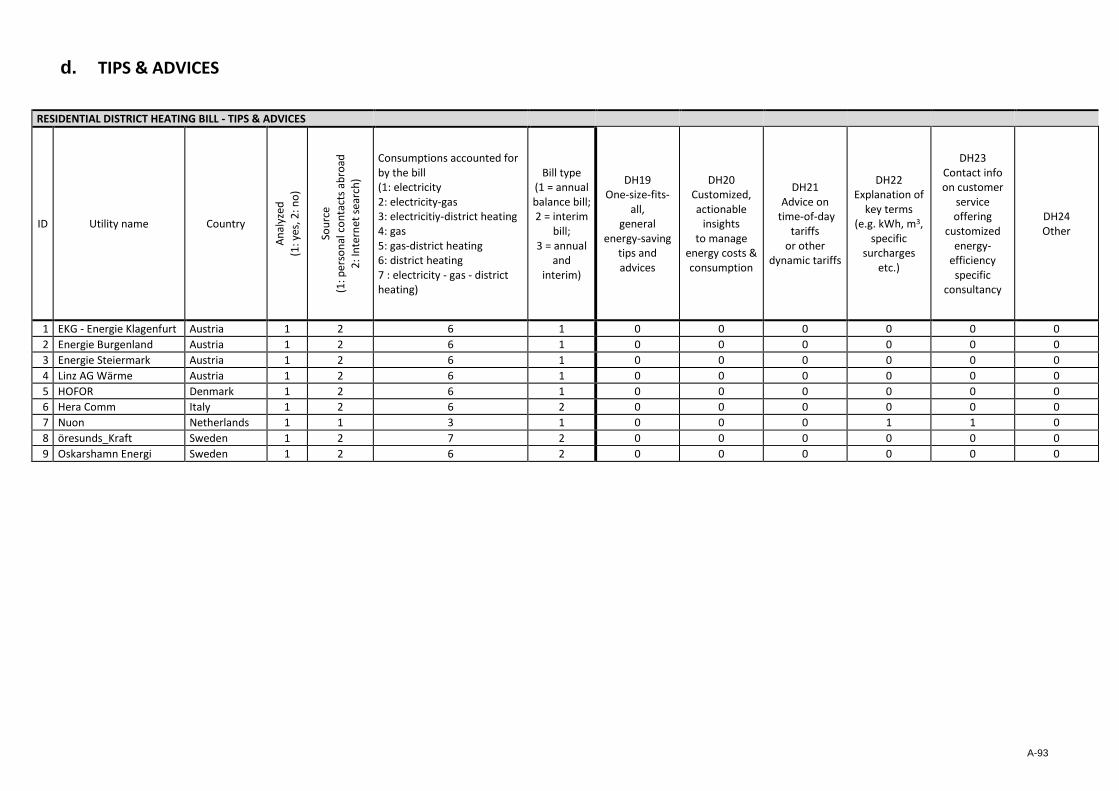
A-93
d. TIPS & ADVICES
RESIDENTIAL DISTRICT HEATING BILL - TIPS & ADVICES
ID Utility name Country
An
alyz
ed
(1: y
es, 2
: no
)
Sou
rce
(1: p
erso
nal
co
nta
cts
abro
ad
2: I
nte
rnet
sea
rch
)
Consumptions accounted for by the bill (1: electricity 2: electricity-gas 3: electricitiy-district heating 4: gas 5: gas-district heating 6: district heating 7 : electricity - gas - district heating)
Bill type (1 = annual balance bill; 2 = interim
bill; 3 = annual
and interim)
DH19 One-size-fits-
all, general
energy-saving tips and advices
DH20 Customized, actionable
insights to manage
energy costs & consumption
DH21 Advice on
time-of-day tariffs
or other dynamic tariffs
DH22 Explanation of
key terms (e.g. kWh, m3,
specific surcharges
etc.)
DH23 Contact info on customer
service offering
customized energy-
efficiency specific
consultancy
DH24 Other
1 EKG - Energie Klagenfurt Austria 1 2 6 1 0 0 0 0 0 0
2 Energie Burgenland Austria 1 2 6 1 0 0 0 0 0 0
3 Energie Steiermark Austria 1 2 6 1 0 0 0 0 0 0
4 Linz AG Wärme Austria 1 2 6 1 0 0 0 0 0 0
5 HOFOR Denmark 1 2 6 1 0 0 0 0 0 0
6 Hera Comm Italy 1 2 6 2 0 0 0 0 0 0
7 Nuon Netherlands 1 1 3 1 0 0 0 1 1 0
8 öresunds_Kraft Sweden 1 2 7 2 0 0 0 0 0 0
9 Oskarshamn Energi Sweden 1 2 6 2 0 0 0 0 0 0

Appendices - IMPROVE
A-94
Appendix 9. Categories of the Analysis Template
Description and summary Short description of the model with a brief summary
Systems and technologies
applied
A description of the used technologies within the model, e.g.
mobile app, in-home display
Behavioural change
investigated
Which behaviour is mainly addressed, e.g. routine or purchasing
behaviour?
Main focus, hypothesis and
motivation
What is the main focus of the model, what is the hypothesis of
the study and the motivation?
Behavioural change model Underlying concepts, based on known theories and models
(introduction chapter to the main body of the final report)
Key words, tags e.g. smart meter, bonus system etc.
Source, material and
literature
Source of the data used for the analysis
Country Country in which the model is applied
Geographical scope Geographical scope in which the model is usable
Monitoring and evaluation
metrics
What are the examination units, what is monitored?
Energy carrier Energy carriers for which the model is used, e.g. oil, gas,
electricity, district heating, warm water
Project period Period in which the model has been applied
Size of utility Amount of energy, which the utility provides per year
Key lessons learned Lessons learned mentioned from the initiators or project team
Feedback frequency Periodicity of the feedback
Feedback duration Continuous or finite feedback
Feedback content e.g. costs, consumption
Level of breakdown Aggregation (e.g. on appliance level)
Medium of presentation e.g. written, electronic
Mode of presentation e.g. text, numbers, graphs
Comparison to previous
consumption
Historical comparison
Comparison to the
consumption of the reference
group
Normative comparison
Gamification elements e.g. tasks, competition
Combination with other DSM
instruments
Is the model combined with other measures, e.g. information
and financial incentives?
Achieved energy savings Includes saved kWh or CHF
Affected population share Potential of the model in terms of affected people
Persistent effect Is a persistent effect of the findings existing?
Subjective Evaluation Strengths and weaknesses of the approach are described within
this section based on the subjective viewpoint of the analysing
researcher. It contains an informed valuation relating to theory.

Appendices - IMPROVE
A-95
Appendix 10. Completed Analysis Template of Assessed DSI/DSM Models
General Information I
Example of use (DSI/DSM) Short description/Summary Systems and technologies
applied Behavioural change investigated Main focus/hypothesis/motivation Model of Behaviour Change used
1 The MUNX (Web
platform from Repower
an international energy
company based in
Switzerland.
It operates along the
entire value chain, from
generation, trading,
transmission and
distribution to sales.)
The aim of the website is to show the users their consumption of electric power in an easy way. A
possibility of being familiar with the own electricity consumption is to enter the values of the
electric power meter weekly into this web platform. The users of this platform enter the meter
reading of the electric power meter weekly. They get a feedback of the consumption by comparing
it to other households/neighbours. You can also enter other parameters of your flat - for example
which energy you use for heating, how big your flat is, how many people live in your flat etc. When
you enter these parameters, you will get an energy standard mark (A, B, C etc). You can also do
some quiz to learn more about electric power and you get lots of tips about saving energy at home
and in the office. You can plan measures to save energy (e.g. plan to buy a new and more efficient
wash machine or to take a shower instead of taking a bath). You can also set a reminder (via mail
or SMS) for entering the value of the electric meter. For all these things, you can collect points and
with the points you can buy devices for saving electric power (e.g. energy saving light bulbs or
water reducing valves for the shower).
web-portal How does the consumption of power
change when the users know how much
they use; Motivate to purchase energy
efficient products
Is there an effect on the consumption of electric
power when the user knows his weekly use and
can compare it with others?
Behavioural economics: theory of planned
behaviour;
social comparison, social marketing;
behaviour barriers (e.g. knowledge
barriers)
2 Smart Metering case
study Uttwil (EKT)
Goal of the study: The study is based on accompany research on a comprehensive smart meter
rollout in two municipalities in the east of Switzerland. The main goal is to analyse the impact of
a real-time feedback system on energy consumption behaviour of pilot households as well as to
test several incentive measures. This includes the monitoring of load profiles as well as conducting
surveys among participants on a regular basis (N=200). A further aspect of the study was to gain
insight in acceptance and perceived benefits of smart meters.
smart meter, mobile app, in-
home display (iPod)
The study analyses how information on
energy use influences the behaviour of
energy consumers in terms of habit
change. Furthermore, acceptance and
attitudes towards smart meters was
evaluated.
How will different kinds of information about
energy use affect the behaviour of energy
consumers? The following types of information
are analysed: Smart meters giving immediate
feedback on energy consumption via in-home-
display (iPod app), general feedback on savings
achieved via newsletter / blog, Information on
new technical extensions of smart meter
equipment towards smart home use. Further was
inquired how a certain level of technology affinity
influences the use of the technical feedback
equipment as well as energy behaviour changes in
general. Not last it was tried to explore patterns of
usage and consumption in order to gain a better
understanding of how consumers can be grouped
in different customer segments.
Information deficit models, value action
gap, behaviour barriers (e.g. knowledge
barriers)
3 bonus model for
energy efficient
households (EWZ),
research project FP-1.9
platform "www.smart-
steps.ch" (mailing,
web-portal, newsletter
and mobile app)
aim of the project: decrease the total energy consumption of households (heat, electricity and
warm water) with IT based information systems.
A personalized efficiency platform was developed within the project. On the platform, the
interventions can be tested under real conditions.
The effect of different incentives (virtual, monetary and material) have been analysed in relation
to the motivation of using the platform.
web-portal, mailing,
newsletter, mobile app,
recommender system REX
The effect of different incentives
(virtual, monetary and material) on the
motivation of using the platform has
been analysed. Furthermore, the change
of consumption behaviour was
investigated.
How will different types of incentives influence
the use of the platform? How does the usage of
the platform influence the energy consumption?
Which activities should be rewarded for an
optimal impact? Is it possible to optimize the
probability for realised efficiency measurements
by individual recommendation?
behaviour influencing information
systems; incentive based motivating;
extrinsic and intrinsic motivation;
behavioural psychology; information
deficit models; social comparison; theory
of planned behaviour; behaviour barriers

A-96
Example of use (DSI/DSM) Short description/Summary Systems and technologies
applied Behavioural change investigated Main focus/hypothesis/motivation Model of Behaviour Change used
4 Smart Metering case
study Zurich (EWZ)
The study analyses electricity consumption over a 15 months period for around 5000 randomly
selected households in Zurich. The objective of the study is to assess the role of information on
electricity consumption. Information is improved in four different dimensions: (i) continuous and
detailed feedback about the electricity consumption by Smart Meters, (ii) expert advice on
electricity conservation, (iii) unilateral information about electricity consumption of others (social
comparison), and (iv) bilateral information about the electricity consumption of a comparable
household (social competition). The design allows to estimate the causal impact of each type of
information on behaviour.
Surveys before, during and after the field experiment allow to collect information on values,
attitudes, and further household characteristics of the participants and to assess the impact of the
treatments on outcomes beyond energy consumption, such as awareness of energy conservation
potentials, and customer satisfaction with the services provided by EWZ.
smart meter and smart meter
display
The study analyses how information on
electricity use influences the behaviour
of electricity consumers in terms of
consumption.
The study analysed the role of information on
electricity consumption.
How does a continuous and detailed information
about the electricity use influence the
consumption?
Is it possible to decrease the consumption by
professional consulting about electricity
efficiency?
Do people adapt their electricity consumption if
they receive information about the consumption
of a comparable household (with competition
aspect and without)?
behavioural economics: theory of planned
behaviour;
social norms and social comparison;
information deficit models
5 Smart Metering case
study (EKZ)
The study analyses electricity consumption over a 24 months period for around 1000 randomly
selected households in Dietikon (Switzerland). The objective of the study is to assess the role of
information and visualisation on electricity consumption. Visualisation of the energy consumption
took place in various ways:
(i) continuous and detailed feedback about the electricity consumption by Smart Meters
(Ecometer in-home display)
(ii) a Smart Meter portal (password-protected)
(iii) a monthly electricity bill.
This allows estimating the causal impact of each type of visualisation type on behaviour.
smart meter, smart meter
portal
The study analyses how information and
visualisation of electricity consumption
influences the behaviour of electricity
consumers.
How are smart electricity meters able to affect the
behaviour of electricity consumers? The following
types of information are analysed:
Smart meters giving immediate and detailed
feedback on electricity consumption;
Communication and consulting by energy experts;
Potential of different feedback systems and their
effect in changing the participants behaviour
behavioural economics: theory of planned
behaviour;
social norms and social comparison;
information deficit models
6 eportal repower -
online customer portal
(swibi)
The eportal is an online-platform for the customers of repower. Information about bills, contracts,
historical consumption (visual) and costs are available. It is possible to report meter readings and
relocations, chose another electricity product and request a service call. Furthermore, on the
energy cockpit the consumption can be compared with the swiss average, an efficiency rating for
the household is made, a quiz game can be played and energy saving hints are made by repower.
web-portal Behaviour change is not the main focus
of this DSI model. The aim is to satisfy
customer needs.
With the costs and consumption
comparisons change in routines and
habits can be forced.
the main focus is to inform the customers and
make processes easier (e.g. purchasing process,
relocation process).
neoclassical economics: rational choice,
expected utility theory;
behavioural economics: theory of planned
behaviour;
social norms and social comparison;
information deficit models
7 my sgsw - online
customer portal (i-web)
The eportal is an online-platform for the customers of sgsw. Information about bills, contracts,
historical consumption and costs are available. It is possible to report meter readings and
relocations, use online forms and contact the service centre.
web-portal Behaviour change is not the main focus
of this DSI model. The aim is to satisfy
customer needs.
With the costs and consumption
comparisons change in routines and
habits can be forced.
the main focus is to inform the customers and
make processes easier (e.g. purchasing process,
relocation process).
neoclassical economics: rational choice,
expected utility theory;
behavioural economics: theory of planned
behaviour;
information deficit models
8 energybox EKS (EW Kt.
Schaffhausen)
Energy box is an online-platform for energy efficiency in households. The platform is set up by
S.A.F.E (Schweizerische Agentur für Energieeffizienz) with "Energie Schweiz" and can be labelled
by the utilities. The energy efficiency is analysed by answering different questions about
consumption, household appliances and consumption behaviour. While answering, the yearly
electricity consumption is counted. The user receives a personal analysis with energy saving
potential and different measures. Further functions are a decision guidance for replacing or
repairing defect appliances, a decision guidance for replacing lighting and a standby check. In the
standby check, the saving potential for turn-off the appliances completely is calculated.
web-portal Routines and habits are analysed within
the online questionnaire. Measures
include change of routine and habit,
investments and purchasing decisions.
What is the energy efficiency of the households
and how can it be improved?
behavioural economics: theory of planned
behaviour; social norms and social
comparison;
information deficit models; social
marketing
9 E-Rechnung - EKS With e-Invoicing the invoice is send directly to the e-banking account of the customer instead of
delivering by post. After login, the e-invoices can be checked and paid within a few clicks and the
invoices can be saved in form of a PDF. The invoice is also sent as a PDF document by mail to the
customers. An e-banking account is necessary for using this service.
e-invoicing, e-banking Behaviour change is not the main focus
of this DSI model. The aim is to satisfy
customer needs.
With the costs and consumption
comparisons change in routines and
habits can be forced.
The main focus is to offer good customer services
and reduce postal charges and print costs.
The customer can choose the e-invoice on
request. But it is planned to offer this service to
more customer in future.
neoclassical economics: rational choice,
expected utility theory; information
deficit models;

A-97
Example of use (DSI/DSM) Short description/Summary Systems and technologies
applied Behavioural change investigated Main focus/hypothesis/motivation Model of Behaviour Change used
10 WaZApp - Werke am
Zürichsee
Online services and information are available in this mobile customer portal. The app is available
for android and iPhone/iPad. Information about bills, historical consumption (over last 5 years)
can be displayed. It is possible to report meter readings and relocations, chose another electricity
product and report a malfunction. Further services are a newsletter, energy saving hints, a
customer magazine and information about products and tariffs. There are also a call and mail
function and push-notifications integrated.
A planned enhancement is a print function to generate pdf documents with graphical overviews
for properties.
mobile-app Behaviour change is not the main focus
of this DSI model. The aim is to satisfy
customer needs.
With the costs and consumption
comparisons change in routines and
habits can be forced.
The main focus is to offer a simple way to access
information about energy consumption and costs.
neoclassical economics: rational choice,
expected utility theory; behavioural
economics: theory of planned behaviour;
information deficit models
11 tiko power Tiko is an intelligent electrical heating system network. It is a joint venture between Swisscom and
repower. The users contribute to a storage network that reacts to supply fluctuations. The heating
system can be controlled and monitored in the mobile app or online. The consumption is displayed
and compared to the average of the other Tiko users.
mobile-app, web-portal,
control box and
communication box
The system can change the habit in
heating and therefore the consumption.
The main focus is the contribution to the
intelligent energy network by automatically
controlling the heating system. The customers can
also control their heating system manually and
monitor the consumption. Energy can be saved by
reducing the heating in absence of the user.
behavioural economics: theory of planned
behaviour; social norms and social
comparison; information deficit models
12 Thermography - EKS Infrared records of the buildings indicate bad heat insulation. Heating losses, thermal bridges and
leakages on doors and windows are visible, At least six records are made for 150 swiss francs. The
pictures are commented by experts and hints for elimination of the weak points are given. The
customer receives the results within two weeks after recording.
thermography Possible investments in buildings for
better thermal insulation and therefore
less energy consumption for heating
The service focuses on thermal insulation of
buildings. The goal is to inform people about
heating losses of buildings.
behavioural economics: theory of planned
behaviour; information deficit models;
social norms;
pro-environmental behaviour
13 wattson energy meter -
EW Höfe
Wattson is an energy meter which shows the actual electricity consumption on a display. The
meter indicates the actual consumption with different colours (blue for low, violet for your average
and red for very high electricity consumption). The data is stored for 28 days in an internal memory
of the device. It is possible to analyse the data with an additional software "Holmes". In an online
community, the data can be shared with friends. The device can be hired for two weeks (200.-) or
purchased (350.-).
energy meter, analysis
software
The device can change the habit and
routines in electricity consumption.
Inform customers about the actual used electrical
power.
behavioural economics: theory of planned
behaviour; information deficit models;
social norms;
pro-environmental behaviour
14 EMU check USB energy
meter - EW Höfe
EMU check USB is an energy meter for one phase devices which shows the actual electrical power
and the consumption on the display. The data of 7 days (1-minute interval) are stored in an internal
memory of the device. It is possible to analyse the data with an additional software. The device
can be hired for one-week (100.-), an additional analysis of the data can be purchased (35.-).
energy meter, analysis
software
The device can change the habit and
routines in electricity consumption or
can influence a purchasing decision.
Inform customers about the actual electricity
power and consumption of one device.
behavioural economics: theory of planned
behaviour; information deficit models;
social norms; pro-environmental
behaviour
15 Stromdetektiv - EKZ
(energy consulting)
The energy detective is an energy consulting service of EKZ (Elektrizitätswerke des Kantons Zürich).
Within this service an individual consulting of 45 minutes takes place at home. The standby
consumption of specific appliances is measured and the bill is analysed. Different LED-lights are
shown and specific hints for saving electricity are made by the expert. Furthermore, the customer
receives a switched cable "Stromsparmaus" as a present. The costs are 50.- for EKZ customers and
200.- for other people.
standby measurements With the information of the consulting
changes in routine or habit can be forced
and purchasing decisions can be
influenced.
Inform the customer about the electricity
efficiency at home.
behavioural economics: theory of planned
behaviour; information deficit models
16 invoice by post - SGSW every customer receives an invoice with information about the energy consumption and costs. The
invoice is obligatory and most of the content is regulated by law (Stromversorgungsgesetz,
Weisungen Elcom). The accounting approach of SGSW are five payments on account (every two
months) and one final invoice every year (31.12.). Additional to the mandatory elements a
comparison to previous energy consumptions is available in a diagram (consumption comparison
per tariff and in total per year). On the end of the invoice there is a part for individual text or
advertising of the utility. Supplementary there is a booklet available in which the elements of the
invoice are explained. The booklet is not delivered with the invoice but is available in the customer
service centre or online on the utility website.
paper invoice Behaviour change is not the main focus
of this DSI model. The aim is to satisfy
customer needs and comply the
regulations.
With the costs and consumption
comparisons change in routines and
habits can be forced.
Invoicing; inform the customer about the energy
consumption and costs; inform the customer for
which service he has to pay how much.
neoclassical economics: rational choice,
expected utility theory;
behavioural economics: theory of planned
behaviour; information deficit models

A-98
Example of use (DSI/DSM) Short description/Summary Systems and technologies
applied Behavioural change investigated Main focus/hypothesis/motivation Model of Behaviour Change used
17 invoice by post - EKS every customer receives an invoice with information about the electricity consumption and costs.
The invoice is obligatory and most of the content is regulated by law (Stromversorgungsgesetz,
Weisungen Elcom). The accounting approach of EKS are 11 payments on account and one final
invoice every year (31.12.). Therefor the customer receives one letter in February with the final
invoice and 11 pay in slips. Additional to the mandatory elements a comparison to the previous
electricity consumption of the last invoice is available in a table (in total electricity consumption).
paper invoice Behaviour change is not the main focus
of this DSI model. The aim is to satisfy
customer needs and comply the
regulations.
With the costs and consumption
comparisons change in routines and
habits can be forced.
Invoicing; inform the customer about the
electricity consumption and costs; inform the
customer for which service he has to pay how
much.
neoclassical economics: rational choice,
expected utility theory; behavioural
economics: theory of planned behaviour;
information deficit models
18 invoice by post -
Repower
every customer receives an invoice with information about the energy consumption and costs. The
invoice is obligatory and most of the content is regulated by law (Stromversorgungsgesetz,
Weisungen Elcom). The accounting approach of repower are four payments on account (February,
may, august, November) and two final invoices every year (31.12. and 30.06.). Additional to the
mandatory elements a comparison to previous energy consumptions and costs is available in a
diagram (comparison in total for half a year). Furthermore, there is a diagram which shows the
relative share of the split costs (e.g. energy, grid fees) and the relative share of the different
electricity products and tariffs (e.g. Aquapower day price/night price) in terms of energy and costs.
paper invoice Behaviour change is not the main focus
of this DSI model. The aim is to satisfy
customer needs and comply the
regulations.
With the costs and consumption
comparisons change in routines and
habits can be forced.
Invoicing; inform the customer about the energy
consumption and costs; inform the customer for
which service he has to pay how much.
neoclassical economics: rational choice,
expected utility theory; behavioural
economics: theory of planned behaviour;
information deficit models
19 energy2click (Swibi and
asgal)
energy2click is a module based online-platform. The system combines DSI, DSM and business
processes of the utility. Visual real-time data, grid monitoring, service desk, billing, customer data
and documents, consulting, control of consumers and monitoring of PV installations are available.
Due to the responsive design, it is possible to use the platform on different devices (smartphone,
notebook, desktop pc)
web-platform The combination of real-time data
visualisation and consulting can lead to
different routines or even investments.
The main goal is to offer an integrated system for
the utilities which combines the customer online-
platform with the business processes of the utility.
neoclassical economics: rational choice,
expected utility theory; behavioural
economics: theory of planned behaviour;
information deficit models
20 smoope messenger -
EWZ
smoope is a B2C-messaging solution which offers "service to go". With the mobile app, it is possible
to get in contact with the utility simple and fast. Questions about products and services are
answered within the pilot phase. Customer feedback, individual consulting and data sharing are
possible too.
mobile-app, instant
messenger
the communication channel between
the utility and the customer is changed.
This can lead to different routines or also
purchasing decisions (e.g. purchase of a
new energy product with the
messenger)
The main goal is to improve the customer service
and boost the interaction with the digital
generation. The main question within the pilot
was "how can smoope be used for the utility?"
behavioural economics: theory of planned
behaviour; information deficit models
21 Social Power Social Power is a joint research project of SUPSI and ZHAW in cooperation with AEM and Stadtwerk
Winterthur. It is an innovative app for smartphones and tablets having as a goal to motivate
household to save energy. The research interest is the potential of energy feedback, social
interactions (e.g. exchange about energy-saving tips) and gamification elements (e.g. cooperative
vs. competitive game) in terms of inducing long term behaviour change regarding energy
consumption.
App for smartphones and
tablets
Both change energy-related routines as
well as inducing purchase of energy-
saving products
Development of an app with gamification
elements providing energy feedback; Conducting
a trial during 3 months with 120 households
making efforts to reduce their energy
consumption in a game setting
Developing a social media platform in order to
support social interaction among the participants
Evaluation of gamification and social interaction
effects on the behaviour change and electricity
consumption
Influence of energy feedback,
gamification, social interaction and
improved energy literacy on changing
energy-related behaviour
22 optimised self-
consumption of solar
energy (EKS)
Goal of the study: The study shows if there is a connection between an optimised self-
consumption and sufficiency in energy consumption. The study refers to a self-consumption
optimising system of Elektrizitätswerke Schaffhausen.
smart meters, mobile app,
feedback on electricity
consumption EKS
installs a full solar energy
package including solar
panels, inverter, smart meters
and a mobile app for
smartphones
load shifting, investment behaviour --->
the consumer has first to invest money
before he is able to economise its energy
consumption
How will information of self-consumption
influence total energy consumption? Is it possible,
that users could reduce their energy consumption
by being vigilant with full-time monitoring on
control devices?
behavioural economics ----> economic
incentives

A-99
Example of use (DSI/DSM) Short description/Summary Systems and technologies
applied Behavioural change investigated Main focus/hypothesis/motivation Model of Behaviour Change used
23 EKT (Energie Kanton
Thurgau) energy
efficiency support
program
"Thurgauer Energie- Fitness" support program is a program of the EKT. The programme includes
about 90 enterprises, which are located in Thurgau or are consumers of EKT energy. Goal of the
program is to save 15% of a company’s energy consumption each year during a span of 3 years.
The programme is aligned to enterprises, which consume over 100'000 kWh of electricity or over
1'000'000 kWh of thermic energy.
After a year the companies
have to give a feedback to the
EKT about their energy
consumption. If the energy
consumption didn't decrease,
the EKT supports the
companies with strategies to
save more energy.
The study takes a closer look at the
energy consumption of the companies
and provides several strategies to be
more efficient in saving energy.
How can we reduce the energy consumption in
the canton of Thurgau to reach our energy
strategy until 2020? With incentives for the
biggest companies in Thurgau, which have to
reach the goal of 15% less energy consumption
over three consecutive years. With this method,
the EKT and the canton of Thurgau can calculate
their savings much better and know, how much
they still have to save to reach their energy
strategy.
Every year the EKT will give advices in an
obligate half day workshop to the
consumers, how to save energy. The
companies have to reach universal energy
saving goals which are written in a
contract. The goals are based on the
energy consumption analysis of Cleantech
and EnAW. Additionally, the support
program rewards companies which have
increased their energy efficiency within
three successive years with a support
amount of 3.5 swiss centime per kWh a
year. It would be a maximum of 50,000
CHF over three years.
24 "Meter to Cash" case
study elog
Energielogistik AG
(elog)
Since 2008 elog offers professional consulting and flexible services within the entire value chain of
the energy market processes. Together with customers and partners, elog meets the requirements
of the liberalized electricity market. Everyday a team of experienced employees deals with the
systems. Thanks to this, the customers receive not only software, but also solid know-how, years
of experience and working solutions. Elog offers six difference services: a) smart power
management b) energy data management c) calculation and clients management d) Portfolio
management e) energy efficiency management f) advice and engineering.
smart meters, feedback on
electricity consumption, data
analysis and data
management
The company provide information on
energy consumption and gives solution
to the customers to minimize the costs.
This system influences automatically the
behaviour of energy consumers.
How will detailed information and analysis of
energy usage increase the consumers energy
efficiency and lastly reduce costs? Smart meters
give a daily feedback on energy consumption to
elog. This feedback analyses the information and
then gives a monthly solution to the customers
with the purpose of increasing energy efficiency
and reducing costs.
A behaviour is going to be changed if a
person decides to live with a lower
consumption of energy. In this case there
are two kinds of improvements: 1)
optional behavioural change, which
includes an increased awareness, a high
individual responsibility. 2) economical
“profit“, which means minor expense.
25 Innovative services
with smart meters
(Energie Thun)
Smart meters can measure specific electricity consumption to provide detailed information about
the energy use of different households. The data can be used to deliver individual and personal
recommendations regarding energy savings. For this reason, Energie Thun AG and the ETH
developed a study about innovative services with smart meters. Therefore, standby and cooling
device consumptions were investigated with specific algorithms. For this study six employees of
Energy Thun AG participated voluntarily.
For this study, the following
technologies were required:
Smart meters (Landis+Gyr
E750 SyM2-electricity meter),
smart plugs, Android tablets
and an Android app.
Energie Thun AG and the ETH mainly
wanted to find out, if it is possible to
provide consumers personalised
recommendations for energy savings
with smart meter data. The participant’s
behavioural change was not precisely
investigated within this study. However,
the personalised recommendations are
able to change the consumer’s
behaviour. With the standby energy
consumption displayed on the tablet,
the consumer is able to identify which
electrical devices should be unplugged
when unused. It is possible to create
new habits dealing with electrical
devices, e.g. unplugging the television
once it is turned off.
With the calculation of the cooling
device consumption, it is possible to
recommend a replacement of this device
to save energy.
The main focus was to find out if it is possible to
give personalized recommendations regarding the
consumers’ energy consumption with smart
meter data. The data was collected with two
different methods. Firstly, data for the energy
consumption was measured every 15 minutes.
Secondly, the current energy data was measured
every second. With these measurements, it was
possible to calculate the consumptions of
standby- and cooling devices with an algorithm.
Based on these calculations personalized energy
saving recommendations can be given.
The participant’s behavioural change was
not investigated during this study, but the
personalised recommendations on the
app fit into a behavioural changing model.
Looking at the “Want-Can-Do”-model, the
personalised notes give a clear advice for
the “Can”-section. The recommendations
give different personalised possibilities to
reduce the energy consumptions, e.g.
“buy a new fridge”. Smart meters also
help to overcome knowledge-based
barriers for energy savings.

A-100
Example of use (DSI/DSM) Short description/Summary Systems and technologies
applied Behavioural change investigated Main focus/hypothesis/motivation Model of Behaviour Change used
26 Nest - Controlling of
room temperature.
Nest is a company which is trying to help homeowners to safe energy. The goal is to safe energy
without losing any comfort. They try to reach this goal by collecting and analysing data, to improve
their technology.
Nest is a manufacturer of
"intelligent" smoke detectors
and thermostats which both
use innovative technologies.
For example, the smoke
detector is also fitted with a
motion detector. In case of a
false alarm the detector can
easily be deactivated by the
user by waving his hands in
front of the detector. The
thermostat is also fitted with a
feature which allows the user
to control the temperature
form all around the world by
using a mobile phone app.
Due to the fact that Nest is building
technologies which allow the user to not
lose any comfort but still saving energy,
the behavioural changes are probably in
the first-time period not very high. But if
the customers realise their savings in
energy and money they might soon try
to adapt their attitude of living more
efficient in to other life situations.
Nest is collecting data from installed smoke
detectors, thermostats and so on. They are using
this data for research to try to improve their
products to save even more money and energy.
The model used, is the theory of the
planed behaviour. Applied on this project
it would mean the following: First it would
need the awareness of the customer to do
something for the environment. Then he
or she should apply this attitude to their
behaviour. For example, if someone wants
to build a new home, he or she would
consider building their house more
environmentally friendly and then decide
to install a product like the thermostat
that Nest provides. The last step for this
person would be to really buy this
product, to become a person with an
ecological behaviour.
27 amphiro water
consumption meter.
Case study from ETH
Zurich.
The amphiro is a device for measuring warm water consumption during the shower procedure. It
can be attached between the water hose and shower head. It is powered through a small water
turbine which also acts as a water flow measuring tool. In addition, a temperature sensor measures
the actual water temperature. While showering it displays the actual water consumption,
temperature, energy efficiency class as well as an animation with a polar bear on an ice floe. As
the warm water/energy consumption rises, the ice floe shrinks and eventually the polar bear sinks
into the ocean. After showering it shows the cumulated energy and water consumption. The goal
of this device is to motivate people to save warm water through direct feedback. Financial savings
are the largest incentive for using this device. The case studies from Verena Tiefenbeck at ETH
Zurich investigated the effects on showering behaviour of nearly 700 households by installing the
amphiro measuring device. The main focus was to investigate the change of water consumption,
temperature, showering time and energy consumption. Also, different external factor (e.g. long
hair) influences on behaviour change were evaluated.
The amphiro a1 which is a
water consumption device
with a digital display, was used
in the ewz-amphiro-study. It
was installed in around 700
households to give direct
feedback to consumers. There
is also another version, the
amphiro b1, available, which is
able to connect with the
according mobile-app. The
mobile app shows a more
detailed summary of the warm
water and energy
consumption over long time. It
also displays a comparison to
previous showering sequences
and how your showering
habits change over time.
In the ETH study the water consumption
while showering was investigated by
measuring and evaluating the data of
the amphiro a1. The amphiro device
gives feedback on ones showering habits
and therefore implicates a motivation to
decrease the water and energy
consumption. Through this method the
warm water consumption in general and
along with this the energy consumption
should be reduced. The showering time,
flow rate, water temperature, energy
consumption and breaks were
investigated. With lowering the average
water temperature massive energy
savings are targeted.
How is the effect of energy-saving technologies,
especially water-consumption-saving-
technologies, and how can they be optimized
depending on consumer group and context?
Which insights were achieved and which
measures were taken?
Behaviour-Specific Real-Time Feedback:
One group received a real-time feedback,
a second one received real-time and past-
feedback and the control group received
no feedback.

A-101
General Information II
Example of use
(DSI/DSM) Key words, tags Source/material/literature Country
Geographical
scope
Monitoring and evaluation
metrics used
Energy
carrier
Project
period
Size of
utility
(GWh)
Key lessons learned
1 The MUNX (Web
platform from
Repower an
international
energy company
based in
Switzerland.
It operates along
the entire value
chain, from
generation,
trading,
transmission and
distribution to
sales.)
reading of the
electric meter,
comparison of own
power consumption
with the
consumption of
others/neighbours,
learning more about
energy / energy
saving / efficient
energy use, bonus
system
http://www.munx.ch (in German) Switzerland Canton of
Graubünden
(Grisons)
(You can use it in
the whole
German
speaking part of
the world, but
only in the
canton of
Graubünden
there are
enough users to
compare the
usage with your
neighbours in
the same street)
The weekly power
consumption of the
participants (not very good
data, because the user has to
enter them manually). The
answers the user gave to the
quiz other information the
user gave about their flats.
electricity,
warm
water
(amphiro
shower
meter)
since 2013 n.a. There was negative feedback from
customers concerning the comparison
with the neighbours. They didn`t want to
be compared with other people and did
not want to disclose their consumption
to others.
2 Smart Metering
case study Uttwil
(EKT)
Smart metering with
feedback,
Information on
energy consumption
http://www.smartmetering.ch (in German)
http://www.clever-strom-sparen.ch/ (in German)
project report: „Feedback Smart Metering“ der EKT AG – Schlussbericht (in German)
Switzerland Uttwil and
Kreuzlingen,
both
municipalities
within the
Canton of
Thurgau in the
east of
Switzerland
Electricity consumption over
a year was analysed
combined with several
questionnaires about
attitude, opinion and
acceptance of smart meters
and energy saving behaviour.
electricity 2011-2012 1468 Smart meters will not change our energy
behaviour significantly and there are
also certain concerns against them.
An average reduction of 1.7% of
electricity consumption for a confidence
level of 95% (2.49% for a confidence
level of 99%) could be reached by the
participants who used the smart meter
(electricity use displayed on in-home-
display). The frequency of checking the
smart meter display and thus control
electricity consumption declined rapidly
after the first month. Perceived benefits
of smart meters were lower after a year
of pilot-use and concerns against it rose
a little bit. Concerns about data security
and economic advantages for utilities
were the most important ones for the
participants. Control over electricity
consumption and simpler billing of
electricity were the biggest perceived
benefits of smart meters.
3 bonus model for
energy efficient
households
(EWZ), research
project FP-1.9
platform
"www.smart-
steps.ch" (mailing,
web-portal,
newsletter and
mobile app)
bonus system,
incentives, IT based
information system,
learning platform,
efficiency
measurements
study report: "Bericht Bonusmodelle FP-1.9" (in German) Switzerland city of Zurich and
parts of the
canton
Graubünden in
the northeast of
Switzerland
registration quote
(compared to mailing);
electricity consumption,
questionnaires on important
measurement points; impact
of bonus system in different
groups of experiment
(amount of realised
measurements, amount of
bonus points);
Impact measurement:
Possible reachable energy
savings due to realised
electricity,
warm
water
(amphiro
shower
meter),
heating
energy
2014-2015 3820 Bonus models can increase the user
activity on the platform. Monetary
incentives are motivating the most
people to use the platform in short term.
But especially in long term the effect
depends on the amount. Ideational
awards have a significant effect and can
eliminate the negative effects of
monetary incentives in long term,
furthermore material incentives can be
demotivating.
Gain in efficiency depend on the activity
on the platform. No overall savings have

A-102
Example of use
(DSI/DSM) Key words, tags Source/material/literature Country
Geographical
scope
Monitoring and evaluation
metrics used
Energy
carrier
Project
period
Size of
utility
(GWh)
Key lessons learned
measurements ("saving
score");
Probability of chosen positive
measurements due to
recommender system
compared to complementary
system
been evaluated for the group of users.
Recommender systems for personalising
of energy efficiency programs provide
an additional benefit. Possibilities and
motivations for measurements differ
strongly between households. The
system increases the selection of an
appropriate measurement for the
reduction of the energy consumption.
The abstinence of monetary motives can
increase the success of an efficiency
campaign, comparisons with neighbours
increases the success. Many
measurements do not result in a lower
electricity consumption but in less warm
consumption water or heating energy.
For increasing the effectiveness of the
web-portal, further enhancements are
recommended. Focussing on a scalable
transfer of comprehensible
consumption feedback could be an
approach.
4 Smart Metering
case study Zurich
(EWZ)
smart metering with
feedback, expert
advice, information
on electricity
consumption, social
comparison and
social competition
study report: "Smart Metering, Beratung oder Sozialer Vergleich - Was beeinflusst den
Elektrizitätsverbrauch?" (in German)
Switzerland City of Zurich 8 periodical electricity
readings to construct
electricity consumption per
day for the evaluation of
electricity consumption;
6 web-surveys with
indicators for attitudes and
values, knowledge and
awareness of energy savings
potentials, and different
indicators for satisfaction.
electricity 2011-2012 3820 Information can lead to significant
electricity savings. Smart meters reduce
the electricity consumption about 3% in
the medium term and can shift the loads
to low tariff times. An invitation for an
efficiency consulting does not influence
the consumption but delivers
information about potential savings and
increases the self-estimated
implementation potential of energy
saving measurements. Social
information can marginal reduce the
consumption, particularly if the
feedback about the consumption of the
partner household is frequent.
The usage of the smart meter displays
decreases in a long term.
5 Smart Metering
case study (EKZ)
smart metering with
feedback, expert
advice, information
on electricity
consumption
Media report: "Einfach sichtbar – so wird Strom gespart" (in German) Switzerland Dietikon 15 minutes feedback of an
Eco Meter;
Daily feedback over web
portal;
Monthly paying-in slip;
2 customer surveys
electricity 2009-2010 5463 Smart electricity meters are able to
support slightly the customer in saving
electricity, if the electricity consumption
is visualised. There was up to 3% less
electricity consumption on average by
using the Ecometer or the Smart Meter
portal compared with the control group
in Regensdorf. Customer who didn’t use
any visualisation technology weren’t
able to save electricity compared to the
control group in Regensdorf.
6 eportal repower -
online customer
portal (swibi)
web-portal,
Information on
energy consumption,
customer
relationship
user manual: "Anleitung Kundenportal Repower" (in German) Switzerland Canton of
Graubünden
2 electricity meter readings
per year
electricity n.a.

A-103
Example of use
(DSI/DSM) Key words, tags Source/material/literature Country
Geographical
scope
Monitoring and evaluation
metrics used
Energy
carrier
Project
period
Size of
utility
(GWh)
Key lessons learned
management,
comparison of
consumption
7 my sgsw - online
customer portal (i-
web)
web-portal,
Information on
energy consumption,
customer
relationship
management,
comparison of
consumption
registration manual: "Anleitung Zugang Kundenportal" (in German) Switzerland City of Sankt
Gallen
1 meter reading per year electricity,
gas,
heating
energy
Feb 17 501 It is too early for lessons learned.
8 energybox EKS
(EW Kt.
Schaffhausen)
web-portal, energy
efficiency check,
decision guidance,
comparison of
efficiency, efficiency
measurements
web-portal: http://www.energybox.ch/(S(lrnevzqbh05zv0nay0nt1afg))/index.aspx;
reports of executed online-checks;
evaluation of the user database: "Auswertung der Nutzerdatenbank" (in German)
Switzerland Can be used
from all over
Switzerland, but
is labelled for
customers of
EKS (Canton of
Schaffhausen
without the city
of Schaffhausen)
Electricity consumption per
year
electricity 2015 576 The usage of the portal was 1000 people
in 2015 and 600 in 2016
9 E-Rechnung - EKS e-invoicing, e-
banking, billing
process
online: http://www.eks.ch/privatkunden/e-rechnung;
"EKS Preisblatt Haushalt CH 2017" (in German)
Switzerland Canton of
Schaffhausen
without the city
of Schaffhausen
Electricity consumption per
year
electricity 2015 576 There is only good feedback from
customers until now.
10 WaZApp - Werke
am Zürichsee
mobile-app, online
services
online:
https://play.google.com/store/apps/details?id=ch.innovativeweb.icmsapp.werkeamzuerichsee;
customer magazine: "Aktuell, Das Informationsmagazin der Werke am Zürichsee AG" (Ausgabe
16, Dezember 2016, in German)
Tel Hr. Brasser 08.05.17
Switzerland Zollikon,
Küsnacht,
Erlenbach
energy consumption per
year, energy costs per year
electricity,
gas
since 2016 147 positive feedback from customers
11 tiko power mobile-app, web-
portal, heating
system control,
intelligent energy
network
online: https://tiko.ch/page/product_power/ Switzerland all households
with electrical
heating systems
electricity consumption electricity
for boiler
and heat
pump
since 2013 - n.a.
12 Thermography -
EKS
thermography,
heating losses,
thermal bridges
online: http://www.eks.ch/privatkunden/infrarotbilder-ihres-hauses (in German) Switzerland Canton of
Schaffhausen
without the city
of Schaffhausen
thermography heating
energy
since 2014 576 There were many requests in the first
year. But then the number of requests
declined with time. There will be a new
evaluation for the project next year.
13 wattson energy
meter - EW Höfe
energy meter,
information on
energy consumption,
energy monitoring,
electricity costs, CO2
emissions
flyer: "Broschuere Energieberatung" (in German);
product flyer: "Wattson Classic";
user guide: "Wattson User Guide"
Switzerland Feusisberg,
Freienbach,
Wollerau
actual electrical power electricity n.a. 169 n.a.
14 EMU check USB
energy meter - EW
Höfe
energy meter,
information on
energy consumption,
energy monitoring,
electricity costs, CO2
emissions
user manual: "Bedienungsanleitung EMU Check" (in German);
datasheet: "EMU Check" (in German)
Switzerland Feusisberg,
Freienbach,
Wollerau
actual electrical power and
electricity consumption
electricity n.a. 169 n.a.
15 Stromdetektiv -
EKZ (energy
consulting)
energy consulting,
standby
consumption,
electricity efficiency
online: http://www.ekz.ch/de/private/strom-sparen/stromdetektiv.html#downloadsundlinks
(in German);
Interview: "Stromsparen: bequem und einfach - EKZ Stromdetektiv" (in German)
Switzerland Canton of Zurich standby electricity
consumption, electricity
consumption
electricity n.a. 5463 n.a.

A-104
Example of use
(DSI/DSM) Key words, tags Source/material/literature Country
Geographical
scope
Monitoring and evaluation
metrics used
Energy
carrier
Project
period
Size of
utility
(GWh)
Key lessons learned
16 invoice by post -
SGSW
invoice, payment,
energy costs,
information on
energy consumption
exemplary invoice: "St. Galler Stadtwerke Musterrechnung" (in German) Switzerland City of Sankt
Gallen
energy consumption per
year, energy costs per year
electricity,
gas,
heating
energy
- 501 There are customer feedbacks about the
insufficient transparency of the invoice.
But the most feedbacks are about the
value of the invoice. 1700 customers of
45000 in total receive the invoice by mail
and 8200 by e-invoicing.
17 invoice by post -
EKS
invoice, payment,
electricity costs,
information on
electricity
consumption
invoice explanations: "EKS Rechnungserklärung 2015" (in German) Switzerland Canton of
Schaffhausen
without the city
of Schaffhausen
electricity consumption per
year, electricity costs per
year
electricity - 576 There were problems and confusions
when the billing period has been
changed from hydrological to the
calendar year because the amount of
the payments on account changed. But
otherwise the customers are used to the
paper invoice.
18 invoice by post -
Repower
invoice, payment,
electricity costs,
information on
electricity
consumption
online: http://www.repower.com/ch/privatkunden/stromprodukte/stromrechnung/#13251 (in
German)
Switzerland Canton of
Graubünden
semi-annual electricity
consumption, semi-annual
electricity costs
electricity - n.a.
19 energy2click
(Swibi and asgal)
web-portal, energy
consulting, real-time
data Information on
energy consumption,
customer
relationship
management
product flyer: "energy2click flyer" (in German);
media report: "Unablässig am Puls der Zeit", VSE-Bulletin 9/2016 (in German)
Switzerland potential for all
EVU in
Switzerland
energy consumption real-
time, energy costs
- n.a. - n.a.
20 smoope
messenger - EWZ
mobile-app,
customer service,
instant messaging,
online: https://www.ewz.ch/de/ueber-ewz/medien/medienmitteilungen/2016/smoope-
pilotprojekt.html;
media report: "Medienmitteilung EWZ Smoope Pilotprojekt 18.01.2016"
call with Denis Beier, EWZ 08.05.17
Switzerland City of Zurich n.a. electricity,
heating
energy
Pilot:
01/2016-
04/2016,
since then
used as a
normal
service
3820 There was a high quality of interaction
with customers; Traceable process;
good customer support; Customers
which used the channel once for testing
returned on this channel for other
requests. The most of the requests are
related to products/tariffs or
administrative processes like movement
or questions about bills. There were not
many requests about consumption; All
customer feedbacks were positive;
service could be used for automatically
send the consumption to the customers.
21 Social Power mobile app,
gamification, social
interaction, energy
feedback
https://www.zhaw.ch/de/engineering/institute-zentren/ine/nachhaltige-
energiesysteme/social-power-projekt/
Switzerland Winterthur (ZH)
and Massgno
(TI)
Energy consumption n.a. Historical
reference:
Qct-Dec 2015;
Playing the
game: Feb-
May 2016;
Post-
evaluation
planned: May
2017
n.a. Overall interventions both saved
electricity compared to their historical
value, and particularly compared to the
control groups. However, there was no
significant difference between the
competitive and collaborative approach.
22 optimised self-
consumption of
solar energy (EKS)
self-consumption,
intelligent devices,
solar energy
Ramon Felder, EKS; EKS Sunpower (https://www.ekson.ch/menschen-mit-energie-
detail/waschen-wenn-die-sonne-scheint.html), EKS Suncontrol
(http://www.eks.ch/privatkunden/dienstleistungen/photovoltaik/sun-control-ch)
Switzerland Region
Schaffhausen in
the north of
Switzerland
Power-meters measure the
produced and consumed
energy in real-time and send
the information to the
control devices (smartphone,
tablet).
electricity 2015-
unspecified
576 An optimised self-consumption doesn't
have to minimise the total amount of
energy consumption. But it shows
energy-losses. This might contribute to a
sufficient behaviour.

A-105
Example of use
(DSI/DSM) Key words, tags Source/material/literature Country
Geographical
scope
Monitoring and evaluation
metrics used
Energy
carrier
Project
period
Size of
utility
(GWh)
Key lessons learned
23 EKT (Energie
Kanton Thurgau)
energy efficiency
support program
Energy saving
strategy
Efficiency
Sufficiency
Reach strategy goals
2020
Reduce energy
consumption by 15%
http://www.ekt.ch/aktuell/projekte-und-kampagnen/ekt-energieeffizienz-foerderprogramm/
http://www.keest.ch/kmu-foerderung/ekt-energie-thurgau.html
Reglement_EEF_2014-2016
Switzerland Canton of
Thurgau in the
east of
Switzerland and
near
surroundings
Every year, measured energy
consumption will be
analysed. If the company
isn't able to reduce its energy
consumption by the required
15%, the EKT helps to reach
the saving goals with
suggestions and specific
strategies.
electricity 2014-2020 1467.9 The effect of this program can be great
due to the fact that with the EKT an
energy selling company gives companies
some advices to reduce the energy
consumption and to use the energy
more effective. That’s unusual for the
energy sector. Companies want to work
with the EKT to save energy.
Nevertheless, the biggest effort will be
reached, because of the aspect that the
companies can save a lot of money
during the programme. They achieve
lower energy costs and earn money for
every saved kWh of energy.
It is possible to make big change even
with a small effort.
24 "Meter to Cash"
case study elog
Energielogistik AG
(elog)
smart metering,
M2C (Meter-to-
Cash), information
on energy
consumption and
integrated-standard
solutions.
http://www.elog.ch/ueber-uns/leitbild/ 071 224 59 32 [18.04.17] Switzerland leader in east
Switzerland for
energy logistic.
Specially in St.
Gallen
Monitoring starts with smart
meters, which sends the daily
data consumption of the
clients to elog engineering.
The company then analyses
and assembles the collected
information and finds
standard solutions.
Therefore, the customers
receive a monthly feedback
on their consumption and
solutions to decrease their
energy usage and to increase
electrical efficiency. These
solutions allow saving
money.
electricity 2008-
indeterminate
- Project not finished yet
25 Innovative
services with
smart meters
(Energie Thun)
Smart meter,
electricity meter,
smart plugs, energy
consumption,
Energie Thun AG,
energy saving,
standby, cooling
devices
Wilhelm Kleiminger, Christian Beckel, Silvia Santini, Christoph Woodtli, Martin Bühler, Thorsten
Staake, “Innovative Dienste mit intelligenten Stromzählern,” pp. 1–4, 2014.
Switzerland It is assumed
that the
geographical
scope of this
study was
around Thun
because all the
participants are
employees of
Energie Thun
AG.
This project analysed three
different services which help
the consumers to reduce
their energy consumption
within eight months. The
services include a visual
consumer-feedback on a
tablet- an automatic
calculation of the standby
consumption- an automatic
calculation of the cooling
device consumptions. The
electricity July 2013 –
January 2014
188 The project team examined three
different services to provide
consumption statistics for the
consumer. To get exact measurements,
data is required every second, but the
problem with these precise
measurements is the large amount of
resulting data. Unfortunately, it is not
yet possible to store such huge amount
of data in an economical and cost-
efficient way. To reduce the data
quantity, measurements every 15

A-106
Example of use
(DSI/DSM) Key words, tags Source/material/literature Country
Geographical
scope
Monitoring and evaluation
metrics used
Energy
carrier
Project
period
Size of
utility
(GWh)
Key lessons learned
participants got an overview
about the consumptions
statistics on their tablet. Due
to the frequent update every
second, the current rise of
energy use appeared
immediately on the display
after turning on an electrical
device. The standby
consumption was calculated
by an algorithm during 1 to 5
a.m. because usually no
other devices were used at
this time except cooling
devices. Because of the
fluctuating consumption
behaviour of cooling devices,
it was possible to measure
the standby consumption
when currently no cooling
device was operating. During
a consumption peak caused
by a cooling device it was
possible to subtract the
standby consumption and
get the effective value of the
cooling device’s energy
consumption.
minutes can be applied, which do not
cause such a big amount of data but the
outcome is less accurate.
When it comes to an acquisition of a
smart meter, it is important to consider
the existence of a “turbo-mode” which
can be switched on to get, when
necessary, a precise data every second.
The effect of a personalised
recommendation regarding the energy
consumption can be very high. Energy
savings can definitely be achieved with
personalised recommendations.
26 Nest - Controlling
of room
temperature.
Data collecting,
improved products,
life becomes easier
Nest Labs, “Energy Savings from the Nest Learning Thermostat: Energy Bill Analysis Results,” no.
February, pp. 1–14, 2015.
Allison Bailes, “Does the Nest Learning Thermostat Save Energy?” 2015. [Online]. Available:
http://www.energyvanguard.com/blog/78078/Does-the-Nest-Learning-Thermostat-Save-
Energy. [Accessed: 22-Apr-2017].
NZZ, “Übernahme von Nest für 3,2 Milliarden Dollar: Google kauft Thermostate-Hersteller - NZZ
Wirtschaft: Unternehmen,” 2014. [Online]. Available:
https://www.nzz.ch/wirtschaft/unternehmen/google-kauft-hersteller-vernetzter-thermostate-
1.18220512. [Accessed: 22-Apr-2017].
Developed
in the USA,
but used
worldwide.
Manufactured in
Mountainview,
California but
distributed to
the whole world.
This is an ongoing project.
Nest is daily receiving and
collecting data which they
analyse immediately to
improve their products.
The company
was
established in
2010 and is
still in
operation.
- The first results are visible in conducted
studies. The thermostats savings equal
to about 10-20 % of heating usage and
the electric savings equal to about 15%
of cooling usage in homes with central
air conditioning. But there are not just
savings in energy. More than 60% of the
participants felt that their homes are
"somewhat more comfortable" or
"much more comfortable" while using
the Nest thermostats.
27 amphiro water
consumption
meter. Case study
from ETH Zurich.
amphiro, (warm)-
water consumption,
energy saving,
behavioural change
Tiefenbeck, Verena; Tasic, Vojkan; Schöb, Samuel; Degen, Kathrin; Goette, Lorenz; Fleisch, Elgar;
Staake, Thorsten: Steigerung der Energieeffizienz durch Verbrauchsfeedback bei der
Warmwassernutzung. Abschlussbericht der ewz-amphiro-Studie, ETH Zürich, Schweiz,
27.11.2013
www.amphiro.com
Verena Tiefenbeck, Lorenz Goette, Kathrin Degen, Vojkan Tasic, Elgar Fleisch, Rafael Lalive,
Thorsten Staake (2016)
Overcoming Salience Bias: How Real-Time Feedback Fosters Resource Conservation.
Management Science
Switzerland,
Europe
The study was
conducted in
Zürich,
Switzerland. The
different
amphiro models
can also be
ordered online
to various
After every shower is the
used water and energy
consumption, efficiency-
class, water temperature,
and a climate-animation
(polar bear) shown on the
display of the amphiro.
warm
water
two months,
from the
beginning of
December
2012 until the
beginning of
February
2013.
(duration of
ETH study)
- The influence of the amphiro is explicit
obvious, then the possible water-savings
represent up to 25% or on an average of
360 kWh per shower, depending on the
number of the household. This effect
was obvious after the eleventh shower
and manly achieved through the
reduction of the shower duration by
20% to 24%. Temperature changes were
despite the amphiro not noticeable,

A-107
Example of use
(DSI/DSM) Key words, tags Source/material/literature Country
Geographical
scope
Monitoring and evaluation
metrics used
Energy
carrier
Project
period
Size of
utility
(GWh)
Key lessons learned
countries in
Europe. [1][2]
however shower breaks extended by
12% on average. That would be an
annually saving of 443 kWh energy and
8'500 litres of drinking water, whereby
96 CHF could be saved (costs for drinking
water and energy. If 10% of the Swiss
population would save this amount of
energy, then we could save 155 GWh
energy a year, which is the twofold of
the annually produced wind energy in
Switzerland.

A-108
Classification Parameters
Example of use (DSI/DSM) Feedback frequency Feedback
duration
Feedback content (e.g.
consumption, cost, environmental
impact)
Level of breakdown (e.g.
specific rooms/appliances)
Medium of
presentation (e.g.
written, electronic)
Mode of
presentation (e.g.
text, numbers,
graphs)
Comparisons
to previous
consumption
Comparison to the
consumption of the
reference group
Gamification elements
(e.g. tasks,
competition)
Combined with other
DSM instruments (e.g.
financial incentives)
1 The MUNX (Web
platform from Repower
an international energy
company based in
Switzerland.
It operates along the
entire value chain, from
generation, trading,
transmission and
distribution to sales.)
weekly continuous Electricity consumption electricity meter (flat or
house)
electronic web-portal yes yes, comparison to
neighbours
Yes: Quiz, collection of
points, team work
Points can be cashed in
the Munx shop
2 Smart Metering case
study Uttwil (EKT)
real-time (15min) continuous Electricity consumption, estimated
CO2-emissions, savings achieved,
information on new technical
extensions towards smart home
electricity meter (flat or
house)
electronic mobile app,
newsletter, blog
yes no no no
3 bonus model for energy
efficient households
(EWZ), research project
FP-1.9
platform "www.smart-
steps.ch" (mailing, web-
portal, newsletter and
mobile app)
weekly continuous Electricity consumption, estimated
electricity consumption per device
(device oracle), shower
consumption (water and energy),
knowledge improvement
electricity meter (flat or
house); showering separate
electronic visualisations,
numbers, newsletter
yes yes, comparison to
neighbours
challenges, bonus financial incentives can
be cashed over
electricity bill
4 Smart Metering case
study Zurich (EWZ)
continuous for smart meter
users (15min); monthly and
quarterly
continuous electricity consumption electricity meter (flat or
house)
electronic, written,
verbal
numbers, text yes yes no no
5 Smart Metering case
study (EKZ)
15 minutes for Eco Meter
users, daily for web portal
users and monthly with
electricity bill
continuous electricity consumption, costs electricity meter (flat or
house)
electronic, written numbers, signal light yes yes no no
6 eportal repower - online
customer portal (swibi)
twice a year continuous electricity consumption, costs electricity meter (flat or
house); high-rate tariff and
low-rate tariff times
electronic web-portal, numbers,
graphs
yes yes, to other swiss
households
no no
7 my sgsw - online
customer portal (i-web)
annually continuous energy consumption, costs aggregate (high-rate tariff and
low-rate tariff times)
electronic web-portal, numbers,
graphs
yes no no no
8 energybox EKS (EW Kt.
Schaffhausen)
immediately while (for total
energy consumption) and
after answering questions
one-time electricity consumption per year,
evaluation and measurements
(text), potential cost savings in
standby-check
appliances electronic, PDF-
reports
website, text,
numbers, graphs
no yes, swiss average
and best value
no no
9 E-Rechnung - EKS annually continuous electricity consumption and costs
per year
electricity meter (flat or
house); high-rate tariff and
low-rate tariff times
electronic, PDF electronic bill, text,
numbers
yes no no no
10 WaZApp - Werke am
Zürichsee
annually continuous electricity consumption and costs
per year
electricity meter (flat or
house); high-rate tariff and
low-rate tariff times
electronic, PDF mobile-app, text,
numbers, graphs
yes (last 5
years)
no no No
11 tiko power n.a. continuous electricity consumption heating system electronic mobile app, numbers,
graphs
yes yes no control of the heating
system, contribution to
the intelligent energy
network

A-109
Example of use (DSI/DSM) Feedback frequency Feedback
duration
Feedback content (e.g.
consumption, cost, environmental
impact)
Level of breakdown (e.g.
specific rooms/appliances)
Medium of
presentation (e.g.
written, electronic)
Mode of
presentation (e.g.
text, numbers,
graphs)
Comparisons
to previous
consumption
Comparison to the
consumption of the
reference group
Gamification elements
(e.g. tasks,
competition)
Combined with other
DSM instruments (e.g.
financial incentives)
12 Thermography - EKS after recording one-time thermography pictures of the
building
building written (postal) text, pictures no no no no
13 wattson energy meter -
EW Höfe
real-time (3 sec interval) continuous electrical power (W) and costs per
year (calculated by the actual
consumption, electricity price can
be defined); CO2 emissions
(calculated with electricity from the
grid of UK, 0.48152 g/kWh)
electricity meter (flat or
house)
electronic numbers and colours
on the device; graphs
in the software
yes (only
with
additional
software)
no no no
14 EMU check USB energy
meter - EW Höfe
real-time continuous
for one week
electrical power (W) and costs
(calculated for the actual
measurement and per year,
electricity price can be defined); CO2
emissions (calculated for the actual
measurement)
appliance electronic numbers on the
device, graphs in the
software
no no no no
15 Stromdetektiv - EKZ
(energy consulting)
- one-time standby electricity consumption,
electricity consumption and costs
appliances (for standby),
electricity meter (flat or
house); high-rate tariff and
low-rate tariff times
verbal verbal, numbers no no no The customer receives a
switched cable
"Stromsparmaus" as a
present.
16 invoice by post - SGSW annually; (bi-monthly on
account)
continuous consumption and costs electricity meter (flat or
house); high-rate tariff and
low-rate tariff times
written text, numbers, graphs yes no no no
17 invoice by post - EKS annually; monthly on
account
continuous consumption and costs electricity meter (flat or
house); high-rate tariff and
low-rate tariff times
written text, numbers yes no no no
18 invoice by post - Repower semi-annually; (four times
per year on account)
continuous consumption and costs electricity meter (flat or
house); high-rate tariff and
low-rate tariff times
written text, numbers, graphs yes no no no
19 energy2click (Swibi and
asgal)
real-time (1-minute
interval)
continuous consumption and costs aggregate electronic text, numbers, graphs n.a. n.a. no load-control, virtual
power plants
20 smoope messenger - EWZ <15min on request consumption and costs possible electricity meter (flat or
house); high-rate tariff and
low-rate tariff times
electronic mobile-app, text possible n.a. no no
21 Social Power Weekly assignment of
challenges to be completed
in different fields of energy
consumption
Feb-May
2016
Own historical consumption,
challenge completion status of other
participants, challenges, energy tips
Own aggregate electricity
consumption
Electronic
(smartphone, tablet)
well designed, user-
friendly point of
contact (graphs,
numbers, text)
yes yes yes no
22 optimised self-
consumption of solar
energy (EKS)
real-time continuous Electricity consumption, savings
achieved (energy and money),
proportion of self-consumption
There are 3 smart meters, one
at the inverter output for
measuring the incoming solar
input. One is at the input of
the boiler producing warm
water (in case of the huge
amount of energy needed)
and there is one for the rest of
the electric devices.
electronic mobile app, graphs yes no no no
23 EKT (Energie Kanton
Thurgau) energy
efficiency support
program
once a year 3 years Energy consumption and reduction,
Efficiency, reaching of universal
saving goals
the whole company electronic website, regulation
sheet
yes no competition between
the companies to save
more energy than the
others
yes
24 "Meter to Cash" case
study elog Energielogistik
AG (elog)
Monthly continuous electricity consumption and costs,
analysed data, concreate and
standard solutions.
aggregate Written and
electronic
The customers
receive a feedback,
which consists of a
Currently the
company
does not give
any
Currently the
company does not
give comparisons to
the customers, only
no no

A-110
Example of use (DSI/DSM) Feedback frequency Feedback
duration
Feedback content (e.g.
consumption, cost, environmental
impact)
Level of breakdown (e.g.
specific rooms/appliances)
Medium of
presentation (e.g.
written, electronic)
Mode of
presentation (e.g.
text, numbers,
graphs)
Comparisons
to previous
consumption
Comparison to the
consumption of the
reference group
Gamification elements
(e.g. tasks,
competition)
Combined with other
DSM instruments (e.g.
financial incentives)
text with tabs and
numbers.
comparisons
to the
customers,
only an
individual
feedback.
an individual
feedback.
25 Innovative services with
smart meters (Energie
Thun)
Real-time (every second or
every 15 minutes)
continuous electricity consumption (actual,
daily, weekly, total)
A smart meter provides data
on building levels. With the
help of smart plugs, it is
possible to examine the exact
energy consumption of a
single device. Due to this fact,
the level of breakdown with
smart plugs is high and focuses
on single devices e.g.
refrigerators.
electronic via Android
app
Graphs, text,
numbers
yes Unfortunately, there
were no possibilities
for the participants to
compare their energy
consumptions with
each other by the
smart metering app.
The participants got
messages on their
tablets of the following
type:
“Did you know that your
cooling devices use 30 %
of your whole energy
consumption? Maybe
you should think about
the acquisition of a new
refrigerator.”
Saving energy means
also saving energy costs
and therefore it has a
financial incentive to
reduce energy
consumption.
Unfortunately, the app
does not show cost
savings.
26 Nest - Controlling of room
temperature.
There is no given time
period.
Continuous The studies give a look on various
aspects. Such as energy
consumption, the feeling of the Nest
customers and so on.
In Every room, the thermostat
is used.
Electronic Mobile app Yes, it is
compared to
the
consumption
without the
new
technology.
Yes, there is a
comparison for each
customer to their old
consumptions.
no The incentive is for the
user to save energy and
therefore costs.
27 amphiro water
consumption meter. Case
study from ETH Zurich.
while and after every
shower
continuous
during the
duration of
the shower
and some
minutes
after the
shower (not
mentioned
how many
minutes)
While showering: water
consumption since start of shower,
water temperature and energy
efficiency class, polar bear on ice
floe that progressively shrinks as
the amount of energy used
increases. After showering: energy
and water consumption
direct feedback while
showering and afterwards
electronic on digital
display
amphiro a1:
numbers, letters and
animation of polar
bear on shrinking ice
floe displayed on
device. amphiro b1:
same as amphiro a1
with additional
mobile app
no ye none indirect financial
incentives: Through
saving warm water and
thus energy, lots of
electrical energy can be
saved. When reducing
this energy amount your
electricity/oil bill gets
lower.

A-111
Qualitative and Quantitative Evaluation
Objective/quantitative/"hard" evaluation criteria Subjective/qualitative/"soft" evaluation criteria
Example of use (DSI/DSM) Achieved energy saving
(incl. kWh saved / CHF)
Affected population share Persistent effect Strengths of the approach Weaknesses of the approach Comments
1 The MUNX (Web platform
from Repower an
international energy
company based in
Switzerland.
It operates along the
entire value chain, from
generation, trading,
transmission and
distribution to sales.)
n.a. whole German speaking Switzerland
possible
n.a. It's a very simple method of tracking
electricity consumption because you don't
need any installation.
You have to enter the data on your own. So,
there is a possibility for mistakes. You collect
only weekly data and it is difficult to know
why consumption varies from one week to
the next. The possibility to compare
consumption can have a bad effect. When
you see that others in the same street use
more electricity than you, this could stop you
to save energy because you think it’s not
necessary to do it neither.
It’s a really funny platform with a
playful exposure to the consumption
of your electrical power. For
example, the three marmots are
funny and have nothing to do with
electrical power. Customer have to
be active by themselves and
interested in the energy thematic.
Needs time every week, fatigue may
occur.
2 Smart Metering case study
Uttwil (EKT)
electricity savings of 1.7% Customers of EKT with a Smart Meter n.a. Real-time feedback; easy to access
information with in-home display; additional
information about estimated CO2-emissions;
mobile use; additional information about
applied technologies and possibilities;
Acceptance of smart meters before and after
pilot-use of smart meter display have been
analysed;
installation is needed; internet connection is
needed for the inhouse display
Will there be any benefit left today?
3 bonus model for energy
efficient households
(EWZ), research project
FP-1.9
platform "www.smart-
steps.ch" (mailing, web-
portal, newsletter and
mobile app)
no savings compared to control group; user which
monitor consumption by manually recording meter
readings saved 1.71% of the electricity
scalable for all EVU, does not depend on
metering system --> all private household
customers of EVU
The effect of financial incentives
decreases after a few weeks, the
effect of virtual bonus increases
over time.
The share of active users
decreases after time.
combination of learning-, information-, and
challenge-tool; scalable; personalised
(individual recommendation); platform can
be used for further research project
meter readings have to be inserted
manually; only weekly and aggregated data;
"opt in" principle, so a proactive interaction
is needed, this leads to behaviour barriers;
4 Smart Metering case study
Zurich (EWZ)
3.2% of the electricity for smart meter users; no
significant savings for consulting and social
information groups
Customers of EWZ with a Smart Meter Reduction on a medium-term
apparent (1 year)
detailed information and continuous
feedback with smart meter; personal
consumption targets on smart meter displays
are possible
installation is needed; data security
The effect of information could go in both
directions: For example, households with
initially low electricity consumptions could
start to use more if they realise that
comparable households consume more.
5 Smart Metering case study
(EKZ)
up to 3% with real-time visualisation; 2.6% with
daily information on web portal; 1.5% overall
compared to 1.1% in control group
Customers of EKT with a Smart Meter n.a. detailed information and continuous
feedback with smart meter; different types of
comparisons on web portal possible;
visualisation with signal light
installation is needed;
The effect of signal light can go in both
directions, if signal is green the customer
maybe has no motivation to further reduce
the consumption
6 eportal repower - online
customer portal (swibi)
customer of repower one web-portal for the communication with
the customers, bidirectional communication
(e.g. purchasing process implemented); uses
available consumption information; easy to
register with information from the bill;
mobile use
Only static consumption information and
only twice a year. The effect of comparison
could go in both directions: For example,
households with initially low electricity
consumptions could start to use more if they
realise that they are consuming less than the
swiss average
7 my sgsw - online customer
portal (i-web)
n.a. n.a. n.a. one web-portal for the communication with
the customers, bidirectional communication;
uses available consumption information; easy
to register with information from the bill
Only static consumption information and
only once a year.

A-112
Objective/quantitative/"hard" evaluation criteria Subjective/qualitative/"soft" evaluation criteria
Example of use (DSI/DSM) Achieved energy saving
(incl. kWh saved / CHF)
Affected population share Persistent effect Strengths of the approach Weaknesses of the approach Comments
8 energybox EKS (EW Kt.
Schaffhausen)
n.a. because the inputs are anonymous. 1000 people in 2015 and 600 in 2016;
scalable for all EVU --> all private
household customers of EVU
n.a. information of electricity consumption on the
level of appliances; guidance for repairing or
replacing an appliance; no installation is
needed. The calculation model is accurate,
there is an error of 2% for the difference
between calculated and measured
consumption values (Quelle: Auswertung
Energybox 2005)
all data have to be inserted manually. Some
questions are hard to answer for many users.
The information is unique and calculated (no
real data). The effect of comparison could go
in both directions: For example, households
with initially low electricity consumptions
could start to use more if they realise that
they are consuming less than the swiss
average
9 E-Rechnung - EKS n.a. scalable for all EVU --> all private
household customers of EVU
n.a. Receiving the information in the e-banking
portal which is used by the customer for all
payment transactions (no additional portal).
It is possible to pay the bill without looking at
the invoice (the invoice has to be opened
actively and manually), so that the
consumption is maybe not noticed by the
customer.
10 WaZApp - Werke am
Zürichsee
n.a. 100-500 android installations, scalable for
all customers of Werke am Zürichsee
n.a. The information is available at any time on
the mobile device; Possibility to contact or
inform the customer directly; simple way to
access information
Need of installation (app) on the mobile
device
11 tiko power up to 60% (source:
https://tiko.ch/page/product_power/#theoffer)
energy savings in total 1553 MWh until now
(source: https://tiko.ch/)
over 10000 users (Quelle: Energate
Messenger 09.02.2017) scalable for all
households with electrical heating
systems
n.a. Information about a specific appliance
(heating system); easy to use (mobile-app)
Only information about the electrical
consumption of the heating system is
covered. The effect of comparison could go
in both directions: For example, households
with initially low electricity consumptions
could start to use more if they realise that
they are consuming less than the other users.
12 Thermography - EKS n.a. customers of EKS which own a building.
scalable for all EVU --> all house owner
n.a. The energy is made visible by thermography,
so the customers can see the losses.
Investments in buildings can bring long term
energy savings.
Only graphically information about the
thermal losses of the building, no numeric
information (about potential savings in terms
of energy or costs).
13 wattson energy meter -
EW Höfe
on average 20% (source: product flyer "Wattson
Classic")
can be used in every household and does
not depend on the utility
n.a. Real-time information about electricity;
colours for actual consumption are easy to
understand; easy to install and use
information is based on the aggregated
actual used electrical power. It is hard for the
user to interpret this number on the display
and the costs (and CO2 emissions) are
calculated on the actual used power. An
additional device and installation is needed.
14 EMU check USB energy
meter - EW Höfe
n.a. can be used in every household and does
not depend on the utility
n.a. Real-time information about electricity
consumption of a specific appliance; easy to
use (put between the plug socket and the
device); analyses is delivered by the utility
additional device is needed; only one
appliance can be measured
15 Stromdetektiv - EKZ
(energy consulting)
10-20% is possible without losing comfort; 50% of
electricity for lightning is possible (source:
"Stromsparen: bequem und einfach - EKZ
Stromdetektiv")
can be used by all customers of EKZ n.a. personal interaction between customer and
energy experts; understanding of the
electricity bill could have a good effect on
energy consumption
time-consuming and costly process for the
utility; high entrance barrier (an
appointment has to be made, costs for the
customer); no durable delivery (only verbal);
only standby of specific appliances is
measured
16 invoice by post - SGSW n.a. all customers of SGSW which do not use e-
invoicing
n.a. visual consumption comparison over many
years; split costs in different services as grid
usage, taxes, legal fees or energy gives
transparency
Only static consumption information and
only once a year; hard to understand
17 invoice by post - EKS all customers of EKT which do not use e-
invoicing
n.a. consumption comparison to previous year;
split costs in different services as grid usage,
taxes, legal fees or energy gives transparency
Only static consumption information and
only once a year; hard to understand
18 invoice by post - Repower all customers of repower which do not use
e-invoicing
n.a. visual consumption comparison over many
years; split costs in different services as grid
usage, taxes, legal fees or energy gives
Only static consumption information and
only twice a year.

A-113
Objective/quantitative/"hard" evaluation criteria Subjective/qualitative/"soft" evaluation criteria
Example of use (DSI/DSM) Achieved energy saving
(incl. kWh saved / CHF)
Affected population share Persistent effect Strengths of the approach Weaknesses of the approach Comments
transparency; visual overview of relative
shares of the services
19 energy2click (Swibi and
asgal)
n.a. n.a. n.a. Combination of DSI, DSM and business
process automatization; one online-platform
for consumers, prosumers and the utility;
real-time data available
high investments for implementation (smart
meter necessary)
20 smoope messenger - EWZ n.a. 500-800 users, can be used by all
customers of EWZ with a smartphone
n.a. The younger customers are used to
communicate with instant messenger; easy
to use (registration with mobile number);
direct contact; possibility to adapt level of
communication (e.g. informal); can be used
for different companies (e.g. SBB, AXA
Winterthur); many services could be
implemented (e.g. request for energy
consumption report); push notification
possible
Need of installation (app) on the mobile
device; customer has to be verified for
delivering sensitive data like the energy
consumption
21 Social Power Winterthur: on average 5.6% compared to previous
consumption, on average 11.8% compared to the
control group
Massgno: on average 11.8% compared to previous
consumption, on average 8.1% compared to the
control group
120 households from Winterthur and
Massagno
To be measured in summer 2017 Savings achieved
More social embedding helps reduce
frustration and invokes personalization
Some goals have unanticipated results – real-
time electricity feedback (2 seconds) is a lot
of data to manage
need participants to stay in the game
22 optimised self-
consumption of solar
energy (EKS)
energy savings not yet evaluated Costumers of EKS n.a. financial savings are appreciably ---> self-
consumption: Because the costumer is able
to control his or her energy consumption 24/7
they reduce their usage. Like that financial
savings are appreciably for the consumer. A
long-lasting effect of energy saving is
reached.
investment costs: A consumer has to invest
money for reducing costs. This is only
profitable in a period of more than 10 years.
Which means a consumer has to invest in a
sustainable way.
23 EKT (Energie Kanton
Thurgau) energy efficiency
support program
Project not finished yet business customers of EKT with
consumption >100`000kWh/a of
electricity or >1'000'000 kWh/a of thermic
energy, companies which take part in the
competition, probably the employees
yes Close cooperation of consumer and
prosumer. Benefit for every participant and
for EKT. Additionally, it sharpens the
environmental awareness of the companies.
Not fair for smaller companies, because of
not getting the same support. Too little
encouragement for huge companies towards
their needed investments. Would be better
to expand the programme over the whole
country. --> a lot more savings.
24 "Meter to Cash" case
study elog Energielogistik
AG (elog)
n.a. Customers of elog n.a. This System encourages saving energy with
the help of economy. Experts manage the
energy sources for their clients making it less
complicated for the customers.
Customers don't receive immediate
feedback on the energy usage. Elog focuses
more on energy management than on
energy saving.
25 Innovative services with
smart meters (Energie
Thun)
No evaluation studies have been done. Recording
to the commission of energy regulation in Ireland,
different pilot projects have shown that it is
possible to save 3-4 % of energy, if the energy
consumption is revealed.
Every consumer with a smart meter (if
possible with data every second or a
”turbo mode“) and a tablet or a smart
phone with the smart metering app.
n.a. With the automatic calculation of the standby
and cooling device consumption, it was
possible to make a personalised visual
feedback and recommendation for the
consumer. The idea of these interventions is
to provide incentives to reduce energy
consumptions. E.g. the participants were
motivated to undercut the energy
consumption of the previous day.
The information provided by the smart
metering app achieves emotional
confrontation with the energy saving topic
and creates encouragement to reduce
energy.
The algorithm of the approach had
difficulties measuring the consumption of
one household’s old cooling device. The
cooling device had a constant standby
consumption and therefore it was impossible
to deploy the algorithm. Another weakness
of the approach is the inaccurate results of
the measurements repeated every 15
minutes, comparing to the measurements
repeated every second. These however
require a large amount of data, which is
difficult to store. There are no cost-efficient
and economical solutions yet regarding this
problem.
With the smart metering app, it is not
possible for the participants to compare their
It is possible to provide individual and
personal recommendations with
smart meter regarding energy
savings. Unfortunately, no evaluation
studies were done, which could have
shown the effect of this study.
In general, it is possible to provide an
overview of the own energy
consumption. However, several
measurements are still inaccurate
due to missing data storage options.

A-114
Objective/quantitative/"hard" evaluation criteria Subjective/qualitative/"soft" evaluation criteria
Example of use (DSI/DSM) Achieved energy saving
(incl. kWh saved / CHF)
Affected population share Persistent effect Strengths of the approach Weaknesses of the approach Comments
energy consumptions with each other. The
comparison could have had a positive
influence regarding energy savings. Due to
the prevention of loneliness, the social
aspect is important when it comes to
consumption reductions. The eco-friendly
motivation is not as effective as the cost
saving aspect for the consumer. Therefore,
an additional cost saving tool would be a
possible development for the smart
metering app.
26 Nest - Controlling of room
temperature.
Overall savings of about 12% energy costs. Every customer Energy savings The approach is to build or establish a safer
surrounding for people and to make their
lives easier.
Some people might not be happy by the fact,
that private data is collected from them.
Overall it is a very good system,
which is visible in the energy savings
analysed by studies. It is not only
good for the customer, who saves
money, but also for the environment
because of the less energy needed.
27 amphiro water
consumption meter. Case
study from ETH Zurich.
One-person households had water and energy
savings of 21%, two-person households had 25%.
On average, compared to the reference group,
there was an energy saving of 23%. Under
consideration of the average degree of efficiency
for warm water preparation, the energy savings
were 443 kWh per average household and year.
Participants of the study. Considering the
amphiro device itself, the European
population is affected as it is only
delivered within Europe.
The energy and water savings
stagnated at the lower
consumption levels until the end
of the study. The goal of the
amphiro is to achieve a
persistent water and energy
saving.
Water heating is very energy consuming and
therefore it is the right place to applicate
methods of behavioural change. A great
saving potential exists in this topic. The
simplicity of the amphiro is a big strength. You
do not need any expertise to install and
operate the device and the feedback content
is easily understandable.
The relatively high costs of the amphiro can
be a hurdle for people to buy the device. For
extensive energy savings, the amphiro
should be more known in society. Possible
problems are the costs. Compared to the
price of the amphiro the annual savings are
low. As today the cost factor is more
important to people than energy savings, this
could be a reason for its unpopularity.

A-115
Appendix 11. Utilities’ interview Questionnaires (in German only)
Interview Leitfaden für die Befragung der Partner-EVU im Projekt IMPROVE – Ziele:
● Die bestehenden Kundeninformations-Modelle (DSI) für Haushaltskunden sind bekannt ● Die Ziele, welche mit den vorhandenen DSI verfolgt werden, sind bekannt ● Die vorhandenen Informationen über die Verbrauchsdaten im EVU sind bekannt (z.B. Smart Meter Daten) ● Die Motivation der EVU und der Kunden zur Steigerung der Energieeffizienz von den Kunden ist bekannt ● Die Informationsbedürfnisse der Kunden sind bekannt ● Ideen, Bestrebungen und Projekte für zukünftige DSI sind bekannt ● Die Ziele, welche mit zukünftigen DSI verfolgt werden, sind bekannt ● Die zukünftig benötigten Informationen über die Verbrauchsdaten im EVU sind bekannt
Interviewer:
Teilnehmer:
Zeit und Ort des Interviews:
Material: Audio-Recorder, Papier, Stift
Einführung Erstmal danke vielmals für Ihre Bereitschaft an diesem Interview teilzunehmen. Bevor wir starten, werde ich Ihnen ein paar Informationen zum Interview geben. Vorstellung Interviewende David Suter, Masterstudent am INE, Hintergrund in IT, Wirtschaftsingenieur, Projektleiter und Prozessautomatisierung Energiebranche Vorstellung Projekt
Energiestrategie 2050 kann nicht ausschliesslich durch erneuerbare und verbesserter Effizienz erreicht werden, es braucht Verringerung der Nachfrage
Kundeninformation ist ein Schlüsselelement dazu
Projekt IMPROVE -> Informationslücke zwischen vorhandenen Infos bei Kunden und Versorgern schliessen
Vorhandene Informationsmodelle für Haushaltskunden werden untersucht (In- und angrenzendes Ausland), mit Hilfe von EVU in der Schweiz
Daraus werden Empfehlungen für EVU abgeleitet
Zusammenarbeit FHNW, HES-SO, SUPSI und ZHAW, Auftrag von BFE
Ziel des Interviews Expertenwissen abfragen, ist wichtig für das Projekt
Vorhandene Informationsmodelle kennen lernen

A-116
Erfahrungen einholen
Die Projektergebnisse werden auf der Plattform ARAMIS (www.aramis.admin.ch) und auf www.energieforschung.ch veröffentlicht. Ausgenommen sind vertrauliche Daten, diese werden in einem unveröffentlichten Anhang dokumentiert. Dürfen wir den Namen Ihres EVU im Bericht erwähnen, oder sollen die Informationen vertraulich behandelt werden? (ev. Review vor Veröffentlichung) Ablauf des Gespräches: Dauer 1-1.5h Ich werde Ihnen offene Fragen stellen, das heisst, Sie sind in Ihrer Antwort ganz frei. Erzählen Sie mir einfach, was Ihnen in den Sinn kommt und was für Sie wichtig ist. Es gibt keine falschen Antworten. Ich werde mir während des Interviews Notizen machen. Trotzdem wäre es für uns sehr hilfreich, wenn ich das Interview auf Tonband aufnehmen könnte, damit wir sicher alle ihre Aussagen protokolliert haben. Haben Sie dagegen irgendwelche Einwände? Bevor wir mit der ersten Frage starten: Haben Sie noch irgendwelche Fragen bezüglich des Interviews? Legende: kursiv geschrieben: Titel oder Meta-Informationen zum Interview, werden vom Interviewer nicht erzählt Nach dieser kurzen Einleitung können wir nun mit den ersten Fragen starten.
1. Warm up (5min) No Question Notes of the interviewer Target 1.1
Können Sie uns erzählen, welches ihr Tätigkeitsgebiet im Unternehmen ist?
Warm up
1.2 Welche Produkte bieten Sie Ihren Kunden an? Warm up 1.3 Was sind die langfristigen Ziele Ihres Unternehmens? Warm up 1.4 Welche Ergebnisse aus dem Projekt Improve wären für
Sie wünschenswert? Warm up
Nun werden wir einige Fragen zu den von Ihnen eingesetzten Kundeninformations-Systemen stellen.

A-117
2. vorhandene Kundeninformations-Modelle No Question Notes of the interviewer Target 2.1 Welche Informationen über den Energieverbrauch
bieten Sie Ihren Kunden? (E-Rechnung, Energieaudits, Coaching, Online etc.) Wie sind diese ausgestaltet?
Die bestehenden DSI-Modelle sind bekannt
2.2 Über welche Informationen zum Verbrauch Ihrer Kunden verfügen Sie aktuell? (Ablesedaten, Ablesefrequenz etc.)
Die vorhandenen Informationen zu den Verbrauchsdaten im EVU sind bekannt
2.3 Haben Sie Erfahrungen mit Smart Meter in Ihrem Unternehmen? (Rollout geplant? Rollout Strategie? Verwendung? Wann?)
Die vorhandenen Informationen zu den Verbrauchsdaten im EVU sind bekannt
2.4 Welche Informationen erhalten Ihre Kunden über die Rechnung? (Periodizität, Vergleich, Kosten/Verbrauch, Stromkennzeichnung etc.)
Die bestehenden DSI-Modelle sind bekannt
2.5 Verfügen Sie über zeitabhängige Tarife? Die bestehenden DSI-Modelle sind bekannt
2.6 In welchen Formen (postal, E-Rechnung, Mail) und zu welchem Zeitpunkt wird die Rechnung versendet?
Die bestehenden DSI-Modelle sind bekannt
2.7 Welche Ziele verfolgen Sie bei der vorhandenen Kundeninformation?
Die Ziele, welche mit den vorhandenen DSI verfolgt werden, sind bekannt
2.8 Gibt es weitere Möglichkeiten, mit denen sich Kunden über Ihren Energieverbrauch informieren können?
Die bestehenden DSI-Modelle sind bekannt
Bei den nächsten Fragen geht es um die Steigerung der Energieeffizienz bei den Endkunden.

A-118
3. Steigerung der Energieeffizienz No Question Notes of the interviewer Target 3.1 Aus welchen Gründen unterstützen Sie die
Endkunden dabei, dass diese energieeffizienter werden? (z.B. Finanziell, Load-Shifting, Image etc.)
Die Motivation der EVU und der Verbraucher zur Steigerung der Energieeffizienz ist bekannt
3.2 Was treibt Ihrer Ansicht nach die Endkunden an, energieeffizienter zu werden?
Die Motivation der EVU und der Verbraucher zur Steigerung der Energieeffizienz ist bekannt
3.3 Wo setzt aus Ihrer Sicht ein optimales Kundeninformationssystem an?
Die Ziele, welche mit zukünftigen DSI verfolgt werden, sind bekannt
Die folgenden Fragen drehen sich um ihre Bestrebungen hin zu neuen oder verbesserten Kundeninformations-Modellen. 4. zukünftige DSI No Question Notes of the interviewer Target 4.1 Wie sehen die Informationsbedürfnisse Ihrer Kunden
heute und in Zukunft aus? Die
Informationsbedürfnisse der Kunden sind bekannt
4.2 Welche Ideen oder Projekte für eine neue oder verbesserte Kundeninformation sind in Ihrem Unternehmen vorhanden oder wurden bereits umgesetzt?
Ideen, Bestrebungen und Projekte für zukünftige DSI sind bekannt
4.3 Welche Erfahrungen haben Sie in solchen Projekten bereits gemacht?
Ideen, Bestrebungen und Projekte für zukünftige DSI sind bekannt
4.4 Was waren die Rückmeldungen der Kunden (positive und negative)?
Die Informationsbedürfnisse der Kunden sind bekannt
4.5 Was sind die Gründe für solche Projekte, oder aus welchen Gründen sind keine Projekte angedacht?
Die Ziele, welche mit zukünftigen DSI verfolgt werden, sind bekannt

A-119
No Question Notes of the interviewer Target 4.6 Welche Ziele verfolgen Sie, wenn Sie Änderungen an
der Kundeninformation vornehmen? Die Ziele, welche mit
zukünftigen DSI verfolgt werden, sind bekannt
4.6 Welche Informationen benötigen Sie, um Ihre Kunden in Zukunft optimal zu informieren? (z.B. Lastgangdaten)
Die zukünftig benötigten Informationen zu den Verbrauchsdaten im EVU sind bekannt
Wir sind nun fast am Ende des Interviews und ich habe nur noch wenige Fragen. Closing questions No Question Notes of the interviewer Target
6.1 Haben Sie den Eindruck, dass der Energieverbrauch mit geeigneter Kundeninformation gesenkt werden kann?
Closing interview
6.2 Haben Sie Fragen oder Bemerkungen zum Projekt IMPROVE?
Closing interview
Danke vielmals für die Teilnahme an diesem Interview und Ihre interessanten Antworten. Wir werden nun die Antworten unserer Partner-EVU zusammenfassen. Dies fliesst dann in die Analyse des Improve Projektes mit ein. Wir werden im Juni einen Workshop mit allen Partner-EVU durchführen, in dem die Analyse präsentiert wird. Danach wird eine Online-Befragung bei den EVU und den Verbrauchern durchgeführt. Aus den Ideen werden drei optimierte Kundeninformations-Modelle entwickelt. Die Endergebnisse und der Projektbericht werden voraussichtlich im Juni 2018 vorhanden sein. Haben Sie Interesse an dem Abschlussbericht? Einen schönen Abend/Tag!

A-120
Appendix 12. Online survey for consumers’ satisfaction assessement
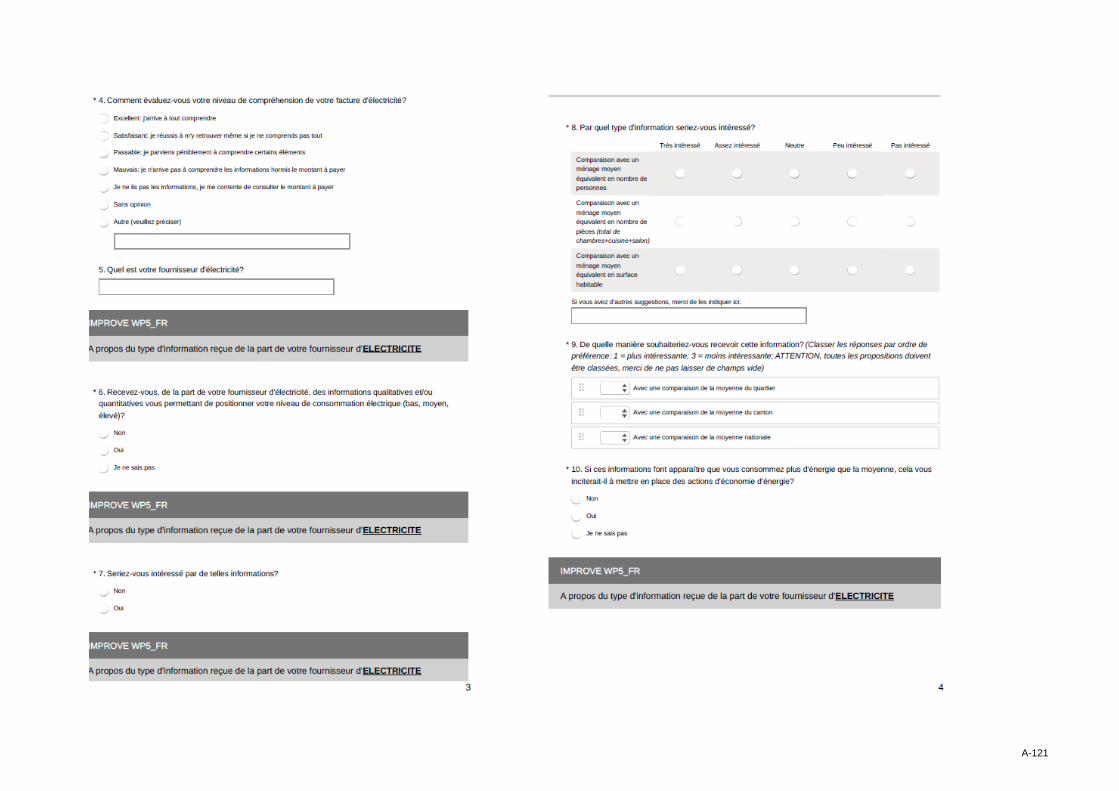
A-121

A-122

A-123

A-124
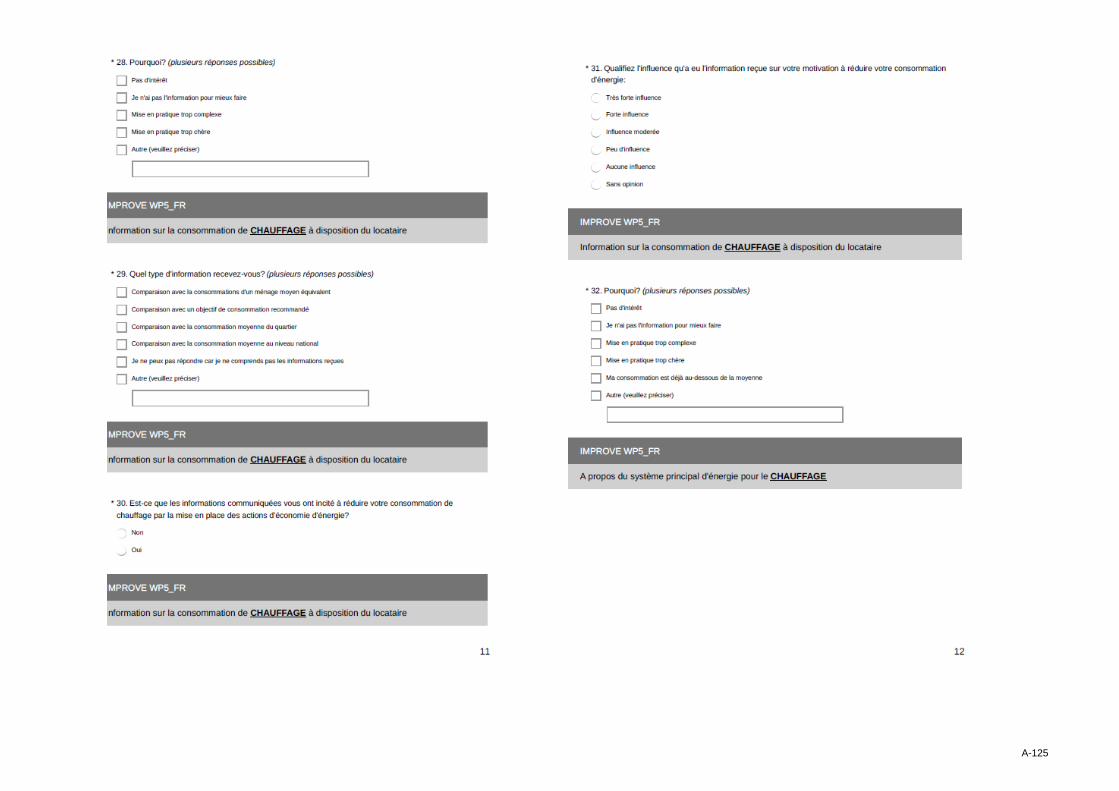
A-125

A-126

A-127

A-128

A-129

A-130

A-131

A-132

A-133

A-134
Appendix 13. IMPROVE proposals

A-135
Appendix 14. Statistical analysis report
Improve project STATISTICAL report
27/2/2018
Electricity consumers’ profile (questions 1 - 15)
Bill (questions 1 - 5)
Question 1
Under what format do you receive your electricity bill? pourcentage
Email 12.4
In-Home display 0.2
Mail 77.2
Mobile devices applications 0.6
Other 0.4
Prepaid 1.0
Web portal 8.4
Question 2
At what frequency do you receive your electricity bill? pourcentage
Annually 6.5
Bi-annually 7.2
Bi-monthly 11.2
Do not know 5.9
Monthly 3.9
Other 1.7
Quarterly 52.2
Triannually 11.3

Appendices - IMPROVE
A-136
Appendix 15. List of utilities contacted by regions
A) German-speaking part of Switzerland:
No. Name Location
1 Wasser- & Elektrizitätswerk Walenstadt 8880 Walenstadt
2 Werkbetriebe Frauenfeld 8503 Frauenfeld
3 Elektrizitätsgenossenschaft Bubikon 8608 Bubikon
4 Industrielle Betriebe Kloten AG 8302 Kloten
5 TBS Strom AG 5034 Suhr
6 Technische Betriebe Würenlos 5436 Würenlos
7 Technische Betriebe Kreuzlingen 8280 Kreuzlingen
8 TB Gränichen Energie AG 5722 Gränichen
9 Technische Betriebe Grabs Strom / CATV 9472 Grabs
10 Technische Betriebe Goldach 9403 Goldach
11 Elektrizitätswerk der Gemeinde Bergün 7482 Bergün/Bravuogn
12 eug Elektra Untergäu Genossenschaft 4616 Kappel SO
13 Stadtwerk Winterthur 8403 Winterthur
14 Gemeindewerke Rüti Elektrizitätsversorgung 8630 Rüti ZH
15 Regio Energie Amriswil (REA) 8580 Amriswil
16 Elektrizitätswerk Vaz/Obervaz 7078 Lenzerheide/Lai
17 Kraftwerk Schaffhausen AG 8201 Schaffhausen
18 Arbon Energie AG 9320 Arbon
19 Elektrizitätswerk Obwalden 6064 Kerns
20 Elektrizitätsversorgung Würenlingen 5303 Würenlingen
21 Elektrizitätsversorgung Murgenthal 4853 Murgenthal
22 Kantonales Elektrizitätswerk Nidwalden 6371 Stans
23 Elektrizitätswerk Obwalden 6064 Kerns
24 Liechtensteinische Kraftwerke 9494 Schaan
25 Stadtwerke Wetzikon 8621 Wetzikon ZH
26 Elektrizitätswerke des Kantons Zürich 8022 Zürich
27 die werke versorgung wallisellen ag 8304 Wallisellen
28 Energie Wasser Bern 3001 Bern
29 EBM (Genossenschaft Elektra Birseck) 4142 Münchenstein
30 Genossenschaft Licht- und Kraftwerke Glattfelden 8192 Glattfelden
31 Elektrizitätswerk Urnäsch AG 9107 Urnäsch
32 EW Aadorf 8355 Aadorf
33 ELEKTRA Bözen 5076 Bözen
34 Elektrizitäts- und Wasserwerk der Stadt Buchs 9471 Buchs SG 1

Appendices - IMPROVE
A-137
35 Technische Betriebe Elektrizitätsversorgung 9400 Rorschach
36 WWZ Energie AG 6301 Zug
37 Werke am Zürichsee AG (Kuesnacht) 8700 Küsnacht ZH
38 Werke Wangen-Brüttisellen 8306 Brüttisellen
39 Thurwerke AG 9630 Wattwil
40 Technische Betriebe Wil 9500 Wil SG
41 Technische Betriebe Glarus Nord 8752 Näfels
42 tba energie ag 4663 Aarburg
43 St. Moritz Energie 7500 St. Moritz
44 SN Energie AG 9000 St. Gallen
45 SH POWER 8201 Schaffhausen
46 SATOM SA 1870 Monthey
47 St. Gallisch-Appenzellische Kraftwerke AG 9001 St. Gallen
48 rwt Regionalwerk Toggenburg AG 9533 Kirchberg SG
49 WERKE Rheineck Elektrizitäts- u.
Wasserversorgung
9424 Rheineck
50 ReLL Regionale energie Lieferung Leuk AG 3952 Susten
51 Regionalwerke AG Baden 5401 Baden
52 Regio Energie Solothurn 4502 Solothurn
53 Rabiosa Energie 7075 Churwalden
54 Gemeindebetriebe Elektrizitätswerk 4914 Roggwil BE
55 Martin Zeller AG Flums Elektrizitätswerk 8890 Flums
56 Licht- und Wasserwerk Adelboden AG 3715 Adelboden
57 Industrielle Betriebe Interlaken 3800 Interlaken
58 Industrielle Betriebe Huttwil AG 4950 Huttwil
59 Gemeindewerke Pfäffikon 8330 Pfäffikon ZH
60 Gemeindewerke Arth 6415 Arth
61 Glattwerk AG 8600 Dübendorf
62 Elektra Gaiserwald 9030 Abtwil SG
63 EWZ Elektrizitätswerk Zermatt AG 3920 Zermatt
64 EGW Weiach Elektrizitätsgenossenschaft c/o
Genossenschaft Licht- und Kraftwerke Glattfelden
8192 Glattfelden
65 EW Wald AG 8636 Wald ZH
66 Elektrizitäts- und Wasserwerk Wettingen 5430 Wettingen
67 Elektrizitätswerk Ursern 6490 Andermatt
68 Elektrizitätswerk Uznach AG 8730 Uznach
69 Elektrizitätswerk Sennwald 9466 Sennwald
70 EWS Energie AG 5734 Reinach AG

Appendices - IMPROVE
A-138
71 Elektrizitätswerk Schmerikon AG 8716 Schmerikon
72 Elektrizitätswerk Samnaun Gemeindehaus 7562 Samnaun-Compatsch
73 Elektrizitätswerk Schwyz AG 6438 Ibach
74 Elektrizitätswerk Rümlang 8153 Rümlang
75 EW Rothrist AG 4852 Rothrist
76 Genossenschaft EW Romanshorn 8590 Romanshorn
77 Elektrizitätswerk Obergoms AG 3985 Münster VS
78 Genossenschaft EW Münchwilen (EWM) 9542 Münchwilen TG
79 Energie und Wasser Meilen AG 8706 Meilen
80 ewl energie wasser luzern 6002 Luzern
81 EWJR Elektrizitätswerk Jona-Rapperswil AG 8645 Jona
82 e & w Dussnang 8374 Dussnang
83 EWD Elektrizitätswerk Davos AG 7270 Davos Platz
84 EWA Energie Wasser Aarberg AG 3270 Aarberg
85 Energie- und Wasserversorgung Appenzell
(Feuerschaugemeinde)
9050 Appenzell
86 EV Gebenstorf AG 5412 Gebenstorf
87 Energieversorgung Büren AG 3294 Büren an der Aare
88 EV Energieversorgung Biberist 4562 Biberist
89 Energie Uster AG 8610 Uster
90 Energie Thun AG 3607 Thun
91 Energie Pool Schweiz AG 8050 Zürich
92 Energie Opfikon AG 8152 Opfikon
93 Energie Gossau AG 8625 Gossau ZH
94 Energie 360° AG 8010 Zürich
95 Elektra Gams 9473 Gams
96 Genossenschaft Elektra, Jegenstorf 3303 Jegenstorf
97 Elektra-Korporation Wolfhalden EKW 9427 Wolfhalden
98 Elektrizitätswerk des Kantons Schaffhausen AG 8201 Schaffhausen
99 Elektrizitätsgenossenschaft Marthalen 8460 Marthalen
100 EGH Elektro - Genossenschaft Hünenberg 6331 Hünenberg
101 EFA Energie Freiamt AG 5630 Muri AG
102 EE-ENERGIA ENGIADINA 7550 Scuol
103 ebs Energie AG 6431 Schwyz
104 Axpo Power AG 5401 Baden
105 Arosa Energie 7050 Arosa
106 AEW Energie AG 5001 Aarau 1 Fächer
107 a.en Aare Energie AG 4601 Olten

Appendices - IMPROVE
A-139
108 Licht- und Wasserwerk Adelboden AG 3715 Adelboden
109 Technische Betriebe Glarus 8750 Glarus
110 Gemeindewerke Stäfa energie und wasser 8712 Stäfa
111 Infrastuktur Männedorf Elektrizitätswerk 8708 Männedorf
112 AG Elektrizitätswerk Maienfeld Stadtverwaltung 7304 Maienfeld
113 Gemeindewerke Horgen 8810 Horgen
114 Gemeindewerke Dietlikon 8305 Dietlikon
115 Technische Betriebe Kemmental
(Gemeindezentrum)
8573 Siegershausen
116 Technische Betriebe Flawil Elektrizität 9230 Flawil
117 Elektra Leibstadt 5325 Leibstadt
118 Elektrizitätsversorgung der Gemeinde Saas-Fee 3906 Saas-Fee
119 Elektrizitätswerk der Gemeinde Samedan 7503 Samedan
120 Elektrizitätswerk der Gemeinde Lindau 8312 Winterberg ZH
121 Elektrizitäts- und Wasserwerk Windisch 5210 Windisch
122 Elektrizitätswerk Vals 7132 Vals
123 EVS Energieversorgung Schänis AG 8718 Schänis
124 Elektrizitätsversorgung Kaltbrunn AG 8722 Kaltbrunn
125 Elektrizitätsversorgung Altendorf AG 8852 Altendorf
126 Elektrizitätswerk Herrliberg 8704 Herrliberg
127 Energie Seeland AG 3250 Lyss
128 Energie AG Sumiswald 3454 Sumiswald
129 tbgs - Technische Betriebe Glarus Süd 8762 Schwanden GL
130 Elektrizitätsgenossenschaft Lufingen 8426 Lufingen
131 Dorfkorporation Weite 9476 Weite
132 Wasser- & Elektrizitätswerk Steinhausen 6312 Steinhausen
133 Kraftwerk Schaffhausen AG 8201 Schaffhausen
134 Industrielle Betriebe Kloten AG 8302 Kloten
135 Technische Gemeindebetriebe Hauptwil-Gottshaus 9213 Hauptwil
136 Einwohnergemeinde Lengnau Bau- und
Werkabteilung
2543 Lengnau BE
137 BKW AG* 3013 Bern
138 SGSW St.Galler Stadtwerke * 9001 St. Gallen
139 EKS Elektrizitätswerk des Kantons Schaffhausen* 8201 Schaffhausen
140 EKS Elektrizitätswerk des Kantons Schaffhausen* 8201 Schaffhausen
141 EKS Elektrizitätswerk des Kantons Schaffhausen* 8201 Schaffhausen
* Official partner utilities collaborating in the IMPROVE research project

Appendices - IMPROVE
A-140
B) French-speaking part of Switzerland:
No. Name Location
1 Services Techniques Tramelan 2720 Tramelan
2 Services Industriels Lausanne de l'Electricité* 1002 Lausanne
3 Services industriels de Delémont 2800 Delémont
4 Services Industriels Lutry 1095 Lutry
5 Services Industriels de Nyon 1260 Nyon 2
6 Services Industriels de la Commune de Fully 1926 Fully
7 Services Electricité, Energies & Développement
Durable (SED2)
1870 Monthey
8 Yverdon-les-bains Energies* 1401 Yverdon-les-Bains
9 GESA Gruyère Energie SA 1630 Bulle
10 L'Energie de Sion-Région SA (esr) 1951 Sion
11 Energie Service Biel / Bienne 2500 Biel/Bienne 1
12 SwissElectricity.com SA 1208 Genève
13 SWG 2540 Grenchen
14 Sinergy Infrastructure SA 1920 Martigny
15 Sierre-Energie SA 3960 Sierre
16 Services Industriels de Bagnes 1934 Le Châble VS
17 Services Industriels Moutier 2740 Moutier
18 Société Électrique du Val-de-Travers S.A. 2108 Couvet
19 Société Electrique de la Vallée de Joux SA 1341 Orient
20 Service Electrique Intercommunal SA (SEIC) 1904 Vernayaz
21 Société Electrique Intercommunale de la Côte SA 1196 Gland
22 Société Electrique des Forces de l'Aubonne (SEFA) 1170 Aubonne
23 Services Techniques de la Municipalité de St-Imier 2610 St-Imier
24 Romande Energie SA 1110 Morges
25 Ville de Pully 1009 Pully
26 EnAlpin AG 3930 Visp
27 Eli10 S.A. 2022 Bevaix
28 Service de l'Electricité SEB 1030 Bussigny
29 FMV SA 1951 Sion
30 Rhonewerke AG c/o FMV SA 1951 Sion
31 Services Industriels de La Neuveville 2520 La Neuveville
32 Electricité de la Lienne S.A. 1951 Sion
33 Bielersee Kraftwerke AG (BIK) 2504 Biel/Bienne
34 Société des Forces Electriques de La Goule 2610 St-Imier
* Official partner utilities collaborating in the IMPROVE research project

Appendices - IMPROVE
A-141
C) Italian-speaking part of Switzerland:
No. Name Location
1 AGE SA 6830 Chiasso
2 AEC - Azienda Elettrica Comunale Airolo 6780 Airolo
3 CEF - Cooperativa Elettrica Faido 6760 Faido
4 AMS - Aziende Municipalizzate Stabio 6855 Stabio
5 AEC – Azienda Elettrica Comunale 6612 Ascona
6 SES* - Società Elettrica Sopracenerina SA 6600 Locarno
7 AEM* - Azienda Elettrica Massagno 6900 Lugano Massagno
8 AIL* - Aziende Industriali di Lugano 6900 Lugano
9 AMB* - Azienda Multiservizi Bellinzona 6500 Bellinzona
10 AIM* - Aziende Industriali di Mendrisio 6850 Mendrisio
* Official partner utilities collaborating in the IMPROVE research project

Appendices - IMPROVE
A-142
Appendix 16. The questionnaire for utilities on DSI models
The present survey offers an overview of 6 possible solutions that have been elaborated by the IMPROVE researchers in the context of currently evolving concepts of demand-side information (DSI). The main aim of these solutions is to enhance energy billing information in Switzerland as to allow consumers to have a better understanding of their energy use and to increase their active engagement in energy efficiency. However, to be effective and feasible, it is fundamental that any proposition takes into account needs and requests of both utilities and consumers. Hence, ultimate aim of this survey is to collect feedback from a utility’s point of view about motivations, costs and benefits linked to the 6 IMPROVE solutions so far developed.
The input provided by your energy utility in this survey is very precious, as it will allow to elaborate and better target recommendations for future DSI for Swiss utilities that will be forwarded to the Swiss Federal Office of Energy (SFOE). About this questionnaire:
To answer the questionnaire will take you about 15 minutes.
The IMPROVE project considers only the residential sector.
All answers will be treated confidential and anonymous and will not be available to third parties.
Thank you for your collaboration!
1. GENERAL INFORMATION
1.1 Utility name:
1.2 Address/Location:
1.3 Contact person:
1.4 E-mail address:
1.5. What form of energy supplies your company to households (check all that apply)?
Form of energy Supplied Total number of residential customers served by your utility:
Electricity
Gas
District heating

Appendices - IMPROVE
A-143
2. MOTIVATIONS FOR IMPROVING INFORMATION FOR RESIDENTIAL HOUSEHOLDS
2.1. To what extent do you agree that the following factors can trigger an improvement in the
consumption information provided in energy bills for households by your utility?
Factor Disagree Somewhat
disagree
Nor disagree
nor agree
Somewhat agree
Agree
1. Need for transparency
2. Compliance with federal legal requirements
3. Compliance with Municipal service mandate
4. Observance of Energy Strategy 2050
5. Reduction of Energy Consumption
6. Customer satisfaction
7. Promotion of load shifting
8. Promotion of utility’s energy consulting services
9. Profiling of customers’ consumption patterns
10. Marketing strategy and customer fidelity programmes

Appendices - IMPROVE
A-144
3. DATA AVAILABILITY
3.1. Please, evaluate your availability of the following RAW DATA for residential households in your
supply area (1 = low; 5 = high)
Raw data 1 2 3 4 5
Annual consumption data
Monthly consumption data
Real-time consumption data (smart meter)
Meteorological data
Number of household members
Type of building (single house, apartment, etc.)
Number of rooms
Energy reference surface SRE (m2)
Type of heating system for hot water
Share of consumption data for hot water
Type of heating system for space heating
Share of consumption data for heating
Type of electrical appliances equipment provided (e.
single or combined freezer; private or shared washing
machine etc.)

Appendices - IMPROVE
A-145
3.2. Please, evaluate feasibility of estimating the following PROCESSED DATA for residential households
in your supply area (1 = low; 5 = high)
Organised/ processed data 1 2 3 4 5 I do not
know
Disaggregation of consumption data for electric appliances
Energy usage compared to previous months / previous year
(same period)
Change in energy consumption (%) over a given billing
period
Profiling similar households (no. of occupants, type of
building, surface)
Profiling of households based on level of consumption of
similar households (e.g. A- G energy label classes,
average/efficient/intensive household etc.)
Correlation between energy consumption and
temperature/weather conditions over billing period

Appendices - IMPROVE
A-146
4. GENERAL ASSESSMENT OF IMPROVE SOLUTIONS
In this section we present an overview of the six possible solutions that have been elaborated within the
IMPROVE project that could be included into current energy bills in order to improve customers’ understanding
of their energy consumption.
Solution 1
Language: technical
Comparative statistics: peer comparison
Comparison indicator
Evaluation of the consumption level: not possible
Basic data requirements: Billing consumption data (monthly, annual, real-time)
4.1 Please, indicate whether your utility is already implementing, as shown above, this kind of solution: Yes No
Solution 2
Language: non technical – image (eco label)
Comparative statistics: peer comparison
Comparison indicator : peer household average energy consumption
Evaluation of consumption level: score of a letter (A, B, C, etc.) grey-black colour coding display of own consumption profile
Basic data requirements: Billing consumption data (monthly, annual, real-time) Building type (SFH vs MFH) Number of household members Share of consumption data for heating Share of consumption data for hot water Profiling of HH consumption based on a Utility’s or National benchmark of energy classes (A - G)
4.2 Please, indicate whether your utility is already implementing, as shown above, this kind of solution: Yes No
QuantitéPrix unitaire
CHF
Montant CHF
(hors TVA)% TVA
Énergie 2800 0,10256 287,17 8,0
Consommation énergétique d'un ménage moyen equivalent 2530
Quantité Prix unitaireMontant CHF
(hors TVA)% TVA
Énergie 2800 0,06523 182,64 8,0
Abonnement 5,50000 66,00 8,0
Quantité Prix unitaireMontant CHF
(hors TVA)% TVA
Énergie 2800 0,01400 39,20 8,0
Quantité Prix unitaireMontant CHF
(hors TVA)% TVA
Taxes 2800 0,00600 16,80 8,0
Emoluments 2800 0,00700 19,60 8,0
611,41
Période de facturation
248,64
36,40
39,20
287,17
Total (hors TVA)
Energie consomméePériode de facturation
Sous-total Taxes (hors TVA)
Sous-total Réseau (hors TVA)
Sous-total distribution (hors TVA)
Distribution
Réseau
Taxes publiques & émoluments
Sous-total énergie (hors TVA)
Période de facturation
Période de facturation
Consommation basse
Consommation élevée
Votre consommation d énergie
Consommation d énergied un ménage moyen équivalent
Niveau de consommation de votre ménage

Appendices - IMPROVE
A-147
Solution 3
Language: technical
Comparative statistics: peer comparison
Comparison indicator e: peer household size (no. of members)
Evaluation of consumption level: bar chart display of own consumption profile
Basic data requirements: Billing consumption data (monthly, annual, real-time) Building type (SFH vs MFH) Number of household members Share of consumption data for heating Share of consumption data for hot water Profiling of HH consumption based on a Utility’s or National benchmark (household consumption average /no. of occupants)
4.3 Please, indicate whether your utility is already implementing, as shown above, this kind of solution: Yes No
Solution 4
Language Technical
Comparative statistics: peer comparisonhistorical self-comparison over time
Comparison indicator: energy usage over time (12 months) peer household annual average consumption peer en-efficient household consumption
Evaluation of consumption level:
bar chart progressive curve % of energy-savings
Basic data requirements:
Billing consumption data (monthly, annual, real-time) Historical consumption data (monthly, annual, real-time) Building type (SFH vs MFH) Number of household members Share of consumption data for heating Share of consumption data for hot water Profiling of HH consumption based on a Utility’s or National benchmark of energy classes (average/ efficient / intensive) Change in energy consumption (%)
4.4 Please, indicate whether your utility is already implementing, as shown above, this kind of solution: Yes No
1 2 3 4 > 4
Votre
consommation
d énergie
Niveau moyen de consommation des ménages
Nombre de personnes dans votre ménage
Consommation moyenne des
ménages économes
Consommation moyenne des
ménages
Votre consommation
d énergie
Niveau de consommation annuelleVotre historique de consommation d énergie
Mois
1 2 3 4 5 6 7 8 9 10 11 12
12 derniers mois12 mois avant
Votre consommation d énergie par rapport à
l année dernière
Consommation moyenne des ménages par rapport à l année
dernière
13%15%

Appendices - IMPROVE
A-148
Solution 5
Language: technical
Comparative statistics: peer comparison
Comparison indicator peer household average consumption/no. of HH members en-efficient household consumption/no. of HH members en-intensive household consumption/no. of HH members
Evaluation of consumption level:
bar chart grey-black colour coding display of own consumption profile
Basic data requirements: Billing consumption data (monthly, annual, real-time) Historical consumption data (monthly, annual, real-time) Building type (SFH vs MFH) Number of household members Share of consumption data for heating Share of consumption data for hot water Profiling of HH consumption based on a Utility’s or National benchmark of energy classes (average/ efficient / intensive)
4.5 Please, indicate whether your utility is already implementing, as shown above, this kind of solution: Yes No
Solution 6
Language: non technical – image (emoticon)
Comparative statistics: Peer comparison
Comparison indicator : peer household size (no. of members)
Evaluation of consumption level : score of emoticons grey-black colour coding
Basic data requirements: Billing consumption data (monthly, annual, real-time) Building type (SFH vs MFH) Number of household members Share of consumption data for heating Share of consumption data for hot water Profiling of HH consumption based on a Utility’s or National benchmark (household consumption average /no. of occupants)
4.6 Please, indicate whether your utility is already implementing, as shown above, this kind of solution: Yes
No
1 2 3 4 > 4
Your level
of energy
consumption
Bas
Moyen
Élevé
Bas
Moyen
Élevé
Bas
Moyen
Élevé
Bas
Moyen
Élevé
Bas
Moyen
Élevé
Votre consommation d énergie
Niveau de consommation des ménages
Nombre de personnes dans votre ménage
1
Nombre de personnes dans votre ménage
2 3 4 > 4
J
L K
J
L
Votre niveau de consommation d énergie
L J

Appendices - IMPROVE
A-149
5. COST EVALUATION OF THE IMPROVE SOLUTIONS
5.1 Please, evaluate how possible additional planning costs (e.g. decision-making, organisational tasks,
consultancy, etc.) arising for the implementation of the IMPROVE solutions would be judged by your
energy utility (1 = low; 5 = high):
PLANNING COSTS 1 2 3 4 5
Tabular form – IMPROVE Solution 1
Graphical form – IMPROVE Solution 2 – 6
5.2 Please, evaluate how possible additional management costs (e.g. administration of new service, etc.)
arising for the implementation of the different solutions would be judged as low, medium or high by your
energy utility (1 = low; 5 = high):
MANAGEMENT COSTS 1 2 3 4 5
Tabular form – IMPROVE Solution 1
Graphical form – IMPROVE Solution 2 – 6
5.3 Please, evaluate whether possible additional hardware costs (e.g. smart meter equipment, etc.) arising for
the implementation of the different solutions would be judged as low, medium or high by your energy
utility (1 = low; 5 = high):
HARDWARE COSTS 1 2 3 4 5
Tabular form – IMPROVE Solution 1
Graphical form – IMPROVE Solution 2 – 6
5.4 Please, evaluate the possible additional software costs (e.g. programme, data maintenance, upgrading)
arising for the implementation of the different solutions would be judged as low, medium or high by your
energy utility (1 = low; 5 = high):
SOFTWARE COSTS 1 2 3 4 5
Tabular form – IMPROVE Solution 1
Graphical form – IMPROVE Solution 2 – 6
5.5 Please, evaluate the possible additional costs associated to human resources (e.g. training of the existing
staff, hiring additional staff, etc.) arising for the implementation of the different solutions would be judged
as low, medium or high by your energy utility(1 = low; 5 = high):
HUMAN RESOURCES 1 2 3 4 5
Tabular form – IMPROVE Solution 1
Graphical form – IMPROVE Solution 2 – 6

Appendices - IMPROVE
A-150
6. BENEFIT EVALUATION OF THE IMPROVE SOLUTIONS
6.1. Please, evaluate the possible benefits in terms of improved customer satisfaction, thanks to the
implementation of each solution (1 = low; 5 = high):
CUSTOMER SATISFACTION 1 2 3 4 5
Tabular form – IMPROVE Solution 1
Graphical form – IMPROVE Solution 2 – 6
6.2. Please, evaluate the possible benefits in terms of improved customer fidelity arising thanks to the
implementation of each solution (1 = low; 5 = high):
IMPROVED CUSTOMER FIDELITY 1 2 3 4 5
Tabular form – IMPROVE Solution 1
Graphical form – IMPROVE Solution 2 – 6
6.3. Please, evaluate the possible benefits in terms of utility’s reputation arising thanks to the
implementation of each solution (1 = low; 5 = high):
UTILITY’S REPUTATION 1 2 3 4 5
Tabular form – IMPROVE Solution 1
Graphical form – IMPROVE Solution 2 – 6
6.4. Would you like to add any comments related to the possible costs and benefits associated to any of
the Improve solutions? Or about needs or constraints precluding their implementation?
6.4.1. Improve solutions in general
…………………………………………………………………………………………………………………………
…………………………
…………………………………………………………………………………………………………………………
…………………………
6.4.2. Improve solution 1
…………………………………………………………………………………………………………………………
…………………………
…………………………………………………………………………………………………………………………
…………………………
QuantitéPrix unitaire
CHF
Montant CHF
(hors TVA)% TVA
Énergie 2800 0,10256 287,17 8,0
Consommation énergétique d'un ménage moyen equivalent 2530
Quantité Prix unitaireMontant CHF
(hors TVA)% TVA
Énergie 2800 0,06523 182,64 8,0
Abonnement 5,50000 66,00 8,0
Quantité Prix unitaireMontant CHF
(hors TVA)% TVA
Énergie 2800 0,01400 39,20 8,0
Quantité Prix unitaireMontant CHF
(hors TVA)% TVA
Taxes 2800 0,00600 16,80 8,0
Emoluments 2800 0,00700 19,60 8,0
611,41
Période de facturation
248,64
36,40
39,20
287,17
Total (hors TVA)
Energie consomméePériode de facturation
Sous-total Taxes (hors TVA)
Sous-total Réseau (hors TVA)
Sous-total distribution (hors TVA)
Distribution
Réseau
Taxes publiques & émoluments
Sous-total énergie (hors TVA)
Période de facturation
Période de facturation

Appendices - IMPROVE
A-151
6.4.3. Improve solution 2
…………………………………………………………………………………………………………………………
…………………………
…………………………………………………………………………………………………………………………
…………………………
6.4.4. Improve solution 3
…………………………………………………………………………………………………………………………
…………………………
…………………………………………………………………………………………………………………………
…………………………
6.4.5. Improve solution 4
…………………………………………………………………………………………………………………………
…………………………
…………………………………………………………………………………………………………………………
…………………………
6.4.6. Improve solution 5
…………………………………………………………………………………………………………………………
…………………………
…………………………………………………………………………………………………………………………
…………………………
6.4.7. Improve solution 6
…………………………………………………………………………………………………………………………
…………………………
…………………………………………………………………………………………………………………………
…………………………
Consommation basse
Consommation élevée
Votre consommation d énergie
Consommation d énergied un ménage moyen équivalent
Niveau de consommation de votre ménage
1 2 3 4 > 4
Votre
consommation
d énergie
Niveau moyen de consommation des ménages
Nombre de personnes dans votre ménage
Consommation moyenne des
ménages économes
Consommation moyenne des
ménages
Votre consommation
d énergie
Niveau de consommation annuelleVotre historique de consommation d énergie
Mois
1 2 3 4 5 6 7 8 9 10 11 12
12 derniers mois12 mois avant
Votre consommation d énergie par rapport à
l année dernière
Consommation moyenne des ménages par rapport à l année
dernière
13%15%
1 2 3 4 > 4
Your level
of energy
consumption
Bas
Moyen
Élevé
Bas
Moyen
Élevé
Bas
Moyen
Élevé
Bas
Moyen
Élevé
Bas
Moyen
Élevé
Votre consommation d énergie
Niveau de consommation des ménages
Nombre de personnes dans votre ménage
1
Nombre de personnes dans votre ménage
2 3 4 > 4
J
L K
J
L
Votre niveau de consommation d énergie
L J

Appendices - IMPROVE
A-152
7. FINAL EVALUATION 7.1. On the basis of your above evaluation, how would you assess the LIKELIHOOD that YOUR UTILITY
COMPANY WILL IMPLEMENT the Improve solutions in the paper energy bill format (1 = unlikely; 5 =
very likely)?
1 2 3 4 5
Solution 1
Solution 2
Solution 3
Solution 4
Solution 5
Solution 6
QuantitéPrix unitaire
CHF
Montant CHF
(hors TVA)% TVA
Énergie 2800 0,10256 287,17 8,0
Consommation énergétique d'un ménage moyen equivalent 2530
Quantité Prix unitaireMontant CHF
(hors TVA)% TVA
Énergie 2800 0,06523 182,64 8,0
Abonnement 5,50000 66,00 8,0
Quantité Prix unitaireMontant CHF
(hors TVA)% TVA
Énergie 2800 0,01400 39,20 8,0
Quantité Prix unitaireMontant CHF
(hors TVA)% TVA
Taxes 2800 0,00600 16,80 8,0
Emoluments 2800 0,00700 19,60 8,0
611,41
Période de facturation
248,64
36,40
39,20
287,17
Total (hors TVA)
Energie consomméePériode de facturation
Sous-total Taxes (hors TVA)
Sous-total Réseau (hors TVA)
Sous-total distribution (hors TVA)
Distribution
Réseau
Taxes publiques & émoluments
Sous-total énergie (hors TVA)
Période de facturation
Période de facturation
Consommation basse
Consommation élevée
Votre consommation d énergie
Consommation d énergied un ménage moyen équivalent
Niveau de consommation de votre ménage
1 2 3 4 > 4
Votre
consommation
d énergie
Niveau moyen de consommation des ménages
Nombre de personnes dans votre ménage
Consommation moyenne des
ménages économes
Consommation moyenne des
ménages
Votre consommation
d énergie
Niveau de consommation annuelleVotre historique de consommation d énergie
Mois
1 2 3 4 5 6 7 8 9 10 11 12
12 derniers mois12 mois avant
Votre consommation d énergie par rapport à
l année dernière
Consommation moyenne des ménages par rapport à l année
dernière
13%15%
1 2 3 4 > 4
Your level
of energy
consumption
Bas
Moyen
Élevé
Bas
Moyen
Élevé
Bas
Moyen
Élevé
Bas
Moyen
Élevé
Bas
Moyen
Élevé
Votre consommation d énergie
Niveau de consommation des ménages
Nombre de personnes dans votre ménage
1
Nombre de personnes dans votre ménage
2 3 4 > 4
J
L K
J
L
Votre niveau de consommation d énergie
L J

Appendices - IMPROVE
A-153
7.2. Depending on the customers’ socio-demographic and educational background, needs and
expectations in regards to energy billing information may differ. What is the current LIKELIHOOD of
your utility to provide different graphical billing solutions depending on the customer segment that is
being addressed (1 = low; 5 = high)?
Factor 1 2 3 4 5
Providing different graphical billing solutions based on the customer profile
7.3. Is there any element you already include/plan to include in energy bills for household customers,
that you would like to notify us?
7.4.
Yes:, namely:_______________________________
…………………………………………………………………………………………………………………………………..
No (-> end of the survey)
7.5. If you have any material that can be useful regarding DSI (Demand-Side-information) billing
improvement in your utility company, and would like to share it with us, please, upload it here.
Thank you for answering!

Appendices - IMPROVE
A-154
Appendix 17. Responses to the questionnaires
A) MOTIVATIONS FOR IMPROVING INFORMATION FOR RESIDENTIAL HOUSEHOLDS
Q2.1 To what extent do you agree that the following factors can trigger an improvement in the consumption
information provided in energy bills for households by your utility?
5 = Agree; 4 = Somewhat agree; 3 = Nor disagree nor agree; 2 = Somewhat disagree;
1 = Disagree
MEAN = 4.04; St. Dev = 0.90 MEAN = 3.69; St. Dev = 1.24
MEAN = 3.27; St. Dev = 1.27 MEAN = 3.44; St. Dev = 1.07
MEAN = 3.65; St. Dev = 0.93 MEAN = 4.08; St. Dev = 0.92
31%
13%
50%
6%
Agree
Disagree
Nor disagree nor agree
Somewhat agree
Somewhat disagree
Need for transparency (n=48)
38%
2%
33%
15%
13%
Agree
Disagree
Nor disagree nor agree
Somewhat agree
Somewhat disagree
Compliance with federal legal requirements (n=48)
23%
10%
38%
17%
13%
Agree
Disagree
Nor disagree nor agree
Somewhat agree
Somewhat disagree
Compliance with Municipal mandate (n=48)
10%
6%
19%
50%
15%
Agree
Disagree
Nor disagree nor agree
Somewhat agree
Somewhat disagree
Observance Energy Strategy 2050 (n=48)
15%
2%
23%
50%
10%
Agree
Disagree
Nor disagree nor agree
Somewhat agree
Somewhat disagree
Reduction of energy consumption (n = 48)
38%
0%
15%
42%
6%
Agree
Disagree
Nor disagree nor agree
Somewhat agree
Somewhat disagree
Customer satisfaction (n=48)

Appendices - IMPROVE
A-155
5 = Agree; 4 = Somewhat agree; 3 = Nor disagree nor agree; 2 = Somewhat disagree;
1 = Disagree
MEAN = 3.38; St. Dev = 1.00 MEAN = 3.83; St. Dev = 0.86
MEAN = 3.52; St. Dev = 1.03 MEAN = 3.54; St. Dev = 1.15
B) DATA AVAILABILITY
Q3.1 Please, evaluate your availability of the following RAW DATA for residential households in your supply
area (1 = low; 5 = high)
RAW DATA
MEAN = 4.76
ST.DEV = 0.57
MEAN = 2.00
ST.DEV= 1.17
6%
6%
25%
50%
13%
Agree
Disagree
Nor disagree nor agree
Somewhat agree
Somewhat disagree
Promotion of load shifting (n=48)
21%
2%
27%
48%
2%
Agree
Disagree
Nor disagree nor agree
Somewhat agree
Somewhat disagree
Promotion of utility's energy consulting services (n=48)
15%
4%
25%
44%
13%
Agree
Disagree
Nor disagree nor agree
Somewhat agree
Somewhat disagree
Profiling of customers’ consumption patterns (n=48)
19%
6%
19%
44%
13%
Agree
Disagree
Nor disagree nor agree
Somewhat agree
Somewhat disagree
Marketing strategy and customer fidelity programmes(n=48)
48%
20%
22%
7%
4%
Difficult
2
3
4
Easy
Monthly consumption (n=46)
0%
0%
7%
11%
83%
Difficult
2
3
4
Easy
Annual consumption data (n=46)

Appendices - IMPROVE
A-156
MEAN = 1.52
ST.DEV = 0.84
MEAN = 2.38
ST.DEV =1.42
MEAN = 2.02
ST.DEV = 1.15
MEAN = 3.53
ST. DEV = 1.20
61%
33%
2%
2%
2%
Difficult
2
3
4
Easy
Real-time consumption data (n=46)
38%
21%
17%
11%
13%
Difficult
2
3
4
Easy
Metereological data (n=47)
43%
30%
15%
9%
4%
Difficult
2
3
4
Easy
Number of household members (n=47)
9%
11%
21%
38%
21%
Difficult
2
3
4
Easy
Type of building - single house, apartment etc. (n=47)

Appendices - IMPROVE
A-157
MEAN = 2.30
ST.DEV = 1.38
MEAN = 1.83
ST.DEV = 1.20
MEAN = 2.70
ST.DEV = 1.33
MEAN = 1.57
ST.DEV = 0.83
43%
17%
17%
15%
9%
Difficult
2
3
4
Easy
Number of rooms (n=47)
57%
21%
6%
11%
4%
Difficult
2
3
4
Easy
Energy reference surface SRE - m2 (n=47)
26%
22%
15%
30%
7%
Difficult
2
3
4
Easy
Type of heating system for hot water (n=46)
61%
26%
9%
4%
0%
Difficult
2
3
4
Easy
Share of consumption data for hot water (n=46)

Appendices - IMPROVE
A-158
MEAN = 2.72
ST. DEV = 1.28
EAN = 1.73
ST.DEV = 0.94
MEAN = 1.20
ST.DEV = 0.50
22%
22%
30%
15%
11%
Difficult
2
3
4
Easy
Type of heating system for space heating (n=46)
53%
27%
13%
7%
0%
Difficult
2
3
4
Easy
Share of consumption data for space (n=45)
84%
11%
4%
0%
0%
Difficult
2
3
4
Easy
Type of electrical appliances equipment provided (n=45)

Appendices - IMPROVE
A-159
Q3.2 Please, evaluate feasibility of estimating the following PROCESSED DATA for residential households in
your supply area (1 = low; 5 = high)
PROCESSED DATA
MEAN = 1.10
ST.DEV = 0.30
MEAN = 3.93
ST.DEV = 1.44
MEAN = 4.19
ST.DEV = 1.06
MEAN = 2.19
ST.DEV = 1.18
88%
9%
0%
0%
0%
2%
Difficult
2
3
4
Easy
I don't know
Disaggregation of consumption data (n=43)
14%
2%
14%
16%
53%
0%
Difficult
2
3
4
Easy
I don't know
Energy usage compared to previous months / previous year - same period (n=43)
2%
5%
19%
19%
53%
2%
Difficult
2
3
4
Easy
I don't know
Change in energy consumption (%) over a given billing period (n=43)
37%
28%
16%
16%
2%
0%
Difficult
2
3
4
Easy
I don't know
Profiling similar households - no. of occupants, type of building, surface (n=43)

Appendices - IMPROVE
A-160
MEAN = 1.95
ST.DEV = 1.00
MEAN = 2.23
ST.DEV = 1.25
C) GENERAL ASSESSMENT OF IMPROVE SOLUTIONS
Q4.1 – Q4.6 Please, indicate whether your utility is already implementing this kind of solution (Solution 1 – 6):
Yes No
44%
23%
26%
7%
0%
0%
Difficult
2
3
4
Easy
I don't know
Profiling of households based on level of consumption of similar households - A -G
energy label classes, average/efficient/intensive household etc. (n=43)
35%
33%
14%
12%
7%
0%
Difficult
2
3
4
Easy
I don't know
Correlation between energy consumption and temperature/weather conditions over billing
period (n=43)

Appendices - IMPROVE
A-161
Solution 1
Solution 2
Solution 3
Solution 4
48%52%
DSI Implementation similar to Solution 1 already in place (n=42)
No
Yes
95%
5%
DSI Implementation similar to Solution 2 already in place (n=42)
No
Yes
95%
5%
DSI Implementation similar to Solution 3 already in place (n=42)
No
Yes
88%
12%
DSI Implementation similar to Solution 4 already in place (n=42)
No
Yes
QuantitéPrix unitaire
CHF
Montant CHF
(hors TVA)% TVA
Énergie 2800 0,10256 287,17 8,0
Consommation énergétique d'un ménage moyen equivalent 2530
Quantité Prix unitaireMontant CHF
(hors TVA)% TVA
Énergie 2800 0,06523 182,64 8,0
Abonnement 5,50000 66,00 8,0
Quantité Prix unitaireMontant CHF
(hors TVA)% TVA
Énergie 2800 0,01400 39,20 8,0
Quantité Prix unitaireMontant CHF
(hors TVA)% TVA
Taxes 2800 0,00600 16,80 8,0
Emoluments 2800 0,00700 19,60 8,0
611,41
Période de facturation
248,64
36,40
39,20
287,17
Total (hors TVA)
Energie consomméePériode de facturation
Sous-total Taxes (hors TVA)
Sous-total Réseau (hors TVA)
Sous-total distribution (hors TVA)
Distribution
Réseau
Taxes publiques & émoluments
Sous-total énergie (hors TVA)
Période de facturation
Période de facturation
Consommation basse
Consommation élevée
Votre consommation d énergie
Consommation d énergied un ménage moyen équivalent
Niveau de consommation de votre ménage
1 2 3 4 > 4
Votre
consommation
d énergie
Niveau moyen de consommation des ménages
Nombre de personnes dans votre ménage
Consommation moyenne des
ménages économes
Consommation moyenne des
ménages
Votre consommation
d énergie
Niveau de consommation annuelleVotre historique de consommation d énergie
Mois
1 2 3 4 5 6 7 8 9 10 11 12
12 derniers mois12 mois avant
Votre consommation d énergie par rapport à
l année dernière
Consommation moyenne des ménages par rapport à l année
dernière
13%15%

Appendices - IMPROVE
A-162
Solution 5
Solution 6
D) COST EVALUATION OF THE IMPROVE SOLUTIONS
Q5.1 Please, evaluate how possible additional planning costs (e.g. decision-making, organisational tasks,
consultancy, etc.) arising for the implementation of the IMPROVE solutions would be judged by your energy
utility (1 = low; 5 = high):
MEAN = 2.88
ST.DEV =1.35
MEAN = 3.79
ST. DEV = 0.90
Q5.2 Please, evaluate how possible additional management costs (e.g. administration of new service, etc.) arising for the implementation of the different solutions would be judged as low, medium or high by your energy utility (1 = low; 5 = high):
14%
36%
14%
19%
17%
Low
2
3
4
High
Planning costs (n=42)
Tabular
0%
10%
24%
45%
21%
Low
2
3
4
High
Planning costs (n=42)
Graphical
100%
0%
DSI Implementation similar to Solution 5 already in place (n=42)
No
Yes
98%
2%
DSI Implementation similar to Solution 6 already in place (n=42)
No
Yes
1 2 3 4 > 4
Your level
of energy
consumption
Bas
Moyen
Élevé
Bas
Moyen
Élevé
Bas
Moyen
Élevé
Bas
Moyen
Élevé
Bas
Moyen
Élevé
Votre consommation d énergie
Niveau de consommation des ménages
Nombre de personnes dans votre ménage
1
Nombre de personnes dans votre ménage
2 3 4 > 4
J
L K
J
L
Votre niveau de consommation d énergie
L J

Appendices - IMPROVE
A-163
MEAN = 2.71
ST.DEV = 1.22
MEAN = 3.33
ST.DEV = 1.12
Q5.3 Please, evaluate whether possible additional hardware costs (e.g. smart meter equipment, etc.) arising for the implementation of the different solutions would be judged as low, medium or high by your energy utility (1 = low; 5 = high):
MEAN = 3.33
ST.DEV = 1.49
MEAN = 4.00
ST.DEV = 1.10
Q5.4 Please, evaluate the possible additional software costs (e.g. programme, data maintenance, upgrading) arising for the implementation of the different solutions would be judged as low, medium or high by your energy utility (1 = low; 5 = high):
MEAN = 3.12
ST.DEV = 1.25
MEAN = 3.76
ST.DEV = 0.79
Q5.5 Please, evaluate the possible additional costs associated to human resources (e.g. training of the existing staff, hiring additional staff, etc.) arising for the implementation of the different solutions would be judged as low, medium or high by your energy utility(1 = low; 5 = high):
17%
31%
26%
17%
10%
Low
2
3
4
High
Management costs (n=42)
Tabular
5%
19%
31%
29%
17%
Low
2
3
4
High
Management costs (n=42)
Graphical
17%
17%
14%
21%
31%
Low
2
3
4
High
Hardware costs (n=42)
Tabular
2%
12%
10%
36%
40%
Low
2
3
4
High
Hardware costs (n=42)
Graphical
12%
21%
24%
29%
14%
Low
2
3
4
High
Software costs (n=42)
Tabular
0%
7%
24%
55%
14%
Low
2
3
4
High
Software costs (n=42)
Graphical

Appendices - IMPROVE
A-164
MEAN = 2.52
ST.DEV = 1.13
MEAN = 3.10
ST.DEV = 1.03
21%
26%
38%
7%
7%
Low
2
3
4
High
Human resources (n=42)
Tabular
7%
17%
45%
21%
10%
Low
2
3
4
HighHuman resources (n=42)
Graphical

Appendices - IMPROVE
A-165
E) BENEFIT EVALUATION OF THE IMPROVE SOLUTIONS
Q6.1 Please, evaluate the possible benefits in terms of improved customer satisfaction, thanks to the implementation of each solution (1 = low; 5 = high):
MEAN = 2.57
ST.DEV = 1.04
MEAN = 3.14
ST.DEV = 1.18
Q6.2 Please, evaluate the possible benefits in terms of improved customer fidelity arising thanks to the
implementation of each solution (1 = low; 5 = high):
MEAN = 2.40
ST.DEV = 1.08
MEAN = 2.81
ST.DEV = 1.15
Q6.3 Please, evaluate the possible benefits in terms of utility’s reputation arising thanks to the implementation of
each solution (1 = low; 5 = high):
MEAN = 2.52
ST.DEV = 1.02
MEAN = 3.02
ST.DEV = 0.95
Q6.4 Would you like to add any comments related to the possible costs and benefits associated to any of the
Improve solutions? Or about needs or constraints precluding their implementation?
26%
26%
29%
19%
0%
Low
2
3
4
High
Customer fidelity (n=42)
Tabular
17%
19%
38%
19%
7%
Low
2
3
4
High
Customer fidelity (n=42)
Graphical
14%
40%
26%
17%
2%
Low
2
3
4
High
Utility's reputation (n=42)
Tabular
5%
26%
33%
33%
2%
Low
2
3
4
High
Utility's reputation (n=42)
Graphical
14%
38%
26%
19%
2%
Low
2
3
4
High
Customer satisfaction (n=42)
Tabular
10%
24%
19%
38%
10%
Low
2
3
4
High
Customer satisfaction (n=42)
Graphical
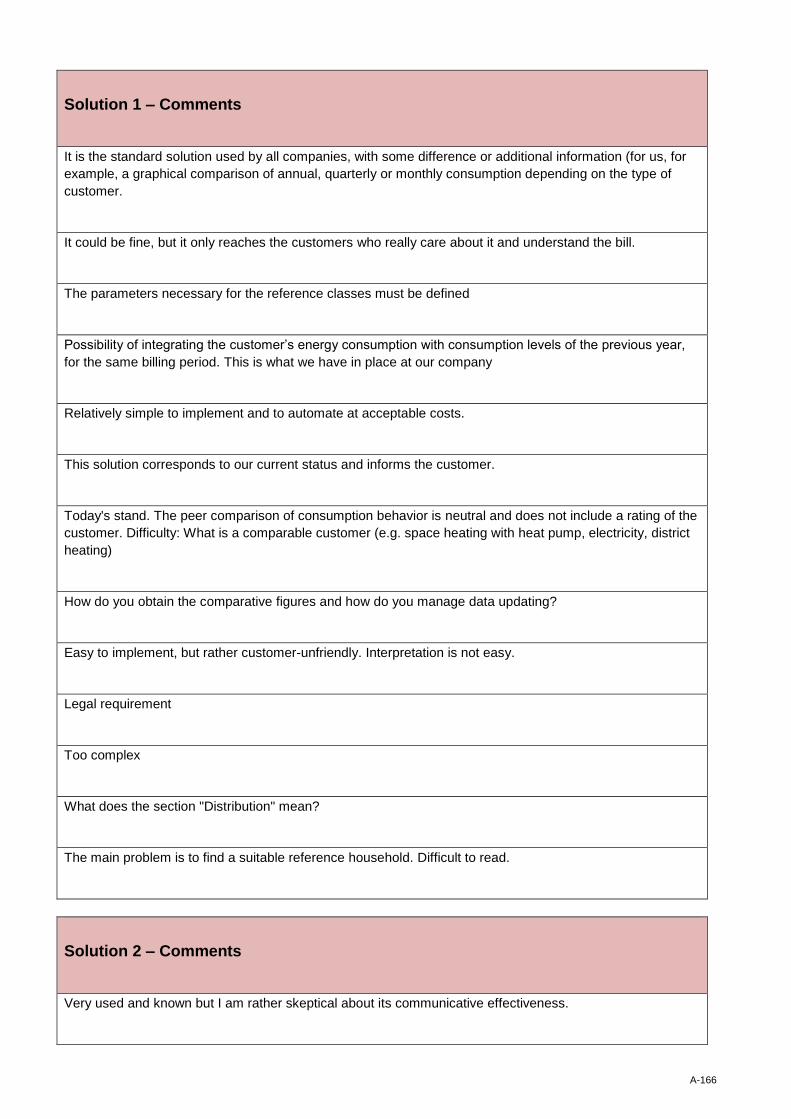
Appendices - IMPROVE
A-166
Solution 1 – Comments
It is the standard solution used by all companies, with some difference or additional information (for us, for
example, a graphical comparison of annual, quarterly or monthly consumption depending on the type of
customer.
It could be fine, but it only reaches the customers who really care about it and understand the bill.
The parameters necessary for the reference classes must be defined
Possibility of integrating the customer’s energy consumption with consumption levels of the previous year,
for the same billing period. This is what we have in place at our company
Relatively simple to implement and to automate at acceptable costs.
This solution corresponds to our current status and informs the customer.
Today's stand. The peer comparison of consumption behavior is neutral and does not include a rating of the
customer. Difficulty: What is a comparable customer (e.g. space heating with heat pump, electricity, district
heating)
How do you obtain the comparative figures and how do you manage data updating?
Easy to implement, but rather customer-unfriendly. Interpretation is not easy.
Legal requirement
Too complex
What does the section "Distribution" mean?
The main problem is to find a suitable reference household. Difficult to read.
Solution 2 – Comments
Very used and known but I am rather skeptical about its communicative effectiveness.

Appendices - IMPROVE
A-167
"Fashion" solution but not reasonable for the energy consumption of an individual. No relationship with the
categories of electrical appliances (given that it depends mainly on the frequency of use of the same) which
inevitably leads to confusion. To avoid.
The parameters necessary for the reference classes must be defined
System too similar and therefore potentially inconsistent with the energy label / CEBS system. The
information available in regards to households (potentially changing with each relocation/transfer) is too
limited to establish such information with relevance.
This approach is too simple; insufficient information
Comments in regards to Solutions 2-6:
1. These solutions require a great deal of basic data, which must be constantly updated.
2. I am convinced that only a small proportion of energy customers will investigate the actual relationship
(smart meter with interface).
3. The graphical representations will confuse or unsettle some customers.
4. There is no incentive to save energy.
5. The saving leverage should perhaps be applied to the sale or production of more and more electrical and
electronic equipment. But since this represents a profitable industry, this is never taken into consideration.
6. Energy-savings and sustainable, decentralized energy production are being discussed. In this context,
the consequences for existing or new energy networks in terms of size, voltage, frequency fluctuations,
harmonic waves etc. must be urgently included.
Clear solution for customers. Labels are accepted. Difficulty of definition from A to G.
How do you obtain the comparative figures and how do you manage data updating?
"Energy label" is known, rather understandable, information at a glance, without having to read a text.
Problem: allocation is unknown.
Hackneyed
For all comparisons -> Basics for benchmark are missing!
Not meaningful
The main problem is to find a suitable household for reference. Representation is clear.
Solution 3 – Comments

Appendices - IMPROVE
A-168
Not very interesting, the customer may want to compare consumption with peers, however, the other
codifications are of little interest.
Good solution neutral and not offensive to the customer.
Technically relatively easy to achieve.
Need to know if the consumption presented / compared does or does not include the consumption of
heating and that of domestic hot water.
Good approach that allows a reading of one’s own consumption without judgment.
Simple solution. Data base, number of persons in the household, which is not always known, and data
updating has to be questioned, since there is no obligation to register.
How do you obtain the comparative figures and how do you manage the data updating?
Simple illustration. Allocation simply solved.
What is an average household? Customer cannot make out anything with this representation. The profiles
are very different.
We cannot estimate the number of people and there are no statistics which we can officially access ->
Privacy!
Cross-comparisons of households are questionable, not meaningful and always in need of interpretation.
Costumer behavior and the relevant equipment used are too different.
The main problem is to find a suitable reference household. The problem is somewhat diminished through
the given representation.
Solution 4 – Comments
Interesting, graphs are the best to stimulate attention.
This Solution is too complicated to achieve at the moment. Only with smart meter roll-out will it be possible
to provide meaningful monthly consumption to the customer.
Need to know if the consumption presented / compared does or does not include the consumption of
heating and that of domestic hot water. Possibility of obtaining this information by analysis of the load curve,
but heavy infrastructure to set up for this.
Very technical and rich in information. Possibly too complex for private customers. Also complicated for the
energy suppliers to set the data according to the average profiles.
Only accessible via smart meter solution (since monthly reading is required)
How do you obtain the comparative figures and how do you manage data updating?

Appendices - IMPROVE
A-169
Very big effort, requires smart meters, implementation possible only after smart meter roll-out
Rather feasible solution
If the smart meters are rolled-out nationwide, then such evaluations can be made, otherwise the reporting is
annual.
Comparison of one’s own consumption in the previous year is the most reasonable solution. Efforts to
reduce energy consumption are easily observed.
Solution 5 – Comments
Not meaningful nor explanatory
This Solution is easily understood by the customer, more accurate than Solution 3 and less irritating than
Solution 6.
Good solution easy to understand, graphical and accessible. Draws more attention to one’s one
consumption, without real judgment.
The definition of the different ratings is difficult because electricity consumption differs according to different
applications per household (electric heating, heat pump, district heating)
How do you obtain the comparative figures and how do you manage the data updating?
Although we do not provide it on our energy bill, we offer it in our customer portal on an annual basis
Same as Solution 3, but more detailed.
Differentiated, but like Solution 3
Same comment as for Solution 3: Cross-comparisons of households are questionable, not meaningful and
always in need of interpretation. Costumer behavior and the relevant equipment used are too different.
The main problem is to find a suitable reference household. The additional subdivision of the bars brings
low added value.

Appendices - IMPROVE
A-170
Solution 6 – Comments
Simple solution, always appreciated.
To avoid. The icons implicitly contain a judgment on customer consumption (good / bad) that would be
negatively interpreted by most people.
Necessary analysis
Not meaningful.
Contains a judgement from sides of the energy utility. We should not rate the customers. So solutions 1 - 5
are better.
How do you obtain the comparative figures and how do you manage data updating?
too little "exact" / not meaningful
Not possible.
Not effective
Different rating levels are merged. Is it the number of people or the energy consumption that is being
assessed?

Appendices - IMPROVE
A-171
F) FINAL EVALUATION
Q7.1 On the basis of your above evaluation, how would you assess the LIKELIHOOD that YOUR UTILITY
COMPANY WILL IMPLEMENT the Improve solutions in the paper energy bill format (1 = unlikely; 5 = very
likely)?
MEAN = 3.00
ST.DEV = 1.50
MEAN = 2.45
ST.DEV = 1.19
MEAN = 2.33
ST.DEV = 1.12
QuantitéPrix unitaire
CHF
Montant CHF
(hors TVA)% TVA
Énergie 2800 0,10256 287,17 8,0
Consommation énergétique d'un ménage moyen equivalent 2530
Quantité Prix unitaireMontant CHF
(hors TVA)% TVA
Énergie 2800 0,06523 182,64 8,0
Abonnement 5,50000 66,00 8,0
Quantité Prix unitaireMontant CHF
(hors TVA)% TVA
Énergie 2800 0,01400 39,20 8,0
Quantité Prix unitaireMontant CHF
(hors TVA)% TVA
Taxes 2800 0,00600 16,80 8,0
Emoluments 2800 0,00700 19,60 8,0
611,41
Période de facturation
248,64
36,40
39,20
287,17
Total (hors TVA)
Energie consomméePériode de facturation
Sous-total Taxes (hors TVA)
Sous-total Réseau (hors TVA)
Sous-total distribution (hors TVA)
Distribution
Réseau
Taxes publiques & émoluments
Sous-total énergie (hors TVA)
Période de facturation
Période de facturation
21%
21%
17%
17%
24%
Very unlikely
2
3
4
Very likely
Solution 1
29%
24%
24%
21%
2%
Very unlikely
2
3
4
Very likely
Solution 2Consommation basse
Consommation élevée
Votre consommation d énergie
Consommation d énergied un ménage moyen équivalent
Niveau de consommation de votre ménage
26%
36%
19%
17%
2%
Very unlikely
2
3
4
Very likely
Solution 3
1 2 3 4 > 4
Votre
consommation
d énergie
Niveau moyen de consommation des ménages
Nombre de personnes dans votre ménage

Appendices - IMPROVE
A-172
MEAN = 2.69
ST.DEV = 1.30
MEAN = 2.40
ST.DEV = 1.15
MEAN = 2.05
ST.DEV = 1.23
Consommation moyenne des
ménages économes
Consommation moyenne des
ménages
Votre consommation
d énergie
Niveau de consommation annuelleVotre historique de consommation d énergie
Mois
1 2 3 4 5 6 7 8 9 10 11 12
12 derniers mois12 mois avant
Votre consommation d énergie par rapport à
l année dernière
Consommation moyenne des ménages par rapport à l année
dernière
13%15%
24%
24%
19%
26%
7%
Very unlikely
2
3
4
Very likely
Solution 4
1 2 3 4 > 4
Your level
of energy
consumption
Bas
Moyen
Élevé
Bas
Moyen
Élevé
Bas
Moyen
Élevé
Bas
Moyen
Élevé
Bas
Moyen
Élevé
Votre consommation d énergie
Niveau de consommation des ménages
Nombre de personnes dans votre ménage
24%
36%
21%
14%
5%
Very unlikely
2
3
4
Very likely
Solution 5
45%
26%
12%
12%
5%
Very unlikely
2
3
4
Very likely
Solution 6
1
Nombre de personnes dans votre ménage
2 3 4 > 4
J
L K
J
L
Votre niveau de consommation d énergie
L J

Appendices - IMPROVE
A-173
Q7.2 Depending on the customers’ socio-demographic and educational background, needs and expectations in
regards to energy billing information may differ. What is the current LIKELIHOOD of your utility to provide
different graphical billing solutions depending on the customer segment that is being addressed (1 = low; 5 =
high)?
MEAN = 2.26
ST.DEV = 1.31
Q.7.3 - Q.7.4 Description of other informative elements:
Description of other informative elements Uploaded material
With a profile analysis every 15 minutes you can offer advice on the effectiveness
of your equipment (heat pump sizing, boiler time ...)
The integration of the comparison (in %) of the energy consumed by the customer
in relation to the preceding year, for the same period, in the form of a summarizing
table at the end of the bill.
Evolution of consumption over similar periods: last 3 years; or same period of last
3 years (for bi-monthly surveys)
In the context of a feed-in remuneration, the display of the detail of the differentiated
consumption: roof / grid
Starting 1.1.2019, the current billing system will be replaced by a new one based
on IS-E/Abacus. In addition, data from the building and housing archive (GWR) will
also be imported.
40%
21%
14%
19%
5%
Very unlikely
2
3
4
Very likely
Segment-oriented graphical solutions?


![Folding and Unfolding Movements in a [2]Pseudorotaxane](https://static.fdokumen.com/doc/165x107/634439d403a48733920acacf/folding-and-unfolding-movements-in-a-2pseudorotaxane.jpg)