A free-field method to calibrate bone conduction transducers
25
K. A. Pollard, P. K. Tran, & T. R. Letowski. 2013. “A free‐field method to calibrate bone conduction transducers.” Journal of the Acoustical Society of America. 133(2): 858‐865. Final version is available at http://link.aip.org/link/?JAS/133/858 . Copyright (2013) Acoustical Society of America. This article may be downloaded for personal use only. Any other use requires prior permission of the author and the Acoustical Society of America. The article appeared in JASA 133(2) and may be found at (http://link.aip.org/link/?JAS/133/858 ). A free-field method to calibrate bone conduction transducers Kimberly A. Pollard; Phuong K. Tran; Tomasz R. Letowski U.S. Army Research Laboratory, 520 Mulberry Point Rd., Aberdeen Proving Ground, Maryland 21005-5425
-
Upload
independent -
Category
Documents
-
view
0 -
download
0
Transcript of A free-field method to calibrate bone conduction transducers

K. A. Pollard, P. K. Tran, & T. R. Letowski. 2013. “A free‐field method to calibrate bone conduction
transducers.” Journal of the Acoustical Society of America. 133(2): 858‐865.
Final version is available at http://link.aip.org/link/?JAS/133/858.
Copyright (2013) Acoustical Society of America. This article may be downloaded for personal use only. Any other use requires prior permission of the author and the Acoustical Society of America. The article appeared in JASA 133(2) and may be found at (http://link.aip.org/link/?JAS/133/858).
A free-field method to calibrate bone conduction transducers
Kimberly A. Pollard; Phuong K. Tran; Tomasz R. Letowski
U.S. Army Research Laboratory, 520 Mulberry Point Rd., Aberdeen Proving Ground, Maryland
21005-5425

2
ABSTRACT
Bone conduction communication systems employ a variety of transducers with different physical
and electroacoustic properties, and these transducers may be worn at various skull locations.
Testing these systems thus requires a reliable means of transducer calibration that can be
implemented across different devices, skull locations, and settings. Unfortunately, existing
calibration standards do not meet these criteria. Audiometric bone conduction standards focus on
only one device model and on limited skull locations. Furthermore, while mechanical couplers may
be used for calibration, the general human validity of their results is suspect. To address the need for
more flexible, human-centered calibration methods, the authors investigated a procedure for bone
transducer calibration, analogous to free-field methods for calibrating air conduction headphones.
Participants listened to1s third-octave noise bands (125-12,500 Hz) alternating between a bone
transducer and a loudspeaker and adjusted the bone transducer to match the perceived loudness of
the loudspeaker at each test frequency. Participants tested two transducer models and two skull
locations. Intra- and inter-subject reliability was high, and the resulting data differed by transducer,
by location, and from the mechanical coupler. The described procedure is flexible to transducer
model and skull location, requires only basic equipment, and directly yields perceptual data.
I. INTRODUCTION
Bone conduction involves the use of skull bone and tissue vibrations to transmit acoustic
information to the listener. As a communication technology, bone conduction offers many

3
advantages over traditional air-conduction audio communication (Gripper et al. 2007, Henry &
Letowski 2007). Bone receivers (also known as bone microphones or contact microphones) can
provide favorable signal-to-noise ratios for persons speaking in environments with high background
noise. Bone transmitters (bone vibrators) can be worn inconspicuously and can deliver signals with
little sound leakage. Bone conduction transducers can also be used without obstructing a listener’s
ears and without interfering with hearing protection devices. These benefits make bone conduction
an attractive means for radio communication, and several laboratories have conducted
investigations using a variety of bone conduction transducer devices placed at various skull
locations (e.g., McBride et al. 2008a, McBride et al. 2008b, Osafo-Yeboah et al. 2009, Stanley &
Walker 2009, Tran & Letowski 2010, McBride et al. 2011).
The diversity of transducers and locations that can be used for bone-conducted speech
communication and other commercial and military applications requires a means to compare and
calibrate bone conduction systems. In communications research, it is essential to be able to
compare and predict the performance of different bone conduction transducers. It is also essential
to compare the performance of these transducers when placed at different skull locations and used
under different operational conditions. In order to meet these goals, a simple and robust calibration
method is needed.
Bone conduction technology is already in wide use in audiology and in commercial hearing
aids, and there are device calibration standards related to these applications (ANSI S3.13-2007, IEC
60318-6:2007, ANSI S3.6-2010). However, the standards are aimed toward clinical use rather than
communication applications (Henry & Letowski 2007, McBride et al. 2008b). The focus of the
standards is on only one bone transducer model (RadioEar B-71) and on only two skull locations
4
(forehead and mastoid process). The limited coverage of devices and skull locations in current
standards presents challenges for communications research and other non-clinical purposes (Walker
& Stanley 2005). In communication and other non-clinical applications, a wide array of different
bone transducer devices may be used, including a range of manufacturers and models. A variety of
different skull locations may also be used. For example, the mandibular condyle has been shown to
be an effective location for bone-conducted speech communication (Gripper et al. 2007, McBride et
al. 2008b, Stanley & Walker 2009), but it is not included in the calibration standards.
A standardized mechanical coupler, such as the B&K 4930 Artificial Mastoid, may be used
as a reference device to test and calibrate bone transducers (ANSI S3.13-2007). Although
mechanical couplers generally yield repeatable results (e.g., Wilber & Goodhill 1967a), they are not
intended to model the response of multiple skull locations (see also Stenfelt & Goode 2005), and the
human validity of their response curves for different transducer models is limited (Richter &
Brinkmann 1976, Henry & Letowski 2007, Weece & Allen 2010, Margolis & Stiepan 2012).
Acoustic calibration methods--capitalizing on air-conducted leakage from transducers– are
promising (Margolis & Stiepan 2012), but these methods do not represent the human perceptual
experience with bone conduction. A more flexible means of transducer calibration is needed to
accommodate a variety of nonstandard configurations that may be used for communication
purposes or other non-clinical functions (Richter & Brinkmann 1976, Henry & Letowski 2007). It is
therefore desirable to develop a reliable and versatile--yet operationally simple--method of
calibrating and comparing bone conduction transducers for communication applications.
Previous studies have described perceptual methods for calibrating bone conduction
transducers for clinical use. The three basic methods include hearing threshold (Roach & Carhart
1956, Hedgecock 1961, Wilber & Goodhill 1967b), phase cancellation (Békésy 1932, Kapteyn et al.
5
1983, Stenfelt 2007), and loudness balance (Carlisle et al. 1947, Barry & Vaughan 1981,
Hedgecock 1961) methods. The most promising of these methods for general use is the loudness
balance method, developed originally by Beranek (1947) for the calibration of air conduction
earphones. In the bone conduction variant of this method (Hedgecock 1961, Barry & Vaughan
1981), a bone transducer is placed on the skull near one ear and an air conduction earphone is
placed at the other ear. This arrangement can be problematic at low frequency ranges due to the
occlusion effect (Franks et al. 2003). Blocking the ear canal with an earphone creates a resonant
chamber that alters the perceived loudness of the bone conducted signal (see also Keidser et al.
2000, Stenfelt et al. 2003, Reinfeldt et al. 2007). This difficulty may to some extent be reduced by
repeatedly removing the air conduction earphone, measuring the occlusion effect separately, or
using tubing or leaky transducers (Barry & Vaughan 1981, Stenfelt 2007). However, the repeated
placement of these devices introduces undesired data variability and imposes time gaps that make
loudness balancing difficult for the listeners (Olsen 1967, Zera et al. 1997). Additionally, in-the-ear
measurements are appropriate only for clinical sites or specialized laboratories, but not for general
application. The occlusion effect is negligible for frequencies at or above 2 kHz, and loudness
balancing of bone vibrators with occluded ears has been performed at 2 kHz as a means of testing
the performance of hearing protective devices (Rimmer & Ellenbecker 1997, McKinley 2009).
Unfortunately, this limited frequency range is not useful for calibrating bone vibrators for
communication purposes.
These various limitations can be alleviated by leaving the ears unoccluded and having
listeners balance the loudness of bone transmitted signals against sound presented in the free field.
Such a technique was first proposed by Richter and Brinkmann (1976), but has not since been
refined and is seldom referenced in the literature. Richter and Brinkmann (1976) used a free-field

6
loudness balance method to calibrate bone conduction transducers for clinical applications and
compared obtained response curves to those generated on a B&K 4930 mechanical coupler. The
B&K 4930 is intended to calibrate transducers with circular contact areas of 1.75 cm2, when applied
with 5.4 N static force (ANSI S3.13-2007, IEC 60318-6:2007). Under these conditions, the B&K
4930 mimics the impedance of the human forehead over a limited frequency range (250-4000 Hz,
Richter & Brinkmann 1976). To best compare loudness balance data with the coupler data, Richter
and Brinkmann (1976) used only bone transducers with the standard contact area of 1.75 cm2, and
placed these on the foreheads of volunteers with 5.4 N static force. These conditions yielded robust
results but are not appropriate for bone conduction communication. People typically find a static
force of 5.4 N highly uncomfortable even after short periods of wear, so a lower static force would
be more realistic for testing bone transducers for communications or other long-wear applications
(see also Toll et al. 2011). Similarly, the forehead is just one location, and generally not the most
practical or efficient location, for bone transducers in communications. Most commercially
available headsets rest the bone transducers against the mandibular condyle or the mastoid process.
Communications headsets also employ transducer models with a range of contact areas, so a
calibration method must be flexible to this variation.
The aim of the current study is thus to investigate the use of a free-field loudness balance
method for calibrating communication and general-use bone vibrators. The current study expands
on the work of Richter and Brinkmann (1976) in order to develop a free-field loudness balance
calibration method that is flexible to transducer type, skull location, and operational conditions and
that provides reliable results in an extended frequency range. The proposed free-field loudness
balance method is conceptually analogous to free-field loudness balance methods for calibrating air-
conduction earphones (see Beranek 1949, pp. 738-739), as mentioned in IEC 60268-7 (International

7
Electrotechnical Commission 2010b). In free-field loudness balance calibration of air-conduction
earphones, human subjects adjust the output of the earphones to perceptually match the loudness of
acoustic stimuli being played in the free field from a loudspeaker (e.g., Bauer & Torick 1966,
Villchur 1969, Morgan & Dirks 1974, Brinkmann & Richter 1989). The standard IEC 60645-2
(International Electrotechnical Commission 2010a) suggests that a similar method could be used for
calibrating bone conduction transducers. The present study aims to describe and test such a method.
II. MATERIALS AND METHODS
A. Devices and Stimuli
1. Bone conduction transducers
Two bone conduction transducers were used in this study: the RadioEar B-71, which is the standard
bone transducer for audiometric work, and the Oiido SD02, which has been used in a variety of
communication studies (Tran et al. 2008; McBride et al. 2010; Tran & Letowski 2010; McBride et
al. 2011). During the experiment, each participant wore one transducer at a time. The transducers
were held in place using an Oiido headset adjusted to the participant’s comfort in the range of 2-2.9
N (200-300 g) static force.
2. Skull locations
Bone conduction involves sound transmission through the bone and soft tissue of the head, so the
placement of bone conduction devices is likely to have strong influence on signal transmission

8
(Snidecor et al. 1959, Acker-Mills et al. 2005, Stenfelt & Goode 2005, Gripper et al. 2007, McBride
et al. 2008a, McBride et al. 2008b, Osafo-Yeboah et al. 2009, Stanley & Walker 2009, McBride et
al. 2011). Two skull locations were investigated in this study: the mastoid process, which is a
common transducer location for hearing aids and clinical applications and is also useful for
communications (McBride et al. 2008a, McBride et al. 2008b, Osafo-Yeboah et al. 2009, McBride
et al. 2011), and the mandibular condyle, which is a commonly-used and effective location for bone
conduction communication (McBride et al. 2008a, McBride et al. 2008b, Osafo-Yeboah et al. 2009,
Stanley & Walker 2009, McBride et al. 2011).
3. Stimuli
Stimuli were 1 s long, one-third-octave wide bands of digitally-generated white noise. The noise
bands were centered around the standard one-third octave frequencies extending from 100 Hz to
12500 Hz (22 test frequencies). These frequencies include standard audiometric test frequencies
plus additional high and low frequencies to test the limits of the bone conduction devices. The
stimuli were set up as two-channel sound files (Microsoft Windows .wav file format, 16-bit depth,
with 44.1 kHz sampling rate), where the signal from one channel was sent to the loudspeaker and
the signal from the other channel was sent to the bone transducer. The noise bands alternated
between channels with no time in between and were played on loop to the participants (Figure 1)
using Adobe Audition 3.0 software.

9
FIG.1. Waveform of a test stimulus. The top channel plays to the bone transducer and the bottom
to the loudspeaker. Both channels contain the same noise sample. In the actual test stimuli sound
files, the loudspeaker channel was attenuated by 45 dB since the loudspeaker requires lower voltage
input than the bone transducers to produce a sound of similar perceived loudness. The loudspeaker
channel attenuation is not shown in this figure.
B. Participants and procedure
Six volunteers (five females and one male) participated in the study. Their ages ranged from 23 to
46 years (mean 32.3, std. dev. 8.1). Air conduction and bone conduction hearing thresholds were

10
obtained for each volunteer using standard hearing testing methods (American Speech-Language-
Hearing Association 2005). All volunteers had air and bone conduction thresholds of 20 dB HL
(Hearing Level) or below in both ears at all test frequencies (ANSI S3.6-2010) and had no reported
otologic problems.
The tests were conducted in an anechoic room meeting free-field conditions above 120 Hz
(no reflections), with a background noise level below 25 dB A-weighted. Each participant was
fitted with one bone transducer at a time, held in place with an Oiido headset adjusted to the
participant’s comfort in the range of 2-2.9 N (200-300 g) static force. This static force range has
been shown to be both effective and comfortable for bone conduction hearing (Toll et al. 2011).
The participant was seated in the center of the anechoic room, facing a concealed loudspeaker. A
headphone amplifier was connected to the bone transducer and placed on the participant’s lap, and a
microphone was available for speaking to the experimenter. All free-field signals were presented at
45 dB SPL (re: 20Pa), measured at the location of the participant’s head with the participant
absent. Both free-field and bone-conduction test signals were played from a battery-powered laptop
computer located outside the test chamber and routed to the loudspeaker and bone transducer inside
the chamber. Stimuli were presented alternating between the loudspeaker and the bone transducer,
and the participant was instructed to adjust the volume on the bone transducer (via the amplifier) to
perceptually match the loudness of the signal from the loudspeaker. The amplifier dial moved
smoothly and allowed a continuous, analog range of responses from the participant. The marks on
the dial were obscured with masking tape to prevent visual assessment of amplifier volume. Once
satisfied with the signal level chosen, the participant would inform the experimenter by speaking
into the microphone. The experimenter then documented the signal level from an audio voltmeter

11
that was located outside the chamber but connected directly to the input of the bone transducer (see
schematic in Figure 2).
After the experimenter documented the participant’s chosen volume, the next stimulus
would then be played, and the procedure would be repeated for each stimulus and each device-
location combination. To obtain data on within-subject repeatability, one participant repeated all
device/location conditions six times and two other participants repeated the B-71/mastoid condition
six times. For all participants, the headset was removed, adjusted, replaced, and readjusted after
each device-location block and each repetition.
The participant’s task in this study differed slightly from that of Richter and Brinkmann’s
study (1976), in which the experimenter adjusted the volume level until participants indicated that a
satisfactory loudness match had been achieved. The current study had the participants adjust the
volume themselves, with the expectation that this would allow finer control, streamline the
procedure, and make the participants feel less pressured to make a rapid response.
C. Mechanical Coupler
The human responses were also compared to frequency response curves generated on the Bruel &
Kjaer Type 4930 mechanical coupler. The frequency response of each transducer on the
mechanical coupler was obtained using standard pure tone signals (for verification purposes) and
using 1/3 octave noise bands (in order to mimic conditions experienced by this study’s human
participants). To mimic the human conditions, each bone transducer was placed on the mechanical
coupler with 2.9 N (300 g) static force, and the same 1/3 octave band noise stimuli were played.

12
The sound source volume was held constant, with 200 mV sent to the transducer during the 1 kHz
noise band. To verify that static force and signal bandwidth did not have any unexpected effects on
the transducers or mechanical coupler, the frequency response of the transducer on the coupler was
checked against curves derived from standard coupler conditions (i.e., using pure tone signals at 100
mV input with a static force of 5.4 N (550 g); ANSI S3.13-2007, IEC 60318-6:2007). One-third
octave noise band curves are expected to be similar to but smoother than pure tone curves, since a
wider bandwidth signal is used. The general shape of the curves was as expected, confirming that
static force and bandwidth did not generate any unexpected effects on the transducer or mechanical
coupler performance.
FIG. 2. Schematic of experimental set-up.

13
III. RESULTS
The output voltages chosen by the participants (in dB re: 1 mV) at each frequency were
compared within subjects, across subjects, and across devices and skull locations. The data
averaged across all participants are shown in Figures 3 and 4.
A. Intra- and inter-individual reliability
To assess reliability, intraclass correlations (two-way random, absolute agreement) were performed
across runs of each subject who did multiple runs, and across the different subjects. Results are
reported as coefficients of reliability, Cronbach’s , which is a measure of internal consistency
(Cronbach 1951).
One subject was run six separate times on each device-location combination. Intra-
individual reliability for this subject was high under each condition. Intraclass correlations
(Cronbach’s , 22 frequencies) were 0.983 for the B-71 on the condyle; 0.974 for the B-71 on the
mastoid; 0.987 for the SD02 on the condyle; and 0.990 for the SD02 on the mastoid. The condition
with the lowest intra-individual reliability (B-71 on the mastoid) was then run six separate times
each on two more subjects. These subjects’ intra-observer reliability (Cronbach’s , 22
frequencies) was also high, with = 0.967 for one subject and = 0.952 for the other.
To compare inter-subject reliability, all runs were averaged first within subjects, and then
intraclass correlations were run across subjects. Intraclass correlations (Cronbach’s , 22
frequencies in each case) were 0.940 for the B-71 on the condyle; 0.907 for the B-71 on the
mastoid; 0.947 for the SD02 on the condyle; and 0.961 for the SD02 on the mastoid.

14
B. Comparison of skull locations
As shown in Figure 3, the condyle location was more sensitive to bone vibration stimulation than
the mastoid. This held for both the RadioEar B-71 bone transducer (Fig. 3a) and for the Oiido
SD02 bone transducer (Fig. 3b), though the difference was more noticeable for the SD02. When
adjusted for the overall difference in sensitivity between condyle and mastoid (i.e., after shifting
curves vertically so they could be placed on top of one another), it is clear that the shape of the
calibration curves is highly similar across skull locations at frequencies above approximately 2000
Hz. This held true for both the B-71 and the SD02.
C. Comparison of bone transducers
When worn on the mastoid, both transducer models were similarly effective in the mid-frequency
range (approximately 630-3000 Hz), with the Oiido SD02 transducer performing better at
frequencies below that range and the RadioEar B-71 performing better at higher frequencies (Fig.
4a). When worn on the condyle, the Oiido SD02 transducer was generally more effective than the
RadioEar B-71, especially at low frequencies (up to 800 Hz), though the B-71 was somewhat more
effective at frequencies above 4000 Hz (Fig. 4b).

15
FIG. 3. Comparison of mandibular condyle (solid line) and mastoid process (dashed line) skull
locations for the B-71 transducer (a) and the SD02 transducer (b). Lines depict the mean response
for 6 subjects at each test frequency, +/- SE. The vertical axis indicates the signal level (dB re: 1
mV) that the human subjects selected to perceptually match the bone conducted sound to 45 dB of
air-conducted sound in the free field.

16
FIG. 4. Comparison of the B-71 (solid line) and SD02 (dashed line) bone transducers on the
mastoid process (a) and mandibular condyle (b). Lines depict the mean response for 6 subjects at
each test frequency, +/- SE. The vertical axis indicates the signal level (dB re: 1 mV) that the
human subjects selected to perceptually match the bone conducted sound to 45 dB of air-conducted
sound in the free field.

17
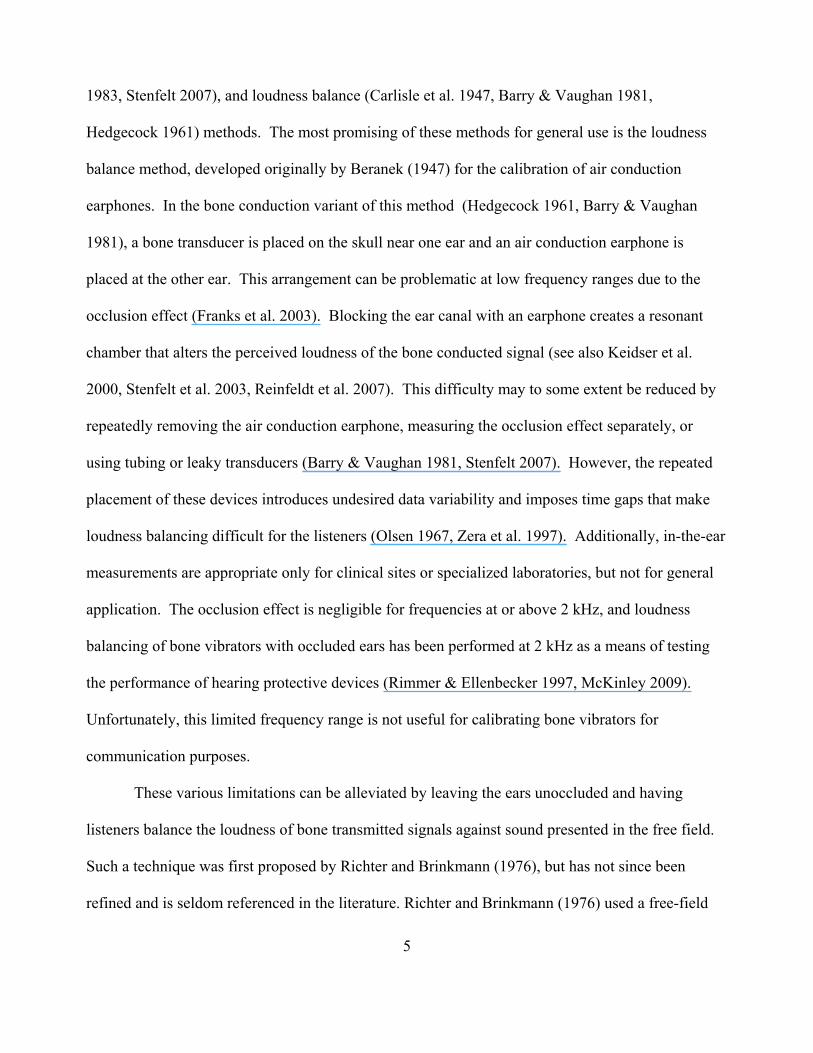
D. Comparison with mechanical coupler
As shown in Figure 5, the mechanical coupler (B&K 4930) output did not align well with the
human perceptual data for any of the transducer/location combinations. High and low sensitivity
regions for the mechanical coupler response did not match with those of the human mastoid or
human condyle. Regardless of skull location or device model, the results of the perceptual
calibrations are closer to each other than any of them are to the mechanical coupler curve.
18
FIG. 5. Comparison of the human mastoid response (dashed black line) to the mechanical coupler
response (solid grey line) and human condyle response (solid black line) for the B-71 transducer (a)
and the SD02 transducer (b). Lines depict the mean response for 6 subjects at each test frequency,
+/- SE. The vertical axis indicates the signal level (dB re: 1 mV) that the human subjects selected to
perceptually match the bone conducted sound at the mastoid to 45 dB of air-conducted sound in the
free field. For ease of comparison, the mechanical coupler curve and human condyle curve have
been overlaid on the human mastoid curve (vertically shifted by the average difference between
each curve and the human mastoid curve).
IV. DISCUSSION
The presented study described a free-field loudness balance method to calibrate bone conduction
transducers. Participants were asked to adjust the volume of a bone transducer to perceptually
match the loudness of 45 dB noise bands presented in the free field from a loudspeaker. The study
tested the method using two bone transducer models (RadioEar B-71 and Oiido SD02) and two
skull locations (mastoid process and mandibular condyle), and compared these data to those
generated on a mechanical coupler, the B&K 4930 Artificial Mastoid. The results indicate that the
proposed loudness balance method is sufficiently accurate and reliable to be used as a calibration
method for bone conduction communication transducers. Furthermore, the obtained results can be
used to select either the device model (for given location) or the skull location (for given device
model) that might be the most suitable for a specific bone conduction communication application.
The relatively smooth frequency responses measured in this study also suggest that the number of

19
test frequencies used for calibration can be reduced without sacrificing the accuracy and validity of
the calibration procedure.
Intra- and inter-subject reliability was high with this calibration method (Cronbach’s > 0.9
in all cases), though repeatability varied somewhat by device model and skull location. Both within
and among subjects, the B-71 mastoid condition yielded the least repeatable data. This may be due
to the slim rounded shape of the mastoid process combined with the smaller surface area of the B-
71 compared to the SD02; it may be more difficult with this configuration to achieve similar levels
of contact both across subjects and across repeated sessions with the same subject.
As expected, reliability across subjects was lower than within subjects (see also Richter &
Brinkmann 1976). However, the difference was relatively small, indicating that although individual
differences may play a role in how listeners experience bone conducted sounds, these differences
may not be practically important for the purposes of device calibration.
Skull location comparisons confirmed that the condyle location is more sensitive than the
mastoid location for bone conduction stimulation, and this was true for both transducer models (Fig.
3). These results are consistent with those of McBride et al. (2008b), who found the condyle to be
more sensitive than the mastoid location for pure tones, and Stanley & Walker (2009), who found
the same relationship for speech sounds. This suggests the condyle may be a preferable location for
use in communication applications (see also McBride et al. 2008a), although another study found no
differences in speech intelligibility between the mastoid and condyle (Osafo-Yeboah et al. 2009).
Upon comparison of transducers, the SD02 model was found to be more effective than the
B-71 at lower frequencies (100-630 Hz). This was the case for either skull location, but especially
for the condyle (Fig. 4). At both skull locations, the B-71 outperformed the SD02 at higher
20
frequencies above 4000 Hz. At both skull locations, the transducer models performed similarly
within the critical speech range of 1000-4000 Hz. This suggests that either model would be suitable
for general-purpose speech communication. Specific applications that rely heavily on low or very
high frequency signals might be better suited for the SD02 or B-71, respectively.
Human response curves for both transducers were also compared to those generated on a
Bruel & Kjaer Type 4930 mechanical coupler. The coupler did not accurately reproduce the human
response to either transducer device at either skull location. It is noteworthy that the B-71’s
frequency response on the B&K 4930 coupler largely agreed with the B-71 B&K 4930 data
reported in other studies (e.g., Dirks et al. 1979). A B&K 4930 or other mechanical coupler is a
helpful device for comparing the vibrational output of different bone transducers, but users should
note that the resulting unprocessed curves do not accurately reflect the human perceptual experience
(see also Richter & Brinkmann 1976, Margolis & Stiepan 2012). In fact, the shapes of perceptual
frequency responses obtained in this study are more similar across different skull locations and
across different transducer models than any of these frequency responses are to the B&K 4930
coupler data. The B&K 4930 coupler output overestimates the bone conduction transducer’s
ability to impart low frequency energy (below 1000 Hz) to the head while underestimating
transmission of high frequency energy (above 3000 Hz) to the head. This discrepancy warrants
further consideration.
A variety of factors likely contribute to the fact that the mechanical coupler response curve
does not match the human perceptual data. First, the coupler is designed to mimic the impedance of
the human skull, but it is not designed to mimic any subsequent auditory filtering that arises in the
cochlea or perceptual processing in the brain. Audiologists account for the perceptual

21
filtering/processing steps by adding transfer factors (ISO 389-3:1994) to the raw coupler output at
standard audiometric frequencies to generate a curve that mimics human bone conduction threshold
levels. The present study, however, was not conducted at threshold sound levels. The present study
instead used a sound level that is more appropriate for communications applications, i.e., a supra-
threshold level. The standard transfer factors would therefore not be appropriate. Equal loudness
curves for bone conduction have not yet been established, but it is well known that equal loudness
curves for air conduction are not parallel. That is to say, a loudness balance study at 45 SPL would
yield a curve that differs in shape from a curve at threshold level. Because equal loudness curves
are not yet available for bone conduction, caution should be exercised when trying to extrapolate
mechanical coupler data to human experience at supra-threshold bone-conducted sound levels.
Future perceptual studies should be conducted at a variety of bone-conducted sound levels to
determine how these curves compare to one another and to determine how well these curves agree
with those produced on mechanical couplers.
V. CONCLUSIONS
This paper described a free-field perceptual loudness calibration method for use with bone
conduction transducers. The method was developed to address the needs of bone conduction
calibration for communications applications, though it is flexible enough to be used for other
applications as well. Intra- and inter-subject reliability was high, and data revealed sensitivity
differences between the condyle and mastoid and between two different transducer models. The
curves generated by the human subjects were, unsurprisingly, not well-represented by a standard
mechanical coupler – a device designed to mimic skull impedance for a single transducer model at a

22
single skull location. Human-generated curves are direct perceptual data and thus may give a more
accurate representation of the human experience of bone conduction signals, especially for signals
at supra-threshold levels, such as typical signals from bone conduction communication devices.
The free-field calibration method described in this paper appears both effective and simple
to implement for calibration of communication bone conduction transducers. The method uses
commonly available equipment, and the listener’s task is straightforward. The method is flexible
and can allow comparison among multiple skull locations and various bone transducer devices.
Furthermore, the method yields data that directly represent the human perceptual experience. This
practical and intuitive calibration method provides a means of comparing the effectiveness of
different devices and locations and should facilitate the transfer of knowledge across different
studies, researchers, and labs investigating bone conduction communication.
Future research could examine different playback levels and include other skull locations
and bone conduction devices, perhaps with the aim of developing a body of human-focused data
relevant to the use of bone conduction in communications. A better understanding of how different
locations and devices compare is important for future development of optimized transducers for
specific applications, headsets, and head locations. Future studies could also focus on individual
differences in order to identify physiological features that need to be taken into consideration for
efficient bone conduction communication.

23
ACKNOWLEDGMENTS
The authors would like to thank all our subjects for participating in this research. We also thank
Paula Henry and Ashley Foots of ARL for advice and for performing hearing tests on our
participants, Walter Piroth of Sensory Devices for advice and assistance during the study, and Diana
Emanuel of Towson University for allowing us to use their mechanical coupler. This research was
conducted under an Oak Ridge Associated Universities postdoctoral fellowship to KAP.
REFERENCES
Acker-Mills, B. E., Houtsma, A. J. M. & Ahroon, W. A. 2005. Speech intelligibility with acoustic and contact microphones. In: New Directions for Improving Audio Effectiveness. Meeting Proceedings RTO-MP-HFM-123. Neuilly-sur-Seine, France, RTO, pp. 1-14.
American National Standards Institute. 2007. American National Standard: Mechanical coupler for measurement of bone vibrators. New York: American National Standards Institute, Inc., ANSI S3.13-1987 (R2007).
American National Standards Institute. 2010. American National Standard: Specification for audiometers. New York: American National Standards Institute, Inc., ANSI S3.6-2010.
American Speech-Language-Hearing Association. 2005. Guidelines for manual pure-tone threshold audiometry [Guidelines]. Available from www.asha.org/policy. Last accessed March 2, 2011.
Barry, S. J. & Vaughan, R. B. 1981. Loudness balance calibration of bone conduction vibrators. J. Speech Hear. Res., 24, 454-459.
Bauer, B. B. & Torick, E. L. 1966. Calibration and analysis of underwater earphones by loudness-balance method. J. Acoust. Soc. Am., 39, 35-39.
Békésy, G. V. 1932. Zur Theorie des Hörens bei der Schallaufnahme durch Knochenleitung (Hearing theory of acoustic perception by bone conduction). Annalen der Physik, 13, 111-136.
Beranek, L. L. 1947. Design of speech communication systems. Proc. Inst. Radio Engineers, 45, 880-890.
Beranek, L. L. 1949. Acoustic Measurements. London: John Wiley & Sons Inc., pp. 738-739. Brinkmann, K. & Richter, U. 1989. Free-field sensitivity level of audiometric earphones to be
used for speech audiometer calibration. Scand. Audiol., 18, 75-81. Carlisle, R. W., Pearson, H. A. & Werner, P. R. 1947. Construction and calibration of an
improved bone-conduction receiver for audiometry. J. Acoust. Soc. Am., 19, 632-638. Cronbach, L. J. 1951. Coefficient alpha and the internal structure of tests. Psychometrika, 16, 297-
334. Dirks, D. D., Lybarger, S. F., Olsen, W. O. & Billings, B. L. 1979. Bone conduction calibration:
current status. J. Speech Hear. Disord., 44, 143-155.

24
Franks, J. R., Murphy, W. J., Harris, D. A., Johnson, J. L. & Shaw, P. B. 2003. Alternative field methods for measuring hearing protector performance. Am. Ind. Hyg. Assoc. J., 64, 501-509.
Gripper, M., McBride, M., Osafo-Yeboah, B. & Jiang, X. 2007. Using the Callsign Acquisition Test (CAT) to compare the speech intelligibility of air versus bone conduction. Int. J. Ind. Ergonomics, 37, 631-641.
Hedgecock, L. D. 1961. Clinical calibration of bone-conduction measurements. Arch. Otolaryngol., 73, 186-195.
Henry, P. & Letowski, T. 2007. Bone conduction: Anatomy, physiology, and communication. Army Research Laboratory: Aberdeen Proving Ground, MD. pp. 1-192.
International Electrotechnical Commission. 2007. Electroacoustics – Simulators of human head and ear – Part 6: Mechanical coupler for the measurements on bone vibrators. Geneva (Switzerland): International Electrotechnical Commission, IEC, IEC 60318-6:2007.
International Electrotechnical Commission. 2010a. Audiometric equipment - Part 2: Equipment for speech audiometry. International Electrotechnical Commission, IEC, IEC 60645-2 29/74/CD.
International Electrotechnical Commission. 2010b. Sound system equipment - Part 7: headphones and earphones. International Electrotechnical Commission, IEC, IEC 60268-7:2010.
International Standards Organization. 1994. Acoustics--Reference zero for the calibration of audiometric equipment--Part 3: Reference equivalent threshold force levels for pure tones and bone vibrators. Geneva: ISO, ISO 389-3:1994.
Kapteyn, T. S., Boezeman, E. H. J. F. & Snel, A. M. 1983. Bone-conduction measurement and calibration using the cancellation method. J. Acoust. Soc. Am., 74, 1297-1299.
Keidser, G., Katsch, R., Dillon, H. & Grant, F. 2000. Relative loudness perception of low and high frequency sounds in the open and occluded ear. J. Acoust. Soc. Am., 107, 3351-3357.
Margolis, R. H. & Stiepan, S. M. 2012. Acoustic method for calibration of audiometric bone vibrators. J. Acoust. Soc. Am., 131, 1221-1225.
McBride, M., Hodges, M. & French, J. 2008a. Speech intelligibility differences of male and female vocal signals transmitted through bone conduction in background noise: Implications for voice communication headset design. Int. J. Ind. Ergonomics, 38, 1038-1044.
McBride, M., Letowski, T. & Tran, P. 2008b. Bone conduction reception: Head sensitivity mapping. Ergonomics, 51, 702-718.
McBride, M., Patrick, R., Letowski, T. & Tran, P. 2010. Bone conduction intelligibility: Headset comparison study. Proc. Ind. Eng. Res. Conf. (IERC). Norcross, GA: IIE Management Press,, CD ROM.
McBride, M., Tran, P., Letowski, T. & Patrick, R. 2011. The effect of bone conduction microphone locations on speech intelligibility and sound quality. Appl. Ergonomics, 42, 495-502. McKinley, R. L. 2009. Bone conducted noise and mitigation techniques. AFRL-RH-WP-TR-2009-
0061. Wright-Patterson Air Force Base, OH: Air Force Research Laboratory. pp. 1-14 Morgan, D. E. & Dirks, D. D. 1974. Loudness discomfort level under earphone and in the free
field: the effects of calibration methods. J. Acoust. Soc. Am., 56, 172-178. Olsen, W. O. 1967. Artificial mastoid calibration of bone vibrators. Arch. Otolaryngol., 85, 314-
318.

25
Osafo-Yeboah, B., Jiang, X., McBride, M., Mountjoy, D. & Park, E. 2009. Using the Callsign Acquisition Test (CAT) to investigate the impact of background noise, gender, and bone vibrator location on the intelligibility of bone-conducted speech. Int. J. Ind. Ergonomics, 39, 246-254.
Reinfeldt, S., Stenfelt, S., Good, T. & Hakansson, B. 2007. Examination of bone-conducted transmission from sound field excitation measured by thresholds, ear-canal sound pressure, and skull vibrations. J. Acoust. Soc. Am., 121, 1576-1587.
Richter, U. & Brinkmann, K. 1976. The sensitivity level of bone-conduction receivers. J. Audiol. Technique, 15, 2-15.
Rimmer, T. W. & Ellenbecker, M. J. 1997. Hearing protection attenuation measurement by bone conduction loudness balance compared with real-ear attenuation at threshold in a sound field. Appl. Occup. Environ. Hyg., 12, 69-75.
Roach, R. E. & Carhart, R. 1956. A clinical method for calibrating the bone-conduction audiometer. Arch. Otolaryngol., 63, 270-278.
Snidecor, J. C., Rehman, I. & Washburn, D. D. 1959. Speech pickup by contact microphone at head and neck positions. J. Speech Hear. Res., 2, 277-281.
Stanley, R. M. & Walker, B. N. 2009. Intelligibility of bone-conducted speech at different locations compared to air-conducted speech. Proc. Hum. Fact. Ergon. Soc. (HFES2009), 53, 1086-1090.
Stenfelt, S. 2007. Simultaneous cancellation of air and bone conduction tones at two frequencies: Extension of the famous experiment by von Békésy. Hearing Sci., 225, 105-116.
Stenfelt, S. & Goode, R. L. 2005. Transmission properties of bone conducted sound: Measurements in cadaver heads. J. Acoust. Soc. Am., 118, 2373-2391.
Stenfelt, S., Wild, T., Hato, N. & Goode, R. L. 2003. Factors contributing to bone conduction: The outer ear. J. Acoust. Soc. Am., 113, 902-913.
Toll, L. E., Emanuel, D. C. & Letowski, T. 2011. Effect of static force on bone conduction hearing thresholds and comfort. Int. J. Audiol., 50, 632-635.
Tran, P. & Letowski, T. 2010. Speech intelligibility of air conducted and bone conducted speech over radio transmission. J. Acoust. Soc. Am., 127, 1896-1896.
Tran, P., Letowski, T. & McBride, M. 2008. Bone conduction microphone: Head sensitivity mapping for speech intelligibility and sound quality. Int. Conf. Audio, Language and Image Processing (ICALIP 2008), Shanghai, China. pp. 107-111.
Villchur, E. 1969. Free-field calibration of earphones. J. Acoust. Soc. Am., 46, 1527-1534. Walker, B. N. & Stanley, R. M. 2005. Thresholds of audibility for bone-conduction headsets.
Proc. Int. Conf. Auditory Display (ICAD2005). Limerick, Ireland. pp. 218-222. Weece, R. & Allen, J. 2010. A method for calibration of bone driver transducers to measure the
mastoid impedance. Hearing Res., 263, 216-223. Wilber, L. A. & Goodhill, V. 1967a. Electronic calibration of bone-conduction receivers. Arch.
Otolaryngol., 86, 431-434. Wilber, L. A. & Goodhill, V. 1967b. Real ear versus artificial mastoid methods of calibration of
bone-conduction vibrators. J. Speech Hear. Res., 10, 405-416. Zera, J., Brammer, A. J. & Pan, G. J. 1997. Comparison between subjective and objective
measures of active hearing protector and communication headset attenuation. J. Acoust. Soc. Am., 101, 3486-3497.