
mechanisms of charge conduction and
129
MECHANISMS OF CHARGE CONDUCTION AND BREAKDOWN IN LIQUID DIELECTRICS by MICHAEL DAVID BUTCHER, B.S., M.S. A DISSERTATION IN ELECTRICAL ENGINEERING Submitted to the Graduate Faculty of Texas Tech University in Partial Fulfillment of the Requirements for the Degree of DOCTOR OF PHILOSOPHY Approved Andreas Neuber Chairperson of the Committee James Dickens Hermann Krompholz Lynn Hatfield Accepted John Borrelli Dean of the Graduate School May, 2005
-
Upload
khangminh22 -
Category
Documents
-
view
0 -
download
0
Transcript of mechanisms of charge conduction and

MECHANISMS OF CHARGE CONDUCTION AND
BREAKDOWN IN LIQUID DIELECTRICS
by
MICHAEL DAVID BUTCHER, B.S., M.S.
A DISSERTATION
IN
ELECTRICAL ENGINEERING
Submitted to the Graduate Faculty of Texas Tech University in
Partial Fulfillment of the Requirements for
the Degree of
DOCTOR OF PHILOSOPHY
Approved
Andreas Neuber Chairperson of the Committee
James Dickens
Hermann Krompholz
Lynn Hatfield
Accepted
John Borrelli Dean of the Graduate School
May, 2005

© 2005
MICHAEL BUTCHER All Rights Reserved

ACKNOWLEDGEMENTS
I would like to thank my committee for their continuous support and guidance
throughout this project. Special thanks go to Dr. Neuber for his guidance, support and
suggestions which kept me on track and for serving as the chairman of my committee. I
also need to thank Dr. Krompholz for the very helpful reviews of my publications and
theoretical insight. I would like to thank Dr. Dickens for his advice and for convincing
me that I should return to Tech for my doctoral work and Dr. Hatfield for numerous
invaluable discussions. I would also like to thank the Compact Pulsed Power MURI
Program funded by the Director of Defense Research & Engineering (DDR&E) and
managed by the Air Force Office of Scientific Research (AFOSR) for funding this
project.
I wish to express my utmost gratitude to my wife, Jessica, for her encouragement,
companionship, and sacrifices so that we could achieve our goal together. I never would
have made it this far without her constant love and support.
I am grateful for the support from everyone in the Pulsed Power and Power
Electronics Lab at Texas Tech. I would like to thank Mic, Danny, Dino, Marie, and John
Walter and all the others for their assistance over the years. Special thanks go to John
Krile for sharing an office and keeping the fun level in the lab on high. Special thanks
must go to my parents for always believing in me, and their support throughout my
educational experience.
ii

TABLE OF CONTENTS
ACKNOWLEDGEMENTS................................................................................................ ii
ABSTRACT...................................................................................................................... vii
LIST OF TABLES............................................................................................................. ix
LIST OF FIGURES ............................................................................................................ x
CHAPTER I. INTRODUCTION.................................................................................................. 1
II. BACKGROUND AND THEORY ......................................................................... 6
2.1 BRIEF REVIEW.................................................................................................... 6
2.1.1 Polarity Effects.................................................................................. 7
2.2 THEORIES OF LIQUID BREAKDOWN ................................................................... 8
2.2.1 Bubble Theory .................................................................................. 9
2.2.2 Suspended Particle Theory ............................................................. 11
2.2.3 Electronic Breakdown Theory ........................................................ 12
III. EXPERIMENTAL SETUP................................................................................... 14
3.1 LIQUID NITROGEN/COOLED OIL CHAMBER..................................................... 14
3.2 OIL FILTRATION SYSTEM ................................................................................ 17
3.3 OIL COOLING SYSTEM..................................................................................... 19
3.4 OPTICAL CHAMBER......................................................................................... 20
3.5 PRESSURE SENSORS......................................................................................... 21
3.6 TEMPERATURE MEASUREMENTS ..................................................................... 22
3.7 ELECTROMETER .............................................................................................. 22
iii

3.8 DATA COLLECTION: CONDUCTION CURRENTS ................................................ 26
3.9 CURRENT SENSOR ........................................................................................... 27
3.10 CAPACITIVE VOLTAGE DIVIDER.................................................................... 28
3.11 PHOTOMULTIPLIER TUBE............................................................................... 30
3.12 DATA COLLECTION: PRE-BREAKDOWN CURRENTS ........................................ 31
3.13 SHADOWGRAPHY........................................................................................... 32
3.14 SPECTROSCOPY ............................................................................................. 33
IV. LIQUID NITROGEN ........................................................................................... 35
4.1 PRE-BREAKDOWN CURRENT AND LUMINOSITY .............................................. 35
4.1.1 Current Pulses and Luminosity........................................................ 36
4.1.2 Energy Injection............................................................................... 38
4.2 EMISSION SPECTRA ......................................................................................... 40
4.2.1 Emission Spectra.............................................................................. 41
4.2.2 Band Structures................................................................................ 44
4.3 CONDUCTION CURRENT .................................................................................. 45
V. UNIVOLT 61 TRANSFORMER OIL.................................................................. 47
5.1 PROPOSED MODEL ........................................................................................... 47
5.1.1 Stages of Conduction ....................................................................... 48
5.1.2 Stages of Breakdown ....................................................................... 49
5.2 ELECTRODE GEOMETRY AND MATERIALS ....................................................... 50
5.2.1 Stage 3.............................................................................................. 51
5.2.2 Stage 1.............................................................................................. 55
5.2.3 Stage 2.............................................................................................. 56
5.2.4 Model of Conduction Current......................................................... 60
iv

5.3 TEMPERATURE AND PRESSURE EFFECTS ......................................................... 62
5.3.1 Pressure Effects................................................................................ 62
5.3.2 Temperature Effects......................................................................... 64
5.4 BREAKDOWN MECHANISM.............................................................................. 68
5.4.1 Cathode Initiated............................................................................. 68
5.4.2 Anode Initiated................................................................................. 74
5.5 PRE-BREAKDOWN CURRENT AND LUMINOSITY .............................................. 75
5.5.1 Current Pulses and Luminosity........................................................ 75
5.5.2 Bubble Formation and Energy Injection.......................................... 77
5.5.3 Electrostriction................................................................................. 79
5.5.4 Current Characteristics..................................................................... 80
VI. SIMILARITIES BETWEEN UNIVOLT 61 AND LIQUID NITROGEN .......... 84
6.1 CONDUCTION MECHANISMS............................................................................ 84
6.1.1 Liquid Nitrogen................................................................................ 84
6.1.2 Univolt 61 ........................................................................................ 85
6.2 PRE-BREAKDOWN CURRENT AND BREAKDOWN .............................................. 86
6.2.1 Cathode Initation.............................................................................. 87
6.2.2 Shadowgraphy.................................................................................. 88
6.2.3 Liquid Nitrogen/Oil Duality ............................................................ 91
VII. CONCLUSIONS................................................................................................... 94
7.1 CONDUCTION ................................................................................................... 94
7.2 BREAKDOWN.................................................................................................... 96
REFERENCES ................................................................................................................. 98
v

APPENDIX A. ELECTROMETER PROTECTION CIRCUIT................................................... 103
B. DATA ANALYSIS SCRIPT FILES FOR USE WITH PLOTIT©...................... 108
C. CONSTRUCTION OF OIL FILTRATION SYSTEM........................................ 111
D. DATA TABLES FOR LN2 AND UNIVOLT 61................................................. 114
vi

ABSTRACT
With a fast coaxial test setup using high speed electrical and optical diagnostics,
pre-breakdown current pulses and shadowgraphy images are measured of DC breakdown
in Univolt 61 transformer oil as well as luminosity in liquid nitrogen. DC leakage
currents are measured using a high sensitivity electrometer. The conduction and
breakdown mechanisms as a function of applied hydrostatic pressures and temperatures
are quantified. Together this information provides data on the development of current
flow in the system. Three stages in the conduction process prior to breakdown have been
identified for highly non-uniform fields in transformer oil. Stage 1 is characterized by a
resistive current at low fields. Increasing the applied electric field alters the effective
barrier at the metal/dielectric interface allowing a “tunneling” mechanism to begin, which
causes an increasing rise in the injection current observed in stage 2 for increasing fields.
In stage 3, at high fields the current reaches space charge saturation with an apparent
mobility of 3*10-3 cm2/V*s prior to breakdown. A descriptive model of conduction in
liquid dielectrics is presented.
The processes of final breakdown show distinct polarity dependence for both
transformer oil and liquid nitrogen. In transformer oil, a strong pressure dependence of
the breakdown voltage is recorded for negative needle/plane breakdown; a 50% reduction
in breakdown voltage is observed when the hydrostatic pressure is lowered from
atmospheric pressure to hundreds of mtorr. Positive needle discharges show a reduction
of only about 10% in breakdown voltage for the reduced pressure case. Weak pressure
vii

dependence indicates the breakdown mechanism does not have a strong gaseous
component. Similar results due to changing hydrostatic pressure have been observed in
liquid nitrogen.
Images of bubbles/low density regions forming at the current injection point
indicate breakdown is gaseous in nature. Electron avalanches in the low density region
of the vapor bubble form a thick, “bushy” channel. Shadowgraphy images of positive
needle breakdown show no localized “bubbles” and correlate to a weak dependence on
pressure. A thin filamentary “streamer-like” appearance characterizes positive
breakdown. Comparisons of transformer oil and liquid nitrogen show some similarities
in the temporal development of final breakdown but not in all stages of conduction
leading to breakdown. Possible links between conduction current and DC breakdown are
discussed.
viii

LIST OF TABLES
3.1 Table of traveling wave current sensor parameters and characteristics.................28
3.2 Capacitive divider sensitivities. .............................................................................29
5-1 Barrier calculations for various geometries and materials....................................59
5-2 Field enhancement and gap resistance for simulating current. ..............................62
5-3 Barrier calculation for varying pressure and temperature point/plane geometry. ...............................................................................................................67
A.1 Table of components and values used in protection circuit. ................................103
D.1 Physical and Electrical properties of LN2 and Univolt 61 transformer oil. ........................................................................................................................114
ix

LIST OF FIGURES
2.1 Illustration of crack development at the cathode surface. (a) pre-breakdown conditions. (b) “crack” develops at the surface of the cathode. (c) jet of electrons from the cathode surface act as an extension of the cathode and severely distort the local field. (d) an array of secondary cracks develop in the radial field. [22]....................................10
3.1 Sketch of conduction test chamber for transformer oil at reduced pressure and temperature. ......................................................................................15
3.2 Sketch of geometries used in liquid breakdown studies. (a) needle/plane, (b) pin/plane, (c) plane/plane...........................................................16
3.3 Sketch of oil filtration and degassing system showing the pump, flow selector valve, isolation valves and plumbing connections. ..................................19
3.4 Biased diode protection circuit for the Keithley 6514 electrometer. Gas discharge tubes not shown. ....................................................................................23
3.5 Low pass filter protection circuit for the Keithley 6514 electrometer. Gas discharge tubes not shown. .............................................................................24
3.6 Sketch of a traveling wave current sensor. ............................................................27
3.7 Sketch of coaxial capacitive voltage divider. C1 capacitance between inner conductor and foil. C2 capacitance between foil and outer conductor................................................................................................................29
3.8 Sketch of fiber optic and cylindrical lens used in the needle/plane test gap. Cylindrical lenses 1 mm diameter, 5 mm long, 5 mm between each lens. Gap = 7 mm..........................................................................................31
3.9 Shadowgraphy configuration for transformer oil. .................................................33
4.1 Sketch of cylindrical lens configuration and point/plane geometry for optical diagnostics in liquid nitrogen. Gap = 7mm...............................................36
4.2 Graph of pre-breakdown current pulses and luminosity in LN2. Negative tip. Point/plane geometry. Current = top trace. Luminosity = lower trace. Decaying current signals are cable reflections. .............................37
x

4.3 Graph of pre-breakdown current and luminosity pulses 0.460 µs before breakdown. Luminosity pulses are normalized to the PMT at the tip. Negative tip. 0.1A peak, 5ns FWHM. Fast pulse. .................................................39
4.4 Graph of pre-breakdown current and luminosity pulses 0.200 µs before breakdown. Luminosity pulses are normalized to the PMT at the tip. Positive tip. 0.030 A peak, 13 ns FWHM. Slow pulse. ........................................39
4.5 Graph of gate location during main breakdown for point/plane geometry in liquid nitrogen. Gate = 70 ns. ...........................................................41
4.6 Emission spectra of liquid nitrogen during a typical self-breakdown. Bottom is the needle shaft. Middle is the needle tip. Top is the middle of the channel near the plane. Bandhead for N2 at 275 nm [18]. ..........................42
4.7 Emission spectra of gaseous atmospheric N2 for self-breakdown. Bottom is an electrode tip. Middle is the center of the channel. Top is an electrode tip. Gap = 10mm. Hemi-spherical electrode, 150 lines/mm grating, 10µm slit. [40] ..........................................................................43
5.1 Graph of Fowler-Nordheim plot for positive and negative polarity. Open symbols: negative. Closed symbols: positive. Gap = 10 mm, Point/plane. Stage I resistive. Stage II tunneling. Stage III space charge saturation. ...................................................................................................50
5.2 Graph of current vs. square of the applied voltage for point/plane geometry. Test gap 10 mm....................................................................................52
5.3 Sketch of fluid motion for (a) point/plane and (b) plane/plane configurations. (a) space charge builds up around the needle due to high velocity of the liquid and small surface area of the electrodes. (b) fluid flow drives the ions into the electrode...........................................................54
5.4 Fowler-Nordheim plot of uniform field case for 2 successive tests. Plane/Plane geometry. Gap = 1.55 mm. ...............................................................55
5.5 Sketch of the potential barrier at the metal-insulator-liquid interface [21]. Insulating region = oxide layer on the metal surface. A = barrier at metal/insulator interface. B = defect/impurity electron traps. C = insulator/liquid interface barrier. D = conduction band of liquid. .................57
5.6 Simulation of resistive and tunneling model of conduction current, solid line: experiment, dotted line: calculated. Stage I resistive. Stage II tunneling. Stage III space charge saturation......................................................61
xi
5.7 Graph of IV characteristics for varying hydrostatic pressure. Point/plane geometry. Negative polarity. ..............................................................63
5.8 Graph of IV characteristics for varying hydrostatic pressure. Point/plane geometry. Positive polarity.................................................................63
5.9 I-V curves for varying temperature. Negative polarity. Point/plane geometry. Gap = 10 mm. .......................................................................................65
5.10 I-V curves for varying temperature. Positive polarity. Point/plane geometry. Gap = 10 mm. .......................................................................................65
5.11 Fowler-Nordheim plot of maximum and minimum temperature curves for the point/plane geometry. Negative polarity. ..................................................66
5.12 Fowler-Nordheim plot of maximum and minimum temperature curves for the point/plane geometry. Positive polarity.....................................................66
5.13 Breakdown vs. pressure curves for positive and negative polarity. Point/plane geometry. Gap=2.5mm. Open symbols = pos. Closed symbols = neg. .......................................................................................................69
5.14 Shadowgraph images of bubble expansion for negative polarity test gap. (a) 300 torr, (b) 30 torr, (c) 0.01 torr. Gap = 2.5mm. Exposure time 70 ns...............................................................................................................70
5.15 Graph of bubble lifetime (µs) vs. applied pressure (torr) for a fixed bubble radius. Solid line = 10 µm radius. Dashed line = 500 µm radius. Region between curves is typical experimental range of bubble dimensions. ............................................................................................................72
5.16 Graph of bubble lifetime (µs) vs. bubble radius (µm) for a fixed hydrostatic pressure. Solid line = 0.01 torr. Dashed line = 680 torr. Region between curves is the range of experimental area. ....................................73
5.17 Shadowgraphy image of cathode initiated breakdown with self-luminosity due electron impact ionization. Pressure = 0.01 torr. Visible shock wave from arc..................................................................................73
5.18 Shadowgraphy image of positive pre-breakdown at reduced hydrostatic pressure. Pressure = 0.01 torr,............................................................75
5.19 Current and luminosity data for Univolt 61 transformer oil. Decaying current pulses are cable reflections. Luminosity and current spikes show direct correlation. Positive point/plane. Gap = 10 mm................................76
xii
5.20 Graphs of electrostrictive pressure for Univolt 61 transformer oil........................80
5.21 Graphs of typical current waveforms for positive breakdown. Point/plane. Gap = 2.5 mm. Slow rate of current injection. 0.01 A, 1.5 µs ramp...................................................................................................................81
5.22 Graphs of typical current waveforms for negative breakdown. Point/plane. Gap = 2.5 mm. Fast rise of injection current. 1.0 A peak, 2-4 ns FWHM. .......................................................................................................81
6.1 Images of negative and positive breakdown characteristics in liquid nitrogen. (a) negative “bush-like” streamer, 0.5 MPa. (b) positive filamentary streamer, 0.5 MPa. [38] ......................................................................89
6.2 Images of negative and positive breakdown characteristics in transformer oil at 30 torr. (a) and (b) small negative current spike after current rise. (c) large negative current spike after current rise. (d) large negative current spike before current rise with a self-luminous breakdown. Positive needle. ..................................................................................90
6.3 Graph of breakdown voltage versus applied hydrostatic pressure. Closed symbols = positive polarity. Open symbols = negative polarity. = gas added. = normal test. ............................................................92
A.1 Image of actual protection circuits used for conduction tests. Gas discharge tubes are located directly below the diodes. ........................................104
A.2 Graph of conduction current using diode protection circuit near breakdown............................................................................................................105
A.3 Graph of conduction current using diode circuit for voltage less than 1.5 kV...................................................................................................................106
A.4 Graph of conduction current using RC circuit for voltage less than 1.5 kV.........................................................................................................................107
B.1 Script file for time shifting and converting PMT and current sensor voltage signals to appropriate units......................................................................109
B.2 Script file for time shifting and converting capacitive voltage divider and current sensor voltage signals to appropriate units. ......................................110
C.1 Image of circulation pump and filter with primary filter isolation valve and filtered/unfiltered flow selector valve. ................................................111
xiii

C.2 Image of circulation pump and filter with secondary filter isolation valve and filtered or unfiltered flow selector valve. ............................................112
C.3 Image of primary test chamber with 1” reinforced hose going to the magnetic drive pump from the chamber and ½” line going to chamber from the filter. ......................................................................................................113
C.4 Image of primary test chamber with ½” line going to chamber through an isolation valve. The isolation valve reduces the ½” line to ¼” line into the chamber...................................................................................................113
xiv

CHAPTER I
INTRODUCTION
For more than 50 years, studies of the mechanisms involved in the development
of liquid breakdown have lead to a deeper understanding while not achieving a definitive
model explaining the initial breakdown process. The quantity of research in the area of
liquid dielectrics increased dramatically in the last 10 to 15 years with increased interest
in compact pulsed power and switching systems. Insulating fluids such as transformer
oils and liquid nitrogen are critical components in high voltage and pulsed power
systems. The desire for compact pulsed power systems drives research to develop a
model that is capable of describing the basic processes of liquid breakdown, similar to the
promotion of the model for gaseous breakdown almost a century ago.
Improvements over the last decade including increased energy density capacitors
and solid state switch gear, have further fueled interest in liquid dielectrics. Higher
relative permittivity, compared to gases, is an advantage for use in the high energy
density systems. The use of cryogenic liquids, such as liquid nitrogen, as an insulator for
solid state devices, can increase the performance of these devices by operating at low
temperatures, which reduces losses. Also, the ability to conform to complex geometries
while maintaining the self-healing/recovery capabilities typical of gas systems makes
liquids suitable for use as switching medium. Therefore, a thorough understanding of
liquid dielectrics including mechanisms of charge conduction and processes leading to
breakdown is of vital interest to advancing the technology of high voltage and pulsed
1

power systems. A descriptive model of conduction currents leading to dielectric
breakdown will aid the development of more efficient switches and improved insulating
systems.
Liquid breakdown involves a unique level of complexity compared to gas or
solid dielectric breakdown. Physical characteristics, such as fluid viscosity, electro-
convection, temperature, density and pressure dependencies complicate the analysis and
modeling of the conduction and breakdown mechanisms. Most liquids have
characteristics more similar to solids than gases, such as high permittivities, high
densities, and weak molecular order, while maintaining the “flowing quality” of a gas.
Research on conduction in liquid dielectrics, especially transformer oil, began
many years ago because of its importance for applications as an insulator. Others [1-6]
have conducted studies of the effects of age, contamination, and gas content on the
overall quality of the oil, affecting the conduction and breakdown mechanisms.
Characterizing breakdown of liquids is important for optimizing the use of materials.
Identifying the failure modes or critical conditions required for a liquid to fail is
necessary to understand how breakdown will develop and successfully model the
mechanisms involved in liquid breakdown.
The work summarized here has focused on the quantification of the conduction
mechanisms of liquid dielectrics. Three geometries with differing field enhancement
factors and different electrode materials provide a variety of test conditions. Also,
changes to the hydrostatic pressure, liquid temperature, and the particle and gas content
of the liquids provide further insight into the conduction mechanisms. After these tests, 3
2

phases of conduction, primarily depending on the magnitude of the applied electric field
are identified in transformer oil. Phase I is a resistive phase. At low fields, current is
simply the result of charge flow through the bulk liquid. Phase II is a tunneling phase.
At moderate to high fields, tunneling of charge carriers into the liquid occurs. Two
methods of tunneling, Schottky barrier and Fowler-Nordheim tunneling are compared to
the test results. Phase III is a space charge saturation region, occurring when the current
is proportional to the square of the voltage across the gap. Phase III is common in the
point/plane geometry with highly non-uniform electric fields, and where the charge
carriers have the highest apparent mobility. A model and discussion of the three phases
using all the data is presented to quantify and predict the conduction behavior of
transformer oil and liquid nitrogen.
In addition to conduction mechanisms at fields below the breakdown threshold,
electrical breakdown of liquids are discussed in this dissertation. Several models of
liquid breakdown have been proposed over the years, commonalities between many of
them include the presence of an electron avalanche and bubble formation. These
avalanches are observed experimentally as current pulses or partial discharges (PD) and
precede the formation of a gas bubble or low density region as verified using optical
diagnostics. Most of the energy of the partial discharge is used in the vaporization of the
liquid forming a small bubble [7-12]. The main aspect of the bubble model is that a vapor
or low density region forms in front of the needle and leads to a breakdown that develops
in the gas phase.
3
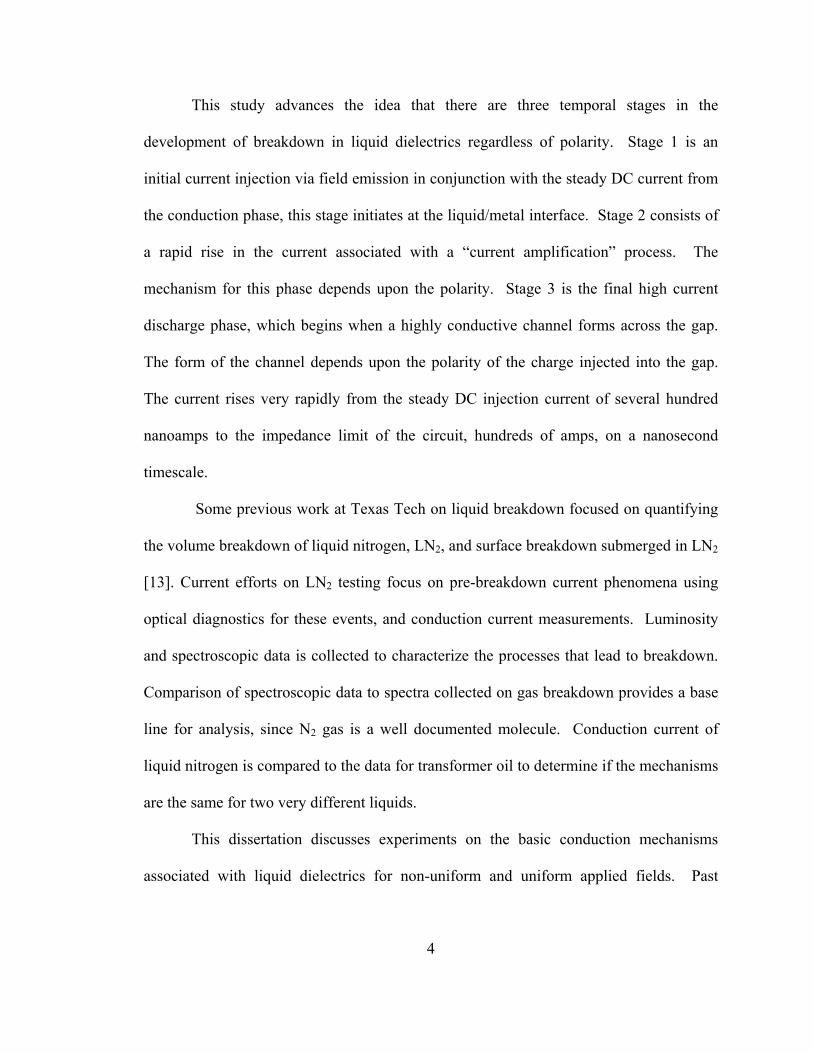
This study advances the idea that there are three temporal stages in the
development of breakdown in liquid dielectrics regardless of polarity. Stage 1 is an
initial current injection via field emission in conjunction with the steady DC current from
the conduction phase, this stage initiates at the liquid/metal interface. Stage 2 consists of
a rapid rise in the current associated with a “current amplification” process. The
mechanism for this phase depends upon the polarity. Stage 3 is the final high current
discharge phase, which begins when a highly conductive channel forms across the gap.
The form of the channel depends upon the polarity of the charge injected into the gap.
The current rises very rapidly from the steady DC injection current of several hundred
nanoamps to the impedance limit of the circuit, hundreds of amps, on a nanosecond
timescale.
Some previous work at Texas Tech on liquid breakdown focused on quantifying
the volume breakdown of liquid nitrogen, LN2, and surface breakdown submerged in LN2
[13]. Current efforts on LN2 testing focus on pre-breakdown current phenomena using
optical diagnostics for these events, and conduction current measurements. Luminosity
and spectroscopic data is collected to characterize the processes that lead to breakdown.
Comparison of spectroscopic data to spectra collected on gas breakdown provides a base
line for analysis, since N2 gas is a well documented molecule. Conduction current of
liquid nitrogen is compared to the data for transformer oil to determine if the mechanisms
are the same for two very different liquids.
This dissertation discusses experiments on the basic conduction mechanisms
associated with liquid dielectrics for non-uniform and uniform applied fields. Past
4
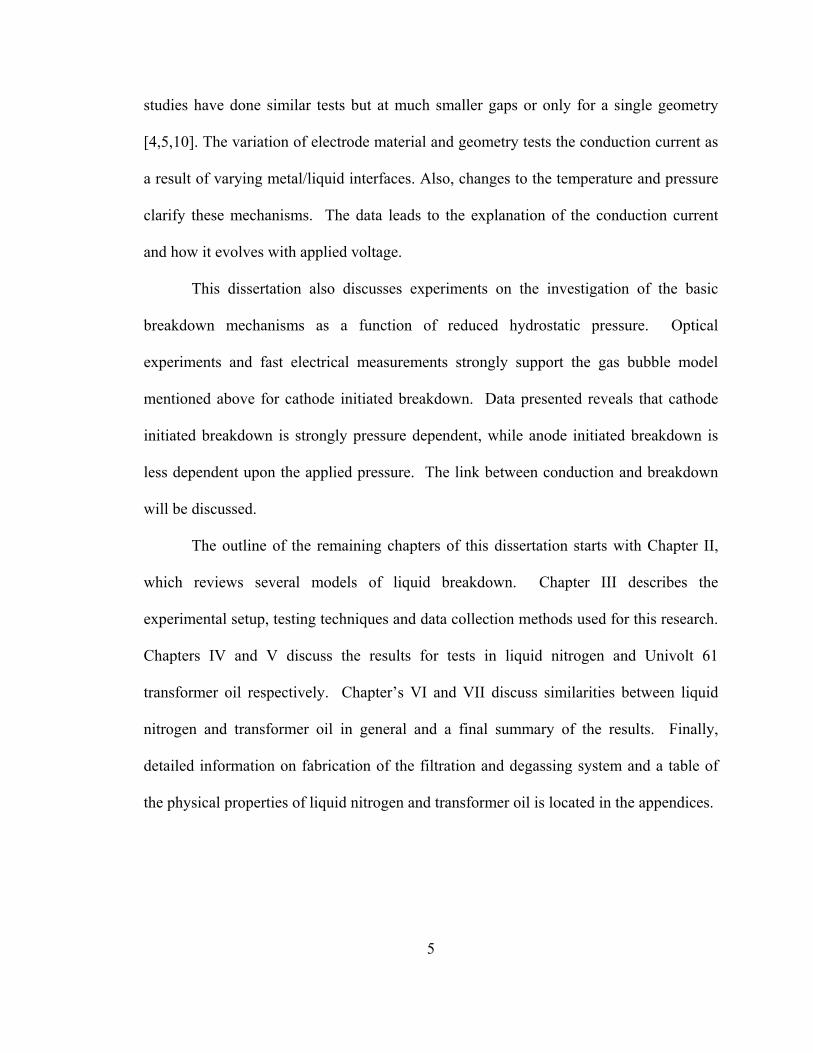
studies have done similar tests but at much smaller gaps or only for a single geometry
[4,5,10]. The variation of electrode material and geometry tests the conduction current as
a result of varying metal/liquid interfaces. Also, changes to the temperature and pressure
clarify these mechanisms. The data leads to the explanation of the conduction current
and how it evolves with applied voltage.
This dissertation also discusses experiments on the investigation of the basic
breakdown mechanisms as a function of reduced hydrostatic pressure. Optical
experiments and fast electrical measurements strongly support the gas bubble model
mentioned above for cathode initiated breakdown. Data presented reveals that cathode
initiated breakdown is strongly pressure dependent, while anode initiated breakdown is
less dependent upon the applied pressure. The link between conduction and breakdown
will be discussed.
The outline of the remaining chapters of this dissertation starts with Chapter II,
which reviews several models of liquid breakdown. Chapter III describes the
experimental setup, testing techniques and data collection methods used for this research.
Chapters IV and V discuss the results for tests in liquid nitrogen and Univolt 61
transformer oil respectively. Chapter’s VI and VII discuss similarities between liquid
nitrogen and transformer oil in general and a final summary of the results. Finally,
detailed information on fabrication of the filtration and degassing system and a table of
the physical properties of liquid nitrogen and transformer oil is located in the appendices.
5
CHAPTER II
BACKGROUND AND THEORY
Over the years, many models have been proposed to explain the mechanisms of
liquid breakdown. It is useful to have a brief review of a few of these proposed models.
Establishment of a clear and effective model is difficult in part due to various
characteristics of liquid dielectrics. Liquids combine some of the best features of both gas
and solid dielectric breakdown. The physical nature of liquids, high density, viscosity,
quality, thermal and electrical properties etc…, compared to gases adds multiple
dimensions to problems associated with developing a comprehensive model. Since
liquids tend to have higher breakdown strengths and permittivities than most gases they
are ideal for compact pulsed power applications where increased energy densities and
decreased physical dimensions are very important. Also, the ability to recover from
breakdown events is a useful trait for use as a switching medium.
2.1 Brief Review
Several models of liquid breakdown have been proposed over the years, each
explaining possible mechanisms, usually for specific cases, but do not explain all
behavior observed or there are more than one method/mechanism to achieve a similar
result. W. G. Chadband focused his research efforts on comparing liquids to amorphous
solids for both positive and negative discharges [14]. The goal was to test various liquids
with increasing viscosity, approaching a solid dielectric. His studies showed that “under
6
certain conditions electrical breakdowns in viscous liquids and plastics show
similarities.” He established a link between solids and liquids by choosing liquids that
were physically similar to solids.
Many models begin with some form of charge injection at the electrode/liquid
interface [15,16] where current injection at an area of high field leads to the formation of
a “bubble” or low density region. Inside the bubble, electron avalanches occur producing
current pulses, if they fail to completely cross the gap, multiple pulses eventually lead to
final breakdown. Current pulses have been observed in many experiments [17, 18]. In
this case, the presence of a low density region such as a “bubble” is a critical component
for the initiation of breakdown.
2.1.1 Polarity Effects
Polarity differences in final breakdown have been observed for years [14, 19].
The general thought is that negative breakdown requires a current amplification such as
an avalanche to develop to final breakdown. Electron amplification via a Townsend
mechanism suggests a gas mechanism for main breakdown. How the formation of a
bubble or low density region in the liquid develops is still not completely understood
since there are several ways to generate a bubble. Explanations include pre-existing
bubbles or dissolved gas, local heating of the liquid due to energy injection, cavitation
caused by fluid motion, and electrical stress on the liquid molecules [20]. When an
electron avalanche forms within a low density region it then leads to further ionization
and current amplification as it crosses the channel, with breakdown as the final result.
7

Characteristics of negative discharges include higher voltages than positive, slow
propagation across the gap, and thick or “bushy” structures for the discharge and multiple
partial discharges at atmosphere.
The mechanism of positive breakdown appears to be very different. It visual
appearance is described as a thin filamentary “streamer-like” structure with a slow
“ramp” of current prior to breakdown in transformer oil. It is proposed to be electronic,
taking place within the liquid phase; however, this would seem to be difficult considering
electron impact ionization is not likely to occur within this region. Therefore, it seems
likely that electrons are not the primary charge carrier. T. Lewis describes a possible
scenario for anode initiated breakdown [21]. A method of hole propagation via tunneling
through the liquid molecules requires high-density regions (non-gaseous), to propagate
efficiently and these conditions exist at the liquid/electrode interface. Image and
electrical data for positive streamers appear to support this idea. Several characteristics
of positive breakdown are lower breakdown voltages than negative discharges, thin
filamentary structures and faster propagation across the gap. This study investigates the
reasons for the breakdown characteristics and further tries to explain these mechanisms.
2.2 Theories of Liquid Breakdown
Liquid breakdown does not consist of a single comprehensive theory for
breakdown that is unanimously accepted for describing dielectric liquid breakdown
phenomena. There are several reasons for lack of a single theory. The complex nature of
liquids makes the theoretical analysis more difficult than with gases. Liquid quality is a
8

critical issue. It is very difficult to create a pure liquid compared to a pure gas. It is
generally accepted that liquid purity plays a very important role in the development of
final breakdown. The predominant theory of liquid breakdown is the bubble theory,
followed by the suspended particle and electronic theories.
2.2.1 Bubble Theory
The bubble theory is based on a combination of gaseous and liquid components
for breakdown. In general it requires the formation of a bubble near the electrode tip.
Then after a bubble is present an electron avalanche or amplification process begins. The
avalanche is triggered either by the injection of more charges into the vapor phase or by
field ionization occurring in the bubble due to the field enhancement caused by a region
of lower permittivity.
Several of the methods of bubble formation such as local heating, cavitation, or
electrical stress may occur simultaneously to one degree or another in liquids. The
mechanism that dominates is controlled by the properties of the fluid at the time of the
test. The primary mechanism discussed is localized energy injection [7-12]. Partial
discharges inject “hot” electrons into the liquid and cause local heating and vaporization.
Hot electrons are electrons with energy in excess of the thermal energy. The vaporization
phase change consumes most of the energy of the pulse.
T.J. Lewis put forth a mechanical model for bubble formation [22]. His model for
the formation of a bubble or low density region comes from the mechanical properties of
9

the fluid. Figure 2.1 illustrates the process of mechanically creating a low density/bubble
region in a liquid dielectric. The mechanical stress placed on liquid molecules by
Figure 2.1 Illustration of crack development at the cathode surface. (a) pre-breakdown conditions. (b) “crack” develops at the surface of the cathode. (c) jet of electrons from the cathode surface act as an extension of the cathode and severely distort the local field. (d) an array of secondary cracks develop in the radial field. [22]
very large electric fields near breakdown, 108 to 109 V/m, enhances the thermal
generation of ruptures or holes throughout the liquid not just at the electrode/liquid
interface. These holes in the liquid will provide weak spots in the molecular structure of
10

the liquid and allow a “crack” in the liquid to form at the cathode surface. The crack is
now a low density or even a vacuum region, occasionally referred to as a vacuole where
electrons can be injected. The vacuole does not require a vaporization of the liquid to
form, it formation is due to mechanical stress instead of energy injection. Vacuoles allow
breakdown to develop in a low density region, the same as a bubble created by another
process. When the electrons are injected into the crack it becomes an extension of the
cathode, similar to a newly formed micro-protrusion. The enhanced field will repeat the
process. The strain on the structure of the liquid opens a “crack” in the liquid by
progressively breaking of the bonds of the liquid like a opening a zipper.
2.2.2 Suspended Particle Theory
The suspended particle theory is based upon impurities in the liquid, usually of
observable size. Since maintaining a pure liquid is extremely difficult especially in
practical situations such as transformer oil, a theory based upon the effect of
contamination would be useful. A suspended particle is anything within the liquid that is
not the test liquid that can carry a charge. The particle must be polarizable or charged, so
that in the presence of an applied field it will drift. Examples include carbonized
materials, electrode pieces, water, or other contaminants. The particle experiences a
force from the applied field and an impeding frictional force due to the viscosity. These
forces control the velocity of the particle. Once it reaches an electrode it acts like an
extension of the electrode and can alter the local field leading to breakdown [23]. For
11

DC breakdown or long pulses it is possible for multiple particles to align and eventually
short the gap leading to breakdown.
2.2.3 Electronic Breakdown Theory
A review of this theory is discussed by Lewis [21]. He discusses the conditions
necessary for cathode and anode initiated processes. In general, it is unlikely for electrons
injected into the liquid to produce significant ionization in the liquid state to develop an
amplification process. Cathode initiation assumes that electrons are injected into the
liquid as a column of electrons emitted from a micro-protrusion on the cathode. The
electrons will collide with molecules locally heating the liquid through collisional
impacts. The heating of the liquid reduces the density allowing future electrons to obtain
more energy from the field before colliding with another molecule. The impacts that
ionize a molecule will leave two slow electrons to drift in the field. The build up of low
energy electrons at the front of the streamer “marks the onset of spherical expansion
under the Coulombic forces of the consequent cloud of negative charge” [21]. The
streamer will expand and appear thick and bushy as it propagates across the gap. The
lower the density of the region the faster an electron amplification will occur. The
obvious extreme of this process is the formation of an avalanche within a bubble.
Anode initiation of breakdown requires a rapid charge development mechanism.
Assuming that holes emitted from the anode via resonance tunneling, or tunneling from
molecule to molecule, requires that the intermolecular distance be as small as possible to
achieve high probabilities for tunneling. High density regions are required to maintain
12
minimal intermolecular spacing. Tunneling establishes a hole propagation pathway
through the liquid. These pathways will trace the path of a hole through the liquid to the
electrode, and should appear as thin filamentary structures in the liquid. The path left by
the propagation of the hole through the liquid will be an ideal return path for a
complementary electron to propagate in the opposite direction. The electrons prefer the
lower density region created by the passing of a hole through the liquid. Energy transfer
via collisions that heat the fluid will be detrimental to hole propagation since the density
of the liquid will be reduced, reducing the tunneling probabilities.
13

CHAPTER III
EXPERIMENTAL SETUP
The purpose of this experiment is to investigate the mechanisms, conditions, and
effects of liquid breakdown in liquid nitrogen and transformer oil. The test setup consists
of a coaxial transmission line that is impedance matched for fast risetimes and minimal
reflections with a test gap on the inner conductor. Two unique chambers are used; the
first is for testing low current, conduction measurements of transformer oil at reduced
temperature or pressure and breakdown measurements for liquid nitrogen. The second is
for fast optical and electrical studies of the breakdown of transformer oil at room
temperature as a function of applied hydrostatic pressure.
3.1 Liquid Nitrogen/Cooled Oil Chamber
The first test chamber consists of a cylindrical stainless steel chamber 20 cm in
diameter and 40 cm in height. The chamber is heavily insulated with approximately
15 cm of thermal insulation, 10 cm of spray insulation and 5 cm of Styrofoam on the
sides. A fast coaxial setup with an impedance of 52 Ω is used for breakdown and
conduction studies. Figure 3.1 is a sketch of the test chamber and the charging system.
Two RG-19 transmission lines connect to feedthroughs on either side of the chamber.
The transmission lines, as connected, can be charged to a maximum of 100 kV per cable
with opposite polarity, for a maximum of 200 kV across the gap. For safety and
14
equipment issues, single sided charging, a requirement for conduction tests, rarely
exceeds 50 kV.
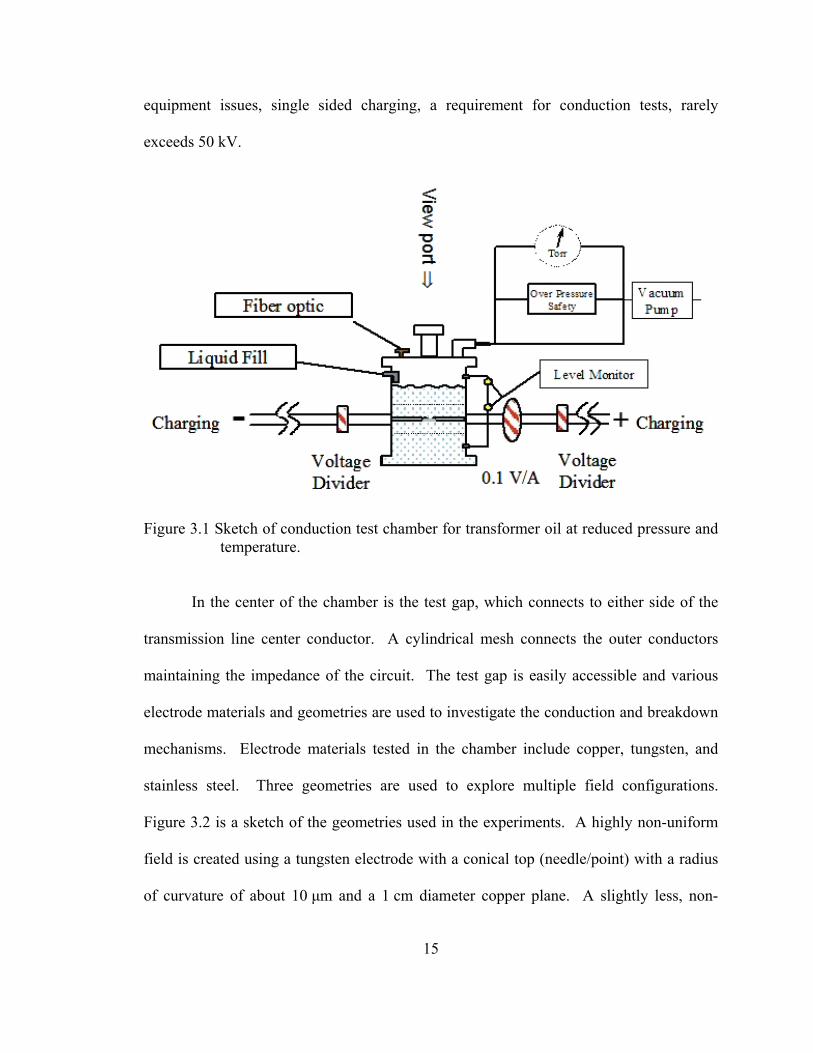
Figure 3.1 Sketch of conduction test chamber for transformer oil at reduced pressure and temperature.
In the center of the chamber is the test gap, which connects to either side of the
transmission line center conductor. A cylindrical mesh connects the outer conductors
maintaining the impedance of the circuit. The test gap is easily accessible and various
electrode materials and geometries are used to investigate the conduction and breakdown
mechanisms. Electrode materials tested in the chamber include copper, tungsten, and
stainless steel. Three geometries are used to explore multiple field configurations.
Figure 3.2 is a sketch of the geometries used in the experiments. A highly non-uniform
field is created using a tungsten electrode with a conical top (needle/point) with a radius
of curvature of about 10 µm and a 1 cm diameter copper plane. A slightly less, non-
15

uniform field is created using either a copper or stainless steel electrode (pin) with a
hemispherical tip of 1mm radius and a corresponding copper or stainless steel plane 1cm
in diameter. The pin and plane are both the same materials, either copper/copper or
stainless/stainless. The uniform field case, plane/plane, consists of 1 cm diameter copper
planes.
Figure 3.2 Sketch of geometries used in liquid breakdown studies. (a) needle/plane, (b) pin/plane, (c) plane/plane.
The connection of the chamber to a vacuum system allows for the adjustment of
the hydrostatic pressure applied to the liquid. Reducing the hydrostatic pressure allows
the trapped gas to escape from the transformer oil or cooling of liquid nitrogen. After
filling the chamber with liquid nitrogen it is evacuated to a pressure of about 150 torr for
a minimum of 15 minutes. The pumping process causes the liquid to boil more rapidly
cooling the liquid. The process is described by the Clausis-Clapyron equation, Eq. (1),
which is used to determine the final temperature of the liquid. Once cooled to a
temperature of about 70 K the pressure in the chamber is returned to atmosphere and the
16

liquid ceases boiling, since the liquid temperature is below the normal boiling point of
77 K at standard temperature and pressure. The temperature of
⎟⎟⎠
⎞⎜⎜⎝
⎛−⋅=
212
1 11lnTTR
Hpp Vap
(3.1)
p = Pressure T = Temperature
HVap = Latent Heat of Vaporization R = Gas constant
the liquid is estimated to be approximately 68 K and will remain below 77 K for 10-15
minutes, long enough to run a series of tests before the liquid must be cooled again for
the next series. The primary source of heat flux into the chamber is the cable/feed
through connection. The total heat flux into the chamber is determined to be about
100 W. Nitrogen testing utilizes the point-plane geometry consisting of a tungsten needle,
10 µm radius of curvature, and copper plane 1 cm diameter. Testing includes temporal
and spatially resolved spectroscopy and measurement of luminosity, current risetime, DC
leakage current, and pre-breakdown current pulses.
3.2 Oil Filtration System
Oil tests required some modification to the existing chamber. The primary
addition is a filter system to clean the oil between a series of tests. Two separate filter
systems were used over the course of experiments. The first system, the Leybold OF-
1000 circulating pump, utilized a low flow 10µm filter that circulates the oil from the
bottom of the tank through the filter and then back into the top of the chamber. This
17

system was not vacuum compatible therefore degassing had to occur separately. The
second system improved upon the quality of the filter and circulation while allowing
simultaneous degassing of the oil. The calculation of the oil flow from the chamber to
the circulating pump indicated that the flow was insufficient for the new system so
modifications had to be made to the chamber. Therefore, a large drain hole, 2.5 cm in
diameter, was added to the system to allow for a continuous flow of oil (2-4 gpm) to the
Little Giant 4-MD-SC, magnetic drive pump, located 3’ beneath the tank. Gravity feeds
the pump, which circulates the oil through a 3µm, cellulous, in-line filter back into the
top of the tank. The primary source line to the pump is a reinforced 1” hose to prevent it
from collapsing while under vacuum. The physical construction of the magnetic drive
pump allows a vacuum quality seal that is not possible with most other fluid pumps. All
plumbing connections must be vacuum compatible for the system to operate. The filter is
a typical hydraulic fluid filter that is about 30-50% efficient at removing particles from
the oil. All oil in the chamber passes through a complete circulation through the filter in
about 10 minutes. The oil recirculates approximately 20 times or 3.5 hours to remove
most of the particles and dirt from the oil. Figure 3.3 is a generic sketch of the improved
oil circulation system. More information on the filtration system is available in the
Appendix.
18

Figure 3.3 Sketch of oil filtration and degassing system showing the pump, flow selector valve, isolation valves and plumbing connections.
Since the system is sealed, and a simultaneous vacuum is applied; the oil is
filtered and degassed at the same time. Oil sprays into the vacuum region above the
liquid to maximize the exposed surface of the oil. Any gas trapped within the liquid
stream rapidly expands and is removed via the vacuum pump. A vacuum of about 100
mtorr removes trapped water molecules from the oil as well, since the applied pressure is
below the vapor pressure of water.
3.3 Oil Cooling System
Cooling of the oil required the addition of a 6 mm copper coil heat exchanger that
allows LN2 to circulate through the coil reducing the temperature of the oil. The copper
19
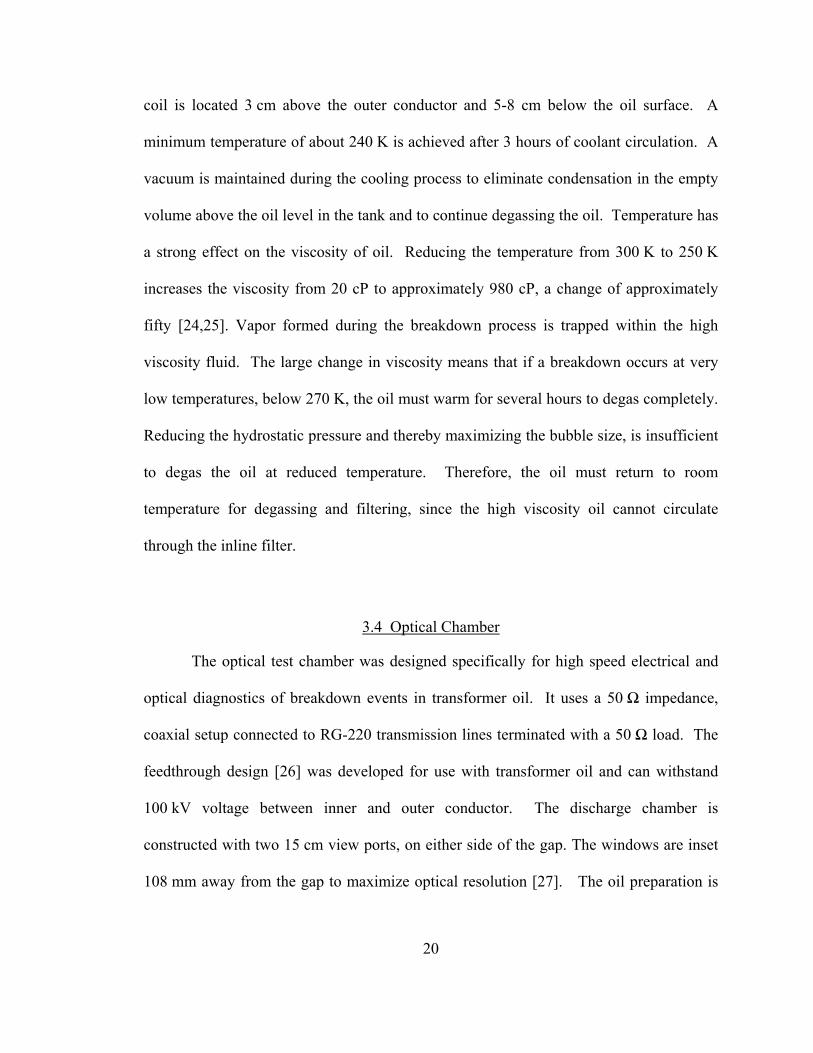
coil is located 3 cm above the outer conductor and 5-8 cm below the oil surface. A
minimum temperature of about 240 K is achieved after 3 hours of coolant circulation. A
vacuum is maintained during the cooling process to eliminate condensation in the empty
volume above the oil level in the tank and to continue degassing the oil. Temperature has
a strong effect on the viscosity of oil. Reducing the temperature from 300 K to 250 K
increases the viscosity from 20 cP to approximately 980 cP, a change of approximately
fifty [24,25]. Vapor formed during the breakdown process is trapped within the high
viscosity fluid. The large change in viscosity means that if a breakdown occurs at very
low temperatures, below 270 K, the oil must warm for several hours to degas completely.
Reducing the hydrostatic pressure and thereby maximizing the bubble size, is insufficient
to degas the oil at reduced temperature. Therefore, the oil must return to room
temperature for degassing and filtering, since the high viscosity oil cannot circulate
through the inline filter.
3.4 Optical Chamber
The optical test chamber was designed specifically for high speed electrical and
optical diagnostics of breakdown events in transformer oil. It uses a 50 Ω impedance,
coaxial setup connected to RG-220 transmission lines terminated with a 50 Ω load. The
feedthrough design [26] was developed for use with transformer oil and can withstand
100 kV voltage between inner and outer conductor. The discharge chamber is
constructed with two 15 cm view ports, on either side of the gap. The windows are inset
108 mm away from the gap to maximize optical resolution [27]. The oil preparation is
20

similar to the previous tests. After each breakdown a vacuum is reapplied to the chamber
to remove gas produced during breakdown. A minimum of 10 minutes of “pumping”
between tests is required to remove the “visible” gas, in the form of bubbles suspended in
the liquid, from the system. The next test is performed when the oil is observed through
the view ports to no longer be outgassing trapped gas from within the liquid.
3.5 Pressure Sensors
The first step in measuring the pressure was to determine the absolute pressure in
the lab. The pressure of 674 torr was measured with a mechanical, absolute pressure
gauge and matches the pressure calculated for the elevation of the lab, 3195 ft. The
purpose of changing the pressure is to emphasize differences and to clarify or identify the
processes. Most pressure studies are at increased hydrostatic pressure, which is
technically challenging and more difficult to achieve large changes in the magnitude of
applied pressure [9,19,20,28-30]. Limited studies have been performed with the effects
of reduced pressure on conduction or breakdown mechanisms. The author performed
tests at 3 orders of magnitude below normal atmospheric pressure.
Large variations in pressure emphasize the physical changes that occur during
breakdown. The lowest pressure achieved for any test was about 10 mtorr. Typically, the
low end pressure was set to 100 mtorr. After breakdown gas is produced, usually
hydrogen, carbon dioxide or other smaller hydrocarbon molecules, and a vacuum must be
applied between shots to remove the newly released gas. The rate of removal of gas is
related to the pressure applied and temperature of the oil, which affects the solubility [24]
21

of gas within the oil. Maintaining a consistent test system requires regular degassing
between tests when possible. Tests on oil at atmospheric pressure can recover in a few
minutes of degassing after breakdown, while tests at 100 mtorr might require an hour or
more to return to an acceptable testing condition.
3.6 Temperature Measurements
The temperature of the oil is monitored using 3 type K thermocouples, however any
thermocouple that operates from 350 K to 200 K will work. The thermocouples monitor
the temperature at the top, bottom, and center of the outer conductor. The temperature
must be within a couple of degrees at each of the levels to insure a stable temperature
across the gap. The viscosity of oil is strongly temperature [24,25] dependent below
300 K, large differences in the temperature measurements cause a spatial, viscosity
gradient, which impacts any induced fluid motion. The temperature is monitored
constantly during the cooling and testing process. Maintaining a constant temperature is
important to the quality of data collected. Using liquid nitrogen as the primary coolant
provides an adequate level of control. When the nitrogen from the source tank is not
flowing the remaining nitrogen in the heat exchanger quickly evaporates and the cooling
process ends.
3.7 Electrometer
DC conduction current tests use the Keithley 6514 electrometer. The electrometer
is used to measure the DC current from pA to µA level. The settling time of the
22

amplifiers within the electrometer requires 10’s of milliseconds, for measurements on the
nanoamp scale, to reach a stable value; therefore it is not useful for any pulsed
measurements that exceed the line frequency, 60Hz. Using the electrometer for
conduction/breakdown research requires design and fabrication of a protection circuit that
limits the voltage, 250V, or current, 10mA, at the electrometer inputs during transient or
breakdown events. Figure 3.4 and figure 3.5 are two different protection circuits used for
testing. Figure 3.4 is a biased diode circuit. The diodes, 1N4935, are reverse biased and
a continuous current is driven through the diodes to try to achieve a balanced zero net
current through the electrometer. The diodes are rated at 200 V and 1 A continuous or
200 A for pulsed operation. Differences in the diode current leave a residual net current
Figure 3.4 Biased diode protection circuit for the Keithley 6514 electrometer. Gas discharge tubes not shown.
of ~2 nA in the circuit. Since data is collected at 50 s intervals and the leakage current is
constant for this time interval the offset is easily subtracted from the signal with
reasonable reliability and accuracy. An improved circuit, designed to reduce the offset
current, is shown in figure 3.5. The offset reduces from 1nA for the diode circuit to
23

~3 pA, which is comparable to the calculated thermal noise from the resistor. Thermal
noise is the amount of current produced by thermal electron motion within the resistor,
described by Plank’s black body radiation [31]. This level of noise is very low, but with
current measurements of 15 pA it becomes significant, representing approximately 20%
of the signal. The filter circuit has a lower initial offset, which reduces the error in the
measurements; however, it is not as efficient a protection circuit.
Figure 3.5 Low pass filter protection circuit for the Keithley 6514 electrometer. Gas discharge tubes not shown.
The RC circuit is made using ceramic capacitors, which have extremely low
leakage. High quality resistors, carbon film 1% resistors, are used to minimize the
thermal noise and parasitic capacitance. A pair of 1 MΩ resistors in parallel creates the
500 kΩ resistance required for the circuit. Not shown in the figures 3.4 and 3.5 are gas
discharge tubes (GDT) in parallel with the filter circuit. A GDT is a gas breakdown
switch that turns on (shorts) at a given DC voltage. The gas discharge tube is present to
shunt the main current, 100’s of amps, from a breakdown to ground away from the
24

electrometer. The GDT turns on at 75 V for normal operation. The diode circuit conducts
within 25 ns when breakdown occurs shunting the current past the electrometer. Voltage
builds up slowly until the gas discharge tubes, turn on as further protection. The main
problem with the RC circuit is the GDT is not always fast enough to protect the
electrometer. If the breakdown pulse is very fast >1 kV/µs then the switch activates at a
higher voltage proportional to the rate of over-voltage. Many of the breakdown events
have pulses that exceed this limit, and the voltage at the electrometer could be as high as
1 kV at the inputs for a short period of time. This applies stress on the filter circuit
components in excess of their design specifications. The lifetime of the circuit for regular
breakdown tests is limited to a few shots. In these experiments both circuits were used
for different regions of tests. The diode circuit is used for tests near the breakdown
voltage. The offset of approximately 1 nA is less important if the total current is
hundreds of nanoamps. The RC circuit is used at low voltages where pA offsets are more
practical.
Finally, the circuits must be mounted inside a double shielded enclosure to reduce
any electrical noise that might be coupled into the circuit. The sensor cable for the
electrometer is a tri-axial cable, signal high, signal low, and noise shield. Low level
measurements are very sensitive to the surrounding environment [32]. Striking the cable,
walking near the test setup and other similar events can affect the data if the proper
precautions such as short, shielded cables, close proximity of setup and detector, and
excellent grounding are not implemented throughout the test setup. More information on
the electrometer system is available in Appendix A.
25
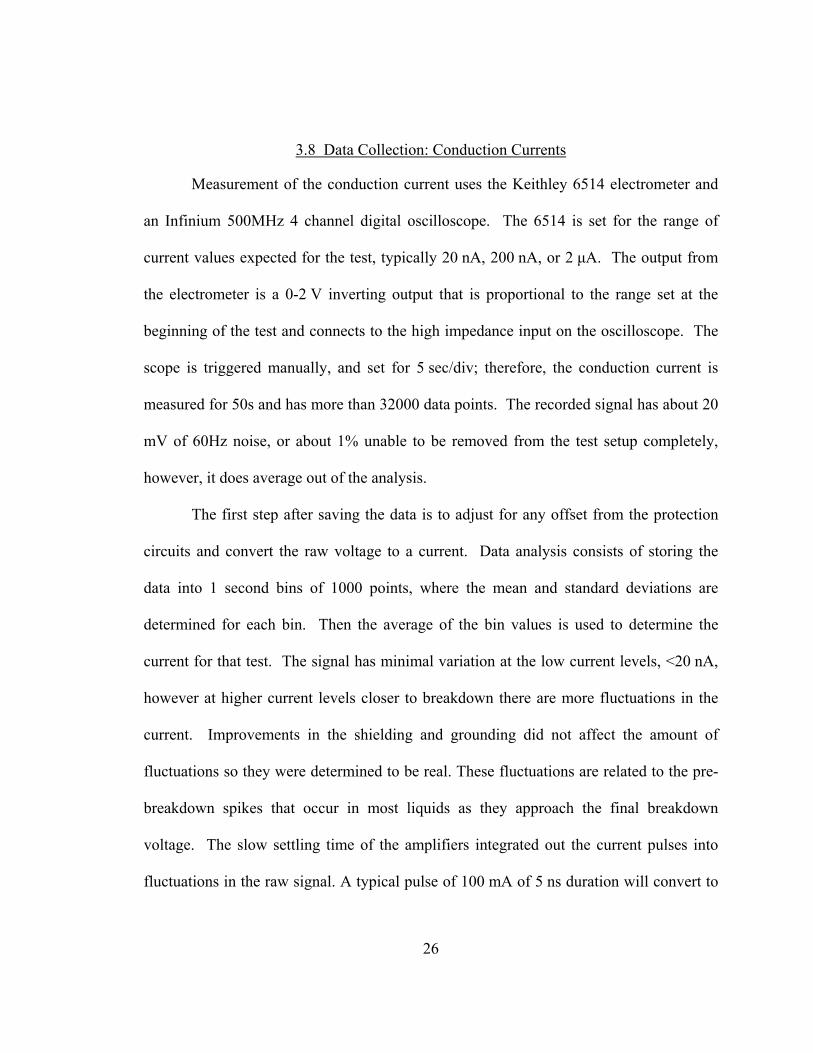
3.8 Data Collection: Conduction Currents
Measurement of the conduction current uses the Keithley 6514 electrometer and
an Infinium 500MHz 4 channel digital oscilloscope. The 6514 is set for the range of
current values expected for the test, typically 20 nA, 200 nA, or 2 µA. The output from
the electrometer is a 0-2 V inverting output that is proportional to the range set at the
beginning of the test and connects to the high impedance input on the oscilloscope. The
scope is triggered manually, and set for 5 sec/div; therefore, the conduction current is
measured for 50s and has more than 32000 data points. The recorded signal has about 20
mV of 60Hz noise, or about 1% unable to be removed from the test setup completely,
however, it does average out of the analysis.
The first step after saving the data is to adjust for any offset from the protection
circuits and convert the raw voltage to a current. Data analysis consists of storing the
data into 1 second bins of 1000 points, where the mean and standard deviations are
determined for each bin. Then the average of the bin values is used to determine the
current for that test. The signal has minimal variation at the low current levels, <20 nA,
however at higher current levels closer to breakdown there are more fluctuations in the
current. Improvements in the shielding and grounding did not affect the amount of
fluctuations so they were determined to be real. These fluctuations are related to the pre-
breakdown spikes that occur in most liquids as they approach the final breakdown
voltage. The slow settling time of the amplifiers integrated out the current pulses into
fluctuations in the raw signal. A typical pulse of 100 mA of 5 ns duration will convert to
26

a few nA signal on millisecond time scales. The voltage was constant during the tests
and was measured by a Fluke 80K-40, 1000:1 high voltage probe.
3.9 Current Sensor
High speed current measurements are made using a traveling wave current sensor
(TWCS) [33]. The sensor is capable of sub-nanosecond risetime, which is useful in
quantifying the temporal nature of liquid breakdown development. The primary
advantage of the TWCS is the minimal distortion of the incoming current waveform, i.e.
a good match between input and output waveforms. Also, it is very useful because of its
wide dynamic range. Figure 3.6 is a general sketch of the construction of a traveling
wave current sensor. The TWCS measures current accurately from 100 µA with an
Figure 3.6 Sketch of a traveling wave current sensor.
27

Table 3.1 Table of traveling wave current sensor parameters and characteristics.
Description LN2 System Number of turns 495 Radius of conductor shield 1.65 cm Radius of Coil 1 cm Capacitance 65 pF Inductance 515 µH Characteristic Impedance 2810Ω Wire Resistance 8.4Ω Risetime 500 ps Two-way transit time 310 ns Sensitivity (into 50Ω) 0.1 V/A
amplifier, up to 1 kA and remains linear along the entire range. Table 3.1 contains
detailed information about the current sensor used on this experiment [34]. These sensors
are ideal for breakdown studies because of there fast rise time, minimal distortion and
dynamic range.
3.10 Capacitive Voltage Divider
A set of capacitive voltage dividers on either side of the gap are used to monitor
the voltages. The set consists of a high and low sensitivity sensor to cover a range of
voltage amplitudes. The voltage dividers are coaxial and designed to fit around the RG-
19 or RG-220 cable. Figure 3.7 is a general sketch of a coaxial voltage divider. A series
of 5 dividers are used in this research. Table 3.2 lists the sensors and their calibrated
sensitivities. The sensors are used in pairs, a high sensitivity (HSC) and a low sensitivity
(LSC) unit.
Capacitive dividers for coaxial transmission lines are easy to fabricate and are
useful for many pulsed power applications because of their very fast risetimes and
28

variable sensitivities. The capacitive dividers are machined from aluminum to “clam
shell” as a pair around the diameter of the solid dielectric of the transmission line. The
sensitivity is adjusted by the amount of Kapton tape between the copper foil and the inner
conductor, 1 mil thick is low sensitivity, 3 mil thick is high sensitivity. The risetime of
the sensors is sub-nanosecond making them acceptable for these experiments.
Figure 3.7 Sketch of coaxial capacitive voltage divider. C1 capacitance between inner conductor and foil. C2 capacitance between foil and outer conductor.
Table 3.2 Capacitive divider sensitivities.
Sensor Risetime Type Sensitivity HSC1 <700ps 3mil Kapton 0.0128 Vo/VsLSC1 <700ps 1mil Kapton 0.00058 Vo/VsHSC2 <700ps 3mil Kapton 0.0132 Vo/VsLSC2 <700ps 1mil Kapton 0.00046 Vo/VsLSC3 <700ps 1mil Kapton 0.00077 Vo/Vs
29
3.11 Photomultiplier Tube
The photomultiplier tubes or PMT’s, detect light emission in various locations
across the test gap. Luminosity measurements used in the LN2 and oil chamber consists
of three Hamamatsu H6780-04 photosensor modules, which have risetimes of 780 ps,
sensitivity of 3x10⁴ A/W, and a gain of 5x10⁵. Each of the PMT’s observes a different
location in the test gap via a fiber optic and cylindrical lens configuration. The lenses
are 5 mm x 1 mm diameter quartz cylinders. To align the lenses light is shown through
the fiber optic cables through the lens and then the lens holder is adjusted until the light
from the lens is focused on the electrode and the gap. The field of view of the lens is a
narrow beam perpendicular to the axis of the gap that is approximately ±3 mm on either
side of the axis and 0.5 mm wide. Figure 3.8 is sketch of the fiber optic and cylindrical
lens setup used with the luminosity and spectroscopic measurements. The lens holder is
usually 10-15 mm away from the electrodes. Luminosity measurements determine if pre-
breakdown events, such as current pulses, are luminous indicating the presence of excited
or ionized elements in the discharge gap prior to breakdown. Monitoring at 3 different
spatial locations means an estimate of the speed of propagation of the light pulses is
possible, as well as the origination or direction of the event. Photomultiplier tubes are
extremely sensitive to detect very low level, luminosity events, which provide further
insight in to the breakdown mechanisms. The intensity of the luminosity is an indicator
of the energy released during an event but it is difficult to quantify without knowledge of
the spectrum of light observed from the event.
30

Figure 3.8 Sketch of fiber optic and cylindrical lens used in the needle/plane test gap. Cylindrical lenses 1 mm diameter, 5 mm long, 5 mm between each lens. Gap = 7 mm.
3.12 Data Collection: Pre-breakdown Currents
Pre-breakdown measurements of the current and luminosity are made using the
TWCS, capacitive voltage dividers, and photosensor modules. Cables of known time
delay connect the sensors to the screen room. Then all the signals connect to three 4
channel Infinium 500MHz oscilloscopes. Scope 1 collects all three photomultiplier
signals and the current signal. Scope 2 collects data from three of the voltage dividers
and a common trigger. Finally scope 3 collects the remaining voltage and current signals
as well as the gate signal if the spectroscope is used for the test. The scopes are triggered
from a pre-breakdown current spike.
Data analysis is time consuming with such a large number of signals. Therefore,
a script file, for use in the spreadsheet program Plot-It was designed that would open the
raw data file and perform several operations. The script would adjust the timing of all the
31

files by adjusting for cable and optical delays as required, it would also convert the raw
signals to units of interest such as amps, kilovolts or lumens. When the data is in an
operable form graphs of the data are created. See the Appendix for more information on
the script files used for data analysis.
3.13 Shadowgraphy
Shadowgraphy measurements are useful for determining the structure of the
breakdown process in the liquid. Shadowgraphs were taken using the optical chamber
described in detail earlier in this chapter. Figure 3.9 is a sketch of the shadowgraphy
setup used for all the imaging in this dissertation. The system consists of a 1 W solid
state diode laser with a 650 nm wavelength that is triggered by a pulse/delay generator.
The laser is expanded for illumination of the entire test gap. The light is collected by a
lens that images the electrode region through a 650 nm band pass filter, 10 nm
bandwidth, and onto the intensified CCD camera.
A breakdown event alters the local density changing the index of refraction, n,
and the laser light is affected accordingly as it passes through the test gap. Shadowgraphy
image intensity is proportional to changes in the second derivative (∂2n/∂x2) of the index
of refraction [35] with respect to changes in the spatial dimension. Therefore it is
sensitive to large changes in the index i.e. bubble/vapor formation. These variations
provide information on index of refraction changes in the area of interest, which
correspond to the structure of the breakdown event. Estimates of the velocity of streamer
32

propagation can be made by measuring how far across the gap an event, “streamer”,
propagates relative to the trigger point.
Figure 3.9 Shadowgraphy configuration for transformer oil.
3.14 Spectroscopy
Spectroscopic measurements of liquid nitrogen breakdown were made using an
Oriel MS257 spectrograph with a quadruple grating turret. The spectrograph was
combined with the iCCD camera and a fiber optic attachment to generate spectra at
multiple points along the test gap. The same physical setup as the luminosity tests was
used for the spectral data collection. The quadruple grating allows for several different
33

resolutions of data to be collected. The 150 lines/mm grating provides the broadest
spectrum of data covering the 200 nm to 800 nm spectral range and was used exclusively
for emission spectra tests in LN2. Gratings of 600, 1200, and 2400 lines/mm are also
available for higher resolution measurements of selected areas. Liquid nitrogen tests
used a 10 µm slit with the 150 line/mm grating.
The system is triggered off of a pre-breakdown pulse. Variable gate and delay
times are used to image an area as early in the breakdown process as possible. Typical
gate times of 70 ns are used to maximize the light collected during the event. Since pre-
breakdown pulses can occur several microseconds before final breakdown, timing of the
optical gate with initial current rise was difficult. If the gate occurs late in the
development stage then the channel is heavily ionized during the optical gate. The
resultant spectrum does not have sharp well defined individual lines. It still provides
information on the development of the breakdown across the gap.
34

CHAPTER IV
LIQUID NITROGEN
Recent investigations of liquid breakdown have shown that it is based on complex
interactions between hydrodynamic and electrical phenomena. These interactions lead to
a complex temporal and spatial structure of the conducting channel, especially in self-
breakdown mode. Basic theories of field emission, local heating, electro-hydrodynamic
effects, density changes and development of electron avalanches are investigated and
how they relate to the overall breakdown and conduction mechanisms. The next two
chapters will discuss the specific effects noticed in both liquid nitrogen and Univolt 61
transformer oil.
4.1 Pre-Breakdown Current and Luminosity
Measurement of current and luminosity from pre-breakdown events helps
characterize the breakdown process. A series of three fiber optic fibers and cylindrical
lenses are arranged to observe the discharge across the gap. Figure 4.1 is a sketch of the
general layout of the gap and lens configuration. The configuration of the lenses, limits
their field of view to about +/- 3mm on either side of the axis of the gap. Therefore, if the
discharge event does not pass directly within the field of view of the lens, the PMT will
receive less light and the amplitude of the signal is correspondingly less. Two of the
PMTs view the discharge gap, the third views the shaft of the needle. This configuration
will determine where the discharge originates and the velocity of the excitation wavefront
35
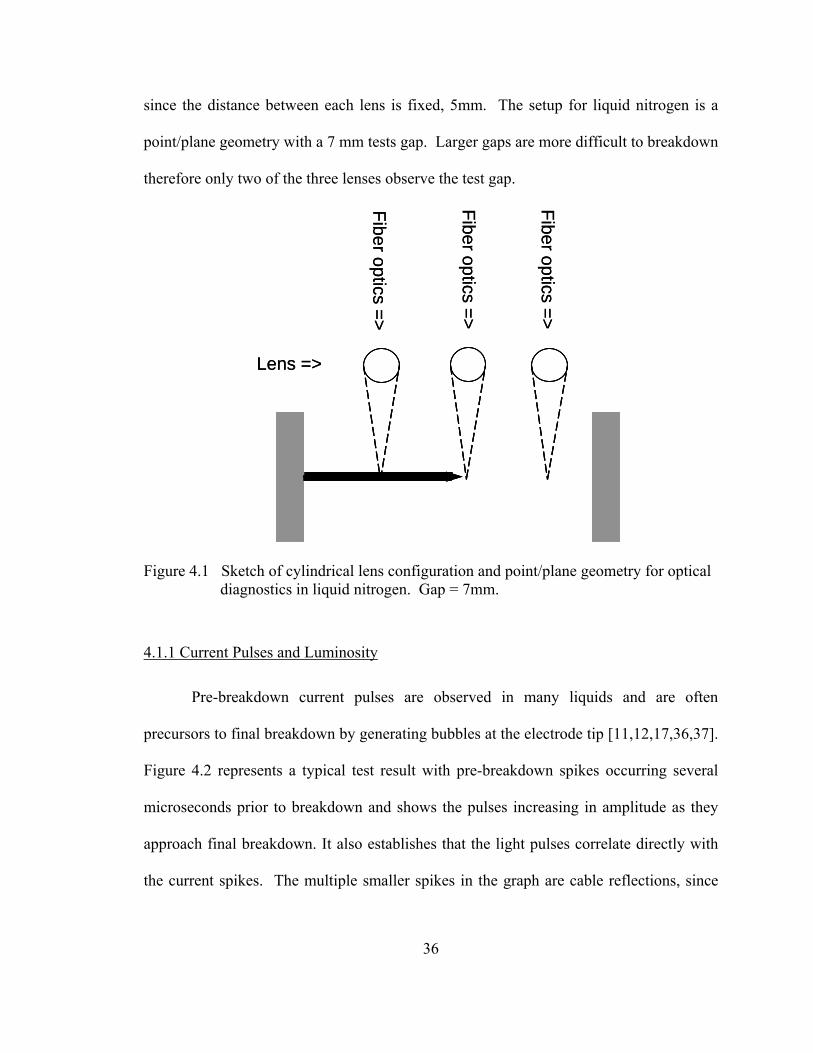
since the distance between each lens is fixed, 5mm. The setup for liquid nitrogen is a
point/plane geometry with a 7 mm tests gap. Larger gaps are more difficult to breakdown
therefore only two of the three lenses observe the test gap.
Fiber optics =>Lens =>
Fiber optics =>
Fiber optics =>
Fiber optics =>Lens =>
Fiber optics =>
Fiber optics =>
Figure 4.1 Sketch of cylindrical lens configuration and point/plane geometry for optical diagnostics in liquid nitrogen. Gap = 7mm.
4.1.1 Current Pulses and Luminosity
Pre-breakdown current pulses are observed in many liquids and are often
precursors to final breakdown by generating bubbles at the electrode tip [11,12,17,36,37].
Figure 4.2 represents a typical test result with pre-breakdown spikes occurring several
microseconds prior to breakdown and shows the pulses increasing in amplitude as they
approach final breakdown. It also establishes that the light pulses correlate directly with
the current spikes. The multiple smaller spikes in the graph are cable reflections, since
36

the cables were not terminated into a matched load. Assuming that negative breakdown
develops in a gas phase, luminosity can be expected to be more intense since electron
impact ionization produces many ions and excited state molecules that release visible
light when recombining or returning to a lower energy state.
Figure 4.2 Graph of pre-breakdown current pulses and luminosity in LN2. Negative tip. Point/plane geometry. Current = top trace. Luminosity = lower trace. Decaying current signals are cable reflections.
Data collected from the current and luminosity spikes provides some insight into
the mechanisms of breakdown. Figures 4.3 and 4.4 are two examples of current and light
emission from pre-breakdown events in liquid nitrogen. They clearly show a polarity
effect on the magnitude and duration of the spikes. The figures indicate that negative
polarity pre-breakdown events are larger in amplitude and have a shorter duration than
37
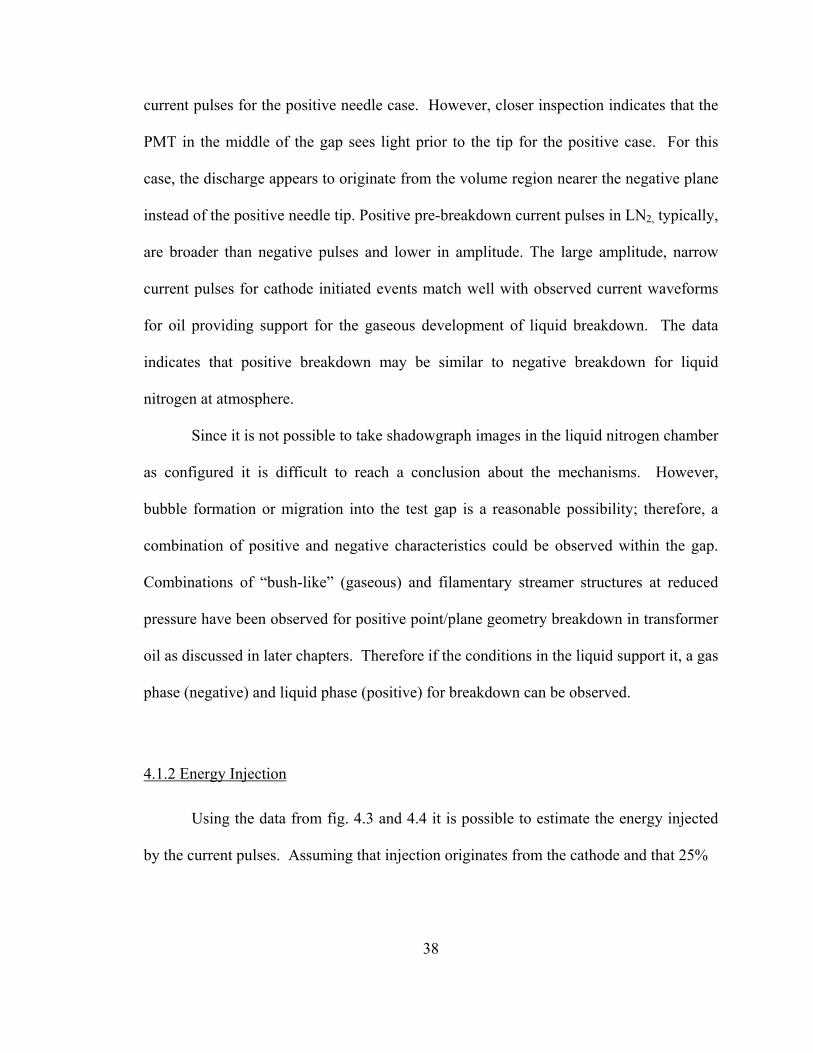
current pulses for the positive needle case. However, closer inspection indicates that the
PMT in the middle of the gap sees light prior to the tip for the positive case. For this
case, the discharge appears to originate from the volume region nearer the negative plane
instead of the positive needle tip. Positive pre-breakdown current pulses in LN2, typically,
are broader than negative pulses and lower in amplitude. The large amplitude, narrow
current pulses for cathode initiated events match well with observed current waveforms
for oil providing support for the gaseous development of liquid breakdown. The data
indicates that positive breakdown may be similar to negative breakdown for liquid
nitrogen at atmosphere.
Since it is not possible to take shadowgraph images in the liquid nitrogen chamber
as configured it is difficult to reach a conclusion about the mechanisms. However,
bubble formation or migration into the test gap is a reasonable possibility; therefore, a
combination of positive and negative characteristics could be observed within the gap.
Combinations of “bush-like” (gaseous) and filamentary streamer structures at reduced
pressure have been observed for positive point/plane geometry breakdown in transformer
oil as discussed in later chapters. Therefore if the conditions in the liquid support it, a gas
phase (negative) and liquid phase (positive) for breakdown can be observed.
4.1.2 Energy Injection
Using the data from fig. 4.3 and 4.4 it is possible to estimate the energy injected
by the current pulses. Assuming that injection originates from the cathode and that 25%
38
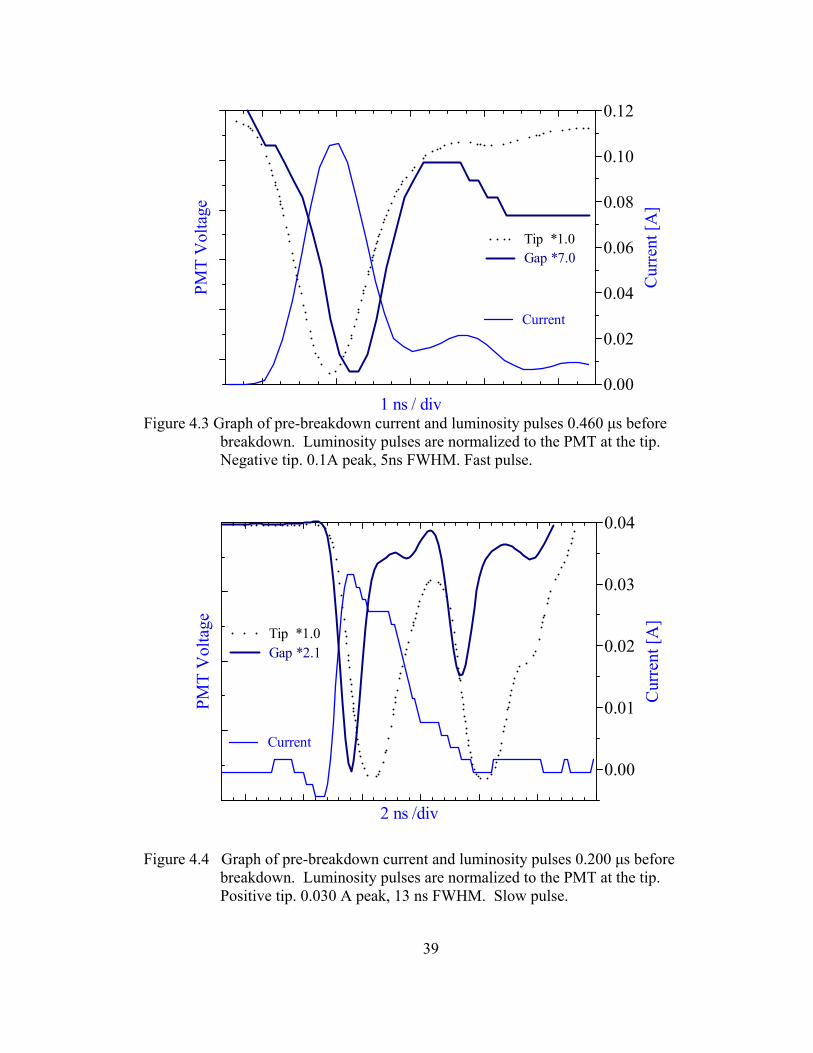
PMT
Vol
tage
0.00
0.02
0.04
0.06
0.08
0.10
0.12
Cur
rent
[A]
1 ns / div
Current
Tip *1.0Gap *7.0
Figure 4.3 Graph of pre-breakdown current and luminosity pulses 0.460 µs before
breakdown. Luminosity pulses are normalized to the PMT at the tip. Negative tip. 0.1A peak, 5ns FWHM. Fast pulse.
PMT
Vo l
tage
0.00
0.01
0.02
0.03
0.04
Cur
rent
[A]
2 ns /div
Current
Tip *1.0Gap *2.1
Figure 4.4 Graph of pre-breakdown current and luminosity pulses 0.200 µs before breakdown. Luminosity pulses are normalized to the PMT at the tip. Positive tip. 0.030 A peak, 13 ns FWHM. Slow pulse.
39

of the electrical energy is converted to heat to vaporize the liquid there is enough energy
to form a bubble of 10–30µm in radius. The physical and electrical properties of LN2
control the mechanisms of breakdown development. The average energy per molecule
required to heat the liquid to vaporization is approximately 60 meV. This is comparable
to values for n-hexane (~100 meV) [21], which will affect the conduction mechanisms.
Small vaporization energy means that a phase change is very easy and tunneling charge
carriers could have sufficient energy to initiate a phase change.
The formation of pulses for both polarities is related to the properties of the
liquid. Liquid nitrogen is at a temperature very close to its vaporization temperature.
The minimal energy injection required to produce a bubble is easily attained by the
impact of charged particles accelerated in the high fields. Work by Frayssines et al.
showed that positive breakdown in liquid nitrogen exhibits a gaseous nature at pressures
below several atmospheres [38]. Since the energy of formation is so low for liquid
nitrogen it is clear that positive initiated events could also produce local heating and
bubble formation. It can be determined from the figures that the amount of charge
injected is approximately the same for both the positive and negative pulses. The
luminosity is factor of 3 lower for the positive case which corresponds to the slower
injection mechanism.
4.2 Emission Spectra
An important step in using the emission spectra as a diagnostic is to trigger the
spectrograph readout, iCCD camera, as early in the breakdown as possible. Breakdown in
40

liquid nitrogen typically reaches 50% of the final impedance limited current in a few
nanoseconds in self-breakdown mode, which is very fast, and an indication of an ideal
switching medium. The fast risetime of the breakdown current makes timing the optical
gate to catch the earliest moments of breakdown difficult.
4.2.1 Emission Spectra
The primary goal is to investigate the early development of the plasma channel to
detect any mechanisms that may contribute to the development. Spectroscopic data can
provide information about plasma temperature and electron density given knowledge of
well defined emission lines and transitions. Figure 4.5 represents a typical timing of the
optical gate relative to the final breakdown current rise. A gate time of 70 ns allows
100
200
300
400
Cur
rent
[A]
Gat
e [V
]
25 ns / div
Figure 4.5 Graph of gate location during main breakdown for point/plane geometry in liquid nitrogen. Gate = 70 ns.
41

sufficient exposure time to obtain a strong signal at all three locations in the gap. The
average intensity of the shots was very close to the maximum levels at the needle tip for
every test, while the intensity within the gap was much lower. Figure 4.6 is the
experimental spectra for LN2 as observed during the early stage of main breakdown. The
outstanding feature of the spectra is the lack of distinct narrow line features. Comparison
to emission spectra for gaseous N2 at atmospheric pressure, figure 4.7, shows a similar
general structure but lacks the distinct line features present in the spectrum of gaseous N2.
The lack of sharp spectral features is due to the optical gate occurring during main
breakdown, which has a large degree of ionization, which broadens the lines.
Figure 4.6 Emission spectra of liquid nitrogen during a typical self-breakdown. Bottom is the needle shaft. Middle is the needle tip. Top is the middle of the channel near the plane. Bandhead for N2 at 275 nm [18].
42

The “blurring” of features is assumed to be a result of Stark broadening as the
most dominant line broadening mechanism. The high degree of ionization and thus the
high electron density in the discharge, as evident by the large current flowing through the
gap during the gate is sufficient for Stark broadening to occur. Pressure broadening
occurs when the excited molecules collide with other molecules, the proximity of another
molecule distorts the energy levels causing line broadening. While pressure broadening
does occur, Stark broadening is likely to be the dominant mechanism. Finally, other
mechanisms such Doppler broadening, caused by high velocity molecules, or the natural
line width are estimated to be small for the discharge event, due to large number density.
400800
120016002000
400800120016002000
400800
1200160020002400
200 300 400 500 600 700 800Wavelength (nm)
Cou
nts
[a.u
.]
Figure 4.7 Emission spectra of gaseous atmospheric N2 for self-breakdown. Bottom is an electrode tip. Middle is the center of the channel. Top is an electrode tip. Gap = 10mm. Hemi-spherical electrode, 150 lines/mm grating, 10µm slit. [40]
43
4.2.2 Band Structures
It is possible to identify broadband band structures for N2 and N2+ [39]. The first
band head appears at 391 nm with the direction of shading primarily to the red, this
corresponds to the transition of N2+ from B2Σu
+ → X2 Σg+. Two other band heads fit the
data reasonably well. A possible transition at 275nm for N2, the m1Πu → a1Πg and a
second transition possibly at 280nm, the dr → a1Πg, both shade towards the red. These
band heads would explain the sharp drop in intensity observed in figure 4.6. Other bands
might exist outside of the measured range of wavelengths but are not distinguishable with
the current experimental setup. Frayssines et al. observed similar spectra in pulsed
experiments with more defined structure [38].
Given that the transition for N2+ goes into the ground state from the upper
electronic level with energy of 3.1 eV and that both N2 transitions occur at energy levels
of about 13 eV, it is clear that the upper energy level N2+ would be more densely
populated assuming that the energy is distributed in a thermal distribution. Since the
intensities differ by approximately an order of magnitude, it is a reasonable conclusion.
The degree of ionization, which is an unknown, determines the population density.
The spectral shape is different at the electrode tip compared to the center of the
gap nearest the plane. Also, the intensities are very different indicating a variance in the
electronic temperature and degree of ionization at each location. The third fiber located
5mm behind the tip electrode, exhibits a different spectra from the other two. The spectra
at the needle shaft clearly extends beyond the bandhead at 275nm, indicating the
formation of a diffuse plasma located outside of the gap. Therefore a different plasma
44

background must be linked to this region. The plasma must have a different electronic
temperature and a different radiation bandhead that is shaded into the violet as
determined from figure 4.6. The difference in the background plasma could be useful in
determining any secondary process that could contribute to the final breakdown
mechanism.
4.3 Conduction Current
Measuring the conduction current in liquid nitrogen was much more difficult than
in transformer oil. Liquid nitrogen does not have a permanent dipole moment and is
difficult to polarize. Also, the molecular configuration makes electron attachment
unlikely and field ionization at very low fields is unlikely for a diatomic molecule.
Combined with a high volume resistivity, ρ > 1013 Ω-cm, it was not possible to establish
a stable conduction current within the measuring limit of a few pA. However, on several
occasions a slow rising current for a fixed voltage was established. For example, an
applied voltage of 10 kV produced a current that rose from 5 nA to 66 nA over a period
of 4 minutes. This slow rising current was only observed a few times during conduction
tests of nitrogen. Since the case was not easily reproducible, it is likely that it was an
artifact of liquid contamination. The liquid nitrogen is not filtered or strained before it is
used in the test chamber. The presence of small particles in the liquid could significantly
alter the conduction mechanisms and mobility of the liquid. At very low temperatures
the water vapor condenses out of the air in the laboratory and immediately freezes. The
system remains closed during the tests and is backfilled with “dry nitrogen” gas, however
45
limited exposure is unavoidable. Any water in the chamber immediately freezes when it
enters and will sink to the bottom because of its much higher density than liquid nitrogen.
During this time some ice could pass through the gap. The permanent dipole moment of
water combined with fields applied to the gap for several minutes, allows a build up of
charge carriers in the liquid and current will flow. These particular results are consistent
with the suspended particle theory of liquid breakdown.
46

CHAPTER V
UNIVOLT 61 TRANSFORMER OIL
Investigations of the characteristics of Univolt 61 transformer oil including the
current development and mechanisms of conduction are discussed in detail. Emphasis on
exploring areas in more depth than previous research is the focus of this chapter. The
work presented here varies the pressure from atmosphere to 100 mtorr and reduces the
temperature of the oil from 300 K to 245 K. The effect of uniform and non-uniform
fields on the conduction mechanisms is also discussed.
5.1 Proposed Model
The objective of this research is to further the understanding of breakdown and
conduction in liquid dielectrics in general, and transformer oil and LN2 specifically. The
polarity effect as a function of reduced hydrostatic pressure or temperature on liquid
breakdown is investigated in detail. The strong pressure dependence of cathode initiated
breakdown, hints at a gaseous nature, and is investigated thoroughly with the
combination of diagnostics discussed earlier in this dissertation. Experimental evidence
establishing the relationship between polarity and a preferred breakdown model such as a
“bubble model” would be a solid link in the development of a comprehensive model for
liquid breakdown. Additionally, establishing a general relationship between the
conduction mechanisms and breakdown would be valuable. It is proposed here that there
47
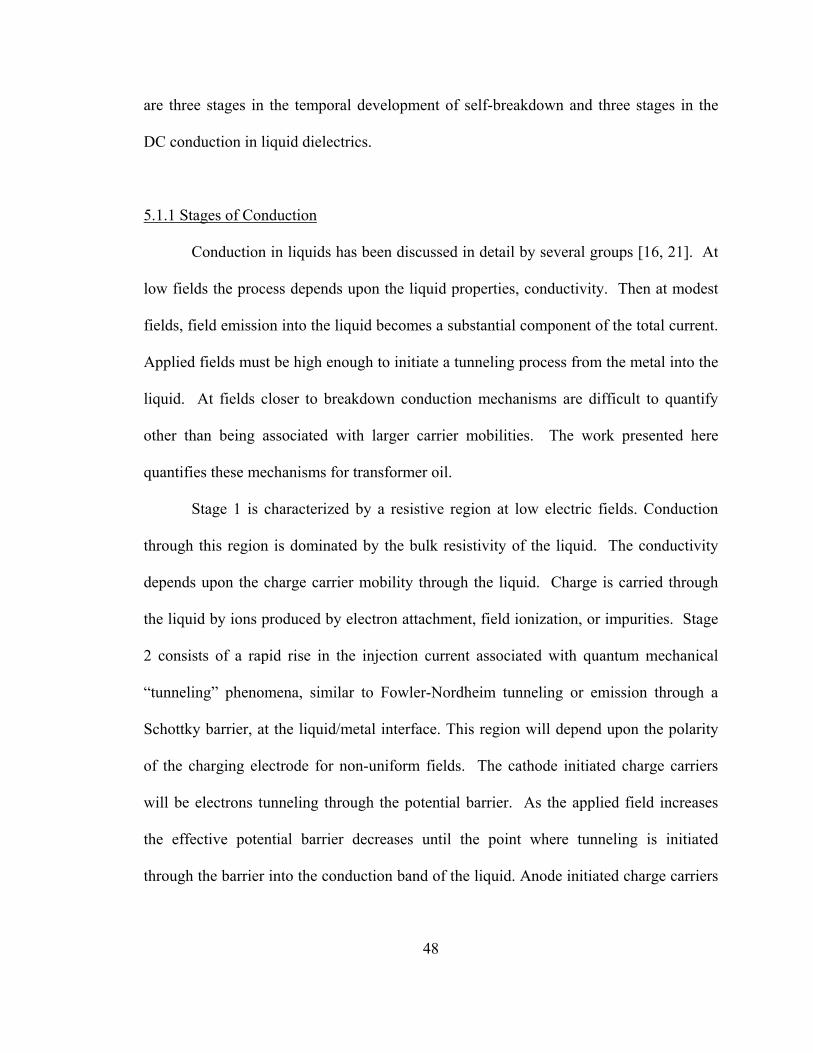
are three stages in the temporal development of self-breakdown and three stages in the
DC conduction in liquid dielectrics.
5.1.1 Stages of Conduction
Conduction in liquids has been discussed in detail by several groups [16, 21]. At
low fields the process depends upon the liquid properties, conductivity. Then at modest
fields, field emission into the liquid becomes a substantial component of the total current.
Applied fields must be high enough to initiate a tunneling process from the metal into the
liquid. At fields closer to breakdown conduction mechanisms are difficult to quantify
other than being associated with larger carrier mobilities. The work presented here
quantifies these mechanisms for transformer oil.
Stage 1 is characterized by a resistive region at low electric fields. Conduction
through this region is dominated by the bulk resistivity of the liquid. The conductivity
depends upon the charge carrier mobility through the liquid. Charge is carried through
the liquid by ions produced by electron attachment, field ionization, or impurities. Stage
2 consists of a rapid rise in the injection current associated with quantum mechanical
“tunneling” phenomena, similar to Fowler-Nordheim tunneling or emission through a
Schottky barrier, at the liquid/metal interface. This region will depend upon the polarity
of the charging electrode for non-uniform fields. The cathode initiated charge carriers
will be electrons tunneling through the potential barrier. As the applied field increases
the effective potential barrier decreases until the point where tunneling is initiated
through the barrier into the conduction band of the liquid. Anode initiated charge carriers
48

will be holes tunneling into the liquid as discussed by Lewis [21]. The charge carriers are
holes, generated by electrons tunneling from the valence band of the insulator through the
barrier. This process requires the electron density near the anode to be capable of
providing the magnitude of tunneling current. The transition point between stage 1 and 2
occurs at moderate fields. Stage 3 is a region of high applied fields and the current
behaves like a space charge saturation region at voltages very near to self-breakdown for
non-uniform fields. Identifying the critical transition regions and causes for observed
polarity dependence will be vital. This model will allow the user to further develop
breakdown inhibiting techniques for use with transformer oil and perhaps all liquid
dielectrics.
5.1.2 Stages of Breakdown
It is put forth that these stages of the temporal development of breakdown are
very general and capable of describing either anode or cathode processes. The
mechanisms of each of these stages depend upon polarity. The first stage requires
current injection into the liquid. The mechanism of injection is field emission from the
cathode tip or field ionization at the anode. The injection of current leads to a current
amplification process that rapidly increases as it propagates across the gap. For a cathode
process an electron avalanche occurs within a gas phase, while for the anode process an
increased electron flow along the path established by holes tunneling through the liquid.
Finally, the third stage is the formation of a high current, highly conductive arc across the
test gap and breakdown is complete. The basic physical processes involved have been
49

determined in this dissertation. Further work is required to complete a comprehensive
model and this dissertation contributes to that knowledge.
5.2 Electrode Geometry and Materials
Measurements of the DC leakage current across the gap were made for three
geometries and various electrode materials. The I-V data is graphed using a Fowler-
Nordheim (FN) plot, i.e. ln (I/V2) vs. (1/V) for interpretation of the mechanisms. Figure
5.1 represents a typical data set of current and voltage for point/plane geometry displayed
in a FN plot for positive and negative polarity at atmospheric pressure. Three regimes can
Figure 5.1 Graph of Fowler-Nordheim plot for positive and negative polarity. Open symbols: negative. Closed symbols: positive. Gap = 10 mm, Point/plane. Stage I resistive. Stage II tunneling. Stage III space charge saturation.
50

be distinguished from the graph. Typically, starting from the left with the high field
region, 1/Vapp ≤ 0.1 kV-1 (i.e. Vapp ≥ 10 kV), and the current is proportional to Vapp2. For
0.1 kV-1 > 1/Vapp > 0.25 kV-1 (10 kV > Vapp > 4 kV) the slope of the curve is linear and
negative which validates the Fowler-Nordheim relation. Finally, for 1/Vapp > 0.3 kV-1
(Vapp < 4 kV), the curve is characteristic for ohmic conduction.
5.2.1 Stage 3
Calculating the mobility in the high field region, stage 3, will reveal the
conduction mechanisms for this region. It is calculated assuming a space charge limited
current, and that the point/plane can be modeled by a simple geometry such as concentric
spheres. This approximation was used by Halpern and Gomer [41] to approximate the
point/plane configuration. Using the simplified geometry and solving Poisson’s equation
and charge conservation equations with appropriate boundary conditions yields equation
(5.1). Assuming the carrier mobility, µ, is constant in the region away from the tip then
the velocity, v, of the charge carriers will be proportional to the electric field, v = µE.
The relative permittivity of the oil is ε = 2.2, d = gap width, α ≈ 0.6π (solid angle factor)
and Vapp is the potential drop; the current varies as the square of the potential drop.
2
83
appVd
I ⋅⎟⎠⎞
⎜⎝⎛ ⋅⋅
⋅=
εµα (5.1)
Plotting the current versus the square of the voltage yields a straight line with the
slope proportional to the mobility of the primary charge carrier. Figure 5.2 is a graph of I
51

vs. Vapp2 for the point/plane, d = 10mm, non-uniform field. The apparent mobility for
non-uniform fields was found to be 2.9*10-3 cm2/V*s in the space charge saturation
region far from the tip using the slope from fig 5.2.
It is well documented that the application of electric fields will cause electro-
hydrodynamic motion (EHD) in a dielectric liquid [42-46]. EHD mobility, a fluid
characteristic, is defined as the square root of the permittivity divided by the density of
the liquid, √(ε/ρ) for uniform fields.
Figure 5.2 Graph of current vs. square of the applied voltage for point/plane geometry. Test gap 10 mm.
This is an upper limit for the mobility of the liquid due to convective charge transport
[44]. EHD is a blending of electric and hydrodynamic forces that describes the
mechanical effects of electric fields acting on a dielectric fluid. Charge carriers in the
52

liquid, ions or impurities, experience a net force from the electric field that causes them
to drift in the field. As the ions drift they collide with liquid molecules and lose
momentum and transfer energy to the fluid. The transfer of momentum causes a net drift
of the liquid in the direction of ion motion. EHD motion aides in carrying the injected
charge away from the injection point. The calculated EHD mobility is 1.5*10-3 cm2/V*s
for transformer oil in a uniform applied field. It is a factor of two less than the apparent
mobility in the high field region mentioned above. The difference in mobility can be
explained by the increase in the fluid velocity, which is a function of the applied field
(non-uniform). As the field enhancement increases near the needle tip electro-
hydrodynamic turbulence [9] increases with the fluid velocity. This leads to the formation
of a large build up of space charge near the metal tip/liquid interface. Figure 5.3 is a
sketch of fluid motion and space charge build up around the electrodes for non-uniform
and uniform field configurations. The surface area of the electrodes is much smaller for
the point/plane case so the inertia of the fluid will carry the charge past the electrode and
will increase the local space charge.
53

Figure 5.3 Sketch of fluid motion for (a) point/plane and (b) plane/plane configurations. (a) space charge builds up around the needle due to high velocity of the liquid and small surface area of the electrodes. (b) fluid flow drives the ions into the electrode.
For the case of uniform fields the apparent mobility is 2*10-3 cm2/V*s, which is
33% higher than the expected EHD mobility, consistent with apparent mobilities
collected by McCluskey et al. [12] for various liquids. Figure 5.4 is a graph of the
Fowler-Nordheim plot for uniform field, plane/plane geometry. Since the apparent
mobility is greater than the EHD upper limit then other factors contribute to the mobility.
The presence of particles in the oil enhances the mobility either by increasing the number
of charge carriers or by altering the local field. Other charge carriers such as electrons or
holes in the liquid could contribute to the mobility. The third stage, space charge
saturation, is not present in this case. Since the field is uniform the magnitude of the fluid
velocity at the electrodes is much less than for the non-uniform field, therefore, the liquid
velocity is smaller hence the apparent mobility is less. Space charge saturation is not a
requirement for transformer oil breakdown.
54

Figure 5.4 Fowler-Nordheim plot of uniform field case for 2 successive tests. Plane/Plane geometry. Gap = 1.55 mm.
5.2.2 Stage 1
Ion mobility without the enhancement of liquid motion is significantly smaller
than EHD mobility. The mobility rates of ions are estimated to range from 1.2*10-4 to
1.0*10-3 cm2/V*s for typical liquids [21]. The low field region of stage 1 is initially
expected to have similar mobilities. Mirza et al. showed that even in uniform fields with
currents of less than 10-10 A, liquid motion is induced in hexane, with the fluid and
charger carriers having comparable velocities [46]. Ions formed in the liquid from
electron attachment or field ionization will drift in the applied field adding to the apparent
55
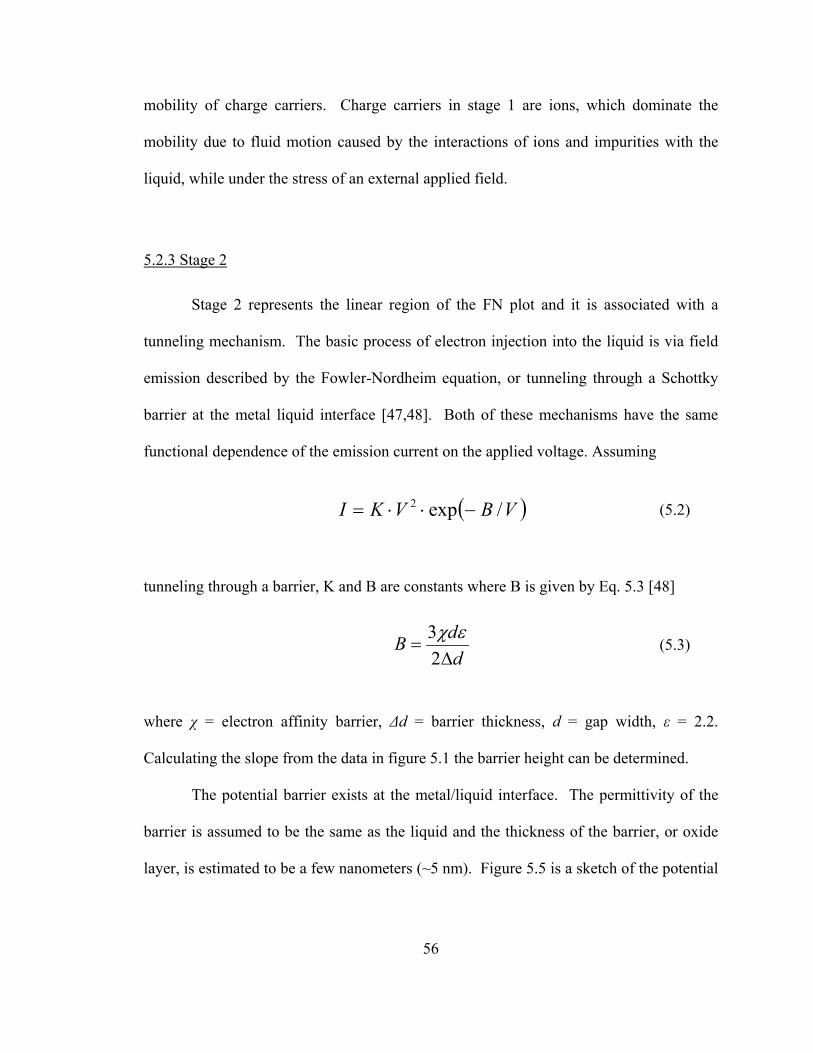
mobility of charge carriers. Charge carriers in stage 1 are ions, which dominate the
mobility due to fluid motion caused by the interactions of ions and impurities with the
liquid, while under the stress of an external applied field.
5.2.3 Stage 2
Stage 2 represents the linear region of the FN plot and it is associated with a
tunneling mechanism. The basic process of electron injection into the liquid is via field
emission described by the Fowler-Nordheim equation, or tunneling through a Schottky
barrier at the metal liquid interface [47,48]. Both of these mechanisms have the same
functional dependence of the emission current on the applied voltage. Assuming
( )VBVKI /exp2 −⋅⋅= (5.2)
tunneling through a barrier, K and B are constants where B is given by Eq. 5.3 [48]
ddB∆
=23 εχ
(5.3)
where χ = electron affinity barrier, ∆d = barrier thickness, d = gap width, ε = 2.2.
Calculating the slope from the data in figure 5.1 the barrier height can be determined.
The potential barrier exists at the metal/liquid interface. The permittivity of the
barrier is assumed to be the same as the liquid and the thickness of the barrier, or oxide
layer, is estimated to be a few nanometers (~5 nm). Figure 5.5 is a sketch of the potential
56
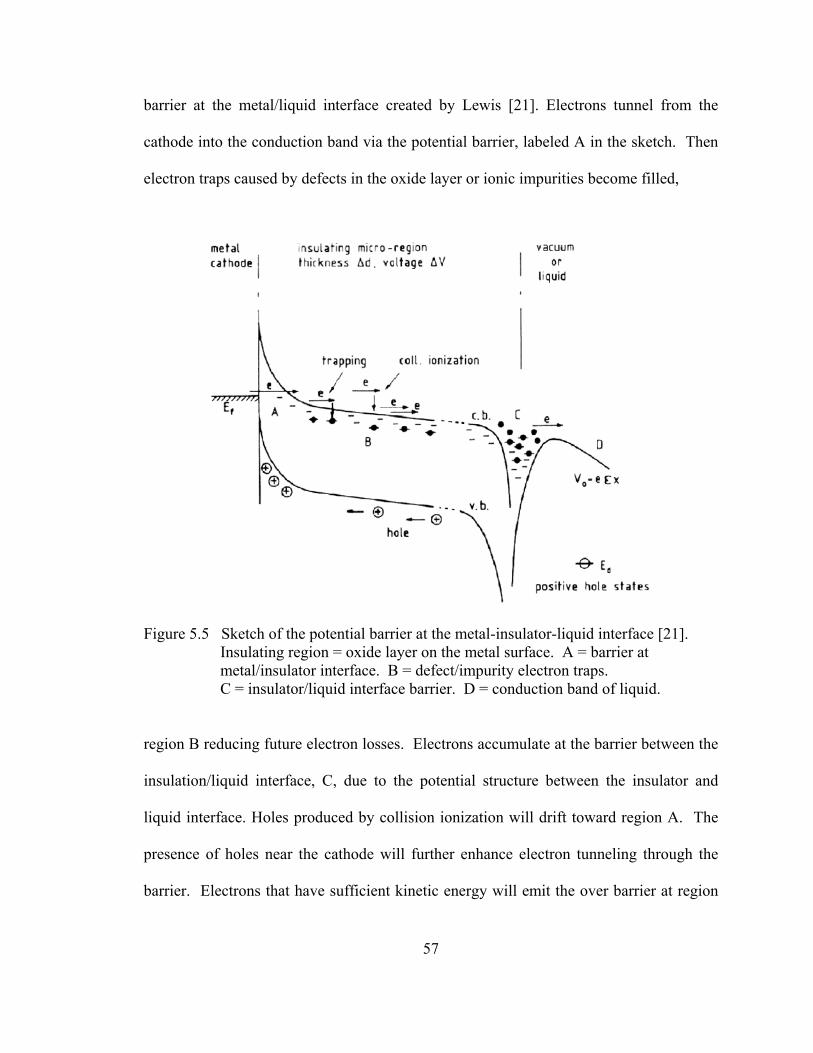
barrier at the metal/liquid interface created by Lewis [21]. Electrons tunnel from the
cathode into the conduction band via the potential barrier, labeled A in the sketch. Then
electron traps caused by defects in the oxide layer or ionic impurities become filled,
Figure 5.5 Sketch of the potential barrier at the metal-insulator-liquid interface [21]. Insulating region = oxide layer on the metal surface. A = barrier at metal/insulator interface. B = defect/impurity electron traps. C = insulator/liquid interface barrier. D = conduction band of liquid.
region B reducing future electron losses. Electrons accumulate at the barrier between the
insulation/liquid interface, C, due to the potential structure between the insulator and
liquid interface. Holes produced by collision ionization will drift toward region A. The
presence of holes near the cathode will further enhance electron tunneling through the
barrier. Electrons that have sufficient kinetic energy will emit the over barrier at region
57

C, and into the conduction band of the liquid, region D. Finally, hole states in the liquid
will drift towards the interface and tunnel into the valence band of the insulator further
contributing to the emission process.
Using the above equations and the slopes from fig 5.1 then the barrier heights for
the negative and positive polarities are calculated as 0.30 eV and 0.39 eV respectively.
Similar values are determined for each of the electrode materials. These values are
smaller than estimated values of (2 to 3 eV) found for similar processes described by
Lewis [21], which is explained by the much larger 100 nm barrier thickness used in those
calculations compared to a few nanometers used in this paper. Table 5.1 lists the
calculated barrier height values determined for each geometry and material tested. The
table indicates that there is a clear difference in the barrier as a function of polarity.
Similar low barrier heights measured above have been observed in studies of
charge injection in solids [49-51]. Typically, low barriers, of a few tenths of an eV, are
caused by the accumulation of space charge around the electrode interface. Without the
accumulation of space charge the barrier heights would be much larger and determined
by the difference in the Fermi levels for the materials. The build up of charge near the
electrode is analogous to doping in semiconductors. Deep traps or defects in the
interfacial (oxide) layer at the surface of the electrode allow charge to be injected directly
into the traps. The escape probability for charge from the traps is low, therefore the
charge remains near the electrode for a significant period of time, before the applied field
can remove the charge, increasing the local space charge density. The build up of a large
58

space charge leads to band bending and reduces the barrier height as observed in
fig. 5.5 (A).
Table 5-1 Barrier calculations for various geometries and materials.
Polarity Pt/PlaneW/Cu
Pin/Plane Cu/Cu
Pin/PlaneSS/SS
Plane/Plane Cu/Cu
Neg. 0.30 eV 0.22 eV 0.20 eV 0.35 eV Pos. 0.39 eV 0.43 eV 0.41 eV 0.35 eV
An important feature seen from these data is that the anode barrier is always
larger than the cathode barrier except for the uniform field case where anode and cathode
geometry are identical. The polarity effect shows a difference in the mechanism of
conduction. The data also suggests that if all conditions are equal the anode
characteristics control the mechanisms. Negative polarity leads to electrons tunneling
from the metal through the barrier into the liquid. The metal has an abundance of
electrons available for tunneling that will be able to transition across the barrier into the
liquid.
The barrier for the positive case is very different and was discussed by Lewis
[21]. The charge carriers are holes, which are generated by electrons tunneling from the
valence band of the liquid through the barrier. The process requires the electron density
near the anode to be capable of providing the magnitude of tunneling current. This
generates holes on the liquid side of the barrier that will move readily into the liquid.
Since the mobility of holes is significantly less than that of electrons a build up of
positive space charge around the anode occurs. A net positive space charge will diminish
59

the local applied field by reducing the local field enhancement factor, diminishing the
effect of the applied field. The effectiveness of the process depends upon the arrival of
electrons from either the cathode or the liquid at the interface layer between the liquid
and the metal.
Identifying the transition point between resistive current and tunneling current
flow is important to the final model of conduction. The application of the electric field
alters the barrier shape. The critical point where tunneling begins is a function of the
applied field. The tests with used oil, gap resistance of ~1012 Ω, indicate that a voltage of
3 kV lowers the barrier to the point where tunneling into the liquid becomes the dominant
conduction method for the point/plane geometry, 10 mm gap. Similar results for the
pin/plane (8 kV, d = 2.5 mm) and plane/plane (7 kV d = 1.55 mm) results were observed.
The applied voltage for the uniform case is higher since there is no geometrical field
enhancement only enhancement due to micro-protrusions on the surface of the electrodes.
The critical local field is around 100 kV/cm for the initiation of tunneling for uniform
fields. At the transition point the current rises rapidly from a few nanoamps to hundreds
of nA before breakdown.
5.2.4 Model of Conduction Current
A simple model of the first two stages can be generated using the parameters
obtained from the experiment. The measured and calculated current data for the
point/plane configuration is shown in figure 5.6. The curve matches the data through
60

Figure 5.6 Simulation of resistive and tunneling model of conduction current, solid line: experiment, dotted line: calculated. Stage I resistive. Stage II tunneling. Stage III space charge saturation.
stages 1 and 2 fairly well. Although the match at the first transition point is higher than
the measured value the calculation is still reasonable. Using equations (5.2) & (5.3) with
values from Tables 5-1 and 5-2 for barrier height, field enhancement factor, and gap
resistance for each geometry the Schottky barrier model is capable of explaining the
results. The total current in the simulation is the sum of the currents from stage 1 and
stage 2. The field enhancement factor, β, was determined using field simulations or
estimates of surface roughness.
61

Table 5-2 Field enhancement and gap resistance for simulating current.
Parameter Pt/Plane Pin/Plane Pin/Plane Plane/Plane β 216 10 10 3-5 R 9*1012Ω 5*1013Ω 9*1013Ω 2*1012Ω
Gap 10 mm 2.5 mm 5.0 mm 1.55 mm
5.3 Temperature and Pressure Effects
Investigating the dynamics of conduction in transformer oil requires altering
parameters that are expected to have an effect. Variations in the hydrostatic pressure and
local temperature provide more information about how charge flows prior to conduction.
Several mechanisms affect the conduction process such as field emission, EHD motion,
liquid viscosity, field ionization, temperature and pressure. Changing the viscosity of the
liquid by altering the temperature and pressure supports our model of conduction.
5.3.1 Pressure Effects
Previous research on conduction and breakdown [5] showed that for small gaps
the effect of reducing the pressure had little effect down to 300 torr. Figures 5.7 and 5.8
are graphs of the I-V characteristics as a function of applied pressure for a cathode and
anode point/plane gaps respectively. The data indicates that there is not a measurable
pressure dependence on the conduction mechanism in transformer oil. It indicates that all
the conduction occurs in the liquid state prior to breakdown.
62

Figure 5.7 Graph of IV characteristics for varying hydrostatic pressure. Point/plane geometry. Negative polarity.
Figure 5.8 Graph of IV characteristics for varying hydrostatic pressure. Point/plane geometry. Positive polarity.
63

5.3.2 Temperature Effects
Reducing the temperature of the oil affects the viscosity of the oil strongly. Since
the velocity of the liquid is proportional to the applied field, changing the velocity of the
liquid affects the apparent mobility and hence the space charge saturation for the
point/plane geometry. At room temperature the fluid velocity prior to breakdown ranges
from 10 to 40 cm/s. Cooling the oil increasing its viscosity compared to the room
temperature, reduces the maximum velocity of the oil by a comparable amount. At the
lowest temperature, 245 K, Univolt 61 is almost solid. Figure 5.9 and 5.10 are graphs of
the I-V characteristics as a function of temperature for point/plane geometry for negative
and positive polarity. The peak conduction current prior to breakdown is reduced from
around 1.0 µA at 300 K to about 100 nA at 245 K, caused by changes in the carrier
mobility. Figure 5.11 and 5.12 are FN plots of the temperature data for negative and
positive polarities. The reduced current due to the temperature change shifts the plot
down but maintains the shape and transition points for stages 1 and 2.
64

Figure 5.9 I-V curves for varying temperature. Negative polarity. Point/plane geometry. Gap = 10 mm.
Figure 5.10 I-V curves for varying temperature. Positive polarity. Point/plane geometry. Gap = 10 mm.
65

Figure 5.11 Fowler-Nordheim plot of maximum and minimum temperature curves for the point/plane geometry. Negative polarity.
Figure 5.12 Fowler-Nordheim plot of maximum and minimum temperature curves for the point/plane geometry. Positive polarity.
66

The space charge saturation region is no longer observable which supports a fluid
velocity effect. Increasing the viscosity does not alter the mechanisms of conduction in
stages 1 or 2. The resistivity of the oil increases with lower temperatures since the
ion/particle mobility is controlled by the fluid motion. Tunneling initiates at the same
field amplitudes for both temperatures since the charge carriers traversing the potential
barrier does not appear to be a strong function of the temperature. The space charge
saturation region changes because the enhanced motion of the oil is no longer present at
reduced temperature. These effects are consistent with all three stages of the conduction
model, and provide experimental support of the model of conduction.
The barrier heights for temperature and pressure data is displayed in Table 5-3 for
point/plane geometry. The data in the table indicates that the barrier height is
approximately constant, within the error, for each polarity and therefore the tunneling
mechanism is little affected by the change in temperature or pressure.
Table 5-3 Barrier calculation for varying pressure and temperature point/plane geometry.
Polarity NTP
680 torr 300 K
Pressure 0.70 torr
300K
Temperature 680 torr 240 K
Neg. 0.30 eV 0.26 eV 0.29 eV Pos. 0.39 eV 0.41 eV 0.45 eV
An investigation of the three stages of conduction and the identification of the
mechanisms involved has been achieved. Conduction begins with the low mobility
resistive region where the conductivity of the liquid controls the current. At the critical
field tunneling begins from the metal/insulator interface through the potential barrier of
67

the oxide layer. The barrier height is usually a few tenths of an eV. Space charge
saturation occurs in the high field region near final breakdown. Reducing the fluid motion
by lowering the temperature reduces the space charge effect observed for point/plane
geometry.
5.4 Breakdown Mechanism
Data collection for the conduction current as a function of pressure indicates that
the breakdown voltage for the cathode initiated case is strongly pressure dependent. In
previous research, most experiments were performed at atmosphere or much higher
applied pressures [9,11,20,28-30]. In these cases weak pressure dependence is observed
since the bubbles formed will be smaller than at reduced pressure. With the assumption
of a gas phase required for breakdown the next step is to emphasize the gas phase by
reducing the applied pressure. This has the advantage of being easy to accomplish while
simultaneously varying the pressure by several orders of magnitude.
5.4.1 Cathode Initiated
The first step in quantifying the pressure effect was to determine the breakdown
voltage for both cathode and anode initiated breakdown as a function of applied
hydrostatic pressure. Figure 5.13 shows the breakdown voltage versus pressure for
point/plane geometry. The breakdown voltage at 100 mtorr is 50% less than at
atmosphere. Typical waveforms for negative polarity show multiple current pulses prior
68

to final breakdown [27,52]. Each pulse is capable of producing a bubble and
shadowgraph images and current waveforms confirm the correlation between number of
bubbles and number of current pulses.
Images of the pre-breakdown current pulse show that a partial discharge precedes
the formation of a low density/bubble region in front of the electrode. The mechanism of
formation is most likely due to the rapid injection of electrons into the liquid. The rapid
injection of electrons causes the temperature of the liquid to rise because the energy
excites the molecules of the oil. The energy injection is sufficient to cause a phase
Figure 5.13 Breakdown vs. pressure curves for positive and negative polarity. Point/plane geometry. Gap=2.5mm. Open symbols = pos. Closed symbols = neg.
69
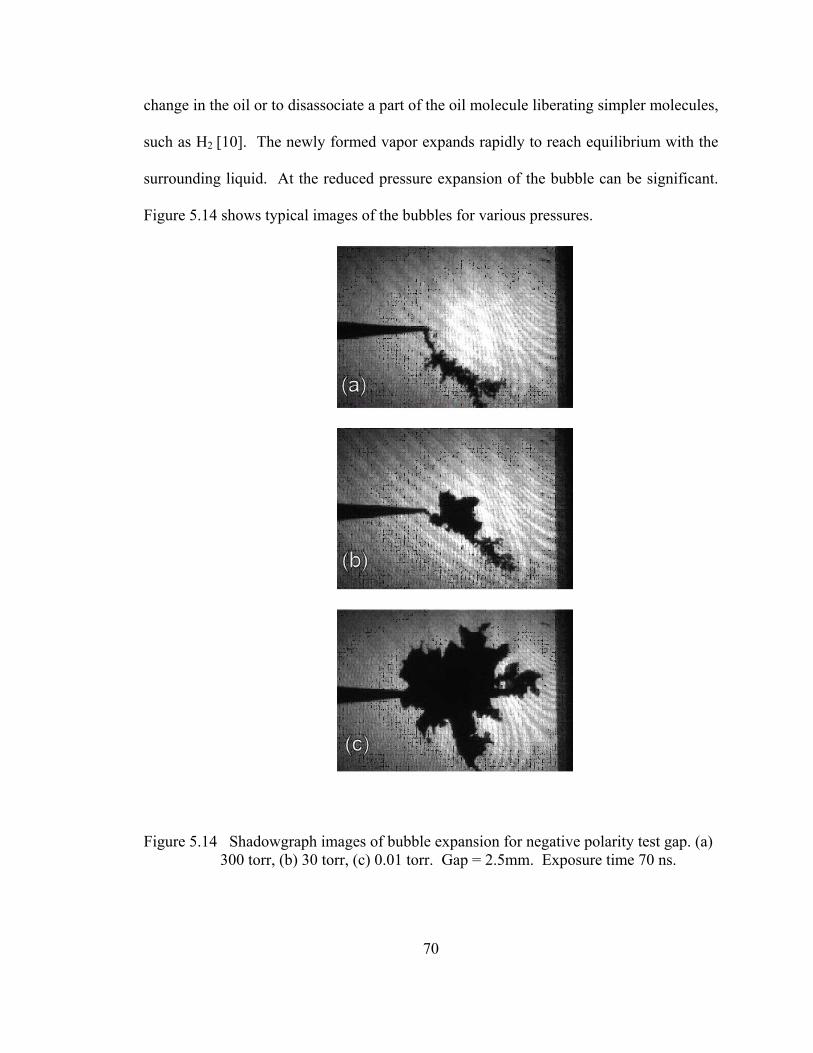
change in the oil or to disassociate a part of the oil molecule liberating simpler molecules,
such as H2 [10]. The newly formed vapor expands rapidly to reach equilibrium with the
surrounding liquid. At the reduced pressure expansion of the bubble can be significant.
Figure 5.14 shows typical images of the bubbles for various pressures.
Figure 5.14 Shadowgraph images of bubble expansion for negative polarity test gap. (a) 300 torr, (b) 30 torr, (c) 0.01 torr. Gap = 2.5mm. Exposure time 70 ns.
70

The high pressure image shows a chain like structure as predicted from a chain of current
pulses.
Investigations of the pressure dependence show several important facts about the
mechanisms. Self-breakdown at low pressures reveals that single pre-breakdown events
occur up to milliseconds before final breakdown. This means that a large partial
discharge or PD will generate a bubble that fills most of the gap. Assuming the bubble
obeys the ideal gas law then a decrease in the pressure corresponds to an increase in the
volume. Bubbles can expand from a few micrometers to millimeters at reduced pressure.
Bubble lifetime is very long at low pressures and can be estimated using the classical
Rayleigh model for bubble generation and collapse [53]. The Rayleigh lifetime, t, is
given by Eq. (5.4), where Rm is the maximum bubble radius, ρ = liquid density, p =
applied hydrostatic pressure [53,54]. Typical lifetimes for a bubble at 680 torr are a few
micro-seconds and it increases to milliseconds at 0.01 torr with a maximum bubble radius
of about 1 mm. Figures 5.15 and 5.16 are graphs of the bubble lifetime for a fixed
pressure or bubble radius determined using Eq. (5.4). The area between the solid and
dashed lines is the area of interest for bubble lifetime as a function of pressure.
pRt m
ρ⋅⋅⋅= )915.0(2 (5.4)
The breakdown mechanism for negative polarity is gaseous in nature given the pressure
dependence and images discussed here. A vapor bubble or series of bubbles bridge the
gap between cathode and anode allowing for the development of a gas phase breakdown,
71

which occurs at voltages lower than breakdown of the liquid. At 100 mtorr, a bubble is
formed in front of the needle tip associated with a current pulse. Then the next current
pulse injects charge carriers into the bubble and initiates current amplification and
breakdown through electron impact ionization. Images of final breakdown as shown in
figure 5.17 show the bubble becoming fully luminous with increasing intensity closer to
the anode, which is characteristic of breakdown in gas.
Figure 5.15 Graph of bubble lifetime (µs) vs. applied pressure (torr) for a fixed bubble radius. Solid line = 10 µm radius. Dashed line = 500 µm radius. Region between curves is typical experimental range of bubble dimensions.
72

Figure 5.16 Graph of bubble lifetime (µs) vs. bubble radius (µm) for a fixed hydrostatic pressure. Solid line = 0.01 torr. Dashed line = 680 torr. Region between curves is the range of experimental area.
Figure 5.17 Shadowgraphy image of cathode initiated breakdown with self-luminosity due electron impact ionization. Pressure = 0.01 torr. Visible shock wave from arc.
73

5.4.2 Anode Initiated
In the case of anode initiated breakdown current pulses are not present in the
waveform. Instead a slow rising current over ten’s to hundred’s of nanoseconds leads to
breakdown [27,52]. The rise in current does not inject high energy particles into the
liquid so there is not a phase change in the oil. The breakdown voltage is about 10%
lower at 100 mtorr than at atmosphere. Images of positive breakdown in oil show thin,
branch like structures emanating from the anode tip. These filamentary “streamer like”
structures show no expansion at reduced pressure. Figure 5.18 is a typical image of
positive pre-breakdown at reduced pressure, which indicates no expansion of the
channels. The data supports a process triggered by a build up of charge in the liquid.
Positive ions or holes are the likely charge carrier and will tend to form channels of
charge through the liquid. These channels have a higher conductivity than the rest of the
oil and the local space charge field will field ionize the local molecules. This process
will increase the length and width of the channel and build up the streamer-like channel.
Finally, the process will become self-sustaining and breakdown through the liquid can
occur. The measured current will rise as the process continues as measured for positive
breakdown data.
74

Figure 5.18 Shadowgraphy image of positive pre-breakdown at reduced hydrostatic pressure. Pressure = 0.01 torr,
5.5 Pre-Breakdown Current and Luminosity
5.5.1 Current Pulses and Luminosity
The measurement of current and luminosity during pre-breakdown events can be
used to characterize the breakdown process. Tests in transformer oil use the same
methods and apparatus as in the liquid nitrogen tests. However, the test gap for
luminosity studies of pre-breakdown in oil is 1 cm, which maximizes use of the lens
holder shown in figure 3.8. The PMT’s, through the cylindrical lenses, focus on the
needle tip, center of the gap, and the plane on the far side of the gap. A graph of typical
luminosity data for transformer oil is shown in figure 5.19. The results are similar to
liquid nitrogen. The current pulses correlate directly with the luminosity and prove that
the pulses excite the local area enough to generate visible light, at low levels. The data
also shows dual characteristics of anode and cathode breakdown development. The
75

current begins to ramp more than 1 µs before breakdown and then large amplitude current
spikes occur.
Figure 5.19 Current and luminosity data for Univolt 61 transformer oil. Decaying current pulses are cable reflections. Luminosity and current spikes show direct correlation. Positive point/plane. Gap = 10 mm.
Measurements of partial discharges are common in liquid breakdown [8,9,11,12,
17,18,52] and are proposed as trigger mechanisms for final breakdown. In the case of
non-uniform cathode initiated events the pre-breakdown current pulses and partial
discharges are believed to be the catalyst for bubble formation. Each pulse injects a
significant amount, 109 to 1010 charged particles per pulse, of “hot” electrons into the
liquid. The definition of “hot” electrons is particles with energy in excess of the thermal
energy for the given temperature of the liquid or gas. These “hot” particles once injected
76

into the liquid cause localized heating of the liquid, which leads to the formation of a
small bubble.
5.5.2 Bubble Formation and Energy Injection
A key component to the bubble theory of liquid breakdown is a mechanism of
bubble formation. The methods of creating bubbles in liquid dielectrics are an area of
interest for researchers in liquid breakdown. A variety of methods have been discussed
in the literature including mechanical fracturing of the liquid (vacuole) [22], cavitation
caused by liquid turbulence near the needle or direct thermal generation (energy of
vaporization). The main method discussed in this research is thermal generation by rapid
energy injection. The first step is to determine the amount of energy needed to form a
bubble of a certain size. Then a comparison to the amount of energy injected into the
liquid.
An estimation of the energy required to form a bubble simply requires knowledge
of the physical properties of the liquid. The liquid temperature must be raised to the
vaporization point and then enough energy to vaporize the liquid to form a gas.
Equations (5.5) and (5.6) address the energy requirements for heating and vaporization of
transformer oil, respectively. Using the following equations to calculate the energy to
create a bubble 10 µm in diameter yields values of a 1.5 µJ to heat the oil and 73 nJ to
vaporize the oil in that volume. The limiting factor is the energy to heat the liquid since
the vaporization energy is so low. Next, determine the amount of energy required per
molecule to heat an individual molecule to the vapor point. The molecular weight of
77

Univolt 61 transformer oil is 245 g/mole, using the oil properties the energy per molecule
was determined to be 8 eV. Assuming the number of particles injected into the oil at the
needle tip to be 1010 and an applied field of 109 V/m acting over a distance of the bubble
diameter then the total energy injected is 6 µJ. Therefore the energy to generate a bubble
of several microns in diameter is larger than the minimum energy of formation. Fast
energy injection into a local area will produce a bubble.
TCV vbuboilheat ∆⋅⋅⋅= ρξ (5.5)
ξheat = Energy to heat liquid [J] ρoil = 894 kg/m3
Vbub = Volume of bubble [m3] Cv = 9630 J/kg·K ∆T = 325 K
vapbuboilvap V ∆Η⋅⋅= ρξ (5.6)
ξvap = Energy to vaporize oil [J] ρoil = 894 kg/m3
Vbub = Volume of bubble [m3] ∆HVap = 156 kJ/kg
The rate of injection is equally important to the formation of a bubble in the
liquid. The injection must be fast, tens of nanoseconds or less, in order to generate a
bubble as seen from experiment. Thermal conduction through the liquid is a slow
process and requires milliseconds for the energy to diffuse away from the formation
region. However, the large applied field generates liquid movement, or electro-
convection, which diffuses the injected energy throughout the system much faster. The
78

data indicates that the rate of injection is the difference between positive and negative
characteristics.
5.5.3 Electrostriction
Another characteristic investigated is also linked to fluid motion caused by non-
uniform electric fields. Electrostriction is caused by the application of non-uniform fields
on liquid dielectrics [55]. Non-uniform fields in the vicinity of the sharp needle tip are
very high, in excess of 109 V/m. These fields will separate the charge on the molecule
polarizing the molecules near the tip producing a dipole. Since the field is highly non-
uniform the forces on the dipole are not balanced and it experiences a force pulling it
toward the electrode compressing the liquid. The compression can exceed the
solidification pressure for the liquid if the field is high enough. The solidification
pressure for transformer oil is around 2500 bar. The electrostrictive pressure can be
calculated using equation (5.7). A graph of the electrostrictive pressure for transformer
[ ][ ] 205 216
10 Ep rres ⋅+−⋅⋅=∆ − εεε (5.7)
∆pes = Electrostrictive pressure [atm] ε0 = 8.85*10-12 F/m εr = εoil = 2.2 E = Electric field [V/m]
oil is plotted in figure 5.20. Using the above equation and the values for transformer oil
and the applied field near breakdown for the point/plane geometry yields a pressure of
130 atm at the tip of the electrode. If the electrode tip is sub-micron then the pressure can
79

exceed the solidification pressure and the mechanisms of charge injection and conduction
may change due to alterations of the interfacial layer at the electrode.
Figure 5.20 Graphs of electrostrictive pressure for Univolt 61 transformer oil.
5.5.4 Current Characteristics
The current characteristics leading to final breakdown are different for positive
and negative polarity and non-uniform field geometries. Figure 5.21 and 5.22 are graphs
of the typical current waveforms for both positive and negative breakdown using
point/plane geometry. The graphs show that negative polarity breakdown consists of a
series of partial discharges or pre-breakdown current pulses. These pulses may occur
several microseconds or more before breakdown, similar to liquid nitrogen. Positive
80

Figure 5.21 Graphs of typical current waveforms for positive breakdown. Point/plane. Gap = 2.5 mm. Slow rate of current injection. 0.01 A, 1.5 µs ramp.
Figure 5.22 Graphs of typical current waveforms for negative breakdown. Point/plane. Gap = 2.5 mm. Fast rise of injection current. 1.0 A peak, 2-4 ns FWHM.
81

polarity has different characteristics. Positive breakdown typically consists of a steady
rise in current without large amplitude spikes prior to breakdown. The rise occurs from
10’s to 100’s of nanoseconds prior to breakdown. These unique characteristics are the
first clues that the mechanisms of breakdown must be different for each polarity.
Current pulses, negative polarity, prior to breakdown have amplitudes of
approximately 0.1-0.5A and usually are 5-10ns in duration for a 10 mm gap. For smaller
gaps the current spikes are usually larger and shorter in duration. The charge injected
with each of these pulses is of the order 5-25 nC per pulse, ~1010 electrons per pulse. The
“slow rising” current associated with positive breakdown reaches an amplitude of 10-
30 mA over 1-1.5 µs, which represents a total charge injection of about 10 nC. However,
comparing similar time scales, such as 1 µs prior to breakdown and integrating the
current for both cases the numbers are very similar, 10’s of nano-coulombs. The data
suggests that breakdown at atmospheric pressure, requires a critical charge injection into
the gap to initiate breakdown in the microseconds immediately before final breakdown. A
critical density is required for the establishment of a self-sustaining discharge. Further
investigation into establishing boundaries for the critical density is required. The
mechanisms for delivering the charge are different for each polarity. The current injected
in the pulses or ramp prior to breakdown is sufficient to trigger the final breakdown
event. The injection of large amounts of charge carriers over a small time frame
significantly increases the local charge and in the case of injection into a “bubble” this
will trigger an electron avalanche under favorable conditions.
82

Assuming a Townsend mechanism for the development of the gas discharge in the
bubble, the gas amplification factor, αd, can be estimated using data from the current
waveforms. Using the initial current from the pre-breakdown events that then develops
into the breakdown current of several hundred amps, yields a value of αd ≈ 7-9 for typical
breakdown current development in transformer oil. The values from this crude
comparison are in same order with data for breakdown in gases such as H2, N2, or air
[56]. The exact composition, pressure, and temperature of the gas in the bubble have not
been determined therefore comparisons to specific gases is a large assumption, however
the values are not unreasonable given the crude comparison. Also this neglects any
secondary feedback mechanisms that could change the values significantly.
83

CHAPTER VI
SIMILARITIES BETWEEN UNIVOLT 61 AND LIQUID NITROGEN
Two very different liquids were investigated in the research for this dissertation.
An investigation into the conduction and breakdown properties of liquid nitrogen, a pure
liquid was performed because of its simple composition and its cryogenic properties.
Then an investigation into transformer oil, arguably the most common dielectric liquid,
was initiated to quantify the breakdown and conduction mechanism and how they relate
to each other. Transformer oil is a very large complex molecule with more than 20 atoms
in a single molecule. Physical similarities between the two liquids is limited, therefore
any link in the breakdown characteristics would be significant to the development of a
working model for liquid breakdown. An area of interest to many researchers in
dielectrics is to establish a comprehensive model for liquid breakdown, similar to models
for gases decades earlier. This chapter will discuss the similarities between liquid
nitrogen and transformer oil and how they relate to an overall model of liquid conduction
and breakdown.
6.1 Conduction Mechanisms
6.1.1 Liquid Nitrogen
Attempts to measure conduction current for liquid nitrogen proved to be difficult.
It was not possible to reliably measure the conduction current for LN2 because of
characteristics of the liquid, non-polar, low polarizability, low conductivity and a large
84

test gap. Other researchers had difficulties measuring leakage current in nitrogen because
the currents were so small [41,57]. The low level current in liquid nitrogen for fields of a
few kV/cm generates currents around 10-13 A [57]. These currents are below the
measurable level for the experimental apparatus at this time. For the case of transformer
oil, it was very easy to measure leakage current while varying several parameters, such as
gap size, electrode materials, field geometries, temperature and pressure. Oil is non-polar
but since it is such a large molecule it is easy to polarize in an applied field and has a high
probability for electron attachment producing a negative ion.
6.1.2 Univolt 61
The general case for conduction in transformer oil has two phases sometimes
three as discussed in detail in the previous chapter. Stage 1 is a resistive phase followed
by a tunneling phase that begins at a critical field and continues until reaching a space
charge saturation region. The mobility of the oil was determined to be 2.9*10-3 cm2/V*s
from experimental data as discussed in detail in Chapter V. The mobility of LN2 was
found to be about 8±4*10-3 cm2/V*s in the space charge saturation region with non-
uniform geometry by Halper & Gomer [41], which is larger than nitrogen’s predicted
EHD mobility of 1.2*10-3 cm2/V*s for uniform fields. Doake and Gribbon [57]
determined the apparent mobility of LN2 to be much lower, 9.6*10-4 cm2/V*s for the
region of low fields <2 kV/cm. For low field conditions the mobility is very close to the
EHD mobility but much higher than typical ion mobilities in liquids. This suggests that
charge carrier mobility is dominated by EHD motion just as it is in transformer oil.
85

The differences in the mobility near the space charge saturation region could be
caused by particles in the liquid, which could increase the number of charge carriers as
the particles, become charged or lead to field ionization of the liquid. The similarity
between calculated carrier mobilities and predicted EHD mobilities was mirrored in the
results found for transformer oil discussed in detail in the previous chapter. The data
presented here is insufficient to link the conduction mechanisms for oil and LN2 directly.
The similar characteristics suggest that at low fields (resistive region) the mechanism of
carrier transport is the same. Identifying the conduction mechanisms in nitrogen will
provide a more complete image of the conduction processes in liquid dielectrics.
6.2 Pre-breakdown Current and Breakdown
There are several similarities between the pre-breakdown events for both liquids.
The existence of pre-breakdown spikes for negative polarity current is common to both
liquids. The current pulses produce luminous events for both cases. The luminosity
shows that light is emitted from the current spikes with direct correlation between current
pulse and luminosity. Since it was not possible to take shadowgraphy images of the pre-
breakdown events in nitrogen it was not possible to compare the observed structure of the
events for DC breakdown of LN2 and Univolt 61. More emphasis was placed on the
electrical and luminosity characteristics to provide insight into the breakdown process.
86

6.2.1 Cathode Initiation
In the case of cathode initiation events, partial discharges in nitrogen can occur
several microseconds or more prior to the final breakdown of the liquid without any other
events occurring before breakdown, see figure 4.2. This is very similar to the current
pulses seen for oil at reduced pressure. The tests in oil at reduced pressure show that a
single, partial discharge would create a large bubble several microseconds or even
milliseconds before the final breakdown event. This bubble would expand to fill most of
the gap and could lead to the breakdown of the gap.
For cathode initiated breakdown, the development begins within the gas phase for
transformer oil. In the case of nitrogen the energy injected by the pulses must be
sufficient to heat the liquid to the phase transition temperature, which is only a change of
a few of degrees for liquid nitrogen at 70K. The energy required to create a 10 µm
bubble in nitrogen is approximately 120 nJ compared to 1.6 µJ in oil. The expansion of
the bubble is controlled by the properties of the liquid and the hydrostatic pressure. The
volume of gas and the interfacial tension of the liquid determine ultimate bubble size.
For nitrogen the energy to cause a phase change is significantly less, almost an order of
magnitude smaller than for transformer oil, therefore less energy is required per pulse to
produce the same effect. Typical pulses measured in liquid nitrogen are smaller than in
oil. Since the amplitude of the current pulses are significantly less than the ones for oil,
compare figures 4.3 and 4.4, the idea of less energy for similar results is supported.
The energy requirements for vaporization of transformer oil at room temperature
are significantly higher than the energy for liquid nitrogen. The average energy per
87
molecule needed for oil is approximately 8 eV compared to about 60 meV for liquid
nitrogen. These values give some perspective as to how easy it is to create a bubble or
gas phase in nitrogen compared to transformer oil, hence the duality of positive/negative
characteristics observed in nitrogen tests. If the applied hydrostatic pressure is increased
for nitrogen then bubble formation is reduced and it behaves more like transformer oil at
atmospheric pressure.
6.2.2 Shadowgraphy
Images of the breakdown in transformer oil are very descriptive of the events that
are transpiring in the liquids. They also match well with shadowgraphy images in liquid
nitrogen taken by Frayssines et al. as shown in figure 6.1 [38]. For both liquid nitrogen
and transformer oil negative breakdown images are “bushy” and appear to be gaseous in
nature. Positive events have a thin “streamer-like” filamentary structure. In liquid
nitrogen, due to the pulse characteristics observed for positive breakdown it does show a
probability of positive streamers appearing “bushy” similar to negative events.
Characteristics of both anode and cathode breakdown are observed in transformer oil as
88

(a) (b)
Figure 6.1 Images of negative and positive breakdown characteristics in liquid nitrogen. (a) negative “bush-like” streamer, 0.5 MPa. (b) positive filamentary streamer, 0.5 MPa. [38]
well as in liquid nitrogen for certain experimental conditions. Figure 6.2 is a series of
images taken in transformer oil for positive point/plane geometry. The images were
takenat reduced hydrostatic pressure of approximately 30 torr. At this pressure expansion
of the negative streamers begins to be significant in the images. The images show that
there are two possibilities for combining anode/cathode characteristics in oil. The first
case a positive “streamer” is present and a large current pulse occurs during the
development producing a “bubble” at the electrode tip at the same time. Images (a), (b),
and (c) are typical of this type of development. The second case a large current pulse
produces a “bubble” at the electrode tip, which is followed by the typical rise of current
for a positive event. The positive “streamers” form at the edge of the bubble instead of
the electrode tip. These are very unusual cases and occurred infrequently during regular
tests of breakdown versus pressure for transformer oil. These images also support the
89

requirement for bubble formation that a rapid energy injection process is required,
usually associated with electron injection (negative needle).
(a)
(b)
(c)
(d)
Figure 6.2 Images of negative and positive breakdown characteristics in transformer oil at 30 torr. (a) and (b) small negative current spike after current rise. (c) large negative current spike after current rise. (d) large negative current spike before current rise with a self-luminous breakdown. Positive needle.
90

Image (d) captures a very rare event. It clearly shows the development of
breakdown for the positive needle with a bubble at the tip. The bubble does not show any
luminosity even with the large currents that must be flowing through it. The lack of
visible luminosity within the bubble region might be explained by the density differences
between the thin streamer and the low density gaseous region. The luminosity from the
low density region is insufficient to appear self-luminous in the shadowgraphy image.
Since the positive streamers begin at the edge of the bubble it implies that the bubble is
acting like an extension of the electrode, similar to a focusing mechanism for charge
injection. Of all the data collected at 30 torr this is the only image showing all three
events simultaneously.
6.2.3 Liquid Nitrogen/Oil Duality
Shadowgraphy images show that both positive and negative characteristics of
breakdown are visible in transformer oil. They establish a visible connection between the
duality of characteristics observed during tests. Reducing the applied pressure allows the
formation of a vapor bubble and a positive “streamer” event simultaneously. Liquid
nitrogen has similar characteristics at atmospheric pressure that are significantly reduced
when the applied pressure is greater than 10 atmospheres [38]. These images establish a
link between characteristics observed in nitrogen and transformer oil.
The formation of a bubble in liquid nitrogen has been shown to occur very easily
due to the nature of the fluid. The next step was to try and recreate the conditions in
transformer oil for comparison to LN2. A trickle of gas is allowed to flow through the oil
91

gap for tests below 200 torr, no gas is added to tests >200 torr. Figure 6.3 shows the
effect of gas within the gap for positive point/plane geometry. The graph indicates that
the positive breakdown behaves like negative breakdown with the presence of bubbles in
the gap. These tests were performed in the cooling chamber and therefore shadowgraphy
images were not possible to confirm the observed electrical data. This test forces a
gas/liquid combination within the test gap. Since a gaseous component is critical to the
generation of “bushy” structures characteristic of negative breakdown, the results for
positive breakdown voltage resemble previous recorded negative breakdown data. These
Figure 6.3 Graph of breakdown voltage versus applied hydrostatic pressure. Closed symbols = positive polarity. Open symbols = negative polarity. = gas added. = normal test.
92
results are within the measurement error. The data also shows that the addition of gas
does not affect the negative case, since it is already a gaseous event. It should be noted
that the control over the bubble size in this test is minimal; however the bubbles, in
general, were less than the 50% of the gap size as observed through the viewport.
From these data similarities between LN2 and transformer oil indicate the
mechanisms for the development of breakdown are the same. Cathode initiated
breakdown will be gaseous in nature and therefore exhibits a “bushy” structure.
Evidence of a gaseous mechanism for breakdown has been observed throughout. Anode
initiated breakdown has a thin, branchy, filamentary structure, since the development
occurs within the liquid state instead of the gaseous. Both transformer oil and nitrogen
show dual characteristics for given test conditions. These structures are defined by the
fluid properties and energy injection process. There are similar relationships between the
mobilities for both dielectrics in the low field or resistive region, i.e. the EHD mobility is
very close to the measured carrier mobility in this region. The same similarities are
observed in the space charge saturation or high field region for both liquids. The
conduction processes appear to have similar characteristics but more investigation is
required to establish a common theme. There is not a link between the DC conduction
and final breakdown other than the fluid dynamics that are created with application of a
constant field and current conduction through the liquid.
93

CHAPTER VII
CONCLUSIONS
The purpose of this experiment was to investigate the mechanisms, conditions,
and effects of current conduction and liquid breakdown in transformer oil and liquid
nitrogen. The test setup consisted of a fast coaxial system. Two chambers are used, the
first is designed for testing with liquid nitrogen, LN2, or transformer oil at low
temperature and the second is for optical studies of transformer oil at room temperature.
7.1 Conduction
The conduction and breakdown mechanisms in Univolt 61 transformer oil and
liquid nitrogen are studied. Conduction begins with a low current phase, where the
conductivity of the liquid controls the current with the charge carried by ions formed
from electron attachment. Electro-hydrodynamic motion appears to dominate the
mobility of charge carriers. Stage 1 mobilities should be controlled by the ion mobility.
However, fluid motion due to the applied electric field alters the apparent mobility. In
liquid nitrogen the conduction current was not distinguishable from the background
noise. However, comparison with low field mobilities of nitrogen measured by others
showed similar trends in the mobilities as observed for transformer oil.
Stage 2 begins when the local uniform applied field reaches a critical value of
about 100 kV/cm, in transformer oil, and tunneling through a potential barrier at the
metal/insulator interface begins. For the case of a positive barrier a local space charge in
94

front of the anode decreases the local field enhancement. The onset of tunneling through
the potential barrier at the metal/insulator interface and out into the liquid is unaffected
by changes in temperature or pressure.
Space charge saturation, stage 3, occurs in the high field region near final
breakdown where fluid motion enhances the mobility, values of 3*10-3 cm2/V*s were
measured for point/plane geometry. Reduction of the applied hydrostatic pressure has no
effect on the conduction mechanisms. Decreased temperature increases the viscosity and
decreases the liquid velocity, which changes the apparent carrier mobility without
altering the primary conduction mechanisms. Stage 3 is only present at room temperature
for highly non-uniform fields where the fields near the needle tip generate large fluid
velocities increasing the apparent mobility of charge carriers.
The basic mechanisms of conduction in transformer oil were tested for a variety
of test parameters and determined to fit with the proposed methods of conduction.
Bubbles or low density regions have not been observed in the gap during DC conduction
prior to breakdown at reduced pressure. The absence of bubbles indicates that
transformer oil remains a liquid, during the DC conduction phase. The data has not
shown a strong link between conduction and breakdown. A transition from conduction to
an electron amplification process has not been established. The observed changes due to
varying temperature and pressure of the liquid support our model of conduction.
Similarities in the relationship between the mobilities of nitrogen and oil for the resistive
and space charge regions suggest the mechanisms maybe the same but more investigation
is required to establish a common theme.
95

7.2 Breakdown
For cathode initiated breakdown, the onset of pre-breakdown pulses allows the
formation of localized bubbles in the oil, due to highly localized energy injection.
Energy requirements for vaporization of transformer oil are significantly higher than for
liquid nitrogen. The energy of vaporization per molecule for Univolt 61 is approximately
8 eV compared to 60 meV for liquid nitrogen. These values highlight how easy it is to
create a bubble or gas phase in nitrogen compared to transformer oil. Varying the applied
pressure alters the bubble size and lifetime. For the 0.01 torr case the maximum bubble
size is of the order of the gap spacing, 1-2 mm, with a lifetime of milliseconds. After the
bubble has formed the next current pulse injected into it leads to an immediate
breakdown and at a 50% lower voltage than at atmosphere. Cathode initiated breakdown
is gaseous in nature and therefore exhibits a “bushy” expanded structure. Main
breakdown is initiated from within the gas phase, supporting the bubble model or gaseous
mechanism for breakdown.
The case of positive breakdown indicates minimal pressure dependence
correlating to a process that develops within the liquid state. The breakdown voltage at
0.01 torr is about 10% lower than at atmosphere and images of the events indicate no
expansion of the event. Anode initiated breakdown has a thin, branchy, filamentary
structure, since the development occurs within the liquid state instead of the gaseous.
Breakdown initiates from channels of higher conductivity created by holes tunneling
through the liquid, which grow as they develop into a self-sustaining arc across the gap.
96

Both transformer oil and nitrogen have shown dual characteristics for given test
conditions. These characteristics are defined by the fluid properties and energy injection
process. A fast rate of energy injection into the liquid causing a phase change is an
observed characteristic of the bubble/gas model, while an initially slow rising current that
does not produce a bubble in the liquid phase prior to final breakdown supports the
electronic model. Nitrogen at atmospheric pressure has similar characteristics to
transformer oil at reduced pressure. In these cases both liquids are easily influenced by a
small amount of gas formed at the electrode. In oil, a small bubble will expand
significantly leading to breakdown while thermal bubble formation in nitrogen is easy at
atmosphere, increasing the probability of breakdown. If nitrogen is under large
hydrostatic pressure, >10 atm, then bubble size is suppressed and nitrogen displays less
dual characteristics than at atmosphere and is more comparable to transformer oil at
atmosphere. These experiments have linked the breakdown mechanisms for oil and liquid
nitrogen. Both liquids exhibit 3 stages of breakdown. The process begins with current
injection into the liquid via field emission followed by an amplification process in the gas
or liquid phase depending upon the polarity of the needle electrode. Finally, the
formation of a high current arc shorts the test gap.
Future research quantifying the critical charge injection prior to breakdown would
be a valuable asset as well as studies comparing the composition of the vapor bubbles
formed will help understand breakdown development in the gas phase. More research on
various liquids to compare the dual anode/cathode similarities in breakdown observed
here will be important to developing a complete theory of liquid breakdown.
97
REFERENCES
[1] Tobazeon, R., “Charges and discharges of conducting particles in a plane oil gap subjected to a DC voltage” Conference record IEEE 12th International Conference on Conduction and Breakdown in Dielectric Liquids, Roma, Italy 1996, pg 309-312.
[2] Krins, M., Borsi, H., Gockenbach, E., “Influence of carbon particles on the breakdown and partial discharge inception voltage of aged mineral based transformer oil”, IEEE 7th International Conference on Dielectric Materials, Measurements, and Applications, September 23-26, 1996, pg 251-254.
[3] Sheshakamal, J. and Cross, J.D. “The Influence of Impurities on Electrohydrodynamic Motion in Insulating Oils” Proceedings of IEEE Conference on Electrical Insulation and Dielectric Phenomena, October 1989, pg. 338-345.
[4] Swan, D.W. “A recent review of investigation into electrical conduction and breakdown of dielectric liquids,” Brit. J. Appl. Phys. Vol. 13, 1962, pg 208-218.
[5] El-Sulaiman, A.A., Alamoud, A.R.M, Ahmed, A.S., Qureshi, M.I. “Effect of sub-atmospheric pressure on the conduction current in transformer oil,” Conference record IEEE 10th Conference on Conduction and Breakdown in Dielectric Liquids, September 1990, pg 176-180.
[6] Toriyama, Y., Sato, T., Mitsui, H., “Dielectric breakdown of insulating liquids”, Brit. J. Appl. Phys. Vol. 15, 1964, pg. 203-204.
[7] McCluskey, F.M.J., Huynh, F., Denat, A., Bonifaci, N., Kattan, R., “Bubble Formation in Simple and Complex Liquids”, Conference Record IEEE International Symposium on Electrical Insulation, Pittsburg, PA June 5-8, 1994, pg 406-409.
[8] Chadband, W. G., “From bubbles to breakdown, or vice-versa.” Conference record IEEE 11th Conference on Conduction and Breakdown in Dielectric Liquids, July 1993, pg 184-193.
[9] Kattan, R., Denat, A., Lesaint, O., “Generation, growth, and collapse of vapor bubbles in hydrocarbon liquids under a high divergent electric field“, J. Appl. Phys. Vol. 66, November 1989, pg 4062-4066.
[10] Murphy, E. J., “The generation of gases in the dielectric breakdown of oil” J. Phys. D: Appl. Phys. Vol. 3, 1970, pg. 917-923.
[11] Kattan, R., Denat, A., Lesaint, O., “Formation of Vapor Bubbles in Non-polar Liquids Initiated by Current Pulses,” IEEE Trans. on Electrical Insulation, Vol. 26, No. 4, August 1991, pg 656-662.
98

[12] McCluskey, F.M.J. and Denat, A. “The behavior of small bubbles generated by electrical current impulses over a wide range of applied pressures,” J. Appl. Phys. Vol. 80, August 1996, pg. 2049-2059.
[13] Butcher, M., Neuber, A.; Krompholz, H., Hatfield, L.L., “Surface flashover of dielectrics immersed in super-cooled liquid nitrogen”, Proceedings from 12th IEEE International Pulsed Power Conference, p. 450-453.
[14] Chadband, W.G.; “Electrical Breakdown- from liquid to amorphous solid”, J. Phys. D: Appl. Phys. Vol. 24, 1991, pg 56-64.
[15] Conway, B.E.; “Electrical Aspects of liquid/vapor, liquid/liquid, and liquid/metal interfaces” in The Liquid state and its electrical properties, Eds. E.E. Kundhart, L.G. Christophoro and L.H. Luessen, Plenum Press, pp 323-366.
[16] Gosse, J.P.; “Electric conduction in dielectric liquids” in The Liquid state and its electrical properties, Eds. E.E. Kundhart, L.G. Christophoro and L.H. Luessen, Plenum Press, pp 503-517.
[17] Nosseir, A. and Megahed, I.; “Pre-breakdown conduction current pulses in insulating oils under non-uniform field conditions”, J. Phys. D: Appl. Phys. Vol. 3, 1970, pg 1205-1211
[18] Butcher, M.; Neuber, A.; Krompholz, H., Dickens, J.; “Optical diagnostics of liquid nitrogen volume pre-breakdown events”, Proceedings from 14th IEEE International Pulsed Power Conference, Vol. 2, June 15-18, 2003, pg 1029-1032.
[19] Frayssines, P.E.; Lesaint, O.; Bonifaci, N.; Denat, A.; Devaux, F.; “Pre-breakdown and breakdown phenomena under uniform field in liquid nitrogen and comparison with mineral oil”, IEEE Transaction on Dielectrics and Electrical Insulation, Vol. 10, No. 6, December 2003, pg 970-976.
[20] Jones, H.M. and Kunhardt, E.E; “Development of pulsed dielectric breakdown in liquids”, J. Phys. D: Appl. Phys. Vol 28, 1994, pg 178-188.
[21] Lewis, T.J., “An overview of electrical processes leading to dielectric breakdown of liquids” in The Liquid state and its electrical properties, Eds. E.E. Kundhart, L.G. Christophoro and L.H. Luessen, Plenum Press, pp 431-453.
[22] Lewis, T.J., “A new model for the primary process of electrical breakdown in liquids,” IEEE Trans. on Dielectrics and Electrical Insulation, Vol. 5, No. 3, June 1998, pg 306-315.
[23] Abdel-Salam, M., Anis, H., El-Morshedy, A., Radwan, R. High-Voltage Engineering: Theory and Practice 2nd Ed. Marcel Dekker Inc. New York, 2000, pg 220-222.
[24] Clark, F.M., Insulating materials for design and engineering practice, New York, Wiley Publishing, 1962, pg 150-170.
99

[25] Oommen, T.V. and Grune, G.L., “Low temperature viscosity behavior of transformer oils”, IEEE Proc. Conference on Electrical Electronics Insulation Conference and Electrical Manufacturing and Coil Winding Conference, September 1995, pg. 107-112.
[26] Cevallos, M.; Dickens, J.; Neuber, A.; Krompholz, H., “High Voltage, Sub Nanosecond Feedthrough Design for Liquid Breakdown Studies”, Proceedings from 14th International Conference on High Power Particle Beams, p. 73.
[27] Cevallos, M.; Dickens, J.; Neuber, A.; Haustein, M.; Krompholz, H., “Self electrical breakdown in biodegradable oil”, 14th IEEE International Pulsed Power Conference, Vol.2, June 15-18, 2003, pg 1036-1039.
[28] Lesaint, O. and Gournay, P.; “On the gaseous nature of positive filamentary streamers in hydrocarbon liquids. I: Influence of the hydrostatic pressure on the propagation” J. Phys. D. Appl. Phys. Vol. 27, 1994, pg. 2111-2116.
[29] Gournay, P. and Lesaint, O.; “On the gaseous nature of positive filamentary streamers in hydrocarbon liquids. II: propagation, growth and collapse of gaseous filaments in pentane” J. Phys. D. Appl. Phys. Vol. 27, 1994, pg. 2117-2127.
[30] Beroual, A.; Aka-N’Gnui, T.; “Influence of additives and hydrostatic pressure on streamers initiation and dielectric strength of liquids”, Annual report conference on Electrical Insulation and Dielectric Phenomena, 2002, pg 248-251.
[31] Pozar, D. Microwave Engineering, 2nd Ed. pg. 551.
[32] Yeager, J., and Tupta, M.A.H. Low Level Measurements, 5th Edition, Keithley Instruments, pg 2-45–2-64.
[33] Krompholz, H.; Schoenbach, K.; Schaefer, G. "Transmission Line Current Sensor," IEEE Instrumentation and Measurement Technology Conference, Tampa, FL, USA 1985, p224.
[34] Butcher, M.; “Surface breakdown on insulators at cryogenic temperatures,” Master’s Thesis in Applied Physics, Texas Tech University, Lubbock, TX., 1998.
[35] Hutchinson, I.H., Principles of Plasma Diagnostics, Cambridge University Press 1987. pg 112-115.
[36] Pompili, M., Mazzetti, C., “Early stages of negative PD development in dielectric liquids,” IEEE Trans. on Dielectrics and Electrical Insulation, Vol. 2, No. 4, August 1995, pg. 602-613.
[37] Tobazeon, R., “Prebreakdown phenomena in dielectric liquids,” IEEE Trans. on Dielectrics and Electrical Insulation, Vol.1, No. 6, December 1994, pg. 1132-1147.
[38] Frayssines et al “Streamers in liquid nitrogen: characterization and spectroscopic determination of gaseous filament temperature and electron density” J. Physics D: Vol 35. pg 369-377.
100

[39] Herzberg, G., Molecular spectra and molecular structure, 2nd Ed. New York: D. Van Nostrand Company, 1950.
[40] Krile, J., Neuber, A., Dickens, J., Krompholz, H., “DC flashover of a Dielectric Surface at Atmospheric Conditions”, IEEE Trans. on Plasma Science, Vol. 32, No.5, October 2004, pg 1828-1834.
[41] Halpern, B. and Gomer, R., “Field Emission in Liquids” J. Chem. Phys. Vol. 51, No 3, August 1969, pg. 1031-1047.
[42] Watson, P.K., Chadband, W.G., Sadeghzadeh-Araghi, M. , “The role of electrostatic and hydrodynamic forces in negative-point breakdown of liquid dielectrics” IEEE Trans. of Electrical Insulation Vol. 26, No. 4, August 1991, pg 543-559.
[43] Theodossiou, G., Nelson, J., Lee, M.J., Odell, G.M., “The influence of electro-hydrodynamic motion on the breakdown of dielectric liquids,” J. Phys. D: Appl. Phys. Vol. 21 No.1 1988, pg. 45-50.
[44] Tobazeon, R.E., “Streamers in Liquids” in The liquid state and its electrical properties, E.E. Kunhardt, L.G. Christophorou, L.H. Luessen eds., Plenum Press, New York 1987
[45] Castellanos, A., “Coulomb-driven Convection in Electrohydro-dynamics”, IEEE Trans. on Electrical Insulation, Vol. 26, No. 6, December 1991, pg. 1201-1215.
[46] Mirza, J.S. , Smith, C.W., Calderwood, J.H., “Liquid motion and internal pressure in electrically stressed liquids”, J. Phys. D: Appl. Phys. Vol. 3, 1970, pg. 580-585.
[47] Latham, R.V. “The origin of pre-breakdown electron emission from vacuum insulated high voltage electrodes”, Vacuum 32, 1982, pg. 137-140
[48] Athwal, C.S., Latham, R.V., “Switching and other nonlinear phenomena associated with pre-breakdown electron emission current”, J. Phys. D., Appl. Phys. Vol. 17, No. 5 1984, pg 1029-1043.
[49] Swami, N.K.; Srivastava, S.; Ghule, H.M.; “The role of the interfacial layer in Schottky barrier solar cells” J. Phys. D: Appl. Phys. Vol. 12, 1979, pg. 765-771.
[50] Bernede, J.C. and Cona, A.; “Space charge effect on the I-V characteristics of Al-Al2O3-Te thin film samples”, J. Phys. D: Appl. Phys. Vol. 16, 1983, pg. 1307-1310.
[51] Feller, F.; Rothe, C.; Tammer, M.; Geschke, D.; Monkman, A.P.; “Temperature dependence of the space-charge distribution in injection limited conjugated polymer structures”, Journal of Applied Physics, Vol. 91, No. 11, 2002, pg. 9225-9231.
101
[52] Butcher, M.; Neuber, A.; Krompholz, H., Dickens, J., “Pre-breakdown current behavior in DC volume breakdown in transformer oil”, Proceedings from 14th IEEE International Pulsed Power Conference, Vol. 1, June 15-18, 2003, pg 289-292.
[53] Lord Rayleigh, “On the pressure developed in a liquid during the collapse of spherical cavity”, Philosophical Magazine, Vol. 34, 1917, pg. 94-98.
[54] Jomni, F., Aitken, F., Denat, A., “Investigation of the behavior of microscopic bubbles in insulating liquids: Transition from the inertial regime to the viscous one“, Proceedings from 14th IEEE International Conference on Dielectric Liquids, July 7-12, 2002, pg. 194-198.
[55] Schmidt, F.W., Liquid State Electronics of Insulating Liquids, CRC Press, New York, 1997, pg. 236-238.
[56] Raizer, Yuri; Gas Discharge Physics, Springer-Verlag, Berlin Heidelberg, 1991 pg. 52-75.
[57] Doake, C.S.M., Gribbon, P.W.F., “Ion motion in liquid nitrogen,” J. Phys. A: Gen. Phys. Vol. 4, 1971, pg. 952-961.
102
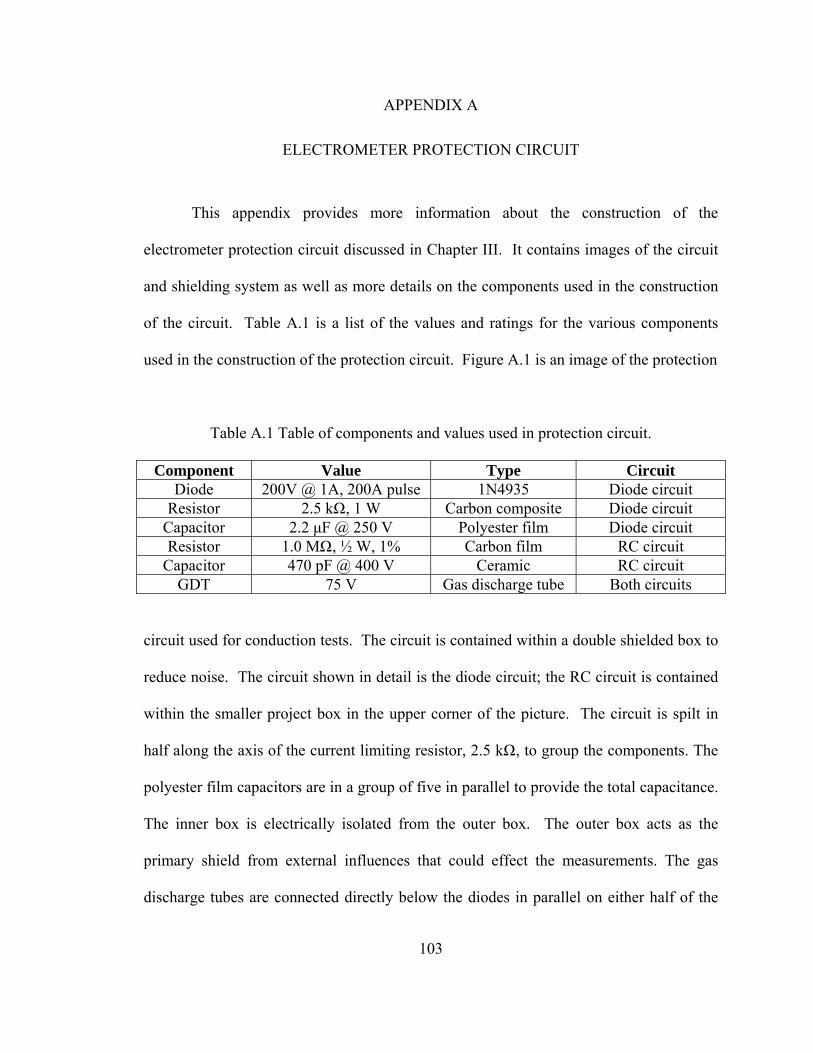
APPENDIX A
ELECTROMETER PROTECTION CIRCUIT
This appendix provides more information about the construction of the
electrometer protection circuit discussed in Chapter III. It contains images of the circuit
and shielding system as well as more details on the components used in the construction
of the circuit. Table A.1 is a list of the values and ratings for the various components
used in the construction of the protection circuit. Figure A.1 is an image of the protection
Table A.1 Table of components and values used in protection circuit.
Component Value Type Circuit Diode 200V @ 1A, 200A pulse 1N4935 Diode circuit
Resistor 2.5 kΩ, 1 W Carbon composite Diode circuit Capacitor 2.2 µF @ 250 V Polyester film Diode circuit Resistor 1.0 MΩ, ½ W, 1% Carbon film RC circuit
Capacitor 470 pF @ 400 V Ceramic RC circuit GDT 75 V Gas discharge tube Both circuits
circuit used for conduction tests. The circuit is contained within a double shielded box to
reduce noise. The circuit shown in detail is the diode circuit; the RC circuit is contained
within the smaller project box in the upper corner of the picture. The circuit is spilt in
half along the axis of the current limiting resistor, 2.5 kΩ, to group the components. The
polyester film capacitors are in a group of five in parallel to provide the total capacitance.
The inner box is electrically isolated from the outer box. The outer box acts as the
primary shield from external influences that could effect the measurements. The gas
discharge tubes are connected directly below the diodes in parallel on either half of the
103
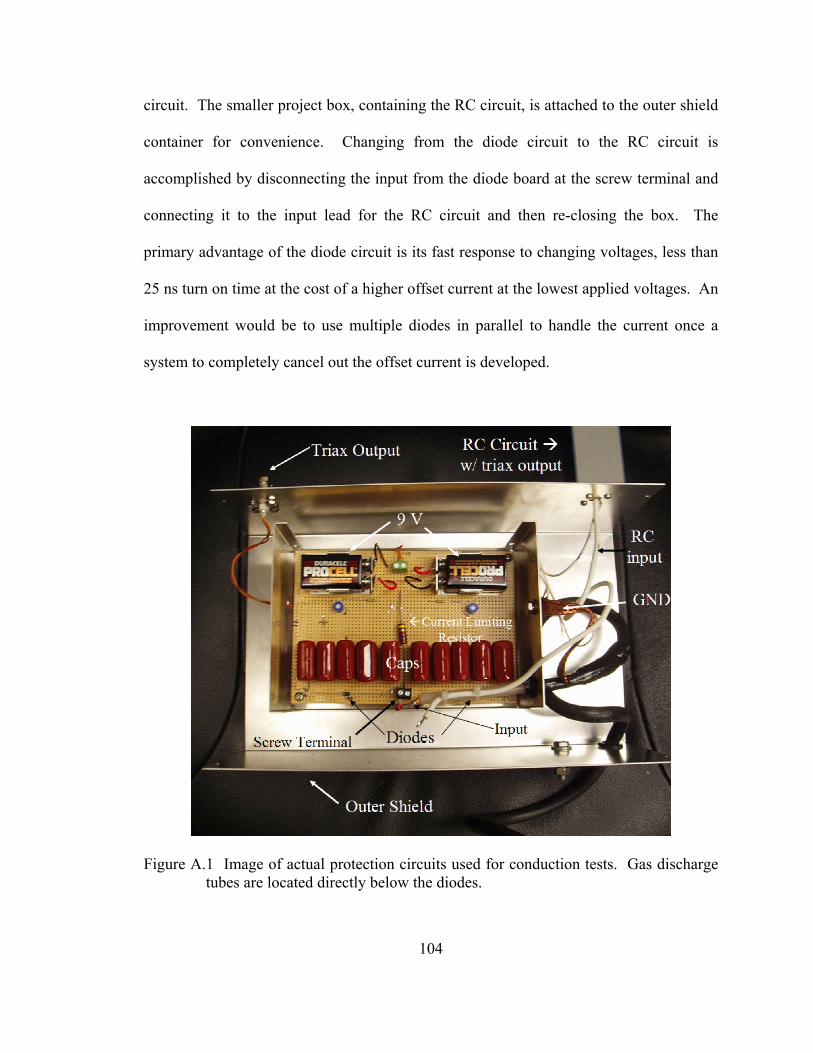
circuit. The smaller project box, containing the RC circuit, is attached to the outer shield
container for convenience. Changing from the diode circuit to the RC circuit is
accomplished by disconnecting the input from the diode board at the screw terminal and
connecting it to the input lead for the RC circuit and then re-closing the box. The
primary advantage of the diode circuit is its fast response to changing voltages, less than
25 ns turn on time at the cost of a higher offset current at the lowest applied voltages. An
improvement would be to use multiple diodes in parallel to handle the current once a
system to completely cancel out the offset current is developed.
Figure A.1 Image of actual protection circuits used for conduction tests. Gas discharge tubes are located directly below the diodes.
104

The difference between the quality of data collected depends upon the circuit used
during the tests. The diode circuit has a constant offset of a couple of nA that is always
present. The offset can be removed but the error associated with the measurement is
larger. The RC circuit has minimal offset and therefore has less error due to minimal
data processing to extract the data from the original signal. Figure A.2 is a graph of the
conduction current measured using the diode circuit near breakdown. The offset value of
2-3 nA is less than 1% of the signal and subtracting it out will have little effect on the
final value for the current. Figure A.3 and A.4 are graphs of the conduction current at
voltages of less than 1.5 kV for the diode and RC circuits respectively.
Figure A.2 Graph of conduction current using diode protection circuit near breakdown.
105

The offset of 2.5 nA for the diode circuit is most of the signal for the data. When it is
subtracted from the source signal the residual current of 20 pA is the value of the
conduction current at that voltage. The error associated with this process is obviously
large since the leakage current will drift with time as the diodes slowly heat with the
constant current. Current drift of a few pA is significant if the final signal is only a few
pA. Current drift was minimized by recording the offset value prior to the next test;
however, it will not be as good as the results using the RC circuit that does not have drift.
Figure A.3 Graph of conduction current using diode circuit for voltage less than 1.5 kV.
106

Figure A.4 contains raw data using the RC filter and the data is clearly less noisy than the
same data collected using the diode circuit shown in fig. A.3. The final value of about
16 pA is measured directly without having to subtract out the offset.
Figure A.4 Graph of conduction current using RC circuit for voltage less than 1.5 kV.
107

APPENDIX B
DATA ANALYSIS SCRIPT FILES FOR USE WITH PLOTiT©
The data analysis of the PMT and current signals for pre-breakdown and
breakdown studies was processed using a script file for the conversion of the raw signal
to useful units. The file also time shifts the data for each channel from the scope
depending upon cable length and distance from the event to the sensor. Since the cables
used are of the same length and manufacturing the data was not adjusted for cable
attenuation. Figure B.1 is the script file for converting and time shifting the PMT data for
breakdown tests. The file is capable of converting both high and low sensitivity PMT
data. The high sensitivity data is for low level pre-breakdown events, while the low
sensitivity is for higher intensity breakdown events. Figure B.2 is the script file for time
shifting and converting the voltage signals from the capacitive voltage dividers to current
data. The script files require that the raw data from each channel be placed in the same
worksheet file. Since the time scale is the same for a given scope the files are grouped
according to the scope on which they were collected. The next step is to confirm that the
channels are in the designated, column according to the script file, in the worksheet.
Then running the script file will perform all the conversions for the data set. A separate
graphical analysis section will use the generated output file to graph the data. Further
modifications can be done to automate the entire process but that was unnecessary for the
amount of file conversions that were required for these experiments.
108

Figure B.1 Script file for time shifting and converting PMT and current sensor voltage signals to appropriate units.
109

Figure B.2 Script file for time shifting and converting capacitive voltage divider and current sensor voltage signals to appropriate units.
110
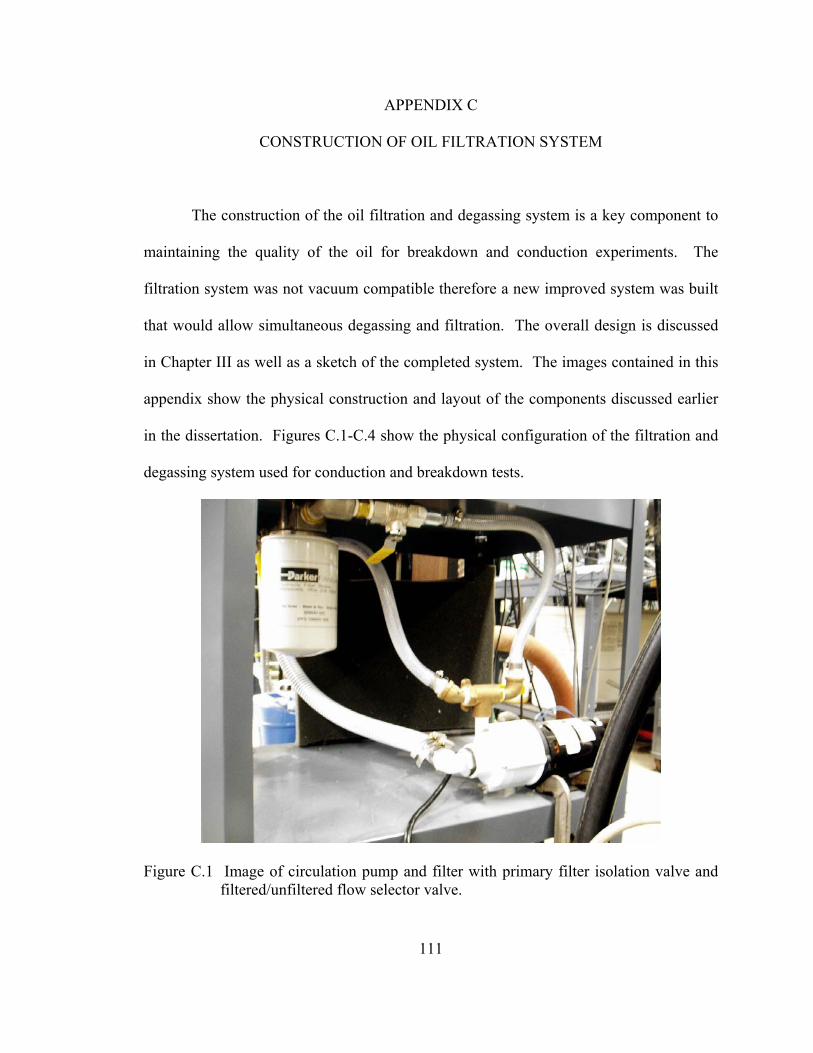
APPENDIX C
CONSTRUCTION OF OIL FILTRATION SYSTEM
The construction of the oil filtration and degassing system is a key component to
maintaining the quality of the oil for breakdown and conduction experiments. The
filtration system was not vacuum compatible therefore a new improved system was built
that would allow simultaneous degassing and filtration. The overall design is discussed
in Chapter III as well as a sketch of the completed system. The images contained in this
appendix show the physical construction and layout of the components discussed earlier
in the dissertation. Figures C.1-C.4 show the physical configuration of the filtration and
degassing system used for conduction and breakdown tests.
Figure C.1 Image of circulation pump and filter with primary filter isolation valve and filtered/unfiltered flow selector valve.
111

Figure C.2 Image of circulation pump and filter with secondary filter isolation valve and filtered or unfiltered flow selector valve.
Normal degassing is done with the filter bypassed from the circulation system.
Removing the filter from the system for degassing is necessary because the filter is
capable of trapping large quantities of gas. Removing all trapped gas from the filter is
very difficult and not necessary. Normal operation is oil filtration and degassing
followed by a period degassing of the oil only.
112

Figure C.3 Image of primary test chamber with 1” reinforced hose going to the magnetic drive pump from the chamber and ½” line going to chamber from the filter.
Figure C.4 Image of primary test chamber with ½” line going to chamber through an isolation valve. The isolation valve reduces the ½” line to ¼” line into the chamber.
113

APPENDIX D
DATA TABLES FOR LN2 AND UNIVOLT 61
The following table D.1 is a list of the physical and electrical parameters of
interest for liquid nitrogen and Univolt 61 transformer oil. This data is complied from
several sources including the specification sheets for Exxon Univolt 61 transformer oil.
Table D.1 Physical and Electrical properties of LN2 and Univolt 61 transformer oil.
Physical Property Liquid Nitrogen Univolt 61 Molecular Weight 28.013 g/mol 245 g/mol
Liquid Density 808.6 kg/m3 894 kg/m3
Boiling point 77 K 477 K Latent Heat of Vaporization 198.4 kJ/kg 155.8 kJ/kg Heat Capacity at constant
volume (Cv) 2.042 J/(g*K) 9.63 J/(g*K)
Thermal Conductivity 24 mW/(m*K) 132 mW/(m*K) Dynamic Viscosity (300 K) 0.01657 cP 20 cP
Kinematic Viscosity — —
7.5 x 10⁻⁵ m2/s @ 313 K 3.5 x 10⁻⁵ m2/s @ 373 K
Interfacial Tension — 0.05 kg/s2
Relative Permittivity (εr) 1.43 2.2 Gas Density @ 288 K 1.185 kg/m3 — Gas Density @ 77K 4.614 kg/m3 —
114