Computational models of neurophysiological correlates of tinnitus

Identifying Tinnitus Subgroups With Cluster Analysis
Richard Tyler, Claudia Coelho, Pan Tao, and Haihong JiThe University of Iowa, Iowa City
William NobleThe University of Iowa, Iowa City, and University of New England, Armidale, New South Wales,Australia
Anne Gehringer and Stephanie GogelThe University of Iowa, Iowa City
AbstractPurpose—We believe it is important to uncover tinnitus subgroups to identify subsets of patientsmost likely to benefit from different treatments. We review strategies for subgrouping based onetiology, subjective reports, the audiogram, psychoacoustics, imaging, and cluster analysis.
Method—Preliminary results of a 2-step cluster analysis based on 246 participants from whom wehad 26 categorical and 25 continuous variables were determined.
Results—A 4-cluster solution suggested the following subgroups: (a) constant distressing tinnitus,(b) varying tinnitus that is worse in noise, (c) tinnitus patients who are copers and whose tinnitus isnot influenced by touch (somatic modulation), and (d) tinnitus patients who are copers but whosetinnitus is worse in quiet environments.
Conclusions—Subgroups of tinnitus patients can be identified by using statistical approaches. Thesubgroups we identify here represent a preliminary attempt at identifying such patients. One nextstep would be to explore clinical trials of tinnitus treatments based on subgroup analyses or on usingsubgroups in the selection criteria.
Keywordstinnitus; subgroups; cluster analysis
Tinnitus is a symptom but likely has many causes. It may be the case that any single treatmentwill not be effective for treating all tinnitus patients but that different treatments will be neededfor different subgroups. There is a long-standing interest in the identification of thesesubgroups. For example, Tyler and Baker (1983) observed that some tinnitus sufferers avoidednoisy situations, whereas others avoided quiet situations. They postulated that ”these contrastsmay suggest two subcategories of tinnitus [patients]” (Tyler & Baker, 1983, p. 152). Tyler(1984) observed that ”psychophysical masking studies suggests there are different types oftinnitus” (p. 43).
In this article, we briefly review some possible strategies for determining tinnitus subgroupsand then focus on some preliminary data from questionnaires and psychoacoustic measuresusing a cluster analysis.
Contact author: Richad Tyler, The University of Iowa 200, Hawkins Drive, Iowa City, IA 52242. E-mail: [email protected] StatementThe first author is a consultant for Neuromonics, Inc.
NIH Public AccessAuthor ManuscriptAm J Audiol. Author manuscript; available in PMC 2009 December 1.
Published in final edited form as:Am J Audiol. 2008 December ; 17(2): S176–S184. doi:10.1044/1059-0889(2008/07-0044).
NIH
-PA Author Manuscript
NIH
-PA Author Manuscript
NIH
-PA Author Manuscript

Strategies for SubgroupingEtiology
Many of the causes and mechanisms involved in hearing loss are likely involved in tinnitus.Some of the more common and widely accepted causes are noise, aging, medications, headinjury, and Ménière's disease. Unfortunately, many of the causes of tinnitus are unknown.Stouffer and Tyler (1990) found that 23% of their male participants reported that noise exposurehad likely caused their tinnitus, but 46% of the 528 tinnitus patients had no idea what mighthave caused their tinnitus. It may also be that the cause of tinnitus varies within these categories.For example, impulsive noise might create a different kind of tinnitus compared with tinnituscaused by continuous noise. In addition, the aging process might affect people differently.Different medications are likely to have different effects on individuals with differentmetabolisms, and the category of tinnitus caused by head injuries might depend on where inthe brain the injury occurs.
Subjective ReportsBecause tinnitus is a subjective phenomenon, the patients’ own descriptions of their problemprovide valuable insights. Stouffer and Tyler (1990), for example, noted that 38% of theirtinnitus patients reported hearing a ringing sound and 11% heard a buzzing sound.
We have recently (Tao et al., 2008) grouped these descriptions into the following:• tonal (including hissing, musical note, ringing, steam whistle, whistling)• noise (including buzzing, humming, roaring, rushing, whooshing)• crickets (including clicking, cricket-like)• pulsing• other
One can imagine that noise-like tinnitus might activate a large array of fibers, or that a tonalor cricket-like tinnitus might be represented by periodic activity. But patients’ descriptions oftheir tinnitus are likely influenced by their personal experiences, and some are not veryarticulate.
AudiogramTinnitus is closely linked to hearing loss, and some of the proposed models of tinnitus arelinked to hearing loss (e.g., Salvi, Lockwood, & Burkard, 2000; Salvi, Wang, & Powers,1996) and audiogram shape (Norena, Micheyl, Chery-Croze, & Collet, 2002). We have beenexploring different audiogram shapes in tinnitus patients (Tao et al., 2008) and have identifiedthe following shapes:
• flat loss• low-frequency hearing loss• normal hearing• notch• others (shape not typical)• gradual slope loss• steep slope loss• inverted U shape
Tyler et al. Page 2
Am J Audiol. Author manuscript; available in PMC 2009 December 1.
NIH
-PA Author Manuscript
NIH
-PA Author Manuscript
NIH
-PA Author Manuscript

However, similar audiograms might be produced by different causes. Furthermore, it may bethat hearing thresholds at octaves are insufficient to provide an adequate characterization ofthe details of hair cell and nerve fiber survival. It could even be the case that hearing thresholdsbelow 125 Hz and above 8000 Hz are helpful.
PsychoacousticsWe have suggested for some time that detailed psychoacoustic studies should provide animportant basis for identifying subgroups (e.g., Tyler, Babin, & Niebuhr, 1984; Tyler, 2000).
Some potential leads for psychoacoustic-based subgroups are (a) tonal masking patterns(Feldmann, 1971; Formby & Gjerdingen, 1980; Tyler & Conrad-Armes, 1984); (b) ipsilateraland contralateral masking (Henry, Fausti, Flick, Helt, & Ellingson, 2000; Tyler, Kuk, & Mims,1987); (c) postmasking effects of level and duration (Feldmann, 1971; Tyler Babin, & Niebuhr,1984; Vernon & Meikle, 1988); (d) contralateral postmasking (Tyler, Conrad-Armes, & Smith,1984); and (e) adaptation of masking (Penner & Bilger, 1995; Penner, Brauth, & Hood,1981).
ImagingObtaining ”images” of the auditory area and related systems might also help to understanddifferent subgroups of tinnitus patients. Researchers have used magnetoencephalography (e.g.,Weisz, Moratti, Meinzer, Dohrnann, & Elbert, 2005), event-related potentials (Jacobson et al.,1991; Muhlnickel, Elbert, Taub, & Flor, 1998; Weisz, Voss, Berg, & Elbert, 2004), magneticresonance imaging (De Ridder, De Mulder, Menovsky, Sunaert, & Kovacs, 2007; Melcher,Sigalovsly, Guinan, & Levine, 2000; Muhlau et al., 2006), and positron emission tomography(Arnold, Bartenstein, Oestreicher, Romer, & Schwaiger, 1996; Lockwood, Salvi, & Burkard,2001; Lockwood et al., 1998; Reyes et al., 2002). Unfortunately, only a few of these studieshave used hearing impaired controls. It is unclear whether differences between the images fromtinnitus and control groups are attributable to tinnitus or to hearing loss. It is important thatany approach to modify the tinnitus (to create a tinnitus and nontinnitus condition within thesame patient) does not also change the image itself.
Cluster AnalysisYet another approach to finding subgroups involves many measurements and a statisticalanalysis called cluster analysis. Cluster analysis is an approach to identify homogeneoussubgroups from a set of common variables without making presumptions about what variablesare important. Generally, measurements are made from a large number of participants, and theanalysis attempts to group those participants that perform similarly.
Preliminary Results of Cluster AnalysisWe have performed a cluster analysis on patients enrolled in some clinical trials at theUniversity of Iowa. Some of the variables that were included were (a) the Tinnitus HandicapQuestionnaire (Kuk, Tyler, Russell, & Jordan, 1990); (b) the Tinnitus Activities Questionnaire(Tyler, Gehringer, et al., 2006); (c) portions of the Tinnitus Intake Questionnaire (Stouffer &Tyler, 1990); (d) biographical variables; and (e) psychoacoustic tinnitus measurements (pitchand loudness matching).
We have found that the Tinnitus Handicap Questionnaire and the Tinnitus ActivitiesQuestionnaire are particularly helpful because they are scored on a 0−100 ordinal scale (Tyler,Oleson, Noble, Coelho, & Ji, 2007). They therefore have advantages over questionnaires thatuse only a 3-point scale, such as the Tinnitus Handicap Inventory (Newman, Jacobson, &Spitzer, 1996). Because we use the Tinnitus Handicap and Tinnitus Activities Questionnaire,
Tyler et al. Page 3
Am J Audiol. Author manuscript; available in PMC 2009 December 1.
NIH
-PA Author Manuscript
NIH
-PA Author Manuscript
NIH
-PA Author Manuscript
we include in our analysis some responses to individual questions. Other behavioral tests, suchas measuring postmasking effects and tonal masking patterns, might be additionally helpful.We did not have data on a sufficient number of patients, and therefore they could not be utilizedin the cluster analysis.
Prliminary Cluster AnalysisData were reviewed from 246 participants, from whom we had 26 categorical and 25continuous variables. The analysis was conducted using a two-step cluster method (SPSSVersion 15.0) because it accepts continuous and categorical variables. We prespecified four,five, and six clusters, and show results here for a four-subgroup solution as it resulted in aboutequal numbers in each subgroup (n 44, 37, 40, and 32, respectively). We had to exclude 93participants due to missing data, resulting in an analysis performed on 153 patients.
We highlight some of the results from the categorical variables and show ”clusterwiseimportance” and responses within clusters. Thirteen of 26 categorical variables and 19 of 25continuous variables were significant.
Table 1 shows the output from the cluster analysis for the continuous variables. Each row showsa continuous variable and the average scores for this variable in each of the four clusters. Forexample, the average loudness rating for the four subgroups was 83%, 67%, 66%, and 68%,respectively. Therefore, those patients who were assigned to Cluster 1 reported a higher tinnitusloudness measure.
We next show examples of detailed responses for each of the clusters.
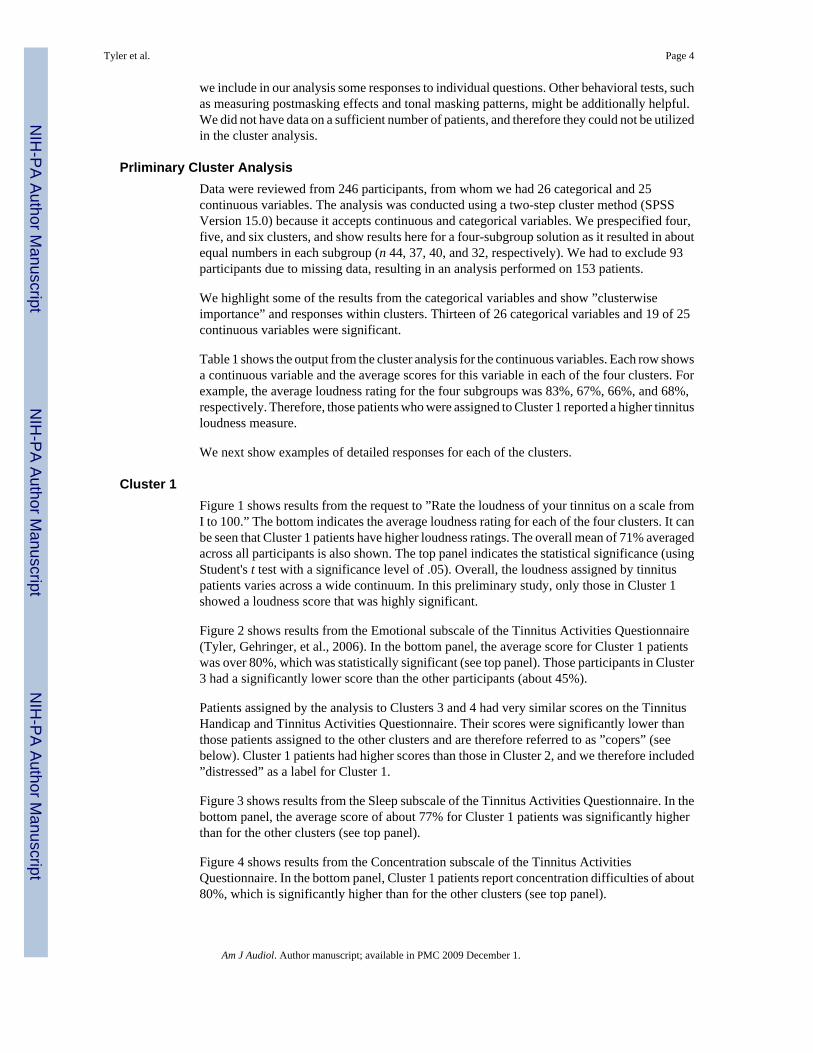
Cluster 1Figure 1 shows results from the request to ”Rate the loudness of your tinnitus on a scale fromI to 100.” The bottom indicates the average loudness rating for each of the four clusters. It canbe seen that Cluster 1 patients have higher loudness ratings. The overall mean of 71% averagedacross all participants is also shown. The top panel indicates the statistical significance (usingStudent's t test with a significance level of .05). Overall, the loudness assigned by tinnituspatients varies across a wide continuum. In this preliminary study, only those in Cluster 1showed a loudness score that was highly significant.
Figure 2 shows results from the Emotional subscale of the Tinnitus Activities Questionnaire(Tyler, Gehringer, et al., 2006). In the bottom panel, the average score for Cluster 1 patientswas over 80%, which was statistically significant (see top panel). Those participants in Cluster3 had a significantly lower score than the other participants (about 45%).
Patients assigned by the analysis to Clusters 3 and 4 had very similar scores on the TinnitusHandicap and Tinnitus Activities Questionnaire. Their scores were significantly lower thanthose patients assigned to the other clusters and are therefore referred to as ”copers” (seebelow). Cluster 1 patients had higher scores than those in Cluster 2, and we therefore included”distressed” as a label for Cluster 1.
Figure 3 shows results from the Sleep subscale of the Tinnitus Activities Questionnaire. In thebottom panel, the average score of about 77% for Cluster 1 patients was significantly higherthan for the other clusters (see top panel).
Figure 4 shows results from the Concentration subscale of the Tinnitus ActivitiesQuestionnaire. In the bottom panel, Cluster 1 patients report concentration difficulties of about80%, which is significantly higher than for the other clusters (see top panel).
Tyler et al. Page 4
Am J Audiol. Author manuscript; available in PMC 2009 December 1.
NIH
-PA Author Manuscript
NIH
-PA Author Manuscript
NIH
-PA Author Manuscript

Combining the results from these figures and from Table 1, we suggest that Cluster 1 patientshave (a) loud tinnitus; (b) loudness hyperacusis; (c) a tinnitus that is present all day, everyday;(d) the highest Tinnitus Handicap and Tinnitus Activities Questionnaire scores; (e) the highestanxiety and depression scores; and (f) the highest emotional, sleep, hearing, and concentrationscores on the Tinnitus Activities Questionnaire. Thus, it appears that Cluster 1 representspatients who have loud, persistent, and distressing tinnitus, and who suffer from loudnesshyperacusis.
Cluster 2Figure 5 shows results from the question to patients regarding whether the pitch of their tinnitusvaried. In the bottom panel, Cluster 2 patients were the only ones who were more likely toreport yes to this question, and their responses were statistically signficantly different fromscores represented in any of the other clusters (using a chi-square test to see how much thedistribution within each cluster differs from what would be expected). The dashed lines in thetop panel represent tie significant differences. Combining the results from this figure and fromTable 1, we suggest that for Cluster 2 patients (a) pitch and loudness vary, (b) noise makes itworse, and (c) relaxation helps somewhat. Thus, it appears that Cluster 2 represents patientswhose tinnitus varies in pitch and loudness, and whose tinnitus is worse in noise.
Cluster 3Figure 6 shows results from the question to patients regarding whether touch or movement inthe head or neck region or their hands or arms influenced their tinnits. Over 90% of patientsassigned to Cluster 3 responded no to this question, and none responded positively. A tentativeobservation is that Cluster 2 patients had the highest proportion of patients who responded yes,that touch or movement did affect their tinnitus (over 60%). However, most of the patients inCluster 2 did not have their tinnitus modulated by touch or movement. Note that over 80% ofthe entire sample indicated that touching or movement did not change their tinnitus. Combiningthe results from this figure and from Table 1, we suggest that Cluster 3 patients (a) have thelowest scores on the Tinmitus Handicap and Tinnitus Activities Questionnaires; (b) have noloudniess hyperacusis; (c) have had no recent life changes; (d) do not have too much stress;and (e) do not have their tinnitus changed by touching or movement. Thus, it appears thatCluster 3 represents patients who are not too distressed by their tinnitus. They do not haveloudness hyperacusis, and their tinnitus is not influenced by touch.
Cluster 4Figure 7 shows results from the question to patients regarding whether being in a quiet placemade their tinnitus worse. In the bottom panel, almost 100% of patients in Cluster 4 respondedyes. Most patients assigned to Clusters 2 and 3 responded no to this question. Theseobservations were all statistically significant.
Figure 8 shows results from the question regarding whether being in a noisy place reducedtheir tinnitus. In the bottom panel, about 80% of patients in Cluster 4 said yes. In contrast, forpatients who fell into Cluster 2, 100% said no. Note that when all the responses of all thepatients in the study are combined (ignoring the clusters), about 80% of patients said no to thisquestion. Noteworthy for Cluster 4 is (a) being in a quiet environment makes their tinnitusworse; (b) noise reduces their tinnitus; (c) they do not have loudness hyperacusis; (d) theyexperience low anxiety; (e) many things make their tinnitus better; and (f) they report a softtinnitus loudness. Thus, it appears that Cluster 4 represents patients whose tinnitus is worse inquiet and better in noise. They report a soft tinnitus loudness and are not too distressed by theirtinnitus.
Tyler et al. Page 5
Am J Audiol. Author manuscript; available in PMC 2009 December 1.
NIH
-PA Author Manuscript
NIH
-PA Author Manuscript
NIH
-PA Author Manuscript

Contrasting ClustersThe Appendix provides an overall summary of some of the main features of the clusters. Itdoes appear that this initial cluster analysis produced four distinct groups. Some of the mainfactors that seem to distinguish groups include the loudness of the tinnitus, whether it varies,how it is influenced by background noise or quiet, and the amount of distress experienced bypatients.
Possible Applications of Cluster AnalysisThere are several possible applications of this cluster analysis and of approaches to tinnitussubgrouping. These include the following:
• Designing clinical trials for a single subgroup instead of all tinnitus patients• Analyzing a large amount of data of heterogeneous tinnitus patients based on
subgroups• Using subgroups to search for clues for the mechanism; for example, there might be
a common modifier gene for a depression subgroup (Tyler, Coelho, & Noble, 2006)• Identifying subgroups (e.g., those most distressed) who might require more specific
collaborative counseling and sound therapy, such as Tinnitus Activities Treatment(Tyler, Gehringer, et al., 2006)
• Understanding specific effects of treatment by monitoring changes in clustersfollowing a treatment
SummaryWe continue to believe that identifying subgroups is necessary to find appropriate treatments(Tyler, 1992). We have reviewed several approaches to define and discover subgroups. Wealso present a preliminary cluster analysis approach intended to identify possible subgroupsOur intent was not to propose these as the subgroups but only to demonstrate the potentialimportance of the technique. As a preliminary step, our analysis suggests the following foursubgroups of tinnitus patients:
1. Constant distressing tinnitus
2. Varying tinnitus that is worse in noise
3. Tinnitus patients who are copers and whose tinnitus is not influenced by touch
4. Tinnitus patients who are copers and whose tinnitus is worse in quiet environments
It is possible, perhaps likely, that a patient falling within a particular subgroup might changeover time. For example, it might be that the tinnitus magnitude (as measured by its loudness)does not change over time, but the reactions to the tinnitus do. Tyler and Baker (1983) observedthat the number of problems identified by tinnitus patients decreased since the time of tinnitusonset. It might also be that the central neurophysiological representation of tinnitus changeswith time. When imaging studies are included in such an analysis, the brain regions activatedmight change over time.
One intriguing and dramatic distinction among tinnitus patients is the difference reported onthe effect of background noise. Noise makes tinnitus worse for some patients but reducestinnitus for others (see Stouffer & Tyler, 1990; Tyler & Baker, 1983). This might represent afundamental difference in the neural mechanisms underlying tinnitus and an opportunity fordifferent treatment approaches.
Tyler et al. Page 6
Am J Audiol. Author manuscript; available in PMC 2009 December 1.
NIH
-PA Author Manuscript
NIH
-PA Author Manuscript
NIH
-PA Author Manuscript

AcknowledgmentsThis research was supported in part by National Institutes on Deafness and Other Communication Disorders GrantR01 DC005972-01A1.
AppendixDescriptions of Four Subgroups Based on Preliminary Cluster Analysis
Cluster 1 Cluster 2 Cluster 3 Cluster 4
Constant distressing tinnitus•Loud tinnitus•Loudness hyperacusis•Present all day, everyday•The highest Tinnitus Handicapand Tinnitus ActivitiesQuestionnaire•The highest anxiety anddepression scores•Highest emotional, sleep,hearing, and concentrationdifficulty on Tinnitus ActivitiesQuestionnaire
Varying tinnitus thatis worse in noise•Pitch and loudnessvaries•Noise makes itworse•Relaxation helpssomewhat
Tinnitus patients who are copersand whose tinnitus is notinfluenced by touch•The lowest scores on TinnitusHandicap and Tinnitus ActivitiesQuestionnaire•No loudness hyperacusis•No recent life changes•Stress not so bad•Touching or movement does notchange their tinnitus
Tinnitus patients who are copersand whose tinnitus is worse inquiet•Being in quiet makes theirtinnitus worse•Noise reduces their tinnitus•They do not have loudnesshyperacusis•They experience low anxiety•Many things make their tinnitusbetter•They report a soft tinnitusloudness
ReferencesArnold W, Bartenstein P, Oestreicher E, Romer W, Schwaiger M. Focal metabolic activation in the
predominant left auditory cortex in patients suffering from tinnitus: A PET study with [18F]deoxyglucose. ORL; Journal for Oto-Rhino-Laryngology and Its Related Specialties 1996;58(4):195–199. [PubMed: 8883104]
De Ridder, D.; De Mulder, G.; Menovsky, T.; Sunaert, S.; Kovacs, S. Electrical stimulation of auditoryand somatosensory cortices for treatment of tinnitus and pain.. In: Langguth, B.; Hajak, G.; Kleinjung,T.; Cacace, A.; Moller, AR., editors. Progress in brain research: Tinnitus: Pathophysiology andtreatment. Elsevier; Amsterdam: 2007. p. 377-388.
Feldmann H. Homolateral and contmralateral masking of tinnitus by noise-bands and by pure tones.Audiology 1971;10(3):138–144. [PubMed: 5163656]
Formby C, Gjerdingen DB. Pure-tone masking of tinnitus. Audiology 1980;19:519–535. [PubMed:7425956]
Henry JA, Fausti SA, Flick CL, Helt WJ, Ellingson RM. Computer-automated clinical technique fortinnitus quantification. American Journal of Audiology 2000;9:36–49. [PubMed: 10943023]
Jacobson GP, Abmad BK, Moran J, Newman CW, Tepley N, Wharton J. Auditory evoked corticalmagnetic field (M1OO-M200) measurements in tinnitus and normal groups. Hearing Research1991;56(1−2):44–52. [PubMed: 1769924]
Kuk FK, Tyler RS, Russell D, Jordan H. The psychometric properties of a tinnitus handicap questionnaire.Ear and Hearing 1990;11:434–445. [PubMed: 2073977]
Lockwood AH, Salvi RJ, Burkard RF. Tinnitus and the performer. Medical Problems of PerformingArtists 2001;16(4):133–135.
Lockwood AH, Salvi RJ, Coad ML, Towsley ML, Wack DS, Murphy BW. The functional neuroanatomyof tinnitus: Evidence for limbic system links and neural plasticity. Neurology 1998;50(1):114–120.[PubMed: 9443467]
Melcher JR, Sigalovsky IS, Guinan JJ Jr. Levine RA. Lateralized tinnitus studied with functional magneticresonance imaging: Abnormal inferior colliculus activation. Journal of Neurophysiology2000;83:1058–1072. [PubMed: 10669517]
Muhlau M, Rauschecker JP, Oestreicher E, Gaser C, Rottinger M, Wobhschlager AM, et al. Structuralbrain changes in tinnitus. Cerebral Cortex 2006;16:1283–1288. [PubMed: 16280464]
Tyler et al. Page 7
Am J Audiol. Author manuscript; available in PMC 2009 December 1.
NIH
-PA Author Manuscript
NIH
-PA Author Manuscript
NIH
-PA Author Manuscript

Muhlnickel W, Elbert T, Taub E, Flor H. Reorganization of auditory cortex in tinnitus. Proceedings ofthe National Academy of Sciences, USA 1998;95:10340–10343.
Newman CW, Jacobson GP, Spitzer JB. Development of the Tinnitus Handicap Inventory. Archives ofOtolaiyngology—Head & Neck Surgery 1996;122:143–148.
Norena A, Micheyl C, Chery-Croze S, Collet L. Psychoacoustic characterization of the tinnitus spectrum:Implications for the underlyig mechanisms of tinnitus. Audiology & Neurootology 2002;7:358–369.
Penner, MJ.; Bilger, RC. Psychophysical observations and the origin of tinnitus.. In: Vernon, JA.; Moller,AR., editors. Mechanisms of tinnitus. Allyn & Bacon; Needham Heights, MA: 1995. p. 219-230.
Penner MJ, Brauth S, Hood L. The temporal course of the masking of tinnitus as a basis for inferring itsorigin. Journal of Speech and Hearing Research 1981;24:257–261. [PubMed: 7265941]
Reyes SA, Salvi RJ, Burkard RF, Coad ML, Wack DS, Galantowicz PJ, et al. Brain imaging of the effectsof lidocaine on tinnitus. Hearing Research 2002;171(1−2):43–50. [PubMed: 12204348]
Salvi, RJ.; Lockwood, A.; Burkard, R. Neural plasticity and tinnitus.. In: Tyler, RS., editor. Tinnitushandbook. Singular; San Diego, CA: 2000. p. 123-148.
Salvi, RJ.; Wang, J.; Powers, NL. Plasticity and reorganization in the auditory brainstem: Implicationsfor tinnitus.. In: Reich, GE.; Vernon, JA., editors. Proceedings of the Fifth International TinnitusSeminar; Portland, OR: American Tinnitus Association; 1996. p. 457-466.
Stouffer JL, Tyler RS. Characterization of tinnitus by tinnitus patients. Journal of Speech and HearingDisorders 1990;55:439–453. [PubMed: 2381186]
Tao P, Tyler RS, Haihong J, Coelho C, Gehringer AK, Gogel SA. The relationship between tinnitus pitchand audiogramin. 2008Manuscript submitted for publication
Tyler RS. Does tinnitus originate from hyperactive nerve fibers in the cochlea? In Tinnitus: Proceedingsof the II International Tinnitus Seminar. The Journal of Laryngology and Otology Supplement1984;9:38–44.
Tyler, RS. Evaluation of tinnitus treatments.. In: Aran, JM.; Dauman, R., editors. Tinnitus 91: Proceedingsof the Fourth International Tinnitus Seminar; Bordeaux, France. August 27−30, 1991; Amsterdam:Kugler; 1992. p. 551-554.
Tyler, RS. The psychoacoustical measurement of tinnitus.. In: Tyler, RS., editor. Tinnitus handbook.Singular; San Diego, CA: 2000. p. 149-179.
Tyler RS, Babin RW, Niebuhr D. Some observations on the masking and post-masking effects of tinnitus.The Journal of Laryngology and Otology Supplement 1984;9:150–156.
Tyler RS, Baker LJ. Difficulties experienced by tinnitus sufferers. Journal of Speech and HearingDisorders 1983;48:150–154. [PubMed: 6621006]
Tyler RS, Coelho C, Noble W. Tinnitus: Standard of care, personality differences, genetic factors. ORL;Journal for Oto-Rhino-Laryngology and Its Related Specialties 2006;68(1):14–19. [PubMed:16514258]discussion 20−22
Tyler RS, Conrad-Armes D. Masking of tinnitus compared to masking of pure tones. Journal of Speechand Hearing Research 1984;27:106–111. [PubMed: 6716994]
Tyler RS, Conrad-Armes D, Smith PA. Postmasking effects of sensorineural tinnitus: A preliminaryinvestigation. Journal of Speech and Hearing Research 1984;27:466–474. [PubMed: 6482416]
Tyler, RS.; Gehringer, AK.; Noble, W.; Dunn, CC.; Witt, SA.; Bardia, A. Tinnitus activities treatment..In: Tyler, RS., editor. Tinnitus treatment: Clinical protocols. Thieme; New York: 2006. p. 116-131.
Tyler, RS.; Kuk, FK.; Mims, LA. Ipsilateral and contralateral postmasking recovery of tinnitus.. In:Feldmann, H., editor. Proceedings of the Third International Tinnitus Seminar; Münster, WestGermany. June 11−13, 1987; Karlsruhe, West Germany: Harsch Verlag; 1987. p. 275-279.
Tyler RS, Oleson J, Noble W, Coelho C, Ji H. Clinical trials for tinnitus: Study populations, designs,measurement variables, and data analysis. Progress in Brain Research 2007;166:499–509. [PubMed:17956814]
Vernon, JA.; Meikle, MB. Measurement of tinnitus: An update.. In: Kitahara, M., editor. Tinnitus:Pathophysiology and management. Igaku-Shoin; Tokyo: 1988. p. 36-52.
Weisz N, Moratti S, Meinzer M, Dohrmann K, Elbert T. Tinnitus perception and distress is related toabnormal spontaneous brain activity as measured by magnetoencephalography. PLoS Medicine2005;2(6):e153. [PubMed: 15971936]
Tyler et al. Page 8
Am J Audiol. Author manuscript; available in PMC 2009 December 1.
NIH
-PA Author Manuscript
NIH
-PA Author Manuscript
NIH
-PA Author Manuscript

Weisz N, Voss S, Berg P, Elbert T. Abnormal auditory mismatch response in tinnitus sufferers with high-frequency hearing loss is associated with spbjective distress level. BMC Neurosciece 2004;5:8.
Tyler et al. Page 9
Am J Audiol. Author manuscript; available in PMC 2009 December 1.
NIH
-PA Author Manuscript
NIH
-PA Author Manuscript
NIH
-PA Author Manuscript

Figure 1.Cluster results for the question regarding tinnitus loudness (1%-100%). The bottom panelshows the mean scores and standard deviations for each of the clusters. The horizontal linedepicts the mean for all participants. The top panel plots the Student t scores for each of theclusters. The significance levels (p < .05; Bonferroni adjustment applied) are shown withvertical dashed lines.
Tyler et al. Page 10
Am J Audiol. Author manuscript; available in PMC 2009 December 1.
NIH
-PA Author Manuscript
NIH
-PA Author Manuscript
NIH
-PA Author Manuscript

Figure 2.Cluster results for the Emotional subscale of the Tinnitus Activities Questionnaire (see Figure1 for details of graphing clusters based on continuous variables).
Tyler et al. Page 11
Am J Audiol. Author manuscript; available in PMC 2009 December 1.
NIH
-PA Author Manuscript
NIH
-PA Author Manuscript
NIH
-PA Author Manuscript

Figure 3.Cluster results for the Sleep subscale of the Tinnitus Activities Questionnaire (see Figure 1 fordetails of graphing clusters based on continuous variables).
Tyler et al. Page 12
Am J Audiol. Author manuscript; available in PMC 2009 December 1.
NIH
-PA Author Manuscript
NIH
-PA Author Manuscript
NIH
-PA Author Manuscript

Figure 4.Cluster results for the Concentration subscale of the Tinnitus Activities Questionnaire (seeFigure 1 for details of graphing clusters based on continuous variables).
Tyler et al. Page 13
Am J Audiol. Author manuscript; available in PMC 2009 December 1.
NIH
-PA Author Manuscript
NIH
-PA Author Manuscript
NIH
-PA Author Manuscript

Figure 5.Cluster results for the question to patients regarding whether their tinnitus pitch varied fromday to day; yes or no (categorical variable). The bottom panel shows the percentage ofparticipants who responded yes or no for each of the clusters and in all patients combined. Thetop panel plots the chi-square scores for each of the clusters. The significance levels (p < .05;Bonferroni adjustment applied) are shown with vertical dashed lines.
Tyler et al. Page 14
Am J Audiol. Author manuscript; available in PMC 2009 December 1.
NIH
-PA Author Manuscript
NIH
-PA Author Manuscript
NIH
-PA Author Manuscript

Figure 6.Cluster results for the question regarding whether touch or movement in the head or neck regionor hands or arms influenced tinnitus (see Figure 5 for details of graphing clusters based oncategorical variables).
Tyler et al. Page 15
Am J Audiol. Author manuscript; available in PMC 2009 December 1.
NIH
-PA Author Manuscript
NIH
-PA Author Manuscript
NIH
-PA Author Manuscript

Figure 7.Cluster results for the question regarding whether being in a quiet place made the tinnitus worse(see Figure 5 for details of graphing clusters based on categorical variables).
Tyler et al. Page 16
Am J Audiol. Author manuscript; available in PMC 2009 December 1.
NIH
-PA Author Manuscript
NIH
-PA Author Manuscript
NIH
-PA Author Manuscript

Figure 8.Cluster results for the question regarding whether being in a noisy place reduced the tinnitus(see Figure 5 for details of graphing clusters based on categorical variables).
Tyler et al. Page 17
Am J Audiol. Author manuscript; available in PMC 2009 December 1.
NIH
-PA Author Manuscript
NIH
-PA Author Manuscript
NIH
-PA Author Manuscript

NIH
-PA Author Manuscript
NIH
-PA Author Manuscript
NIH
-PA Author Manuscript
Tyler et al. Page 18Ta
ble
1V
aria
ble
scor
es (m
eans
and
stan
dard
dev
iatio
ns) f
or e
ach
of th
e fo
ur p
rofil
es a
nd fo
r the
tota
l gro
up (n
= 2
46).
Clu
ster
12
34
Com
bine
d
Age
(yea
rs)
M54
.255
.658
.754
.955
.9
SD10
.810
.610
.39.
410
.4
Man
y ev
eryd
ay so
unds
are
unb
eara
bly
loud
to m
e.M
60.6
49.5
15.9
14.1
36.5
SD36
.535
.022
.822
.836
.5
Soun
ds th
at o
ther
s bel
ieve
are
mod
erat
ely
loud
are
too
loud
to m
e.M
63.2
56.8
19.3
18.6
40.8
SD35
.831
.825
.225
.136
.4
I hea
r ver
y so
ft so
unds
that
oth
ers w
ith n
orm
al h
earin
g do
not
hea
r.M
21.9
15.5
7.4
15.3
15.2
SD32
.730
.821
.426
.128
.5
Des
crib
e the
mos
t pro
min
ent P
ITC
H o
f you
r tin
nitu
s by
usin
g a s
cale
from
1 to
10.
M8.
67.
97.
68.
18.
1
SD1.
71.
92.
31.
11.
9
Des
crib
e the
LO
UD
NES
S of
you
r tin
nitu
s by
usin
g a s
cale
from
1 to
100.
M83
.266
.665
.668
.071
.4
SD18
.319
.225
.415
.721
.3
Dur
ing
the
time
you
are
awak
e, w
hat p
erce
ntag
e of
the
time
is y
our
tinni
tus p
rese
nt?
M96
.791
.291
.891
.792
.8
SD9.
320
.217
.318
.816
.6
On
the
aver
age,
how
man
y da
ys p
er m
onth
are
you
bot
here
d by
tinni
tus?
M29
.325
.528
.525
.327
.3
SD3.
48.
94.
58.
76.
8
How
man
y m
onth
s hav
e yo
u ha
d tin
nitu
s?M
114.
214
1.2
141.
412
7.2
130.
5
SD12
1.3
193.
1215
6.2
170.
815
9.2
Pitc
h av
erag
e (H
z)M
4957
.447
74.8
4962
.548
34.7
4888
.9
SD28
45.9
2949
.229
68.5
2602
.128
28.4
Loud
ness
mat
ch (d
B H
L)M
56.1
47.4
52.3
40.4
49.7
SD16
.217
.814
.311
.216
.2
Sens
atio
n le
vel o
f lou
dnes
s mat
ch (l
oudn
ess m
atch
– th
resh
old)
M31
.225
.030
.721
.227
.5
SD16
.415
.315
.78.
315
.0
Iow
a Ti
nnitu
s Han
dica
p Q
uest
ionn
aire
M67
.150
.734
.336
.548
.1
SD11
.315
.515
.412
.819
.3
Iow
a Ti
nnitu
s Han
dica
p Q
uest
ionn
aire
(TH
Q) F
acto
r 1M
68.8
46.3
28.2
33.8
45.4
SD15
.121
.019
.817
.224
.3
Am J Audiol. Author manuscript; available in PMC 2009 December 1.

NIH
-PA Author Manuscript
NIH
-PA Author Manuscript
NIH
-PA Author Manuscript
Tyler et al. Page 19
Clu
ster
12
34
Com
bine
d
Iow
a Ti
nnitu
s Han
dica
p Q
uest
ionn
aire
(TH
Q) F
acto
r 2M
64.4
54.6
35.2
31.7
47.6
SD22
.720
.623
.018
.125
.2
Trai
t Anx
iety
Que
stio
nnai
re (2
0−80
)M
49.6
42.9
33.8
35.3
40.8
SD11
.39.
78.
27.
311
.4
Iow
a Ti
nnitu
s Act
iviti
es Q
uest
ionn
aire
(Con
cent
ratio
n su
bsca
le)
M80
.246
.833
.642
.352
.0
SD13
.424
.025
.920
.728
.2
Iow
a Ti
nnitu
s Act
iviti
es Q
uest
ionn
aire
(Em
otio
nal s
ubsc
ale)
M81
.165
.044
.756
.862
.6
SD18
.522
.621
.920
.824
.9
Iow
a Ti
nnitu
s Act
iviti
es Q
uest
ionn
aire
(Hea
ring
subs
cale
)M
74.5
58.5
44.6
49.1
57.5
SD22
.223
.923
.827
.826
.8
Iow
a Ti
nnitu
s Act
iviti
es Q
uest
ionn
aire
(Sle
ep su
bsca
le)
M72
.536
.431
.431
.644
.5
SD26
.733
.030
.232
.735
.2
Iow
a Ti
nnitu
s Act
iviti
es Q
uest
ionn
aire
(ove
rall
scor
e)M
77.1
51.7
38.6
44.9
54.1
SD11
.919
.617
.615
.522
.2
Bec
k D
epre
ssio
n In
vent
ory
Que
stio
nnai
re (0−5
9)M
15.6
8.4
5.2
4.8
8.9
SD8.
36.
14.
33.
27.
4
Rec
ent L
ife C
hang
e Q
uest
ionn
aire
(0−3
,545
)M
279.
521
8.1
112.
319
6.5
203.
6
SD22
7.9
171.
611
1.9
156.
418
3.8
Som
atic
Per
cept
ion
(0−3
9)M
10.0
5.5
3.6
3.0
5.8
SD6.
94.
53.
82.
65.
6
Not
e. U
nles
s oth
erw
ise
note
d, th
e sc
ales
go
from
0 to
100
.
Am J Audiol. Author manuscript; available in PMC 2009 December 1.
Copyright © 2022 FDOKUMEN