Multifrequency spectroscopy of laser active centers Nd 3+ and Yb 3+ in nearly stoichiometric LiNbO 3
7
pss current topics in solid state physics c status solidi www.pss-c.com physica REPRINT Multifrequency spectroscopy of laser active centers Nd 3+ and Yb 3+ in nearly stoichiometric LiNbO 3 G. Malovichko 1 , V. Bratus 2 , M. Munro 1 , E. Kokanyan 3 , S. Okulov 2 , and V. Grachev 1 1 Physics Department, Montana State University, Bozeman, MT 59717, USA 2 Institute of Semiconductors Physics, Kiev 03028, Ukraine 3 Institute of Physical Researches, Ashtarak 378410, Armenia Received 9 July 2006, revised 21 October 2006, accepted 23 October 2006 Published online 9 March 2007 PACS 71.55.Ht, 76.30.Kg, 76.70.Dx, 77.84.Dy, 78.40.Ha Lithium niobate crystals doped with neodymium and ytterbium were studied with the help of the electron paramagnetic resonance (EPR), electron nuclear double resonance (ENDOR) and optical absorption. Tremendous narrowing of magnetic resonance lines in nearly stoichiometric samples in comparison with congruent ones allowed us to distinguish four non-equivalent centers (NEC) of Nd 3+ and five NEC of Yb 3+ , as well as line splitting caused by hyperfine interaction of neodymium electrons with nuclear spins of magnetic isotopes 143 Nd, 145 Nd, 171 Yb and 173 Yb. It was shown that some of the centers has axial C3 symmetry, whereas all others have lowest C1 symmetry due to presence of intrinsic defects or/and charge compensation defects in the near neighborhood of Nd 3+ and Yb 3+ . phys. stat. sol. (c) 4, No. 3, 1346 – 1351 (2007) / DOI 10.1002/pssc.200673819
Transcript of Multifrequency spectroscopy of laser active centers Nd 3+ and Yb 3+ in nearly stoichiometric LiNbO 3
p s scurrent topics in solid state physics
c
statu
s
soli
di
www.pss-c.comph
ysi
ca
REPRINT
Multifrequency spectroscopy of laser active centers Nd3+
and Yb3+
in nearly stoichiometric LiNbO3
G. Malovichko1
, V. Bratus2
, M. Munro1
, E. Kokanyan3
, S. Okulov2
, and V. Grachev1
1
Physics Department, Montana State University, Bozeman, MT 59717, USA
2
Institute of Semiconductors Physics, Kiev 03028, Ukraine
3
Institute of Physical Researches, Ashtarak 378410, Armenia
Received 9 July 2006, revised 21 October 2006, accepted 23 October 2006
Published online 9 March 2007
PACS 71.55.Ht, 76.30.Kg, 76.70.Dx, 77.84.Dy, 78.40.Ha
Lithium niobate crystals doped with neodymium and ytterbium were studied with the help of the electron
paramagnetic resonance (EPR), electron nuclear double resonance (ENDOR) and optical absorption.
Tremendous narrowing of magnetic resonance lines in nearly stoichiometric samples in comparison with
congruent ones allowed us to distinguish four non-equivalent centers (NEC) of Nd3+
and five NEC of
Yb3+
, as well as line splitting caused by hyperfine interaction of neodymium electrons with nuclear spins
of magnetic isotopes143
Nd,145
Nd,171
Yb and173
Yb. It was shown that some of the centers has axial C3
symmetry, whereas all others have lowest C1 symmetry due to presence of intrinsic defects or/and charge
compensation defects in the near neighborhood of Nd3+
and Yb3+
.
phys. stat. sol. (c) 4, No. 3, 1346–1351 (2007) / DOI 10.1002/pssc.200673819
phys. stat. sol. (c) 4, No. 3, 1346–1351 (2007) / DOI 10.1002/pssc.200673819
© 2007 WILEY-VCH Verlag GmbH & Co. KGaA, Weinheim
Multifrequency spectroscopy of laser active centers Nd3+
and Yb3+
in nearly stoichiometric LiNbO3
G. Malovichko*, 1
, V. Bratus2, M. Munro
1, E. Kokanyan
3, S. Okulov
2, and V. Grachev
1
1 Physics Department, Montana State University, Bozeman, MT 59717, USA 2 Institute of Semiconductors Physics, Kiev 03028, Ukraine 3 Institute of Physical Researches, Ashtarak 378410, Armenia
Received 9 July 2006, revised 21 October 2006, accepted 23 October 2006
Published online 9 March 2007
PACS 71.55.Ht, 76.30.Kg, 76.70.Dx, 77.84.Dy, 78.40.Ha
Lithium niobate crystals doped with neodymium and ytterbium were studied with the help of the electron
paramagnetic resonance (EPR), electron nuclear double resonance (ENDOR) and optical absorption.
Tremendous narrowing of magnetic resonance lines in nearly stoichiometric samples in comparison with
congruent ones allowed us to distinguish four non-equivalent centers (NEC) of Nd3+ and five NEC of
Yb3+, as well as line splitting caused by hyperfine interaction of neodymium electrons with nuclear spins
of magnetic isotopes 143Nd, 145Nd, 171Yb and 173Yb. It was shown that some of the centers has axial C3
symmetry, whereas all others have lowest C1 symmetry due to presence of intrinsic defects or/and charge
compensation defects in the near neighborhood of Nd3+ and Yb3+.
© 2007 WILEY-VCH Verlag GmbH & Co. KGaA, Weinheim
1 Introduction For many years Lithium Niobate (LN) has been of great interest for both fundamen-
tal science and applications because of the unusual richness of its ferro-, pyro- and piezoelectric proper-
ties. Conventional LN crystals, grown from a congruent melt with lithium deficiency (Xmelt = XCrystal ≈
48.4%, where X = [Li]/([Li]+[Nb]), contain some percent of intrinsic (non-stoichiometric) defects and,
consequently, have strong structural disorder. Crystals grown under special conditions from melts, to
which potassium has been added, have extremely low intrinsic defect concentrations. These samples,
called stoichiometric, have significantly decreased widths of spectral lines. This leads to the increased
resolution of the optical and EPR/ENDOR spectra.
The laser systems LiNbO3:Nd3+ (LN:Nd) and LiNbO3:Yb3+ (LN:Yb) are extensively studied by differ-
ent methods beginning 1967. Since spectroscopic and gain properties of a solid state laser strongly de-
pend on the location of the active ions in the host material, numerous publications were devoted to the
study of neodymium and ytterbium location and surrounding. First investigations of LN:Nd have re-
vealed one [1] and two [2] different Nd3+ centers. Later on, a resolution enhancement allowed to distin-
guish three [3] and even more [4, 5] NEC. It is remarkable that according to independent experiments -
Rutherford backscattering spectrometry (RBS) in combination with channeling [6, 7] and extended X-ray
absorption fine structure (EXAFS) [8, 9] – the Nd3+ ions substitute for Li+ in all NEC with slightly dif-
ferent displacement from the Li lattice site. The presence of NEC has been related to the defects associ-
ated with non-stoichiometry of LN. Similar results were also obtained for LN:Yb system [1, 4, 5, 10–12].
In order to obtain additional information about neodymium and ytterbium centers we carried out the
multifrequency EPR/ENDOR study of LN:Nd and LN:Yb crystals of different composition.
* Corresponding author: e-mail: [email protected], Phone: +1 406 994 3474, Fax: +1 406 994 4452
phys. stat. sol. (c) 4, No. 3 (2007) 1347
www.pss-c.com © 2007 WILEY-VCH Verlag GmbH & Co. KGaA, Weinheim
2 Crystals, equipment Two sets of the samples, grown by the Czochralski method and doped with
Nd2O3 or Yb2O3 in the melt, were used. One set of the crystals was grown from a congruent melt; an-
other set was grown under special conditions from the melt with the addition of potassium, leading to Li-
rich or nearly stoichiometric samples [13, 14]. Strong blue shift of the absorption edge (about 15-16 nm
for the absorption level equal to 20 cm–1) was observed in samples grown from melts with potassium. It
indicates that these samples have significantly reduced concentration of intrinsic defects (nearly
stoichiometric composition).
The EPR/ENDOR measurements were carried out in the temperature range T=4.2-50 K by means of
Bruker ELEXSYS 560 operating in X- and Q-bands (9.8 and 34.4-35 GHz).
3 The EPR spectra of congruent and stoichiometric samples Multiband structures of optical ab-
sorption were observed in both congruent and nearly stoichiometric crystals. The overlapped bands had
nearly the same widths in all samples. In contrast to optical spectra, line widths of observed EPR spectra
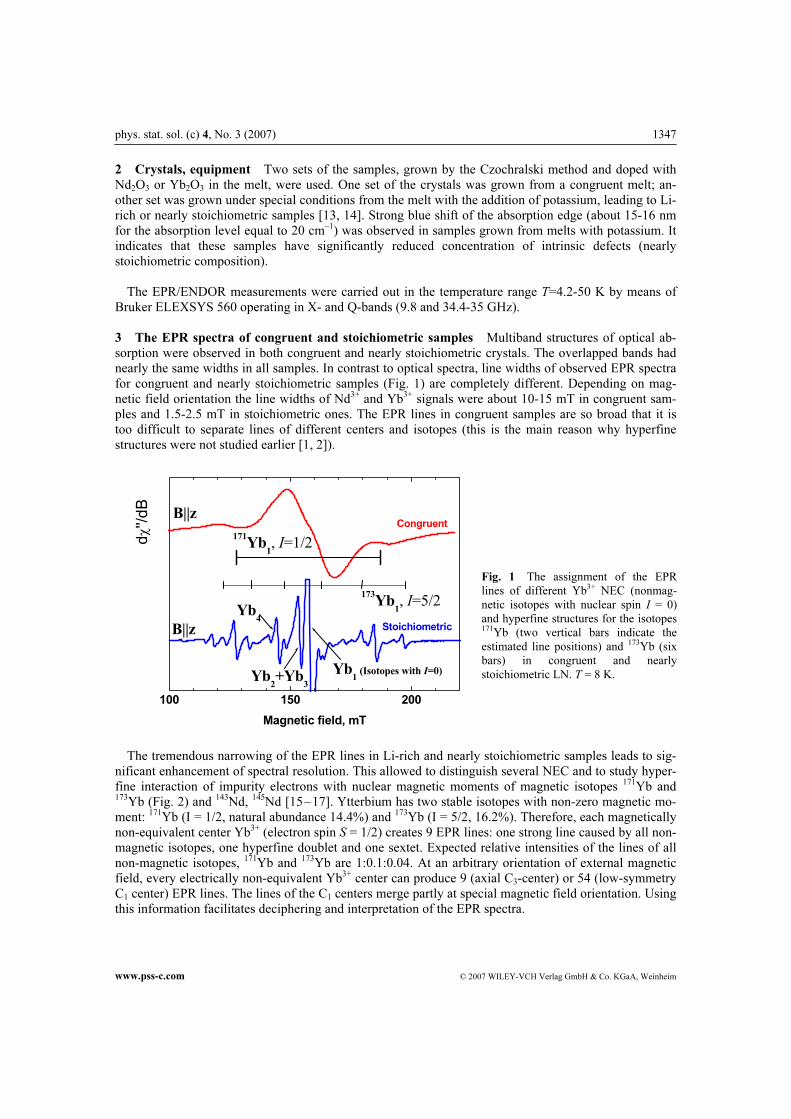
for congruent and nearly stoichiometric samples (Fig. 1) are completely different. Depending on mag-
netic field orientation the line widths of Nd3+ and Yb3+ signals were about 10-15 mT in congruent sam-
ples and 1.5-2.5 mT in stoichiometric ones. The EPR lines in congruent samples are so broad that it is
too difficult to separate lines of different centers and isotopes (this is the main reason why hyperfine
structures were not studied earlier [1, 2]).
100 150 200
dχ''/dB
Magnetic field, mT
Stoichiometric
Congruent
(Isotopes with I=0)
173
Yb1, I=5/2
Yb4
Yb2+Yb
3
Yb1
171
Yb1, I=1/2
B||z
B||z
The tremendous narrowing of the EPR lines in Li-rich and nearly stoichiometric samples leads to sig-
nificant enhancement of spectral resolution. This allowed to distinguish several NEC and to study hyper-
fine interaction of impurity electrons with nuclear magnetic moments of magnetic isotopes 171Yb and 173Yb (Fig. 2) and 143Nd, 145Nd [15–17]. Ytterbium has two stable isotopes with non-zero magnetic mo-
ment: 171Yb (I = 1/2, natural abundance 14.4%) and 173Yb (I = 5/2, 16.2%). Therefore, each magnetically
non-equivalent center Yb3+ (electron spin S = 1/2) creates 9 EPR lines: one strong line caused by all non-
magnetic isotopes, one hyperfine doublet and one sextet. Expected relative intensities of the lines of all
non-magnetic isotopes, 171Yb and 173Yb are 1:0.1:0.04. At an arbitrary orientation of external magnetic
field, every electrically non-equivalent Yb3+ center can produce 9 (axial C3-center) or 54 (low-symmetry
C1 center) EPR lines. The lines of the C1 centers merge partly at special magnetic field orientation. Using
this information facilitates deciphering and interpretation of the EPR spectra.
Fig. 1 The assignment of the EPR
lines of different Yb3+ NEC (nonmag-
netic isotopes with nuclear spin I = 0)
and hyperfine structures for the isotopes 171Yb (two vertical bars indicate the
estimated line positions) and 173Yb (six
bars) in congruent and nearly
stoichiometric LN. T = 8 K.
1348 G. Malovichko et al.: Multifrequency spectroscopy of Nd3+ and Yb3+ in stoichiometric LiNbO3
© 2007 WILEY-VCH Verlag GmbH & Co. KGaA, Weinheim www.pss-c.com
4 Multifrequency EPR investigations The multifrequency EPR investigations have many advan-
tages, especially, for the paramagnetic centers with electron spin S = 1/2 (like Nd3+ and Yb3+ ions). Us-
ing higher magnetic fields for Q- or W-band measurements leads to larger splitting between lines of
different centers and to better accuracy of the g-factor determination. It helps also to clarify mechanisms
of the EPR line broadening.
For Nd3+ and Yb3+ ions there are several basic mechanisms of line broadening: spin-lattice relaxation
(this mechanism is very important at high temperatures and negligible at liquid helium temperatures),
hyperfine interactions (they do not depend on crystal composition), and a distribution of local fields due
to crystal imperfections (this mechanism leads to a distribution of g-factors for Nd3+ and Yb3+). Since
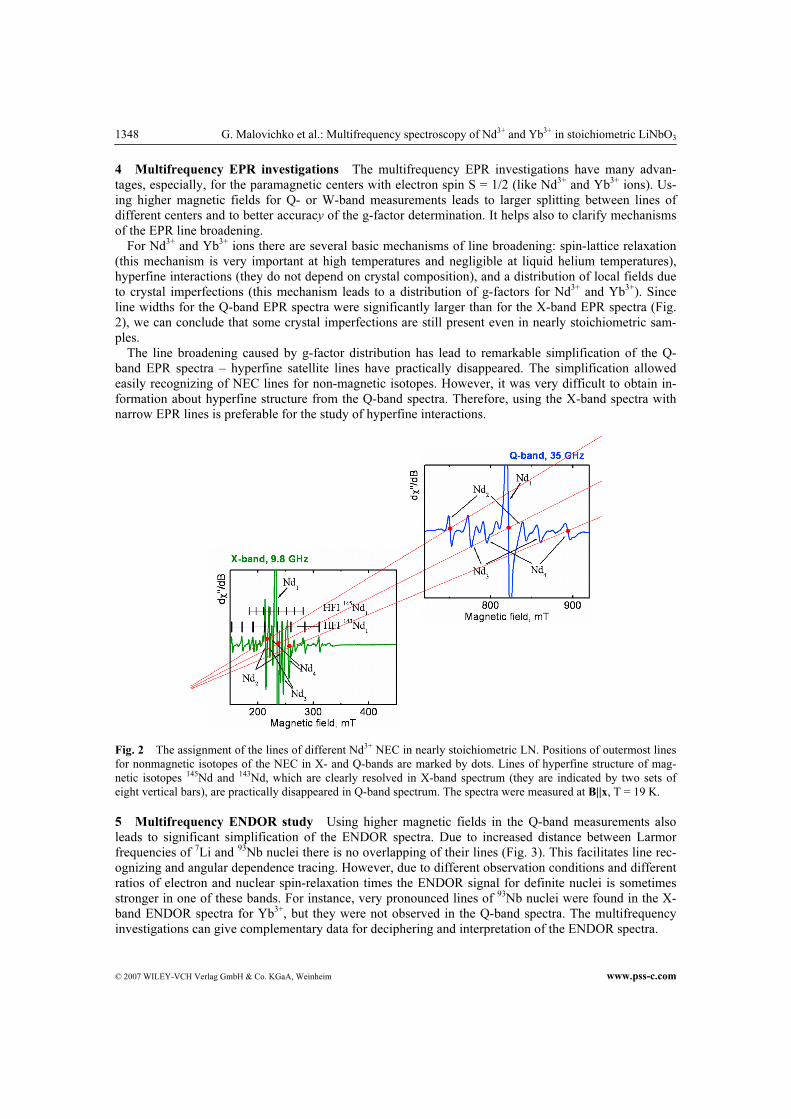
line widths for the Q-band EPR spectra were significantly larger than for the X-band EPR spectra (Fig.
2), we can conclude that some crystal imperfections are still present even in nearly stoichiometric sam-
ples.
The line broadening caused by g-factor distribution has lead to remarkable simplification of the Q-
band EPR spectra – hyperfine satellite lines have practically disappeared. The simplification allowed
easily recognizing of NEC lines for non-magnetic isotopes. However, it was very difficult to obtain in-
formation about hyperfine structure from the Q-band spectra. Therefore, using the X-band spectra with
narrow EPR lines is preferable for the study of hyperfine interactions.
Fig. 2 The assignment of the lines of different Nd3+ NEC in nearly stoichiometric LN. Positions of outermost lines
for nonmagnetic isotopes of the NEC in X- and Q-bands are marked by dots. Lines of hyperfine structure of mag-
netic isotopes 145Nd and 143Nd, which are clearly resolved in X-band spectrum (they are indicated by two sets of
eight vertical bars), are practically disappeared in Q-band spectrum. The spectra were measured at B||x, T = 19 K.
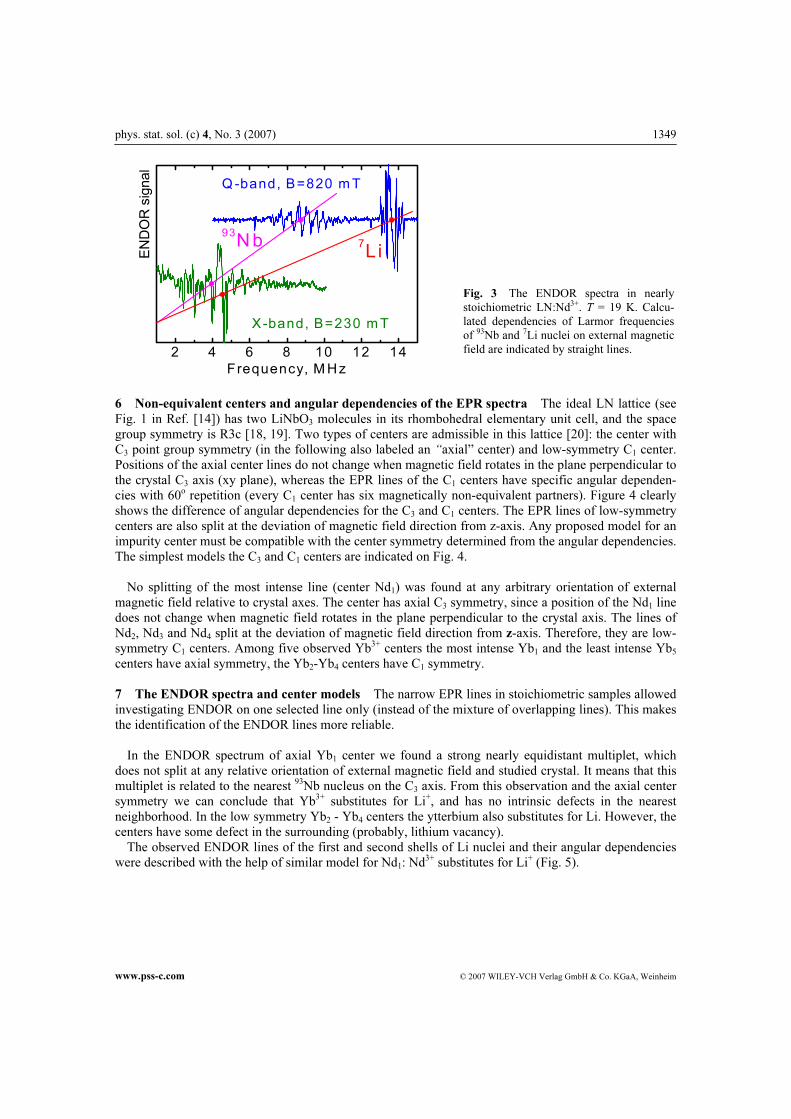
5 Multifrequency ENDOR study Using higher magnetic fields in the Q-band measurements also
leads to significant simplification of the ENDOR spectra. Due to increased distance between Larmor
frequencies of 7Li and 93Nb nuclei there is no overlapping of their lines (Fig. 3). This facilitates line rec-
ognizing and angular dependence tracing. However, due to different observation conditions and different
ratios of electron and nuclear spin-relaxation times the ENDOR signal for definite nuclei is sometimes
stronger in one of these bands. For instance, very pronounced lines of 93Nb nuclei were found in the X-
band ENDOR spectra for Yb3+, but they were not observed in the Q-band spectra. The multifrequency
investigations can give complementary data for deciphering and interpretation of the ENDOR spectra.
phys. stat. sol. (c) 4, No. 3 (2007) 1349
www.pss-c.com © 2007 WILEY-VCH Verlag GmbH & Co. KGaA, Weinheim
2 4 6 8 10 12 14
EN
DO
R s
ignal
Frequency, M Hz
7
Li
93
Nb
Q -band, B=820 m T
X-band, B=230 m T
6 Non-equivalent centers and angular dependencies of the EPR spectra The ideal LN lattice (see
Fig. 1 in Ref. [14]) has two LiNbO3 molecules in its rhombohedral elementary unit cell, and the space
group symmetry is R3c [18, 19]. Two types of centers are admissible in this lattice [20]: the center with
C3 point group symmetry (in the following also labeled an “axial” center) and low-symmetry C1 center.
Positions of the axial center lines do not change when magnetic field rotates in the plane perpendicular to
the crystal C3 axis (xy plane), whereas the EPR lines of the C1 centers have specific angular dependen-
cies with 60o repetition (every C1 center has six magnetically non-equivalent partners). Figure 4 clearly
shows the difference of angular dependencies for the C3 and C1 centers. The EPR lines of low-symmetry
centers are also split at the deviation of magnetic field direction from z-axis. Any proposed model for an
impurity center must be compatible with the center symmetry determined from the angular dependencies.
The simplest models the C3 and C1 centers are indicated on Fig. 4.
No splitting of the most intense line (center Nd1) was found at any arbitrary orientation of external
magnetic field relative to crystal axes. The center has axial C3 symmetry, since a position of the Nd1 line
does not change when magnetic field rotates in the plane perpendicular to the crystal axis. The lines of
Nd2, Nd3 and Nd4 split at the deviation of magnetic field direction from z-axis. Therefore, they are low-
symmetry C1 centers. Among five observed Yb3+ centers the most intense Yb1 and the least intense Yb5
centers have axial symmetry, the Yb2-Yb4 centers have C1 symmetry.
7 The ENDOR spectra and center models The narrow EPR lines in stoichiometric samples allowed
investigating ENDOR on one selected line only (instead of the mixture of overlapping lines). This makes
the identification of the ENDOR lines more reliable.
In the ENDOR spectrum of axial Yb1 center we found a strong nearly equidistant multiplet, which
does not split at any relative orientation of external magnetic field and studied crystal. It means that this
multiplet is related to the nearest 93Nb nucleus on the C3 axis. From this observation and the axial center
symmetry we can conclude that Yb3+ substitutes for Li+, and has no intrinsic defects in the nearest
neighborhood. In the low symmetry Yb2 - Yb4 centers the ytterbium also substitutes for Li. However, the
centers have some defect in the surrounding (probably, lithium vacancy).
The observed ENDOR lines of the first and second shells of Li nuclei and their angular dependencies
were described with the help of similar model for Nd1: Nd3+ substitutes for Li+ (Fig. 5).
Fig. 3 The ENDOR spectra in nearly
stoichiometric LN:Nd3+. T = 19 K. Calcu-
lated dependencies of Larmor frequencies
of 93Nb and 7Li nuclei on external magnetic
field are indicated by straight lines.

1350 G. Malovichko et al.: Multifrequency spectroscopy of Nd3+ and Yb3+ in stoichiometric LiNbO3
© 2007 WILEY-VCH Verlag GmbH & Co. KGaA, Weinheim www.pss-c.com
Fig. 4 Angular dependencies of the EPR spectra in nearly stoichiometric LN:Nd3+ (Q-band) and LN:Yb3+ X-band.
Fig. 5 Typical ENDOR spectrum of nearly stoichiometric LN:Nd3+, a high-frequency fragment of angular de-
pendence of the ENDOR spectra, a proposed model of axial Nd3+ center and correspondence of observed ENDOR
lines and shells of lithium nuclei (indicated by arrows). T = 19 K, Q-band, B = 821 mT.
phys. stat. sol. (c) 4, No. 3 (2007) 1351
www.pss-c.com © 2007 WILEY-VCH Verlag GmbH & Co. KGaA, Weinheim
8 Conclusion The presence of nonequivalent centers manifests itself in both optical and EPR spectra.
In studied samples grown from melts with potassium the observed EPR lines are ten times narrower than
for congruent samples, and the concentration of intrinsic defects in the bulk is significantly reduced.
Therefore, stoichiometric LN:Nd3+ and LN:Yb3+ can be considered as promising materials for the con-
struction of high efficiency lasers with frequency doubling [21].
Using multifrequency EPR/ENDOR investigations facilitates deciphering and interpretation of ob-
served spectra. The lattice positions of the Nd3+ and Yb3+ ions derived from the EPR and ENDOR data
are in agreement with results of the cited above RBS, EXAFS and optical studies. The EPR/ENDOR
data have led to noteworthy progress in the determination of the surrounding of Nd3+ and Yb3+ in LN.
Carried our study of the laser active impurity defects on the atomic level is important and helpful for
fundamental and applied science, as well as for theoretical calculations [22].
Acknowledgements. The research was supported by National Science Foundation (project DMR-0307267) and
Montana Board of Research and Commercialization Technology.
References
[1] G. Burns, D. F. O’Kane, and R. S. Title, Phys. Rev. 167, 314 (1968).
[2] N. F. Evlanova, L. S. Kornienko, L. N. Rashkovich, and A. O. Rybaltovskii, Sov. JETP 53, 1920 (1967).
[3] G. Lifante, Chem. Phys. Lett. 176, 482 (1991).
[4] J. Garcia Sole, L. E. Bausa, D. Jaque, E. Monoya, H. Murrieta, and F. Jaque, Spectrochim. Acta A 54, 1571
(1998).
[5] I. Sokolska, I. Praska, and T. Lukasievicz, J. Cryst. Growth 198/199, 521 (1999).
[6] B. Herreros, G. Lifante, A. Kling, J. C. Soares, M. F. da Silva, P. D. Townsend, P. J. Chandler, J. Olivares,
and J. M. Cabrera, Opt. Mater. 6, 281 (1996).
[7] A. Lorenzo, H. Loro, J. E. Munoz Santiuste, M. C. Terrile, G. Boulon, L. E. Bause, and J. Garcia Sole, Opt.
Mater. 8, 55 (1997).
[8] C. Prieto, Opt. Mater. 12, 135 (1999).
[9] M. Vila, A. de Bernabe, and C. Prieto, J. Alloys Compd. 323/324, 331 (2001).
[10] C. Bonardi, C. J. Magon, E. A. Vidoto, M. C. Terrile, L. E. Bausa, E. Montoya, D. Bravo, A. Martın,
and F. J. Lopez, J. Alloys Compd. 323/324, 340 (2001).
[11] E. Camarillo, J. Hernandez, J. Garcia Sole, U. Caldino, J. E. Munoz Santiuste, H. Loro, M. Voda, F. Jaque,
and H. Murrieta, J. Phys.: Condens. Matter 7, 9635 (1995).
[12] C. Bonardi, R. A. Carvalho, H. C. Basso, M. C. Terrile, G. K. Cruz, L. E. Bausa, and J. Garcia Sole, J. Chem.
Phys. 111, 6042 (1999).
[13] G. I. Malovichko, V. G. Grachev, L. P. Yurchenko, V. Ya. Proshko, E. P. Kokanyan, and V. T. Gabrielyan,
phys. stat. sol. (a) 133, K29 (1992).
[14] G. I. Malovichko, V. G. Grachev, E. P. Kokanyan, O. F. Schirmer, K. Betzler, B. Gather, F. Jermann, S. Klau-
er, U. Schlarb, and M. Wöhlecke, Appl. Phys. A 56, 103 (1993).
[15] G. Malovichko, V. Grachev, and O. Schirmer, Appl. Phys. B 68, 785 (1999).
[16] S. H. Choh, J. H. Kim, I. W. Park, H. J. Kim, D. Choi, and S. S. Kim, Appl. Magn. Res. 24, 313 (2003).
[17] G. Malovichko, V. Grachev, S. Okulov, E. Kokanyan, F. Henecker, A. Hofstaetter, and O. Schirmer, phys. stat.
sol. (b) 243, 409 (2006).
[18] A. Räuber, in: Current Topics in Material Sciences, Vol. 1, edited by E. Kaldis (North-Holland, Amsterdam,
1978), p. 481.
[19] S. C. Abrahams, J. M. Reddy, and J. L. Bernstein, J. Phys. Chem. Solids 27, 997 (1966).
[20] G. Malovichko, V. Grachev, E. Kokanyan, and O. Schirmer, Phys. Rev. B 59, 9113 (1999).
[21] E. Cantelar, G. A. Torchia, J. A. Sanz-Garcıa, P. L. Pernas, G. Lifante, and F. Cusso, Appl. Phys. Lett. 83,
2991 (2003).
[22] Hui-Ning Dong, Shao-Yi Wu, and Wen-Chen Zheng, J. Phys. Chem. Solids 64, 695 (2003).