A direct sulfation method for introducing the transition metal cation Co 2+ into ZrO 2 with little...
9
A direct sulfation method for introducing the transition metal cation Co 2+ into ZrO 2 with little change in the Brønsted acid sites Xiangjie Wang, Huayu Wang, Yongchun Liu, Fudong Liu, Yunbo Yu ⇑ , Hong He ⇑ State Key Laboratory of Environmental Chemistry and Ecotoxicology, Research Center for Eco-environmental Sciences, Chinese Academy of Sciences, 18 Shuangqing Road, Haidian District, Beijing 100085, China article info Article history: Received 12 November 2010 Revised 24 January 2011 Accepted 25 January 2011 Keywords: Sulfation Solid acid Selective catalytic reduction Solid solution abstract Direct sulfation of Zr–Co hydroxides provides a significant advantage over traditional impregnation by conserving Brønsted acid sites for the introduction of a second active component and also for subsequent catalytic reactions. After Pd loading, sulfated Zr–Co exhibits excellent activity, selectivity, and durability for the selective catalytic reduction of NO x by methane. Using Co K-edge X-ray absorption spectroscopy, we provide the direct evidence of the entrance of Co into the lattice of cubic zirconia to form a substitu- tional solid solution. Ó 2011 Elsevier Inc. All rights reserved. 1. Introduction Sulfated metal oxides with both Brønsted and Lewis acid sites are widely used as solid acid catalysts and/or supports in organic synthesis, transformation reactions, and NO x removal [1–7]. Of particular interest is sulfated zirconia, which possesses more acid sites than other sulfated metal oxides [8–13]. Zirconia exists in several crystalline forms: monoclinic, tetragonal, and cubic. It ex- ists mainly in the tetragonal phase in the presence of S [14,15]. Using periodic ab initio calculations, Haase and Sauer [16] sug- gested that the most stable configurations of sulfur species on the surface of tetragonal zirconia are the tridentate sulfate anion and the –SO 3 complex. Details of the type and number of acid sites on sulfated zirconia have been identified by 13 C NMR, 31 P NMR, and pyridine adsorption [17–19]. To further improve the properties of sulfated zirconia, active component transition metal cations have been introduced into sulfated zirconia by impregnation. Li et al. [19,20] reported that the loading of Co over sulfated zirconia exhibits high activity for the selective catalytic reduction of NO x by methane. Mn 2+ and Fe 3+ show significant catalytic effects on n-butane isomerization over sulfated zirconia [21–25]. Arata and co-workers [26] reported that Pt-added sulfated zirconia was ac- tive for the dehydrogenative coupling of methane. However, this conventional impregnation method often decreases the number of Brønsted acid sites, since these sites are preferentially occupied by the cations introduced, such as Co [19] and Pd [27,28]. As Brønsted acid sites play a crucial role both in anchoring other ac- tive components and in catalytic reactions [29–31], such a de- crease would cause deterioration in the intrinsic properties of solid acid materials. Thus, designing and implementing new meth- ods for the introduction of transition metals into sulfated zirconia while minimizing the consumption of Brønsted acid sites is of par- ticular importance. In the present study, the selective catalytic reduction of NO x by methane (CH 4 -SCR) was used as a probe reaction because the num- ber of Brønsted acid sites is very important for this reaction [32– 38]. Sulfated zirconia is commonly used as a support for catalysts used in CH 4 -SCR [39–47]. Both Co 2+ and Pd 2+ are further intro- duced into sulfated zirconia to enhance its activity and durability [39,40,42,43]. The Co species in previous studies were introduced by impregnation at the expense of Brønsted acid sites. Thus, it is important to find a new method of introducing Co 2+ into zirconia with little change in the Brønsted acid sites. Here, the direct sulfa- tion of Zr–Co hydroxides is employed to introduce Co species. The number of Brønsted acid sites on sulfated Zr–Co oxide (denoted as SZC) prepared by this method was much larger than that on zirco- nia prepared by the impregnation method. As a result, sufficient Brønsted acid sites are left available for the introduction of a sec- ond active component and subsequent catalytic reactions. Specifi- cally, a SZC-supported Pd catalyst (PdSZC) was further prepared by the impregnation method. As expected, PdSZC showed high activ- ity toward CH 4 -SCR. 0021-9517/$ - see front matter Ó 2011 Elsevier Inc. All rights reserved. doi:10.1016/j.jcat.2011.01.026 ⇑ Corresponding authors. Fax: +86 10 6284 9121. E-mail addresses: [email protected] (Y. Yu), [email protected] (H. He). Journal of Catalysis 279 (2011) 301–309 Contents lists available at ScienceDirect Journal of Catalysis journal homepage: www.elsevier.com/locate/jcat
Transcript of A direct sulfation method for introducing the transition metal cation Co 2+ into ZrO 2 with little...
Journal of Catalysis 279 (2011) 301–309
Contents lists available at ScienceDirect
Journal of Catalysis
journal homepage: www.elsevier .com/locate / jcat
A direct sulfation method for introducing the transition metal cation Co2+ intoZrO2 with little change in the Brønsted acid sites
Xiangjie Wang, Huayu Wang, Yongchun Liu, Fudong Liu, Yunbo Yu ⇑, Hong He ⇑State Key Laboratory of Environmental Chemistry and Ecotoxicology, Research Center for Eco-environmental Sciences, Chinese Academy of Sciences, 18 Shuangqing Road,Haidian District, Beijing 100085, China
a r t i c l e i n f o a b s t r a c t
Article history:Received 12 November 2010Revised 24 January 2011Accepted 25 January 2011
Keywords:SulfationSolid acidSelective catalytic reductionSolid solution
0021-9517/$ - see front matter � 2011 Elsevier Inc. Adoi:10.1016/j.jcat.2011.01.026
⇑ Corresponding authors. Fax: +86 10 6284 9121.E-mail addresses: [email protected] (Y. Yu), hongh
Direct sulfation of Zr–Co hydroxides provides a significant advantage over traditional impregnation byconserving Brønsted acid sites for the introduction of a second active component and also for subsequentcatalytic reactions. After Pd loading, sulfated Zr–Co exhibits excellent activity, selectivity, and durabilityfor the selective catalytic reduction of NOx by methane. Using Co K-edge X-ray absorption spectroscopy,we provide the direct evidence of the entrance of Co into the lattice of cubic zirconia to form a substitu-tional solid solution.
� 2011 Elsevier Inc. All rights reserved.
1. Introduction
Sulfated metal oxides with both Brønsted and Lewis acid sitesare widely used as solid acid catalysts and/or supports in organicsynthesis, transformation reactions, and NOx removal [1–7]. Ofparticular interest is sulfated zirconia, which possesses more acidsites than other sulfated metal oxides [8–13]. Zirconia exists inseveral crystalline forms: monoclinic, tetragonal, and cubic. It ex-ists mainly in the tetragonal phase in the presence of S [14,15].Using periodic ab initio calculations, Haase and Sauer [16] sug-gested that the most stable configurations of sulfur species onthe surface of tetragonal zirconia are the tridentate sulfate anionand the –SO3 complex. Details of the type and number of acid siteson sulfated zirconia have been identified by 13C NMR, 31P NMR, andpyridine adsorption [17–19]. To further improve the properties ofsulfated zirconia, active component transition metal cations havebeen introduced into sulfated zirconia by impregnation. Li et al.[19,20] reported that the loading of Co over sulfated zirconiaexhibits high activity for the selective catalytic reduction of NOx
by methane. Mn2+ and Fe3+ show significant catalytic effects onn-butane isomerization over sulfated zirconia [21–25]. Arata andco-workers [26] reported that Pt-added sulfated zirconia was ac-tive for the dehydrogenative coupling of methane. However, thisconventional impregnation method often decreases the number
ll rights reserved.
[email protected] (H. He).
of Brønsted acid sites, since these sites are preferentially occupiedby the cations introduced, such as Co [19] and Pd [27,28]. AsBrønsted acid sites play a crucial role both in anchoring other ac-tive components and in catalytic reactions [29–31], such a de-crease would cause deterioration in the intrinsic properties ofsolid acid materials. Thus, designing and implementing new meth-ods for the introduction of transition metals into sulfated zirconiawhile minimizing the consumption of Brønsted acid sites is of par-ticular importance.
In the present study, the selective catalytic reduction of NOx bymethane (CH4-SCR) was used as a probe reaction because the num-ber of Brønsted acid sites is very important for this reaction [32–38]. Sulfated zirconia is commonly used as a support for catalystsused in CH4-SCR [39–47]. Both Co2+ and Pd2+ are further intro-duced into sulfated zirconia to enhance its activity and durability[39,40,42,43]. The Co species in previous studies were introducedby impregnation at the expense of Brønsted acid sites. Thus, it isimportant to find a new method of introducing Co2+ into zirconiawith little change in the Brønsted acid sites. Here, the direct sulfa-tion of Zr–Co hydroxides is employed to introduce Co species. Thenumber of Brønsted acid sites on sulfated Zr–Co oxide (denoted asSZC) prepared by this method was much larger than that on zirco-nia prepared by the impregnation method. As a result, sufficientBrønsted acid sites are left available for the introduction of a sec-ond active component and subsequent catalytic reactions. Specifi-cally, a SZC-supported Pd catalyst (PdSZC) was further prepared bythe impregnation method. As expected, PdSZC showed high activ-ity toward CH4-SCR.
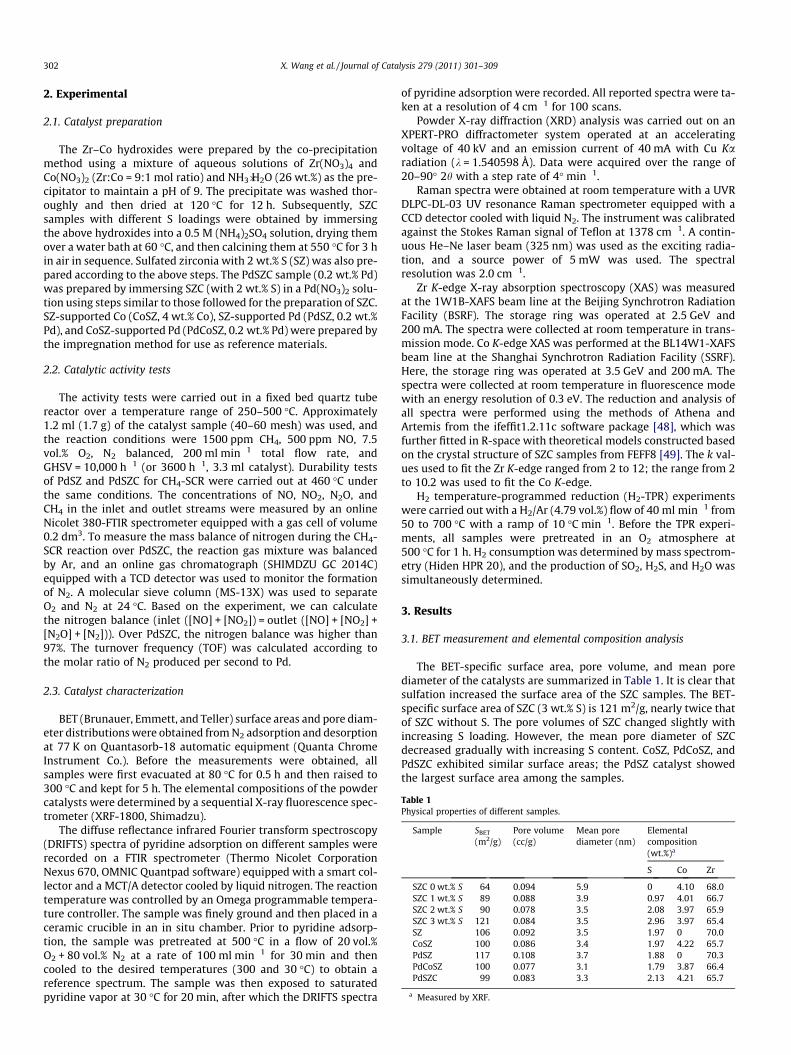
Table 1Physical properties of different samples.
Sample SBET
(m2/g)Pore volume(cc/g)
Mean porediameter (nm)
Elementalcomposition(wt.%)a
S Co Zr
SZC 0 wt.% S 64 0.094 5.9 0 4.10 68.0SZC 1 wt.% S 89 0.088 3.9 0.97 4.01 66.7SZC 2 wt.% S 90 0.078 3.5 2.08 3.97 65.9SZC 3 wt.% S 121 0.084 3.5 2.96 3.97 65.4SZ 106 0.092 3.5 1.97 0 70.0CoSZ 100 0.086 3.4 1.97 4.22 65.7PdSZ 117 0.108 3.7 1.88 0 70.3PdCoSZ 100 0.077 3.1 1.79 3.87 66.4PdSZC 99 0.083 3.3 2.13 4.21 65.7
a Measured by XRF.
302 X. Wang et al. / Journal of Catalysis 279 (2011) 301–309
2. Experimental
2.1. Catalyst preparation
The Zr–Co hydroxides were prepared by the co-precipitationmethod using a mixture of aqueous solutions of Zr(NO3)4 andCo(NO3)2 (Zr:Co = 9:1 mol ratio) and NH3�H2O (26 wt.%) as the pre-cipitator to maintain a pH of 9. The precipitate was washed thor-oughly and then dried at 120 �C for 12 h. Subsequently, SZCsamples with different S loadings were obtained by immersingthe above hydroxides into a 0.5 M (NH4)2SO4 solution, drying themover a water bath at 60 �C, and then calcining them at 550 �C for 3 hin air in sequence. Sulfated zirconia with 2 wt.% S (SZ) was also pre-pared according to the above steps. The PdSZC sample (0.2 wt.% Pd)was prepared by immersing SZC (with 2 wt.% S) in a Pd(NO3)2 solu-tion using steps similar to those followed for the preparation of SZC.SZ-supported Co (CoSZ, 4 wt.% Co), SZ-supported Pd (PdSZ, 0.2 wt.%Pd), and CoSZ-supported Pd (PdCoSZ, 0.2 wt.% Pd) were prepared bythe impregnation method for use as reference materials.
2.2. Catalytic activity tests
The activity tests were carried out in a fixed bed quartz tubereactor over a temperature range of 250–500 �C. Approximately1.2 ml (1.7 g) of the catalyst sample (40–60 mesh) was used, andthe reaction conditions were 1500 ppm CH4, 500 ppm NO, 7.5vol.% O2, N2 balanced, 200 ml min�1 total flow rate, andGHSV = 10,000 h�1 (or 3600 h�1, 3.3 ml catalyst). Durability testsof PdSZ and PdSZC for CH4-SCR were carried out at 460 �C underthe same conditions. The concentrations of NO, NO2, N2O, andCH4 in the inlet and outlet streams were measured by an onlineNicolet 380-FTIR spectrometer equipped with a gas cell of volume0.2 dm3. To measure the mass balance of nitrogen during the CH4-SCR reaction over PdSZC, the reaction gas mixture was balancedby Ar, and an online gas chromatograph (SHIMDZU GC 2014C)equipped with a TCD detector was used to monitor the formationof N2. A molecular sieve column (MS-13X) was used to separateO2 and N2 at 24 �C. Based on the experiment, we can calculatethe nitrogen balance (inlet ([NO] + [NO2]) = outlet ([NO] + [NO2] +[N2O] + [N2])). Over PdSZC, the nitrogen balance was higher than97%. The turnover frequency (TOF) was calculated according tothe molar ratio of N2 produced per second to Pd.
2.3. Catalyst characterization
BET (Brunauer, Emmett, and Teller) surface areas and pore diam-eter distributions were obtained from N2 adsorption and desorptionat 77 K on Quantasorb-18 automatic equipment (Quanta ChromeInstrument Co.). Before the measurements were obtained, allsamples were first evacuated at 80 �C for 0.5 h and then raised to300 �C and kept for 5 h. The elemental compositions of the powdercatalysts were determined by a sequential X-ray fluorescence spec-trometer (XRF-1800, Shimadzu).
The diffuse reflectance infrared Fourier transform spectroscopy(DRIFTS) spectra of pyridine adsorption on different samples wererecorded on a FTIR spectrometer (Thermo Nicolet CorporationNexus 670, OMNIC Quantpad software) equipped with a smart col-lector and a MCT/A detector cooled by liquid nitrogen. The reactiontemperature was controlled by an Omega programmable tempera-ture controller. The sample was finely ground and then placed in aceramic crucible in an in situ chamber. Prior to pyridine adsorp-tion, the sample was pretreated at 500 �C in a flow of 20 vol.%O2 + 80 vol.% N2 at a rate of 100 ml min�1 for 30 min and thencooled to the desired temperatures (300 and 30 �C) to obtain areference spectrum. The sample was then exposed to saturatedpyridine vapor at 30 �C for 20 min, after which the DRIFTS spectra
of pyridine adsorption were recorded. All reported spectra were ta-ken at a resolution of 4 cm�1 for 100 scans.
Powder X-ray diffraction (XRD) analysis was carried out on anXPERT-PRO diffractometer system operated at an acceleratingvoltage of 40 kV and an emission current of 40 mA with Cu Karadiation (k = 1.540598 Å). Data were acquired over the range of20–90� 2h with a step rate of 4� min�1.
Raman spectra were obtained at room temperature with a UVRDLPC-DL-03 UV resonance Raman spectrometer equipped with aCCD detector cooled with liquid N2. The instrument was calibratedagainst the Stokes Raman signal of Teflon at 1378 cm�1. A contin-uous He–Ne laser beam (325 nm) was used as the exciting radia-tion, and a source power of 5 mW was used. The spectralresolution was 2.0 cm�1.
Zr K-edge X-ray absorption spectroscopy (XAS) was measuredat the 1W1B-XAFS beam line at the Beijing Synchrotron RadiationFacility (BSRF). The storage ring was operated at 2.5 GeV and200 mA. The spectra were collected at room temperature in trans-mission mode. Co K-edge XAS was performed at the BL14W1-XAFSbeam line at the Shanghai Synchrotron Radiation Facility (SSRF).Here, the storage ring was operated at 3.5 GeV and 200 mA. Thespectra were collected at room temperature in fluorescence modewith an energy resolution of 0.3 eV. The reduction and analysis ofall spectra were performed using the methods of Athena andArtemis from the ifeffit1.2.11c software package [48], which wasfurther fitted in R-space with theoretical models constructed basedon the crystal structure of SZC samples from FEFF8 [49]. The k val-ues used to fit the Zr K-edge ranged from 2 to 12; the range from 2to 10.2 was used to fit the Co K-edge.
H2 temperature-programmed reduction (H2-TPR) experimentswere carried out with a H2/Ar (4.79 vol.%) flow of 40 ml min�1 from50 to 700 �C with a ramp of 10 �C min�1. Before the TPR experi-ments, all samples were pretreated in an O2 atmosphere at500 �C for 1 h. H2 consumption was determined by mass spectrom-etry (Hiden HPR 20), and the production of SO2, H2S, and H2O wassimultaneously determined.
3. Results
3.1. BET measurement and elemental composition analysis
The BET-specific surface area, pore volume, and mean porediameter of the catalysts are summarized in Table 1. It is clear thatsulfation increased the surface area of the SZC samples. The BET-specific surface area of SZC (3 wt.% S) is 121 m2/g, nearly twice thatof SZC without S. The pore volumes of SZC changed slightly withincreasing S loading. However, the mean pore diameter of SZCdecreased gradually with increasing S content. CoSZ, PdCoSZ, andPdSZC exhibited similar surface areas; the PdSZ catalyst showedthe largest surface area among the samples.
X. Wang et al. / Journal of Catalysis 279 (2011) 301–309 303
The elemental compositions of the SZ, CoSZ, SZC, and Pd-addedcatalysts were measured by XRF, with the results shown in Table 1.Clearly, the S and Co content in all samples was almost identical tothe corresponding nominal values. This proves that the two speciesdo not dissolve into the aqueous solution during the sequentialimmersion process. The Pd species was not detected by XRF, likelydue to its low concentration (0.2 wt.%).
3.2. Pyridine adsorption experiment
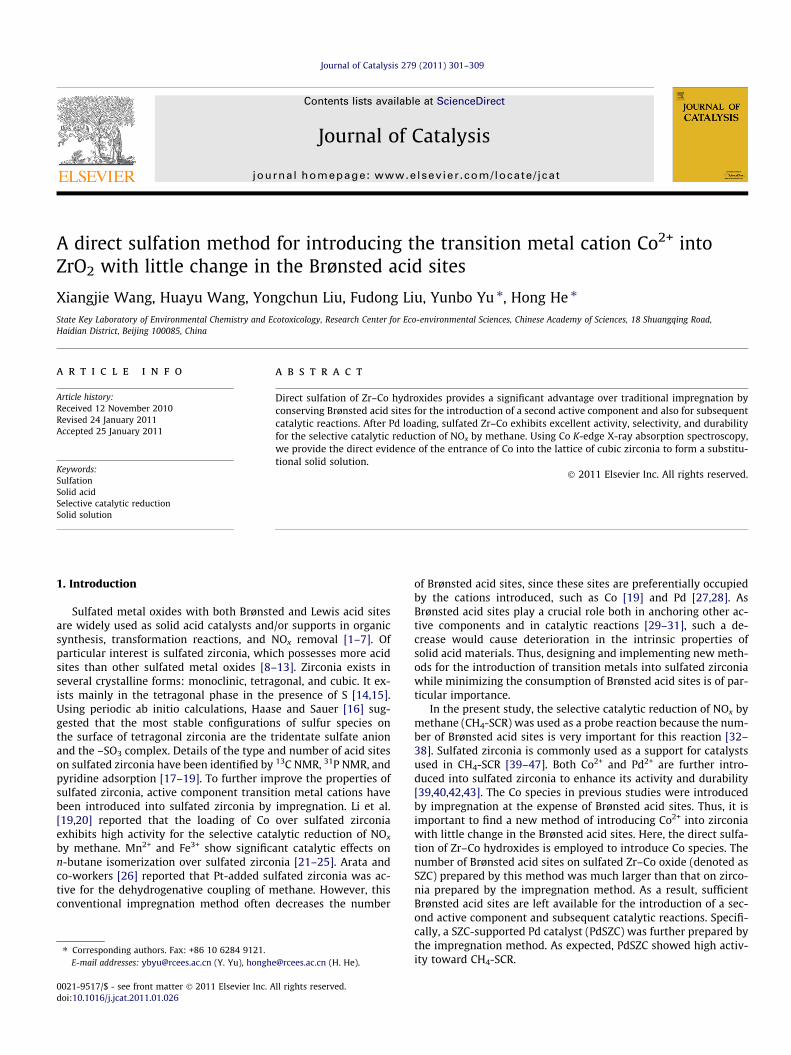
Pyridine adsorption was used to determine the acid sites andthe acidity on SZC samples with different S loadings (Fig. 1a). Thebands at 1439 and 1541 cm�1 were attributed to the characteris-tics of adsorbed pyridine bound to Lewis and Brønsted acid sites,respectively [19]. The Brønsted acid sites on the SZC samples in-creased perceptibly as the S content increased from 0 to 2 wt.%,but they decreased when the S content was further increased to3 wt.%. Meanwhile, the Lewis acid sites increased significantly withS addition. The same pyridine adsorption experiment was also per-formed on SZ, CoSZ, PdSZC, and PdCoSZ samples (Fig. 1b). The num-ber of Brønsted acid sites on SZC was larger than that on CoSZ withthe same Co and S content. In comparison with SZC (with 2 wt.% S),the Brønsted acid sites on the PdSZC catalyst decreased sharply.This trend shows that the introduction of Pd consumes Brønstedacid sites. In other words, Pd species with the form Pd2+ are an-chored to Brønsted acid sites [27,28,33,34]. Pd species in thePdCoSZ catalyst were difficult to anchor onto Brønsted acid sites,
Fig. 1. DRIFT spectra of pyridine adsorption at 30 �C over (a) SZC with different Sloadings; (b) samples containing 2 wt.% S prepared by direct sulfation andtraditional impregnation methods.
considering that the Brønsted acid sites in CoSZ hardly changedwith Pd introduction. In PdCoSZ, Pd may exist in the form ofPdO. To examine the strength of Brønsted acids, samples wereheated from 30 to 300 �C under N2 flow after pyridine adsorption.The SZC sample with 2 wt.% S maintained nearly the sameBrønsted acidity as SZ, which was also more abundant than thatof CoSZ (Fig. 2b). Thus, we successfully developed a new methodfor the introduction of Co into ZrO2 with little change in the num-ber of Brønsted acid sites. A peak at 1444 cm�1 was observed for allCo-containing samples in Fig. 1b; this peak was assigned to the Le-wis acid sites related to Co species that were anchored to theBrønsted sites formed by sulfation.
3.3. XRD characterization
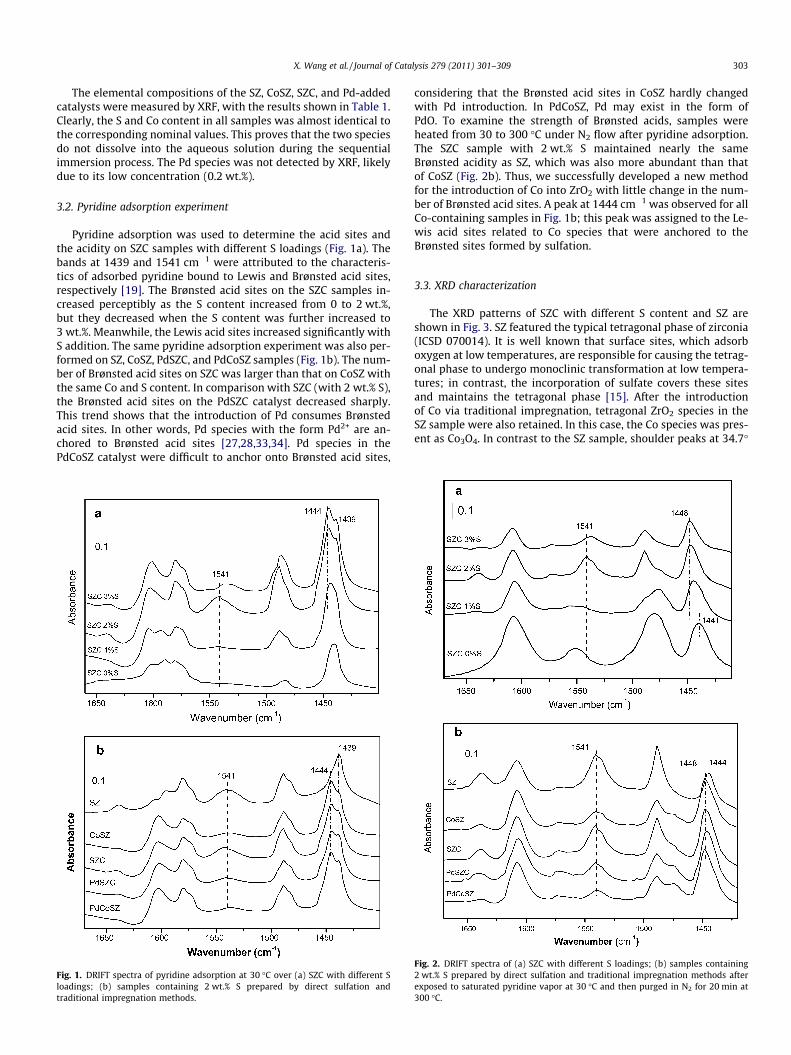
The XRD patterns of SZC with different S content and SZ areshown in Fig. 3. SZ featured the typical tetragonal phase of zirconia(ICSD 070014). It is well known that surface sites, which adsorboxygen at low temperatures, are responsible for causing the tetrag-onal phase to undergo monoclinic transformation at low tempera-tures; in contrast, the incorporation of sulfate covers these sitesand maintains the tetragonal phase [15]. After the introductionof Co via traditional impregnation, tetragonal ZrO2 species in theSZ sample were also retained. In this case, the Co species was pres-ent as Co3O4. In contrast to the SZ sample, shoulder peaks at 34.7�
Fig. 2. DRIFT spectra of (a) SZC with different S loadings; (b) samples containing2 wt.% S prepared by direct sulfation and traditional impregnation methods afterexposed to saturated pyridine vapor at 30 �C and then purged in N2 for 20 min at300 �C.
Fig. 3. (a) XRD patterns of SZ and SZC with different S loadings; (b) XRD patterns of SZ, CoSZ, and SZC with 2 wt.% S.
Table 2Determination of crystalline phase (cubic or tetragonal) of SZC samples with differentS content and SZ from X-ray diffraction analysis. EXPGUI software of GSAS (GeneralStructure Analysis System) was used.
Sample Crystallinephase
Lattice constant(Å)
Rp
(%)Rwp
(%)R (F2)(%)
SZC 0 wt.% S Cubica a = 5.100004 2.22 2.89 2.01SZC 1 wt.% S Cubica a = 5.104160 2.17 3.23 2.75SZC 2 wt.% S Cubica a = 5.105236 2.11 2.86 3.80SZC 3 wt.% S Cubica a = 5.106705 2.89 5.19 1.65SZ 2 wt.% S Tetragonalb a = 3.599640
b = 5.180907 2.78 3.82 2.92
304 X. Wang et al. / Journal of Catalysis 279 (2011) 301–309
(0 0 2) and 59.5� (1 0 3) disappeared obviously in the SZC samples,strongly suggesting that phase transformation occurred due to theaddition of Co and that a cubic phase may be present in the SZCsamples (ICSD 072955).
To examine the index and identify the phase of the samples,XRD pattern refinement with GSAS was performed using EXPGUIsoftware [50], the results of which are shown in Table 2. The cu-bic phase was present in the SZC samples, with lattice constantsrising slowly from 5.100004 to 5.106705 Å with increasing Sloading.
a Space group f m 3 m.b Space group P 42/n m c.
3.4. Raman characterization
The Raman spectra of SZ and SZC are shown in Fig. 4. TheRaman bands of SZ were located at 262, 307, 451, and636 cm�1, all of which are characteristic of the typical tetragonalphase [24,51]. SZC, however, showed no such bands. The XRD
results confirm that SZ samples exist in the tetragonal phase,and a phase transformation occurs in SZC samples due to theaddition of Co into zirconia.
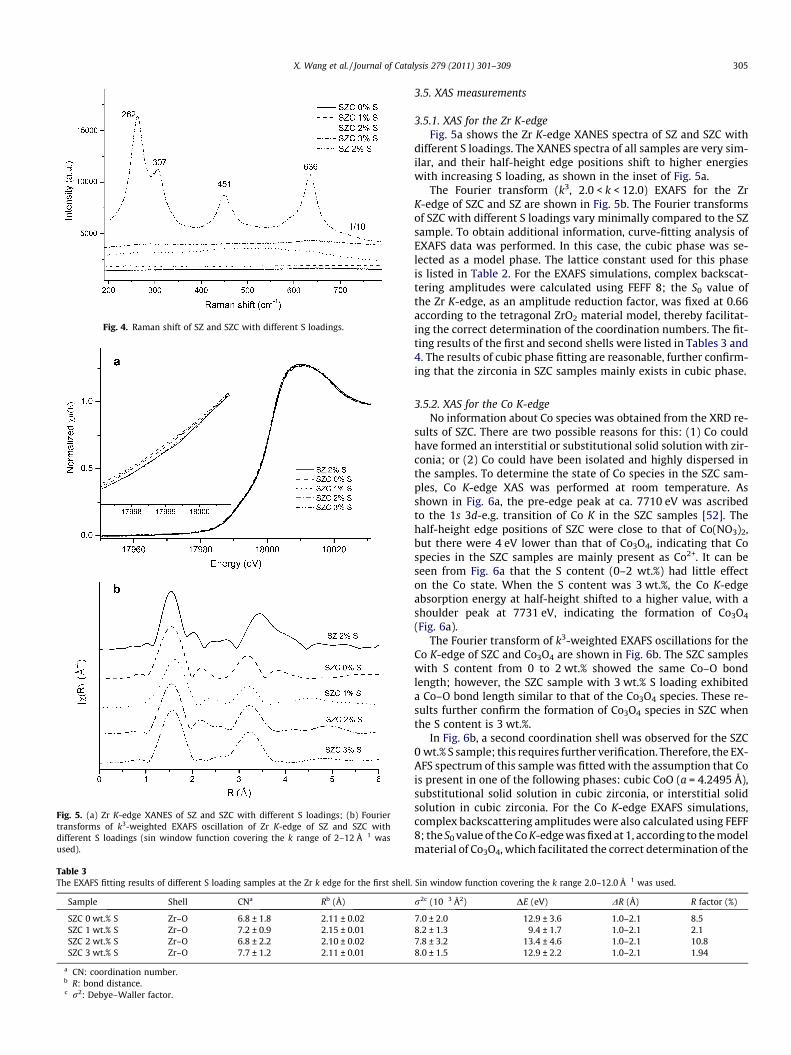
Fig. 4. Raman shift of SZ and SZC with different S loadings.
Fig. 5. (a) Zr K-edge XANES of SZ and SZC with different S loadings; (b) Fouriertransforms of k3-weighted EXAFS oscillation of Zr K-edge of SZ and SZC withdifferent S loadings (sin window function covering the k range of 2–12 Å�1 wasused).
Table 3The EXAFS fitting results of different S loading samples at the Zr k edge for the first shell.
Sample Shell CNa Rb (Å)
SZC 0 wt.% S Zr–O 6.8 ± 1.8 2.11 ± 0.02SZC 1 wt.% S Zr–O 7.2 ± 0.9 2.15 ± 0.01SZC 2 wt.% S Zr–O 6.8 ± 2.2 2.10 ± 0.02SZC 3 wt.% S Zr–O 7.7 ± 1.2 2.11 ± 0.01
a CN: coordination number.b R: bond distance.c r2: Debye–Waller factor.
X. Wang et al. / Journal of Catalysis 279 (2011) 301–309 305
3.5. XAS measurements
3.5.1. XAS for the Zr K-edgeFig. 5a shows the Zr K-edge XANES spectra of SZ and SZC with
different S loadings. The XANES spectra of all samples are very sim-ilar, and their half-height edge positions shift to higher energieswith increasing S loading, as shown in the inset of Fig. 5a.
The Fourier transform (k3, 2.0 < k < 12.0) EXAFS for the ZrK-edge of SZC and SZ are shown in Fig. 5b. The Fourier transformsof SZC with different S loadings vary minimally compared to the SZsample. To obtain additional information, curve-fitting analysis ofEXAFS data was performed. In this case, the cubic phase was se-lected as a model phase. The lattice constant used for this phaseis listed in Table 2. For the EXAFS simulations, complex backscat-tering amplitudes were calculated using FEFF 8; the S0 value ofthe Zr K-edge, as an amplitude reduction factor, was fixed at 0.66according to the tetragonal ZrO2 material model, thereby facilitat-ing the correct determination of the coordination numbers. The fit-ting results of the first and second shells were listed in Tables 3 and4. The results of cubic phase fitting are reasonable, further confirm-ing that the zirconia in SZC samples mainly exists in cubic phase.
3.5.2. XAS for the Co K-edgeNo information about Co species was obtained from the XRD re-
sults of SZC. There are two possible reasons for this: (1) Co couldhave formed an interstitial or substitutional solid solution with zir-conia; or (2) Co could have been isolated and highly dispersed inthe samples. To determine the state of Co species in the SZC sam-ples, Co K-edge XAS was performed at room temperature. Asshown in Fig. 6a, the pre-edge peak at ca. 7710 eV was ascribedto the 1s 3d-e.g. transition of Co K in the SZC samples [52]. Thehalf-height edge positions of SZC were close to that of Co(NO3)2,but there were 4 eV lower than that of Co3O4, indicating that Cospecies in the SZC samples are mainly present as Co2+. It can beseen from Fig. 6a that the S content (0–2 wt.%) had little effecton the Co state. When the S content was 3 wt.%, the Co K-edgeabsorption energy at half-height shifted to a higher value, with ashoulder peak at 7731 eV, indicating the formation of Co3O4
(Fig. 6a).The Fourier transform of k3-weighted EXAFS oscillations for the
Co K-edge of SZC and Co3O4 are shown in Fig. 6b. The SZC sampleswith S content from 0 to 2 wt.% showed the same Co–O bondlength; however, the SZC sample with 3 wt.% S loading exhibiteda Co–O bond length similar to that of the Co3O4 species. These re-sults further confirm the formation of Co3O4 species in SZC whenthe S content is 3 wt.%.
In Fig. 6b, a second coordination shell was observed for the SZC0 wt.% S sample; this requires further verification. Therefore, the EX-AFS spectrum of this sample was fitted with the assumption that Cois present in one of the following phases: cubic CoO (a = 4.2495 Å),substitutional solid solution in cubic zirconia, or interstitial solidsolution in cubic zirconia. For the Co K-edge EXAFS simulations,complex backscattering amplitudes were also calculated using FEFF8; the S0 value of the Co K-edge was fixed at 1, according to the modelmaterial of Co3O4, which facilitated the correct determination of the
Sin window function covering the k range 2.0–12.0 Å�1 was used.
r2c (10�3 Å2) DE (eV) DR (Å) R factor (%)
7.0 ± 2.0 �12.9 ± 3.6 1.0–2.1 8.58.2 ± 1.3 �9.4 ± 1.7 1.0–2.1 2.17.8 ± 3.2 �13.4 ± 4.6 1.0–2.1 10.88.0 ± 1.5 �12.9 ± 2.2 1.0–2.1 1.94

Table 4The EXAFS fitting results of different S loading samples at the Zr k edge for the second shell. Sin window function covering the k range 2.0–12.0 Å�1 was used.
Sample Shell CNa Rb (Å) r2c (10�3 Å2) DE (eV) DR (Å) R factor (%)
SZC 0 wt.% S Zr–Zr 6.5 ± 5.5 3.58 ± 0.04 1.8 ± 0.7 �9.0 ± 4.8 1.0–3.7 8.5SZC 1 wt.% S Zr–Zr 10.5 ± 6.0 3.60 ± 0.02 2.3 ± 0.4 �8.0 ± 2.1 1.0–3.7 2.1SZC 2 wt.% S Zr–Zr 3.9 ± 3.1 3.63 ± 0.04 1.3 ± 0.6 �3.6 ± 5.6 1.0–3.7 10.8SZC 3 wt.% S Zr–Zr 6.1 ± 1.9 3.61 ± 0.02 1.5 ± 0.2 �5.3 ± 2.0 1.0–3.7 1.9
a CN: coordination number.b R: bond distance.c r2: Debye–Waller factor.
Fig. 6. (a) Co K-edge XANES of Co3O4, Co(NO3)2�6H2O and SZC with different Sloadings; (b) Fourier transforms of k3-weighted EXAFS oscillation of Co K-edge ofCo3O4 and SZC with different S loadings (sin window function covering the k rangeof 2–10.2 Å�1 was used).
Table 5The EXAFS fitting results of SZC with 0 wt.% S sample at the Co K edge for the first andsecond shells. Sin window function covering the k range 2.0–10.2 Å�1 was used.
Shell Atom CNa R (Å)b R0 (Å)c R factor (%)
1 O 7.0 ± 1.2 2.18 2.21 2.12 Zr 12.7 ± 5.6 3.59 3.61 2.8
a CN: coordination number.b R: bond distance fitted.c R0: bond distance calculated.
306 X. Wang et al. / Journal of Catalysis 279 (2011) 301–309
coordination number. Fitting results demonstrate that isomorphoussubstitution of Co in cubic zirconia is reasonable (Tables 5 and 6,Fig. 7). To the best of our knowledge, this is the first time that evi-dence of Co entering the lattice of cubic zirconia to form a substitu-tion solid solution was provided. The second coordination shell ofSZC with 3 wt.% S was similar to that of the referential Co3O4 mate-rial, also confirming the formation of Co3O4.
3.6. Activity test
The catalysts were tested for CH4-SCR, and the results of whichare shown in Fig. 8. Fig. 8a depicts the activity of SZC samples at alow space velocity of 3600 h�1. Obviously, the S content has a greatinfluence on the activity of SZC during NOx reduction. Increasing theS loading from 0 to 2 wt.% significantly increased NOx conversion to
N2, while further increases in S content to 3 wt.% decreasedsuch activity. The SZC with 2 wt.% S was used for the introductionof a second active species of Pd. The following activity tests werepreformed at a high space velocity of 10,000 h�1. As shown inFig. 8b, CoSZ prepared by the traditional impregnation methodshowed marginal activity for NOx reduction within the temperatureregion 250–500 �C, while SZC with 2 wt.% S provided ca. 20%NOx conversion to N2 at above 400 �C. After the second activecomponent of Pd was introduced into SZC (PdSZC), NOx conversionto N2 increased to 82%, three times higher than that of SZC. ForPdCoSZ, however, the conversion of NOx was below 26% in the tem-perature range 250–500 �C. The TOFs of the PdSZC and PdCoSZcatalysts for NOx reduction were calculated based on the data at450 �C. At this temperature, the former exhibits a TOF value of1.4 � 10�3 s�1, 2.2 times higher than that of the latter catalyst(4.4 � 10�4 s�1).
N2O as a main byproduct was commonly observed during theSCR of NOx [53]; this byproduct was also detected during NOx
reduction by CH4 [45,54]. During NOx reduction by methane overPdSZ, large amounts of N2O were formed above 400 �C. Interest-ingly, PdSZC significantly lowered the formation of N2O comparedto PdSZ (Fig. 8c), indicating that the introduction of Co enhancedselectivity to N2 during CH4-SCR.
The PdSZC catalyst exhibited much greater durability thanPdCoSZ, maintaining ca. 84% NOx conversion to N2 at 460 �C until35 h; in contrast, the latter material showed a gradual decreasein NOx conversion under the same reaction conditions (Fig. 8d).The durability of the PdSZC catalyst for NOx reduction was alsoevaluated in the presence of 10% water vapor; the results areshown in Fig. 8d. At 500 �C, NOx conversion to N2 decreased from80% to 60% after 6.4 h, indicating that the water tolerance of thiscatalyst requires improvement in future research.
3.7. TPR
Resasco and co-workers [25] reported that the state of Pd playsa crucial role in the activity of SZ-supported catalysts. To furtherconfirm this, H2-TPR experiments were performed, and the resultsof which are shown in Fig. 9. H2 consumption was observed be-tween 100 and 200 �C for PdCoSZ, which can be attributed toPdO species [55]. The PdSZC sample showed no H2 consumptionover the same temperature range, indicating that Pd2+ was tightly
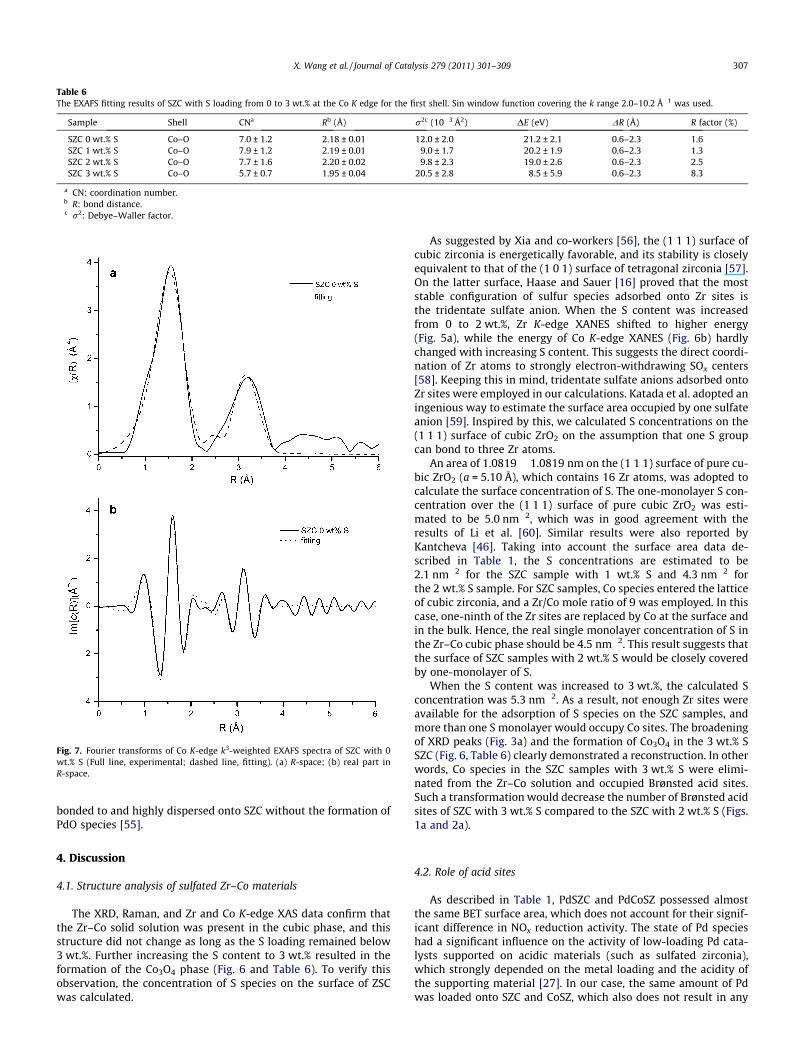
Table 6The EXAFS fitting results of SZC with S loading from 0 to 3 wt.% at the Co K edge for the first shell. Sin window function covering the k range 2.0–10.2 Å�1 was used.
Sample Shell CNa Rb (Å) r2c (10�3 Å2) DE (eV) DR (Å) R factor (%)
SZC 0 wt.% S Co–O 7.0 ± 1.2 2.18 ± 0.01 12.0 ± 2.0 �21.2 ± 2.1 0.6–2.3 1.6SZC 1 wt.% S Co–O 7.9 ± 1.2 2.19 ± 0.01 9.0 ± 1.7 �20.2 ± 1.9 0.6–2.3 1.3SZC 2 wt.% S Co–O 7.7 ± 1.6 2.20 ± 0.02 9.8 ± 2.3 �19.0 ± 2.6 0.6–2.3 2.5SZC 3 wt.% S Co–O 5.7 ± 0.7 1.95 ± 0.04 20.5 ± 2.8 �8.5 ± 5.9 0.6–2.3 8.3
a CN: coordination number.b R: bond distance.c r2: Debye–Waller factor.
Fig. 7. Fourier transforms of Co K-edge k3-weighted EXAFS spectra of SZC with 0wt.% S (Full line, experimental; dashed line, fitting). (a) R-space; (b) real part inR-space.
X. Wang et al. / Journal of Catalysis 279 (2011) 301–309 307
bonded to and highly dispersed onto SZC without the formation ofPdO species [55].
4. Discussion
4.1. Structure analysis of sulfated Zr–Co materials
The XRD, Raman, and Zr and Co K-edge XAS data confirm thatthe Zr–Co solid solution was present in the cubic phase, and thisstructure did not change as long as the S loading remained below3 wt.%. Further increasing the S content to 3 wt.% resulted in theformation of the Co3O4 phase (Fig. 6 and Table 6). To verify thisobservation, the concentration of S species on the surface of ZSCwas calculated.
As suggested by Xia and co-workers [56], the (1 1 1) surface ofcubic zirconia is energetically favorable, and its stability is closelyequivalent to that of the (1 0 1) surface of tetragonal zirconia [57].On the latter surface, Haase and Sauer [16] proved that the moststable configuration of sulfur species adsorbed onto Zr sites isthe tridentate sulfate anion. When the S content was increasedfrom 0 to 2 wt.%, Zr K-edge XANES shifted to higher energy(Fig. 5a), while the energy of Co K-edge XANES (Fig. 6b) hardlychanged with increasing S content. This suggests the direct coordi-nation of Zr atoms to strongly electron-withdrawing SOx centers[58]. Keeping this in mind, tridentate sulfate anions adsorbed ontoZr sites were employed in our calculations. Katada et al. adopted aningenious way to estimate the surface area occupied by one sulfateanion [59]. Inspired by this, we calculated S concentrations on the(1 1 1) surface of cubic ZrO2 on the assumption that one S groupcan bond to three Zr atoms.
An area of 1.0819 � 1.0819 nm on the (1 1 1) surface of pure cu-bic ZrO2 (a = 5.10 Å), which contains 16 Zr atoms, was adopted tocalculate the surface concentration of S. The one-monolayer S con-centration over the (1 1 1) surface of pure cubic ZrO2 was esti-mated to be 5.0 nm�2, which was in good agreement with theresults of Li et al. [60]. Similar results were also reported byKantcheva [46]. Taking into account the surface area data de-scribed in Table 1, the S concentrations are estimated to be2.1 nm�2 for the SZC sample with 1 wt.% S and 4.3 nm�2 forthe 2 wt.% S sample. For SZC samples, Co species entered the latticeof cubic zirconia, and a Zr/Co mole ratio of 9 was employed. In thiscase, one-ninth of the Zr sites are replaced by Co at the surface andin the bulk. Hence, the real single monolayer concentration of S inthe Zr–Co cubic phase should be 4.5 nm�2. This result suggests thatthe surface of SZC samples with 2 wt.% S would be closely coveredby one-monolayer of S.
When the S content was increased to 3 wt.%, the calculated Sconcentration was 5.3 nm�2. As a result, not enough Zr sites wereavailable for the adsorption of S species on the SZC samples, andmore than one S monolayer would occupy Co sites. The broadeningof XRD peaks (Fig. 3a) and the formation of Co3O4 in the 3 wt.% SSZC (Fig. 6, Table 6) clearly demonstrated a reconstruction. In otherwords, Co species in the SZC samples with 3 wt.% S were elimi-nated from the Zr–Co solution and occupied Brønsted acid sites.Such a transformation would decrease the number of Brønsted acidsites of SZC with 3 wt.% S compared to the SZC with 2 wt.% S (Figs.1a and 2a).
4.2. Role of acid sites
As described in Table 1, PdSZC and PdCoSZ possessed almostthe same BET surface area, which does not account for their signif-icant difference in NOx reduction activity. The state of Pd specieshad a significant influence on the activity of low-loading Pd cata-lysts supported on acidic materials (such as sulfated zirconia),which strongly depended on the metal loading and the acidity ofthe supporting material [27]. In our case, the same amount of Pdwas loaded onto SZC and CoSZ, which also does not result in any
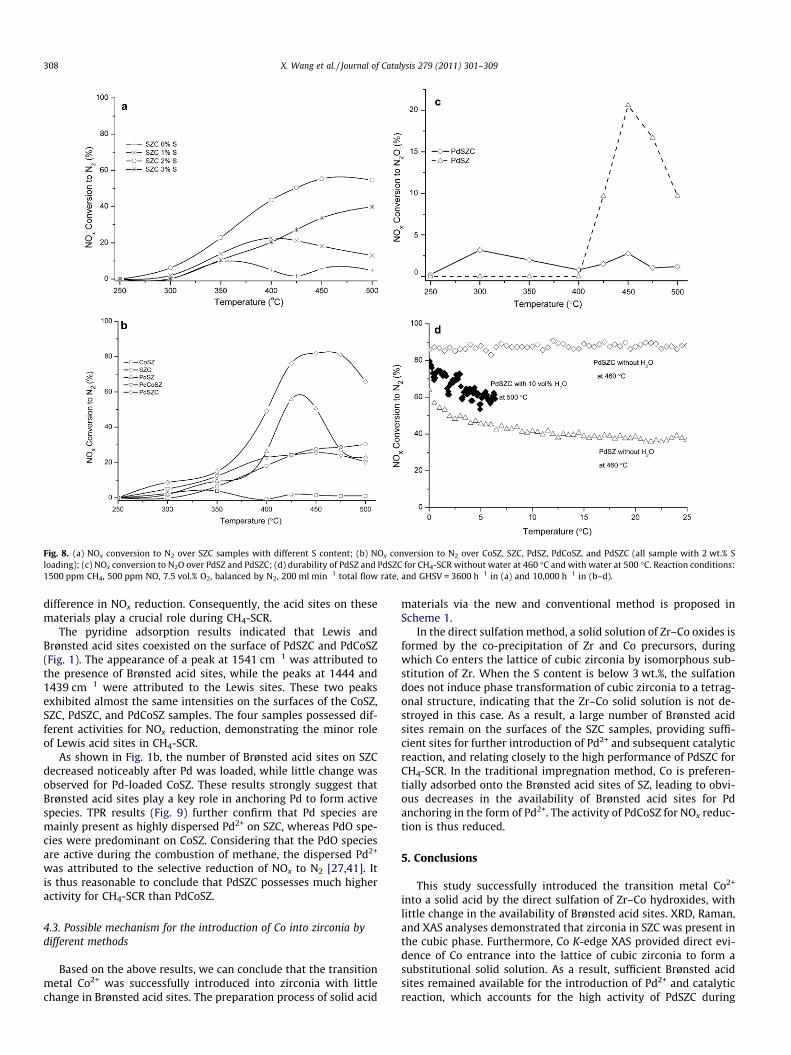
Fig. 8. (a) NOx conversion to N2 over SZC samples with different S content; (b) NOx conversion to N2 over CoSZ, SZC, PdSZ, PdCoSZ, and PdSZC (all sample with 2 wt.% Sloading); (c) NOx conversion to N2O over PdSZ and PdSZC; (d) durability of PdSZ and PdSZC for CH4-SCR without water at 460 �C and with water at 500 �C. Reaction conditions:1500 ppm CH4, 500 ppm NO, 7.5 vol.% O2, balanced by N2, 200 ml min�1 total flow rate, and GHSV = 3600 h�1 in (a) and 10,000 h�1 in (b–d).
308 X. Wang et al. / Journal of Catalysis 279 (2011) 301–309
difference in NOx reduction. Consequently, the acid sites on thesematerials play a crucial role during CH4-SCR.
The pyridine adsorption results indicated that Lewis andBrønsted acid sites coexisted on the surface of PdSZC and PdCoSZ(Fig. 1). The appearance of a peak at 1541 cm�1 was attributed tothe presence of Brønsted acid sites, while the peaks at 1444 and1439 cm�1 were attributed to the Lewis sites. These two peaksexhibited almost the same intensities on the surfaces of the CoSZ,SZC, PdSZC, and PdCoSZ samples. The four samples possessed dif-ferent activities for NOx reduction, demonstrating the minor roleof Lewis acid sites in CH4-SCR.
As shown in Fig. 1b, the number of Brønsted acid sites on SZCdecreased noticeably after Pd was loaded, while little change wasobserved for Pd-loaded CoSZ. These results strongly suggest thatBrønsted acid sites play a key role in anchoring Pd to form activespecies. TPR results (Fig. 9) further confirm that Pd species aremainly present as highly dispersed Pd2+ on SZC, whereas PdO spe-cies were predominant on CoSZ. Considering that the PdO speciesare active during the combustion of methane, the dispersed Pd2+
was attributed to the selective reduction of NOx to N2 [27,41]. Itis thus reasonable to conclude that PdSZC possesses much higheractivity for CH4-SCR than PdCoSZ.
4.3. Possible mechanism for the introduction of Co into zirconia bydifferent methods
Based on the above results, we can conclude that the transitionmetal Co2+ was successfully introduced into zirconia with littlechange in Brønsted acid sites. The preparation process of solid acid
materials via the new and conventional method is proposed inScheme 1.
In the direct sulfation method, a solid solution of Zr–Co oxides isformed by the co-precipitation of Zr and Co precursors, duringwhich Co enters the lattice of cubic zirconia by isomorphous sub-stitution of Zr. When the S content is below 3 wt.%, the sulfationdoes not induce phase transformation of cubic zirconia to a tetrag-onal structure, indicating that the Zr–Co solid solution is not de-stroyed in this case. As a result, a large number of Brønsted acidsites remain on the surfaces of the SZC samples, providing suffi-cient sites for further introduction of Pd2+ and subsequent catalyticreaction, and relating closely to the high performance of PdSZC forCH4-SCR. In the traditional impregnation method, Co is preferen-tially adsorbed onto the Brønsted acid sites of SZ, leading to obvi-ous decreases in the availability of Brønsted acid sites for Pdanchoring in the form of Pd2+. The activity of PdCoSZ for NOx reduc-tion is thus reduced.
5. Conclusions
This study successfully introduced the transition metal Co2+
into a solid acid by the direct sulfation of Zr–Co hydroxides, withlittle change in the availability of Brønsted acid sites. XRD, Raman,and XAS analyses demonstrated that zirconia in SZC was present inthe cubic phase. Furthermore, Co K-edge XAS provided direct evi-dence of Co entrance into the lattice of cubic zirconia to form asubstitutional solid solution. As a result, sufficient Brønsted acidsites remained available for the introduction of Pd2+ and catalyticreaction, which accounts for the high activity of PdSZC during
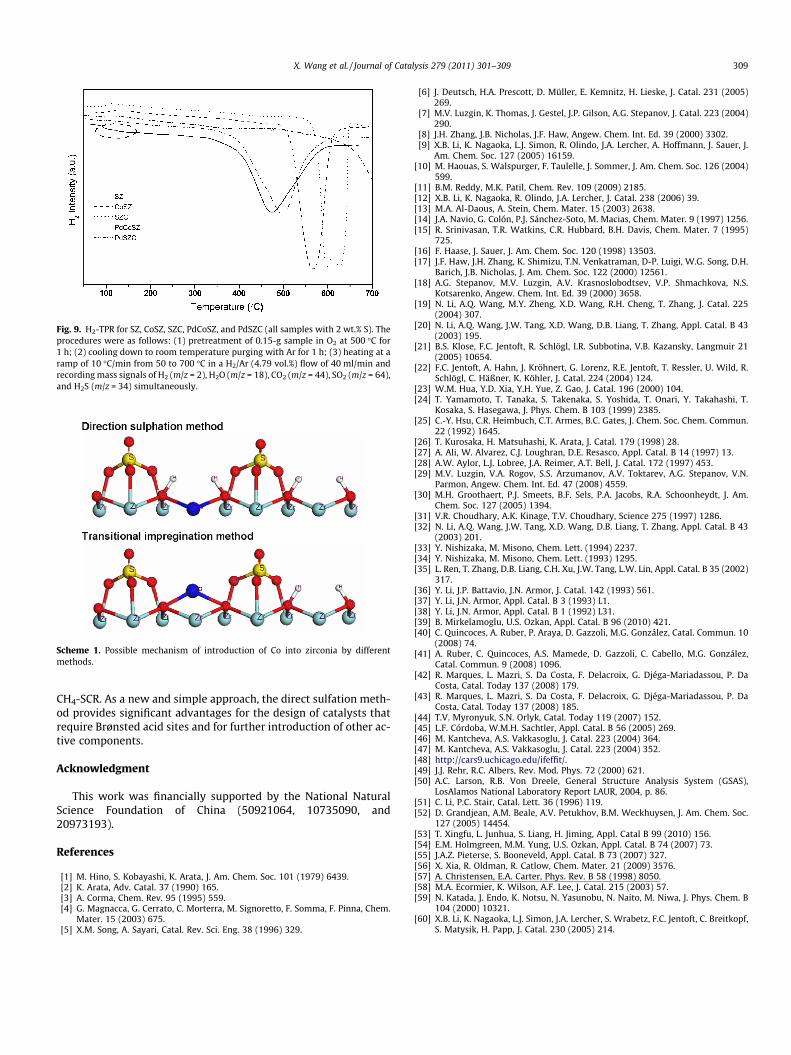
Fig. 9. H2-TPR for SZ, CoSZ, SZC, PdCoSZ, and PdSZC (all samples with 2 wt.% S). Theprocedures were as follows: (1) pretreatment of 0.15-g sample in O2 at 500 �C for1 h; (2) cooling down to room temperature purging with Ar for 1 h; (3) heating at aramp of 10 �C/min from 50 to 700 �C in a H2/Ar (4.79 vol.%) flow of 40 ml/min andrecording mass signals of H2 (m/z = 2), H2O (m/z = 18), CO2 (m/z = 44), SO2 (m/z = 64),and H2S (m/z = 34) simultaneously.
Scheme 1. Possible mechanism of introduction of Co into zirconia by differentmethods.
X. Wang et al. / Journal of Catalysis 279 (2011) 301–309 309
CH4-SCR. As a new and simple approach, the direct sulfation meth-od provides significant advantages for the design of catalysts thatrequire Brønsted acid sites and for further introduction of other ac-tive components.
Acknowledgment
This work was financially supported by the National NaturalScience Foundation of China (50921064, 10735090, and20973193).
References
[1] M. Hino, S. Kobayashi, K. Arata, J. Am. Chem. Soc. 101 (1979) 6439.[2] K. Arata, Adv. Catal. 37 (1990) 165.[3] A. Corma, Chem. Rev. 95 (1995) 559.[4] G. Magnacca, G. Cerrato, C. Morterra, M. Signoretto, F. Somma, F. Pinna, Chem.
Mater. 15 (2003) 675.[5] X.M. Song, A. Sayari, Catal. Rev. Sci. Eng. 38 (1996) 329.
[6] J. Deutsch, H.A. Prescott, D. Müller, E. Kemnitz, H. Lieske, J. Catal. 231 (2005)269.
[7] M.V. Luzgin, K. Thomas, J. Gestel, J.P. Gilson, A.G. Stepanov, J. Catal. 223 (2004)290.
[8] J.H. Zhang, J.B. Nicholas, J.F. Haw, Angew. Chem. Int. Ed. 39 (2000) 3302.[9] X.B. Li, K. Nagaoka, L.J. Simon, R. Olindo, J.A. Lercher, A. Hoffmann, J. Sauer, J.
Am. Chem. Soc. 127 (2005) 16159.[10] M. Haouas, S. Walspurger, F. Taulelle, J. Sommer, J. Am. Chem. Soc. 126 (2004)
599.[11] B.M. Reddy, M.K. Patil, Chem. Rev. 109 (2009) 2185.[12] X.B. Li, K. Nagaoka, R. Olindo, J.A. Lercher, J. Catal. 238 (2006) 39.[13] M.A. Al-Daous, A. Stein, Chem. Mater. 15 (2003) 2638.[14] J.A. Navio, G. Colón, P.J. Sánchez-Soto, M. Macias, Chem. Mater. 9 (1997) 1256.[15] R. Srinivasan, T.R. Watkins, C.R. Hubbard, B.H. Davis, Chem. Mater. 7 (1995)
725.[16] F. Haase, J. Sauer, J. Am. Chem. Soc. 120 (1998) 13503.[17] J.F. Haw, J.H. Zhang, K. Shimizu, T.N. Venkatraman, D-P. Luigi, W.G. Song, D.H.
Barich, J.B. Nicholas, J. Am. Chem. Soc. 122 (2000) 12561.[18] A.G. Stepanov, M.V. Luzgin, A.V. Krasnoslobodtsev, V.P. Shmachkova, N.S.
Kotsarenko, Angew. Chem. Int. Ed. 39 (2000) 3658.[19] N. Li, A.Q. Wang, M.Y. Zheng, X.D. Wang, R.H. Cheng, T. Zhang, J. Catal. 225
(2004) 307.[20] N. Li, A.Q. Wang, J.W. Tang, X.D. Wang, D.B. Liang, T. Zhang, Appl. Catal. B 43
(2003) 195.[21] B.S. Klose, F.C. Jentoft, R. Schlögl, I.R. Subbotina, V.B. Kazansky, Langmuir 21
(2005) 10654.[22] F.C. Jentoft, A. Hahn, J. Kröhnert, G. Lorenz, R.E. Jentoft, T. Ressler, U. Wild, R.
Schlögl, C. Häßner, K. Köhler, J. Catal. 224 (2004) 124.[23] W.M. Hua, Y.D. Xia, Y.H. Yue, Z. Gao, J. Catal. 196 (2000) 104.[24] T. Yamamoto, T. Tanaka, S. Takenaka, S. Yoshida, T. Onari, Y. Takahashi, T.
Kosaka, S. Hasegawa, J. Phys. Chem. B 103 (1999) 2385.[25] C.-Y. Hsu, C.R. Heimbuch, C.T. Armes, B.C. Gates, J. Chem. Soc. Chem. Commun.
22 (1992) 1645.[26] T. Kurosaka, H. Matsuhashi, K. Arata, J. Catal. 179 (1998) 28.[27] A. Ali, W. Alvarez, C.J. Loughran, D.E. Resasco, Appl. Catal. B 14 (1997) 13.[28] A.W. Aylor, L.J. Lobree, J.A. Reimer, A.T. Bell, J. Catal. 172 (1997) 453.[29] M.V. Luzgin, V.A. Rogov, S.S. Arzumanov, A.V. Toktarev, A.G. Stepanov, V.N.
Parmon, Angew. Chem. Int. Ed. 47 (2008) 4559.[30] M.H. Groothaert, P.J. Smeets, B.F. Sels, P.A. Jacobs, R.A. Schoonheydt, J. Am.
Chem. Soc. 127 (2005) 1394.[31] V.R. Choudhary, A.K. Kinage, T.V. Choudhary, Science 275 (1997) 1286.[32] N. Li, A.Q. Wang, J.W. Tang, X.D. Wang, D.B. Liang, T. Zhang, Appl. Catal. B 43
(2003) 201.[33] Y. Nishizaka, M. Misono, Chem. Lett. (1994) 2237.[34] Y. Nishizaka, M. Misono, Chem. Lett. (1993) 1295.[35] L. Ren, T. Zhang, D.B. Liang, C.H. Xu, J.W. Tang, L.W. Lin, Appl. Catal. B 35 (2002)
317.[36] Y. Li, J.P. Battavio, J.N. Armor, J. Catal. 142 (1993) 561.[37] Y. Li, J.N. Armor, Appl. Catal. B 3 (1993) L1.[38] Y. Li, J.N. Armor, Appl. Catal. B 1 (1992) L31.[39] B. Mirkelamoglu, U.S. Ozkan, Appl. Catal. B 96 (2010) 421.[40] C. Quincoces, A. Ruber, P. Araya, D. Gazzoli, M.G. González, Catal. Commun. 10
(2008) 74.[41] A. Ruber, C. Quincoces, A.S. Mamede, D. Gazzoli, C. Cabello, M.G. González,
Catal. Commun. 9 (2008) 1096.[42] R. Marques, L. Mazri, S. Da Costa, F. Delacroix, G. Djéga-Mariadassou, P. Da
Costa, Catal. Today 137 (2008) 179.[43] R. Marques, L. Mazri, S. Da Costa, F. Delacroix, G. Djéga-Mariadassou, P. Da
Costa, Catal. Today 137 (2008) 185.[44] T.V. Myronyuk, S.N. Orlyk, Catal. Today 119 (2007) 152.[45] L.F. Córdoba, W.M.H. Sachtler, Appl. Catal. B 56 (2005) 269.[46] M. Kantcheva, A.S. Vakkasoglu, J. Catal. 223 (2004) 364.[47] M. Kantcheva, A.S. Vakkasoglu, J. Catal. 223 (2004) 352.[48] http://cars9.uchicago.edu/ifeffit/.[49] J.J. Rehr, R.C. Albers, Rev. Mod. Phys. 72 (2000) 621.[50] A.C. Larson, R.B. Von Dreele, General Structure Analysis System (GSAS),
LosAlamos National Laboratory Report LAUR, 2004, p. 86.[51] C. Li, P.C. Stair, Catal. Lett. 36 (1996) 119.[52] D. Grandjean, A.M. Beale, A.V. Petukhov, B.M. Weckhuysen, J. Am. Chem. Soc.
127 (2005) 14454.[53] T. Xingfu, L. Junhua, S. Liang, H. Jiming, Appl. Catal B 99 (2010) 156.[54] E.M. Holmgreen, M.M. Yung, U.S. Ozkan, Appl. Catal. B 74 (2007) 73.[55] J.A.Z. Pieterse, S. Booneveld, Appl. Catal. B 73 (2007) 327.[56] X. Xia, R. Oldman, R. Catlow, Chem. Mater. 21 (2009) 3576.[57] A. Christensen, E.A. Carter, Phys. Rev. B 58 (1998) 8050.[58] M.A. Ecormier, K. Wilson, A.F. Lee, J. Catal. 215 (2003) 57.[59] N. Katada, J. Endo, K. Notsu, N. Yasunobu, N. Naito, M. Niwa, J. Phys. Chem. B
104 (2000) 10321.[60] X.B. Li, K. Nagaoka, L.J. Simon, J.A. Lercher, S. Wrabetz, F.C. Jentoft, C. Breitkopf,
S. Matysik, H. Papp, J. Catal. 230 (2005) 214.