Session 2 2)Use of Transport Modelling (2)
41
Presentation to the UN (OHRLLS) – 11 th - 12 th October 2021 1 Presenter: Glory K. Jonga Training Workshop for Developing successful Public- Private Partnerships (PPPs) for increased transport connectivity in Botswana
-
Upload
khangminh22 -
Category
Documents
-
view
0 -
download
0
Transcript of Session 2 2)Use of Transport Modelling (2)

Presentation to the UN (OHRLLS) – 11th -12th October 2021
1
Presenter: Glory K. Jonga
Training Workshop for Developing successful Public-
Private Partnerships (PPPs) for increased transport connectivity
in Botswana

Use of Transport ModellingMul3 Modal Transport Model
• Transporta)on modelling and simula)on as interface in the planning process plays an
important role in enabling spa)al development. The models developed by transport planning
professionals are simplified representa)ons of reality which can be used to explore the
consequences of par)cular policies, strategies and spa)al changes.
• The transport models forecast transport demand based on expected spa)al development,
popula)on and economic growth, which translates in the crea)on of addi)onal trips on the
road network requiring expansion or the provision of infrastructure for a variety of modes.
Transport modelling is a strong and helpful tool in the Transport Planner’s tool kit that
supports decisions making.
• Transporta)on modelling is a young and developing science that has generally developed as
part of the evolu)on of advancing computer technology and was originally developed to
solve highway capacity problems. Many mistakes have been made in the past where
inappropriate solu)ons were implemented – with hind sight. A classic mistake includes where
new infrastructure provision is considered purely on the basis of the “predict and provide”
approach resul)ng in infrastructure being implemented completely surplus to requirements
and unnecessary. The consequence is an unprac)cal and unaffordable cost to government.
2

Use of Transport Modelling
Advantages of using Transport Models
• it estimates likely land use transport interactions more quickly and at lower cost and risk
than would be through implementation and monitoring or trial by error;
• It helps planners optimise the balance between land use provision and appropriate transport
infrastructure and relevant modes to enable sustained economic growth;
• It defines the appropriate level of infrastructure required to support land use and spatial
development;
• It defines the appropriate modes of transport to connect land use;
• It weighs up benefits/dis-benefits of various development scenarios; and
• It informs investment decisions by providing input into financial, economic, environmental
and other relevant forms of appraisal.
3

Use of Transport Modelling
Transport Models and PPP Projects
When designing PPP projects within the transport sector, for example, Toll Roads, the
Developer/Concessioner should build Base Year and Future Year Transport Models. The laDer
should be based on an agreed Design/Future Year (normally the end of the Concession Period) to
give a representaHon of how traffic would be in that year. The revenue from the Toll Road is
calculated from the quantum of traffic using the concessioned Toll Road and it is quite criHcal
that the Developer gets the traffic flows right since an overesHmaHon of the level of traffic in the
Transport Model on parHcular road links would bring less revenue. Of late there have been some
court cases involving the “fitness for purpose” of some of the Transport Models developed for
Concession contracts.
4

Use of Transport Modelling
Disadvantages of Not using Transport Models: Lack of the use of appropriate Transport
Modelling leads to:
• Misguided investment in transportation systems that prioritize high speed mobility over local
accessibility (This places all other modes of travel at a disadvantage);
• Urban sprawl;
• Under provision of Non-Motorised Transport Infrastructure;
• Commuter public transport services focused on operating mainly during the morning and
afternoon peak hours, with limited inter peak services;
• High travel cost (private and public transport) – mobility and accessibility is expensive and
has a high economic and social cost; and
• Rural communities often isolated and inaccessible, contributing to the inability to access
opportunities and jobs resulting in perpetuated poverty.
• 5

Use of Transport Modelling
Goals of Multi Modal Transport Model
• Improve accessibility and connectivity of all transport modes.
• To ensure the process of regional integration is supported by a robust analysis of issues and
impacts leading to reduced cost of trade.
• Ensure sustainable mobility, Improve safety and security of society and the level of service for
all modes.
• Provide socially inclusive transport for all to improve the quality of life for Mauritius and its
vast visitors.
• Provide an environmentally sustainable transport system.
• Stimulate competition through utilizing alternative transport modes.
• Provide an enabling environment to encourage private sector investment.
6

Use of Transport Modelling
Steps in Transport PlanningBefore exploring what transport modelling is, it is necessary to understand the broad stepsinvolved in transportation planning as to understand how transportation modelling fits into theoverall planning process.
7
Problem Definition
Goals, ObjecAves &
CriteriaData Collection Data Collection Forecsating Develop
AlFernaAves Evaluation ImplementaAon

Use of Transport Modelling
Steps in Transport PlanningProblem Definition: What is the key transportation, economic and land use issues and problemsfacing the community? This step may also involve definition of the size of an area to be studied,determination of the scope of the study and the establishment of a steering committee structureor forum to oversee the planning processGoals, Objectives and Criteria: A consensus should be developed by elected officials and citizensabout the future of the community and its transportation system. Goals are developed for thequality of transportation service, environmental impacts and costs and are typically in conflict. Agood planning effort will identify the trade-offs between these factors among alternatives in aclear, concise way to help make decisions.Data Collection: Data must be compiled about the present status of the transportation system andits use. This could include traffic data, public transport ridership statistics, census information andinterviews of households about their travel patterns. Data are also gathered on land use,development trends, environmental factors, and financial resources. This will help in problemdefinition and in developing methods to forecast future travel patterns. Good data are essential tothe planning process. The statement ‘garbage in/garbage out’ applies in transportation planning.Without good data, the results of the planning process have little real meaning and can lead towrong project selection and an inappropriate developmental direction for the region8

Use of Transport Modelling
Steps in Transport PlanningForecasting: Data from existing travel is used to make forecasts of future travel using traveldemand models. This requires forecasts of future population, land use and economic conditions aswell as understanding of how people make travel choices. Forecasting requires large amounts ofdata and is carried out under many assumptions which is based on benchmarking, sensitivitychecks and follow up surveys to identify trends.Develop Alternatives: Forecasts are used to determine the performance of alternative future landuse and transportation systems. Alternatives normally include different land use andtransportation patterns with different mixtures of highway and transit services and facilities. Sinceland use affects travel and travel affects land use, both must be considered.Evaluation: Results of forecasts are used to compare the performance of alternatives in meetinggoals, objectives and criteria. This information may be extensively discussed by interested citizens,elected officials, different government agencies and the private sector. Ultimately decisions aremade by appropriate elected or appointed officials and groups.Implementation: Once decisions are made, plans should be further developed and refined forimplementation. This may include more detailed analysis for design and evaluation following asimilar process as above. 9

Use of Transport Modelling
Four Step Model
10
Zonal System
1. Trip Genera5on
2. Modal Choice
3. Destination
4. Assignment

Use of Transport Modelling
Zonal System: Travel simulation require that an urban area or region be represented as a series
of small geographic areas referred to as travel analysis zones. Zones are characterized by their
population, employment and other factors and are the places where trip making decisions are
made (trip producers) and the trip need is met (trip attractors). Trip making is assumed to begin
at the centre of activity in a zone (zone centroid). Trips that are very short, that begin and end in
a single zone (intrazonal trips) are usually not directly included in the forecasts. This limits the
analysis of pedestrian and bicycle trips in the process. Zones can be as small as a single block but
typically are 1/4 to one mile square in area. A planning study can easily use 500–2000 zones. A
large number of zones will increase the accuracy of the forecasts but require more data and
computer processing time.
11

Use of Transport Modelling
Example of a Transport Model Zoning System: Addis Ababa
The areas outside the study area which contribute traffic to the study area is defined as
external zones. The zones do not just represent areas adjacent to the study area though they
represent the “rest of the world”.12

Use of Transport Modelling
Trip Genera3on: The first step in travel forecas1ng is trip genera1on. In this step informa1on
from land use, popula1on and economic forecasts are used to es1mate how many trips will be
made to and from each zone. This is carried out separately by trip purpose. Some of the trip
purposes that could be used are: home based work trips (work trips that begin or end at home),
home based shopping trips, home based other trips, school trips, non-home based trips (trips
that neither begin or end at home), truck trips and taxi trips. Trips are calculated based on the
characteris1cs of the zones. Trip produc1ons are based on household characteris1cs such as the
number of people in the household and the number of cars available.
Trip Distribu3on: Trip genera1on only finds the number of trips that begin or end at a par1cular
zone. The process of trip distribu1on links the trip ends to form an origin des1na1on paDern.
Trip distribu1on is used to represent the process of des1na1on choice, e.g. “I need to go
shopping but where should I go to meet my shopping needs?” Trip distribu1on leads to a large
increase in the amount of data which needs to be dealt with.13

Use of Transport Modelling
Origin–destination tables are very large. For example, a 1200 zone study area would have
1,440,000 possible trip combinations in its O–D table for each trip purpose. The most commonly
used procedure for predict trip distribution is gravity modelling. The gravity model takes the trips
produced at one zone and distributes to other zones based on the size of the other zones (as
measured by their trip attractions) and on the basis of the distance to other zones.
Mode Split/mode choice: one of the most critical parts of the demand modelling process. It is
the step where trips between a given origin and destination are split into trips using public
transport, trips by car pool or as car passengers and trips by car drivers. All proposals to improve
public transport or to change the ease of using the cars are passed through the mode split/car
occupancy process as part of their assessment and evaluation.
14

Use of Transport Modelling
Mode Split:
15
NMTCycleWalk
Public Transport
Private Trip
Private Car

Use of Transport Modelling
Assignment
• Once trips have been split into highway and public transport trips, the specific path that they
use to travel from their origin to their destination must be foun. These trips are then assigned
to that path in the step referred to as traffic assignment. Traffic assignment is the most time
consuming and data intensive step in the process and is performed differently for highway
trips and public transport trips.
• The process first involves the calculation of the shortest path from each origin to all
destinations (usually the minimum time path is used). Trips for each O–D pair are then
assigned to the links in the minimum path and the trips are added up for each link. The
assigned trip volume is then compared to the capacity of the link to see if it is congested. If a
link is congested the speed on the link needs to be reduced to result in a larger travel time on
that link. When speeds and travel times are changed, the shortest path may change. Hence
the whole process must be repeated many times (iterated) until there is an equilibrium
between travel demand and travel supply.16

Use of Transport Modelling
Model Validation and Calibration
Model calibration is the adjustment of constants and other model parameters in estimated or
asserted models in an effort to make the models replicate observed data for a base year or
otherwise produce more reasonable results;
Model validation is the application of the calibrated models and comparison of the results
against observed data; ideally, the observed data are not the same data used for model
estimation or calibration.
Model calibration and validation generally occur in an iterative fashion. Model validation may
reveal the need to return to the model estimation or model calibration steps. The application of
the model using future year conditions requires that the model forecasts are reasonable and
consistent with expectations and also might reveal a need to return to the model estimation or
calibration step.
17

Use of Transport Modelling
Valida&on of model free-flow drive &mes against drive &mes from OpenRouteservice.org
18

Use of Transport Modelling
Main elements of a Transport ModelThe main elements of a transport model are as follows:
• nodes – intersections;
• links – segments of the road network;
• transport zones – sources and goals of correspondence improvement;
• connectors – they connect the centers of transport nodes to the individual andpublic transport network.
In public transport systems, the above elements are supplemented by public transport stops and lines.
19

Use of Transport ModellingMain elements of a Transport Model
Public and Car/Private connectors connecting the network to zone centroid
20

Use of Transport Modelling
New Data/Traffic Surveys
To develop a Transport Model a set of traffic and socio-economic data is needed:
(a) To assist in the development and calibra9on of a computerized transport demand model;
(b) To provide up-to-date informa9on so that accurate engineering and planning analysis mayproceed;
(c) To document current transport demand among the various transport modes and facili9esexis9ng in the area; and
(d) To establish quan9ta9ve as well as qualita9ve interac9ons among transport, planning,economic, social and environmental sectors.
21

Use of Transport Modelling
New Data/Traffic Surveys
The surveys typically undertaken are:
Household Interview Surveys (HIS): he HIS is seen as the “backbone” of model development andconsists of interviews involving a number of households at an agreed sample size within the studyarea. Each member of the household is asked a series of questions relating to householdcharacteristics, persons characteristics and trip characteristics. In addition, subsidiary surveys canbe conducted with additional, focused questions relating to trip preferences, environmentalconcerns and opinions on transportation problems, possible solutions and policies.
Roadside Interview Surveys (RSI): The monitoring of trip demand is an important element of themodel building process, thus, a series of interrelated and mutually supportive traffic surveys needto be conducted from identified locations over agreed time frames. The questionnaire for thissurvey will contain questions about the current trip, questions about the respondents and theirhouseholds such as income, household structure, car availability, and so on. Some basictrip/journey questions would include: where are you coming from (origin address), what wereyou doing there (origin purpose); where are you going to (destination address), what will you bedoing there (destination purpose).
22

Use of Transport Modelling
New Data/Traffic Surveys
Manual Classified Count Surveys (MCC): This questionnaire will be designed to include all vehicletypes (e.g., Motorcycles, Cars, Jeeps & Buses, Luxury Buses, Light trucks; and heavy trucks).Depending on the traffic condition, a survey location may have two or more enumeratorscounting different type of vehicles. For example, we could have one enumerator counting onlycars, and the other counting other vehicles (buses, goods or other vehicles). This means separateforms have to be designed for this purpose.
Automatic Traffic Counts (ATC): This involves counting vehicles automatically at each survey siteto enable a full daily profile of traffic to be established. Depending on the resources available thecounting can done either manually or using automatic counting equipment. The data will be usedto expand the 12 hours traffic to 24 hours and also to account for the variations in traffic acrossthe day. Where resources permit, this survey will be conducted continuously for seven days toalso account for variations in traffic across the week.
Personal Interview Survey (PI): This will be similar in content to RSI, except that the respondentswill be asked about their reference trip, which is usually the latest trip they have made. It will beconducted at key traffic generators such as schools, hospitals, government departments etc.
23

Use of Transport Modelling
New Data/Traffic Surveys
Road Survey Interviews: Addis Ababa
24

Use of Transport Modelling
New Data/Traffic Surveys
Public Transport System-Addis Ababa
25

Use of Transport Modelling
New Data/Traffic Surveys
Freight Vehicle Surveys: The flow of cargo to/from an area, as well as within an area, is of vitalimportance to any strategy involving commercial vehicles and the facili9es used in cargoprocessing. Thus, in addi9on to analysis of available data, interviews were conducted which focuson truck owner characteris9cs, trip pa>erns as well as opportuni9es and constraints.
Vehicle Travel Speed Surveys: A series of arterials or main road links can be iden9fied, and vehicleopera9ng speeds determined. These surveys, conducted during varying periods of the day,measure speeds of vehicles opera9ng in mixed traffic.
Road CondiAon Surveys: The general content of major roads (such as number of lanes,carriageway width, roadside fric9on, traffic signal control, etc.) can be ascertained via a review ofavailable records, plus focused field inves9ga9ons.
26

Use of Transport Modelling
New Data/Traffic Surveys
Transport Network Surveys: As a sister-survey to the road condition survey, the network surveyfocuses on public transport systems. Results of both the road condition and transport networksurveys provide considerable inputs toward the development of road and public transportnetworks within the framework of the transport model.
Stated Preference Surveys: This survey will be designed to collect all relevant information that donot exist or are difficult to collect using the above survey methods. Some of this informationincludes user’s perception of toll roads, value of time, willingness to pay, and value of differenttolling methods (close or open) and so on.
27

Use of Transport Modelling
Selecting a Transport Model
When selecting a model, the user should begin by defining the requirements of the exercise to be
undertaken and the resources required. The requirements that should be defined include:
• What input variables are required, and to what level of detail?
• What output variables are required, at what level of detail and in what form (e.g. on screen
results or graphics and results to “come alive” where the movement of cars are observed on
screen)?
• Geographical coverage (will a single intersection be simulated, a number of intersections or
an entire suburb?);
• Constraints of time and money;
• Is it possible to buy new commercially available software or should new software or
processes be developed? and
• Determine whether new data can be collected.
28
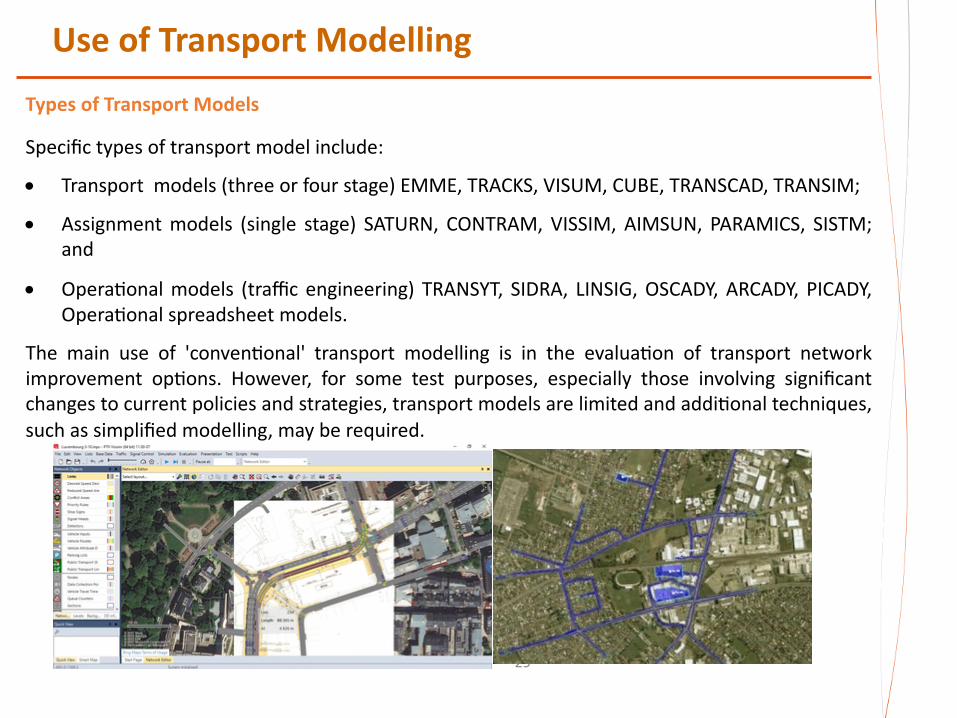
Use of Transport ModellingTypes of Transport Models
Specific types of transport model include:
• Transport models (three or four stage) EMME, TRACKS, VISUM, CUBE, TRANSCAD, TRANSIM;
• Assignment models (single stage) SATURN, CONTRAM, VISSIM, AIMSUN, PARAMICS, SISTM;and
• OperaIonal models (traffic engineering) TRANSYT, SIDRA, LINSIG, OSCADY, ARCADY, PICADY,OperaIonal spreadsheet models.
The main use of 'convenIonal' transport modelling is in the evaluaIon of transport networkimprovement opIons. However, for some test purposes, especially those involving significantchanges to current policies and strategies, transport models are limited and addiIonal techniques,such as simplified modelling, may be required.
29

Use of Transport Modelling: Case Study
Greater Gaborone Transport Model
Project Objectives
The primary objective of this Assignment is to develop for Ministry of Transport &Communicationconcrete interventions and a detailed implementation plan for the proposed bus based transportnetwork in Greater Gaborone. In particular the Study proposes a public transport system that willreduce traffic congestion, delays, accidents, increase reliability and hence improve traffic flows.
Study Background
The need for the study was identified by the Greater Gaborone Multi-Modal Transport Study
(GGMMTS) which recommended improvements in traffic management; parking; Non-Motorised
Transport (NMT) facilities; safety; public transport; inter-modal coordination; urban distribution
of freight; international logistics; institutional strengthening; and the creation of a Project
Implementation Unit. The Government of Botswana sought to improve the overall management
of the transport sector through the Botswana Integrated Transport Project (BITP) that was World
Bank funded and, which in turn sought to enhance the integration of transport subsectors with
other sectors of the economy and to revamp/modernise the entire transport system.
30

Use of Transport Modelling: Case Study
Greater Gaborone Transport Model
Study Catchment AreaThe area covered by Greater Gaborone is essentially the region within a radius of 80 km aroundGaborone City. This area encompasses Lobatse, Kanye, Moshupa, Molepolole and Mochudi, andalso includes Tlokweng and Mogoditshane as well as the smaller villages that lie in between.
In addition to the three corridors identified by the GGMMTS, two additional corridors linking thecity to its suburbs and surrounding towns and villages have been identified. The five radialcorridors are:
o the northern corridor which serves small towns and villages along the A1, to the north-westof Gaborone, including those in the Mochudi Planning Area (namely Mochudi, Bokaa, Morwa,Pilane, Rasesa and Malotwane villages), and others such as Oodi, Matebeleng, Mmamashiaand areas in between;
o the north-western corridor which serves the built-up areas of Mogoditshane, Metsimotlhabe,Mmopane and Ledumadumane to the immediate west and north-west of Gaborone; andextending all the way to Molepolole;
o the western corridor which serves the southern parts of Mogoditshane, Gabane, Kumakwaneand extends all the way to Kanye;
o the southern corridor serving the Kgale Hill area, Mmokolodi and Tloaneng to the immediate
31

Use of Transport Modelling: Case Study
Greater Gaborone Transport Model
Daily Public Transport Passenger Trips around Gaborone and surrounding towns
32

Use of Transport Modelling: Case Study
Greater Gaborone Transport Model
Other Study ObjectivesOther study objectives include the examination of public transport choices between conventionalbuses with or without DBLs, BRT, Park and Ride and bus priority schemes, as well as an analysis ofthe current status of the bus network and recommendation of critical measures for improvement.The study also examines ways of integrating small and medium players in the transport industryand evaluates the risks involved. The critical area of intervention is the Private Sector involvementthrough PPPs.
Transport Model Development
Traffic Surveys
o A survey of public transport bus and passenger movements was carried out in November-December 2014. The traffic surveys focussed mainly on outward movements from CentralGaborone and Game City to other places; it did not consider inward movements, orpassengers boarding midway along a route, as well as external movements, i.e. thosemovements between places outside central Gaborone. Also there are some routes which werenot captured in the survey such as Broadhurst Routes 1 and 2 where combi drivers resistedthe surveys that were being conducted. 33

Use of Transport Modelling: Case Study
Greater Gaborone Transport Model
o Travel pa(erns and characteris0cs have been determined from the results of public transport(bus and taxi) surveys, roadside interview surveys (by car) and journey 0me surveys (by car).Trips by bus are mainly for travel from home to/from work and for educa0on, and to a lesserextent for shopping and personal business.
o Cars are mainly used for travel to/from work and for personal business, and to a lesser extentfor shopping and visi0ng friends and rela0ves. Taxis are mainly used for work and shoppingtrips and to a lesser extent for personal business, visi0ng friends and rela0ves and foreduca0on. As cars are mostly used for work trips, it means they spend most of the day parkedat work. This presents a poten0ally good market for the provision of an a(rac0ve bus systemtogether with Park and Ride.
o Almost 60% of people travelling by bus boarded two buses to get to their des0na0ons, whilstforty percent caught one bus. A negligible propor0on of bus users took three or four buses toreach their des0na0ons. A large majority of travellers would therefore benefit from throughrou0ng and 0cke0ng.
o Eighty percent of all people travelling either by bus, car or taxi, earn up to P20,000 per month;20% earn more than that. 15% of bus users, 10% of taxi users and 7% of car users earn P2,000or less. 34

Use of Transport Modelling: Case Study
Greater Gaborone Transport Model
o In terms of household vehicle ownership among bus, car and taxi users, more than 40% of busand taxi users come from households with no vehicles owned. However, for car users, almost50% of them come from households which own one vehicle; only 11% come from householdswith no vehicles owned, whilst the remainder come from households with 2 or more vehicles.
Person Trips by Mode
Assumed vehicle occupancies are shown below and these are used to derive the person trips splitby vehicle type from the manual classified counts:
Assumed Occupancy Rates for Various Modes
35
Vehicles Average Occupancy
Motorbikes 1
Taxis 1
Car 1.2
Goods 1
Minibus 16
Large Bus 20

Use of Transport Modelling: Case Study
Greater Gaborone Transport Model
Person Trips By Mode
36
Motos; 0%
Cars; 30%
Taxis; 0%Mini bus; 53%
Large bus; 3%Vans; 11%
Goods Vehicles; 2%Others; 0%
Motos
Cars
Taxis
Mini bus
Large bus
Vans
Goods Vehicles
Others

Use of Transport Modelling: Case Study
Greater Gaborone Transport Model
The chart above shows that the minibus carries more than half (53%) of the passengersencountered on the roads, whilst larger buses carry 3% of the passengers, assuming theoccupancy factors given above. Although minibuses constitute a small proportion of traffic on theroads (8%) they contribute substantially to the movement of people in and around Gaborone.
37

Use of Transport Modelling: Case Study
Greater Gaborone Transport Model: Forecast Model
The Transport Demand Forecast Model
o Origin-destination (O-D) bus surveys were undertaken in November 2014 and were used todevelop trip matrices to model public transport patronage on the existing combi routes withinGaborone and the long distance routes. A TransCAD transport model of Gaborone which hadbeen developed prior to the current study, was interrogated but could not be run. However,the TransCAD network was transferred to a Visual-tm modelling platform for the current study.The Visual-tm modelling platform was developed by Peter Davidson Consultancy of the UKwho were sub consultants to this project and provided all the transport modelling work.
o Bus routes that have been proposed in this study, were coded into the Visual-tm model toreplace the current services and the current demand matrix was assigned to the network. Theproposed bus service consists of a set of Frequent Core routes and Frequent Local routes toabsorb a significant proportion of the total travel demand, plus “Coverage” routes to fill in thegaps.
38

Use of Transport Modelling: Case Study
Greater Gaborone Transport Model: Forecast Model
The figure below shows the Zoning system that was developed as part of the Transport Model
39
Notes: The blue stars indicate tentative sites for Park and Ride carparks.
Zones are represented by small numbers; sectors are represented by large numbers
Zones have been coloured as follows:Pink : car drivers cannot use PnR, parking charges apply;Purple : car drivers cannot use PnR;Brown : car users can use PnR if travelling to pink zones;Green : additional zones where car users can use PnR if travelling to pink zones

Use of Transport Modelling: Case Study
Greater Gaborone Transport Model: Forecast Model
o A model of the existing minibus routes was developed, onto which the proposed bus routeswere superimposed as shown in the above map. It was then run to reproduce bus flows tomatch existing minibus passenger flows, together with potential Park and Ride passengers.The figures for Park and Ride are a result of the availability and attractiveness of a faster highquality bus service as well as the Park and Ride facility.
Park and Ride Forecasts with Parking Charges in the City CentreThe transport model was run taking into account parking restraint in the city centre, therestraint being in the form of parking charges. Sensitivity tests were undertaken for variouslevels of parking charges and for different Mode Perception Penalty (MPP) values (in minutes).A third variable that was used was catchment area. Three scenarios were considered:
o Scenario 1: only travellers from sectors 5 to 9 would consider to either use Park and Ride ornot;
o Scenario 2: travellers from sectors 5 to 9 plus those from zones 10, 13, 18 and 20 wouldconsider using Park and Ride;
o Scenario 3: all travellers with a destination in the city could consider using Park and Ride.40

Use of Transport Modelling: Case Study
Greater Gaborone Transport Model: PnR Forecast Model
Model results for Park and Ride with parking charges at different levels of MPP and catchmentareas were obtained. Results showed that as MPP increases the number of car drivers opting touse Park and Ride decreases. However, for each MPP value, as the parking charge in the citycentre increases, the number of car drivers opting to use the Park and Ride also increases. Also,with an increase in the size of the catchment area, the number of potential Park and Ride usersincreases.
This case study has only given the public transport element of the model. There is a NetworkTraffic Model that forms part of this Transport Model as well.
41