Colour emission tunability in Ho3+–Tm3+–Yb3+ co-doped Y2O3 upconverted phosphor
6
Colour emission tunability in Ho 3+ –Tm 3+ –Yb 3+ co-doped Y 2 O 3 upconverted phosphor Anurag Pandey • Vineet Kumar Rai Received: 10 July 2012 / Revised: 3 August 2012 / Published online: 25 September 2012 Ó Springer-Verlag 2012 Abstract The frequency upconversion (UC) emission throughout the visible region from the Y 2 O 3 :Ho 3? –Tm 3? – Yb 3? co-doped phosphors synthesized by using low tem- perature combustion process upon excitation with a diode laser operating at 980 nm have been presented. The colour emission tunability in co-doped phosphor has been observed on increasing the pump power and seen by the naked eyes. The tunability in colour emission has also been visualized by CIE chromaticity diagram. The variation in UC emission intensity of the 1 G 4 ? 3 H 6 (Tm 3? ) and 5 F 3 ? 5 I 8 (Ho 3? ) transitions lying in the blue region has been monitored with increase in the pump power and marked that their ratio can be used to determine the tem- perature. The developed phosphor has been used to record fingerprints. The observed most intense visible colour emission from the developed material may be used for photodynamic therapy and as an alternative of traditional fluorescent biolabels. 1 Introduction The generation of visible light from rare-earth (RE) and transition metal ions-doped materials are still very inter- esting work among researchers from the last two decades. This is due to their wide applications viz. display devices, solar cells, fingerprint detections, medical diagnosis, tem- perature sensors, etc. [1–7]. The best way of generating visible emissions from the lanthanides-doped materials due to their unique optical properties from the intra 4f-transi- tions upon near infrared (NIR) excitations is frequency upconversion (UC) [8–12]. The semiconductor quantum dots due to their bright photoluminescence, size-dependent tunable emission, broad ultraviolet excitation, narrow emission and good photostability have shown a wide range of applications, viz., gene delivery, cell labelling, energy transfer, tissue imaging, etc. But the long-term uses of quantum dots have been limited by its chemical instability and inherent cytotoxicity. Therefore, it is very essential to search the appropriate biolabels to overcome the limita- tions of traditionally used biolabels. Recently, the fre- quency upconversion through nonlinear optical processes has shown much interest among the researchers in medical field. Particularly, the lanthanides-doped UC nanoparticles have been found as an alternate and excellent substitute for traditional fluorescent biolabels. Photo dynamic therapy (PDT) is a cancer treatment method in which a drug, called photosensitizer is injected into blood stream which stays into cells of whole body for several hours. The injected sensitizer after certain period of time leaves the normal cells but remains in cancer cells for a longer time. In order to activate the sensitizer, excitation source of a particular wavelength is incident on the affected part of body that activates the photosensitizer remains in cancer cells and release the active singlet oxygen that possibly kills the cancer cells [13]. Several popular oxides have been used as host materials, among them Y 2 O 3 is most challenging because of its spe- ciality as wide band gap, high melting point, low phonon frequency, etc. [10]. The yttrium oxide has been considered as an attractive host material because the Ho 3? , Tm 3? and Yb 3? ions have nearly the same ionic radii as that of the Y 3? ions. The triply ionized lanthanides doped into a A. Pandey V. K. Rai (&) Laser and Spectroscopy Laboratory, Department of Applied Physics, Indian School of Mines, Dhanbad 826004, Jharkhand, India e-mail: [email protected]; [email protected] 123 Appl. Phys. B (2012) 109:611–616 DOI 10.1007/s00340-012-5224-1
-
Upload
independent -
Category
Documents
-
view
2 -
download
0
Transcript of Colour emission tunability in Ho3+–Tm3+–Yb3+ co-doped Y2O3 upconverted phosphor

Colour emission tunability in Ho3+–Tm3+–Yb3+ co-doped Y2O3
upconverted phosphor
Anurag Pandey • Vineet Kumar Rai
Received: 10 July 2012 / Revised: 3 August 2012 / Published online: 25 September 2012
� Springer-Verlag 2012
Abstract The frequency upconversion (UC) emission
throughout the visible region from the Y2O3:Ho3?–Tm3?–
Yb3? co-doped phosphors synthesized by using low tem-
perature combustion process upon excitation with a diode
laser operating at 980 nm have been presented. The colour
emission tunability in co-doped phosphor has been
observed on increasing the pump power and seen by the
naked eyes. The tunability in colour emission has also been
visualized by CIE chromaticity diagram. The variation in
UC emission intensity of the 1G4 ? 3H6 (Tm3?) and5F3 ? 5I8 (Ho3?) transitions lying in the blue region has
been monitored with increase in the pump power and
marked that their ratio can be used to determine the tem-
perature. The developed phosphor has been used to record
fingerprints. The observed most intense visible colour
emission from the developed material may be used for
photodynamic therapy and as an alternative of traditional
fluorescent biolabels.
1 Introduction
The generation of visible light from rare-earth (RE) and
transition metal ions-doped materials are still very inter-
esting work among researchers from the last two decades.
This is due to their wide applications viz. display devices,
solar cells, fingerprint detections, medical diagnosis, tem-
perature sensors, etc. [1–7]. The best way of generating
visible emissions from the lanthanides-doped materials due
to their unique optical properties from the intra 4f-transi-
tions upon near infrared (NIR) excitations is frequency
upconversion (UC) [8–12]. The semiconductor quantum
dots due to their bright photoluminescence, size-dependent
tunable emission, broad ultraviolet excitation, narrow
emission and good photostability have shown a wide range
of applications, viz., gene delivery, cell labelling, energy
transfer, tissue imaging, etc. But the long-term uses of
quantum dots have been limited by its chemical instability
and inherent cytotoxicity. Therefore, it is very essential to
search the appropriate biolabels to overcome the limita-
tions of traditionally used biolabels. Recently, the fre-
quency upconversion through nonlinear optical processes
has shown much interest among the researchers in medical
field. Particularly, the lanthanides-doped UC nanoparticles
have been found as an alternate and excellent substitute for
traditional fluorescent biolabels. Photo dynamic therapy
(PDT) is a cancer treatment method in which a drug, called
photosensitizer is injected into blood stream which stays
into cells of whole body for several hours. The injected
sensitizer after certain period of time leaves the normal
cells but remains in cancer cells for a longer time. In order
to activate the sensitizer, excitation source of a particular
wavelength is incident on the affected part of body that
activates the photosensitizer remains in cancer cells and
release the active singlet oxygen that possibly kills the
cancer cells [13].
Several popular oxides have been used as host materials,
among them Y2O3 is most challenging because of its spe-
ciality as wide band gap, high melting point, low phonon
frequency, etc. [10]. The yttrium oxide has been considered
as an attractive host material because the Ho3?, Tm3? and
Yb3? ions have nearly the same ionic radii as that of the
Y3? ions. The triply ionized lanthanides doped into a
A. Pandey � V. K. Rai (&)
Laser and Spectroscopy Laboratory,
Department of Applied Physics,
Indian School of Mines, Dhanbad 826004,
Jharkhand, India
e-mail: [email protected]; [email protected]
123
Appl. Phys. B (2012) 109:611–616
DOI 10.1007/s00340-012-5224-1

variety of hosts to obtain their emission characteristics and
as an ideal sensitizer to enhance their emission intensities
and energy transfer purposes have been used by different
researchers [14–16].
Colour emission tunability is one of the very interesting
properties of a material since it produces more than one
colour even from a single material upon suitable optical
excitation. A very few papers on colour emission tunability
for materials doped/co-doped with the Er3?, Yb3?, Ho3?
and Tm3? ions have been reported [17–25]. However, the
Yb3?/Ho3?/Tm3? ions co-doped in Y2O3 phosphor upon
980 nm excitation has not been synthesized and investi-
gated so for.
Here, we report the NIR to visible frequency UC in the
Ho3?–Tm3?–Yb3? co-doped Y2O3 phosphor prepared by
the combustion process. The colour emission tunability
with variation in the pump power has been monitored and
explained on the basis of CIE chromaticity diagram. The
temperature sensing measurement and finger print record-
ing of the material has been done and explained based on
the available data. The blue to red and green to red UC
emission intensity ratio which decides the purity of blue
and green emissions suitable for biological and medical
applications has been determined.
2 Experimental
2.1 Material preparation
The materials of high purity (99.90–99.99 %) have been
used without further purifications and synthesized by
combustion process. The Y2O3, Ho2O3, Tm2O3 and Yb2O3
were taken as raw materials while urea (NH2–CO–NH2)
was used as the organic fuel. In the synthesis process, the
concentration of dopants namely holmium and thulium
were fixed along with varying concentration of ytterbium.
The mixture ratios of reactants used were as follows:
1� x� y� zð Þ Y2O3 þ xHo2O3 þ yTm2O3 þ zYb2O3
where x and y were fixed at 0.001 and z varies from 0.01 to
0.07.
The desired amounts of Y2O3, Ho2O3, Tm2O3 and Yb2O3
materials were first dissolved in nitric acid properly to get
the transparent solution. The transparent solution was then
mixed with urea and stirred at 1,000 rpm with the help of
magnetic stirrer and heated at 80 �C. In 1–2 h, the solution
became a transparent gel and then rapidly heated into a
furnace preheated to 650 �C. Within 4 min, the solution
becomes foamed and a flame was produced which lasted for
few seconds. After that, the sample was immediately
removed from the furnace and resultant fluffy mass was
taken out. The fluffy mass of sample was grinded into fine
powder and finally the Y2O3:Ho3?–Tm3?–Yb3? phosphor
powders were used for further optical characterization.
2.2 Characterization
The as-synthesized fine Y2O3:Ho3?–Tm3?–Yb3? phosphor
powders were used for the characterization purposes. The
determination of average crystallite size have been performed
by X-ray powder diffraction pattern recorded by X-ray dif-
fractometer using Cu Ka1 radiation (k = 0.154 nm) within
the range 10�–80�.
The UC emission spectra have been recorded using a
Princeton triple grating monochromator (Acton SP2300)
attached with a photomultiplier tube (PMT) and personal
computer (PC). The samples were pumped by a diode
(CW) laser operating at 980 nm. All the measurements
were performed at room temperature.
3 Results and discussion
3.1 X-ray diffraction analysis
Figure 1 shows the X-ray diffraction (XRD) pattern of as-
synthesized Y2O3:Ho3?–Tm3?–Yb3? phosphor prepared by
combustion route in the range 10�–80�. The diffraction
peaks observed are well indexed to the cubic Y2O3 phase
(JCPDS file no. 25-1200). This shows that sample is well
crystallized, cubic-shaped with the lattice parameters
a = b = c = 10.604 A and a = b = c = 90�. The average
crystallite size of Y2O3:Ho3?–Tm3?–Yb3? phosphor has
been calculated using famous Debye–Scherrer equation:
d ¼ 0:89kbCosh
ð1Þ
where d the crystallite size, k the wavelength of X-ray
radiation, b the full-width half maxima (FWHM) and h is
diffraction angle. The average crystallite size was found in
Fig. 1 XRD pattern of Y2O3:Ho3?–Tm3?–Yb3? phosphor
612 A. Pandey, V. K. Rai
123
39–47 nm range that indicates that the developed phosphor
is a nano-material.
3.2 Upconversion emission study
The UC emission spectra of Y2O3:Ho3?–Tm3?–Yb3?
phosphor at varying concentrations of ytterbium from 1.0
to 7.0 mol % with fixed holmium and thulium concentra-
tions at 0.1 mol % have been recorded. Several UC emis-
sion bands for both the Ho3? and Tm3? ions have been
found. The maximum enhancement in UC emission inten-
sity for all bands in the co-doped phosphor of 0.1Tm3? ?
2.0Yb3? ? 0.1Ho3? RE ions concentrations has been
observed.
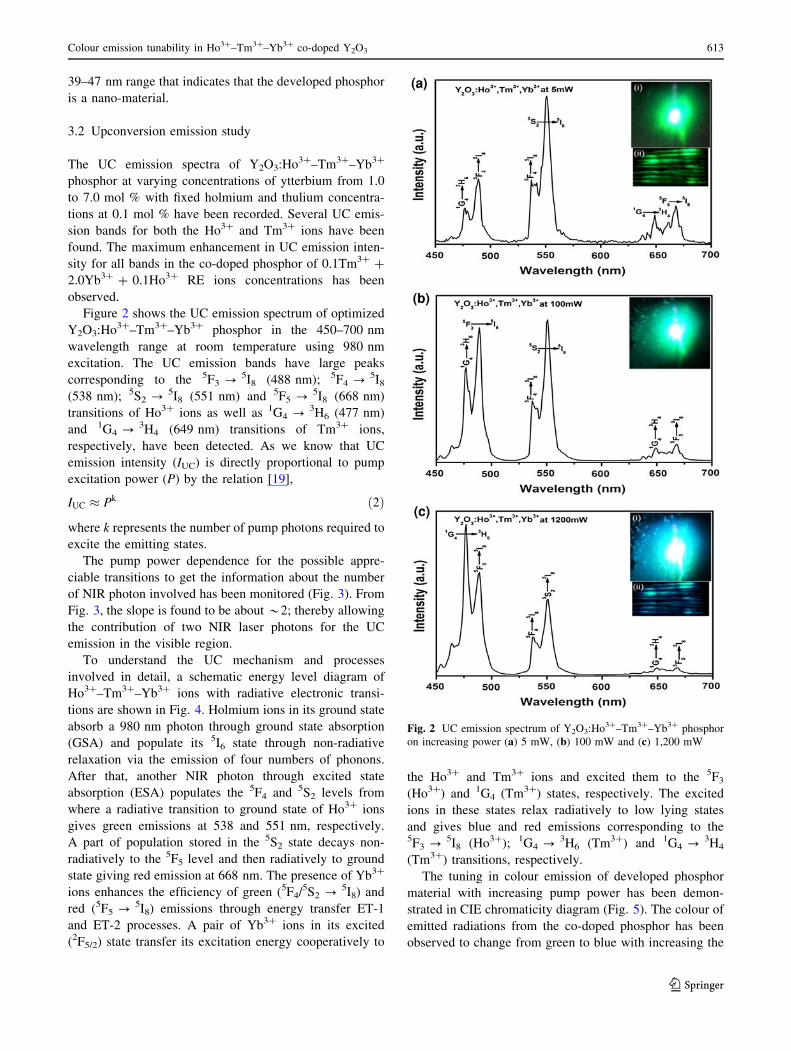
Figure 2 shows the UC emission spectrum of optimized
Y2O3:Ho3?–Tm3?–Yb3? phosphor in the 450–700 nm
wavelength range at room temperature using 980 nm
excitation. The UC emission bands have large peaks
corresponding to the 5F3 ? 5I8 (488 nm); 5F4 ? 5I8
(538 nm); 5S2 ? 5I8 (551 nm) and 5F5 ? 5I8 (668 nm)
transitions of Ho3? ions as well as 1G4 ? 3H6 (477 nm)
and 1G4 ? 3H4 (649 nm) transitions of Tm3? ions,
respectively, have been detected. As we know that UC
emission intensity (IUC) is directly proportional to pump
excitation power (P) by the relation [19],
IUC � Pk ð2Þ
where k represents the number of pump photons required to
excite the emitting states.
The pump power dependence for the possible appre-
ciable transitions to get the information about the number
of NIR photon involved has been monitored (Fig. 3). From
Fig. 3, the slope is found to be about *2; thereby allowing
the contribution of two NIR laser photons for the UC
emission in the visible region.
To understand the UC mechanism and processes
involved in detail, a schematic energy level diagram of
Ho3?–Tm3?–Yb3? ions with radiative electronic transi-
tions are shown in Fig. 4. Holmium ions in its ground state
absorb a 980 nm photon through ground state absorption
(GSA) and populate its 5I6 state through non-radiative
relaxation via the emission of four numbers of phonons.
After that, another NIR photon through excited state
absorption (ESA) populates the 5F4 and 5S2 levels from
where a radiative transition to ground state of Ho3? ions
gives green emissions at 538 and 551 nm, respectively.
A part of population stored in the 5S2 state decays non-
radiatively to the 5F5 level and then radiatively to ground
state giving red emission at 668 nm. The presence of Yb3?
ions enhances the efficiency of green (5F4/5S2 ? 5I8) and
red (5F5 ? 5I8) emissions through energy transfer ET-1
and ET-2 processes. A pair of Yb3? ions in its excited
(2F5/2) state transfer its excitation energy cooperatively to
the Ho3? and Tm3? ions and excited them to the 5F3
(Ho3?) and 1G4 (Tm3?) states, respectively. The excited
ions in these states relax radiatively to low lying states
and gives blue and red emissions corresponding to the5F3 ? 5I8 (Ho3?); 1G4 ? 3H6 (Tm3?) and 1G4 ? 3H4
(Tm3?) transitions, respectively.
The tuning in colour emission of developed phosphor
material with increasing pump power has been demon-
strated in CIE chromaticity diagram (Fig. 5). The colour of
emitted radiations from the co-doped phosphor has been
observed to change from green to blue with increasing the
Fig. 2 UC emission spectrum of Y2O3:Ho3?–Tm3?–Yb3? phosphor
on increasing power (a) 5 mW, (b) 100 mW and (c) 1,200 mW
Colour emission tunability in Ho3?–Tm3?–Yb3? co-doped Y2O3 613
123

pump power in the range 5 mW–1.8 W (Fig. 5). The
intensity ratio for the blue to red and green to red UC
emission bands were noted to be 1.7 and 3.9, respectively,
even at very low pump power (*5 mW) of the diode laser.
With increasing the pump power the blue to red and green
to red intensity ratio has been increased and the corre-
sponding ratio was observed to be *24 and *19,
respectively, at 1.8 W pump power of the diode laser. This
result indicates that high purity blue and green colour
emissions from the synthesized phosphor material can also
be used in minimally invasive photodynamic therapy and
fluorescent biolabelling [26, 27]. Because in PDT cancer
cells are irradiated with light flux of an appropriate
wavelength matched to the absorption spectrum of photo-
sensitizer and the absorption bands of photosensitizer lies
mainly throughout the visible region that suitably matched
with developed upconverted material. Irradiation with a
suitable wavelength may trigger selective photochemical
reaction that occurs at very small power densities
(0.01–50 W/cm2), resulting in desirable biological trans-
formation [28]. The power densities of light emitted
from synthesized Y2O3:Ho3?–Tm3?–Yb3? phosphor is off
course very small (*0.02–2.0 W/cm2 at pump excitation
of *0.33–117 W/cm2) but within the above range, i.e.
0.01–50 W/cm2 [28]. Therefore, the present developed
Y2O3:Ho3?–Tm3?–Yb3? phosphor may be of specific use
for PDT. The colour emission tunability with increase in
the pump power is shown in CIE colour coordinates
(Fig. 5) and the optical photographs of these colours are
shown in Fig. 2[a(i)], [b], [c(i)].
3.3 Fingerprint detection
The tunability in colour emission of as-synthesized
Y2O3:Ho3?–Tm3?–Yb3? phosphor with respect to excita-
tion power can be utilized in detection of finger prints. In
finger print detection technique, the phosphor material has
been spread on finger marks and NIR beam emitted from a
diode laser is allowed to fall on the marks. Figure 2[a(ii)]
and [c(ii)] shows the photographs of fingerprint developed
on a plane glass sheet using as-synthesized Y2O3:Ho3?–
Tm3?–Yb3? phosphor excited by 980 nm diode laser in
green and blue colours at 5 and 1,200 mW, respectively.
The latent finger prints were visualized due to the UC
emission of powder sprinkled on finger print marks that can
be seen by naked eyes (shown in inset of Fig. 2). The
intense emissions from developed material in different
colour helped to detect the finger print marks easily.
Fig. 3 The logarithmic dependence of peak intensity of blue, green
and red UC emissions as a function of pump power
Fig. 4 Energy level diagram of Ho3?–Tm3?–Yb3? ions with possi-
ble transition scheme
Fig. 5 CIE chromaticity diagram of Y2O3:Ho3?–Tm3?–Yb3? phos-
phor at different pump powers
614 A. Pandey, V. K. Rai
123

3.4 Temperature sensor
Figure 6 shows the UC emission spectra of blue emission
band of the Y2O3: Ho3?–Tm3?–Yb3? co-doped phosphor
in the 450–510 nm region on 980 nm excitation at different
pump powers. It is observed that the UC emission intensity
ratio corresponding to the 1G4 ? 3H6 (Tm3?) and5F3 ? 5I8 (Ho3?) peaking at 477 and 488 nm, respectively,
shows a significant variation with increasing the pump
power. The energy difference between the two emission
transitions is DE & 473 cm-1. This shows that the 1G4 and5F3 levels are very close to each other. Therefore,
according to the fluorescence intensity ratio technique [29,
30], they can be used to study the temperature sensing
behaviour of the developed phosphor material. It has been
found that the intensity ratio of two closely spaced transi-
tions 1G4 ? 3H6 and 5F3 ? 5I8 (i.e. I477nm/I488nm) increa-
ses linearly with the input power densities (Fig. 7).
The intensity ratios of two transitions coming from the
closely spaced levels of Tm3? and Ho3? ions vary with
temperature according to:
I477nm
I488nm
¼ B expð�DE
kTÞ ð3Þ
where all the terms have their usual meanings [29, 30].
Now we consider that at very low pump power (i.e. power
density of 0.32 W/cm2 at 5 mW of beam spot size
*1.4 mm) the sample was at room temperature (27 �C).
The calculated value of constant B using the above equa-
tion is found to be 5.99. Then the temperature of sam-
ple corresponding to different values of intensity ratios
(I477nm/I488nm) at different power densities can easily be
calculated (Table 1).
Thus from the Table 1 we conclude that the developed
phosphor can also be used as high temperature sensor
probe.
4 Conclusion
Cubic shaped Ho3?–Tm3?–Yb3? co-doped Y2O3 phosphor
has been synthesized successfully by the combustion route.
NIR to visible UC emission has been observed. The colour
emission tunability from green to blue with increasing
pump power has been verified by the help of CIE chro-
maticity diagram. The UC-based finger print detecting
concept has been demonstrated and noted that the present
phosphor can be used in latent finger print detection pur-
pose. The Intensity ratio (I477nm/I488nm) of two closely
spaced blue UC emission bands of Tm3? and Ho3? ions
has been found to increase linearly with input pump power
Fig. 6 Variation of blue UC spectrum of Y2O3: Ho3?–Tm3?–Yb3?
phosphor on increasing pump power
Fig. 7 The plot of intensity ratio of blue UC emissions at different
powers densities
Table 1 Calculated temperature of sample for different intensity
ratios at different pump power densities
Power density
(W/cm2)
Intensity ratio
(I477nm/I488nm)
Calculated
temperature (K)
0.33 0.51 300.1
0.65 0.59 319.4
3.25 0.64 330.8
6.49 0.70 344.7
12.98 0.81 370.5
22.73 0.92 396.3
32.47 1.01 416.3
45.46 1.13 443.7
55.19 1.23 469.0
64.94 1.34 494.0
77.92 1.45 521.8
97.40 1.59 561.3
116.88 1.68 583.5
Colour emission tunability in Ho3?–Tm3?–Yb3? co-doped Y2O3 615
123

showing the potentiality of the present phosphor to be used
as high temperature sensor probe. Also, the highly pure
intense blue and green colour emissions from the devel-
oped phosphor upon excitation with 980 nm diode laser
provided the possibility that the present material can be
used for photodynamic therapy and also may be an alter-
native and substitute for traditional biolabels.
Acknowledgments Authors are grateful to the University Grants
Commission, New Delhi, India for providing the financial assistance.
References
1. V.K. Rai, Temperature sensor and optical sensor. Appl. Phys. B
88, 297–303 (2007)
2. M. Zhang, J. Wang, W. Ding, Q. Zhang, Q. Su, A novel white
light-emitting diode (w-LED) fabricated with Sr6BP5O20:Eu2?
phosphor. Appl. Phys. B 86, 647–651 (2007)
3. C. Champod, C. Lennard, P. Margot, M. Stoilovic, Fingerprintand other ride skin impression. (CRC Press, Boca Raton, 2004)
4. F. Auzel, Upconversion and anti-stokes processes with f and d
ions in solids. Chem. Rev. 104, 139–173 (2004)
5. E.D. Rosa, P. Salas, H. Desirena, C. Angeles, R.A. Rodriguez,
Strong green upconversion emission in ZrO2:Yb3?-Ho3? nano-
crystals. Appl. Phys. Lett. 87, 241912 (2005)
6. F. Wang, X. Liu, Recent advances in the chemistry of lantha-
nides-doped upconversion nanocrystals. Chem. Soc. Rev. 38,
976–989 (2009)
7. S.K. Singh, K. Kumar, S.B. Rai, Diode laser pumped Gd2O3:Er3?/
Yb3? phosphor as optical nano-heater. Appl. Phys. B 100, 443–
446 (2010)
8. V.K. Rai, L.S. Menezes, C.B. de Araujo, Infrared to green and
blue upconversion in Tm3? doped TeO2–PbO glass. J. Appl.
Phys. 103, 53514 (2008)
9. D.K. Mohanty, V.K. Rai, Y. Dwivedi, Yb3? sensitized Tm3?
upconversion in tellurite lead oxide glass. Spectrochim. Acta A
89, 264–267 (2012)
10. V. Singh, V.K. Rai, I. Ledoux-Rak, S. Watanabe, T.K. Gundu
Rao, J.F.D. Chubaci, L. Badie, F. Pelle, S. Ivanova, NIR to vis-
ible up-conversion, infrared luminescence, thermoluminescence
and defect centers in Y2O3: Er phosphor. J. Phys. D 42, 065104
(2009)
11. G. Blasse, B.C. Grabmaier, Luminescent Materials (Springer,
Berlin, 1994)
12. Y. Dwivedi, S.B. Rai, Blue and red emission from Eu doped barium
tetraborate crystals. J. Am. Ceram. Soc. 93, 727–731 (2010)
13. H.S. Mader, P. Kele, S.M. Saleh, O.S. Wolfbeis, Upconverting
luminescent nanoparticles for use in bioconjugation and bioi-
maging. Curr. Opin. Chem. Biol. 14, 582–596 (2010)
14. H. Zhang, X.Y. Liu, F.Y. Zhao, L.H. Zhang, Y.F. Zhang, H. Guo,
Efficient visible to near-infrared energy transfer in Ce3?–Yb3?
codoped Y2SiO5 phosphor. Opt. Mater. 34, 1034–1036 (2012)
15. H.D. Liu, X.X. Zhang, X.L. Wu, Q. Zhang, Y.Z. Liu, Study on
relaxation oscillation of Er3?/Yb3? codoped phosphate glass
optical waveguide laser. Chin. Sci. Bull. 54, 3653–3657 (2009)
16. C. Reinhard, R. Valiente, H.U. Guiidel, Exchange-induced upcon-
version in Rb2MnCl4:Yb3?. J. Phys. Chem. B 106, 10051–10057
(2002)
17. O. Meza, L.A. Diaz-Torres, P. Salas, E. De la Rosa, D. Solis,
Color tunability of the upconversion emission in Er-Yb doped the
wide band gap nanophosphors ZrO2 and Y2O3. Mater. Sci. Eng. B
174, 177–181 (2010)
18. J.J. Li, L.W. Yang, Y.Y. Zhang, J.X. Zhong, C.Q. Sun, P.K. Chu,
Pump-power tunable white upconversion emission in lanthanide-
doped hexagonal NaYF4 nanorods. Opt. Mater. 33, 882–887
(2011)
19. J. Grube, M. Voss, G. Doke, A. Sarakovskis, M. Springis, Mul-
ticolor up-conversion luminescence in rare-earth doped NaLaF4.
IOP Conf. Ser. Mater. Sci. Eng. 23, 012004 (2011)
20. A.S. Gouveia-Neto, L.A. Bueno, R.F. Nascimento, E.A. Silva,
E.B. da Costa, Rare-earth doped solid state phosphor with
temperature induced variable chromaticity. Mater. Lett. 63,
1999–2002 (2009)
21. A. Bednarkiewicz, D. Wawrzynczyk, M. Nyk, M. Samoc, Tun-
able red-green-white up-conversion color in nano NaYF4:Er/Yb
phosphor. J. Rare Earths 29, 1152–1156 (2011)
22. N.K. Giri, D.K. Rai, S.B. Rai, Multicolor upconversion from
Tm3? ? Ho3? ? Yb3? codoped tellurite glass on NIR excita-
tion. Appl. Phys. B 91, 437–441 (2008)
23. Y. Kuisheng, L. Yan, Y. Chaoyi, L. Liping, Y. Chanhua, Z.
Xiyan, Upconversion luminescence properties of Ho3?, Tm3?,
Yb3? co-doped nanocrystal NaYF4 synthesized by hydrothermal
method. J. Rare Earths 24, 757–760 (2006)
24. Z. Xia, W. Zhou, H. Du, J. Sun, Synthesis and spectral analysis of
Yb3?/Tm3?/Ho3?-doped Na0.5Gd0.5WO4 phosphor to achieve
white upconversion luminescence. Mater. Res. Bull. 45, 1199–
1202 (2010)
25. Y. Ledemi, D. Manzani, S.J.L. Ribeiro, Y. Messaddeq, Multi-
color up conversion emission and color tunability in Yb3?/Tm3?/
Ho3? triply doped heavy metal oxide glasses. Opt. Mater. 33,
1916–1920 (2011)
26. D.L. Yang, H. Gong, E.Y.B. Pun, X. Zhao, H. Lin, Rare-earth
ions doped heavy metal germanium tellurite glasses for fiber
lighting in minimally invasive surgery. Opt. Express 18, 18997–
19008 (2010)
27. J. Shen, L.-D. Sun, X.-H. Yan, Luminescent rare earth nanoma-
terials for bioprobe applications. Dalton Trans. 42, 5687–5697
(2008)
28. T. Nyokong, V. Ahsen, Photosensitizers in Medicine, Environ-ment, and Security. (Springer Science ? Business Media B. V.,
The Netherlands, 2012). doi:10.1007/978-90-481-3872-2
29. V.K. Rai, C.B. de Araujo, Fluorescence intensity technique
for Sm3? doped calibo glass. Spectrochim. Acta A 69, 509–512
(2008)
30. S.A. Wade, S.F. Collins, G.W. Baxter, Fluorescence intensity
ratio technique for optical fiber point temperature sensing.
J. Appl. Phys. 94, 4743–4756 (2003)
616 A. Pandey, V. K. Rai
123