
Structural, morphological and luminescence properties of nanocrystalline up-converting...
38
Accepted Manuscript Structural, morphological and luminescence properties of nanocrystalline up- converting Y 1.89 Yb 0.1 Er 0.01 O 3 phosphor particles synthesized through aerosol route V. Lojpur, L. Mancic, M.E. Rabanal, M.D. Dramicanin, Z. Tan, T. Hashishin, S. Ohara, O. Milosevic PII: S0925-8388(13)01750-7 DOI: http://dx.doi.org/10.1016/j.jallcom.2013.07.125 Reference: JALCOM 29049 To appear in: Received Date: 18 March 2013 Accepted Date: 19 July 2013 Please cite this article as: V. Lojpur, L. Mancic, M.E. Rabanal, M.D. Dramicanin, Z. Tan, T. Hashishin, S. Ohara, O. Milosevic, Structural, morphological and luminescence properties of nanocrystalline up-converting Y 1.89 Yb 0.1 Er 0.01 O 3 phosphor particles synthesized through aerosol route, (2013), doi: http://dx.doi.org/10.1016/ j.jallcom.2013.07.125 This is a PDF file of an unedited manuscript that has been accepted for publication. As a service to our customers we are providing this early version of the manuscript. The manuscript will undergo copyediting, typesetting, and review of the resulting proof before it is published in its final form. Please note that during the production process errors may be discovered which could affect the content, and all legal disclaimers that apply to the journal pertain.
-
Upload
independent -
Category
Documents
-
view
0 -
download
0
Transcript of Structural, morphological and luminescence properties of nanocrystalline up-converting...
Accepted Manuscript
Structural, morphological and luminescence properties of nanocrystalline up-
converting Y1.89Yb0.1Er0.01O3 phosphor particles synthesized through aerosol
route
V. Lojpur, L. Mancic, M.E. Rabanal, M.D. Dramicanin, Z. Tan, T. Hashishin,
S. Ohara, O. Milosevic
PII: S0925-8388(13)01750-7
DOI: http://dx.doi.org/10.1016/j.jallcom.2013.07.125
Reference: JALCOM 29049
To appear in:
Received Date: 18 March 2013
Accepted Date: 19 July 2013
Please cite this article as: V. Lojpur, L. Mancic, M.E. Rabanal, M.D. Dramicanin, Z. Tan, T. Hashishin, S. Ohara,
O. Milosevic, Structural, morphological and luminescence properties of nanocrystalline up-converting
Y1.89Yb0.1Er0.01O3 phosphor particles synthesized through aerosol route, (2013), doi: http://dx.doi.org/10.1016/
j.jallcom.2013.07.125
This is a PDF file of an unedited manuscript that has been accepted for publication. As a service to our customers
we are providing this early version of the manuscript. The manuscript will undergo copyediting, typesetting, and
review of the resulting proof before it is published in its final form. Please note that during the production process
errors may be discovered which could affect the content, and all legal disclaimers that apply to the journal pertain.
1
Structural, morphological and luminescence properties of nanocrystalline up-
converting Y1.89Yb0.1Er0.01O3 phosphor particles synthesized through aerosol route
V. Lojpura, L. Mancic
a, M.E. Rabanal
b, M.D. Dramicanin
c, Z. Tan
d, T. Hashishin
d
S.Oharad, O. Milosevic
a,*
aInstitute of Technical Sciences of the Serbian Academy of Sciences and Arts,
K.Mihailova 35/IV, 11000 Belgrade, Serbia
bUniversity Carlos III of Madrid, Avd. Universidad 30, 28911 Leganes, Madrid, Spain
cVinca Institute of Nuclear Science, University of Belgrade, P.O. Box 522, Belgrade,
Serbia
dJWRI, Osaka University, 11-1 Mihogaoka, Ibaraki, Osaka 567-0047, Japan
* Corresponding author: tel. +381 11 2636994, fax. +381 11 2185263,
e-mail: [email protected]
Abstract
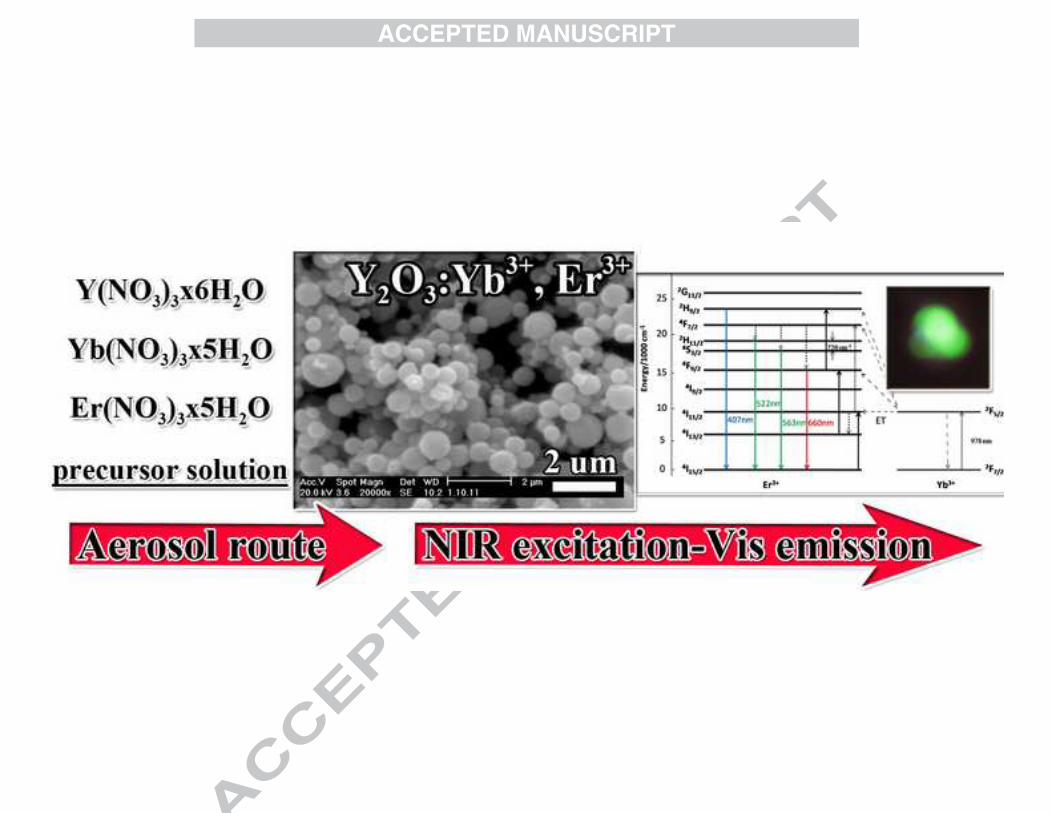
Nanocrystalline up-converting Y2O3:Yb3+
,Er3+
phosphor particles were processed in a
dispersed system-aerosol, generated ultrasonically at 1.3MHz from common nitrate
precursor solution having fixed ytterbium-to-erbium concentration ratio. The appropriate
process parameters: residence time 21s, carrier gas (air) flow rate 1.6 dm3/min, synthesis
temperature 900oC, led to the formation of un-agglomerated spherical nanostructured
secondary particles, having mean particle size of approx 450nm, composed of primary
nanoscaled (20nm) subunits. In order to reach targeting phase crystallinity, the as-prepared
2
particles were additionally annealed at 1100oC in air for 12, 24 and 48 h, respectively.
Particle structure, morphology and purity were analyzed by x-ray powder diffraction
(XRPD), scanning electron microscopy (FESEM/SEM), analytical and high resolution
transmission electron microscopy (TEM/HRTEM) in combination with energy dispersive
x-ray analysis and Fourier Transform Infrared Spectroscopy (FTIR). All samples
crystallized in a cubic bixbyte-structure, space group Ia-3. The crystallite size changed with
annealing time from 30 nm in as-prepared sample to 135 nm in sample annealed for 48h,
respectively. Emission spectra were assigned to the following trivalent erbium f-f electronic
transitions: 2H9/2→
4I15/2 (blue: 407-420 nm), (
2H11/2,
4S3/2) →
4I15/2 (green: 510-590 nm),
and 4F9/2→
4I15/2 (red: 640-720 nm). The significant improvement of the emission decay
times were observed after thermal treatment and this effect is correlated further with the
structural and morphological particles characteristics. For the annealing time of 12h a quite
high emission decay times were achieved (blue: 0.14 ms, green: 0.32 ms and red: 0.39 ms).
Keywords: aerosol processing, nanoparticles, Y2O3, up-conversion, decay time
Introduction
The up-conversion (UC) describes the physical process which takes multiple
photons of lower energy and converts them to one photon of higher energy.1 In recent
years, there is a great interest in the investigation of up-conversion luminescence materials
due to the wide range of their applications, such as in solid state lasers, screen displays,
3
sensors, optical data storage, fluorescent labels for sensitive detection of bio-molecules,
telecommunications etc.2-6
The most commonly used activator is trivalent rare earth ion
Er3+
since it posses the metastable 4I9/2 and
4I11/2 levels that can be filled using the low-cost
high-power diode laser of 980 nm. Since the absorption of Er3+
is quite small at this
wavelength, Yb3+
ion has been used commonly as a sensitizer to enhance the absorption.
Similar positions of energy levels between 4I11/2
(Er
3+) and
2F5/2 (Yb
3+) favors transfer of
the excitation energy from Yb3+
to Er3+
ions, leading to the subsequent excitation of erbium
higher levels, so emitting light is with higher energy, i.e. in the visible spectra.7,8
Since it is well known that up-conversion performance of rare earth ions depends on
the host matrix, the choice of suitable host material is of great importance. In accordance
to the literature, the following oxides have been investigated up to now: Y2O3, Gd2O3,
Lu2O3, ZrO2 and TiO2.9-13
In particular, rare-earth sesquioxides are well recognized because
of their excellent chemical stability, good thermal conductivity and high light output.
Especially, Y2O3 has large energy band gap of 5.8 eV which easily accommodates energy
levels of rare earth dopants, while its low phonon energy (~ 430-550 cm-1
) minimizes
multiphonon nonradiative relaxations, which is very important for achievement of high
emission efficiencies after doping.14
Moreover, Y2O3 with its high melting point (2450°C)
and good optical properties (refractive index >1.9 and wide transmission region) is a very
suitable host candidate for up-conversion and laser applications.8
Synthesis of the nanocrystalline host matrix additionally intensifies the
luminescence response in comparison to the bulk microcrystalline materials. Because of the
localized electronic states and relatively weak ion–phonon interactions, the spectroscopic
4
properties of the divalent and trivalent lanthanide ions in nanocrystals do not differ
significantly from those in bulk crystals. However, nanoscale size variation may affect the
excited state dynamics including radiative and nonradiative decay times, energy transfer,
and thermalization phenomena. Therefore, one expects to observe changes in luminescence
decay times, energy transfer efficiency, and efficiency of upconversion luminescence.15
Different methods for the synthesis of up-conversion nanocrystalline materials are
reported in the literature such as sol-gel, combustion, hydrothermal method, pulsed laser
deposition, homogenous precipitation method etc.16-20
Synthesis of up-convertors with the
good characteristics requires strict control of the particle size, morphology, crystal structure
and uniform distribution of the luminescent center in the host lattice. Getting the ideal
spherical particles is crucial for the good packing density and a small scattering of light,
and additionally improves the brightness and resolutions of nanomaterials.21
In comparison
with other methods, aerosol processing offers the possibility for obtaining submicronic
nanostructured particles with well controlled size and morphology.22
The factors that affect
the formation of a certain particle structure and morphology are physico-chemical
properties of the precursor solution and the mechanisms of its decomposition in a dispersed
system-aerosol. The latter one comprises several steps like droplets evaporation and drying,
solute precipitation and decomposition, associated with the nucleation, growth, collision
and/or coalescence of primary nanoparticles into the secondary spherical assemblage; all of
them are influenced by the processing parameters (reaction temperature, atmosphere and
residence time). Since the reaction is performed in disperse systems, in the droplets of a
5
few microns, the compositional segregation is suppressed and the uniform distribution of
dopants is enhanced.
In our previous work, we have successfully obtained red emitting down-conversion
Y2O3, Gd2O3 and Y1-xGdxO3:Eu3+
(x=0-1), phosphor particles with desired morphological
and good luminescent properties.23-25
In addition, we have recently processed the
temperature sensitive up-conversion Y2O3 nanocrystalline particles, doped with Yb3+
and
co-doped with either Tm3+
or Ho3+
.26
Here, ytterbium and erbium co-doped Y2O3 powders
with composition Y1.89Yb0.1Er0.01O3, and with advanced morphological and structural
characteristics were synthesized for the first time through aerosol route, i.e. spray pyrolysis,
from common nitrate solution. The effects of different annealing conditions on particles
structural and morphological characteristics are followed in details and are further
correlated with the measured optical properties.
Experimental
Y2O3:Yb,Er powder was synthesized via spray pyrolysis from 0.1 M nitrate
precursor solution containing stoichiometric amounts of Y(NO3)3·6H2O, Yb(NO3)3·5H2O
and Er(NO3)3·5H2O defined by Y1.89Yb0.1Er0.01O3 composition. Atomization of the
precursor was done with an ultrasonic atomizer (RBI-France, working frequency of 1.3
MHz). The aerosol was introduced into a high-temperature tubular reactor with the three
independently controlled temperature zones by means of air as a carrier gas, 1.6 dm3/min.
The synthesis was carried out on 900oC and the total droplet/particle residence time in the
6
reactor zone (for) was about 21 s. The as-prepared powder was collected at the end of the
reactor in electrostatic precipitator and subjected to the additional thermal treating in air at
1100 °C for 12, 24 and 48h. The synthesis procedure flowchart is given elsewhere.22
The phase composition of the obtained powder samples were performed by X-ray
powder diffraction (XRPD) analysis on X’Pert Philips diffractometer operating with Cu Kα
radiation at 40mA and 40kV, in the 2Ө range from 10° to 100° with a step scan of 0.02 and
counting time of 10 s per each step. Rietveld structural refinement was done in Topas
Academic 4.1.27
For the determination of microstructural parameters the Fundamental
Parameter Approach was used; FWHM based LVol (volume weighted mean column
height) calculation to determine the intermediate crystallite size broadening modelled by a
Voigt function and FWHM based strain calculation for the strain broadening was used.
The morphological features and chemical purity were investigated by means of both
Scanning (Philips SEM XL30/EDS Dx4) and Field Emission Scanning Electron
Microscopy, FESEM (HITACHI SU-70) with energy dispersive X-ray Analysis. For that
purpose, the powder samples were dispersed on Cu holder and sputtered with Au (depth
layer 2nm). The particle substructure was analyzed on a 200kV JEOL-JEM-2100F
Transmission Electron Microscopy (TEM) coupled with energy dispersive X-ray Analysis
and STEM mode and equipped with ES 500W CCD camera with electromagnetic lens.
Primary particles were identified as individual particles having different contrasts and
contour features. Gatan Digital MicrographTM
software package was used for interpretation
of HRTEM images.
7
The infrared absorption spectra were recorded in the range of 4000-400 cm-1
on
Nickolet spectrophotometer (Model 380, Thermo Nickolet Corporation, Madison, USA).
Photoluminescence emission spectra and decay time measurements were performed on
spectroflurometer system which comprises optical parametric oscillator excitation source
(EKSPLA NT 342, emission range 210-2300 nm), Cryostat (Advance Research Systems
DE202-AE) equipped with Lakeshore model 331 controller, spectrograph FHR 1000
(Horiba Jobin-Yvon, 300 groove/mm grating) and ICCD detector (Horiba Jobin-Yvon
3771).
Results and discussion
X-ray diffraction patterns of as-prepared Y1.89Yb0.1Er0.01O3 (asp) and powders
annealed at 1100oC for a different time are presented in Fig. 1a. All samples have a cubic
bixbyte crystal structure, space group Ia-3. Reflections of thermally treated samples have
much narrower peaks, suggesting the increase in the particle crystallinity with annealing
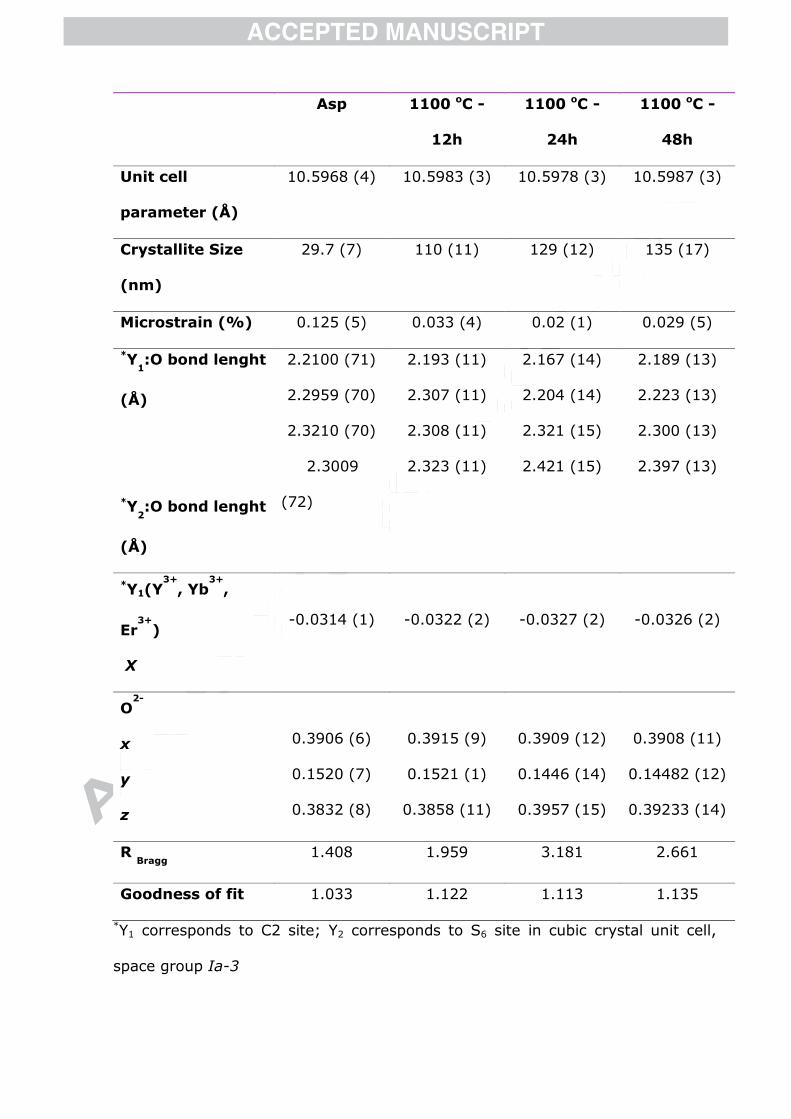
time. Detailed microstructural analysis performed through Rietveld refinement (Table 1,
Fig.1b) revealed small changes in the crystal cell parameters due to the Yb3+
and Er3+
incorporation. As it is well known, the cubic bixbyte-structure of pure Y2O3 (PDF 89-5591)
is characterized with the unit cell parameter of 10.60 Å and coexistence of two
nonequivalent crystallographic sites for Y3+
ions: non-centrosymmetric C2 at the 24d site
and centrosymmetric S6 (C3i) at the 8a site.28
Since both dopants used here have smaller
ionic radii in comparison to Y3+
(Y3+
: 0.104 Å, Yb3+
:0.100 Å, Er3+
: 0.103 Å) slight
decrease of the lattice parameter is detected in all samples, Table 1. Selective refinement of
8
the C2 and S6 sites occupation with Y3+
implies that substitution of Y3+
with Yb3+
and Er3+
ions is more pronounced in the position C2 than in S6 position, i.e. values of 0.9367 for C2
occupation and of 0.9510 for S6 site are obtained (value of 1 corresponds to full site
occupation with Y3+
). In accordance to it, the stoichiometry of as-prepared powder is
Y1.8877Yb0.1Er0.01O3 which correlates well with the targeted one (Y1.89Yb0.1Er0.01O3). All
powders revealed nanocrystalline particles structure. Average crystallite size of 30 nm is
founded in as-prepared sample, while this value increases up to 135 nm in sample annealed
for 48h. Elongation of the heating time also reduces significantly the microstrain in the
particles.
Typical morphology of the particles obtained through spray pyrolysis is presented on
Fig. 2. Spherical, un-agglomerated particles with the mean particle size of approx 450nm
are visible in the as-prepared powder, Fig. 1a. The influence of prolonged thermal treatment
is recognized through the increase of the particle roughness provoked by the crystal growth.
As it is shown by XRD analysis the size of the primary crystallites is increased from 30 to
130 nm with heating emphasizing the fact that secondary spherical particles are composed
form much smaller nanosized grains. Although the majority of the particles retain their
spherical morphology, agglomeration of secondary submicronic particles is also noticeable
with annealing time increasing. Consequently, “necks” formation among them due to the
sintering process is sporadically found in the sample which is thermally treated for 48 h,
Fig. 2d.
FESEM micrographs are presented at Fig. 3 for as-prepared and thermally treated
powder samples. The obtained results confirmed SEM observations and the presence of
9
polydispersed spherical particles, sizing below 500nm. The sponge-like particle
morphology is prevailing for the as-prepared powders, as seen at magnification 70000x.
The prolonged heating leads to the better differentiation of primary particles as a result of
their thermally induced growth and aggregation. The typical particle morphology after
thermal treatment at 1100˚C/24h is presented at Fig.3c, showing the blueberry-like
structure of secondary particles representing an assembly of nanosized (< 50 nm) primary
particles. The primary particles are predominantly spherical in shape, colliding to the weak
aggregates, as evident from the Fig.3d.
Based on the elemental analysis (Fig 4a) it is evident the presence of the following
elements: Y (Kα line at 14.9334 and Lα at 1.9226 keV), Er (Lα 6.9488, Mα 1.4057keV),
Yb (Lα 7.4157, Mα 1.5215 keV). The low energy peaks belong to the O (Kα 0.5249) and
probably to the C Kα line at 0.277 keV. Cu (Kα 8.040 and Lα 0.930 keV) and Au (Mα 2.12
keV, not signed) peaks belong either to the holder or to the sputtering layer. The elements
distribution is highly homogeneous as followed by the energy dispersive x-Ray analysis of
the selected rectangular area inside a particle sizing approx. 800nm (Fig.4b).
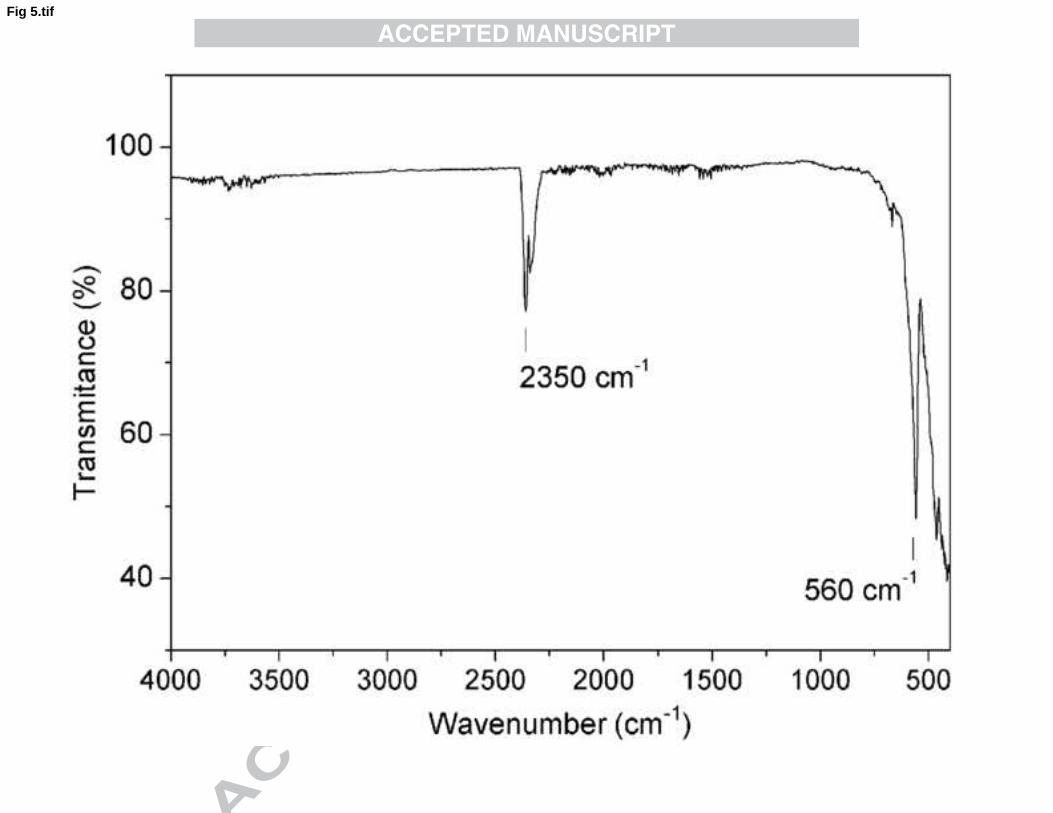
Since the luminescent efficiency of phosphors depends in a great measure of
particles purity, Fourier transform infrared emission spectroscopy (FT-IR) is also
performed. As shown, FT-IR spectra (Fig.5) shows sharp peak at 560 cm-1
from Y-O bond
vibration29
and more important, no presence of residual –OH groups which may quench
emission. Peak at 2350 cm-1
, Fig5, is due to physically adsorbed CO2 at the sample surface
as a consequence of the measurement environment.
10
Figure 6a represents the low magnification bright field TEM image of the approx
600nm in size secondary particle with the corresponding selected area electron diffraction
(SAED) patterns indexed according to the Ia3 phase (Fig.6 b,c). The crystallized area
appears as the dark field. It is evident the particle composite structure and the presence of
primary nanoparticles associated with nanoporosity, the former aroused through the
collision/coalescence mechanisms during spray pyrolysis.30
The SAED patterns of the
particle inner and at the edge domains imply the particles polycrystalline structure having
high defect content. The cubic symmetry, implied by SAED, indicates the interplannar
spacings of 0.189 and 0.262nm corresponding to the 440 and 400 planes, respectively, of a
Y1.88Yb0.12O3 compound (JCPDF 87-2368).
Further magnification and contrast analysis of the TEM image in bright field mode of
a secondary particle from Fig.6, reveal small subspheric primary nanoparticles sizing below
20nm, presented at Fig. 7a. The contrast at the external edge of the secondary particle
suggests the presence of approximately 20nm thick crust at the particle surface. HRTEM
analysis (Fig.7b) shows the presence of well crystallized periodical structures implying the
primary particles are with crystalline structure. FFT (Fast Fourier Transform) analysis
(Fig.7c) reveals the interplanar spacings corresponding to the x-ray value for (222) and 200
planes, respectively, of cubic, Ia-3 phase (file card JCPDF 87-2368, compound type
Y1.88Yb0.12O3 ) as well as to the structure explained by ICSD 84132, the latter used for the
XRD structure refinement. This implies a very good agreement of the structural data
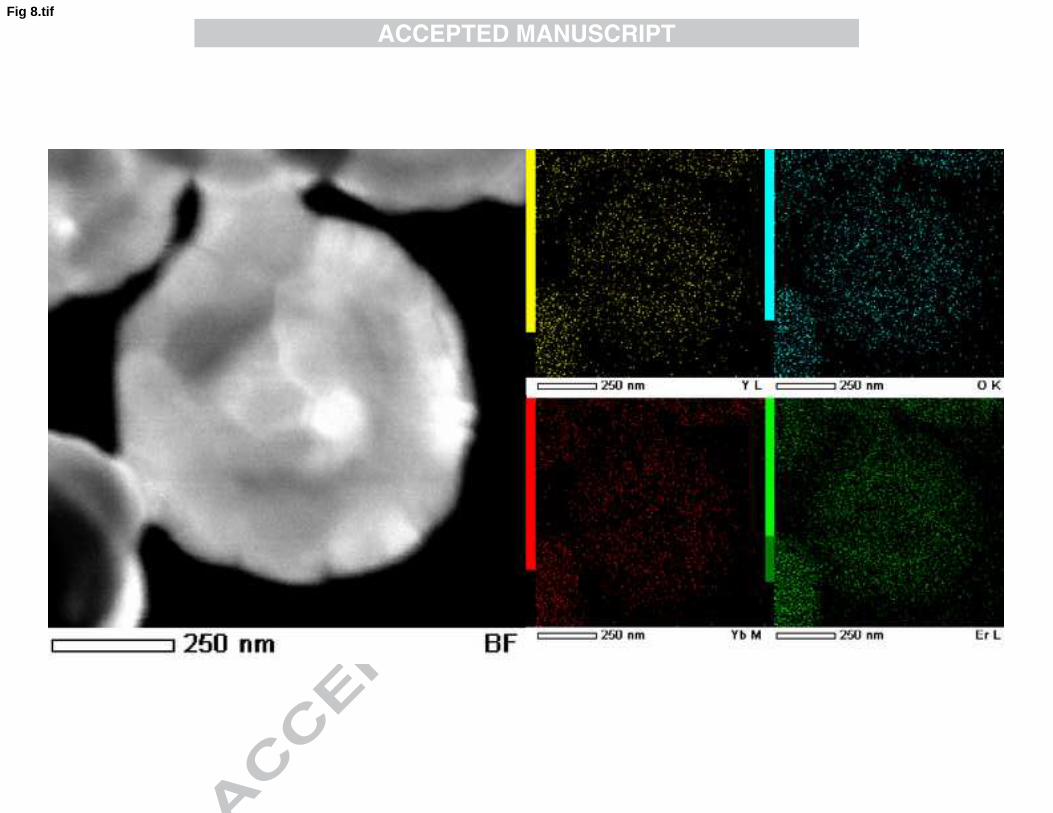
obtained by XRD and TEM analyses. STEM and energy dispersive X-ray analysis
additionally confirmed homogeneous elemental distribution and exclusively presence of
yttrium, ytterbium and erbium (Fig. 8)

11
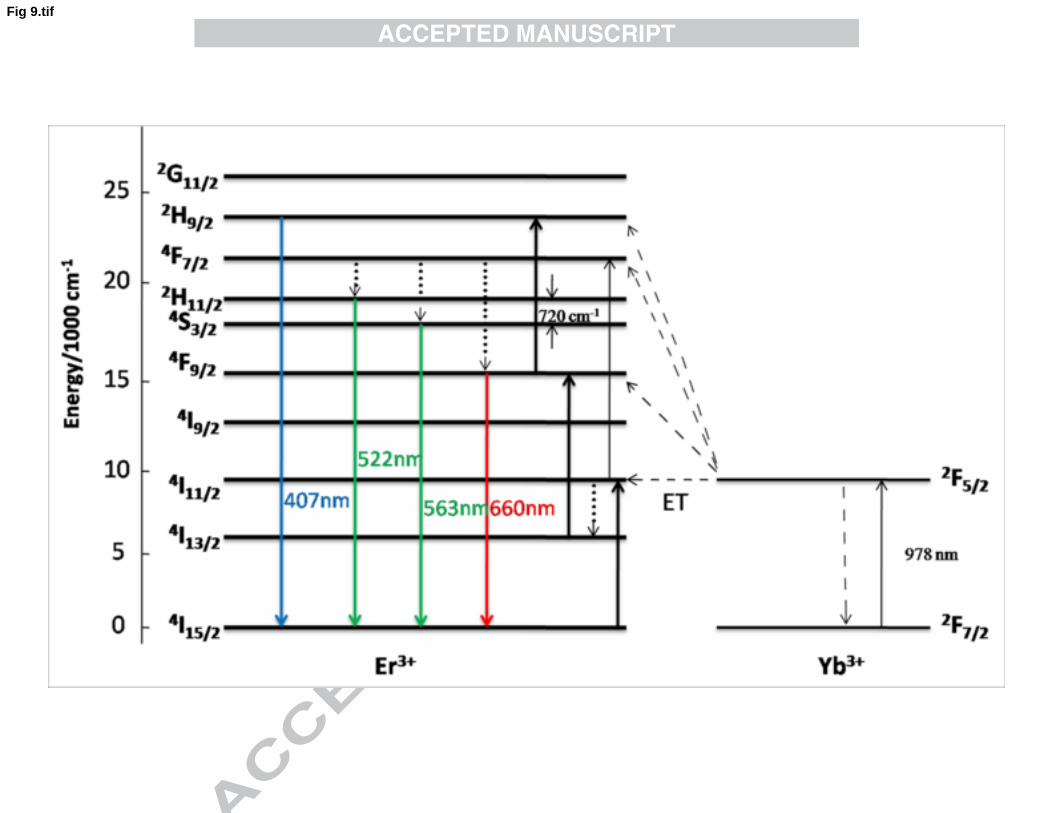
Up-conversion mechanism in Yb3+
-Er3+
co-doped systems may result from different
processes, such as energy transfer up-conversion (ET), excited state absorption (ESA) and
addition of photons by energy transfer (APTE).17
Schematic diagram of this process is
presented in Fig. 9. The energy transfer from excited Yb3+
ions promote the state of Er3+
from the 4I15/2 to the
4I11/2 and from
4I11/2 to the
4F7/2 by excited state absorption. After non-
radiative decay to lower energy states (2H11/2,
4S3/2 and
4F9/2) electrons radiatively de-excite
to the ground state giving green and red up-conversion emissions. In the case of blue up-
conversion emission, electrons from the 4I11/2 level non-radiatively de-excite to
4I13/2 and
then they are promoted to 4F9/2 and
2H9/2 by excited state absorption. Blue up-conversion
emission is then realized by the radiative de-excitation from 2H9/2 level.
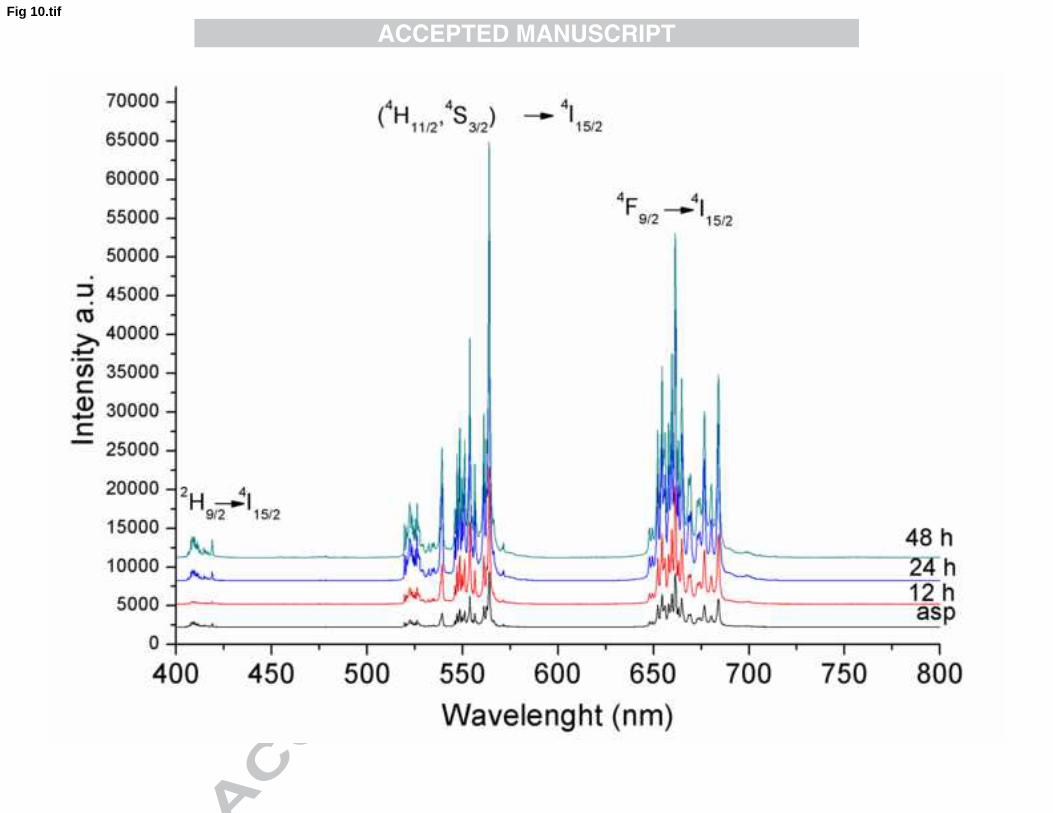
The up-conversion luminescence spectra for as prepared and annealed samples of
Y1.89Yb0.1Er0.01O3 excited at 978 nm shows blue, green and red luminescence around
407 nm, 563 nm and 660 nm, respectively, Fig. 10. Emission peaks are assigned to the
following trivalent erbium f-f electronic transitions: 2H9/2→
4I15/2 (blue: 407-420 nm, three
photon process), (2H11/2,
4S3/2) →
4I15/2 (green: 510-590 nm, two photon process), and
4F9/2→
4I15/2 (red: 640-720 nm, two photon process).
31 Since the yttrium oxide structure has
two crystallographic six-coordinated sites that could give different Stark splitting of Er3+
4f
levels, following transitions are assumed: the S6 lattice with a higher symmetry generates
the smallest crystal field so the Er3+
ions on this sites experience the smallest Stark splitting
(480 cm-1
) compared to 720 cm-1
on the other Er3+
(C2) site. For Er3+
ions accommodated at
C2 site, the f–f transitions are partially allowed by forced electric-dipole transition due to
the odd parity terms in the crystal field. On the other hand, for ions situated in the S6 sites

12
of inversion symmetry, only weak magnetic-dipole induced transitions are possible.
Therefore, the 4f spectra presented in Fig. 10 exhibit electric dipole transitions from the
Er3+
ions residing in the C2 sites and magnetic dipole transitions from both sites. The
emission bands mostly correspond to Er3+
on C2 site whose occupation is more pronounced
as it was shown by XRD structural refinement. Increase of the emission intensity with the
elongation of heat treatment is observed indicating the improvement of UC efficiency with
the rise of the powders crystallinity and the ordering of the crystal lattice. The intensity of
the green up-conversion is the most prominent in all samples.
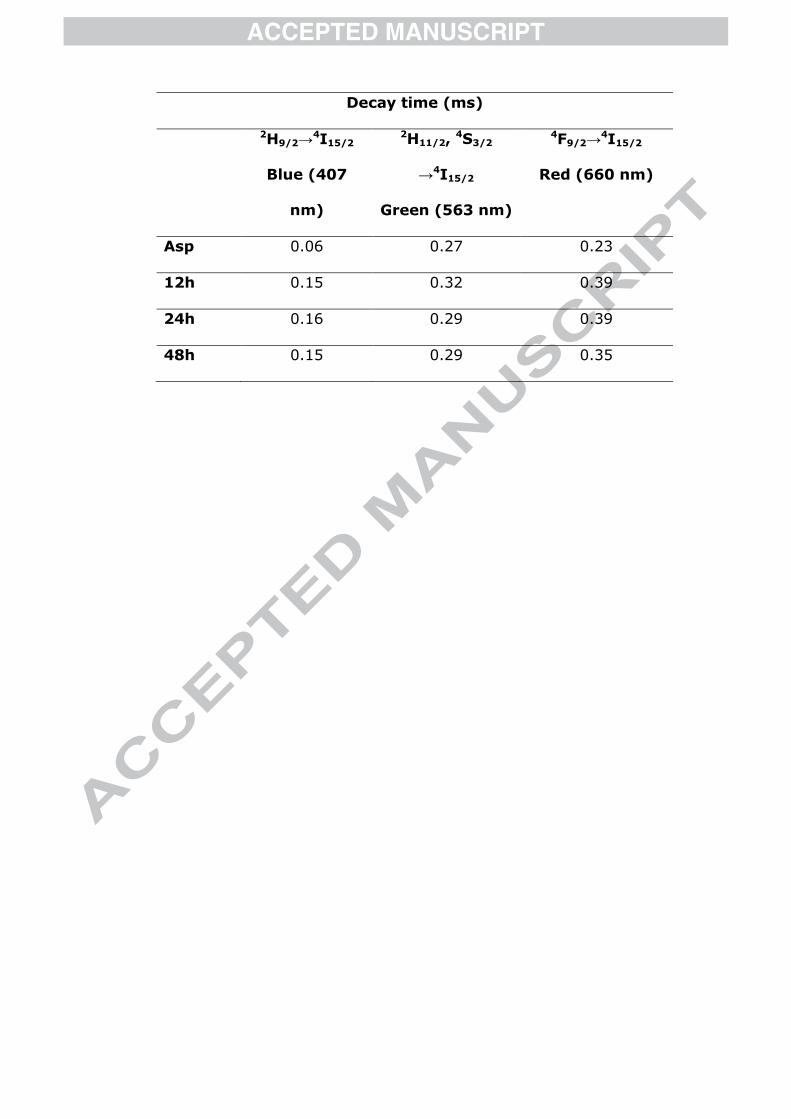
The emission decay times of Y1.89Yb0.1Er0.01O3 powders were measured following
excitation at 978 nm, and results are given in Table 2. The lowest value of decay time is
detected in as-prepared sample because the process parameters (short residence time and
high temperature gradient in the reaction zone) favor the formation of defects and retention
of microstrains in particles influencing further the luminescent efficiency. With the change
of the annealing time, the decay time value of blue emission (407 nm) stay constant, while
green (563 nm) and red (660 nm) decay times significantly increase. Red emission decay
time prevalence is confirmed in all heat treated samples. The highest value is measured in
powder annealed for 12h. Slight decreases of the decay time with the further prolongation
of powders heat treatment is probably related to the observed morphological changes, i.e.
agglomeration of particles and appearance of interparticles sintering. The presence of
strong green component in spectra indicates very weak ion-pair energy transfer process,
implying homogenous distribution of rare-earth ion dopants in the nanocrystalline host
matrix.31
Since it is known that the up-conversion efficiency is mainly influenced by the
13
non-radiative relaxation in material,32
a quite long emission achieved implicates very good
up-conversion efficiency of nanocrystalline Y1.89Yb0.1Er0.01O3 powders obtained through
spray pyrolysis. The magnitude of up-conversion enhancement achieved in nanocrystalline
Y1.89Yb0.1Er0.01O3 powder obtained through spray pyrolysis is about ten times in
comparison to the reported values for nanocrystals with the same composition obtained
through combustion synthesis (4S3/2 →
4I15/2 : 0.011 ms;
4F9/2→
4I15/2: 0.021 ms), and for ~
30% higher than in bulk (4S3/2 →
4I15/2 : 0.25 ms;
4F9/2→
4I15/2: 0.28 ms).
33
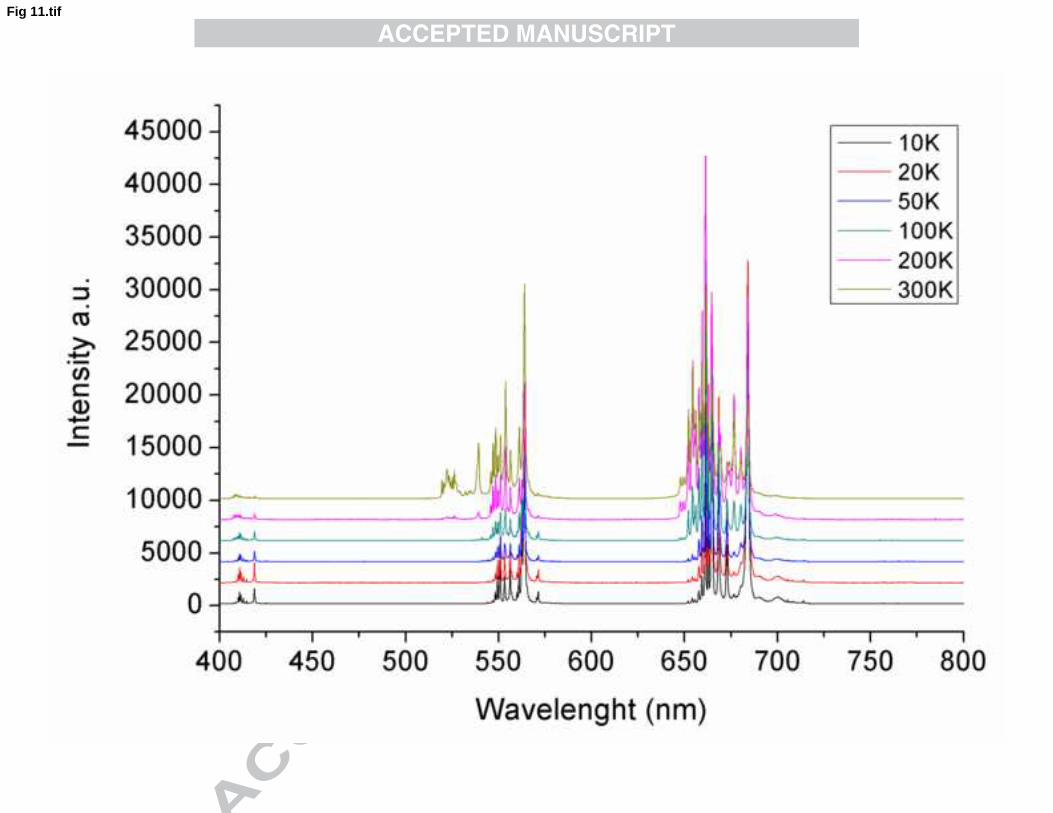
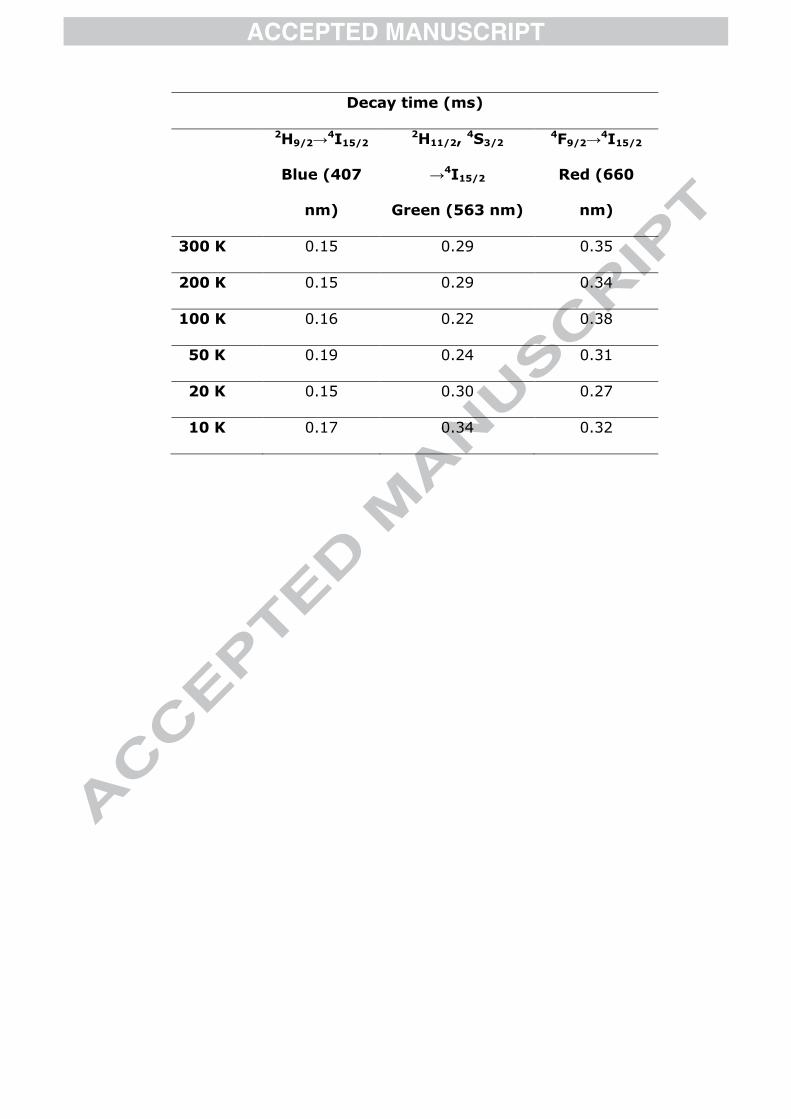
The temperature dependant up-conversion emission of nanocrystalline
Y1.89Yb0.1Er0.01O3 powder thermally treated 48h is presented on Fig. 11, while
corresponding decay times are given in the Table 3.The presented results show that
synthesized powders exhibit the temperature dependant up-conversion emission. Blue
emission has the strongest intensity at 10 K. Up to 200 K the red emission intensities are
stronger than green ones while afterwards green emission intensity is the strongest one. The
temperature dependence of the 2H11/2→
4I15/2 green emission could be also followed at the
temperatures higher than 100 K, when its increasing trend is detected. This feature can be
explained by the existence of thermalization process between 4S3/2 and
2H11/2 levels,
separated by an energy gap of about 720 cm-1
, Fig. 9. When two energy levels of the rare
earth activator are closely separated by a difference of approximately 1000 cm-1
, the upper
level will not emit the energy at low temperatures due to the high multi-phonon relaxation
that quenches it. With the increasing the temperature, the upper level becomes more
populated and therefore the emission from this level gradually increases at the expense of
the lower level population.34
In this temperature range the emission bands do not shift in

14
magnitude or direction indicating further that the crystal field splitting occurs on both the
C2 and S6 sites.
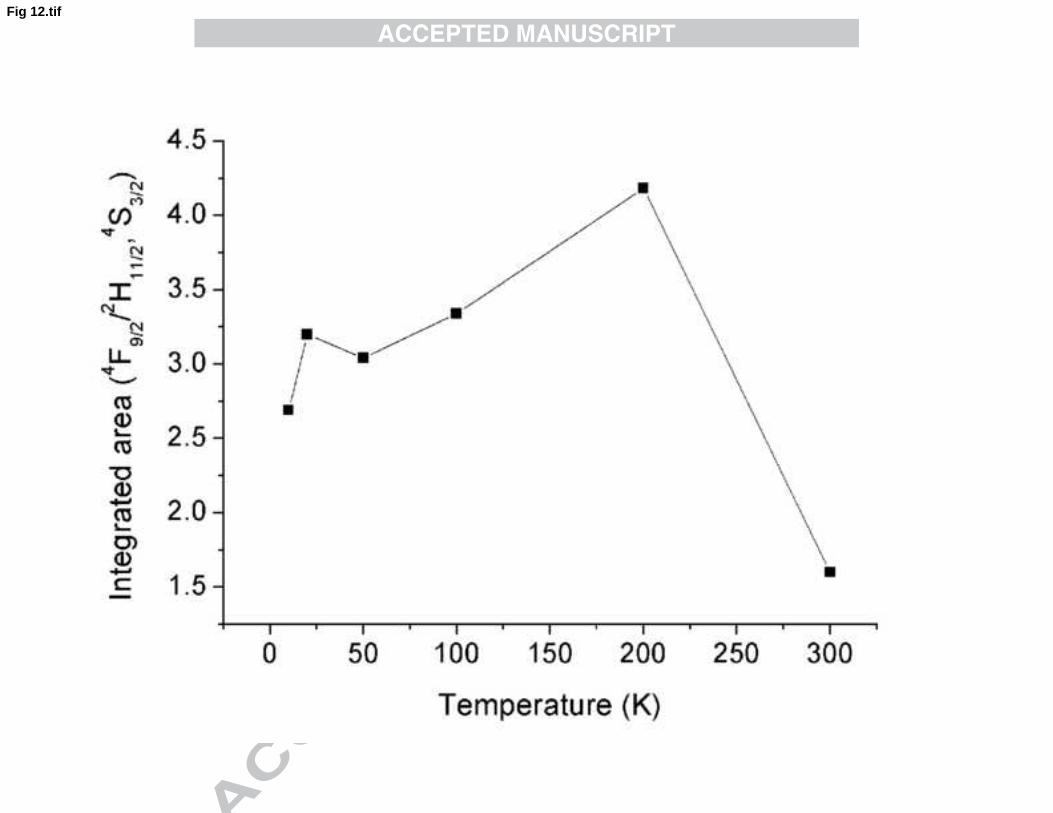
Calculated values of ratio between integrated areas of red (640-720 nm) and green
(510-590 nm) emission (R/G) vs. temperature are presented in Fig.12. It is clearly evident
that at temperatures over 200 K green emission becomes much stronger, but the red
emission is still dominant. Observed enhancement of green emission additionally proves
that the mechanisms connected with the green up-conversion are temperature dependent.
Conclusion
It has been demonstrated that ultrasonic aerosol processing may provide spherical,
non-agglomerated, approx 450nm in size Y1.89Yb0.1Er0.01O3 particles with advanced optical
properties due to its capability for size and morphology control during synthesis process.
This method also suppresses compositional segregation at the droplet level, and therefore
more uniform distribution of dopants is achieved. Additional thermal treatment of powders
improves further up-conversion efficiency, confirmed by increase of the emission decay
times. Observed superior emission decay times are consequence of achieved materials
purity and homogeneous doping, and also consequence of modification of a refractive
index in effective medium due to the particle nanocrystalline nature.
15
Acknowledgements
This research is financially supported through the Project #172035 of the Ministry of
Science and Education of the Republic of Serbia. OM especially acknowledge the
University Carlos III, Madrid, Spain-Santander Bank Chairs of Excellence program and
JSPS 2011/2012 fellowship, Japan.
References
[1] T. Li, S. Liu, H. Zhang, E. Wang, L. Song, P. Wang, Ultraviolet upconversion
luminescence in Y2O3:Yb3+
, Tm3+
nanocrystals and its application in photocatalysis, J.
Mater. Sci. 46 (2011) 2882–2886
[2] A.M. Pires, S. Heer, H.U. Güdel, O.A. Serra, Er, Yb Doped Yttrium Based Nanosized
Phosphors: Particle Size, “Host Lattice” and Doping Ion Concentration Effects on
Upconversion Efficiency, J. Fluoresc. 16 (2006) 461–468
[3] M. Xing, W. Cao, H. Zhong, Y. Zhang, X. Luo, Y. Fu, W. Feng, T. Pang, X. Yang,
Synthesis and upconversion luminescence properties of monodisperse Y2O3:Yb, Ho
spherical particles. J. Alloys Compd, 509 (2011) 5725–5730
[4] Z. Yang, Z. Feng, Z. Jiang, Upconversion emission in multi-doped glasses for full
colour display, J. Phys. D Appl. Phys. 38 (2005) 1629–1632
[5] C. Li, B. Dong, C. Ming, M. Lei, Application to Temperature Sensor Based on Green
Up-conversion of Er3+
Doped Silicate Glass, Sensors 7 (2007) 2652–2659
[6] J. Silver, M.I. Martinez-Rubio, T.G. Ireland, G.R. Fern, R. Withnall, The Effect of
Particle Morphology and Crystallite Size on the Upconversion Luminescence
Properties of Erbium and Ytterbium Co-doped Yttrium Oxide Phosphors, J. Phys.
Chem. B 105 (2001) 948–953
[7] H. Guo, N. Dong, M. Yin, W. Zhang, L. Lou, S. Xia, Visible Upconversion in Rare
Earth Ion-Doped Gd2O3 Nanocrystals, J. Phys. Chem. B 108 (2004) 19205–19209.
[8] A. Martínez, J. Morales, L.A. Díaz-Torres, P. Salas, E. De La Rosa, J. Oliva, H.
Desirena, Green and red upconverted emission of hydrothermal synthesized Y2O3:
Er3+
–Yb3+
nanophosphors using different solvent ratio conditions. Mater. Sci. Eng. B
174 (2010) 164–168
[9] A.Og. Dikovska, P.A. Atanasov, I.G. Dimitrov, C. Vasilev, T. Kocourek, M. Jelinek,
Structural and optical properties of Er, Yb co-doped Y2O3 thin films, Appl. Surf. Sci.
252 (2006) 4569–4572
[10] G. Tian, Z. Gu, X. Liu, L. Zhou, W. Yin, L. Yan, S. Jin, W. Ren, G. Xing, S. Li, Y.
Zhao, Facile fabrication of Rare-Earth-Doped Gd2O3 Hollow Spheres with
Upconversion Luminescence, Magnetic Resonance, and Drug Delivery Properties, J.
Phys. Chem. C 115 (2011) 23790–23796
16
[11] O. Meza, L.A. Diaz-Torres, P. Salas, E. De La Rosa, D. Solis, Color tunability of the
upconversion emission in Er–Yb doped the wide band gap nanophosphors ZrO2 and
Y2O3. Mater. Sci. Eng. B 174 (2010) 177–181
[12] B.S. Cao, Y.Y. He, Z.Q. Feng, M. Song, B. Dong, Crystalline-structure-dependent
green and red upconversion emissions of Er3+
–Yb3+
–Li+ codoped TiO2, Opt. Commun.
284 (2011) 3311–3314
[13] J.A. Capobianco, F. Vetrone, J.C. Boyer, A. Speghini, M. Bettinelli, Visible
upconversion of Er3+
doped nanocrystalline and bulk Lu2O3, Opt. Mater. 19 (2002)
259–268
[14] S. Lu, Q. Yang, B. Zhang, H. Zhang Upconversion and infrared luminescences in
Er3+
/Yb3+
codoped Y2O3 and (Y0.9La0.1)2O3 transparent ceramics, Opt. Mater. 33
(2011) 746–749
[15] K.A. Gschneidner Handbook on the Physics and Chemistry of Rare Earths 37 Optical
spectroscopy, first edition, North-Holland Publ. Co., Amsterdam, 2007
[16] T.K. Anh, L.Q. Minh, N. Vu, T.T. Huong, N.T. Huong, C. Barthou, W. Strek,
Nanomaterials containing rare-earth ions Tb, Eu, Er and Yb: preparation, optical
properties and application potential, J. Lumin. 102-103 (2003) 391–394
[17] G. De, W. Qin, J. Zhang, J. Zhang, Y. Wang, C. Cao, Y. Cui, Upconversion
luminescence properties of Y2O3:Yb3+
, Er3+
nanostructures, J. Lumin. 119-120 (2006)
258–263
[18] Y.Q. Sheng, J. Liu, L.L. Xu, D. Zhai, Z.G. Zhang, W.W. Cao, Effect of Eu3+
codoping
on upconversion luminescence in Y2O3:Er3+
, Yb3+
nanocrystals, Solid State Commun.
150 (2010) 1048–1051
[19] Y. Li, Y. Zhang, G. Hong, Y. Yu, Upconversion luminescence of Y2O3:Er3+
, Yb3+
nanoparticles prepared by a homogeneous precipitation method, J. Rare Earths 26
(2008) 450–454
[20] C. Tan, Y. Liu, Y. Han, W. Li, Influence of carbon templates and Yb3+ concentration
on red and green luminescence of uniform Y2O3:Yb/Er hollow microspheres, J.
Lumin. 131 (2011) 1198–1202
[21] H. Guo, Y.M. Qiao, Preparation, characterization, and strong upconversion of
monodisperse Y2O3:Er3+
,Yb3+
microspheres, Opt. Mater. 31 (2009) 583–589
[22] O. Milosevic, L. Mancic, M.E. Rabanal, L.S. Gomez, K. Marinkovic, Aerosol route in
processing of nanostructured functional materials, Kona Powder Part. J. 27 (2009) 84–
106
[23] K. Marinkovic, L. Mancic, L.S. Gomez, M.E. Rabanal, Dramicanin M, Milosevic O.
Photoluminescent properties of nanostructured Y2O3:Eu3+
powders obtained through
aerosol synthesis, Opt. Mater. 32 (2010) 1606–1611
[24] O. Milosevic, L. Mancic, M.E. Rabanal, J.M. Torralba, B. Yang, P. Townsend,
Structural and Luminescence Properties of Gd2O3:Eu3+
and Y3Al5O12:Ce3+
Phosphor
Particles Synthesized via Aerosol, J. Electrochem. Soc. 152 (2005) G707-G713
[25] Y. Wang, O. Milosevic, L. Gomez, M.E. Rabanal, J.M. Torralba, B. Yang, P.D.
Townsend, Thermoluminescence responses from europium doped gadolinium oxide, J.
Phys. Condens. Matter 18 (2006) 9257–9272
17
[26] V. Lojpur, M. Nikolic, L. Mancic, O. Milosevic, M.D. Dramicanin, Y2O3:Yb,Tm and
Y2O3:Yb,Ho powders for low-temperature thermometry based on up-conversion
fluorescence, Ceram. Int. 39 (2013) 1129–1134
[27] A.A. Coelho, Indexing of powder diffraction patterns by iterative use of singular value
decomposition, J. Appl. Crystallogr. 36 (2003) 86–95
[28] J. Silver, M.I. Martinez-Rubio, T.G. Ireland, G.R. Fern, R. Withnall, Yttrium Oxide
Upconverting Phosphors. Part 4: Upconversion Luminescent Emission from Thulium-
Doped Yttrium Oxide under 632.8-nm Light Excitation, J. Phys. Chem. B 107 (2003)
1548–1553
[29] G. Socrates, Infrared and Raman Characteristic Group Frequencies: Tables and charts,:
third ed., John Wiley & Sons, West Sussex, 2004
[30] M.I. Martín, L.S. Gómez, O. Milosevic, M.E. Rabanal, Nanostructured alumina
particles synthesized by the Spray Pyrolysis method: microstructural and
morphological analyses, Ceram. Int. 36 (2010) 767–772
[31] R.S. Meltzer, S.P. Feofilov, B. Tissue, H.B. Yuan Dependence of fluorescence
lifetimes of Y2O3:Eu3+
nanoparticles on the surrounding medium, Phys. Rev. B:
Condens. Matter 60 (1999) R14012–R14015
[32] X. Luo, W. Cao, Blue, green, red upconversion luminescence and optical
characteristics of rare earth doped rare earth oxide and oxysulfide, Sci. China Ser. B 50
(2007) 505–513
[33] F. Vetrone, J.-C. Boyer, J.A. Capobianco, A. Speghini, M. Bettinelli, Significance of
Yb3+
concentration on the upconversion mechanisms in codoped Y2O3:Er3+
, Yb3+
nanocrystals, J. App. Phys. 96 (2004) 661-667
[34] J. Silver, M.I. Martinez-Rubio, T.G. Ireland, R. Withnall, Yttrium Oxide Upconverting
Phosphors. Part 2: Temperature Dependent Upconversion Luminescence Properties of
Erbium in Yttrium Oxide, J. Phys. Chem. B 105 (2001) 7200–7204
18
Figure captions:
Fig 1. X-ray diffraction patterns of as-prepared Y1.89Yb0.1Er0.01O3 and powders
annealed at 1100oC for 12, 24 and 48h (a) and Rietveld refinement of sample annealed at
1100oC for 24h (b)
Fig. 2. SEM micrographs of as-prepared Y1.89Yb0.1Er0.01O3 (a) and powders annealed
at 1100 oC for 12 h (b), 24 h (c) and 48h (d)
Fig. 3. FESEM micrographs of the Y1.89Yb0.1Er0.01O3 powder: as-prepared (a,b) and
annealed at 1100 oC /24 h (c,d)
Fig.4. EDAX spectrum (a) and elements distribution inside a particle (b) for the
Y1.89Yb0.1Er0.01O3 powder system
Fig.5. FT-IR spectroscopy of nanocrystalline Y1.89Yb0.1Er0.01O3 powder annealed at
1100 oC for 24 h
Fig. 6. Bright field TEM image of the particle inner structure (a) and the
corresponding SAED patterns (b,c)
Fig.7. A magnified bright field image from Fig 6 (a) and the corresponding HRTEM
lattice image (b) with FFT (c)
Fig.8 STEM image and EDS mapping of Y1.89Yb0.1Er0.01O3 particles
Fig. 9 . Energy level diagrams of Yb3+
and Er3+
ions following excitation with 978 nm
19
Fig.10. Up-converted spectra of Er3+
ions in nanocrystalline Y1.89Yb0.1Er0.01O3
powder excited at 978 nm
Fig. 11. The temperature dependant up-conversion emission of nanocrystalline
Y1.89Yb0.1Er0.01O3 powder thermally treated at 1100 oC, 48h
Fig 12. Temperature dependence of the red to green emission integrated area ratio of
nanocrystalline Y1.89Yb0.1Er0.01O3 powder thermally treated 48h
20
Table captions:
Table 1. Refined structural parameters of nanocrystalline Y1.89Yb0.1Er0.01O3 powders
Table 2. Decay times of nanocrystalline Y1.89Yb0.1Er0.01O3 powder excited at 978 nm
Table 3. The temperature dependence of decay times in nanocrystalline
Y1.89Yb0.1Er0.01O3 powder thermally treated at 1100 oC, 48h
Asp 1100 oC -
12h
1100 oC -
24h
1100 oC -
48h
Unit cell
parameter (Å)
10.5968 (4) 10.5983 (3) 10.5978 (3) 10.5987 (3)
Crystallite Size
(nm)
29.7 (7) 110 (11) 129 (12) 135 (17)
Microstrain (%) 0.125 (5) 0.033 (4) 0.02 (1) 0.029 (5)
*Y1:O bond lenght
(Å)
*Y2:O bond lenght
(Å)
2.2100 (71)
2.2959 (70)
2.3210 (70)
2.3009
(72)
2.193 (11)
2.307 (11)
2.308 (11)
2.323 (11)
2.167 (14)
2.204 (14)
2.321 (15)
2.421 (15)
2.189 (13)
2.223 (13)
2.300 (13)
2.397 (13)
*Y1(Y3+
, Yb3+
,
Er3+
)
X
-0.0314 (1)
-0.0322 (2)
-0.0327 (2)
-0.0326 (2)
O2-
x
y
z
0.3906 (6)
0.1520 (7)
0.3832 (8)
0.3915 (9)
0.1521 (1)
0.3858 (11)
0.3909 (12)
0.1446 (14)
0.3957 (15)
0.3908 (11)
0.14482 (12)
0.39233 (14)
R Bragg
1.408 1.959 3.181 2.661
Goodness of fit 1.033 1.122 1.113 1.135
*Y1 corresponds to C2 site; Y2 corresponds to S6 site in cubic crystal unit cell,
space group Ia-3
Decay time (ms)
2H9/2→4I15/2
Blue (407
nm)
2H11/2, 4S3/2
→4I15/2
Green (563 nm)
4F9/2→4I15/2
Red (660 nm)
Asp 0.06 0.27 0.23
12h 0.15 0.32 0.39
24h 0.16 0.29 0.39
48h 0.15 0.29 0.35
Decay time (ms)
2H9/2→4I15/2
Blue (407
nm)
2H11/2, 4S3/2
→4I15/2
Green (563 nm)
4F9/2→4I15/2
Red (660
nm)
300 K 0.15 0.29 0.35
200 K 0.15 0.29 0.34
100 K 0.16 0.22 0.38
50 K 0.19 0.24 0.31
20 K 0.15 0.30 0.27
10 K 0.17 0.34 0.32
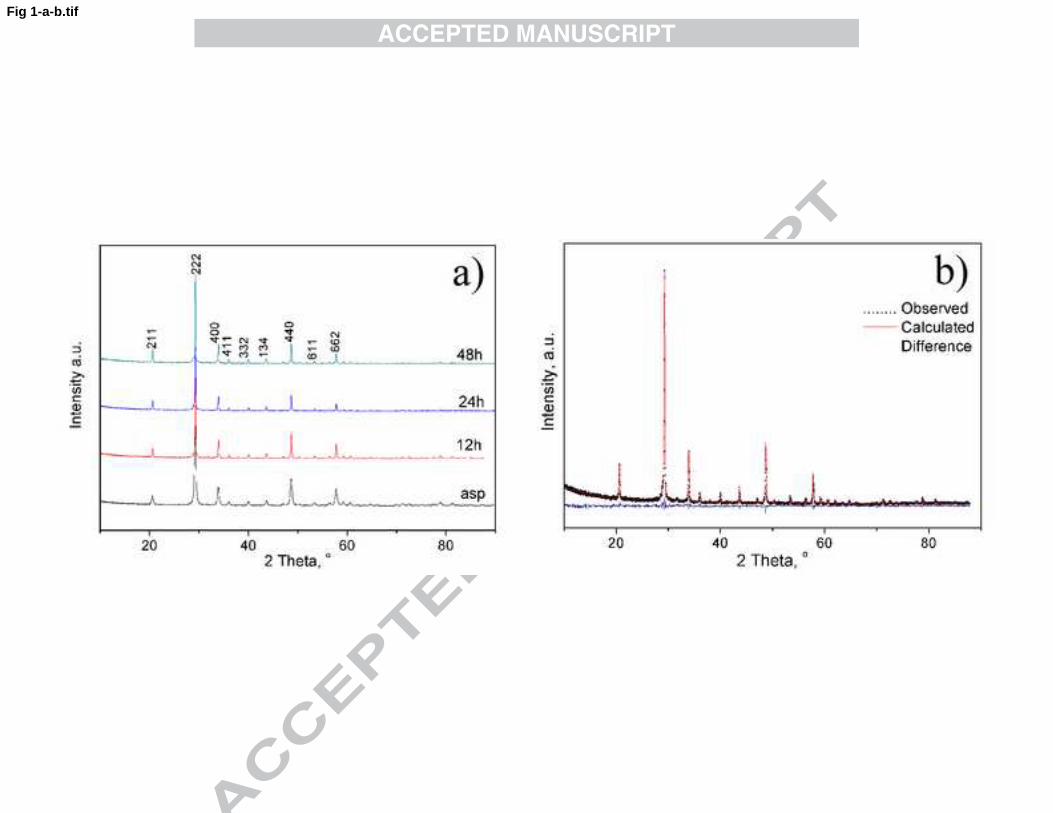
Fig 1-a-b.tif
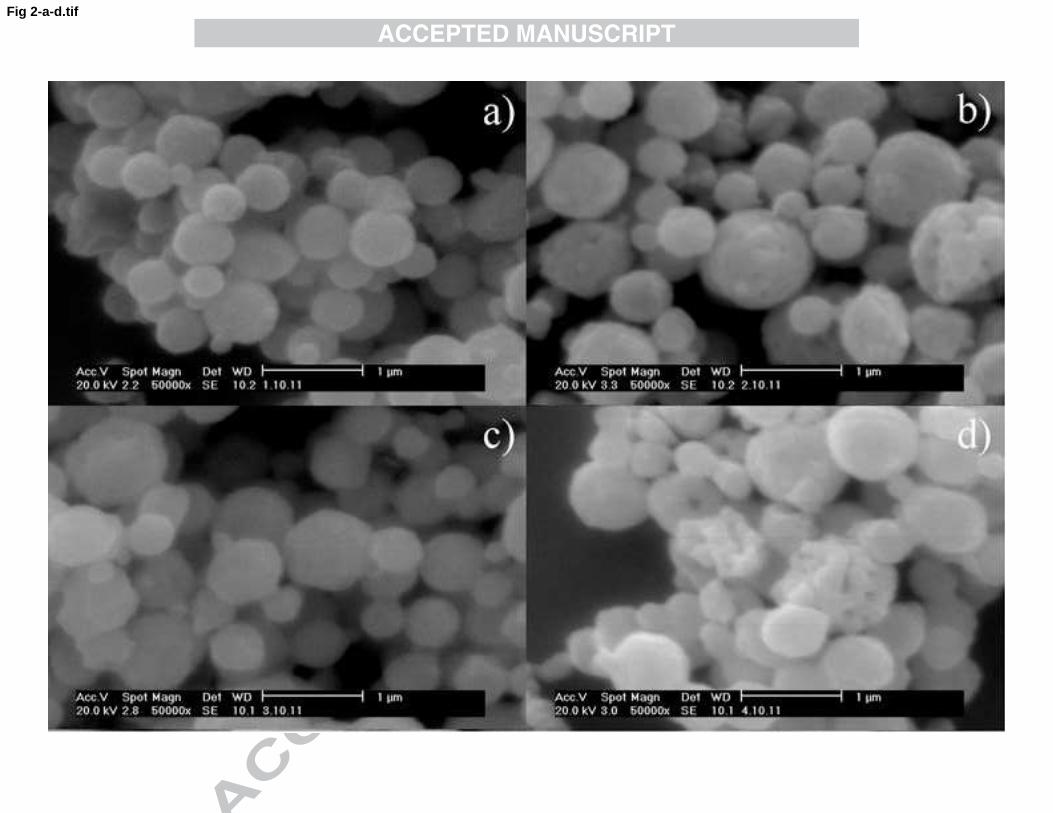
Fig 2-a-d.tif
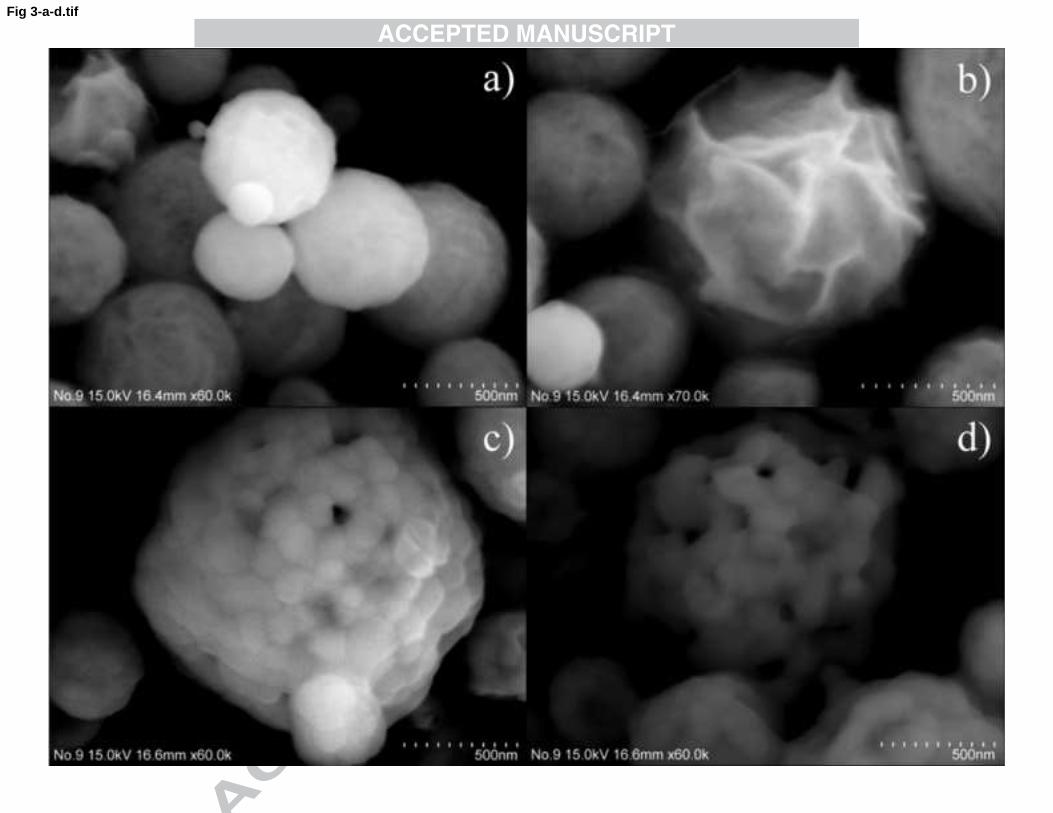
Fig 3-a-d.tif
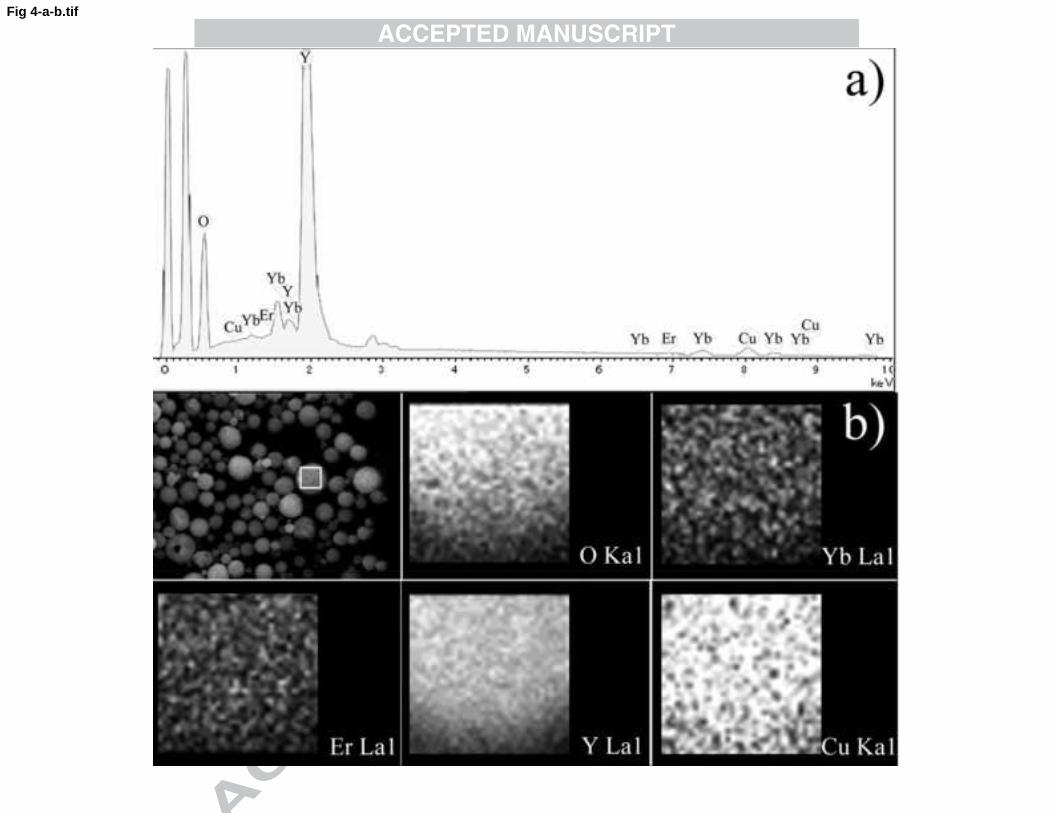
Fig 4-a-b.tif
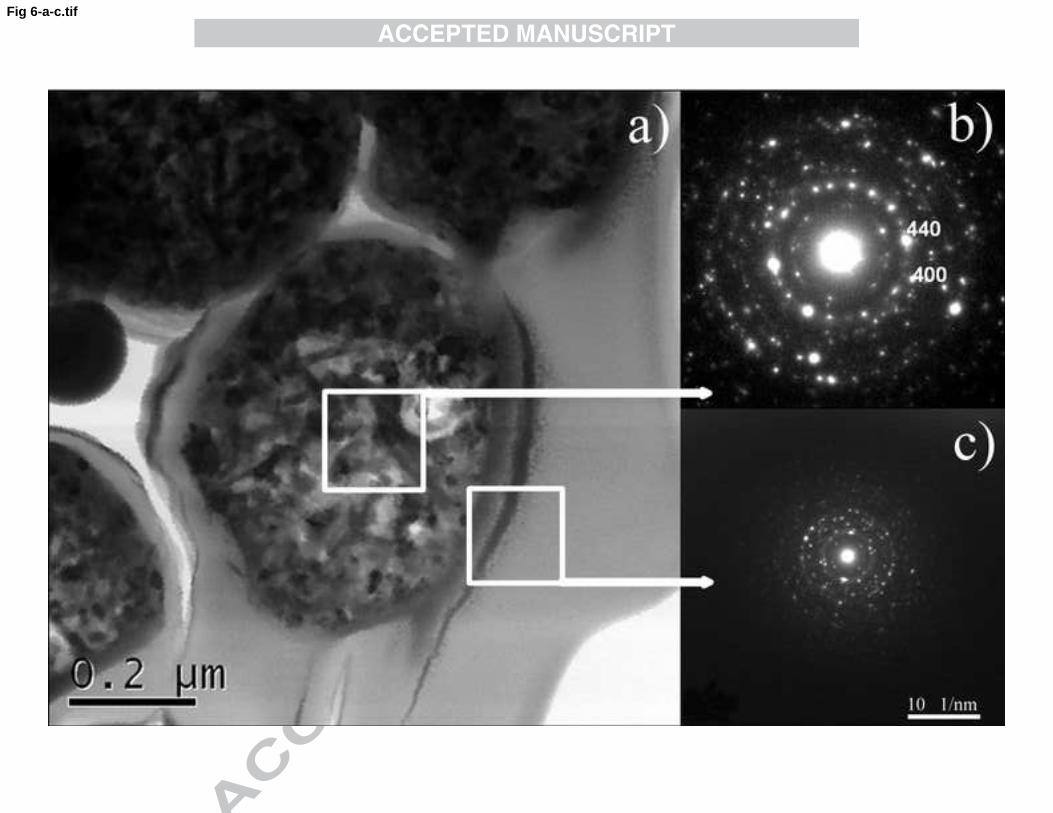
Fig 6-a-c.tif

Fig 7-a-c.tif

The Y1.89Yb0.1Er0.01O3 phosphor particles are sinthesized via aerosol route
We report influence of process parameters on the particle structure and morphology
Spherical, submicronic size and nano-crystalline particle morphology are confirmed
The particles show improved luminescence properties and decay time
Synthesized powders exhibit the temperature dependant up-conversion emission