
OPTICALLY STIMULATED LUMINESCENCE (OSL) RESPONSE OF Al2O3:C, BaFCl:Eu AND K2Ca2(SO4)3:Eu PHOSPHORS
8
A new high sensitivity Na 2 LiPO 4 :Eu OSL phosphor P. D. Sahare, * a Manveer Singh a and Pratik Kumar b A new high sensitivity Na 2 LiPO 4 :Eu optically stimulated luminescence dosimeter (OSLD) material was prepared by a simple solid-state diffusion method. The formation of the material was confirmed by comparing the experimental data with that available in the literature (JCPDF # 80-2110). The dosimetric properties of the phosphor material using a continuous wave-optically stimulated luminescence (CW- OSL) technique were studied. The material was studied for different concentrations of the impurity and also for different heating treatments. The material doped with 1.0 mol% and annealed at 873 K was found to be the most sensitive. The phosphor was found to have all the good dosimetric characteristics, such as tissue equivalence (low-Z, Z eff 10.8), high sensitivity (3 times less than the commercially available Al 2 O 3 :C, Landauer Inc., USA and BeO, Thermalox® 995, Materion Inc., USA), low fading (6.2% in 40 days), wide range of dose response (0.1–1.0 kGy), excellent reusability, easy optical bleaching (annealing) for its reuse, etc., which makes the material useful for dosimetry of high-energy radiations using OSL. The advantages of our OSLD phosphor are the easily available and inexpensive ingredients and a very simple method of preparation that makes it cost effective as compared to the commercially available OSLD phosphors. Also, it is easy to handle, unlike the Thermalox® 995 (BeO) dosimeters which are very toxic, and require a special method of preparation and handling. Introduction Optically stimulated luminescence (OSL) has established itself as an improved and more reliable technique for dosimetry of high-energy radiations. The technique is becoming more and more popular because of several advantages over thermolumi- nescence (TL) dosimetry, such as the completely optical nature of the instrumentation, possibility of online (in situ) measure- ments using optical ber, low power consuming LED sources for stimulation, facility of reestimation of radiation doses in case of any doubts and, over and above all, no structural changes 1 due to heating that lose its reusability, unlike in some TLD phosphor materials. 2–5 However, there is not much choice due to the paucity of commercially available OSL phosphors and the high fading in others. The OSL phosphors available are also costly due to their difficult methods of synthesis. For example, for producing Al 2 O 3 :C, 6,7 one needs to have a very high temperature vacuum furnace as the doping of carbon is not possible in an atmospheric environment; for producing another OSL phosphor, BeO, 8 special arrangements are needed for its production and handling as it is very toxic to human beings. The general requirement of a good OSL phosphor is that the emission should be between 350 and 425 nm (where most common detectors are most sensitive) and the defects (traps) should have a high photo-ionization cross-section in the blue- green region (450–550 nm) or IR region (650–800 nm). The sensitivity of an OSLD phosphor depends on the kind of defects, stimulation sources and availability of suitable lters and on the detector (generally a wide-band PMT). The tissue equivalent (low-Z) phosphors are much preferred due to their at energy response and their suitability to be used in a mixed radiation eld. Attempts are, therefore, going on to study new (preferably low-Z) materials for their applications as OSL phosphors, such as, LiMgPO 4 :Tb,B, 9 Na 2 SiF 6 :Cu,P, 10 Al 2 O 3 :B, 11 Y 3 Al 5 O 12 :C, 12 Cu- doped quartz (SiO 2 :Cu), 13 LiAlO 2 , 14 MgO:Tb, 15 NaMgF 3 :Eu, 16 etc. However, all these phosphors are at the developmental level and the issues related to their sensitivity and fading need to be addressed before they are nally accepted as OSLD phosphors. More details and a comparative study can be seen in some recent review papers. 17–19 In the present paper we report optically stimulated lumi- nescence (OSL) and thermoluminescence (TL) studies of a new high sensitivity low-Z Na 2 LiPO 4 :Eu phosphor for its application for OSL dosimetry. Na 2 LiPO 4 :Eu is really a multifunctional advanced ceramic as it has already been proved to be a red phosphor for solid-state lighting and display applications 20 and a high-sensitivity TLD phosphor for dosimetry applications. 21 It was intuitive to study this material for its application as an OSL phosphor and it proved to be satisfying. The phosphor Na 2 LiPO 4 :Eu is found to have several ‘good’ characteristics, such as low-Z material, very easy method of preparation, nontoxic in nature, highly sensitive, linear OSL dose response over a wide range, low fading, excellent reusability, emission a Department of Physics & Astrophysics, University of Delhi, Delhi–110 007, India. E-mail: [email protected]; [email protected]; Fax: +91-11-2766-7061; Tel: +91-11-2766-7793 b Medical Physics Unit, BRAIRCH, AIIMS, Ansari Nagar, New Delhi–110 029, India Cite this: RSC Adv. , 2015, 5, 3474 Received 4th October 2014 Accepted 26th November 2014 DOI: 10.1039/c4ra11779d www.rsc.org/advances 3474 | RSC Adv., 2015, 5, 3474–3481 This journal is © The Royal Society of Chemistry 2015 RSC Advances PAPER
Transcript of OPTICALLY STIMULATED LUMINESCENCE (OSL) RESPONSE OF Al2O3:C, BaFCl:Eu AND K2Ca2(SO4)3:Eu PHOSPHORS
RSC Advances
PAPER
A new high sensi
aDepartment of Physics & Astrophysics, Un
E-mail: [email protected]; pdsaha
Tel: +91-11-2766-7793bMedical Physics Unit, BRAIRCH, AIIMS, An
Cite this: RSC Adv., 2015, 5, 3474
Received 4th October 2014Accepted 26th November 2014
DOI: 10.1039/c4ra11779d
www.rsc.org/advances
3474 | RSC Adv., 2015, 5, 3474–3481
tivity Na2LiPO4:Eu OSL phosphor
P. D. Sahare,*a Manveer Singha and Pratik Kumarb
A new high sensitivity Na2LiPO4:Eu optically stimulated luminescence dosimeter (OSLD) material was
prepared by a simple solid-state diffusion method. The formation of the material was confirmed by
comparing the experimental data with that available in the literature (JCPDF # 80-2110). The dosimetric
properties of the phosphor material using a continuous wave-optically stimulated luminescence (CW-
OSL) technique were studied. The material was studied for different concentrations of the impurity and
also for different heating treatments. The material doped with 1.0 mol% and annealed at 873 K was
found to be the most sensitive. The phosphor was found to have all the good dosimetric characteristics,
such as tissue equivalence (low-Z, Zeff � 10.8), high sensitivity (�3 times less than the commercially
available Al2O3:C, Landauer Inc., USA and BeO, Thermalox® 995, Materion Inc., USA), low fading (�6.2%
in 40 days), wide range of dose response (0.1–1.0 kGy), excellent reusability, easy optical bleaching
(annealing) for its reuse, etc., which makes the material useful for dosimetry of high-energy radiations
using OSL. The advantages of our OSLD phosphor are the easily available and inexpensive ingredients
and a very simple method of preparation that makes it cost effective as compared to the commercially
available OSLD phosphors. Also, it is easy to handle, unlike the Thermalox® 995 (BeO) dosimeters which
are very toxic, and require a special method of preparation and handling.
Introduction
Optically stimulated luminescence (OSL) has established itselfas an improved and more reliable technique for dosimetry ofhigh-energy radiations. The technique is becoming more andmore popular because of several advantages over thermolumi-nescence (TL) dosimetry, such as the completely optical natureof the instrumentation, possibility of online (in situ) measure-ments using optical ber, low power consuming LED sourcesfor stimulation, facility of reestimation of radiation doses incase of any doubts and, over and above all, no structuralchanges1 due to heating that lose its reusability, unlike in someTLD phosphor materials.2–5 However, there is not much choicedue to the paucity of commercially available OSL phosphors andthe high fading in others. The OSL phosphors available are alsocostly due to their difficult methods of synthesis. For example,for producing Al2O3:C,6,7 one needs to have a very hightemperature vacuum furnace as the doping of carbon is notpossible in an atmospheric environment; for producing anotherOSL phosphor, BeO,8 special arrangements are needed for itsproduction and handling as it is very toxic to human beings.
The general requirement of a good OSL phosphor is that theemission should be between 350 and 425 nm (where mostcommon detectors are most sensitive) and the defects (traps)
iversity of Delhi, Delhi–110 007, India.
[email protected]; Fax: +91-11-2766-7061;
sari Nagar, New Delhi–110 029, India
should have a high photo-ionization cross-section in the blue-green region (450–550 nm) or IR region (650–800 nm). Thesensitivity of an OSLD phosphor depends on the kind of defects,stimulation sources and availability of suitable lters and onthe detector (generally a wide-band PMT). The tissue equivalent(low-Z) phosphors are much preferred due to their at energyresponse and their suitability to be used in a mixed radiationeld. Attempts are, therefore, going on to study new (preferablylow-Z) materials for their applications as OSL phosphors, suchas, LiMgPO4:Tb,B,9 Na2SiF6:Cu,P,10 Al2O3:B,11 Y3Al5O12:C,12 Cu-doped quartz (SiO2:Cu),13 LiAlO2,14 MgO:Tb,15 NaMgF3:Eu,16
etc.However, all these phosphors are at the developmental leveland the issues related to their sensitivity and fading need to beaddressed before they are nally accepted as OSLD phosphors.More details and a comparative study can be seen in somerecent review papers.17–19
In the present paper we report optically stimulated lumi-nescence (OSL) and thermoluminescence (TL) studies of a newhigh sensitivity low-Z Na2LiPO4:Eu phosphor for its applicationfor OSL dosimetry. Na2LiPO4:Eu is really a multifunctionaladvanced ceramic as it has already been proved to be a redphosphor for solid-state lighting and display applications20 anda high-sensitivity TLD phosphor for dosimetry applications.21 Itwas intuitive to study this material for its application as anOSL phosphor and it proved to be satisfying. The phosphorNa2LiPO4:Eu is found to have several ‘good’ characteristics,such as low-Z material, very easy method of preparation,nontoxic in nature, highly sensitive, linear OSL dose responseover a wide range, low fading, excellent reusability, emission
This journal is © The Royal Society of Chemistry 2015
Paper RSC Advances
well separated (peaking at around 420 nm) from that of theexcitation source (470 nm blue LEDs). Phenomenologicalstudies have also been done to understand the process of OSLand a model for trapping and emptying and recombining thetraps with luminescence (hole) centers has been proposed.
Result and discussionsXRD analysis
XRD patterns of the NaLi2PO4:Eu3+ phosphor are as shown in
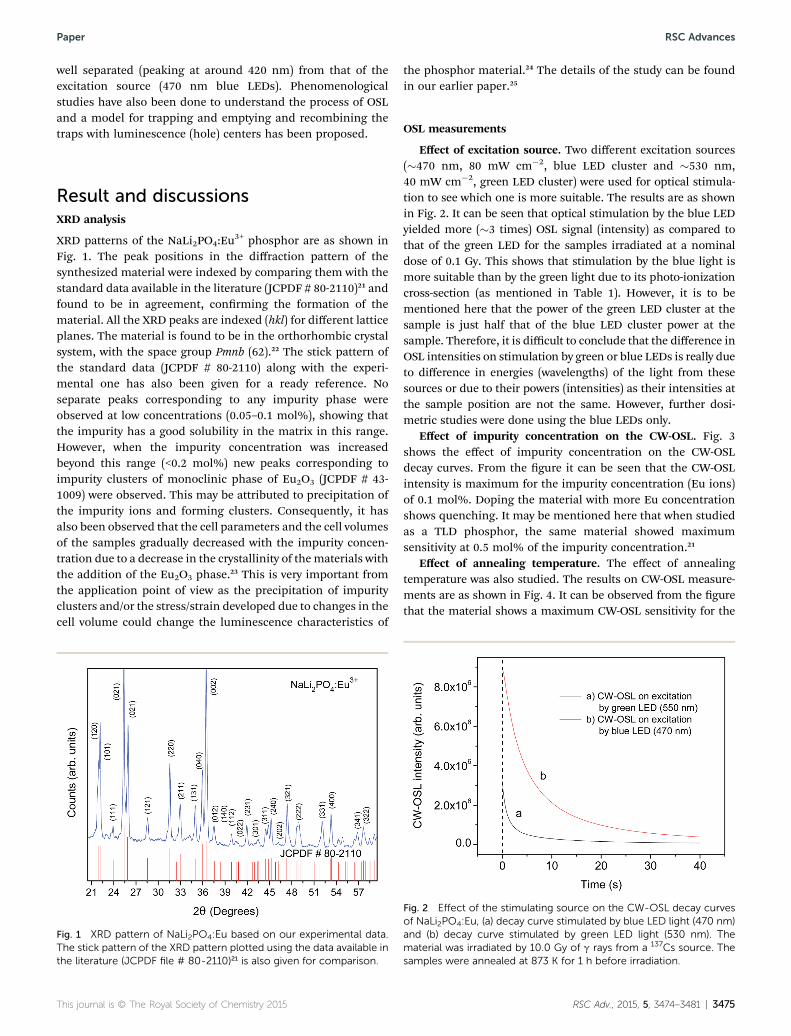
Fig. 1. The peak positions in the diffraction pattern of thesynthesized material were indexed by comparing them with thestandard data available in the literature (JCPDF # 80-2110)21 andfound to be in agreement, conrming the formation of thematerial. All the XRD peaks are indexed (hkl) for different latticeplanes. The material is found to be in the orthorhombic crystalsystem, with the space group Pmnb (62).22 The stick pattern ofthe standard data (JCPDF # 80-2110) along with the experi-mental one has also been given for a ready reference. Noseparate peaks corresponding to any impurity phase wereobserved at low concentrations (0.05–0.1 mol%), showing thatthe impurity has a good solubility in the matrix in this range.However, when the impurity concentration was increasedbeyond this range (<0.2 mol%) new peaks corresponding toimpurity clusters of monoclinic phase of Eu2O3 (JCPDF # 43-1009) were observed. This may be attributed to precipitation ofthe impurity ions and forming clusters. Consequently, it hasalso been observed that the cell parameters and the cell volumesof the samples gradually decreased with the impurity concen-tration due to a decrease in the crystallinity of thematerials withthe addition of the Eu2O3 phase.23 This is very important fromthe application point of view as the precipitation of impurityclusters and/or the stress/strain developed due to changes in thecell volume could change the luminescence characteristics of
Fig. 1 XRD pattern of NaLi2PO4:Eu based on our experimental data.The stick pattern of the XRD pattern plotted using the data available inthe literature (JCPDF file # 80-2110)21 is also given for comparison.
This journal is © The Royal Society of Chemistry 2015
the phosphor material.24 The details of the study can be foundin our earlier paper.25
OSL measurements
Effect of excitation source. Two different excitation sources(�470 nm, 80 mW cm�2, blue LED cluster and �530 nm,40 mW cm�2, green LED cluster) were used for optical stimula-tion to see which one is more suitable. The results are as shownin Fig. 2. It can be seen that optical stimulation by the blue LEDyielded more (�3 times) OSL signal (intensity) as compared tothat of the green LED for the samples irradiated at a nominaldose of 0.1 Gy. This shows that stimulation by the blue light ismore suitable than by the green light due to its photo-ionizationcross-section (as mentioned in Table 1). However, it is to bementioned here that the power of the green LED cluster at thesample is just half that of the blue LED cluster power at thesample. Therefore, it is difficult to conclude that the difference inOSL intensities on stimulation by green or blue LEDs is really dueto difference in energies (wavelengths) of the light from thesesources or due to their powers (intensities) as their intensities atthe sample position are not the same. However, further dosi-metric studies were done using the blue LEDs only.
Effect of impurity concentration on the CW-OSL. Fig. 3shows the effect of impurity concentration on the CW-OSLdecay curves. From the gure it can be seen that the CW-OSLintensity is maximum for the impurity concentration (Eu ions)of 0.1 mol%. Doping the material with more Eu concentrationshows quenching. It may be mentioned here that when studiedas a TLD phosphor, the same material showed maximumsensitivity at 0.5 mol% of the impurity concentration.21
Effect of annealing temperature. The effect of annealingtemperature was also studied. The results on CW-OSL measure-ments are as shown in Fig. 4. It can be observed from the gurethat the material shows a maximum CW-OSL sensitivity for the
Fig. 2 Effect of the stimulating source on the CW-OSL decay curvesof NaLi2PO4:Eu, (a) decay curve stimulated by blue LED light (470 nm)and (b) decay curve stimulated by green LED light (530 nm). Thematerial was irradiated by 10.0 Gy of g rays from a 137Cs source. Thesamples were annealed at 873 K for 1 h before irradiation.
RSC Adv., 2015, 5, 3474–3481 | 3475
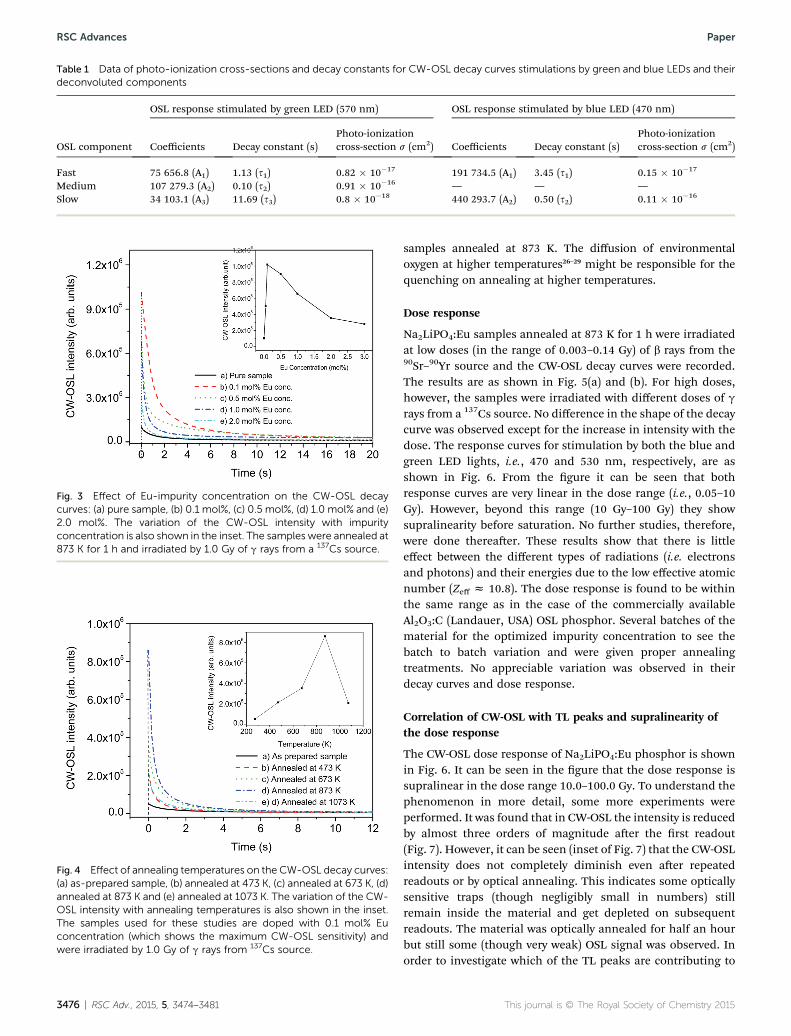
Table 1 Data of photo-ionization cross-sections and decay constants for CW-OSL decay curves stimulations by green and blue LEDs and theirdeconvoluted components
OSL component
OSL response stimulated by green LED (570 nm) OSL response stimulated by blue LED (470 nm)
Coefficients Decay constant (s)Photo-ionizationcross-section s (cm2) Coefficients Decay constant (s)
Photo-ionizationcross-section s (cm2)
Fast 75 656.8 (A1) 1.13 (s1) 0.82 � 10�17 191 734.5 (A1) 3.45 (s1) 0.15 � 10�17
Medium 107 279.3 (A2) 0.10 (s2) 0.91 � 10�16 — — —Slow 34 103.1 (A3) 11.69 (s3) 0.8 � 10�18 440 293.7 (A2) 0.50 (s2) 0.11 � 10�16
Fig. 3 Effect of Eu-impurity concentration on the CW-OSL decaycurves: (a) pure sample, (b) 0.1 mol%, (c) 0.5 mol%, (d) 1.0 mol% and (e)2.0 mol%. The variation of the CW-OSL intensity with impurityconcentration is also shown in the inset. The samples were annealed at873 K for 1 h and irradiated by 1.0 Gy of g rays from a 137Cs source.
Fig. 4 Effect of annealing temperatures on the CW-OSL decay curves:(a) as-prepared sample, (b) annealed at 473 K, (c) annealed at 673 K, (d)annealed at 873 K and (e) annealed at 1073 K. The variation of the CW-OSL intensity with annealing temperatures is also shown in the inset.The samples used for these studies are doped with 0.1 mol% Euconcentration (which shows the maximum CW-OSL sensitivity) andwere irradiated by 1.0 Gy of g rays from 137Cs source.
3476 | RSC Adv., 2015, 5, 3474–3481
RSC Advances Paper
samples annealed at 873 K. The diffusion of environmentaloxygen at higher temperatures26–29 might be responsible for thequenching on annealing at higher temperatures.
Dose response
Na2LiPO4:Eu samples annealed at 873 K for 1 h were irradiatedat low doses (in the range of 0.003–0.14 Gy) of b rays from the90Sr–90Yr source and the CW-OSL decay curves were recorded.The results are as shown in Fig. 5(a) and (b). For high doses,however, the samples were irradiated with different doses of grays from a 137Cs source. No difference in the shape of the decaycurve was observed except for the increase in intensity with thedose. The response curves for stimulation by both the blue andgreen LED lights, i.e., 470 and 530 nm, respectively, are asshown in Fig. 6. From the gure it can be seen that bothresponse curves are very linear in the dose range (i.e., 0.05–10Gy). However, beyond this range (10 Gy–100 Gy) they showsupralinearity before saturation. No further studies, therefore,were done thereaer. These results show that there is littleeffect between the different types of radiations (i.e. electronsand photons) and their energies due to the low effective atomicnumber (Zeff z 10.8). The dose response is found to be withinthe same range as in the case of the commercially availableAl2O3:C (Landauer, USA) OSL phosphor. Several batches of thematerial for the optimized impurity concentration to see thebatch to batch variation and were given proper annealingtreatments. No appreciable variation was observed in theirdecay curves and dose response.
Correlation of CW-OSL with TL peaks and supralinearity ofthe dose response
The CW-OSL dose response of Na2LiPO4:Eu phosphor is shownin Fig. 6. It can be seen in the gure that the dose response issupralinear in the dose range 10.0–100.0 Gy. To understand thephenomenon in more detail, some more experiments wereperformed. It was found that in CW-OSL the intensity is reducedby almost three orders of magnitude aer the rst readout(Fig. 7). However, it can be seen (inset of Fig. 7) that the CW-OSLintensity does not completely diminish even aer repeatedreadouts or by optical annealing. This indicates some opticallysensitive traps (though negligibly small in numbers) stillremain inside the material and get depleted on subsequentreadouts. The material was optically annealed for half an hourbut still some (though very weak) OSL signal was observed. Inorder to investigate which of the TL peaks are contributing to
This journal is © The Royal Society of Chemistry 2015
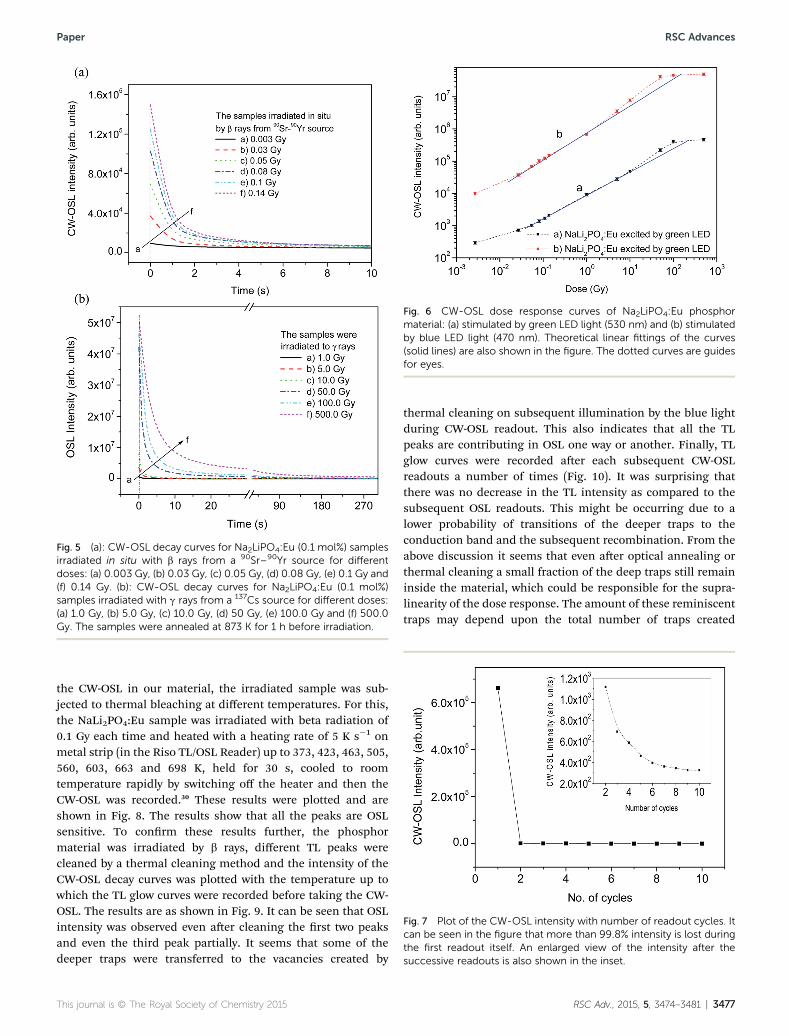
Fig. 5 (a): CW-OSL decay curves for Na2LiPO4:Eu (0.1 mol%) samplesirradiated in situ with b rays from a 90Sr–90Yr source for differentdoses: (a) 0.003 Gy, (b) 0.03 Gy, (c) 0.05 Gy, (d) 0.08 Gy, (e) 0.1 Gy and(f) 0.14 Gy. (b): CW-OSL decay curves for Na2LiPO4:Eu (0.1 mol%)samples irradiated with g rays from a 137Cs source for different doses:(a) 1.0 Gy, (b) 5.0 Gy, (c) 10.0 Gy, (d) 50 Gy, (e) 100.0 Gy and (f) 500.0Gy. The samples were annealed at 873 K for 1 h before irradiation.
Fig. 6 CW-OSL dose response curves of Na2LiPO4:Eu phosphormaterial: (a) stimulated by green LED light (530 nm) and (b) stimulatedby blue LED light (470 nm). Theoretical linear fittings of the curves(solid lines) are also shown in the figure. The dotted curves are guidesfor eyes.
Fig. 7 Plot of the CW-OSL intensity with number of readout cycles. Itcan be seen in the figure that more than 99.8% intensity is lost duringthe first readout itself. An enlarged view of the intensity after thesuccessive readouts is also shown in the inset.
Paper RSC Advances
the CW-OSL in our material, the irradiated sample was sub-jected to thermal bleaching at different temperatures. For this,the NaLi2PO4:Eu sample was irradiated with beta radiation of0.1 Gy each time and heated with a heating rate of 5 K s�1 onmetal strip (in the Riso TL/OSL Reader) up to 373, 423, 463, 505,560, 603, 663 and 698 K, held for 30 s, cooled to roomtemperature rapidly by switching off the heater and then theCW-OSL was recorded.30 These results were plotted and areshown in Fig. 8. The results show that all the peaks are OSLsensitive. To conrm these results further, the phosphormaterial was irradiated by b rays, different TL peaks werecleaned by a thermal cleaning method and the intensity of theCW-OSL decay curves was plotted with the temperature up towhich the TL glow curves were recorded before taking the CW-OSL. The results are as shown in Fig. 9. It can be seen that OSLintensity was observed even aer cleaning the rst two peaksand even the third peak partially. It seems that some of thedeeper traps were transferred to the vacancies created by
This journal is © The Royal Society of Chemistry 2015
thermal cleaning on subsequent illumination by the blue lightduring CW-OSL readout. This also indicates that all the TLpeaks are contributing in OSL one way or another. Finally, TLglow curves were recorded aer each subsequent CW-OSLreadouts a number of times (Fig. 10). It was surprising thatthere was no decrease in the TL intensity as compared to thesubsequent OSL readouts. This might be occurring due to alower probability of transitions of the deeper traps to theconduction band and the subsequent recombination. From theabove discussion it seems that even aer optical annealing orthermal cleaning a small fraction of the deep traps still remaininside the material, which could be responsible for the supra-linearity of the dose response. The amount of these reminiscenttraps may depend upon the total number of traps created
RSC Adv., 2015, 5, 3474–3481 | 3477
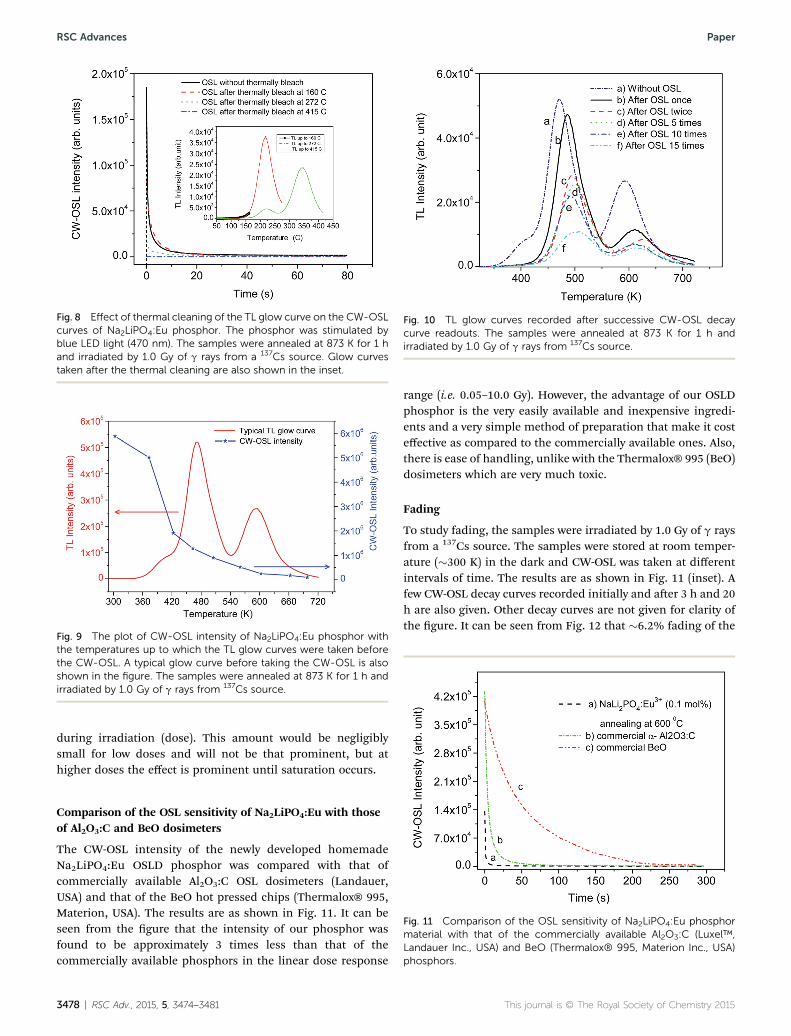
Fig. 9 The plot of CW-OSL intensity of Na2LiPO4:Eu phosphor withthe temperatures up to which the TL glow curves were taken beforethe CW-OSL. A typical glow curve before taking the CW-OSL is alsoshown in the figure. The samples were annealed at 873 K for 1 h andirradiated by 1.0 Gy of g rays from 137Cs source.
Fig. 10 TL glow curves recorded after successive CW-OSL decaycurve readouts. The samples were annealed at 873 K for 1 h andirradiated by 1.0 Gy of g rays from 137Cs source.
Fig. 8 Effect of thermal cleaning of the TL glow curve on the CW-OSLcurves of Na2LiPO4:Eu phosphor. The phosphor was stimulated byblue LED light (470 nm). The samples were annealed at 873 K for 1 hand irradiated by 1.0 Gy of g rays from a 137Cs source. Glow curvestaken after the thermal cleaning are also shown in the inset.
RSC Advances Paper
during irradiation (dose). This amount would be negligiblysmall for low doses and will not be that prominent, but athigher doses the effect is prominent until saturation occurs.
Fig. 11 Comparison of the OSL sensitivity of Na2LiPO4:Eu phosphormaterial with that of the commercially available Al2O3:C (Luxel™,Landauer Inc., USA) and BeO (Thermalox® 995, Materion Inc., USA)phosphors.
Comparison of the OSL sensitivity of Na2LiPO4:Eu with thoseof Al2O3:C and BeO dosimeters
The CW-OSL intensity of the newly developed homemadeNa2LiPO4:Eu OSLD phosphor was compared with that ofcommercially available Al2O3:C OSL dosimeters (Landauer,USA) and that of the BeO hot pressed chips (Thermalox® 995,Materion, USA). The results are as shown in Fig. 11. It can beseen from the gure that the intensity of our phosphor wasfound to be approximately 3 times less than that of thecommercially available phosphors in the linear dose response
3478 | RSC Adv., 2015, 5, 3474–3481
range (i.e. 0.05–10.0 Gy). However, the advantage of our OSLDphosphor is the very easily available and inexpensive ingredi-ents and a very simple method of preparation that make it costeffective as compared to the commercially available ones. Also,there is ease of handling, unlike with the Thermalox® 995 (BeO)dosimeters which are very much toxic.
Fading
To study fading, the samples were irradiated by 1.0 Gy of g raysfrom a 137Cs source. The samples were stored at room temper-ature (�300 K) in the dark and CW-OSL was taken at differentintervals of time. The results are as shown in Fig. 11 (inset). Afew CW-OSL decay curves recorded initially and aer 3 h and 20h are also given. Other decay curves are not given for clarity ofthe gure. It can be seen from Fig. 12 that �6.2% fading of the
This journal is © The Royal Society of Chemistry 2015

Fig. 12 Typical CW-OSL decay curves just after irradiation and afterstoring in the dark at room temperature: (a) at 0 h, (b) after 3 h and (c)after 20 h. The decay curves recorded after 20 h are not shown in thefigure for better clarity. The fading curve is also shown in the inset.Around 6.2% fading was observed in 40 days.
Fig. 13 Normalized intensity curve for repeated reusability of theNa2LiPO4:Eu phosphor material. The material was irradiated by 1.0 Gyof g rays from a 137Cs source and the CW-OSL was taken. The materialwas optically annealed for half an hour; and the OSL was taken beforeirradiation to see that no OSL signal was left after the annealing.The material was irradiated again for the same dose as for taking theCW-OSL. The process is repeated several times. The dotted line showsthe least squares fitting.
Fig. 14 Theoretical fitting of a typical CW-OSL decay curve stimulatedby blue LED light (470 nm). The theoretically fitted curve is shown insymbols and the experimental as a solid curve. The components are:(a) fast component (dash dot curve) and (b) slow component (dot dotcurve).
Paper RSC Advances
OSL signal was observed in 40 days. This is very much compa-rable with that of the commercially available phosphors, i.e.,Al2O3:C (Luxel™, Landauer Inc., USA) and BeO (Thermalox®995, Materion Inc., USA). This has also been accepted formedical and personnel dosimetry.
Optical annealing (bleaching) and reusability
Several batches of the newly developed NaLi2PO4:Eu OSLDphosphor were prepared and used for OSL studies. The phos-phors were also irradiated to various test doses; OSL was takenand optically annealed using an annealing system consisting of8 high output T5 uorescent lamps (Annealing System, Modelno.: GS-00004, Gammasonics, Australia). The system canremove a dose of a few mGy in a few minutes.31 The sampleswere optically annealed for different times aer the OSL read-outs until the entire OSL signal was erased. Aer the rst CW-OSL, the remaining signal is of the order of only a few mGy.The moderate time for annealing/bleaching was found to bearound half an hour. The OSL was again taken to see that noOSL signal was le inside the material. Several samples wereirradiated at different test doses and the procedure wasrepeated several times. A few results are shown in Fig. 13. Thematerial shows excellent reusability.
Theoretical tting of the CW-OSL decay curve and photo-ionization cross-sections
Fig. 14 and 15 show theoretical curve ttings of typical CW-OSLdecay curves for the OSL stimulated by the blue (470 nm) andthe green (530 nm) light. The gure of merit (FOM) for both thecurve ttings was approx. 2%. It can be observed from the gurethat the blue light stimulated decay curve consists of twocomponents, a fast component and a slow component, whilethat stimulated by the green light consists of three components,fast, medium and slow. The sum of these components is alsoshown as theoretically tted curves (curves with symbols). The
This journal is © The Royal Society of Chemistry 2015
curve stimulated by blue light can, be represented by thefollowing equation (eqn (1)).
IOSL ðBlueÞ ¼ A1 exp�t
s1þ A2 exp
�t
s2(1)
where A1 ¼ 391 734.5, s1 ¼ 3.45, A2 ¼ 4 440 293.7, s2 ¼ 0.50 andthe other one (stimulated by green light) by another equation asgiven below (eqn (2)),
IOSL ðGreenÞ ¼ A1 exp�t
s1þ A2 exp
�t
s2þ A3 exp
�t
s3(2)
RSC Adv., 2015, 5, 3474–3481 | 3479
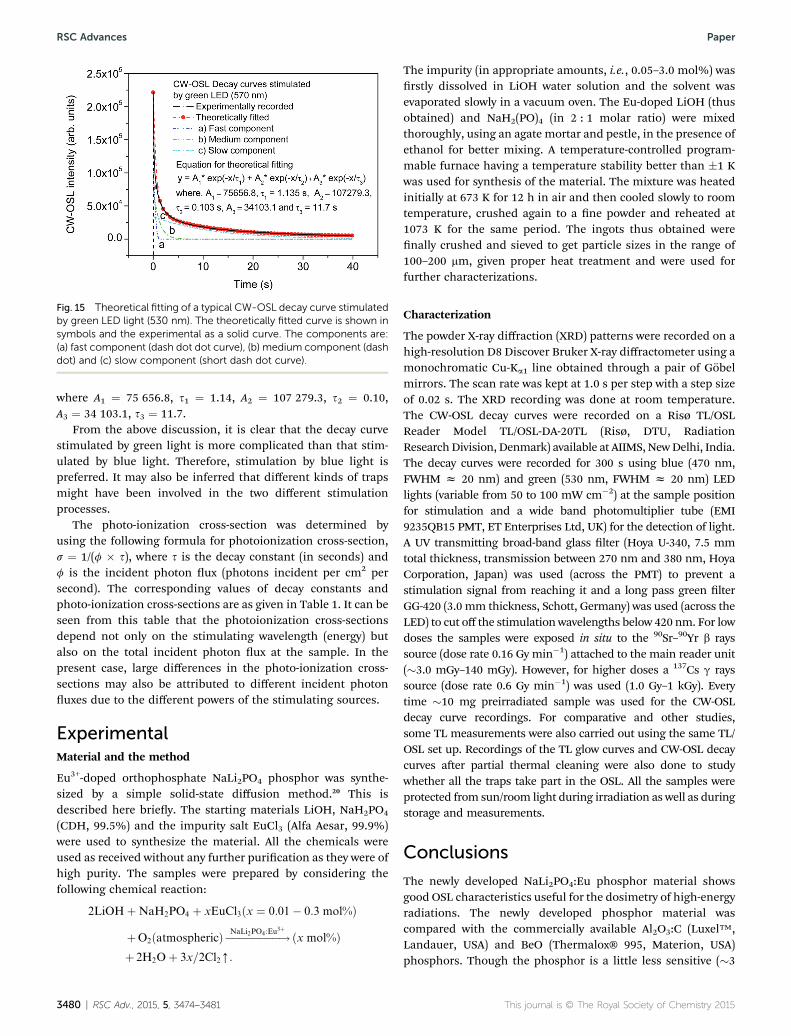
Fig. 15 Theoretical fitting of a typical CW-OSL decay curve stimulatedby green LED light (530 nm). The theoretically fitted curve is shown insymbols and the experimental as a solid curve. The components are:(a) fast component (dash dot dot curve), (b) medium component (dashdot) and (c) slow component (short dash dot curve).
RSC Advances Paper
where A1 ¼ 75 656.8, s1 ¼ 1.14, A2 ¼ 107 279.3, s2 ¼ 0.10,A3 ¼ 34 103.1, s3 ¼ 11.7.
From the above discussion, it is clear that the decay curvestimulated by green light is more complicated than that stim-ulated by blue light. Therefore, stimulation by blue light ispreferred. It may also be inferred that different kinds of trapsmight have been involved in the two different stimulationprocesses.
The photo-ionization cross-section was determined byusing the following formula for photoionization cross-section,s ¼ 1/(f � s), where s is the decay constant (in seconds) andf is the incident photon ux (photons incident per cm2 persecond). The corresponding values of decay constants andphoto-ionization cross-sections are as given in Table 1. It can beseen from this table that the photoionization cross-sectionsdepend not only on the stimulating wavelength (energy) butalso on the total incident photon ux at the sample. In thepresent case, large differences in the photo-ionization cross-sections may also be attributed to different incident photonuxes due to the different powers of the stimulating sources.
ExperimentalMaterial and the method
Eu3+-doped orthophosphate NaLi2PO4 phosphor was synthe-sized by a simple solid-state diffusion method.20 This isdescribed here briey. The starting materials LiOH, NaH2PO4
(CDH, 99.5%) and the impurity salt EuCl3 (Alfa Aesar, 99.9%)were used to synthesize the material. All the chemicals wereused as received without any further purication as they were ofhigh purity. The samples were prepared by considering thefollowing chemical reaction:
2LiOHþNaH2PO4 þ xEuCl3ðx ¼ 0:01� 0:3 mol%Þ
þO2ðatmosphericÞ��������!NaLi2PO4 :Eu
3þðx mol%Þ
þ 2H2Oþ 3x=2Cl2[:
3480 | RSC Adv., 2015, 5, 3474–3481
The impurity (in appropriate amounts, i.e., 0.05–3.0 mol%) wasrstly dissolved in LiOH water solution and the solvent wasevaporated slowly in a vacuum oven. The Eu-doped LiOH (thusobtained) and NaH2(PO)4 (in 2 : 1 molar ratio) were mixedthoroughly, using an agate mortar and pestle, in the presence ofethanol for better mixing. A temperature-controlled program-mable furnace having a temperature stability better than �1 Kwas used for synthesis of the material. The mixture was heatedinitially at 673 K for 12 h in air and then cooled slowly to roomtemperature, crushed again to a ne powder and reheated at1073 K for the same period. The ingots thus obtained werenally crushed and sieved to get particle sizes in the range of100–200 mm, given proper heat treatment and were used forfurther characterizations.
Characterization
The powder X-ray diffraction (XRD) patterns were recorded on ahigh-resolution D8 Discover Bruker X-ray diffractometer using amonochromatic Cu-Ka1 line obtained through a pair of Gobelmirrors. The scan rate was kept at 1.0 s per step with a step sizeof 0.02 s. The XRD recording was done at room temperature.The CW-OSL decay curves were recorded on a Risø TL/OSLReader Model TL/OSL-DA-20TL (Risø, DTU, RadiationResearchDivision, Denmark) available at AIIMS, NewDelhi, India.The decay curves were recorded for 300 s using blue (470 nm,FWHM z 20 nm) and green (530 nm, FWHM z 20 nm) LEDlights (variable from 50 to 100 mW cm�2) at the sample positionfor stimulation and a wide band photomultiplier tube (EMI9235QB15 PMT, ET Enterprises Ltd, UK) for the detection of light.A UV transmitting broad-band glass lter (Hoya U-340, 7.5 mmtotal thickness, transmission between 270 nm and 380 nm, HoyaCorporation, Japan) was used (across the PMT) to prevent astimulation signal from reaching it and a long pass green lterGG-420 (3.0 mm thickness, Schott, Germany) was used (across theLED) to cut off the stimulation wavelengths below 420 nm. For lowdoses the samples were exposed in situ to the 90Sr–90Yr b rayssource (dose rate 0.16 Gy min�1) attached to the main reader unit(�3.0 mGy–140 mGy). However, for higher doses a 137Cs g rayssource (dose rate 0.6 Gy min�1) was used (1.0 Gy–1 kGy). Everytime �10 mg preirradiated sample was used for the CW-OSLdecay curve recordings. For comparative and other studies,some TL measurements were also carried out using the same TL/OSL set up. Recordings of the TL glow curves and CW-OSL decaycurves aer partial thermal cleaning were also done to studywhether all the traps take part in the OSL. All the samples wereprotected from sun/room light during irradiation as well as duringstorage and measurements.
Conclusions
The newly developed NaLi2PO4:Eu phosphor material showsgood OSL characteristics useful for the dosimetry of high-energyradiations. The newly developed phosphor material wascompared with the commercially available Al2O3:C (Luxel™,Landauer, USA) and BeO (Thermalox® 995, Materion, USA)phosphors. Though the phosphor is a little less sensitive (�3
This journal is © The Royal Society of Chemistry 2015
Paper RSC Advances
times less), the very easy method of synthesis makes it very costeffective. The fading in the material was found to be around6.2% in 40 days and is comparable with that of the commer-cially available phosphors and thus is acceptable for dosimetry.The dose response was found to be linear in the dose range of0.05–0.0 Gy but shows supralinearity at higher doses (from 10.0to 100 Gy) before it gets saturated. The supralinearity and thecontribution of different kinds of traps were also studied indetail and explained.
Acknowledgements
We are thankful to the Inter-University Accelerator Center, NewDelhi, for partial nancial assistance under the research project(UFR # 45318) and also University of Delhi for the research grantunder the R & D scheme (RC/2014/6820). We are also thankful tothe Director, BRAIRCH, AIIMS, New Delhi for permitting us touse the facilities at the hospital. We are also thankful to MrsDebbie Handley from Materion, USA, for generously donating afew BeO (Thermalox® 995) dosimeter chips.
References
1 L. Botter-Jensen, S. W. S. McKeever and A. G. Wintle,Optically Stimulated Luminescence Dosimetry, ElsevierScience B. V., Amsterdam, The Netherlands, 2003.
2 M. Danilkin, A. Lust, A. Ratas, V. Seeman and M. Kerikmae,Radiat. Meas., 2008, 43, 300.
3 G. G. Cai, J. Fesquet, L. Dusseau, M. Martini, F. Meinardi,B. L. Huang, K. Y. Tang, D. Beteille and J. Gasiot, Radiat.Prot. Dosim., 1996, 65, 163.
4 B. Yang, Q. Lu, S. Wang and P. D. Townsend, Nucl. Instrum.Methods Phys. Res., Sect. B, 2005, 239, 171.
5 M. Singh and P. D. Sahare, Nucl. Instrum. Methods Phys. Res.,Sect. B, 2012, 289, 59.
6 M. S. Akselrod, V. S. Kortov, D. J. Kravetsky and V. I. Gotlib,Radiat. Prot. Dosim., 1990, 32, 15.
7 M. S. Kulkarni, D. R. Mishra, K. P. Muthe, A. Singh, M. Roy,S. K. Gupta and S. Kannan, Radiat. Meas., 2005, 39, 277.
8 M. Sommer, R. Fraudenberg and J. Henniger, Radiat. Meas.,2007, 42, 617.
9 B. Dhabekar, S. N. Menon, E. Alagu Raja, A. K. Bakshi,A. K. Singh, M. P. Chougaonkar and Y. S. Mayya, Nucl.Instrum. Methods Phys. Res., Sect. B, 2011, 269, 1844.
This journal is © The Royal Society of Chemistry 2015
10 R. A. Barve, R. R. Patil, S. V. Moharil, N. P. Gaikwad,B. C. Bhatt, R. Pradeep, D. R. Mishra and M. S. Kulkarni,Radiat. Prot. Dosim., 2014, DOI: 10.1093/rpd/ncu255.
11 A. Soni, K. P. Muthe, M. S. Kulkarni, D. R. Mishra,B. C. Bhatt, S. K. Gupta, J. V. Yakhmi and D. N. Sharma, J.Lumin., 2010, 130, 1308.
12 M. S. Kulkarni, K. P. Muthe, N. S. Rawat, D. R. Mishra,M. B. Kakade, S. Ramanathan, S. K. Gupta, B. C. Bhatt,J. V. Yakhmi and D. N. Sharma, Radiat. Meas., 2008, 43, 492.
13 R. Barve, R. R. Patil, N. S. Rawat, N. P. Gaikwad, R. Pradeep,B. C. Bhatt, S. V. Moharil and M. S. Kulkarni, Nucl. Instrum.Methods Phys. Res., Sect. B, 2012, 289, 100.
14 J. I. Lee, A. S. Pradhan, J. L. Kim, I. Chang, B. H. Kim andK. S. Chung, Radiat. Meas., 2012, 47, 837.
15 A. J. Bos, M. Prokic and J. C. Brouwer, Radiat. Prot. Dosim.,2006, 119, 130.
16 C. Dotzler, G. V. M. Williams, U. Reiser and A. Edgar, Appl.Phys. Lett., 2007, 91, 121910.
17 S. W. S. McKeever, Optically Stimulated LuminescenceDosimetry, Nucl. Instrum. Methods Phys. Res., 2001, 184, 29.
18 M. S. Kulkarni, Internat. J. Lum. Appl., 2012, 2, 84.19 A. S. Pradhan, J. I. Lee and J. L. Kim, J. Med. Phys., 2008, 33,
85.20 P. D. Sahare and M. Singh, Indian J. Phys., 2014, 88, 621.21 M. Singh, P. D. Sahare and P. Kumar, Radiat. Meas., 2013, 59,
8.22 G. Y. Chao and T. S. Ercit, Can. Mineral., 1991, 29, 565.23 S.-S. Chang and M. S. Jo, Ceram. Int., 2007, 33, 511.24 A. Lust, Ph. D. thesis, Charge state of dopants and ordered
clusters formation in CaF2:Mn and CaF2:Eu luminophors,Tartu University Press, ISBN: 978-9949-11-6-621, 2007.
25 P. D. Sahare and M. Singh, Indian J. Phys., 2014, 88, 621.26 R. Nakata, K. Kohnom, M. Sumita and E. Higuchi, J. Phys.
Soc. Jpn., 1976, 41, 470.27 F. M. Lay and A. W. Nolle, Phys. Rev., 1967, 163, 266.28 A. R. Lakshmanan, M. T. Jose, V. Ponnusamy and
K. P. R. Vivek, J. Phys. D: Appl. Phys., 2002, 35, 386.29 C. M. Sunta, Radiat. Prot. Dosim., 1984, 8, 25.30 N. Mandlik, P. D. Sahare, M. S. Kulkarni, B. C. Bhatt,
V. N. Bhoraskar and S. D. Dhole, J. Lumin., 2014, 146, 128.31 Webpage: http://portal.landauer.com.au/.
RSC Adv., 2015, 5, 3474–3481 | 3481


![Raman spectroscopic study of the uranyl mineral pseudojohannite Cu6.5[(UO2)4O4(SO4)2]2(OH)5·25H2O](https://static.fdokumen.com/doc/165x107/633658844e9c1ac02e080a47/raman-spectroscopic-study-of-the-uranyl-mineral-pseudojohannite-cu65uo24o4so422oh5a25h2o.jpg)