Dose evaluation using multiple-aliquot quartz OSL: test of methods and a new protocol for improved...
14
Available online at www.sciencedirect.com Radiation Measurements 37 (2003) 67 – 80 www.elsevier.com/locate/radmeas Dose evaluation using multiple-aliquot quartz OSL: test of methods and a new protocol for improved accuracy and precision M. Jain a; b; ∗ , L. BHtter-Jensen b , A.K. Singhvi c a Department of Geology, Delhi University, Delhi 110 007, India b Risoe National Laboratory, Department NUK 201, P.O. Box 49, DK-4000, Roskilde, Denmark c Physical Research Laboratory, Navarangpura, Ahmedabad 380 009, India Received 1 May 2002; received in revised form 11 October 2002; accepted 16 October 2002 Abstract Multiple-aliquot quartz OSL dose–response curves often suer from substantial variability in the luminescence output from identically treated aliquots (scatter) that leads to large uncertainties in the equivalent-dose estimates. In this study, normalisation and its bearing on the accuracy and precision of the equivalent-dose estimates is investigated. We conclude that the most commonly used procedure employing the natural OSL (natural normalisation), leads to both poor accuracy and poor precision in the equivalent-dose estimates as it is insensitive to possible dose-dependent and non-dose-dependent sensitivity changes during the pre-heat, and fundamental variability in the shapes of quartz OSL (blue–green or blue-light stimulated luminescence) decay forms. A new protocol using a combination of ‘elevated temperature IR cleaning’ (ETIR) and ‘component-specic dose normalisa- tion’ (CSDN) has been developed. CSDN accounts for variability in the OSL decay forms and absorbs such sensitivity changes. A combination of ETIR and CSDN protocol increased palaeodose precision from ±100% to ±4% in quartz separates from the uvially transported sands in the Thar desert. A comparison with palaeodose estimates from the single-aliquot-regeneration protocol (SAR) gave similar accuracy and precision. c 2002 Elsevier Science Ltd. All rights reserved. Keywords: Quartz OSL; Scatter; Normalisation; Equivalent dose 1. Introduction In multiple aliquot dating techniques, dierent aliquots of the sample are used to construct a dose–response curve for equivalent-dose (De ) estimation. The accuracy and precision of the De is controlled by appropriateness of the curve t and aliquot-to-aliquot scatter in the luminescence output, respec- tively (Felix and Singhvi, 1997). Multiple-aliquot quartz optical dating is often associated with large uncertainties ∗ Corresponding author. Tel.: +45-4677-4907; fax: +45-4677- 4959. E-mail address: [email protected] (M. Jain). in De estimates (e.g. Stokes, 1994a). Consequently, it has been desirable to adopt single aliquot procedures that oer both high precision and improved accuracy (SAR, Murray and Wintle, 2000; Murray and Olley, 2002). However, mul- tiple aliquot techniques are still commonly carried out (e.g. English et al., 2001; Ollerhead et al., 2001), and there are laboratories that do not have adequate instrumental facili- ties to carry out the single-aliquot protocols. Further, it is justied to use multiple-aliquot procedures in samples with adequate (or homogeneous) pre-depositional zeroing of the OSL (e.g. aeolian) as the dose histograms in such cases show a normal distribution (e.g. Lepper et al., 2000), or in older samples where the eect of any possible pre-depositional heterogeneity in zeroing of OSL is likely to be insignicant 1350-4487/03/$ - see front matter c 2002 Elsevier Science Ltd. All rights reserved. PII:S1350-4487(02)00165-8
-
Upload
independent -
Category
Documents
-
view
1 -
download
0
Transcript of Dose evaluation using multiple-aliquot quartz OSL: test of methods and a new protocol for improved...
Available online at www.sciencedirect.com
Radiation Measurements 37 (2003) 67–80
www.elsevier.com/locate/radmeas
Dose evaluation using multiple-aliquot quartz OSL: test ofmethods and a new protocol for improved accuracy and
precision
M. Jaina;b;∗, L. BHtter-Jensenb, A.K. SinghvicaDepartment of Geology, Delhi University, Delhi 110 007, India
bRisoe National Laboratory, Department NUK 201, P.O. Box 49, DK-4000, Roskilde, DenmarkcPhysical Research Laboratory, Navarangpura, Ahmedabad 380 009, India
Received 1 May 2002; received in revised form 11 October 2002; accepted 16 October 2002
Abstract
Multiple-aliquot quartz OSL dose–response curves often su2er from substantial variability in the luminescence outputfrom identically treated aliquots (scatter) that leads to large uncertainties in the equivalent-dose estimates. In this study,normalisation and its bearing on the accuracy and precision of the equivalent-dose estimates is investigated. We conclude thatthe most commonly used procedure employing the natural OSL (natural normalisation), leads to both poor accuracy and poorprecision in the equivalent-dose estimates as it is insensitive to possible dose-dependent and non-dose-dependent sensitivitychanges during the pre-heat, and fundamental variability in the shapes of quartz OSL (blue–green or blue-light stimulatedluminescence) decay forms.
A new protocol using a combination of ‘elevated temperature IR cleaning’ (ETIR) and ‘component-speci9c dose normalisa-tion’ (CSDN) has been developed. CSDN accounts for variability in the OSL decay forms and absorbs such sensitivity changes.A combination of ETIR and CSDN protocol increased palaeodose precision from ±100% to ±4% in quartz separates from the>uvially transported sands in the Thar desert. A comparison with palaeodose estimates from the single-aliquot-regenerationprotocol (SAR) gave similar accuracy and precision.c© 2002 Elsevier Science Ltd. All rights reserved.
Keywords: Quartz OSL; Scatter; Normalisation; Equivalent dose
1. Introduction
In multiple aliquot dating techniques, di2erent aliquots ofthe sample are used to construct a dose–response curve forequivalent-dose (De) estimation. The accuracy and precisionof theDe is controlled by appropriateness of the curve 9t andaliquot-to-aliquot scatter in the luminescence output, respec-tively (Felix and Singhvi, 1997). Multiple-aliquot quartzoptical dating is often associated with large uncertainties
∗ Corresponding author. Tel.: +45-4677-4907; fax: +45-4677-4959.
E-mail address: [email protected] (M. Jain).
in De estimates (e.g. Stokes, 1994a). Consequently, it hasbeen desirable to adopt single aliquot procedures that o2erboth high precision and improved accuracy (SAR, Murrayand Wintle, 2000; Murray and Olley, 2002). However, mul-tiple aliquot techniques are still commonly carried out (e.g.English et al., 2001; Ollerhead et al., 2001), and there arelaboratories that do not have adequate instrumental facili-ties to carry out the single-aliquot protocols. Further, it isjusti9ed to use multiple-aliquot procedures in samples withadequate (or homogeneous) pre-depositional zeroing of theOSL (e.g. aeolian) as the dose histograms in such cases showa normal distribution (e.g. Lepper et al., 2000), or in oldersamples where the e2ect of any possible pre-depositionalheterogeneity in zeroing of OSL is likely to be insigni9cant
1350-4487/03/$ - see front matter c© 2002 Elsevier Science Ltd. All rights reserved.PII: S1350 -4487(02)00165 -8
68 M. Jain et al. / Radiation Measurements 37 (2003) 67–80
(Jain et al., 1999). Signi9cant reduction in measurementtime can be achieved in such cases by using a separate ir-radiation system such as is possible in the multiple-aliquotprotocols.
But, unfortunately, the protocols employing multiple-aliquot quartz OSL, have been associated with large scatterand consequent uncertainties in De estimates as comparedto feldspars and polyminerallic samples. This is irrespectiveof whether the sample was homogeneously or heteroge-neously bleached (Jain, 2000). It has been shown recentlythat this e2ect can partly arise from feldspar contamination(Jain and Singhvi, 2001). In this contribution we further in-vestigate the relationship between scatter and normalisationprocedures, and their bearing on the accuracy and precisionof quartz OSL equivalent-dose estimates.
2. Normalisation procedures (an overview)
The variability in the OSL output from identically treatedmultigrain aliquots (henceforth termed as scatter) is gen-erally attributed to inter-aliquot variability in the numberof bright grains, presence of contaminant mineral phases,etc. Appropriate normalisation procedures are required toaccount for this. Di2erent normalisation procedures, in thepast, have been based on:
1. Aliquot’s weight (weight normalisation—WN).2. Post-OSL residual TL normalisation (RTLN).3. Aliquot’s TL response to pre-OSL laboratory irradiation
(zero-glow normalisation—ZGN).4. A short measurement (0:1 s) of OSL prior to laboratory
irradiation or pre-heating (natural normalisation—NN orshort-shine normalisation); and
5. Aliquot’s response to post-OSL irradiation (dose norma-lisation—DN or equal-pre-dose normalisation—EPDN).
WN assumes an identical luminescence response of theindividual grains. However, it is now established that onlya very small proportion of grains actually give out light(Singhvi and Zimmerman, 1979; Duller et al., 2000); aninter-aliquot variability in the number of bright grains seemsmore of a rule than exception. Residual TL normalisation,on the other hand, compares optically stable traps with thehighly bleachable traps. Both these protocols have therefore,quite understandably, failed as viable normalisation tech-niques in OSL dating.
A correlation between the 110◦C TL peak and OSL inquartz (Stoneham and Stokes, 1991), led Stokes (1994a) toexplore the potential of ZGN. This used 110◦C TL peakafter a small test dose on natural aliquots prior to laboratoryirradiation and pre-heat; however, no perceptible reductionin scatter was observed.
The most widely used normalisation technique in OSLstudies has been the NN. The applicability of NN is limitedin very young or dim samples with low natural light levels.
Further, there often exists a signi9cant scatter, even after theNN, which obscures the true dose response. A combinationof large scatter and non-linear 9tting algorithms may giverise to ∼ 100% error in the De estimate (e.g. Stokes, 1994a;Jain et al., 1999).
DN, analogous to second-glow normalisation in TL, em-ploys a sequence of test dose irradiation followed by pre-heatand OSL measurement after the OSL in the natural andlaboratory-irradiated aliquots has been measured. Although,DN was more e2ective in reducing the scatter as compared tothe other normalisation protocols (e.g. Stokes, 1994a), it wasfound to have a (pre)dose-dependent sensitivity (Rhodes,1990). In order to circumvent such dose-dependent sensi-tivity changes induced due to irradiation, pre-heating andbleaching, an EPDN was developed. In this method, eachaliquot was made equal in terms of previously received dose.This was followed by bleaching and measurement of OSLresponse to a test dose (Stokes, 1992; Galloway and Hong,1996). It was generally believed that EPDN was importantfor the accuracy of results; however, this has been ques-tioned in the past (Jain and Singhvi, 1999; Jain, 2000).
In spite of a superior performance of DN over NN or ZGNin terms of scatter reduction, a clear physical explanation isnot available. In general an understanding of the causes ofscatter and its linkage to normalisation procedures is lackingand a need exists for other methods of normalisation to bedeveloped. In this study, we revisit the commonly used nor-malisation procedures (NN, DN and EPDN), discuss theirimplications and limitations, and develop a new protocol forbetter precision and accuracy.
3. Methodology
Blue–green and blue light stimulated luminescence(BGSL and BL) measurements were carried out on105– 150 �m size quartz fraction extracted following asequential pre-treatment of sample with 1 N HCl and30% H2O2, sieving, Frantz magnetic separation andsodium-polytungstate heavy liquid separation of the min-eral fractions (¡ 2:58 g=cc for feldspar, ¿ 2:58 g=cc forquartz and ¿ 2:7 for heavy minerals). This was followedby further treatment with 40% HF for 80 min and conc.HCl for 30 min.
BGSL measurements were done using a tungsten–halogenlamp using a set of GG 420 and SWP interface 9lters. Bluelight stimulation was achieved through an array of 12 LEDs(470±30 nm) delivering a light of 35 mW cm−2 after pass-ing through Schott GG-420 9lters. Infrared stimulated lumi-nescence (IRSL) was done using TEMP 484 diodes emit-ting at 880± 80 nm. Detection window comprised of HoyaU340 9lters. All luminescence measurements were carriedout in a RisH TL-DA 15 TL-OSL reader with an inbuilt90Sr=90Y beta source (40 mCi) delivering 7:95 Gy=min tothe sample. All OSL measurements were made at 125◦Cunless otherwise mentioned.

M. Jain et al. / Radiation Measurements 37 (2003) 67–80 69
The samples were collected from the Thar Desert, India.These come from a mixed provenance comprising Precam-brian Aravalli range and Malani igneous suite of rocks. Thepetrographic examination of 9ne and medium grained sand-stones revealed about 80% monocrystalline (igneous andmetamorphic) and 20% polycrystalline (metamorphic ori-gin) quartz (Jain, 2000). The source rocks were dominantlyPrecambrian volcanic and metamorphic rocks and Mesosoicsandstones.
4. The nature of scatter in the quartz dose–response
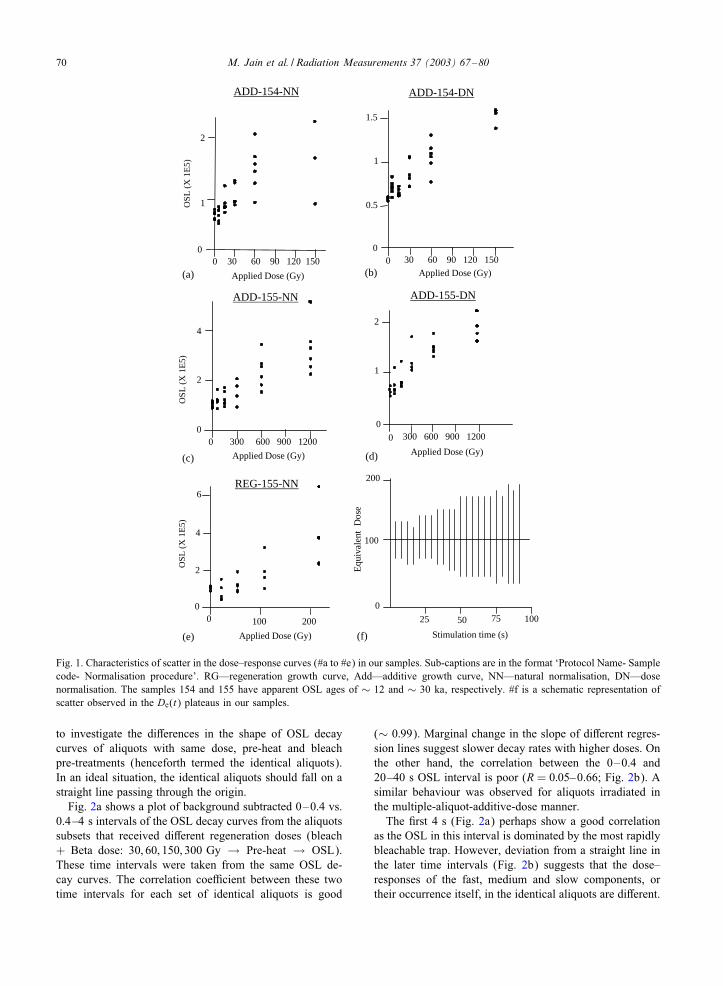
Di2erent characteristics of scatter observed in the additiveand regeneration growth curves in our samples are given inFig. 1 and summarised below. Each aliquot was stimulatedfor 100 s after laboratory irradiation and pre-heat, and theaverage OSL in the 95–100 s interval was used for back-ground subtraction. The following observations can be madefrom Fig. 1:
1. The scatter is independent of the age of the samples(Fig. 1a and c).
2. A signi9cant scatter is present in the quartz regenerationgrowth curve (Fig. 1e).
3. The scatter increaseswith thegiven laboratorydose inboththe additive and the regeneration methods (Fig. 1a,c,e).
4. The scatter persists in the natural aliquots despite theuse of NN. This occurs in both relatively young and oldsamples (Figs. 1a and c) (see Jain et al. (1999) whoreport an unusually high scatter in the natural OSL of ayoung sample).
5. There is an apparent reduction in the scatter with the useof DN (Fig. 1b and d).
6. The De(t) plateau (shine plateau) shows an increase inthe scatter with the OSL stimulation time (Fig. 1f) (alsosee Perkin and Rhodes, 1994).
Heterogeneous bleaching of the ‘primary’ (easy to bleach)and/or ‘secondary’ (less light sensitive) traps has been pro-posed as an important cause for scatter (e.g. Huntley andBerger, 1995). Ollerhead et al. (2001) have suggested thatthe easy-to-bleach component shows an increase in the scat-ter with added dose. TheDe calculation from the >uvial sandat 0:5 m depth in the ephemeral Luni river channel (Thardesert) gave an equivalent dose of 0:16± 0:04 Gy indicat-ing that sands transported under similar >uvial environmentswere well bleached (Jain et al., 1999). Even if this preci-sion were attributed to scatter arising from heterogeneousbleaching, it would be insigni9cant for older samples sincethe absolute variability in De of di2erent grains from thiscause would remain constant with time. Further, since thenature of scatter is similar in the additive and regenerationgrowth curves, and in both >uvial and aeolian sediments, itcan be inferred that the causes of scatter in our samples areother than heterogeneous bleaching.
A second important cause of scatter can be contamina-tion of quartz by feldspar micro-inclusions (Stokes, 1994a;Jain and Singhvi, 2001). BGSL from feldspar can be signif-icant due to its inherently higher sensitivity, which is furtheraccentuated by thermal assistance at the 125◦C stimulationtemperature used in routine quartz OSL measurement. An in-crease in the scatter with applied dose (with the use of NN),and reduction of the same with DN can be explained as beingdue to faded feldspar (Wintle, 1973; Mejdahl, 1988) inclu-sions or micro-dosimetric variations within a quartz grain.
Presence of feldspars can be detected by infrared screen-ing (Short and Huntley, 1992). A prolonged room tempera-ture IR cleaning has been used earlier to avoid the feldsparOSL (e.g. Perkin and Rhodes, 1994; Liritzis et al., 1997).Jain and Singhvi (2001) observed a strong thermal assis-tance of diPcult-to-bleach BGSL traps in feldspars (see alsoWallinga et al., 2002) and a signi9cant reduction in scatterwith an elevated temperature IR (ETIR) cleaning.
The causes of scatter must, however, be more complexas is revealed by persistence of scatter even after near re-moval of feldspar BGSL in well-bleached sediments (Jainand Singhvi, 2001). The e2ects such as scatter in the nor-malised natural aliquots and an increase in the scatter alongthe De(t) plateau (Fig. 1), in any case, are not immediatelyexplainable. This led us to investigate the relationship ofcommonly-used normalisation procedures with (a) scatter(for precision), and (b) the nature of dose–response curve(for accuracy).
We start with the most commonly used, NN. The basicpremises in the use NN are:
1. No signi9cant OSL depletion occurs during measurementof the NN signal.
2. The shape of OSL decay form is identical for identicallytreated aliquots. This especially has a bearing on its use inthe De(t) plateau where di2erent parts of the OSL decaycurves are used.
3. In an identical set of aliquots the extent of sensitivitychanges during the pre-heat are the same (i.e. related bya constant factor).
4. The dose-dependent changes in di2erent aliquot subsetsoccur only during or after the post-pre-heat OSL mea-surements.
A deviation from #1 will cause a systematic o2set in theDe values. Assumptions 2–4 have bearing on the accuracyand precision, and are tested below.
5. OSL decay forms of the identically treated aliquots
The OSL decay curves of di2erent aliquot sets of sampleTR156 were measured after bleaching, irradiation (as in themultiple-aliquot-regeneration-dose method) and pre-heat(220◦C, 300 s). A plot of initial OSL (9rst 0:4 s or less)vs. OSL intensity from any later time interval can be used
70 M. Jain et al. / Radiation Measurements 37 (2003) 67–80
30 60 90 120 150
(a)
(c)
(b)
(d)
(e) (f)
Stimulation time (s)
25 50 75 100
Applied Dose (Gy)
Applied Dose (Gy)
30 60 90 120 150
300 600 900 1200 300 600 900 1200
100 200
ADD-154-NN ADD-154-DN
ADD-155-NN ADD-155-DN
REG-155-NN
2 1
4
0.5
2
1
1.5
2
1
00
0 0
0 0
0 0
0
2
4
6
0
100
200
0
Applied Dose (Gy)
Applied Dose (Gy) Applied Dose (Gy)
OS
L (
X 1
E5)
OS
L (
X 1
E5)
OS
L (
X 1
E5)
Equ
ival
ent
Dos
e
Fig. 1. Characteristics of scatter in the dose–response curves (#a to #e) in our samples. Sub-captions are in the format ‘Protocol Name- Samplecode- Normalisation procedure’. RG—regeneration growth curve, Add—additive growth curve, NN—natural normalisation, DN—dosenormalisation. The samples 154 and 155 have apparent OSL ages of ∼ 12 and ∼ 30 ka, respectively. #f is a schematic representation ofscatter observed in the De(t) plateaus in our samples.
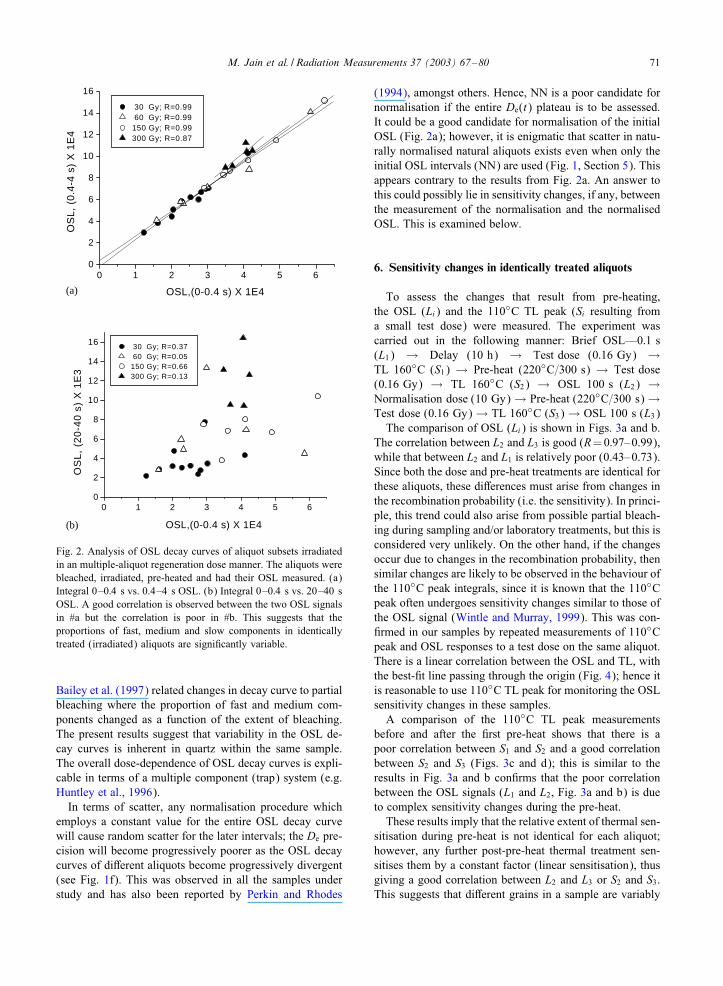
to investigate the di2erences in the shape of OSL decaycurves of aliquots with same dose, pre-heat and bleachpre-treatments (henceforth termed the identical aliquots).In an ideal situation, the identical aliquots should fall on astraight line passing through the origin.
Fig. 2a shows a plot of background subtracted 0–0.4 vs.0.4–4 s intervals of the OSL decay curves from the aliquotssubsets that received di2erent regeneration doses (bleach+ Beta dose: 30; 60; 150; 300 Gy → Pre-heat → OSL).These time intervals were taken from the same OSL de-cay curves. The correlation coePcient between these twotime intervals for each set of identical aliquots is good
(∼ 0:99). Marginal change in the slope of di2erent regres-sion lines suggest slower decay rates with higher doses. Onthe other hand, the correlation between the 0–0.4 and20–40 s OSL interval is poor (R = 0:05–0.66; Fig. 2b). Asimilar behaviour was observed for aliquots irradiated inthe multiple-aliquot-additive-dose manner.
The 9rst 4 s (Fig. 2a) perhaps show a good correlationas the OSL in this interval is dominated by the most rapidlybleachable trap. However, deviation from a straight line inthe later time intervals (Fig. 2b) suggests that the dose–responses of the fast, medium and slow components, ortheir occurrence itself, in the identical aliquots are di2erent.
M. Jain et al. / Radiation Measurements 37 (2003) 67–80 71
0 1 2 3 4 5 60
2
4
6
8
10
12
14
16
OS
L,
(0.4
-4 s
) X
1E
4
OSL,(0-0.4 s) X 1E4
30 Gy; R=0.99 60 Gy; R=0.99150 Gy; R=0.99300 Gy; R=0.87
0 1 2 3 4 5 60
2
4
6
8
10
12
14
16
OS
L,
(20
-40
s)
X 1
E3
OSL,(0-0.4 s) X 1E4
30 Gy; R=0.37 60 Gy; R=0.05150 Gy; R=0.66300 Gy; R=0.13
(a)
(b)
Fig. 2. Analysis of OSL decay curves of aliquot subsets irradiatedin an multiple-aliquot regeneration dose manner. The aliquots werebleached, irradiated, pre-heated and had their OSL measured. (a)Integral 0–0:4 s vs. 0.4–4 s OSL. (b) Integral 0–0:4 s vs. 20–40 sOSL. A good correlation is observed between the two OSL signalsin #a but the correlation is poor in #b. This suggests that theproportions of fast, medium and slow components in identicallytreated (irradiated) aliquots are signi9cantly variable.
Bailey et al. (1997) related changes in decay curve to partialbleaching where the proportion of fast and medium com-ponents changed as a function of the extent of bleaching.The present results suggest that variability in the OSL de-cay curves is inherent in quartz within the same sample.The overall dose-dependence of OSL decay curves is expli-cable in terms of a multiple component (trap) system (e.g.Huntley et al., 1996).
In terms of scatter, any normalisation procedure whichemploys a constant value for the entire OSL decay curvewill cause random scatter for the later intervals; the De pre-cision will become progressively poorer as the OSL decaycurves of di2erent aliquots become progressively divergent(see Fig. 1f). This was observed in all the samples understudy and has also been reported by Perkin and Rhodes
(1994), amongst others. Hence, NN is a poor candidate fornormalisation if the entire De(t) plateau is to be assessed.It could be a good candidate for normalisation of the initialOSL (Fig. 2a); however, it is enigmatic that scatter in natu-rally normalised natural aliquots exists even when only theinitial OSL intervals (NN) are used (Fig. 1, Section 5). Thisappears contrary to the results from Fig. 2a. An answer tothis could possibly lie in sensitivity changes, if any, betweenthe measurement of the normalisation and the normalisedOSL. This is examined below.
6. Sensitivity changes in identically treated aliquots
To assess the changes that result from pre-heating,the OSL (Li) and the 110◦C TL peak (Si resulting froma small test dose) were measured. The experiment wascarried out in the following manner: Brief OSL—0:1 s(L1) → Delay (10 h) → Test dose (0:16 Gy) →TL 160◦C (S1) → Pre-heat (220◦C=300 s) → Test dose(0:16 Gy) → TL 160◦C (S2) → OSL 100 s (L2) →Normalisation dose (10 Gy)→ Pre-heat (220◦C=300 s)→Test dose (0:16 Gy)→ TL 160◦C (S3)→ OSL 100 s (L3)
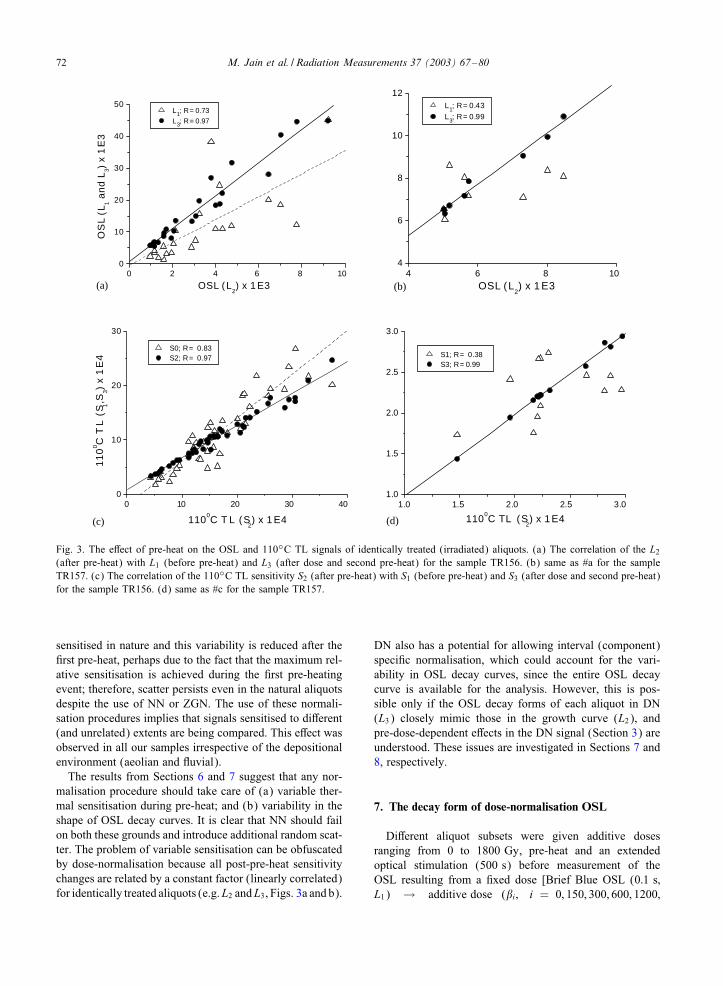
The comparison of OSL (Li) is shown in Figs. 3a and b.The correlation between L2 and L3 is good (R=0:97–0.99),while that between L2 and L1 is relatively poor (0.43–0.73).Since both the dose and pre-heat treatments are identical forthese aliquots, these di2erences must arise from changes inthe recombination probability (i.e. the sensitivity). In princi-ple, this trend could also arise from possible partial bleach-ing during sampling and/or laboratory treatments, but this isconsidered very unlikely. On the other hand, if the changesoccur due to changes in the recombination probability, thensimilar changes are likely to be observed in the behaviour ofthe 110◦C peak integrals, since it is known that the 110◦Cpeak often undergoes sensitivity changes similar to those ofthe OSL signal (Wintle and Murray, 1999). This was con-9rmed in our samples by repeated measurements of 110◦Cpeak and OSL responses to a test dose on the same aliquot.There is a linear correlation between the OSL and TL, withthe best-9t line passing through the origin (Fig. 4); hence itis reasonable to use 110◦C TL peak for monitoring the OSLsensitivity changes in these samples.
A comparison of the 110◦C TL peak measurementsbefore and after the 9rst pre-heat shows that there is apoor correlation between S1 and S2 and a good correlationbetween S2 and S3 (Figs. 3c and d); this is similar to theresults in Fig. 3a and b con9rms that the poor correlationbetween the OSL signals (L1 and L2, Fig. 3a and b) is dueto complex sensitivity changes during the pre-heat.
These results imply that the relative extent of thermal sen-sitisation during pre-heat is not identical for each aliquot;however, any further post-pre-heat thermal treatment sen-sitises them by a constant factor (linear sensitisation), thusgiving a good correlation between L2 and L3 or S2 and S3.This suggests that di2erent grains in a sample are variably
72 M. Jain et al. / Radiation Measurements 37 (2003) 67–80
0 2 4 6 8 100
10
20
30
40
50O
SL
(L1 a
nd
L3)
x 1
E3
OSL (L2) x 1 E3
L1; R= 0.73
L3; R= 0.97
0 10 20 30 400
10
20
30
11
00 C
TL
(S 1,S
3) x
1E
4
1100C T L (S
2) x 1 E4
S0; R= 0.83 S2; R= 0.97
1.0 1.5 2.0 2.5 3.01.0
1.5
2.0
2.5
3.0
1100C TL (S
2) x 1 E4
S1; R= 0.38 S3; R= 0.99
4 6 8 104
6
8
10
12
OSL (L2) x 1 E3
L1; R= 0.43
L3; R= 0.99
(a)
(c) (d)
(b)
Fig. 3. The e2ect of pre-heat on the OSL and 110◦C TL signals of identically treated (irradiated) aliquots. (a) The correlation of the L2(after pre-heat) with L1 (before pre-heat) and L3 (after dose and second pre-heat) for the sample TR156. (b) same as #a for the sampleTR157. (c) The correlation of the 110◦C TL sensitivity S2 (after pre-heat) with S1 (before pre-heat) and S3 (after dose and second pre-heat)for the sample TR156. (d) same as #c for the sample TR157.
sensitised in nature and this variability is reduced after the9rst pre-heat, perhaps due to the fact that the maximum rel-ative sensitisation is achieved during the 9rst pre-heatingevent; therefore, scatter persists even in the natural aliquotsdespite the use of NN or ZGN. The use of these normali-sation procedures implies that signals sensitised to di2erent(and unrelated) extents are being compared. This e2ect wasobserved in all our samples irrespective of the depositionalenvironment (aeolian and >uvial).
The results from Sections 6 and 7 suggest that any nor-malisation procedure should take care of (a) variable ther-mal sensitisation during pre-heat; and (b) variability in theshape of OSL decay curves. It is clear that NN should failon both these grounds and introduce additional random scat-ter. The problem of variable sensitisation can be obfuscatedby dose-normalisation because all post-pre-heat sensitivitychanges are related by a constant factor (linearly correlated)for identically treated aliquots (e.g.L2 andL3, Figs. 3a and b).
DN also has a potential for allowing interval (component)speci9c normalisation, which could account for the vari-ability in OSL decay curves, since the entire OSL decaycurve is available for the analysis. However, this is pos-sible only if the OSL decay forms of each aliquot in DN(L3) closely mimic those in the growth curve (L2), andpre-dose-dependent e2ects in the DN signal (Section 3) areunderstood. These issues are investigated in Sections 7 and8, respectively.
7. The decay form of dose-normalisation OSL
Di2erent aliquot subsets were given additive dosesranging from 0 to 1800 Gy, pre-heat and an extendedoptical stimulation (500 s) before measurement of theOSL resulting from a 9xed dose [Brief Blue OSL (0:1 s;L1) → additive dose (�i; i = 0; 150; 300; 600; 1200;
M. Jain et al. / Radiation Measurements 37 (2003) 67–80 73
0 20 40 60 80 100
0
10
20
30
40
50
OS
L (
a.u
)
1100 T L Peak (a.u)
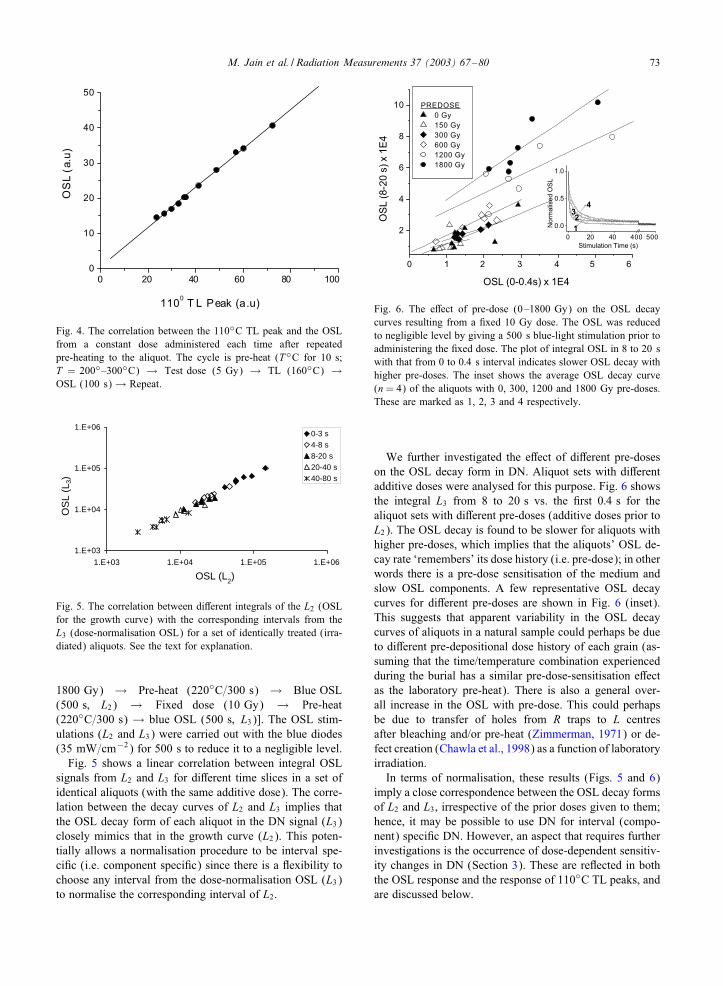
Fig. 4. The correlation between the 110◦C TL peak and the OSLfrom a constant dose administered each time after repeatedpre-heating to the aliquot. The cycle is pre-heat (T◦C for 10 s;T = 200◦–300◦C) → Test dose (5 Gy) → TL (160◦C) →OSL (100 s) → Repeat.
1.E+03
1.E+04
1.E+05
1.E+06
1.E+03 1.E+04 1.E+05 1.E+06
OSL (L2)
OS
L (L
3)
0-3 s4-8 s8-20 s20-40 s40-80 s
Fig. 5. The correlation between di2erent integrals of the L2 (OSLfor the growth curve) with the corresponding intervals from theL3 (dose-normalisation OSL) for a set of identically treated (irra-diated) aliquots. See the text for explanation.
1800 Gy) → Pre-heat (220◦C=300 s) → Blue OSL(500 s; L2) → Fixed dose (10 Gy) → Pre-heat(220◦C=300 s) → blue OSL (500 s; L3)]. The OSL stim-ulations (L2 and L3) were carried out with the blue diodes(35 mW=cm−2) for 500 s to reduce it to a negligible level.
Fig. 5 shows a linear correlation between integral OSLsignals from L2 and L3 for di2erent time slices in a set ofidentical aliquots (with the same additive dose). The corre-lation between the decay curves of L2 and L3 implies thatthe OSL decay form of each aliquot in the DN signal (L3)closely mimics that in the growth curve (L2). This poten-tially allows a normalisation procedure to be interval spe-ci9c (i.e. component speci9c) since there is a >exibility tochoose any interval from the dose-normalisation OSL (L3)to normalise the corresponding interval of L2.
0 1 2 3 4 5 6
2
4
6
8
10
OS
L (
8-2
0 s
) x 1
E4
OSL (0-0.4s) x 1E4
PREDOSE
0 Gy
150 Gy
300 Gy
600 Gy
1200 Gy
1800 Gy
0 20 40 400 500
0.0
0.5
1.0
32
1
4
No
rma
lise
d O
SL
Stimulation Time (s)
Fig. 6. The e2ect of pre-dose (0–1800 Gy) on the OSL decaycurves resulting from a 9xed 10 Gy dose. The OSL was reducedto negligible level by giving a 500 s blue-light stimulation prior toadministering the 9xed dose. The plot of integral OSL in 8 to 20 swith that from 0 to 0:4 s interval indicates slower OSL decay withhigher pre-doses. The inset shows the average OSL decay curve(n= 4) of the aliquots with 0, 300, 1200 and 1800 Gy pre-doses.These are marked as 1, 2, 3 and 4 respectively.
We further investigated the e2ect of di2erent pre-doseson the OSL decay form in DN. Aliquot sets with di2erentadditive doses were analysed for this purpose. Fig. 6 showsthe integral L3 from 8 to 20 s vs. the 9rst 0:4 s for thealiquot sets with di2erent pre-doses (additive doses prior toL2). The OSL decay is found to be slower for aliquots withhigher pre-doses, which implies that the aliquots’ OSL de-cay rate ‘remembers’ its dose history (i.e. pre-dose); in otherwords there is a pre-dose sensitisation of the medium andslow OSL components. A few representative OSL decaycurves for di2erent pre-doses are shown in Fig. 6 (inset).This suggests that apparent variability in the OSL decaycurves of aliquots in a natural sample could perhaps be dueto di2erent pre-depositional dose history of each grain (as-suming that the time/temperature combination experiencedduring the burial has a similar pre-dose-sensitisation e2ectas the laboratory pre-heat). There is also a general over-all increase in the OSL with pre-dose. This could perhapsbe due to transfer of holes from R traps to L centresafter bleaching and/or pre-heat (Zimmerman, 1971) or de-fect creation (Chawla et al., 1998) as a function of laboratoryirradiation.
In terms of normalisation, these results (Figs. 5 and 6)imply a close correspondence between the OSL decay formsof L2 and L3, irrespective of the prior doses given to them;hence, it may be possible to use DN for interval (compo-nent) speci9c DN. However, an aspect that requires furtherinvestigations is the occurrence of dose-dependent sensitiv-ity changes in DN (Section 3). These are re>ected in boththe OSL response and the response of 110◦C TL peaks, andare discussed below.

74 M. Jain et al. / Radiation Measurements 37 (2003) 67–80
8. Dose-dependent sensitivity changes in DN
The e2ect of pre-dose on the DN values (L3) can be seenas an increase in the luminescence output of the aliquotsas a function of initial additive/regeneration dose givento them (Fig. 7), and has been observed previously (e.g.Stokes, 1994a; Rhodes, 1990). It is important to determinethe timing of these sensitivity changes for the accuracy ofthe De estimates and hence the development of a viablenormalisation protocol. Experiments were carried out inthe manner outlined in Table 1 to track dose-dependent
0 200 400 600 800 1000 1200
0.5
1.0
1.5
2.0
2.5
3.0
Inte
gra
l OS
L (
0.4
s)
X 1
E4
Predose (Gy)
Fig. 7. The (pre) dose-dependent sensitivity changes in thedose-normalisation (DN) OSL.
Table 1A general sequence followed for monitoring the sensitivity changes.The di2erent additive/regeneration doses (Di) at step 5 are givento di2erent subsets containing at least four aliquots each
1 Brief or extended Blue—OSL (L1)2 Delay (10 h)3 Test dose (2 Gy)4 TL 180◦C (S1)5 Regeneration doses (Di; i = 0–2000 Gy)6 Pre-heat (220◦C=300 s)7 Test dose (2 Gy)8 TL 180◦C (S2)9 Blue—OSL (L2)
10 Test dose (2 Gy)11 TL 180◦C (S3)12 Blue—OSL (T1)13 Fixed normalisation dose (10 Gy)14 Cut-heat-220◦C (or pre-heat 220◦C for 300 s)15 Test dose (2 Gy)16 TL 180◦C (S4)17 Blue—OSL (L3)18 Test dose (2 Gy)19 TL 180◦C (S5)20 Blue—OSL (T2)
sensitivity changes during a routine multiple-aliquot proto-col. The aliquots were heated to 180◦C (cut-heat) to measurethe test-dose TL (S1–S5) and OSL (T1 and T2) (Murray andWintle, 2000). This temperature was chosen to avoid anysensitivity changes. Note that one experimental set was car-ried out with a pre-heat of 220◦C for 300 s, while the otherinvolved only heating to 220◦C and cooling down immedi-ately (cut-heat) after the normalisation dose (Table 1, Step16). The results are described below.
8.1. Test dose OSL (T1 and T2)
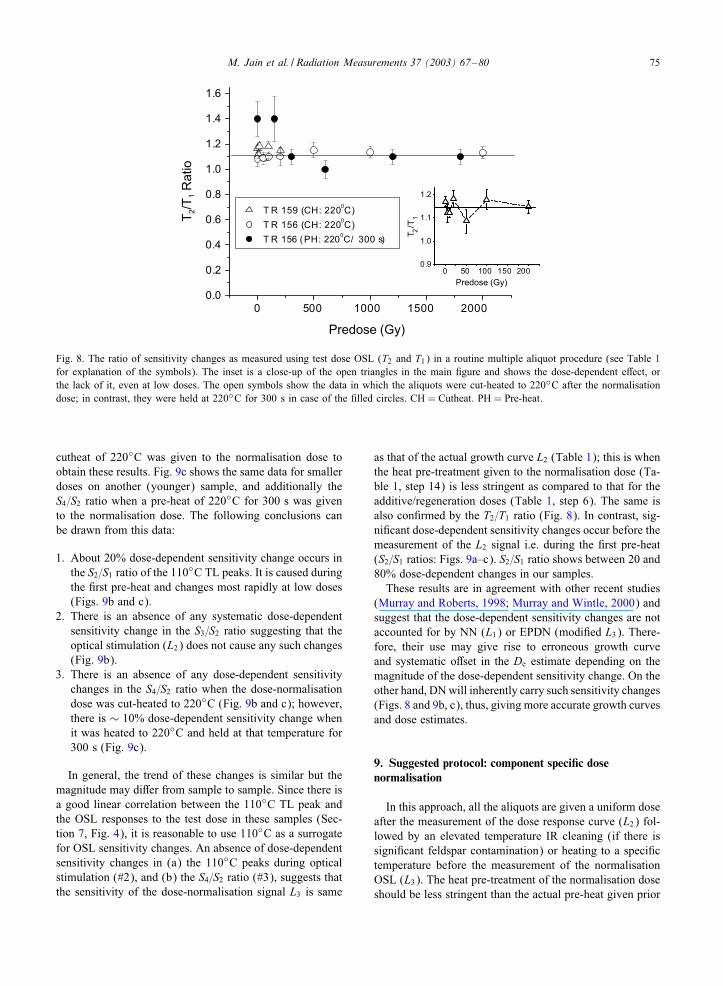
Fig. 8 shows the ratio of test dose OSL signals T1 and T2
immediately following the measurement of L2 (growth curveOSL) and L3 (dose-normalisation OSL), respectively. Theopen symbols (circles and triangles) show a constant ratioindicating an absence of dose-dependent sensitivity changesin T2 with respect to T1. The experiment was carried out ontwo di2erent samples with an order of magnitude di2erencein the added doses (Table 1, step 5). The ratio of T2=T1
however remains constant irrespective of the magnitude ofthe added doses when a cutheat of 220◦C was used after thenormalisation dose (Fig. 8; see the inset for smaller doses).
However, in case where a pre-heat of 220◦C for 300 s wasgiven to the normalisation dose (step 14), i.e. it was given thesame pre-heat treatment as the additive/regeneration doses(step 6), a 30% dose-dependent sensitivity change is wit-nessed at low doses (Fig. 8). It however reaches a constantvalue after ¿ 100 Gy applied dose. These results suggestthat there are no dose-dependent sensitivity changes betweenL2 and L3 when the pre-heat treatment to the normalisationdose is less stringent.
Since it is unlikely that there are sensitivity changes dur-ing the cutheat given to normalisation dose (Murray andWintle, 2000), the dose-dependent sensitivity changescommonly witnessed in the DN values (Fig. 7) must oc-cur during the 9rst pre-heat (assuming that there are nodose-dependent sensitivity changes due to the measurementof OSL, L2, itself). This was tested further by tracking thechanges in 110◦C TL peak after each pre-heat and OSL mea-surement (S1–S5). As shown earlier, the 110◦C TL peak is agood surrogate for OSL sensitivity changes in these samples(Fig. 4).
8.2. Monitoring of 110◦C TL peaks
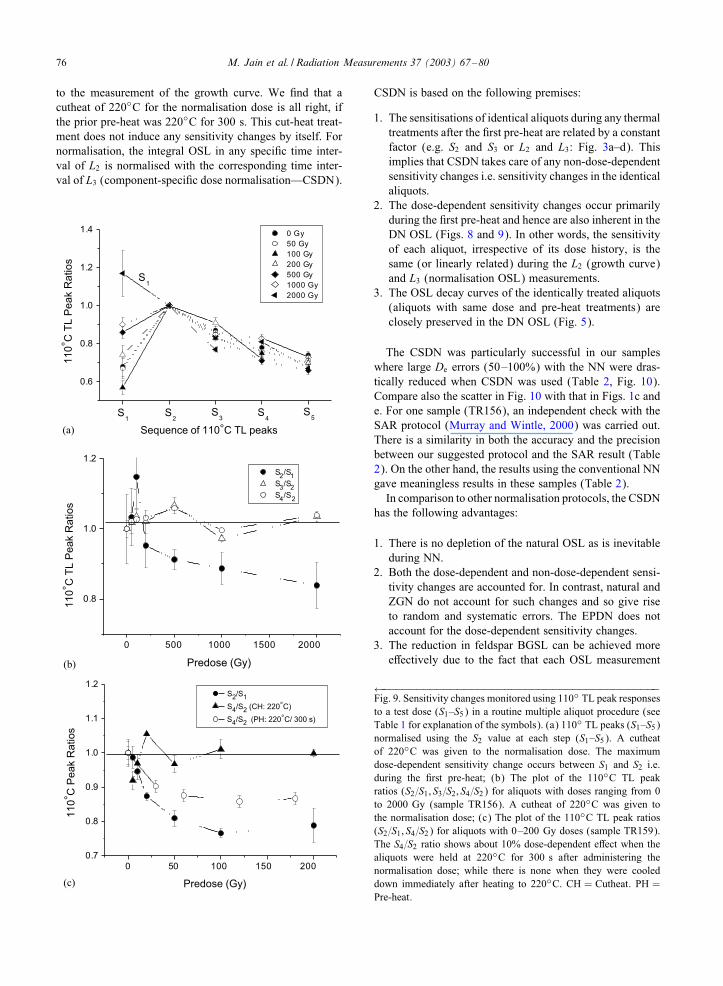
The changes in the 110◦C TL peak measured at vari-ous stages are summarised in Fig. 9a. All the values arenormalised to S2. A cut-heat of 220◦C was given to thenormalisation dose. As conjectured above, it is clear thatdose-dependent sensitivity changes occur between S1 and S2
i.e. during the 9rst pre-heat (Fig. 9a).Fig. 9b shows di2erent ratios of 110◦C peaks: S2=S1
[bracketing the 9rst pre-heat, (Step 5)], S3=S2 [bracketingthe L2 (step 9)] and S4=S2 [before L2 (step 9) and before L3
(step17)]; the step numbers given as per Table 1. Again a
M. Jain et al. / Radiation Measurements 37 (2003) 67–80 75
0 500 1000 1500 2000
0.0
0.2
0.4
0.6
0.8
1.0
1.2
1.4
1.6
T2/T
1 R
atio
Predose (Gy)
T R 159 (CH: 2200C)
T R 156 (CH: 2200C)
T R 156 (PH: 2200C/ 300 s)
0 50 100 150 2000.9
1.0
1.1
1.2
T2/T
1
Predose (Gy)
Fig. 8. The ratio of sensitivity changes as measured using test dose OSL (T2 and T1) in a routine multiple aliquot procedure (see Table 1for explanation of the symbols). The inset is a close-up of the open triangles in the main 9gure and shows the dose-dependent e2ect, orthe lack of it, even at low doses. The open symbols show the data in which the aliquots were cut-heated to 220◦C after the normalisationdose; in contrast, they were held at 220◦C for 300 s in case of the 9lled circles. CH = Cutheat: PH = Pre-heat.
cutheat of 220◦C was given to the normalisation dose toobtain these results. Fig. 9c shows the same data for smallerdoses on another (younger) sample, and additionally theS4=S2 ratio when a pre-heat of 220◦C for 300 s was givento the normalisation dose. The following conclusions canbe drawn from this data:
1. About 20% dose-dependent sensitivity change occurs inthe S2=S1 ratio of the 110◦C TL peaks. It is caused duringthe 9rst pre-heat and changes most rapidly at low doses(Figs. 9b and c).
2. There is an absence of any systematic dose-dependentsensitivity change in the S3=S2 ratio suggesting that theoptical stimulation (L2) does not cause any such changes(Fig. 9b).
3. There is an absence of any dose-dependent sensitivitychanges in the S4=S2 ratio when the dose-normalisationdose was cut-heated to 220◦C (Fig. 9b and c); however,there is ∼ 10% dose-dependent sensitivity change whenit was heated to 220◦C and held at that temperature for300 s (Fig. 9c).
In general, the trend of these changes is similar but themagnitude may di2er from sample to sample. Since there isa good linear correlation between the 110◦C TL peak andthe OSL responses to the test dose in these samples (Sec-tion 7, Fig. 4), it is reasonable to use 110◦C as a surrogatefor OSL sensitivity changes. An absence of dose-dependentsensitivity changes in (a) the 110◦C peaks during opticalstimulation (#2), and (b) the S4=S2 ratio (#3), suggests thatthe sensitivity of the dose-normalisation signal L3 is same
as that of the actual growth curve L2 (Table 1); this is whenthe heat pre-treatment given to the normalisation dose (Ta-ble 1, step 14) is less stringent as compared to that for theadditive/regeneration doses (Table 1, step 6). The same isalso con9rmed by the T2=T1 ratio (Fig. 8). In contrast, sig-ni9cant dose-dependent sensitivity changes occur before themeasurement of the L2 signal i.e. during the 9rst pre-heat(S2=S1 ratios: Figs. 9a–c). S2=S1 ratio shows between 20 and80% dose-dependent changes in our samples.
These results are in agreement with other recent studies(Murray and Roberts, 1998; Murray and Wintle, 2000) andsuggest that the dose-dependent sensitivity changes are notaccounted for by NN (L1) or EPDN (modi9ed L3). There-fore, their use may give rise to erroneous growth curveand systematic o2set in the De estimate depending on themagnitude of the dose-dependent sensitivity change. On theother hand, DN will inherently carry such sensitivity changes(Figs. 8 and 9b, c), thus, giving more accurate growth curvesand dose estimates.
9. Suggested protocol: component speci0c dosenormalisation
In this approach, all the aliquots are given a uniform doseafter the measurement of the dose response curve (L2) fol-lowed by an elevated temperature IR cleaning (if there issigni9cant feldspar contamination) or heating to a speci9ctemperature before the measurement of the normalisationOSL (L3). The heat pre-treatment of the normalisation doseshould be less stringent than the actual pre-heat given prior
76 M. Jain et al. / Radiation Measurements 37 (2003) 67–80
to the measurement of the growth curve. We 9nd that acutheat of 220◦C for the normalisation dose is all right, ifthe prior pre-heat was 220◦C for 300 s. This cut-heat treat-ment does not induce any sensitivity changes by itself. Fornormalisation, the integral OSL in any speci9c time inter-val of L2 is normalised with the corresponding time inter-val of L3 (component-speci9c dose normalisation—CSDN).
0 50 100 150 200
0.7
0.8
0.9
1.0
1.1
1.2
11
0° C
Peak R
atios
Predose (Gy)
S2/S1
S4/S2 (CH: 220°C)
S4/S2 (PH: 220°C/ 300 s)
0 500 1000 1500 2000
0.8
1.0
1.2
11
0° C
TL P
eak R
atios
Predose (Gy)
S2/S
1
S3/S
2
S4/S
2
S1 S2 S3 S4 S5
0.6
0.8
1.0
1.2
1.4
S5
S4
S1
S3
S2
S1
11
0° C
TL P
eak R
atios
Sequence of 110°C TL peaks
0 Gy
50 Gy
100 Gy
200 Gy
500 Gy
1000 Gy
2000 Gy
(a)
(c)
(b)
CSDN is based on the following premises:
1. The sensitisations of identical aliquots during any thermaltreatments after the 9rst pre-heat are related by a constantfactor (e.g. S2 and S3 or L2 and L3: Fig. 3a–d). Thisimplies that CSDN takes care of any non-dose-dependentsensitivity changes i.e. sensitivity changes in the identicalaliquots.
2. The dose-dependent sensitivity changes occur primarilyduring the 9rst pre-heat and hence are also inherent in theDN OSL (Figs. 8 and 9). In other words, the sensitivityof each aliquot, irrespective of its dose history, is thesame (or linearly related) during the L2 (growth curve)and L3 (normalisation OSL) measurements.
3. The OSL decay curves of the identically treated aliquots(aliquots with same dose and pre-heat treatments) areclosely preserved in the DN OSL (Fig. 5).
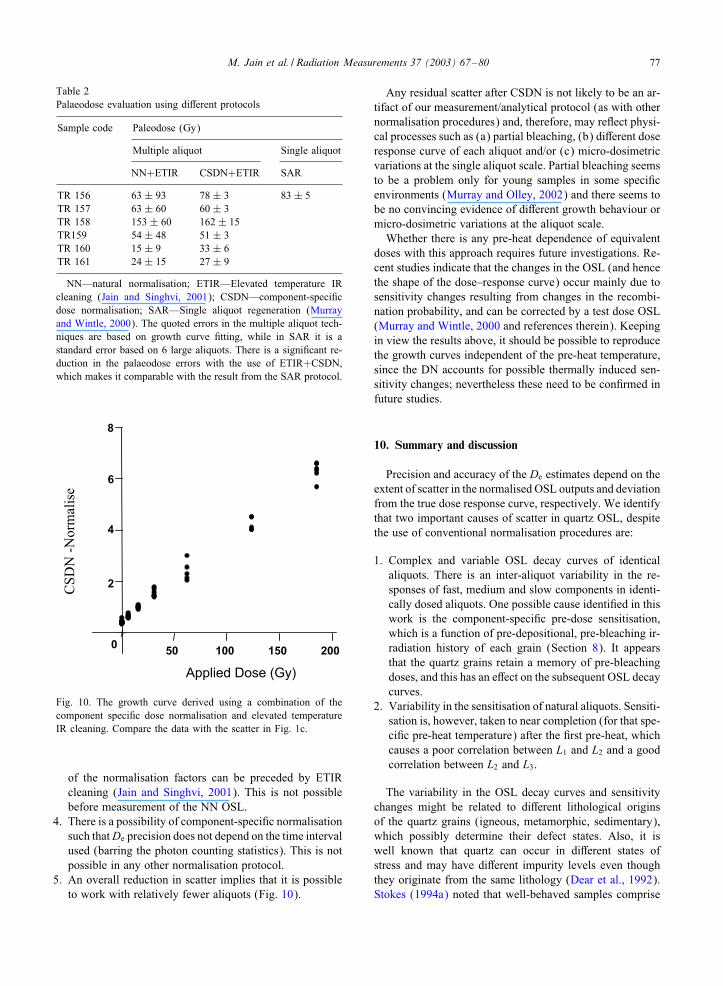
The CSDN was particularly successful in our sampleswhere large De errors (50–100%) with the NN were dras-tically reduced when CSDN was used (Table 2, Fig. 10).Compare also the scatter in Fig. 10 with that in Figs. 1c ande. For one sample (TR156), an independent check with theSAR protocol (Murray and Wintle, 2000) was carried out.There is a similarity in both the accuracy and the precisionbetween our suggested protocol and the SAR result (Table2). On the other hand, the results using the conventional NNgave meaningless results in these samples (Table 2).
In comparison to other normalisation protocols, the CSDNhas the following advantages:
1. There is no depletion of the natural OSL as is inevitableduring NN.
2. Both the dose-dependent and non-dose-dependent sensi-tivity changes are accounted for. In contrast, natural andZGN do not account for such changes and so give riseto random and systematic errors. The EPDN does notaccount for the dose-dependent sensitivity changes.
3. The reduction in feldspar BGSL can be achieved moree2ectively due to the fact that each OSL measurement
←−−−−−−−−−−−−−−−−−−−−−−−−−−−−−−−−−−−−−−−−−Fig. 9. Sensitivity changes monitored using 110◦ TL peak responsesto a test dose (S1–S5) in a routine multiple aliquot procedure (seeTable 1 for explanation of the symbols). (a) 110◦ TL peaks (S1–S5)normalised using the S2 value at each step (S1–S5). A cutheatof 220◦C was given to the normalisation dose. The maximumdose-dependent sensitivity change occurs between S1 and S2 i.e.during the 9rst pre-heat; (b) The plot of the 110◦C TL peakratios (S2=S1; S3=S2; S4=S2) for aliquots with doses ranging from 0to 2000 Gy (sample TR156). A cutheat of 220◦C was given tothe normalisation dose; (c) The plot of the 110◦C TL peak ratios(S2=S1; S4=S2) for aliquots with 0–200 Gy doses (sample TR159).The S4=S2 ratio shows about 10% dose-dependent e2ect when thealiquots were held at 220◦C for 300 s after administering thenormalisation dose; while there is none when they were cooleddown immediately after heating to 220◦C. CH = Cutheat. PH =Pre-heat.
M. Jain et al. / Radiation Measurements 37 (2003) 67–80 77
Table 2Palaeodose evaluation using di2erent protocols
Sample code Paleodose (Gy)
Multiple aliquot Single aliquot
NN+ETIR CSDN+ETIR SAR
TR 156 63 ± 93 78 ± 3 83 ± 5TR 157 63 ± 60 60 ± 3TR 158 153 ± 60 162 ± 15TR159 54 ± 48 51 ± 3TR 160 15 ± 9 33 ± 6TR 161 24 ± 15 27 ± 9
NN—natural normalisation; ETIR—Elevated temperature IRcleaning (Jain and Singhvi, 2001); CSDN—component-speci9cdose normalisation; SAR—Single aliquot regeneration (Murrayand Wintle, 2000). The quoted errors in the multiple aliquot tech-niques are based on growth curve 9tting, while in SAR it is astandard error based on 6 large aliquots. There is a signi9cant re-duction in the palaeodose errors with the use of ETIR+CSDN,which makes it comparable with the result from the SAR protocol.
2
4
6
8
050 100 150 200
Applied Dose (Gy)
CS
DN
-N
orm
alis
e
Fig. 10. The growth curve derived using a combination of thecomponent speci9c dose normalisation and elevated temperatureIR cleaning. Compare the data with the scatter in Fig. 1c.
of the normalisation factors can be preceded by ETIRcleaning (Jain and Singhvi, 2001). This is not possiblebefore measurement of the NN OSL.
4. There is a possibility of component-speci9c normalisationsuch thatDe precision does not depend on the time intervalused (barring the photon counting statistics). This is notpossible in any other normalisation protocol.
5. An overall reduction in scatter implies that it is possibleto work with relatively fewer aliquots (Fig. 10).
Any residual scatter after CSDN is not likely to be an ar-tifact of our measurement/analytical protocol (as with othernormalisation procedures) and, therefore, may re>ect physi-cal processes such as (a) partial bleaching, (b) di2erent doseresponse curve of each aliquot and/or (c) micro-dosimetricvariations at the single aliquot scale. Partial bleaching seemsto be a problem only for young samples in some speci9cenvironments (Murray and Olley, 2002) and there seems tobe no convincing evidence of di2erent growth behaviour ormicro-dosimetric variations at the aliquot scale.
Whether there is any pre-heat dependence of equivalentdoses with this approach requires future investigations. Re-cent studies indicate that the changes in the OSL (and hencethe shape of the dose–response curve) occur mainly due tosensitivity changes resulting from changes in the recombi-nation probability, and can be corrected by a test dose OSL(Murray and Wintle, 2000 and references therein). Keepingin view the results above, it should be possible to reproducethe growth curves independent of the pre-heat temperature,since the DN accounts for possible thermally induced sen-sitivity changes; nevertheless these need to be con9rmed infuture studies.
10. Summary and discussion
Precision and accuracy of the De estimates depend on theextent of scatter in the normalised OSL outputs and deviationfrom the true dose response curve, respectively. We identifythat two important causes of scatter in quartz OSL, despitethe use of conventional normalisation procedures are:
1. Complex and variable OSL decay curves of identicalaliquots. There is an inter-aliquot variability in the re-sponses of fast, medium and slow components in identi-cally dosed aliquots. One possible cause identi9ed in thiswork is the component-speci9c pre-dose sensitisation,which is a function of pre-depositional, pre-bleaching ir-radiation history of each grain (Section 8). It appearsthat the quartz grains retain a memory of pre-bleachingdoses, and this has an e2ect on the subsequent OSL decaycurves.
2. Variability in the sensitisation of natural aliquots. Sensiti-sation is, however, taken to near completion (for that spe-ci9c pre-heat temperature) after the 9rst pre-heat, whichcauses a poor correlation between L1 and L2 and a goodcorrelation between L2 and L3.
The variability in the OSL decay curves and sensitivitychanges might be related to di2erent lithological originsof the quartz grains (igneous, metamorphic, sedimentary),which possibly determine their defect states. Also, it iswell known that quartz can occur in di2erent states ofstress and may have di2erent impurity levels even thoughthey originate from the same lithology (Dear et al., 1992).Stokes (1994a) noted that well-behaved samples comprise
78 M. Jain et al. / Radiation Measurements 37 (2003) 67–80
relatively inclusion free, single grained quartz. Samplescontaining composite quartz had a typically scattered OSLwhen NN was used. In either case, there was a reduction inscatter with the use of DN; however, no reason was givenfor this e2ect. We 9nd that this behaviour occurs due to ran-dom changes in the sensitivity of identical aliquots after the9rst pre-heat. This is consistent with the fact that sensitisa-tion of quartz may be partially complete or even reversiblein the natural sample (Murray and Roberts, 1998; Wintleand Murray, 1999). It is possible that in the natural sys-tem with di2erent origins and structural defects of quartzgrains, each grain achieves its own equilibrium sensitiv-ity; but during the pre-heat, a completion of sensitisationof the dominant component occurs (e.g. Wintle and Mur-ray, 1999). This causes any post-9rst-pre-heat sensitivitymeasurements to be in good agreement.
The other question that merits attention is the shape of thedose–response curve, which has a bearing on the accuracy ofthe palaeodose estimates. In the earlier work, a use of EPDNhas been suggested to circumvent the dose-dependent sen-sitivity changes in the DN values (Stokes, 1994a; Gallowayand Hong, 1996). EPDN claims to avoid such an e2ect byequalising the previous doses and consequently the sensitiv-ity of each aliquot; in this manner it becomes similar to NN.The need for giving a forced correction to the DN measure-ments stems from a largely untested assumption that thereare no dose-dependent sensitivity changes before measure-ment of the growth curve (L2, Table 1), and that they occurduring or after the optical stimulation L2.
The choice between DN and EPDN (or NN) must, how-ever, depend on the timing and the nature of OSL sensitivitychanges. Stokes (1994b) found that OSL sensitivity changesoccurred after optical bleaching and were non-synchronouswith the changes in the 110◦C TL peak. This appears tobe rare and in general has not been validated in the laterstudies. A physical mechanism for such behaviour was notprovided. On the other hand, a common mechanism of lu-minescence production between 110◦C TL peak and OSLhas, however, been suggested frequently (Aitken and Smith,1988; Stoneham and Stokes, 1991; Wintle and Murray,1999; Murray and Roberts, 1998) and has been supportedfrom the spectral studies (Huntley et al., 1991; Franklinet al., 1995). In our samples this is demonstrated as a linearcorrelation between the two (Fig. 4).
With the use of 110◦C TL peaks, we demonstrate thatthe dose-dependent sensitivity changes occur during the 9rstpre-heat i.e. prior to the OSL stimulation (L2: the growthcurve). Hence the natural, zero-glow and equal pre-dose nor-malisations do not account for these changes and may leadto erroneous dose response curves. In the case of CSDN,these sensitivity changes are inherent and hence this nor-malisation protocols should lead to a more accurate growthcurve (Section 9).
The aspect of variability in physical characteristics ofquartz grains is adequately covered in the new suggestednormalisation protocol—CSDN. It promises a substantial
improvement in both the scatter (precision) and the truedose–response curve (accuracy) of the De estimates whenmultiple aliquot methods are employed.
An interesting o2shoot of this work is the possible use of110◦C TL peak as an indicator of partial bleaching since itshows signi9cant dose-dependent sensitisation at low doses(S2=S1 or S4=S2 ratio: Fig. 9b and c). In case of well-bleachedsamples one would expect a relatively good clustering ofthese ratios, whereas in case of heterogeneously bleachedsamples a spectrum of ratios depending on di2erences inthe doses of well-bleached and poorly bleached grains isexpected. This requires future investigations.
11. Conclusions
This study enables following conclusions:
1. NN has limitations due to dose-dependent andnon-dose-dependent sensitivity changes that may occurduring the dose-measurement protocol, and variability inthe OSL decay forms of the quartz grains (if the entireOSL curve is used for De calculation). Further, it maylead to a 9nite depletion in the natural OSL.
2. In a multiple component OSL, the OSL decay curvesof identically treated aliquots are variable. One possiblecause of this variability can be the pre-bleaching dosehistory (Fig. 6; provided our lab experiment can beextrapolated to the natural conditions). The NN givesDe(t) plateaus with large errors since it compares dif-ferent trap populations (e.g. fast with medium and slowcomponents), the proportions of which vary from onealiquot to another.
3. Signi9cant non-dose-dependent sensitivity changes occurduring the 9rst pre-heat. This causes a poor correlationbetween the sensitivities, before and after the pre-heat,of identical aliquots. Consequently, an intra-dose aliquotscatter exists in the growth curve even when the dominantfast component OSL is used for analysis.
4. A signi9cant dose-dependent sensitivity change, that is,especially important at low doses, occurs during the 9rstpre-heat. This may cause errors in the shape of the growthcurve, leading to inaccurate De estimates, when conven-tional normalisation techniques (NN, ZGN, EPDN) areused. The deviation will be controlled by the overall mag-nitude of the sensitivity change.
5. A new normalisation protocol named as ‘component-speci9c dose normalisation’ (CSDN) is suggested.This takes care of the non-identical luminescence de-cay behaviour, and both the dose-dependent and thenon-dose-dependent thermal sensitisations during thepre-heat into account. A combined use of Elevated tem-perature IR cleaning (ETIR) and CSDN increased thepalaeodose precision from upto 100% to 4% in our sam-ples and made them comparable with that obtained fromSAR technique.

M. Jain et al. / Radiation Measurements 37 (2003) 67–80 79
We speculate that this protocol may be more universallyapplicable compared to the NN since it takes into consider-ation a greater variety of e2ects. The future e2orts shouldinvestigate the e2ect of di2erent pre-heats on the shape ofthe dose–response curve.
Acknowledgements
MJ acknowledges the University Grants Commission(India), the Department of Geology (Delhi University) andthe Physical Research Laboratory (Ahmedabad) for sup-porting this work during his Ph. D (1997–1998). AKSthanks the Department of Science & Technology, Govt.of India, for a 9nancial support for this work through theproject ESS/A3-08/92-A.
References
Aitken, M.J., Smith, B.W., 1988. Optical dating: recuperation afterbleaching. Quat. Sci. Rev. 7, 387–394.
Bailey, R.M., Smith, B.W., Rhodes, E.J., 1997. Partial bleachingand the decay curve characteristics of quartz OSL. Radiat. Meas.27, 123–136.
Chawla, S, Gundurao, T.K., Singhvi, A.K., 1998. Quartzthermoluminescence: dose and dose rate e2ects and theirimplications. Radiat. Meas. 29 (1), 53–63.
Dear, W.A., Howie, R.A., Zussman, J., 1992. An Introduction tothe Rock Forming Minerals. Longman Scienti9c and Technical,England.
Duller, G.A.T., BHtter-Jensen, L., Murray, A.S., 2000. Opticaldating of single sand sized grains of quartz: sources ofvariability. Radiat. Meas. 32, 453–57.
English, P., Spooner, N.A., Chappell, J., Questiaux, D.G., Hill,N.G., 2001. Lake Lewis basin, central Australia: environmentalevolution and OSL chronology. Quat. Int. 83–85, 81–101.
Felix, C., Singhvi, A.K., 1997. Study of non-linear luminescence-dose growth curves for estimation of palaeodose in luminescencedating: results of Monte-Carlo simulations. Radiat. Meas. 27,599–607.
Franklin, A.D., Prescott, J.R., Schole9eld, R.B., 1995. Themechanism of thermoluminescence in Australian sedimentaryquartz. J. Lumin. 63, 317–326.
Galloway, R.B., Hong, D.G., 1996. Concerning the normalisationof additive-dose optically stimulated luminescence data fromquartz. Ancient TL 14 (2), 1–5.
Huntley, D.J., Berger, G.W., 1995. Scatter in luminescence datafor optical dating—some models. Ancient TL 13 (1), 5–9.
Huntley, D.J., Godfrey-Smith, D.I., Haskell, E.H., 1991. Lightinduced emission spectra from some quartz and feldspars. Nucl.tracks Radiat. Meas. 18, 127–131.
Huntley, D.J., Short, M.A., Dunphy, K., 1996. Deep traps in quartzand their use for optical dating. Canadian J. Phys. 74, 81–91.
Jain, M., 2000. Stratigraphic development of some exposedQuaternary alluvial sequences in the Thar and its margins:>uvial response to climate change, Western India. Ph. D Thesis,University of Delhi, India, unpublished.
Jain, M., Singhvi, A.K., 1999. Scatter and normalisation in quartzOSL: evaluation of current procedures and development of anew protocol. Ninth International Conference on Luminescenceand Electron Spin Resonance, Rome, Book of Abstracts,83.
Jain, M., Singhvi, A.K., 2001. Limits to depletion of blue–greenlight stimulated luminescence in feldspars: implications forquartz dating. Radiat. Meas. 33, 883–892.
Jain, M., Tandon, S.K., Bhatt, S.C., Singhvi, A.K, Mishra, S., 1999.Alluvial and aeolian sequences along the river Luni, Barmerdistrict: physical stratigraphy and feasibility of luminescencechronology methods. In: Vedic Saraswati, Radhakrishna, B.P.,Merh, S.S. (Eds.), Geological Society of India Memoir 42,273–295.
Lepper, K., Agersnap-Larsen, N., McKeever, S.W.S, 2000.Equivalent dose distribution analysis of Holocene eolian and>uvial quartz sands from central Oklahama. Radiat. Meas. 32,603–608.
Liritzis, I, Galloway, R.B., Hong, D.G., 1997. Single aliquot datingof ceramics by green-light stimulation of quartz. Nucl. Instrum.and Meas. Phys. Res. B 132, 457–467.
Mejdahl, V., 1988. Long term stability of the TL signal in alkalifeldspars. Quat. Sci. Rev. 7, 357–360.
Murray, A.S., Olley, J.M., 2002. Precision and accuracy in theoptically stimulated luminescence dating of sedimentary quartz:a status review. Geochronometria 21, 1–16.
Murray, A.S., Roberts, R.G., 1998. Measurement of equivalentdose in quartz using a regenerative-dose single aliquot protocol.Radiat. Meas. 29, 503–515.
Murray, A.S., Wintle, A.G., 2000. Dating quartz using an improvedsingle-aliquot regenerative-dose (SAR) protocol. Radiat. Meas.32, 57–73.
Ollerhead, J., Huntley, D.J., Nelson, A.R., Kelsey, H.M., 2001.Optical dating of tsunami laid sand from an Oregon coastal lake.Quat. Sci. Rev. 20, 1915–1926.
Perkin, N.K., Rhodes, E.J., 1994. Optical dating of >uvialsediments from Tattershall, UK. Quat. Sci. Rev. (QuaternaryGeochronology) 13, 517–520.
Rhodes, E.J., 1990. Optical dating of quartz from sediments. D.Phil thesis, Oxford University, unpublished.
Short, M.A., Huntley, D.J., 1992. Infra-red stimulation of quartz.Ancient TL 10, 19–21.
Singhvi, A.K., Zimmerman, D.W., 1979. Thermoluminescenceminerals in 9ne grain samples from archaeological ceramics.Archaeometry 21, 73.
Stokes, S., 1992. Optical dating of young (modern) sediments usingquartz: results from a selection of depositional environments.Quat. Sci. Rev. 11, 152–159.
Stokes, S., 1994a. Optical dating of selected Late Quaternaryaeolian sediments from Western United States, D. Phil Thesis,University of Oxford.
Stokes, S., 1994b. The timing of OSL sensitivity changes in naturalquartz. Radiat. Meas. 23, 601–605.
Stoneham, D., Stokes, S., 1991. An investigation of therelationship between the 110◦C TL peak and opticallystimulated luminescence. Nucl. Tracks Radiat. Meas. 18,119–123.
Wallinga, J., Murray, A.S, BHtter-Jensen, L., 2002. Measurementof the dose in quartz in the presence of feldspar contamination.Radiat. Prot. Dosim. 101, 367–370.

80 M. Jain et al. / Radiation Measurements 37 (2003) 67–80
Wintle, A.G., 1973. Anomalous fading of thermoluminescence inmineral samples. Nature 245, 143–144.
Wintle, A.G., Murray, A.S., 1999. Luminescence sensitivitychanges in quartz. Radiat. Meas. 30, 107–118.
Zimmerman, J., 1971. The radiation induced increase in 100◦Cthermoluminescence sensitivity of 9red quartz. J. Phys. C 4,3265–3276.