Vivek Ranjan - BSE
100
ICICI Bank Limited ICICI Bank Towers Bandra-Kurla Complex Mumbai 400 051, India. Tel.: (91-22) 2653 1414 Fax: (91-22) 2653 1122 Website www.icicibank.com CIN.: L65190GJ1994PLC021012 Regd. Office: ICICI Bank Tower, Near Chakli Circle, Old Padra Road Vadodara 390007. India April 23, 2022 BSE Limited Listing Department Phiroze Jeejeebhoy Towers Dalal Street Mumbai 400 001 National Stock Exchange of India Limited Listing Department Exchange Plaza, 5th floor Plot No. C/1, G Block Bandra-Kurla Complex Bandra(East Mumbai 400 051 Dear Madam/Sir, Sub: Earnings call for quarter results ended March 31, 2022 Please find attached the investor presentation and the opening remarks of Q4-2022 Earnings call. The investor presentation has been uploaded on the Bank’s website and opening remarks of the Earnings call will be uploaded later. The same be accessed on the link https://www.icicibank.com/aboutus/qfr.page?#toptitle This is for your records and information. Yours sincerely, For ICICI Bank Limited Vivek Ranjan Chief Manager Encl: As above
-
Upload
khangminh22 -
Category
Documents
-
view
0 -
download
0
Transcript of Vivek Ranjan - BSE

ICICI Bank Limited
ICICI Bank Towers
Bandra-Kurla Complex
Mumbai 400 051, India.
Tel.: (91-22) 2653 1414
Fax: (91-22) 2653 1122
Website www.icicibank.com
CIN.: L65190GJ1994PLC021012
Regd. Office: ICICI Bank Tower,
Near Chakli Circle,
Old Padra Road
Vadodara 390007. India
April 23, 2022
BSE Limited
Listing Department
Phiroze Jeejeebhoy Towers
Dalal Street
Mumbai 400 001
National Stock Exchange of India Limited
Listing Department
Exchange Plaza, 5th floor
Plot No. C/1, G Block
Bandra-Kurla Complex
Bandra(East
Mumbai 400 051
Dear Madam/Sir,
Sub: Earnings call for quarter results ended March 31, 2022
Please find attached the investor presentation and the opening remarks of Q4-2022 Earnings
call. The investor presentation has been uploaded on the Bank’s website and opening remarks
of the Earnings call will be uploaded later. The same be accessed on the link
https://www.icicibank.com/aboutus/qfr.page?#toptitle
This is for your records and information.
Yours sincerely,
For ICICI Bank Limited
Vivek Ranjan
Chief Manager
Encl: As above

Q4-2022:
Performance review
April 23, 2022

2
Certain statements in this release relating to a future period of time (including inter alia concerning our future
business plans or growth prospects) are forward-looking statements intended to qualify for the 'safe harbor'
under applicable securities laws including the US Private Securities Litigation Reform Act of 1995. Such
forward looking statements involve a number of risks and uncertainties that could cause actual results to
differ materially from those in such forward-looking statements. These risks and uncertainties include, but are
not limited to statutory and regulatory changes, international economic and business conditions, political or
economic instability in the jurisdictions where we have operations, increase in non-performing loans,
unanticipated changes in interest rates, foreign exchange rates, equity prices or other rates or prices, our
growth and expansion in business, the adequacy of our allowance for credit losses, the actual growth in
demand for banking products and services, investment income, cash flow projections, our exposure to
market risks, changes in India’s sovereign rating, and the impact of the Covid-19 pandemic which could result
in fewer business opportunities, lower revenues, and an increase in the levels of non-performing assets and
provisions, depending inter alia upon the period of time for which the pandemic extends, the remedial
measures adopted by governments and central banks, and the sustenance of economic activity as well as
other risks detailed in the reports filed by us with the United States Securities and Exchange Commission.
Any forward-looking statements contained herein are based on assumptions that we believe to be
reasonable as of the date of this release. ICICI Bank undertakes no obligation to update forward-looking
statements to reflect events or circumstances after the date thereof. Additional risks that could affect our
future operating results are more fully described in our filings with the United States Securities and Exchange
Commission. These filings are available at www.sec.gov.

Highlights for Q4-2022
3
4
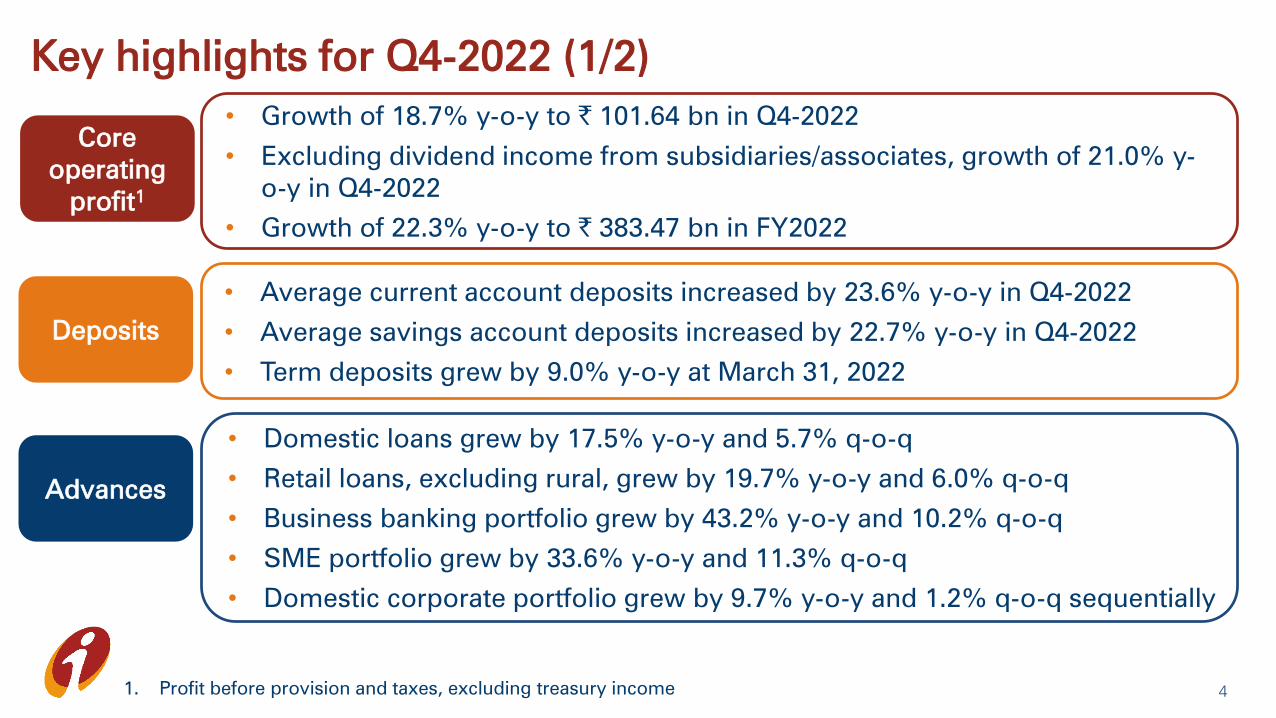
Key highlights for Q4-2022 (1/2)
• Growth of 18.7% y-o-y to ` 101.64 bn in Q4-2022
• Excluding dividend income from subsidiaries/associates, growth of 21.0% y-
o-y in Q4-2022
• Growth of 22.3% y-o-y to ` 383.47 bn in FY2022
• Average current account deposits increased by 23.6% y-o-y in Q4-2022
• Average savings account deposits increased by 22.7% y-o-y in Q4-2022
• Term deposits grew by 9.0% y-o-y at March 31, 2022
• Domestic loans grew by 17.5% y-o-y and 5.7% q-o-q
• Retail loans, excluding rural, grew by 19.7% y-o-y and 6.0% q-o-q
• Business banking portfolio grew by 43.2% y-o-y and 10.2% q-o-q
• SME portfolio grew by 33.6% y-o-y and 11.3% q-o-q
• Domestic corporate portfolio grew by 9.7% y-o-y and 1.2% q-o-q sequentially
1. Profit before provision and taxes, excluding treasury income
Core
operating
profit1
Deposits
Advances

5
Key highlights for Q4-2022 (2/2)
• Net NPA ratio declined to 0.76% at Mar 31, 2022 from 0.85% at Dec 31, 2021
• Net deletions of ` 4.89 bn from gross NPAs in Q4-2022 (Q3-2022: ` 1.91 bn)
• Total provisions of ` 10.69 bn in Q4-2022 (0.53% of average loans, 10.5% of
core operating profit)
• Provision coverage was 79.2% at Mar 31, 2022 (Dec 31, 2021: 79.9%)
• Fund based o/s of ` 82.67 bn (1.0% of advances) to all standard borrowers
under resolution; provisions of ` 25.30 bn held against these borrowers
• Contingency provisions of ` 74.50 bn at Mar 31, 2022
• Profit after tax grew by 59.4% y-o-y to ` 70.19 bn in Q4-2022
• Profit after tax grew by 44.1% y-o-y to ` 233.39 bn in FY2022
• The Board has recommended a dividend of ` 5 per share, subject to requisite
approvals
• Common Equity Tier 1 ratio of 17.60%1
1. After reckoning the impact of proposed dividend
Asset
quality
Profit after
tax and
capital

Operating performance
6

P&L trends: Q4-2022
Provision to core operating profit (%)
7
Profit after tax
Core operating profit to average
assets (%)
Growth of 59.4% y-o-y to ` 70.19 billon
3.06 in Q4-2022; 3.03 in FY2022
(Q4-2021: 2.95; FY2021: 2.75)
10.5 in Q4-2022; 22.5 in FY2022
(Q4-20211: 22.0; FY2021
1: 36.6)
4.00 in Q4-2022; 3.96 in FY2022
(Q4-2021: 3.84; FY2021: 3.69)
Net interest margin (%) Fee income
Growth of 14.4% y-o-y to ` 43.66 billon
Standalone return on equity (%)
17.1 in Q4-2022; 14.8 in FY2022
(Q4-2021: 12.3; FY2021: 12.2)
1. Excluding Covid-19 related provisions

Profit & loss statement
(` billion) FY2021 Q4-
2021
Q3-
2022
Q4-
2022
FY2022 Q4-o-Q4
(%)
Net interest income1
389.89 104.31 122.36 126.05 474.66 20.8%
Non-interest income 139.23 41.37 48.99 46.08 176.14 11.4%
- Fee income 126.59 38.15 42.91 43.66 156.87 14.4%
- Dividend income2
12.34 3.57 6.03 2.32 18.29 (35.0)%
- Others 0.30 (0.35) 0.05 0.10 0.98 -
Core operating income 529.12 145.68 171.35 172.13 650.80 18.2%
Operating expenses 215.61 60.03 70.75 70.49 267.33 17.4%
- Employee expenses 80.91 20.08 24.853
24.293
96.733
21.0%
- Non-employee expenses 134.70 39.95 45.90 46.20 170.60 15.6%
Core operating profit 313.51 85.65 100.60 101.64 383.47 18.7%
Core operating profit excluding
dividend income2
301.17 82.08 94.57 99.32 365.18 21.0%
8
1. Includes interest on income tax refund of ` 0.19 bn in Q4-2022 and ` 2.43 bn in FY2022 (FY2021: ` 2.57 bn, Q3-2022: ` 1.81 bn, Q4-2021: ` 0.11 bn)
2. Dividend income from subsidiaries/associates
3. The Bank has changed its accounting policy from intrinsic value method to fair value method for all stock options granted after March 31, 2021
under its ESOS scheme based on RBI’s clarification dated Aug 30, 2021. The fair value of ESOPs is estimated on the date of grant using Black-
Scholes model and is recognised as compensation expense over the vesting period. Accordingly, the Bank has accounted for additional employee
expense of ₹ 0.69 bn during Q4-2022 and Q3-2022 and ₹ 2.63 bn during FY2022

Profit & loss statement
(` billion) FY2021 Q4-
2021
Q3-
2022
Q4-
2022
FY
2022
Q4-o-Q4
(%)
Core operating profit 313.51 85.65 100.60 101.64 383.47 18.7%
Treasury income 50.461
(0.25) 0.88 1.29 9.03 -
Operating profit 363.97 85.40 101.48 102.93 392.50 20.5%
Net provisions 162.14 28.83 20.07 10.69 86.41 (62.9)%
- Contingency
provisions2
47.50 10.00 - 10.25 (0.25) 2.5%
- Other provisions 114.64 18.83 20.073 0.44 86.66 (97.7)%
Profit before tax 201.83 56.57 81.41 92.24 306.09 63.1%
Tax 39.90 12.54 19.47 22.05 72.70 75.8%
Profit after tax 161.93 44.03 61.94 70.19 233.39 59.4%
9
1. Includes profit of ` 36.70 bn from sale of shareholding in subsidiaries in FY2021
2. During Q4-2022, the Bank made contingency provision of ` 10.25 bn on a prudent basis. The Bank continues to carry Covid-19 related provisions
of ` 64.25 bn as contingency provisions at Mar 31, 2022. Accordingly, including this Covid-19 related provisions, the total contingency provisions
was ` 74.50 bn at March 31, 2022
3. Includes ₹ 4.65 bn of higher provision against security receipts and ₹ 4.47 bn of higher provisions against loans under resolution on a prudent
basis in Q3-2022

Consolidated P&L and ratios: slide 63-65
1. Includes interest on income tax refund of ` 0.19 bn in Q4-2022 and ` 2.43 bn in FY2022 (FY2021: ` 2.57 bn, Q4-2021: ` 0.11 bn and
Q3-2022: ` 1.81 bn)
2. Excludes gain on sale of stake in subsidiaries
3. Excluding Covid-19 related provisions of ` 10.00 bn in Q4-2021 and ` 47.50 bn in FY2021
4. Annualised for all interim periods
Key ratios
Percent FY2021 Q4-
2021
Q3-
2022
Q4-
2022
FY
2022
Net interest margin1,4
3.69 3.84 3.96 4.00 3.96
Cost of deposits4
4.12 3.80 3.47 3.48 3.53
Cost-to-income 39.72
41.3 41.1 40.6 40.5
Provisions/core operating profit 36.63
22.03
20.0 10.5 22.5
Provisions/average advances4
1.753
1.093
1.01 0.53 1.12
Return on average assets4
1.42 1.51 1.90 2.11 1.84
Standalone return on equity4
12.2 12.3 15.4 17.1 14.8
Weighted average EPS (`)4
24.0 25.8 35.4 41.0 33.7
Book value (`) 213.3 213.3 234.9 245.4 245.4
Yield, cost and margin: slide 62
10

Unconsolidated segment-wise PBT
Profit before tax
(` billion)
FY2021 Q4-
2021
Q3-
2022
Q4-
2022
FY
2022
Retail 77.40 22.98 37.62 46.43 114.00
Wholesale 58.20 25.25 19.90 32.78 90.53
Treasury 110.80 18.09 22.40 23.24 98.20
Others 2.93 0.25 1.49 0.04 3.11
Unallocated1
(47.50) (10.00) - (10.25) 0.25
Total 201.83 56.57 81.41 92.24 306.09
111. Represents contingency provision

Balance sheet growth
12

Deposits
(` billion) Mar 31,
2021
Dec 31,
2021
Mar 31,
2022
Y-o-Y
growth
% share at
Mar 31, 2022
CASA 4,316.23 4,806.56 5,184.37 20.1% 47.2%
- Current 1,361.70 1,460.43 1,584.80 16.4% 14.4%
- Savings 2,954.53 3,346.13 3,599.57 21.8% 32.8%
Term 5,008.99 5,368.11 5,461.35 9.0% 52.8%
Total deposits 9,325.22 10,174.67 10,645.72 14.2% 100.0%
Q4-2021 Q3-2022 Q4-2022
Average CASA ratio 42.5% 44.9% 45.2% - -
• Q4-2022: 23.6% y-o-y growth in average CA and 22.7% y-o-y growth in average SA
• FY2022: 31.0% y-o-y growth in average CA and 23.5% y-o-y growth in average SA
Balance sheet-liabilities: slide 66-67
Consolidated balance sheet: slide 68 Branch and ATM network: slide 69
13

Loan portfolio
(` billion) Mar 31,
2021
Dec 31,
2021
Mar 31,
2022
Y-o-Y
growth
% share at
Mar 31, 20224
Retail 3,797.35 4,287.35 4,546.35 19.7% 52.9%
Rural loans 721.58 736.85 768.30 6.5% 8.9%
Business banking 373.27 484.84 534.37 43.2% 6.2%
SME1
302.84 363.53 404.50 33.6% 4.7%
Domestic corporate and others 1,766.35 1,913.58 1,937.34 9.7% 22.5%
BRDS/IBPC2
- (53.00) (13.50) - -
Total domestic book 6,961.39 7,733.15 8,177.36 17.5% 95.2%
Overseas book3
375.90 406.77 412.84 9.8% 4.8%
Total advances 7,337.29 8,139.92 8,590.20 17.1% 100.0%
• Including non-fund based outstanding, the share of retail portfolio was 43.8% of the total portfolio at Mar 31, 2022
• Of the total domestic loan book, 30% has fixed interest rates, 41% has interest rate linked to repo rate, 7% has interest
rate linked to other external benchmarks and 22% has interest rate linked to MCLR and other older benchmarks
Balance sheet-assets: slides 70-71
Portfolio composition: slide 7214
1. SME portfolio includes borrowers with turnover less than ` 2.50 billion
2. Bill rediscounting scheme/Interbank participatory certificate
3. Includes impact of exchange rate movement
4. Proportions are gross of BRDS/IBPC

Retail portfolio
(` billion) Mar 31,
2021
Dec 31,
2021
Mar 31,
2022
Y-o-Y
growth
% share at Mar
31, 2022
Mortgages 2,436.54 2,782.67 2,930.63 20.3% 64.5%
Vehicle loans 641.54 658.64 680.51 6.1% 15.0%
- Auto finance 362.39 387.37 403.20 11.3% 8.9%
- Commercial vehicle and
equipment
265.16 256.71 261.67 (1.3)% 5.8%
- Two wheeler loans 13.99 14.56 15.64 11.8% 0.3%
Personal loans 493.45 569.63 628.73 27.4% 13.8%
Credit cards 173.11 228.00 250.62 44.8% 5.5%
Others 52.71 48.41 55.86 6.0% 1.2%
- Dealer funding loans 36.73 31.81 38.54 4.9% 0.8%
- Loan against shares and others 15.98 16.60 17.32 8.4% 0.4%
Total retail loans 3,797.35 4,287.35 4,546.35 19.7% 100.0%
15
• Till Mar 31, 2022 the Bank disbursed ~ ` 179 bn under ECLGS schemes

Portfolio of overseas branches
16
Total outstanding1 at Mar 31, 2022: USD 3.65 billion
1. Corporate fund and non-fund outstanding of overseas branches, net of cash/bank/insurance backed lending
The overseas non-India linked
corporate portfolio reduced by
48.2% year-on-year or about USD
597 million and 6.8% sequentially or
about USD 47 million at March 31,
2022

Growing digital platforms
17

iMobile 1.0
One App Strategy
India’s First Banking App
iMobile 2.0
iMobile Pay
3.0
Basic Banking | Digitized Processes
Products & Services| INSTA Banking
One app for All Banks | Seamless Journeys | Hyper Personalization
iMobile Pay : Universal Super App
Tap2Pay
Scan2Pay
Pay2Contact
Any Bank
Card
payment
Invest,
Insure &
Tax
LoansOffers &
Shopping
Personal
Finance
Mgmt
Bill
Payment
&
Recharge
18
19
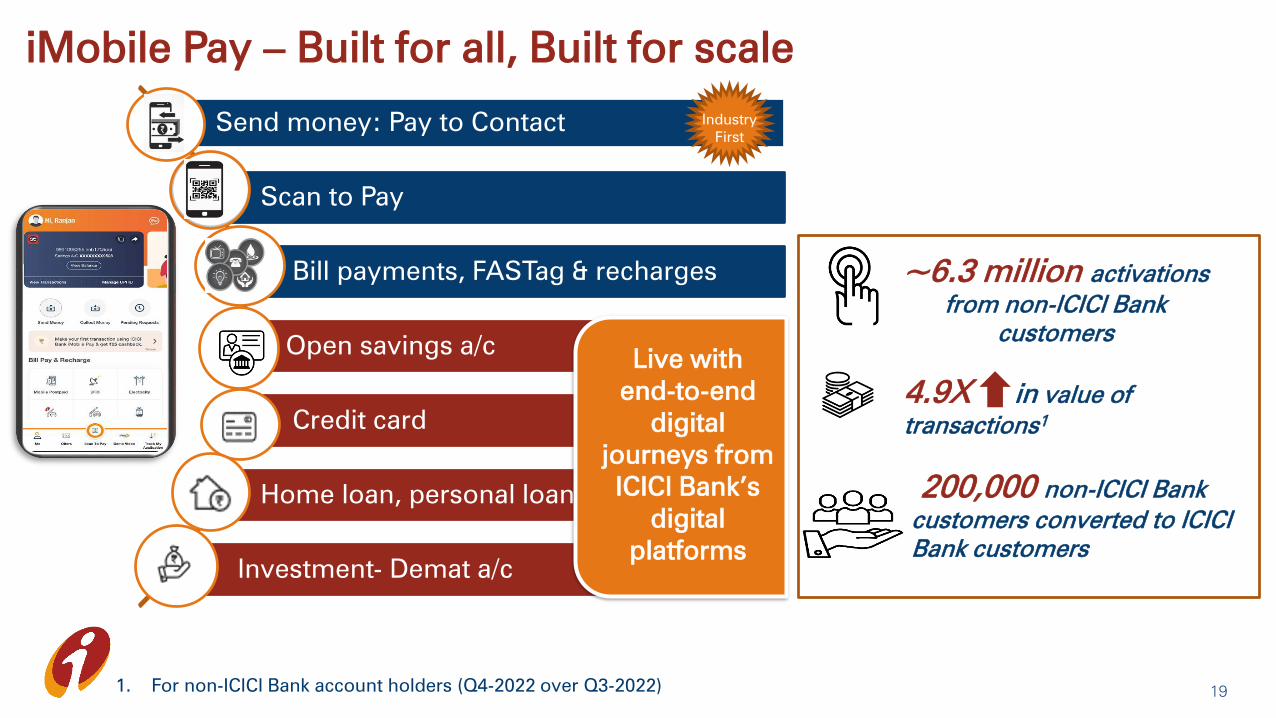
iMobile Pay – Built for all, Built for scale
1. For non-ICICI Bank account holders (Q4-2022 over Q3-2022)
Send money: Pay to Contact
Scan to Pay
Bill payments, FASTag & recharges
Open savings a/c
Credit card
Home loan, personal loan
Investment- Demat a/c
Industry
First
Live with
end-to-end
digital
journeys from
ICICI Bank’s
digital
platforms
~6.3 million activations
from non-ICICI Bank
customers
4.9X in value of
transactions1
200,000 non-ICICI Bank
customers converted to ICICI
Bank customers

Seamless payment features driving growth
20
1. Q4-2022 over Q4-2021
2. Q4-2022 over Q3-2022
3. For Nov. 2021; as per RBI definition, includes individual and corporate
payments initiated, processed and authorised using mobile device
3.2x y-o-y1
Number of transactions
Pay to contact
1.5x q-o-q2
Industry
first
3.2x y-o-y1
UPI -iMobile Pay
Number of transactions
Scan to Pay
Mobile banking transactions avg ticket size
2x of industry3
Highest UPI PSP app transactions through
put amongst banks (Source: NPCI)
75% customers active digitally4
21% y-o-y in website traffic5
4. One month active existing ICICI Bank account holders in Mar 2022
5. March 2022 over March 2021
Q4-2021 Q1-2022 Q2-2022 Q3-2022 Q4-2022Q4-2021 Q1-2022 Q2-2022 Q3-2022 Q4-2022
Q4-2021 Q1-2022 Q2-2022 Q3-2022 Q4-2022

New features on iMobile Pay
Outward remittance using iMobile Pay Smart checkout
• Good adoption within one month of
launch
• 55% of the users of outward remittance
feature were first time users of the
Money2World service
Seamless
customer
experience
Launched in February 2022
• Feature active for over 70,000 merchants
No need to
remember user
ID and password
Better
transition,
less friction
during
checkout
Move towards
App-to-app
transactions
Fingerprint/
MPIN
payment
completion
Launched in February 2022
21
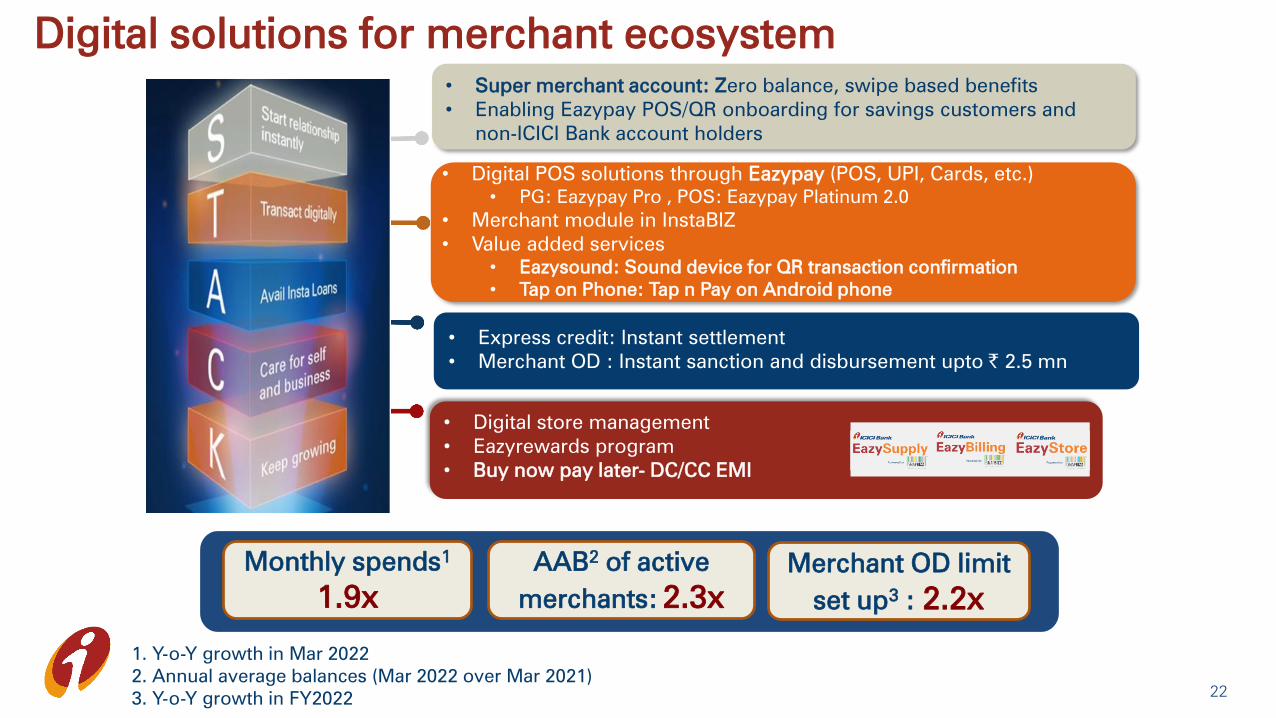
Digital solutions for merchant ecosystem
22
AAB2
of active
merchants: 2.3x
1. Y-o-Y growth in Mar 2022
2. Annual average balances (Mar 2022 over Mar 2021)
3. Y-o-Y growth in FY2022
Monthly spends1
1.9x
• Super merchant account: Zero balance, swipe based benefits
• Enabling Eazypay POS/QR onboarding for savings customers and
non-ICICI Bank account holders
• Express credit: Instant settlement
• Merchant OD : Instant sanction and disbursement upto ` 2.5 mn
• Digital store management
• Eazyrewards program
• Buy now pay later- DC/CC EMI
• Digital POS solutions through Eazypay (POS, UPI, Cards, etc.)
• PG: Eazypay Pro , POS: Eazypay Platinum 2.0
• Merchant module in InstaBIZ
• Value added services
• Eazysound: Sound device for QR transaction confirmation
• Tap on Phone: Tap n Pay on Android phone
Merchant OD limit
set up3
: 2.2x

InstaBIZ is now interoperable for merchants
23
Benefits of the app available to all merchants including those who do not
have a current account with the Bank
23
Download InstaBiz Select bank a/c Input details Digital validation Instant activation
All-in-one
app
Instant
activation
Paperless
KYC
Digital
collection
solution: UPI
ID, QR code
Apply for
POS
Create
digital
store
Loyalty
rewards
Key
features

InstaBIZ: Universal app for small business
1 mn + active customers5
1. Ratings on Android & iOS
2. Growth in transactions in Q4-2022 over Q4-2021
3. InstaBIZ & corporate internet banking in Q4-2022
4. Products sold in Q4-2022
5. At March 31, 2022
Key metrics
1.49x Balances of digitally
active vs inactive customers
44% value of financial
transactions2
88%+ Payments on digital
channels3
0.17 mn+ Products sold
across deposit, lending, trade &
payments4
24
27% count of financial
transactions2
App rating1
4.6
Key features
4.7
Dec’21
© GlobalLinker. All rights
reserved
OTHERS
COLLECT
THROUGH
TOP SERVICES

BizPay360 – Bulk Payment Solution
25
Digital onboarding with instant activation
Choose your debit type – consolidated /
individual
Customized debit credit narration for
ease in reconciliation
Instant file format customization for
compatibility with accounting software
Macro based validations to reduce errors in
payment file
67%
65%
Q-o-Q growth in
customer registrations1
Q-o-Q growth in
throughput value1
Upto 10 onscreen payments with single
OTP
50,000+ registrations
1. Growth in Q4-2022 over Q3-2022

Contactless disbursement
Business banking: Digital initiatives
26
Collateral free overdraft upto ` 51million
Offerings to pre-approved customers and
non-ICICI Bank account holders
Do it yourself, seamless journey
Scorecard based instant sanction using BRE2
1. For existing customers of the Bank
2. Business Rule Engine
Digital document
generation and
scrutiny
Remote access to
digital documents
by signor
On the fly e-
stamping, e-sign
and document
storage
Contactless and paperless
24x7, 365 days access by signer
TAT reduction4
from 4 days to 3 hours
No rework
3. For cases disbursed in March 2022
4. Average time for document preparation and execution
Adoption: 50%3
Paperless overdraft process
About 95% of overdraft facilities set up
were end-to-end digital in FY2022

Supply chain platforms driving growth
27
Increasing value of
outstanding book
2.7x y-o-y
Increasing value of
throughput
2.7x y-o-y
Sanctions > ` 7.5 mn
based on GST return for
new-to-bank customersTransaction data based
renewal / enhancement
New portal -
UI/UX with
branding
Customer collaboration
tools to improve
onboarding
Digital penetration
in dealers and
vendors
Open architecture solution
ERP integrated solution
Seamless API integration
Real time status update across journey
Plug-and-play solution
Automated reconciliation of transaction
Algorithm
Driven
Credit

28
Seamless execution … Market share & income growthSuperior experience …
Distribution Technology
Process People
Digital onboarding
Digital transaction
efficiency | coverage | wallet share
integrations | platforms | H2H | API
Bespoke | industry solutions
20+ ICICI STACK for corporates
FY21 FY22
Value of transactions done
through Trade Online
FY21 FY22
Growth in
corporate CA MAB
FY21 FY22
LC income
FY21 FY22
GST collection
growth
3.0xNumber of current
accounts opened digitally1
2.0xGrowth in supply chain
counterparties1
Trade digital
adoption11.2x
…leveraging digital strategy
1.7x
1.8x
Growth in corporate
integrations12.4x
1.4x
1.3x
1. FY2022 over F20Y21
Growth in API volume12.9x
Growing corporate ecosystem through execution…

…driven by innovation
Capital Market
Ecosystem
Electronic Bill of
Lading(e-BL)iXC
Corporate API
suite
One stop solution for all
trade needs 33
New customers since launch
in Nov 2021
Cross border transaction using for
select large corporates
70%
Reduction in turnaround time
End-to-end blockchain
solution for domestic trade
1.67x
Growth in volume1
A bouquet of APIs for
corporate customers
200+
Clients onboarded in FY2022
A DIY platform for
corporates to seamlessly
access Bank through APIs
85+
APIs offered2
Enabling seamless onboarding
and transaction for investors
Value driven by recent initiatives
…& many more
1.4x
CA MAB growth1
1. FY2022 over F20Y21 29
Expanding digital reach across corporate ecosystem…

Digital sourcing for retail products in FY2022
30
Credit cards (by volume)
Term life insurance
policies sold online
Fixed deposits
(by volume)
SIPs initiated (by volume)
Mortgages
(Number of sanctions)
Personal loan
disbursements (by volume)

Digital payments: credit and debit cards
31
Credit card spends
Increasing market share1 (%)
1. Source: RBI
Issued 3 mn+ cards
Debit card spends
Partnerships
1.8x y-o-y
Tied up with Emirates
Skywards, an award-winning
loyalty programme of Emirates
and FlyDubai
` `

Digital payments
32
UPI: P2M1
transactions
Value: 2.4x y-o-y;
Volume: 1.7x y-o-y
1. Payments to merchants
Market share by volume was 15% in Q4-
2022; ranked 3rd
in the industry
Electronic toll collections
Market share by value was 33% in
Q4-2022; ranked 1st
in the industry
27.4%
y-o-y
``

Asset quality trends
33

NPA trends
(` billion) Mar 31,
2021
Dec 31,
2021
Mar 31,
2022
Gross NPAs1
413.73 370.53 339.20
Less: cumulative provisions 321.93 297.09 269.59
Net NPAs1
91.80 73.44 69.61
Gross NPA ratio1
4.96% 4.13% 3.60%
Net NPA ratio1
1.14% 0.85% 0.76%
Provision coverage ratio 77.7% 79.9% 79.2%
Non-fund o/s to NPAs 44.05 36.38 36.40
Provisions on non-fund o/s to NPAs 14.92 19.57 20.51
341. Based on customer assets
• Net investment in security receipts of ARCs was ` 8.07 billion at Mar 31, 2022
(Dec 31, 2021: ` 10.17 billion, Mar 31, 2021: ₹ 17.29 billion)
Retail, rural and
business banking
NPAs: slide 73

NPA movement1
35
1. Based on customer assets
2. Includes proforma NPAs of ` 82.80 bn at Dec 31, 2020, net of recoveries of ` 19.85 bn. Excluding proforma NPAs and net of recoveries,
gross NPA additions were ` 55.23 bn (retail, rural and business banking portfolio: ` 43.55 bn, corporate and SME portfolio: ` 11.68 bn)
3. Includes additions of ₹ 6.14 bn from kisan credit card portfolio
` in billion FY2021 Q4-2021 Q3-2022 Q4-2022 FY2022
Opening gross NPA 414.09 348.60 414.37 370.53 413.73
Add: gross additions (1) 161.23 118.182
40.18 42.04 192.91
- Retail, rural and business banking 128.25 99.56 38.533
37.36 173.57
- Corporate and SME 32.98 18.62 1.65 4.68 19.34
Less: recoveries, upgrades and others (2) 64.63 25.60 42.09 46.93 163.63
- Retail, rural and business banking 27.97 8.20 37.27 36.13 132.93
- Corporate and SME 36.66 17.40 4.82 10.80 30.70
Net additions (1)-(2) 96.60 92.58 (1.91) (4.89) 29.28
Less: write-offs 96.08 27.45 40.88 26.44 99.46
: sale of NPAs 0.88 - 1.05 - 4.35
Closing gross NPAs 413.73 413.73 370.53 339.20 339.20
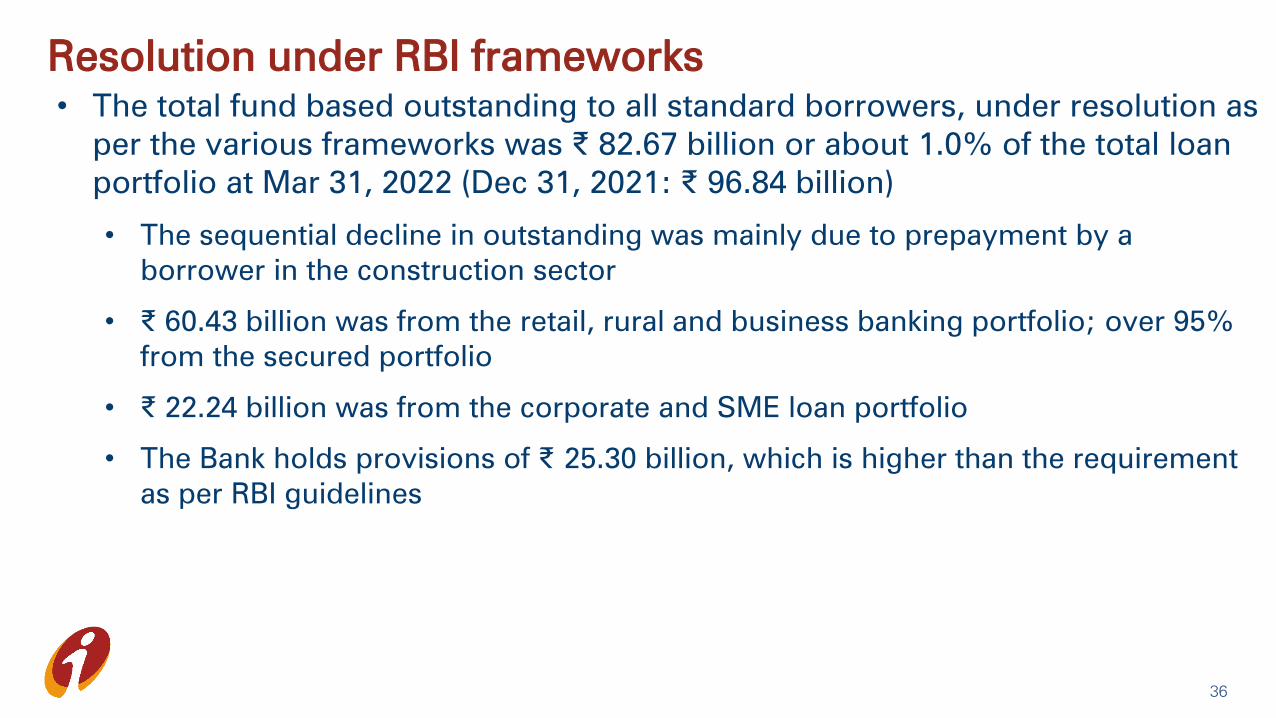
Resolution under RBI frameworks
36
• The total fund based outstanding to all standard borrowers, under resolution as
per the various frameworks was ₹ 82.67 billion or about 1.0% of the total loan
portfolio at Mar 31, 2022 (Dec 31, 2021: ₹ 96.84 billion)
• The sequential decline in outstanding was mainly due to prepayment by a
borrower in the construction sector
• ₹ 60.43 billion was from the retail, rural and business banking portfolio; over 95%
from the secured portfolio
• ₹ 22.24 billion was from the corporate and SME loan portfolio
• The Bank holds provisions of ₹ 25.30 billion, which is higher than the requirement
as per RBI guidelines

Standard asset and other provisions
37
(` billion) Mar 31,
2021
Jun 30,
2021
Sep 30,
2021
Dec 31,
2021
Mar 31,
2022
Contingency provisions1
74.75 64.25 64.25 64.25 74.50
Provision on non-fund based o/s to
NPAs
14.92 16.55 17.71 19.57 20.51
Provisions on fund based o/s to
standard borrowers under resolution
7.16 8.99 19.50 24.36 25.30
General provisions on other standard
assets and other provisions
44.62 49.02 48.06 52.08 58.87
Total 141.44 138.81 149.51 160.26 179.18
Total as a % of net advances 1.9% 1.9% 2.0% 2.0% 2.1%
1. Includes Covid-19 related provisions

Loan portfolio information
38

Diversified and granular loan book
39
Retail portfolio largely secured and
built on proprietary data and
analytics in addition to bureau
checks and well-priced in relation
to risk
1. Proportions are gross of BRDS/IBPC
2. Includes dealer funding, loan against shares and others
3. Including non-fund based outstanding, the share of retail portfolio was 43.8% of the total portfolio at Mar 31, 2022
2
Focus on granular exposures and
higher rated corporates; provide
full suite of banking products to
corporate clients and their
ecosystems
52.9% of total loans are retail3
Breakup of loan portfolio1
at Mar 31, 2022
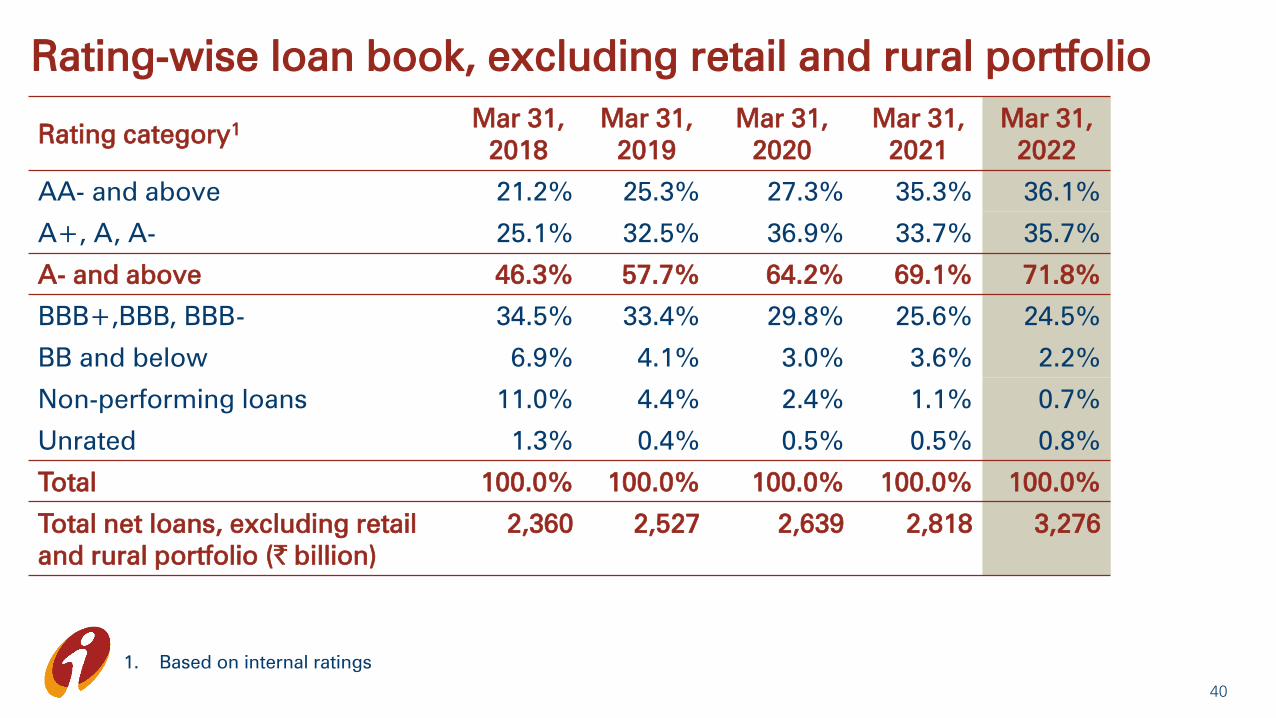
Rating-wise loan book, excluding retail and rural portfolio
40
Rating category1
Mar 31,
2018
Mar 31,
2019
Mar 31,
2020
Mar 31,
2021
Mar 31,
2022
AA- and above 21.2% 25.3% 27.3% 35.3% 36.1%
A+, A, A- 25.1% 32.5% 36.9% 33.7% 35.7%
A- and above 46.3% 57.7% 64.2% 69.1% 71.8%
BBB+,BBB, BBB- 34.5% 33.4% 29.8% 25.6% 24.5%
BB and below 6.9% 4.1% 3.0% 3.6% 2.2%
Non-performing loans 11.0% 4.4% 2.4% 1.1% 0.7%
Unrated 1.3% 0.4% 0.5% 0.5% 0.8%
Total 100.0% 100.0% 100.0% 100.0% 100.0%
Total net loans, excluding retail
and rural portfolio (` billion)
2,360 2,527 2,639 2,818 3,276
1. Based on internal ratings

• Other than two accounts, one each in power and telecom sectors, the maximum
single borrower outstanding in the BB and below portfolio was less than ` 6 billion at
Mar 31, 2022
• At Mar 31, 2022, total provisions3
held on BB and below portfolio were ` 12.32 billion
(Dec 31, 2021: ` 15.75 billion)
Corporate and SME: BB and below
41
` billion Mar 31,
20211
Dec 31,
2021
Mar 31,
2022
BB and below outstanding1
130.98 118.42 108.08
- Fund and non-fund o/s to borrowers with loans
under resolution
14.05 36.92 23.89
- Other borrowers with o/s greater than ` 1.00 bn2
79.17 52.34 58.81
- Other borrowers with o/s less than ` 1.00 bn2
37.76 29.16 25.38
1. Excludes banks, investments and fund and non-fund based outstanding to NPAs
2. Fund-based and non-fund based outstanding
3. Including provisions on loans under resolution

42
(` billion)
Movement in Corporate & SME BB and below: Q4-2022
1. Fund-based and non-fund based outstanding
2. Excludes banks, investments and fund and non-fund based outstanding to NPAs
1,2 1,2

Mortgage portfolio
43
Mortgage portfolio includes home loans ~70%, top-up loans given to existing home
loan customers 6%, office premises loans ~5% and loan against property ~19%
~75%
mortgage customers
have liability relationship
with the Bank
~ ` 3.1 mn
Average ticket
size of home
loan
~60%
Average loan-to-
value ratio of
home loan
~35%
Average loan-to-value
ratio of loan against
property
iLens, an integrated, end-to-end, retail lending solution, covering all facets of loan
lifecycle starting from sourcing till disbursement for all kind of customers. It is a single
interface for employees, third party agencies and sourcing channels
Home loans are geographically well diversified, built on fundamental premises of cashflow
assessment of underlying borrower + meeting the legal and technical standards of the
Bank for the property being mortgaged
Loan against property portfolio has conservative loan to value ratios, lending based on
cash flows of business/individuals with limited reliance on the value of collateral; valuation
of the property is carried out internally

Auto and two wheeler finance
44
Auto loan portfolio comprises 86% new vehicles and 14% used vehicles
~70%Auto loan customers have
a liability relationship with
the Bank
Instant car loan disbursement, a industry first proposition, for pre-approved customers;
delivery order is generated digitally in a seamless manner. The product won the ‘Best
Automobile/Car Loan Product Award' in 2021
Two wheeler loans – onboarding mobility solution provides an end-to-end digital journey
for customers with instant approval; instant verification and rule engine based decisioning
Digital sourcing
and processing
for new car loan
~85%
ICICIAuto.com, a one stop digital solution to assist customers in their car buying
journey; offers superior and more personalised service to the customer; helps in
reducing operating expenses

Rural and personal loan and credit card portfolio
45
Rural loans Personal loans and credit cards
~75% Portfolio to existing customers
~85% Portfolio of salaried individuals
~75% Salaried customers from well rated
corporates, MNCs, and government entities
Gold loans comprise ~2% and kisan credit cards
comprise ~3% of the total loan book
Through API integration with Bharat Bill
Payment System, customers can instantly
pay interest on their overdraft facilities;
eliminates branch visits to service their
loans
Leverage opportunities for growth
in identified ecosystems such as
agriculture, dealers, self-employed,
corporates, institutions and micro-
entrepreneurs
Personal loan disbursements increased
sequentially
Growth in credit card spends driven by –
Higher activation rate through digital
onboarding of customers
Automated, effective portfolio management
Diversification through commercial cards

SME and business banking portfolio
46
` 10-15 mn
Average ticket
size of business
banking loan
~ ` 110 million
average ticket size of the
incremental sanctions in SME
> 95%
Of business banking book
fully collateralized with a
collateral cover of >100%
Focus on parameterised and programme based lending,
granularity, collateral and robust monitoring; well diversified
portfolio across sectors and geographies
Growth driven by leveraging distribution network and digital
platforms such as InstaBIZ, Merchant STACK and Trade Online
and efforts towards process decongestion such as e-signing
of disbursement documents through EasySign
Primary collateral in the business banking portfolio in the form of charge on
current assets and backed by property

Exposure to power sector
(` billion) Mar 31,
2021
Dec 31,
2021
Mar 31,
2022
Share at Mar
31, 2022 (%)
Borrowers classified as NPA/proforma NPA
or part of BB and below portfolio1
82.21 75.79 73.24 18.3%
Other borrowers 276.39 301.42 327.47 81.7%
Total 356.59 377.21 400.71 100.0%
• Of the other borrowers aggregating ` 327.47 billion, excluding exposure to State
Electricity Boards, >90% was rated A- and above
Sector-wise exposures: slide 74
471. Including loans restructured or under a RBI resolution scheme
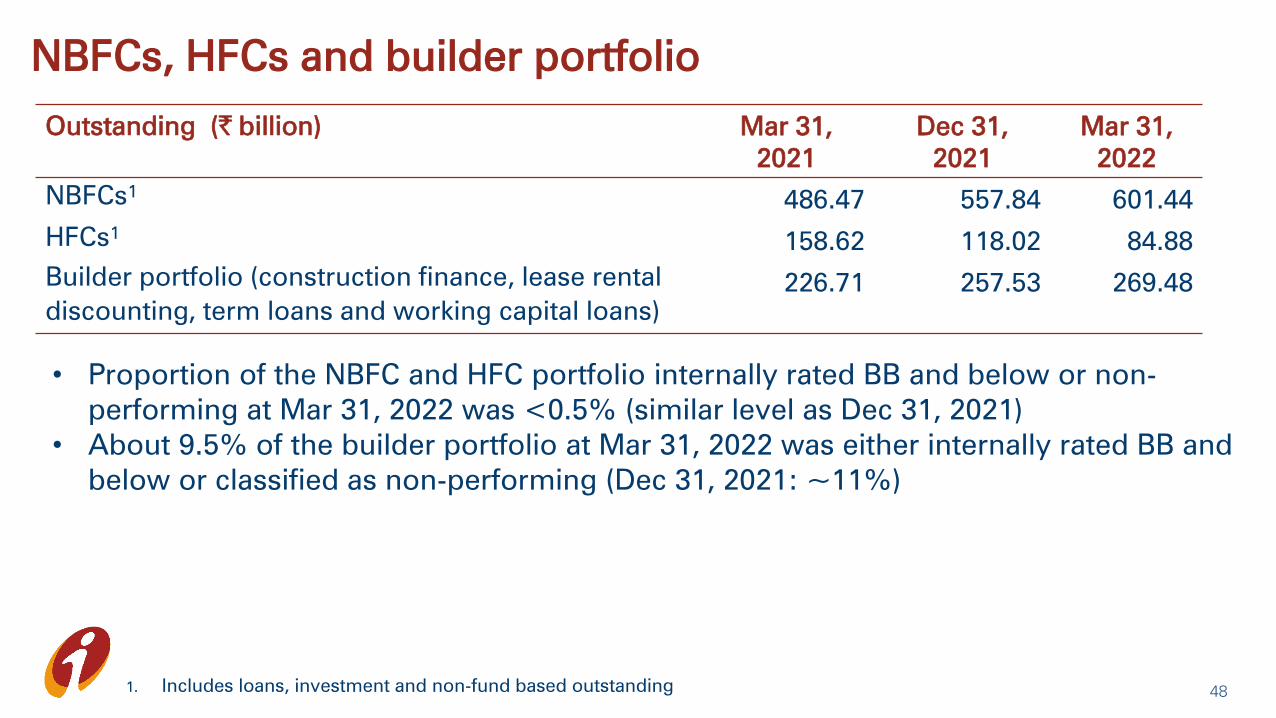
NBFCs, HFCs and builder portfolio
Outstanding (` billion) Mar 31,
2021
Dec 31,
2021
Mar 31,
2022
NBFCs1
486.47 557.84 601.44
HFCs1
158.62 118.02 84.88
Builder portfolio (construction finance, lease rental
discounting, term loans and working capital loans)
226.71 257.53 269.48
481. Includes loans, investment and non-fund based outstanding
• Proportion of the NBFC and HFC portfolio internally rated BB and below or non-
performing at Mar 31, 2022 was <0.5% (similar level as Dec 31, 2021)
• About 9.5% of the builder portfolio at Mar 31, 2022 was either internally rated BB and
below or classified as non-performing (Dec 31, 2021: ~11%)

Concentration risk ratios
• Hard limit on borrower groups based on turnover and track record, lower than the
regulatory limits
• All top 20 borrowers as of Mar 31, 2022 are rated A- and above internally
Details Mar 31,
2018
Mar 31,
2019
Mar 31,
2020
Mar 31,
2021
Mar 31,
2022
Exposure to top 20
borrowers1
as a % of total
exposure
12.5% 10.8% 11.0% 12.1% 9.6%
Exposure to top 10 groups
as a % of total exposure
14.3% 13.6% 12.1% 11.6% 10.3%
49
1. Excludes banks

Capital
50
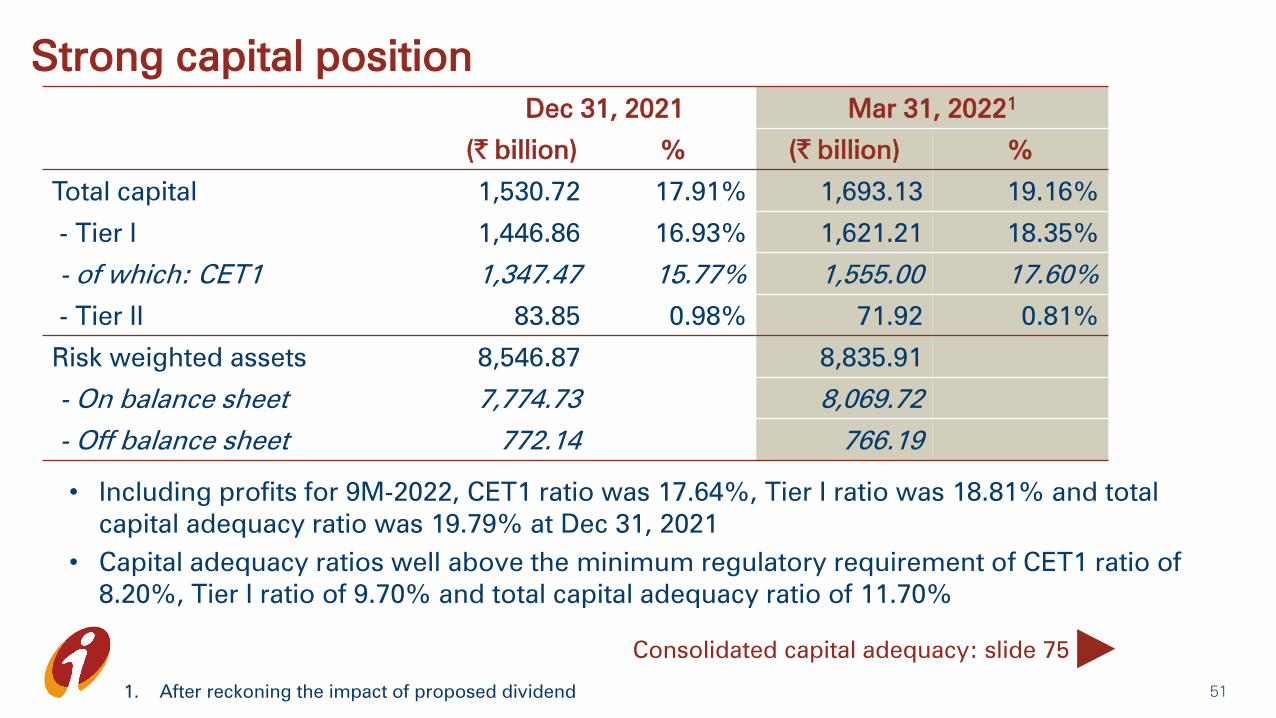
Strong capital position
Dec 31, 2021 Mar 31, 20221
(` billion) % (` billion) %
Total capital 1,530.72 17.91% 1,693.13 19.16%
- Tier I 1,446.86 16.93% 1,621.21 18.35%
- of which: CET1 1,347.47 15.77% 1,555.00 17.60%
- Tier II 83.85 0.98% 71.92 0.81%
Risk weighted assets 8,546.87 8,835.91
- On balance sheet 7,774.73 8,069.72
- Off balance sheet 772.14 766.19
• Including profits for 9M-2022, CET1 ratio was 17.64%, Tier I ratio was 18.81% and total
capital adequacy ratio was 19.79% at Dec 31, 2021
• Capital adequacy ratios well above the minimum regulatory requirement of CET1 ratio of
8.20%, Tier I ratio of 9.70% and total capital adequacy ratio of 11.70%
1. After reckoning the impact of proposed dividend
Consolidated capital adequacy: slide 75
51

Group companies
52

Profit after tax of key subsidiaries and associates
1. As per Ind AS
2. Represents total comprehensive income
3. In accordance with the Scheme of Arrangement between ICICI General and Bharti AXA General Insurance, assets and liabilities of
Bharti AXA’s general insurance business vested with ICICI General on the appointed date of April 1, 2020. ICICI General’s financial
statements for Q1-2022 have been restated to reflect the scheme. Prior period numbers are not comparable due to the reflection of
the Scheme of Arrangement between ICICI General and Bharti AXA General Insurance Company in current period numbers
4. Insignificant amount
Details on key subsidiaries and associates: slides 76-81
53
Profit after tax (` billion) FY2021 Q4-2021 Q3-2022 Q4-2022 FY2022
ICICI Prudential Life Insurance 9.60 0.64 3.11 1.85 7.54
ICICI Lombard General Insurance3
14.73 3.46 3.18 3.13 12.71
ICICI Prudential Asset Management1
12.45 3.48 3.34 3.57 14.54
ICICI Securities (Consolidated)1
10.68 3.29 3.80 3.40 13.83
ICICI Securities Primary Dealership1,2
5.70 0.66 0.03 0.42 3.30
ICICI Home Finance1
0.22 0.15 0.48 0.53 1.64
ICICI Venture 0.04 (0.12) (0.08) 0.16 0.004
ICICI Bank UK (USD million) 14.8 2.8 3.0 3.1 10.9
ICICI Bank Canada (CAD million) 20.0 5.1 11.5 4.3 29.2

Insurance entities
1. Annualised premium equivalent
2. In accordance with the Scheme of Arrangement between ICICI General and Bharti AXA General Insurance, assets and liabilities of
Bharti AXA’s general insurance business vested with ICICI General on the appointed date of April 1, 2020. ICICI General’s financial
statements for Q1-2022 have been restated to reflect the scheme. Prior period numbers are not comparable due to the reflection of
the Scheme of Arrangement in current period numbers
ICICI Prudential Life Insurance
• New business premium grew by 15.4% y-o-y to ` 150.36 billion in FY2022
• Value of new business (VNB) grew by 33.4% y-o-y to ` 21.63 billion in FY2022; VNB margins
increased from 25.1% in FY2021 to 28.0% in FY2022
• Annuity new business premium grew by 29.0% y-o-y to ` 29.56 billion in FY2022
• Embedded value grew by 8.7% y-o-y to ` 316.25 billion at March 31, 2022
• New business sum assured grew by 25.4% y-o-y to ` 7,731.46 billion in FY2022; Company
continued to maintain leadership within the private life insurance sector
ICICI Lombard General Insurance2
• Gross direct premium income was ` 179.77 billion in FY2022 (FY2021: ` 140.03 billion)
• Market leader in motor segment with a share of 11.8% at March 31, 2022
54
ICICI Securities and ICICI AMC
1. On a consolidated basis
2. Average assets under management (excluding fund of funds); source: Association of Mutual Funds in India (AMFI) website
ICICI Securities
• Revenue1
grew by 33.0% to ₹ 34.38 billion in FY2022 from growth across all businesses
• New client acquisition of ~ 2.3 mn in FY2022; highest ever in a year
• Overall active clients grew by ~77.5% y-o-y to 3.4 million in Q4-2022
• Profit after tax1
grew by 29.5% y-o-y to ₹ 13.83 billion in FY2022
ICICI AMC
• AAUM2
grew by 15.5% y-o-y to ₹ 4,681.97 billion in Q4-2022
• Market leader in equity and hybrid AUM with market share of 12.7% at Mar 31, 2022
• Profit after tax grew by 16.8% y-o-y to ₹ 14.54 billion in FY2022
55

Environmental, Social and Governance (ESG)
initiatives
56

ESG @ ICICI Bank
57
• Adopting sustainable business practices that ensure long-term success of the
organization and have a positive impact on the environment and society
• To promote long-term sustainable growth in the economy through business
initiatives and responsible corporate citizenship
Philosophy
The Bank has adopted a Board approved ESG policy along with a
governance and oversight framework for ESG
The approved ESG policy will be available on the Bank’s website
• Risk Committee of the Board of Directors will have oversight on ESG
– Risk Committee will review the Bank’s action plan on various aspects of ESG,
external reporting and stakeholder feedback
• Identification and implementation of ESG related initiatives to be undertaken
by the Steering Committee comprising representatives of various functions
within the Bank, which shall be chaired by the Group Chief Financial Officer
Governance

Key focus areas of ESG (1/2)
58
• Social and Environmental Management
Framework for screening new project finance
proposals
• Incorporating ESG and climate risk aspects in
the credit evaluation process
• Aligned to national goals and targets in the
nation’s collective transition to a low-carbon
economy
Responsible financing
• Providing and encouraging adoption of
digital solutions to customers
• Investing in construction and
maintenance of sustainable and green
workplaces aligned to IGBC1
standards
• Continue to report Scope 1 and Scope 2
emissions and intensity
Environmental sensitivity in
operations
• Committed to the principle of “Fair to
Customer, Fair to Bank”
• Various customer related policies like
Customer Rights Policy, Customer
Relations Policy, Customer Grievance
Redressal Policy and Customer
Compensation Policy
Customers
• The Bank is an equal opportunity
employer; believes in leveraging the
strength of diversity at workplace
• Committed to adoption of fair employment
practices, diverse and inclusive working
environment, skill enhancement, no-
discrimination policy towards employees
Employees
1. Indian Green Building Certification

Key focus areas of ESG (2/2)
59
• Dedicated focus through ICICI
Foundation in areas of skill development,
rural livelihoods, value chain
development, creating sustainable
economic ecosystems
Society
• Committed to protecting the privacy of
individuals; Personal Data Protection
Standard prescribes handling of personal
data of employees, clients, customers
and others
• Cyber security framework encompasses
management and Board oversight
Cyber security and data privacy
Effective independent Board; separation
of the Board’s supervisory role from the
executive management
Policies like Whistleblower, anti-bribery
and corruption, Group Code of Business
Conduct and Ethics
Corporate governance
• Maintaining a transparent relationship
and regular interactions with
stakeholders including investors,
employees, customers and regulators
• Enhancing ESG practices and
disclosures, especially on the material
topics identified by stakeholders, on
an ongoing basis
Stakeholder engagement
and accountability

Thank you

Additional financial information
61

Yield, cost and margin
Movement in yield, costs &
margins (Percent)1
FY2021 Q4-2021 Q3-2022 Q4-2022 FY2022
Yield on total interest-earning
assets2
7.49 7.31 7.15 7.19 7.21
- Yield on advances 8.76 8.45 8.19 8.31 8.27
Cost of funds 4.25 3.95 3.66 3.68 3.71
- Cost of deposits 4.12 3.80 3.47 3.48 3.53
Net interest margin2
3.69 3.84 3.96 4.00 3.96
- Domestic 3.84 3.94 4.06 4.12 4.07
- Overseas 0.34 0.44 0.28 0.35 0.29
1. Annualised for all interim periods
2. Includes interest on income tax refund of ` 0.19 bn in Q4-2022 and ` 2.43 bn in FY2022 (FY2021: ` 2.57 bn, Q4-2021: ` 0.11
bn and Q3-2022: ` 1.81 bn)62
slide 10

Consolidated profit & loss statement
(` billion) FY2021 Q4-
2021
Q3-
2022
Q4-
2022
FY
2022
Q4-o-Q4
growth
Net interest income 465.04 123.45 139.41 143.66 542.40 16.4%
Non-interest income 720.30 212.69 155.52 178.34 621.29 (16.2)%
- Fee income 161.95 48.62 54.82 55.30 203.35 13.7%
- Premium income 479.23 152.16 98.01 119.34 389.60 (21.6)%
- Other income1
79.12 11.91 2.69 3.70 28.34 (68.9)%
Total income 1,185.34 336.14 294.93 322.00 1,163.69 (4.2)%
Operating expenses 762.72 237.34 183.42 206.72 731.52 (12.9)%
Operating profit 422.62 98.80 111.51 115.28 432.17 16.7%
631. Includes profit of ` 32.97 bn in FY2021 from sale of shareholding in subsidiaries
• In accordance with the Scheme of Arrangement between ICICI General and Bharti AXA General Insurance, assets and liabilities of Bharti
AXA’s general insurance business vested with ICICI General on the appointed date of April 1, 2020.

• In accordance with the Scheme of Arrangement between ICICI General and Bharti AXA General Insurance, assets and liabilities of Bharti
AXA’s general insurance business vested with ICICI General on the appointed date of April 1, 2020.
Consolidated profit & loss statement
(` billion) FY2021 Q4-
2021
Q3-
2022
Q4-
2022
FY2022 Q4-o-Q4
growth
Operating profit 422.62 98.80 111.51 115.28 432.17 16.7%
Contingency provisions1
47.50 10.00 - 10.25 (0.25) 2.5%
Other provisions 116.28 19.23 21.28 0.79 90.02 (95.9)%
Profit before tax 258.84 69.57 90.23 104.24 342.40 49.8%
Tax 56.64 16.79 22.57 25.13 84.56 49.7%
Share in profit of associates 1.44 0.53 1.93 1.78 7.54 -
Minority interest 19.80 4.45 4.23 3.70 14.28 (16.9)%
Profit after tax 183.84 48.86 65.36 77.19 251.10 58.0%
64
1. Represents contingency provisions made by ICICI Bank

Key ratios (consolidated)
Percent FY2021 Q4-2021 Q3-2022 Q4-2022 FY2022
Return on equity1
13.0 12.8 15.1 17.5 14.8
Weighted average EPS1 (`) 27.3 28.7 37.4 45.1 36.2
Book value (`) 228 228 252 262 262
65
1. Annualised for all interim periods
slide 10

Balance sheet: liabilities
(` billion) Mar 31, 2021 Dec 31, 2021 Mar 31, 2022
Net worth 1,475.09 1,630.69 1,705.12
- Equity capital 13.83 13.89 13.90
- Reserves 1,461.26 1,616.80 1,691.22
Deposits 9,325.22 10,174.67 10,645.72
- Current 1,361.70 1,460.43 1,584.80
- Savings 2,954.53 3,346.13 3,599.57
- Term 5,008.99 5,368.11 5,461.35
Borrowings1
916.31 1,095.85 1,072.31
Other liabilities 587.71 640.75 689.93
Total liabilities 12,304.33 13,541.96 14,112.98
• Credit/deposit ratio of 77.5% on the domestic balance sheet at Mar 31, 2022
(Dec 31, 2021: 77.0%)
1. Including impact of rupee depreciation 66

Composition of borrowings
(` billion) Mar 31,
2021
Dec 31,
2021
Mar 31,
2022
Domestic 616.88 833.19 753.10
- Capital instruments 172.46 172.50 138.51
- Other borrowings 444.42 660.69 614.59
- Long term infrastructure bonds 194.67 307.89 387.84
Overseas borrowings1
299.43 262.66 319.21
Total borrowings 916.31 1,095.85 1,072.31
1. Including impact of rupee depreciation67
slide 13

Consolidated balance sheet
(` billion) Mar 31, 2021 Dec 31, 2021 Mar 31, 2022
Cash & bank balances 1,475.71 1,956.15 1,831.26
Investments 5,365.79 5,318.23 5,670.98
Advances 7,918.01 8,745.94 9,203.08
Fixed & other assets 978.61 808.72 821.05
Total assets 15,738.12 16,829.04 17,526.37
Net worth 1,575.88 1,751.13 1,820.52
Minority interest 95.88 58.02 59.81
Deposits 9,599.40 10,442.90 10,913.66
Borrowings 1,439.00 1,546.10 1,616.03
Liabilities on policies in force 2,031.80 2,264.46 2,288.27
Other liabilities 996.16 766.43 828.08
Total liabilities 15,738.12 16,829.04 17,526.37
68
slide 13
• In accordance with the Scheme of Arrangement between ICICI General and Bharti AXA General Insurance, assets and
liabilities of Bharti AXA’s general insurance business vested with ICICI General on the appointed date of April 1, 2020

Branch and ATM network
Branches Mar 31,
2018
Mar 31,
2019
Mar 31,
2020
Mar 31,
2021
Mar 31,
2022
% share at
Mar 31, 2022
Metro 1,443 1,438 1,585 1,542 1,567 29%
Urban 991 991 1,067 1,063 1,074 20%
Semi urban 1,449 1,453 1,546 1,537 1,599 30%
Rural 984 992 1,126 1,124 1,178 21%
Total branches 4,867 4,874 5,324 5,266 5,418 100%
Total ATMs 14,367 14,987 15,688 14,136 13,626
69
slide 13

Balance sheet: assets
(` billion) Mar 31,
2021
Dec 31,
2021
Mar 31,
2022
Cash & bank balances 1,331.28 1,809.09 1,678.22
Investments 2,812.87 2,848.23 3,102.41
- SLR investments 2,136.10 2,335.23 2,563.78
- Equity investment in subsidiaries2
97.57 75.91 67.13
Advances 7,337.29 8,139.92 8,590.20
Fixed & other assets 822.89 744.71 742.14
- RIDF 1and related 311.78 271.06 264.19
Total assets 12,304.33 13,541.96 14,112.98
1. Rural Infrastructure Development Fund
2. At March 31, 2022 and December 31, 2021, the Bank’s equity investment in ICICI Lombard General Insurance Company
Limited was ₹ 13.31 billion. The company ceased to be a subsidiary of the Bank during Q2-202270

Equity investment in subsidiaries
71
slide 14
(` billion) Mar 31,
2021
Dec 31,
2021
Mar 31,
2022
ICICI Prudential Life Insurance 32.75 32.75 32.75
ICICI Bank Canada 18.74 18.74 9.96
ICICI Bank UK 18.05 9.70 9.70
ICICI Lombard General Insurance 13.31 -1
-1
ICICI Home Finance 11.12 11.12 11.12
ICICI Securities Limited 1.22 1.22 1.22
ICICI Securities Primary Dealership 1.58 1.58 1.58
ICICI AMC 0.61 0.61 0.61
ICICI Venture Funds Mgmt 0.05 0.05 0.05
Others 0.14 0.14 0.14
Total 97.57 75.91 67.13
• ICICI Bank Canada repatriated equity capital amounting to CAD 220 million in Q4-2022
• ICICI Bank UK repatriated equity capital amounting to USD 200 million in Q2-2022
1. At March 31, 2022 and December 31, 2021, the Bank’s equity investment in ICICI Lombard General Insurance Company
Limited was ₹ 13.31 billion. The company ceased to be a subsidiary of the Bank during Q2-2022

Portfolio composition
Mar 31, 2021 Dec 31, 2021 Mar 31, 2022
Domestic 90.0% 90.8% 91.2%
International 10.0% 9.2% 8.8%
Total consolidated advances
(` billion)
7,918 8,746 9,203
72
slide 14

Retail, rural and business banking NPAs
73
slide 34
` in billionMar 31,
2021
Dec 31,
2021
Mar 31,
2022
Gross retail, rural and business banking NPAs 151.30 135.94 128.32
- as a % of gross advances 3.04% 2.43% 2.17%
Net retail, rural and business banking NPAs 62.63 55.21 53.05
- as a % of net advances 1.28% 1.00% 0.91%

Sector-wise exposures
Top 10 sectors1: % of total exposure of
the Bank
Mar 31,
2018
Mar 31,
2019
Mar 31,
2020
Mar 31,
2021
Mar 31,
2022
Retail finance2 27.6% 30.4% 32.2% 33.9% 36.3%
Rural 4.5% 4.7% 4.9% 6.3% 5.8%
Services – finance 7.0% 7.3% 8.4% 9.9% 8.9%
Banks 8.4% 7.9% 6.4% 7.9% 7.9%
Electronics & engineering 6.8% 6.7% 6.1% 4.5% 4.2%
Crude petroleum/refining &
petrochemicals
5.6% 5.7% 5.9% 4.9% 4.1%
Wholesale/retail trade 3.0% 3.3% 3.9% 3.4% 3.3%
Road, port, telecom, urban development
& other infra
4.2% 4.6% 4.3% 3.5% 3.2%
of which: Telecom 1.5% 2.0% 1.7% 1.6% 1.4%
Services - non finance 3.4% 3.2% 3.0% 2.8% 3.0%
Power 4.6% 3.3% 3.1% 2.5% 2.4%
Construction 3.2% 3.0% 2.6% 2.3% 2.3%
Total (` billion) 10,265 11,207 12,446 14,223 16,648
1. Top 10 based on position at Mar 31, 2022
2. From Mar 31, 2022, the Bank has started reporting rural portfolio separately from retail finance. Previous period numbers have been re-
classified
74
slide 47

Consolidated capital adequacy
Basel III (%) Dec 31,
2021
Mar 31,
20221
Total capital 17.64% 18.87%
- Tier I 16.65% 18.02%
- of which: CET 1 15.59% 17.34%
- Tier II 0.99% 0.84%
1. After reckoning the impact of proposed dividend
75
slide 51
• Including profits for 9M-2022, CET1 ratio was 17.38%, Tier I ratio was
18.44% and total capital adequacy ratio was 19.43% at Dec 31, 2021

Insurance entities
ICICI Life (` billion) FY2021 Q4-2021 Q3-2022 Q4-2022 FY2022
Annualised premium equivalent 64.62 25.09 19.29 26.08 77.33
- Of which: protection 10.46 3.44 3.06 4.57 13.13
Assets under management 2,142.18 2,142.18 2,375.60 2,404.92 2,404.92
Expense ratio1
14.8% 15.3% 17.5% 20.6% 18.6%
1. All expenses (including commission) / (Total premium – 90% of single premium)
2. In accordance with the Scheme of Arrangement between ICICI General and Bharti AXA General Insurance, assets and
liabilities of Bharti AXA’s general insurance business vested with ICICI General on the appointed date of April 1, 2020. ICICI
General’s financial statements for Q1-2022 have been restated to reflect the scheme. Prior period numbers are not
comparable due to the reflection of the Scheme of Arrangement in current period numbers
3. Annualised for all interim periods
ICICI General2
(` billion) FY2021 Q4-2021 Q3-2022 Q4-2022 FY2022
Gross written premium 143.20 35.60 47.86 50.01 185.62
Combined ratio 99.8% 101.8% 104.5% 103.2% 108.8%
Return on average equity3 21.7% 18.8% 14.6% 14.0% 14.7%
76

ICICI Bank UK
(USD million) FY2021 Q4-2021 Q3-2022 Q4-2022 FY2022
Net interest income 50.9 11.5 9.8 10.0 40.5
Operating profit 25.9 6.8 2.1 4.3 14.4
Loans and advances 1,574.5 1,574.5 1,377.4 1,244.3 1,244.3
Deposits 1,957.5 1,957.5 1,598.4 1,542.0 1,542.0
- Retail term deposits 466.7 466.7 314.9 240.0 240.0
Capital adequacy ratio 28.3% 28.3% 21.9% 23.0% 23.0%
- Tier I 23.8% 23.8% 17.0% 17.8% 17.8%
• Net impaired loans were USD 25.4 million at Mar 31, 2022 compared to USD
27.7 million at Dec 31, 2021 and USD 34.5 million at Mar 31, 2021
77

ICICI Bank UK1
Asset profileLiability profile
Total liabilities: USD 2.24 bnTotal assets: USD 2.24 bn
78
1. At Mar 31, 2022
2. Includes cash & advances to banks and T Bills
3. Includes securities re-classified to loans & advances
3
2

ICICI Bank Canada
(CAD million) FY2021 Q4-2021 Q3-2022 Q4-2022 FY2022
Net interest income 46.3 10.1 11.6 11.5 44.0
Operating profit 13.7 6.2 8.9 8.0 34.1
Loans and advances 5,086.7 5,086.7 4,997.9 4,984.1 4,984.1
- Residential mortgages 3,627.3 3,627.3 3,658.8 3,692.5 3,692.5
Deposits 2,716.4 2,716.4 2,793.0 2,851.7 2,851.7
Capital adequacy ratio 24.1% 24.1% 26.5% 17.2% 17.2%
- Tier I 23.3% 23.3% 25.9% 16.5% 16.5%
• Net impaired loans at Mar 31, 2022 were CAD 0.3 million compared to CAD 1.1
million at Dec 31, 2021 and Mar 31, 2021
79

2
ICICI Bank Canada1
Liability profileAsset profile
Total liabilities: CAD 5.74 bn
Total assets: CAD 5.74 bn
80
1. At Mar 31, 2022
2. Includes cash & placements with banks and government securities
3. Insured mortgages include CAD 2,400.3 million at Mar 31, 2022 (Dec 31, 2021: CAD 2,432.6 million) of securitised mortgages
4. As per IFRS, proceeds of CAD 2,369.2 million at Mar 31, 2022 (Dec 31, 2021: CAD 2,400.4 million) on securitisation of
residential mortgages are considered a part of borrowings
4
3

ICICI Home Finance1
(` billion) Dec 31, 2021 Mar 31, 2022
Loans and advances 139.78 144.98
Gross impaired loans (stage 3)2
12.13 8.60
Net impaired loans (stage 3) 9.28 6.24
Capital adequacy ratio 20.57% 21.90%
1. As per Ind AS
2. Includes commercial real estate loans of ` 1.62 billion at Mar 31, 2022 (Dec 31, 2021: ` 2.00 billion)81
slide 53
• At Mar 31, 2022, loans to borrowers where resolution was implemented as per the framework
announced by RBI in August 2020 and May 2021 were ` 8.62 billion; provisions held on these
loans were ` 0.96 billion

1
Analyst call on April 23, 2022: opening remarks
Certain statements in this release relating to a future period of time (including
inter alia concerning our future business plans or growth prospects) are
forward-looking statements intended to qualify for the 'safe harbor' under
applicable securities laws including the US Private Securities Litigation Reform
Act of 1995. Such forward-looking statements involve a number of risks and
uncertainties that could cause actual results to differ materially from those in
such forward-looking statements. These risks and uncertainties include, but are
not limited to statutory and regulatory changes, international economic and
business conditions, political or economic instability in the jurisdictions where
we have operations, increase in non-performing loans, unanticipated changes
in interest rates, foreign exchange rates, equity prices or other rates or prices,
our growth and expansion in business, the adequacy of our allowance for credit
losses, the actual growth in demand for banking products and services,
investment income, cash flow projections, our exposure to market risks,
changes in India’s sovereign rating, and the impact of the Covid-19 pandemic
which could result in fewer business opportunities, lower revenues, and an
increase in the levels of non-performing assets and provisions, depending inter
alia upon the period of time for which the pandemic extends, the remedial
measures adopted by governments and central banks, and the time taken for
economic activity to resume at normal levels after the pandemic, as well as
other risks detailed in the reports filed by us with the United States Securities
and Exchange Commission. Any forward-looking statements contained herein
are based on assumptions that we believe to be reasonable as of the date of
this release. ICICI Bank undertakes no obligation to update forward-looking
statements to reflect events or circumstances after the date thereof. Additional
risks that could affect our future operating results are more fully described in
our filings with the United States Securities and Exchange Commission. These
filings are available at www.sec.gov.
This release does not constitute an offer of securities.

2
Mr. Bakhshi’s opening remarks
Good evening to all of you and welcome to the ICICI Bank Earnings Call
to discuss the results for Q4 of FY2022. Joining us today on this call are
Vishakha, Anup, Sandeep Batra, Rakesh and Anindya.
We hope that you are safe and in good health.
In January we saw a sharp rise in the number of Covid-19 cases that
resulted in a moderation in the pace of economic activity. However, the
impact of this third wave of the pandemic was mild and with the decline
in number of new Covid-19 cases, economic activity gained momentum
in the months of February and March. This was visible in the Bank’s Ultra
Frequency Index, comprising several high frequency indicators tracked
by our Economic Research Group, which rose from 112.0 in January to
114.9 in February and 124.4 in March. Some of the major factors leading
to improvement in this index were increase in power demand, rail freight
revenues, e-way bill generation and GST collections. We extend our
gratitude to the medical and health workers’ fraternity for their tireless
effort in this fight against Covid-19.
At ICICI Bank, we aim to grow the core operating profit within the
guardrails of compliance and risk through our 360-degree customer-
centric approach and focus on opportunities across client and segment
ecosystems. We focus on growing our loan portfolio in a granular manner
with a focus on risk and reward, with return of capital and containment of

3
provisions below a defined percentage of core operating profit being a
key imperative. We follow a micro market based approach to create an
efficient distribution and resource allocation strategy by using analytics to
identify opportunities. We aim to steadily grow our business within our
strategic framework and strengthen our franchise, delivery, and servicing
capabilities, backed by a range of digital initiatives.
Coming to the quarterly performance against this framework:
First- Growth in the core operating profit in a risk-calibrated
manner through the focused pursuit of target market segments
The core operating profit increased by 18.7% year-on-year to 101.64
billion Rupees in this quarter and 22.3% year-on-year to 383.47 billion
Rupees in FY2022. Excluding dividend income from subsidiaries and
associates, core operating profit grew by 21.0% year-on-year in Q4 of
2022. The profit after tax grew by 59.4% year-on-year to 70.19 billion
Rupees in this quarter. For the fiscal year 2022, the profit after tax
increased by 44.1% year-on-year to 233.39 billion Rupees. The Board has
recommended a dividend of 5 Rupees per share for FY2022, subject to
requisite approvals.
Second-Further enhancing our strong deposit franchise
Total deposits grew by 14.2% year-on-year at March 31, 2022. During the
quarter, average current account deposits increased by 23.6% year-on-

4
year and average savings account deposits by 22.7% year-on-year. The
liquidity coverage ratio for the quarter was about 130%, reflecting
continued surplus liquidity. Our cost of deposits continues to be among
the lowest in the system.
Third-Growing our loan portfolio in a granular manner with a
focus on risk and reward
The retail loan portfolio, excluding rural loans, grew by 19.7% year-on-
year and 6.0% sequentially at March 31, 2022. Disbursements across
various retail products increased in Q4 of 2022 compared to the previous
quarter. The business banking portfolio grew by 43.2% year-on-year and
10.2% sequentially at March 31, 2022. The SME portfolio grew by 33.6%
year-on-year and 11.3% sequentially. The growth in our SME and
business banking portfolios has been driven by our digital offerings and
platforms like InstaBIZ and Merchant Stack.
The domestic corporate portfolio grew by 9.7% year-on-year and was flat
sequentially at March 31, 2022. The domestic loan portfolio grew by
17.5% year-on-year and 5.7% sequentially. The overall loan portfolio
grew by 17.1% year-on-year and 5.5% sequentially at March 31, 2022.
Fourth-Leveraging digital across our business
Our various digital platforms such as iMobile Pay, internet banking
platforms, InstaBIZ and Trade Online provide end-to-end seamless digital
5
journeys, personalized solutions and value added features to customers
and enable more data driven cross sell and up sell. In line with the
philosophy of open architecture, of our digital platforms, recently, we
made our InstaBIZ app interoperable, that is, all benefits of the app are
now available to all merchants including those who do not have a current
account with us. This initiative enables merchants to instantly create
digital collection solutions like UPI ID and QR code and start collecting
money from their customers. We have shared some details on our
technology and digital offerings in slides 18 to 32 of the investor
presentation.
Fifth - Protecting the balance sheet from potential risks
Net NPAs declined by 24.2% year-on-year and 5.2% sequentially to 69.61
billion Rupees at March 31, 2022 from 73.44 billion Rupees at December
31, 2021. The net NPA ratio declined to 0.76% at March 31, 2022 from
0.85% at December 31, 2021. During the quarter, there were net deletions
from gross NPAs of 4.89 billion Rupees, excluding write-offs and sale. The
provision coverage ratio on NPAs was 79.2% at March 31, 2022. The total
provisions during the quarter were 10.69 billion Rupees or 10.5% of core
operating profit and 0.53% of average advances. This includes
contingency provision of 10.25 billion Rupees made on a prudent basis.
The Bank holds contingency provisions of 74.50 billion Rupees or about
0.9% of total loans as of March 31, 2022.

6
Sixth- Maintaining a strong capital base
The capital position of the Bank continued to be strong with a CET-1 ratio
of 17.60% at March 31, 2022 after reckoning the impact of the proposed
dividend. The Tier 1 ratio was 18.35% and the total capital adequacy ratio
was 19.16% at March 31, 2022. Further, the market value of the Bank’s
investments in listed entities of the Group is about 840 billion Rupees.
As has been announced, Vishakha has decided to pursue opportunities
outside the Group and will step down from the Board effective May 31.
We thank her for her outstanding contribution to ICICI and wish her all the
very best. Anup would take over Vishakha’s responsibilities at the Board
level. The Board has today approved the elevation of Rakesh as an
Executive Director and he would take over Anup’s responsibilities.
Anindya will take up the role of CFO and will report to Sandeep Batra who
will continue to head our Corporate Centre.
At ICICI Bank, we strive to build a sustainable and responsible business
and make a positive impact on the economy, society and environment.
The Bank has focused on various aspects of ESG in its business as well
as CSR activities. We have adopted a Board approved ESG Policy along
with a governance and oversight framework for ESG.
Looking ahead, we see many opportunities to grow our core operating
profit in a risk-calibrated manner. We will continue to focus on our
objective of catering to all the banking and financial needs of the customer
with a focus on risk and reward. Our ecosystem based approach and

7
creation of multi-functional teams has helped in nurturing relationships
and offering the entire bouquet of services of the Bank to customers. We
continue to be guided by the twin principles of “One Bank, One RoE”,
emphasising the goal of maximizing our share of target market across all
products and services and “Fair to Customer, Fair to Bank”, emphasising
the need to deliver fair value to customers while creating value for
shareholders. We remain focused on delivering consistent and
predictable returns to our shareholders.
I now hand the call over to Rakesh.

8
Rakesh’s opening remarks
Thank you, Sandeep. I will talk about balance sheet growth, credit quality,
P&L details, growth in digital offerings, portfolio trends and performance
of subsidiaries.
A. Balance sheet growth
Sandeep covered the loan growth across various segments. Up to the last
quarter, we used to report rural loans as a part of the retail portfolio. From
this quarter, we are reporting rural separately. The retail loan portfolio,
excluding rural loans, grew by 19.7% year-on-year and 6.0% sequentially
at March 31, 2022. Coming to the growth across retail products, the
mortgage portfolio grew by 20.3% year-on-year, and auto loans by
11.3%. The commercial vehicles and equipment portfolio declined by
1.3% year-on-year. Growth in the personal loan and credit card portfolio
was 31.9% year-on-year. This portfolio was 879.35 billion Rupees or
10.2% of the overall loan book at March 31, 2022. The rural loan portfolio
increased by 6.5% year-on-year and 4.3% sequentially. The retail and
rural portfolio together grew by 17.6% year-on-year and 5.8%
sequentially.
The overseas loan portfolio, in US dollar terms, grew by 5.9% year-on-
year and was flat sequentially at March 31, 2022. The year-on-year
increase in the overseas loan portfolio was primarily due to increase in
the India-linked trade finance book. The overseas loan portfolio was 4.8%

9
of the overall loan book at March 31, 2022. The non-India linked corporate
portfolio reduced by 48.2% or about 597 million US Dollars year-on-year
and 6.8% or about 47 million US Dollars sequentially. Of the overseas
corporate portfolio, about 82% comprises Indian corporates, 10% is
overseas corporates with Indian linkage, 4% comprises companies
owned by NRIs or PIOs and balance 4% is non-India corporates. Our
direct exposure to Russia and Ukraine is negligible. We have exposure to
an Indian oil refinery rated AA- externally where a sanctioned Russian
entity owns 49% stake. The exposure is largely non-fund in nature. The
oil refinery’s operations are largely in India.
Coming to the funding side: average savings account deposits increased
by 22.7% year-on-year in Q4 and 23.5% year-on-year in FY2022. Average
current account deposits increased by 23.6% year-on-year in Q4 and
31.0% year-on-year in FY2022. Total term deposits grew by 9.0% year-
on-year at March 31, 2022.
B. Credit quality
The net deletions from gross NPAs were 4.89 billion Rupees in the current
quarter compared to 1.91 billion Rupees in the previous quarter. There
were net additions of 1.23 billion Rupees to gross NPAs in the retail, rural
and business banking portfolios and net deletions of 6.12 billion Rupees
to gross NPAs in the corporate and SME portfolios.

10
The gross NPA additions were 42.04 billion Rupees in the current quarter
compared to 40.18 in the previous quarter. The gross NPA additions from
the retail, rural and business banking portfolio were 37.36 billion Rupees
and from the corporate and SME portfolio were 4.68 billion Rupees.
Recoveries and upgrades from NPAs, excluding write-offs and sale, were
46.93 billion Rupees in the current quarter compared to 42.09 billion
Rupees in the previous quarter. There were recoveries and upgrades of
36.13 billion Rupees from the retail, rural and business banking portfolio
and 10.80 billion Rupees from the corporate and SME portfolio. Corporate
and SME recoveries and upgrades include a power sector account which
was upgraded post implementation of a resolution plan under IBC. The
gross NPAs written-off during the quarter were 26.44 billion Rupees.
The non-fund based outstanding to borrowers classified as non-
performing was 36.40 billion Rupees as of March 31, 2022 compared to
36.38 billion Rupees as of December 31, 2021. The Bank holds provisions
amounting to 20.51 billion Rupees as of March 31, 2022 against this non-
fund based outstanding.
The total fund based outstanding to all standard borrowers, under
resolution as per various guidelines declined to 82.67 billion Rupees or
about 1.0% of the total loan portfolio at March 31, 2022 from 96.84 billion
Rupees as of December 31, 2021. The sequential decline was mainly due
to prepayment by a borrower in the construction sector. Of the total fund
based outstanding under resolution at March 31, 2022, 60.43 billion
Rupees was from the retail, rural and business banking portfolio and 22.24
billion Rupees was from the corporate and SME portfolio. The Bank holds

11
provisions of 25.30 billion Rupees against these borrowers, which is
higher than the requirement as per RBI guidelines.
C. P&L Details
Net interest income increased by 20.8% year-on-year to 126.05 billion
Rupees. The net interest margin was at 4.00% in this quarter compared
to 3.96% in the previous quarter and 3.84% in Q4 of last year. The impact
of interest on income tax refund on net interest margin was 1 bps in Q4
of this year compared to 6 bps in the previous quarter and 1 bps in Q4 of
last year. The domestic NIM was at 4.12% this quarter compared to 4.06%
in previous quarter and 3.94% in Q4 last year. The cost of deposits was
3.48% in this quarter compared to 3.47% in previous quarter. Of the total
domestic loans, interest rates on 41% are linked to repo rate and 7% to
other external benchmarks.
Non-interest income, excluding treasury income, grew by 11.4% year-on-
year to 46.08 billion Rupees in Q4 of 2022
Fee income increased by 14.4% year-on-year to 43.66 billion
Rupees in this quarter driven by growth across various
segments. Fees from retail, rural, business banking and SME
customers grew by 14.3% year-on-year and constituted about
77% of the total fees in this quarter
Dividend income from subsidiaries and associates was 2.32
billion Rupees in this quarter compared to 3.57 billion Rupees in

12
Q4 of last year. The dividend income in Q4 of last year included
interim dividend of ICICI General and ICICI Securities PD
On Costs: The Bank’s operating expenses increased by 17.4% year-on-
year in this quarter. The employee expenses increased by 21.0% year-on-
year. The Bank had about 105,800 employees at March 31, 2022. The
employee count has increased by about 7,000 in the last 12 months.
Employee expenses in this quarter include an impact of 0.69 billion
Rupees due to fair valuation of ESOPs granted to all employees post April
1, 2021 for the current quarter as required by RBI guidelines. Non-
employee expenses increased by 15.6% year-on-year in this quarter
primarily due to retail business and technology related expenses. The
technology expenses were about 8.5% of our operating expenses in
FY2022.
The core operating profit increased by 18.7% year-on-year to 101.64
billion Rupees in this quarter. Excluding dividend income from
subsidiaries and associates, the core operating profit, grew by 21.0%
year-on-year. The core operating profit grew by 22.3% year-on-year to
383.47 billion Rupees in FY2022.
There was a treasury gain of 1.29 billion Rupees in Q4 compared to 0.88
billion Rupees in Q3 and a loss of 0.25 billion Rupees in Q4 of the previous
year.
13
The total provisions during the quarter were 10.69 billion Rupees or
10.5% of core operating profit and 0.53% of average advances. During
the quarter we made contingency provisions of 10.25 billion Rupees on a
prudent basis. The Bank continues to carry Covid-19 related provision of
64.25 billion Rupees as contingency provisions at March 31, 2022. Thus,
the Bank holds contingency provision of 74.50 billion Rupees as of March
31, 2022. The provisioning coverage on NPAs continued to be robust at
79.2%. In addition, we hold 25.30 billion Rupees of provisions on
borrowers under resolution. At March 31, 2022, the total provisions, other
than specific provisions on fund-based outstanding to borrowers
classified as non-performing, were 179.18 billion Rupees or 2.1% of loans.
The profit before tax grew by 63.1% year-on-year to 92.24 billion Rupees
in this quarter. The tax expense was 22.05 billion Rupees in this quarter
compared to 12.54 billion Rupees in the corresponding quarter last year.
The profit after tax grew by 59.4% year-on-year to 70.19 billion Rupees in
this quarter. The profit after tax grew by 44.1% year-on-year to 233.39
billion Rupees in FY2022.
The consolidated profit after tax grew by 58.0% year-on-year to 77.19
billion Rupees in this quarter. The consolidated profit after tax grew by
36.6% year-on-year to 251.10 billion Rupees in FY2022.

14
D. Growth in digital offerings
Leveraging digital and technology across businesses is a key element of
our strategy of growing the risk calibrated core operating profit. We have
seen significant increase in the adoption of our mobile banking app,
iMobile Pay. There have been 6.3 million activations of iMobile Pay by
non-ICICI Bank account holders as of end-March. The value of
transactions by non-ICICI Bank account holders in the current quarter was
4.9 times the value of transactions in Q3 of 2022.
The value of credit card spends grew by 77% year-on-year in Q4 of 2022
driven by higher activation rate through digital onboarding of customers,
including Amazon Pay credit cards, automated and effective portfolio
management to grow spends among existing card customers and
diversification through commercial cards. The Bank has issued more than
3 million Amazon Pay credit cards since its launch. The Bank has recently
tied up with Emirates Skywards, the award-winning loyalty programme of
Emirates and FlyDubai, to launch a range of co-branded credit cards that
enable customers to earn reward points on travel, lifestyle and everyday
spends.
The value of financial transactions on InstaBIZ grew by about 44% year-
on-year in the current quarter. The value of transactions on the supply
chain platforms in the current quarter was 2.7 times the value of
transactions in Q4 last year.

15
The proportion of end-to-end digital sanctions and disbursements across
various products has been increasing steadily. About 34% of our
mortgage sanctions and 44% of our personal loan disbursements, by
volume, were end-to-end digital in FY2022.
The Bank has created more than 20 industry specific STACKs which
provide bespoke and purpose-based digital solutions to corporate clients
and their ecosystems. The volume of transactions through these solutions
in FY2022 was 2.7 times the volume of transactions in FY2021. The value
of transactions done on Trade Online increased by about 80% year-on-
year in FY2022.
E. Portfolio information
We have provided details on our retail, business banking and SME
portfolio in slides 43 to 46 of the investor presentation.
The loan and non-fund based outstanding to performing corporate and
SME borrowers rated BB and below was 108.08 billion Rupees at March
31, 2022 compared to 118.42 billion Rupees at December 31, 2021. The
amount of 108.08 billion Rupees at March 31, 2022 includes 23.89 billion
Rupee of loans under resolution. The sequential decline during the
quarter was mainly due to prepayment from a borrower in the
construction sector where resolution had been implemented as per RBI’s
Covid resolution framework. The details are given on slide 41 and 42 of
the investor presentation.

16
Other than two accounts one each in power and telecom sectors, the
maximum single borrower outstanding in the BB and below portfolio was
less than 6 billion Rupees at March 31, 2022. At March 31, 2022, we held
provisions of 12.32 billion Rupees on the BB and below portfolio
compared to 15.75 billion Rupees at December 31, 2021. This includes
provisions held against borrowers under resolution included in this
portfolio.
The builder portfolio including construction finance, lease rental
discounting, term loans and working capital loans was 269.48 billion
Rupees at March 31, 2022 compared to 257.53 billion Rupees at
December 31, 2021. The builder portfolio is about 3% of our total loan
portfolio. Our portfolio is granular in nature with the larger exposures
being to well-established builders and this is also reflected in the
sequential increase in the portfolio. About 9.5% of our builder portfolio at
March 31, 2022 was either rated BB and below internally or was classified
as non-performing, compared to 11% at December 31, 2021.
F. Subsidiaries and key associates
The details of the financial performance of subsidiaries and key associates
are covered in slides 53 to 55 and slides 76 to 81 in the investor
presentation.

17
The VNB margin increased from 25.1% in FY2021 to 28.0% in FY2022.
The value of new business increased by 33.4% year-on-year to 21.63
billion Rupees in FY2022. The profit after tax of ICICI Life was 7.54 billion
Rupees in FY2022 compared to 9.60 billion Rupees in FY2021. The
Embedded value increased by 8.7% year-on-year to 316.25 billion Rupees
at March 31, 2022. The profit after tax was 1.85 billion Rupees in this
quarter compared to 0.64 billion Rupees in Q4 of last year.
Gross Direct Premium Income of ICICI General was 179.77 billion Rupees
in FY2022 compared to 140.03 billion Rupees in FY2021. The combined
ratio was 108.8% in FY2022 compared to 99.8% in FY2021. The profit
after tax was 12.71 billion Rupees in FY2022 compared to 14.73 billion
Rupees in FY2021. The profit after tax was 3.13 billion Rupees this quarter
compared to 3.46 billion Rupees in Q4 last year. Prior period numbers are
not comparable due to the reflection of the general insurance business of
Bharti AXA in the current period numbers.
The profit after tax of ICICI AMC was 3.57 billion Rupees in this quarter
compared to 3.48 billion Rupees in Q4 of last year.
The profit after tax of ICICI Securities, on a consolidated basis, increased
by 3% year-on-year to 3.40 billion Rupees in this quarter from 3.29 billion
Rupees in Q4 of last year.
ICICI Bank Canada had a profit after tax of 4.3 million Canadian dollars in
this quarter compared to 5.1 million Canadian dollars in Q4 last year and

18
11.5 million Canadian dollars in Q3 this year. Profit after tax was higher in
Q4 last year and Q3 this year due to write-back of provisions. ICICI Bank
Canada repatriated CAD 220 million of equity capital to ICICI Bank in Q4
this year.
ICICI Bank UK had a profit after tax of 3.1 million US dollars this quarter
compared to 2.8 million US dollars in Q4 of last year and 3.0 million US
dollars in Q3 this year.
As per Ind AS, ICICI Home Finance had a profit after tax of 0.53 billion
Rupees in the current quarter compared to 0.15 billion Rupees in Q4 of
last year and 0.48 billion Rupees in Q3 this year. The year-on-year
increase in profit after tax is mainly due to decline in cost of funds and
lower provisions.
With this, we conclude our opening remarks and we will now be happy
to take your questions.