Spatial Deterministic Modelling of Landslide in Chamoli Area
7
Journal of Studies in Dynamics and Change (JSDC), ISSN:2348-7038 Vol. 1, No. 6, October 2014 Suggested Citation Bhatt, P. K.; Ray P. K. C., Naithani, S. and Singh, A. (2014). Spatial Deterministic Modelling of Landslide in Chamoli Area.. Journal of Studies in Dynamics and Change (JSDC), 1(6), Pages 247-253.. ©LOKKATHA Debate on Development Website: http://www.jsdc.lokkatha.com Spatial Deterministic Modelling of Landslide in Chamoli Area Pradeep Kumar Bhatt P.K.Champati Ray Suneet Naithani Ashutosh Singh ABSTRACT The high susceptibility to landslides of the Himalayan terrain is mainly due to a complex geological setting combined with contemporary crustal movement, varying slopes and relief, heavy rainfall, along with increasing human interference of human in ecosystem. The paper presents Remote Sensing and GIS based spatial data analysis for landslide mapping in Chamoli district using IRS 1C LISS III, IRS 1C PAN image. Landslide map were prepared to understand the parameter which is influencing landslides. It includes the derivation of input parameters from remotely sensed data with limited field check. Factor of safety map is also calculated for the study area. Keywords: Landslide, GIS, DEM, Factor of Safety Author Details and Affiliations Pradeep Kumar Bhatt is currently working with NIIT GIS Ltd. (ESRI India), New Delhi, India. P.K.Champati Ray is currently working with Indian Institute of Remote Sensing (NRSA), Department of Space, Govt. of India, Dehradun, India. Suneet Naithani (Corresponding Author) is Assistant Professor, School of Environmental Studies and Natural Resources, Doon University, Uttrakhand, India. Ashutosh Singh is Research Scholar, School of Environmental Studies and Natural Resources, Doon University, Uttrakhand, India. 1. Introduction The Indian subcontinent has a highly diversified range of natural features. The entire Himalayan range is tectonically sensitive for earthquake and the state Uttarakhand is not an exception (Naithani et al., 2008). The Himalayas, which are the young fold mountain and where the phenomena of stress release is very common together with the uncertain monsoon winds make the region highly prone to natural disasters. The region being the most populous in the world further adds to the damage caused by the natural disasters. This region is prone mainly to earthquakes, landslides, avalanches and forest fire. Landslide may be defined as, “the movement of mass of rock, debris, or earth down a slope (Cruden, 1991). Landslides are a type of ‘mass wasting’ which denotes any down slope movement of soil and rock under the direct influence of gravity. The term “landslide” encompasses events such as rock falls, topples, slides, spreads and flows (Cruden&Varnes, 1996). Rainfall, earthquakes, volcanic activity, and changes in groundwater, disturbance and change of a slope by man-made construction activities, or any combination of these factors can initiate landslides. Landslide occurs in the hilly terrain. The Himalaya being geologically young and susceptible to earthquakes
Transcript of Spatial Deterministic Modelling of Landslide in Chamoli Area

Journal of Studies in Dynamics and Change (JSDC), ISSN:2348-7038 Vol. 1, No. 6, October 2014
Suggested Citation Bhatt, P. K.; Ray P. K. C., Naithani, S. and Singh, A. (2014). Spatial Deterministic Modelling of Landslide in Chamoli Area.. Journal of Studies in Dynamics and Change (JSDC), 1(6), Pages 247-253..
©LOKKATHA Debate on Development Website: http://www.jsdc.lokkatha.com
Spatial Deterministic Modelling of Landslide in Chamoli Area
Pradeep Kumar Bhatt P.K.Champati Ray
Suneet Naithani Ashutosh Singh
ABSTRACT The high susceptibility to landslides of the Himalayan terrain is mainly due to a complex geological setting combined with contemporary crustal movement, varying slopes and relief, heavy rainfall, along with increasing human interference of human in ecosystem. The paper presents Remote Sensing and GIS based spatial data analysis for landslide mapping in Chamoli district using IRS 1C LISS III, IRS 1C PAN image. Landslide map were prepared to understand the parameter which is influencing landslides. It includes the derivation of input parameters from remotely sensed data with limited field check. Factor of safety map is also calculated for the study area. Keywords: Landslide, GIS, DEM, Factor of Safety Author Details and Affiliations Pradeep Kumar Bhatt is currently working with NIIT GIS Ltd. (ESRI India), New Delhi, India. P.K.Champati Ray is currently working with Indian Institute of Remote Sensing (NRSA), Department of Space, Govt. of India, Dehradun, India. Suneet Naithani (Corresponding Author) is Assistant Professor, School of Environmental Studies and Natural Resources, Doon University, Uttrakhand, India. Ashutosh Singh is Research Scholar, School of Environmental Studies and Natural Resources, Doon University, Uttrakhand, India.
1. Introduction The Indian subcontinent has a highly diversified range of natural features. The entire Himalayan range is tectonically sensitive for earthquake and the state Uttarakhand is not an exception (Naithani et al., 2008). The Himalayas, which are the young fold mountain and where the phenomena of stress release is very common together with the uncertain monsoon winds make the region highly prone to natural disasters. The region being the most populous in the world further adds to the damage caused by the natural disasters. This region is prone mainly to earthquakes, landslides, avalanches and forest fire.
Landslide may be defined as, “the movement of mass of rock, debris, or earth down a slope (Cruden, 1991). Landslides are a type of ‘mass wasting’ which denotes any down slope movement of soil and rock under the direct influence of gravity. The term “landslide” encompasses events such as rock falls, topples, slides, spreads and flows (Cruden&Varnes, 1996). Rainfall, earthquakes, volcanic activity, and changes in groundwater, disturbance and change of a slope by man-made construction activities, or any combination of these factors can initiate landslides. Landslide occurs in the hilly terrain. The Himalaya being geologically young and susceptible to earthquakes

Journal of Studies in Dynamics and Change (JSDC), ISSN:2348-7038, Vol. 1, No. 6, October 2014
248 Bhatt, Ray, Naithani & Singh(2014)
makes it susceptible for landslide. Intensive soil erosion is also one of the main factors for the occurrences of landslides. Over the years, due to increasing cultural activity, the incidences of landslides have shown a disturbing trend of occurrence with higher damage to life and property. Landslides cause approximately 1000 deaths per year, causing property damage of approximately US $4 billion (Alexander, 1995). Landslides pose serious threats to settlements, and structures that support transportation, natural resources management and tourism. They cause considerable damage to highways, railways, waterways and pipelines. They commonly occur with other major natural disasters such as earthquakes (Keefer, 1984), volcanic activity (Kimura and Yamaguchi, 2000), and floods caused by heavy rainfall. Landslide occurs in various geological environments, ranging from steep rock slopes to gentle slopes with unconsolidated sediments. In many cases, expanded development and human activities, such as modified slope and deforestation can also increase the incidence of landslide disasters. The increasing trend of landslide occurrences will continue in future with the increased unplanned urbanization and development, continued deforestation and increased regional precipitation due to unprecedented rainfall may be because of changing climatic patterns (Naithani et al., 2013). The landslides occur mostly during the monsoon season when huge precipitation saturates the unstable soil, leading to high erosion rates, and high likelihoods of landslides (Bhasin et al., 2002). Landslide can be rapid or slow, and occur in a wide variety of geologic environments, including underwater. Other effects are upstream and downstream flooding due to landslide dams and dam breaks. (Evans and Savigny, 1994). In Himalayas natural hazard such as landslide causes havoc to both property and life every year. Landslide hazard Zonation of areas affected by landslides therefore is essential for future development planning and organization of various disasters and mitigation programs. Aerial photographs were used by Indian Institute of Remote Sensing (IIRS) to study slope failure processes in Alaknanda valley. Large scale aerial photographs on 1:10,000 (approx.) scale supplemented by limited use of Landsat MSS data were analysed for evaluating slope conditions in Tapoban-Vishnugad and Bowala-NandprayagHydel scheme in Chamoli district of Uttaranchal (Lakhera, 1982). Remote sensing data of IRS 1A LISS II were
integrated in GIS environment by Lakhera et al., (1992) to prepare the landslide hazard zone map in parts of Chamoli region. The major objectives of the study are preparation of the landslide map and to understand the parameter which is influencing landslides. It includes the derivation of input parameters from remotely sensed data with limited field check. Factor of safety map is calculated for the study area. 2. Study area Chamoli is surrounded by the district of Uttarkashi in the NW, Pithoragarh in the NE, Almora in the SE. the total geographic area is around 7520 sq. km. Gopeshwar is the district headquarters. The nearest airport is Jollygrant and nearest railway station is at Rishikesh. The study area is bounded by North 30022’ 30’’ to 300 30’ 00” and East 790 15’ 00” to 79022’ 30” in survey of India toposheet no. 53 N/7 NW covering village like Bhimtalla, Chamoli town, Gopeshwar and Mandal. 3. Methodology The research work is carried out using IRS 1C LISS III, IRS 1C PAN image in addition with SRTM DEM. SOI Toposheet 53 N/7 NW on 1:25,000 is also used for the study. In order to achieve the objectives of the study, the following methodology has adopted for the entire work. The whole work of the study has been carried out in three stages.
1. Pre-Field (Mainly literature survey) 2. Field work (Data Collection) 3. Post Field (Mainly analysis part and
modelling) 3.1 Modelling: Following steps were taken for modelling- Compute the static factor of safety (ratio of resisting to driving forces)
i. Using compiled shear-strength data, assign representative shear strengths to each unit on the geologic map, which yield friction (Φ) and cohesion (c’) grids.
ii. Construct a slope map from digital elevation model (DEM).
Journal of Studies in Dynamics and Change (JSDC), ISSN:2348-7038, Vol. 1, No. 6, October 2014
249 Bhatt, Ray, Naithani & Singh(2014)
iii. Combine shear-strength and slope data in factor of safety equation to estimate static factors of safety in each grid cell.
3.2. Selection of Strength Parameter A critical aspect of creating a representative slope stability model is the selection of strength parameters. Ultimately, this data will have to be collected on a site-specific basis. Distribution of the material (Lithology) is shown, on 1:25,000 scale that are based on the geological mapping of the region description for each unit are based on field observation, image interpretation, published reports geological/geo-morphological maps, geotechnical strength parameters such as cohesion value and friction angle have been taken for lithosphere assigned to the samples taken from the field observation. 3.3. Data Available for modelling
i. Comprehensive inventory of triggered
landslides. ii. Geological map of study area. iii. Engineering properties of geologic units. iv. DEM of the topography.
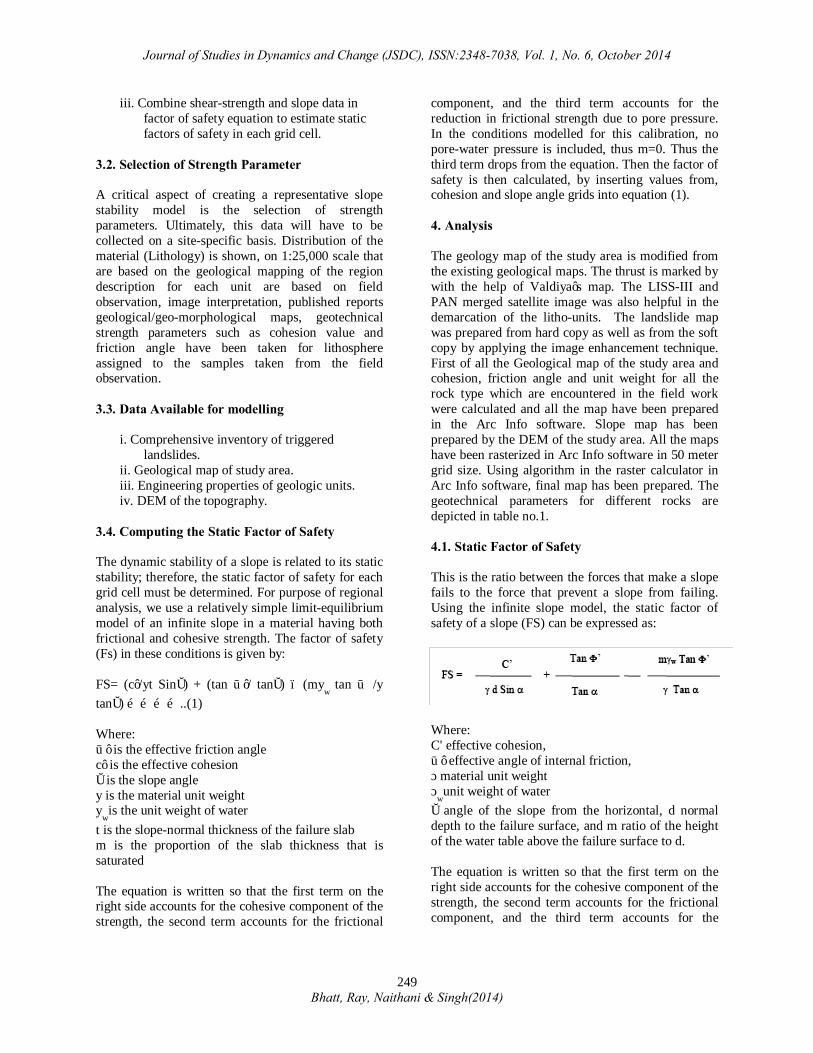
3.4. Computing the Static Factor of Safety The dynamic stability of a slope is related to its static stability; therefore, the static factor of safety for each grid cell must be determined. For purpose of regional analysis, we use a relatively simple limit-equilibrium model of an infinite slope in a material having both frictional and cohesive strength. The factor of safety (Fs) in these conditions is given by: FS= (c’/yt Sinα) + (tan Φ’/ tanα) – (my
w tan Φ /y
tanα) …………..(1) Where: Φ’ is the effective friction angle c’ is the effective cohesion α is the slope angle y is the material unit weight y
wis the unit weight of water
t is the slope-normal thickness of the failure slab m is the proportion of the slab thickness that is saturated The equation is written so that the first term on the right side accounts for the cohesive component of the strength, the second term accounts for the frictional
component, and the third term accounts for the reduction in frictional strength due to pore pressure. In the conditions modelled for this calibration, no pore-water pressure is included, thus m=0. Thus the third term drops from the equation. Then the factor of safety is then calculated, by inserting values from, cohesion and slope angle grids into equation (1). 4. Analysis The geology map of the study area is modified from the existing geological maps. The thrust is marked by with the help of Valdiya’s map. The LISS-III and PAN merged satellite image was also helpful in the demarcation of the litho-units. The landslide map was prepared from hard copy as well as from the soft copy by applying the image enhancement technique. First of all the Geological map of the study area and cohesion, friction angle and unit weight for all the rock type which are encountered in the field work were calculated and all the map have been prepared in the Arc Info software. Slope map has been prepared by the DEM of the study area. All the maps have been rasterized in Arc Info software in 50 meter grid size. Using algorithm in the raster calculator in Arc Info software, final map has been prepared. The geotechnical parameters for different rocks are depicted in table no.1.
4.1. Static Factor of Safety This is the ratio between the forces that make a slope fails to the force that prevent a slope from failing. Using the infinite slope model, the static factor of safety of a slope (FS) can be expressed as:
Where: C' effective cohesion, Φ’ effective angle of internal friction, γ material unit weight γ
wunit weight of water
α angle of the slope from the horizontal, d normal depth to the failure surface, and m ratio of the height of the water table above the failure surface to d. The equation is written so that the first term on the right side accounts for the cohesive component of the strength, the second term accounts for the frictional component, and the third term accounts for the

Journal of Studies in Dynamics and Change (JSDC), ISSN:2348-7038, Vol. 1, No. 6, October 2014
250 Bhatt, Ray, Naithani & Singh(2014)
reduction in frictional strength due to pore pressure. In the conditions modelled for this calibration, no pore pressure is included (m=0), because in this case it was supposed that there is dry condition. 5. Conclusion IRS-LISS-III and PAN data products could provide surface changes related to landslides using various change detection technique. The detailed geologic field investigation is required to calculate hazard zone to carry out such study. The factor of safety mostly depends upon the geotechnical parameters. At many places, unconsolidated sediments are not considered due to lack of information on their thickness, which should be incorporated as these are very vulnerable. Ortho-rectification is highly essential for the rugged topography like in this case. Most of the region of landslide map falls on the areas which have less factor of safety. The area is more prone for the failure of the mass. The area which falls in FS<1 is most unstable area, FS>1 is mod. Unstable and FS<6 is most stable.
Works Cited Alexander, D., 1995. Natural Disasters. Chapman and
Hall, New York, pp 621. Cruden, D.M., 1991. A simple definition of a
landslide. Bulletin International Association for Engineering Geology, 43: 27-29
Cruden, D and Varnes D.J., 1996. Landslide types
and processes, In: AK Turner and R.L. Schuster (Editors), Landslides Investigation and Mitigation, Special Report 247, Transportation Research Board, National Academy of Sciences, Washington, D.C., 36-75.
Keefer, D. K., 1984. Landslides caused by
earthquake. Bulletin of the Geological Society of America. 95 (4), 406-421.
Kimura, H. and Yamaguchi, Y., 2000. Detection of
landslide areas using Radar Interferometry,
Photogrammetric Engineering and Remote Sensing, 66 (3), 337-344.
Bhasin, R., Grimstad, E., Larsen, J.O., Dhawan,
A.K., Singh, R., Verma, S.K and Venkatachalam, K., 2002. Landslide hazards and mitigation measures at Gangtok, Sikkim Himalaya, Engg. Geology, 64, 351–368.
Evans, S. G. and Savigny K.W., 1994.Landslide in
the Vancouver –Fraser Valley- Whistler region. (In) Geology and Geological Hazards of the Vancouver Region, SouthwesternBritish Columbia. (ed) J.W. H. Monger; Geological Survey of Canada, Bulletin 481, p 251-286
Lakhera, R.C., 1982. Geotechnical studies of
Bowala-NandprayagHydel-Scheme Area, Chamoli District, U.P., Unpublished report of IIRS, Dehradun.
Lakhera, R.C., Roy, A.K., Prusty, B.G. and Mittal,
S.K., 1992. Landslide hazard zonation studies in parts of Garhwal Himalayas using remote sensing and GIS techniques. Proc. Nat. Symp. on Rem. Sen. for Sustainable Development, pp.227-232.
Naithani, S., Bhardwaj P. and Chaudhry A.,
2013.Landslide Hazard Zonation Mapping of Kempty Fall Area, Mussoorie, Using RS &GIS. International Journal of Asian, Academic Research Associates (AARA), Vol. 1, Issue 10, p.224-235.
Naithani, S., Doval M.M. and Juyal N.,
(2008).Turbulent Terrain and Threatened Livelihood. 2nd Australasian Natural Hazards Management Conference,28-31July 2008, Te Papa, Wellington, New Zealand,Stewart, C. (editor), GNS Science Miscellaneous Series 15,Poster Paper, e- proceedings, p.45.

Journal of Studies in Dynamics and Change (JSDC), ISSN:2348-7038, Vol. 1, No. 6, October 2014
251 Bhatt, Ray, Naithani & Singh(2014)
Tables and Figures Used
Table1 Geotechnical Parameters for different rocks
Rock Type Cohesion Friction Unit Weight Quartzite 50 32 27 Gneiss 40 30 23 HGM 55 34 26 Phyllite 30 29 24 Qtzschist 31 28 22 Mylonite 35 31 21 Fluvioglacial Material 20 18 20 Alluvium 18 15 18
Fig 1 Location Map and satellite Image of the study area
Fig 2 Flow Chart of the Methodology

Journal of Studies in Dynamics and Change (JSDC), ISSN:2348-7038, Vol. 1, No. 6, October 2014
252 Bhatt, Ray, Naithani & Singh(2014)
Fig 3 Flow chart of Modelling
Fig 4 Slope Map Fig 5 Lithology Map
Fig 6 Landslide Map

Journal of Studies in Dynamics and Change (JSDC), ISSN:2348-7038, Vol. 1, No. 6, October 2014
253 Bhatt, Ray, Naithani & Singh(2014)
Fig 7 Geotechnical Parameters Maps
(Cohesion Map, Unit Weight and Friction Angle Map)
Fig 8. Factor of Safety Map Fig 9. Factor of Safety Map Overlaid with Landslide Map