Laser synthesis and luminescence properties of SrAl2O4:Eu2+, Dy3+ phosphors
Upload
srivenketeswarauiversityCategory
view
3download
0
This article appeared in a journal published by Elsevier. The attachedcopy is furnished to the author for internal non-commercial researchand education use, including for instruction at the authors institution
and sharing with colleagues.
Other uses, including reproduction and distribution, or selling orlicensing copies, or posting to personal, institutional or third party
websites are prohibited.
In most cases authors are permitted to post their version of thearticle (e.g. in Word or Tex form) to their personal website orinstitutional repository. Authors requiring further information
regarding Elsevier’s archiving and manuscript policies areencouraged to visit:
http://www.elsevier.com/copyright

Author's personal copy
Optical properties and generation of white lightin Dy3þ-doped lead phosphate glasses
K. Linganna, Ch. Srinivasa Rao, C.K. Jayasankar n
Department of Physics, Sri Venkateswara University, Tirupati 517502, India
a r t i c l e i n f o
Article history:
Received 17 June 2012
Received in revised form
2 December 2012
Accepted 4 December 2012Available online 12 December 2012
Keywords:
Lead phosphate glasses
Dysprosium
Fluorescence
Lifetime
White light
a b s t r a c t
Dy3þ-doped lead phosphate (PbPKANDy: P2O5þK2OþAl2O3þPbOþNa2OþDy2O3)
glasses were prepared by melt quenching technique and their optical properties have
been studied. Judd-Ofelt parameters have been evaluated for 1.0 mol% Dy2O3-doped lead
phosphate glass and inturn derived radiative properties for excited luminescent levels of
Dy3þ ions. The yellow-to-blue emission intensity ratios and CIE chromaticity coordinates
were calculated which have been used to evaluate white light emission as a function of
the activator (Dy3þ) ion concentration. The observed non-exponential decay nature and
quenching of lifetime for higher Dy3þ ion concentration (Z1.0 mol%) have been
attributed due to energy transfer of dipole–dipole type between excited and unexcited
Dy3þ ions. The PbPKANDy glasses exhibit better luminescence properties which are
suitable for generation of white light.
& 2012 Elsevier Ltd. All rights reserved.
1. Introduction
Rare earth (RE)-doped glasses have attracted persistentresearch interest as they are easy to shape and have hightransparency, low production cost, and better thermal sta-bility. These glasses have been playing significant role for thedevelopment of optical devices including optical fibers andamplifiers, visible and infrared solid state lasers, waveguides,display devices, etc. [1–3]. Though different spectroscopiccharacterizations have been studied by the modification ofchemical composition to improve the performance of opticaldevices, still there is a demand for new host materials withhigher efficiency. Among different glass hosts, oxide basedphosphate glasses have unique physical and chemical prop-erties, which render them useful for a wide range of practicalapplications. Unfortunately, their relatively poor chemicaldurability precludes their practical utilization. Therefore, it
has been noticed that the addition of metal oxides (MO) suchas ZnO or PbO, resulting in the formation of M–O(–P) bonds,leads to improvement of the chemical durability and thermalstability of the phosphate glasses and enhance the radiativetransition rates of RE3þ ions [4–7]. Hence, lead basedphosphate glasses can be considered as promising materialsfor applications in optoelectronics.
Among the RE ions, trivalent dysprosium (Dy3þ)-doped glasses have been considered as promising materi-als for two-color phosphors and white light emissionsince Dy3þ ion possesses intense emissions at blue(486 nm, 4F9/2-
6H15/2) and yellow (576 nm, 4F9/2-6H13/2)
regions. Further, it is well known that the 4F9/2-6H13/2
transition of Dy3þ ions is hypersensitive and therefore itsintensity strongly depends on the nature of the host,whereas the intensity of magnetic-dipole allowed4F9/2-
6H15/2 transition is less sensitive to the host. Hence,at a suitable environment, the intensity ratio of theseyellow to blue (Y/B) transitions will be tailored such thatthe Dy3þ-doped materials would generate white light.
In this work we report the optical properties of leadphosphate glasses containing different concentrations of
Contents lists available at SciVerse ScienceDirect
journal homepage: www.elsevier.com/locate/jqsrt
Journal of Quantitative Spectroscopy &Radiative Transfer
0022-4073/$ - see front matter & 2012 Elsevier Ltd. All rights reserved.
http://dx.doi.org/10.1016/j.jqsrt.2012.12.002
n Corresponding author. Tel.: þ91 877 224 8033;
fax: þ91 877 22 89472.
E-mail address: [email protected] (C.K. Jayasankar).
Journal of Quantitative Spectroscopy & Radiative Transfer 118 (2013) 40–48
Author's personal copy
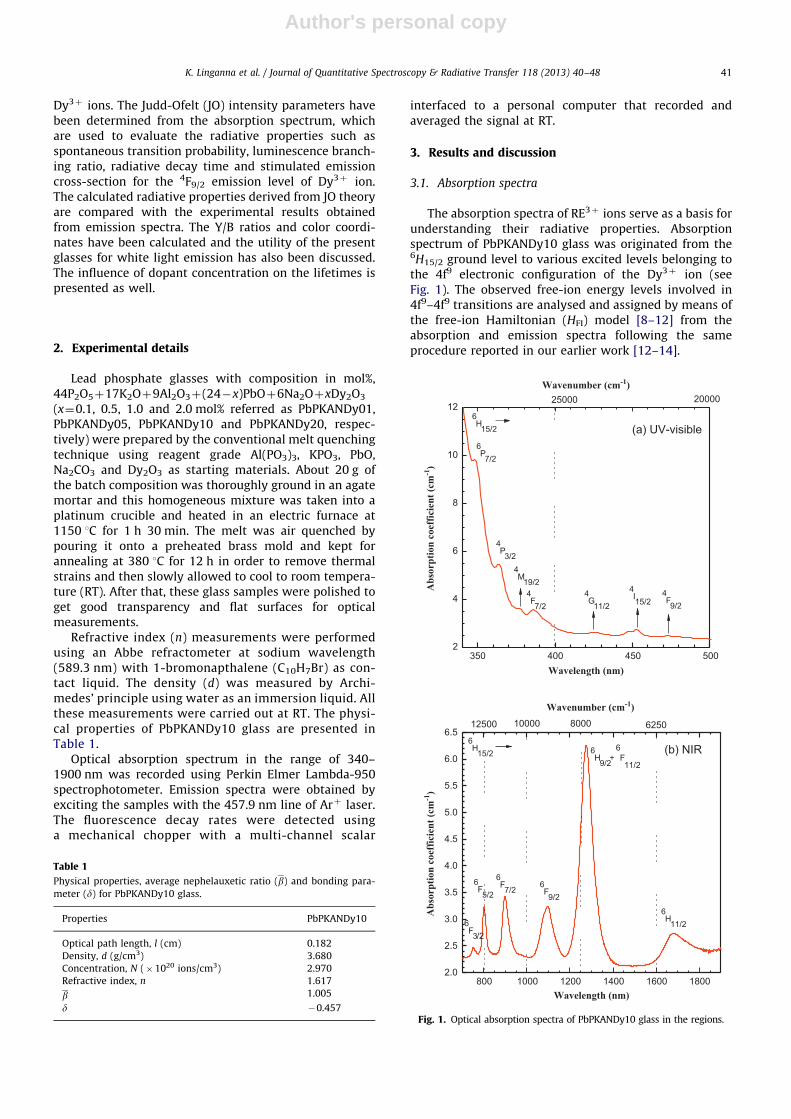
Dy3þ ions. The Judd-Ofelt (JO) intensity parameters havebeen determined from the absorption spectrum, whichare used to evaluate the radiative properties such asspontaneous transition probability, luminescence branch-ing ratio, radiative decay time and stimulated emissioncross-section for the 4F9/2 emission level of Dy3þ ion.The calculated radiative properties derived from JO theoryare compared with the experimental results obtainedfrom emission spectra. The Y/B ratios and color coordi-nates have been calculated and the utility of the presentglasses for white light emission has also been discussed.The influence of dopant concentration on the lifetimes ispresented as well.
2. Experimental details
Lead phosphate glasses with composition in mol%,44P2O5þ17K2Oþ9Al2O3þ(24�x)PbOþ6Na2OþxDy2O3
(x¼0.1, 0.5, 1.0 and 2.0 mol% referred as PbPKANDy01,PbPKANDy05, PbPKANDy10 and PbPKANDy20, respec-tively) were prepared by the conventional melt quenchingtechnique using reagent grade Al(PO3)3, KPO3, PbO,Na2CO3 and Dy2O3 as starting materials. About 20 g ofthe batch composition was thoroughly ground in an agatemortar and this homogeneous mixture was taken into aplatinum crucible and heated in an electric furnace at1150 1C for 1 h 30 min. The melt was air quenched bypouring it onto a preheated brass mold and kept forannealing at 380 1C for 12 h in order to remove thermalstrains and then slowly allowed to cool to room tempera-ture (RT). After that, these glass samples were polished toget good transparency and flat surfaces for opticalmeasurements.
Refractive index (n) measurements were performedusing an Abbe refractometer at sodium wavelength(589.3 nm) with 1-bromonapthalene (C10H7Br) as con-tact liquid. The density (d) was measured by Archi-medes’ principle using water as an immersion liquid. Allthese measurements were carried out at RT. The physi-cal properties of PbPKANDy10 glass are presented inTable 1.
Optical absorption spectrum in the range of 340–1900 nm was recorded using Perkin Elmer Lambda-950spectrophotometer. Emission spectra were obtained byexciting the samples with the 457.9 nm line of Arþ laser.The fluorescence decay rates were detected usinga mechanical chopper with a multi-channel scalar
interfaced to a personal computer that recorded andaveraged the signal at RT.
3. Results and discussion
3.1. Absorption spectra
The absorption spectra of RE3þ ions serve as a basis forunderstanding their radiative properties. Absorptionspectrum of PbPKANDy10 glass was originated from the6H15/2 ground level to various excited levels belonging tothe 4f9 electronic configuration of the Dy3þ ion (seeFig. 1). The observed free-ion energy levels involved in4f9–4f9 transitions are analysed and assigned by means ofthe free-ion Hamiltonian (HFI) model [8–12] from theabsorption and emission spectra following the sameprocedure reported in our earlier work [12–14].
Table 1
Physical properties, average nephelauxetic ratio (b) and bonding para-
meter (d) for PbPKANDy10 glass.
Properties PbPKANDy10
Optical path length, l (cm) 0.182
Density, d (g/cm3) 3.680
Concentration, N (�1020 ions/cm3) 2.970
Refractive index, n 1.617
b 1.005
d �0.457
350 400 450 5002
4
6
8
10
126H15/2
4F7/2
4M19/2
4P3/2
Wavelength (nm)
Abs
orpt
ion
coef
ficie
nt (c
m-1
)
4F9/2
4I15/2
4G11/2
6P7/2
25000 20000
(a) UV-visible
(b) NIR
Wavenumber (cm-1)
800 1000 1200 1400 1600 18002.0
2.5
3.0
3.5
4.0
4.5
5.0
5.5
6.0
6.5
Abs
orpt
ion
coef
ficie
nt (c
m-1
)
6F5/2
6F3/2
Wavelength (nm)
6H15/2
6H11/2
6H9/2+
6F11/2
6F9/2
6F7/2
12500 10000 62508000
Wavenumber (cm-1)
Fig. 1. Optical absorption spectra of PbPKANDy10 glass in the regions.
K. Linganna et al. / Journal of Quantitative Spectroscopy & Radiative Transfer 118 (2013) 40–48 41

Author's personal copy
3.2. Judd-Ofelt analysis
The intensity of an absorption band is expressed interms of ‘‘oscillator strength’’. The experimental oscillatorstrengths (f exp) of absorption bands for PbPKANDy10glass are evaluated by measuring the integrated areasunder the absorption bands using the relation [15],
f exp ¼2:303mc2
pe2N
ZaðuÞdu¼ 4:318� 10�9
ZaðuÞdu ð1Þ
where m and e are the mass and charge of an electron,respectively, c is the velocity of light in vacuum, N is thenumber of RE3þ ions per unit volume and aðuÞ is themolar absorptivity of the corresponding band at an energyu (in cm�1).
According to the JO theory [16,17], the calculatedoscillator strengths (f cal) of an electric-dipole allowedtransition J-J0 is given as
f cal ¼8p2mcu
3he2 2Jþ1ð Þ
n2þ2� �2
9nðe2
Xl ¼ 2,4,6
OlðcJ:Ul:c0J0Þ2Þ ð2Þ
where e2P
l ¼ 2,4,6Olðc J:Ul:c0J0Þ2 is the line strength ofelectric-dipole transitions, h is Planck’s constant, u is thewavenumber of the transition in cm�1, n is the refractiveindex of the sample, J and J0 are the total angularmomentum for the ground and upper level, respectively,Ol (l¼2, 4 and 6) are the JO parameters that arecharacteristic of a given RE3þ ion and :Ul:2
are thedoubly reduced squared matrix elements of the unittensor operator of the rank l¼2, 4 and 6 which arecalculated from the intermediate coupling approximationfor a transition c J-c0J0. The reduced matrix elements,:Ul:2
(l¼2, 4 and 6), were taken from Ref. [12]. However,these matrix elements of the unit tensor operatorbetween two energy manifolds in RE3þ ion do not varysignificantly when it is incorporated in different hosts dueto the electrostatic shielding of the 4f shell electrons bythe closed 5s and 5p shell electrons.
The f exp values were evaluated from the absorptionbands, whereas the f cal values were calculated from the JOtheory using Eq. (2). To determine the JO parameters, Ol
(l¼2, 4 and 6), a least-square fitting approach wasadopted for Eq. (2), which gives the best fit between thef exp and f cal. The quality of the fit known as the root-mean-square deviation (sRMS) between the f exp and f cal isgiven by
sRMS ¼
ffiffiffiffiffiffiffiffiffiffiffiffiffiffiffiffiffiffiffiffiffiffiffiffiffiffiffiffiffiffiffiffiffiffiffiPNi ¼ 1
f expi �f cal
i
� �2
N
vuuutð3Þ
where f expi and f cal
i are the experimental and calculatedoscillator strengths, respectively, for level i and N referstotal number of levels included in the fit. The assignmentof transitions, band positions (in cm�1), f exp and f cal
values for the PbPKANDy10 glass and f exp values of someother reported Dy3þ:systems [18–22] are given in Table 2for comparison. The position and intensity of certainelectric-dipole transitions of RE3þ ions are found to bevery sensitive to the host environment. Such transitionsare termed as hypersensitive transitions by Jorgensen andJudd [23]. As can be seen from Fig. 1(b), the strongabsorption band 6H15/2-
6H9/2þ6H11/2 is located at
around 1277 nm for all the studied glasses. This transitionis a hypersensitive transition as it follows the selectionrule 9DS9¼0, 9DL9r2, 9DJ9r2 and is very sensitive to thesurrounding environment of the RE3þ ion. Moreover, thistransition has large value of squared reduced matrixelement (:Ul:2
) [12].The JO parameters for PbPKANDy10 glass are pre-
sented in Table 3 along with reported Dy3þ-doped sys-tems [13,14,18–22,24–32]. As can be seen from Table 3,these parameters for PbPKANDy10 glass are found to beO2¼11.74, O4¼2.64 and O6¼2.86 (�10�20 cm2) andfollow the trend as O24O64O4, which is similar to thetrends observed in lead borate glass [19], oxyfluorideglass [21], Ba2TiSi2O8:crystallized glass [24], LiNbO3:crys-tal [25], lead fluorophosphate glass [30] and sodium
Table 2Absorption transitions (from the ground 6H15/2 level to excited levels), energies (cm�1), experimental (fexp, �10�6) and calculated (fcal, �10�6)
oscillator strengths for Dy3þ:PbPKANDy10 glass along with fexp values of some reported Dy3þ:glasses.
Transition6H15/2-
2Sþ1LJ
Energy PbPKANDy10 [Present work] Fluorophosphate [18] Lead
borate [19]
Barium
fluoroborate [20]
Oxyfluoride [21] Fluoroindate [22]
fexp fcal fexp fexp fexp fexp fexp
6H11/2 5942 1.08 1.80 0.96 – 1.29 1.01 1.086H9/2,6F11/2 7831 10.78 10.67 6.02 – 5.73 5.88 2.526F9/2 9124 3.40 3.24 2.09 3.31 2.33 2.01 –6F7/2 11123 3.62 2.65 0.93 3.08 2.33 1.95 1.526F5/2 12484 1.33 1.22 0.69 2.1 1.37 1.08 0.996F3/2 13298 0.20 0.23 0.12 0.28 0.22 0.15 0.164F9/2 21097 0.08 0.21 0.07 – 0.26 0.11 –4I15/2 22075 0.73 0.61 0.34 0.98 0.44 0.39 0.334G11/2 23529 0.18 0.10 0.12 0.26 0.18 0.11 0.094F7/2 25840 1.24 0.72 0.89 – – – –4M19/2 26385 0.13 0.87 – 0.31 – – –4P3/2 27473 1.41 0.39 0.59 1.89 – – –4M15/2,6P7/2 28653 2.50 4.10 1.75 – – – –
s(N)a 70.68(13)
a s indicates the RMS deviation between experimental and calculated values and N is the number of levels used in the fit.
K. Linganna et al. / Journal of Quantitative Spectroscopy & Radiative Transfer 118 (2013) 40–4842
Author's personal copy
aluminum phosphate glass [32]. Among the three JOparameters, O2 is more sensitive to the environment ofthe RE3þ ion and in turn strongly depends on hypersen-sitive transition. In addition, O2 provides information onthe nature of the bond between RE3þ ions and surround-ing ligands as well as the symmetry of the environmentaround the RE3þ ions, whereas O4 and O6 parameters arerelated to the bulk properties such as viscosity andrigidity of the glass. It has been noticed from Table 3 thatO2 is found to be high indicating relatively higher cova-lency between the Dy3þ ions and the surrounding ligandsand lower symmetry of the coordination structure sur-rounding the Dy3þ ion in the present glass compared toother reported Dy3þ:systems [14,18–22,24–32] exceptfor phosphate glass [13]. However, hypersensitivity of atransition has been shown to be proportional to thenephelauxetic ratio (b), which is a measure of the cova-lency of the RE3þ–oxygen (RE3þ
�O) bond given by,
b ¼uc
uað4Þ
where uc and ua are the energies (in cm�1) of thecorresponding transitions in the present glass and aquo-ion, respectively. From the average value of b, (referredas b) the bonding parameter d, is calculated by
d ¼1�bb� 100 ð5Þ
the d value may be positive or negative depending uponbonding type. It is positive for covalent bonding andnegative for ionic bonding. In the present glass system(see Table 1), the d value is found to be �0.457, whichindicates that RE3þ
�O bonding is of ionic type. But this iscontrary to the results obtained from the JO analysis;however, we also note that the asymmetry of the sitesaccommodating the Dy3þ ions contributes to the valuesof the O2 parameter, as this value increases with the sitedistortion [33]. It is conceivable that asymmetry and
covalency give different contributions in differentglass hosts.
3.3. Radiative properties and emission spectra
The Ol values obtained from the absorption spectrumand refractive index (n) are used to calculate the radiativeproperties such as transition probability (A), radiativelifetime (tR), peak stimulated emission cross-section(sðlPÞ) and branching ratio (bR). The spontaneous transi-tion probabilities (A) from the initial level cJ to final levelc0J0 can be obtained using the relation
A cJ,c0J0� �
¼ AedþAmd ð6Þ
where Aed and Amd are the electric and magnetic-dipoleradiative transition probabilities, respectively, and theseare calculated from
Aed ¼64p4u3
3h 2Jþ1ð Þ
n n2þ2� �2
9Sed
and
Amd ¼64p4u3
3h 2Jþ1ð Þn3Smd ð7Þ
Sed and Smd represent the line strengths for the inducedelectric and magnetic-dipole transitions, respectively.They are given by the expressions
Sed ¼ e2X
l ¼ 2,4,6Ol cJ:Ul:c0J0Þ2�
and
Smd ¼e2h2
16p2m2c2cJ:Lþ2S:c0J0� �2
ð8Þ
and ðnðn2þ2Þ2=9Þ is the local field correction for theelectric-dipole transitions and n3 for magnetic-dipoletransitions.
The total radiative transition probability (AT ðcJÞ) for anexcited level is given by the sum of the A(cJ-c0J0) terms
Table 3Comparison of Judd-Ofelt parameters (Ol, �10�20 cm2) and their trend in different Dy3þ: systems.
Host O2 O4 O6 Trend Reference
PbPKANDy10 glass 11.74 2.64 2.86 O24 O64O4 Present work
Fluorophosphate glass 12.34 2.67 2.30 O24 O44 O6 [13]
Phosphate glass 9.72 3.08 1.66 O24 O44 O6 [14]
Fluorophosphate glass 10.41 2.29 2.07 O24 O44 O6 [14]
Fluorophosphate glass 7.04 1.73 1.57 O24 O44 O6 [18]
Lead borate glass 4.90 0.94 2.07 O24 O64 O4 [19]
Barium fluoroborate glass 2.90 1.09 0.98 O24 O44 O6 [20]
Oxyfluoride glass 6.41 1.02 2.25 O24 O64 O4 [21]
Fluoroindate glass 1.78 1.48 1.84 O64 O24 O4 [22]
Ba2TiSi2O8:crystallized glass 4.97 0.60 0.68 O24 O64 O4 [24]
LiNbO3:crystal 5.42 1.14 2.51 O24 O64 O4 [25]
Ge–Ga–Sb–Se glass 11.61 2.79 1.11 O24 O44 O6 [26]
Tellurite glass 1.46 2.32 3.60 O64 O44 O2 [27]
Lead borate tungsten glass 10.17 4.32 3.27 O24 O44 O6 [28]
Lead tellurofluoroborate glass 9.86 3.39 2.41 O24 O44 O6 [29]
Lead fluorophosphate glass 7.12 1.59 2.20 O24 O64 O4 [30]
Phosphate glass 7.55 2.30 1.70 O24 O44 O6 [31]
Fluorophosphate glass 8.04 1.84 1.41 O24 O44 O6 [31]
Sodium–aluminum-phosphate glass 6.68 1.10 1.73 O24 O64 O4 [32]
K. Linganna et al. / Journal of Quantitative Spectroscopy & Radiative Transfer 118 (2013) 40–48 43
Author's personal copy
calculated over all the terminal levels.
AT ðcJÞ ¼X
A cJ,c0J0� �
ð9Þ
The radiative lifetime (tR) of an excited level c0J0 isgiven by the reciprocal of the AT ðcJÞ,
tR cJð Þ ¼1
AT ðcJÞð10Þ
The fluorescence branching ratio (bR) corresponding tothe emission from an excited level c’J’ to a lower level cJ
can be calculated from the transition probabilities byusing the relation
bR cJ,c0J0� �
¼A cJ,c0J0� �AT ðcJÞ
ð11Þ
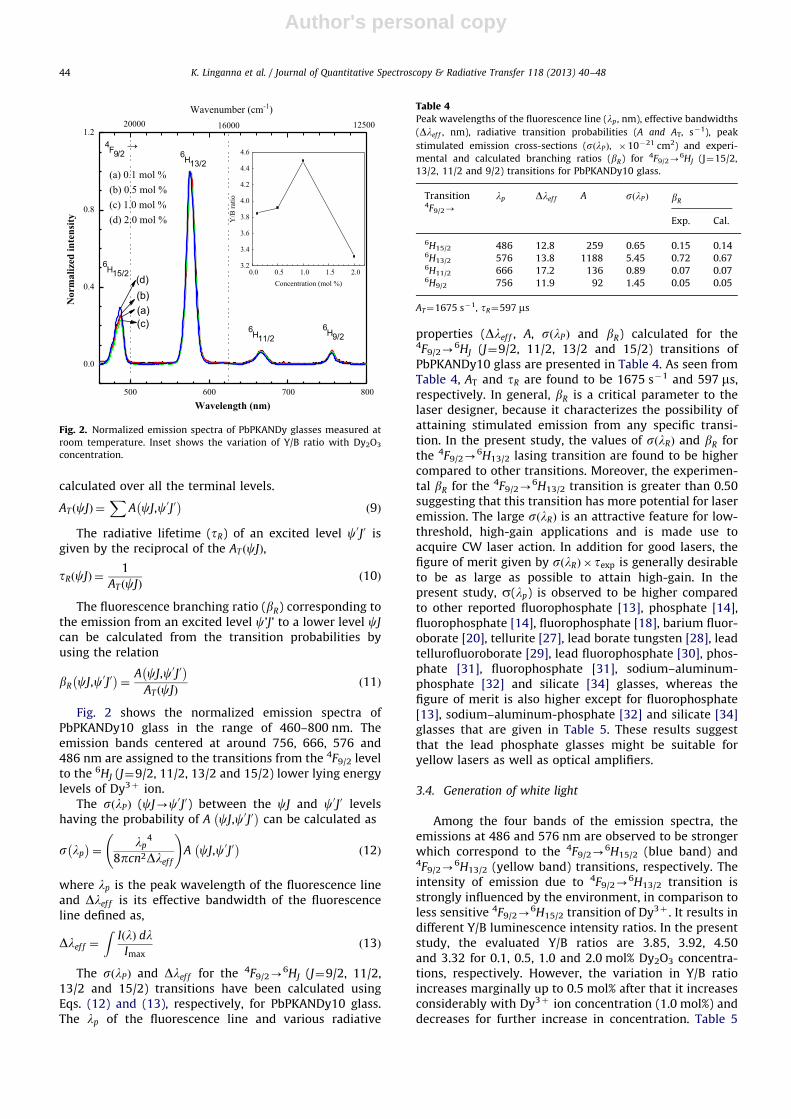
Fig. 2 shows the normalized emission spectra ofPbPKANDy10 glass in the range of 460–800 nm. Theemission bands centered at around 756, 666, 576 and486 nm are assigned to the transitions from the 4F9/2 levelto the 6HJ (J¼9/2, 11/2, 13/2 and 15/2) lower lying energylevels of Dy3þ ion.
The sðlPÞ (cJ-c0J0) between the cJ and c0J0 levelshaving the probability of A cJ,c0J0
� �can be calculated as
s lp
� �¼
lp4
8pcn2Dlef f
!A cJ,c0J0� �
ð12Þ
where lp is the peak wavelength of the fluorescence lineand Dlef f is its effective bandwidth of the fluorescenceline defined as,
Dlef f ¼
ZIðlÞ dl
Imaxð13Þ
The sðlPÞ and Dlef f for the 4F9/2-6HJ (J¼9/2, 11/2,
13/2 and 15/2) transitions have been calculated usingEqs. (12) and (13), respectively, for PbPKANDy10 glass.The lp of the fluorescence line and various radiative
properties (Dlef f , A, sðlPÞ and bR) calculated for the4F9/2-
6HJ (J¼9/2, 11/2, 13/2 and 15/2) transitions ofPbPKANDy10 glass are presented in Table 4. As seen fromTable 4, AT and tR are found to be 1675 s�1 and 597 ms,respectively. In general, bR is a critical parameter to thelaser designer, because it characterizes the possibility ofattaining stimulated emission from any specific transi-tion. In the present study, the values of sðlRÞ and bR forthe 4F9/2-
6H13/2 lasing transition are found to be highercompared to other transitions. Moreover, the experimen-tal bR for the 4F9/2-
6H13/2 transition is greater than 0.50suggesting that this transition has more potential for laseremission. The large sðlRÞ is an attractive feature for low-threshold, high-gain applications and is made use toacquire CW laser action. In addition for good lasers, thefigure of merit given by sðlRÞ� texp is generally desirableto be as large as possible to attain high-gain. In thepresent study, s(lp) is observed to be higher comparedto other reported fluorophosphate [13], phosphate [14],fluorophosphate [14], fluorophosphate [18], barium fluor-oborate [20], tellurite [27], lead borate tungsten [28], leadtellurofluoroborate [29], lead fluorophosphate [30], phos-phate [31], fluorophosphate [31], sodium–aluminum-phosphate [32] and silicate [34] glasses, whereas thefigure of merit is also higher except for fluorophosphate[13], sodium–aluminum-phosphate [32] and silicate [34]glasses that are given in Table 5. These results suggestthat the lead phosphate glasses might be suitable foryellow lasers as well as optical amplifiers.
3.4. Generation of white light
Among the four bands of the emission spectra, theemissions at 486 and 576 nm are observed to be strongerwhich correspond to the 4F9/2-
6H15/2 (blue band) and4F9/2-
6H13/2 (yellow band) transitions, respectively. Theintensity of emission due to 4F9/2-
6H13/2 transition isstrongly influenced by the environment, in comparison toless sensitive 4F9/2-
6H15/2 transition of Dy3þ . It results indifferent Y/B luminescence intensity ratios. In the presentstudy, the evaluated Y/B ratios are 3.85, 3.92, 4.50and 3.32 for 0.1, 0.5, 1.0 and 2.0 mol% Dy2O3 concentra-tions, respectively. However, the variation in Y/B ratioincreases marginally up to 0.5 mol% after that it increasesconsiderably with Dy3þ ion concentration (1.0 mol%) anddecreases for further increase in concentration. Table 5
500 600 700 800
0.0
0.4
0.8
1.24F9/2
Wavenumber (cm-1)
(c)
(d)(b)(a)
Nor
mal
ized
inte
nsity
Wavelength (nm)
6H11/26H9/2
6H15/2
6H13/2
20000 16000 12500
(a) 0.1 mol %(b) 0.5 mol %(c) 1.0 mol %(d) 2.0 mol %
Fig. 2. Normalized emission spectra of PbPKANDy glasses measured at
room temperature. Inset shows the variation of Y/B ratio with Dy2O3
concentration.
Table 4
Peak wavelengths of the fluorescence line (lp , nm), effective bandwidths
(Dlef f , nm), radiative transition probabilities (A and AT, s�1), peak
stimulated emission cross-sections (sðlPÞ, �10�21 cm2) and experi-
mental and calculated branching ratios (bR) for 4F9/2-6HJ (J¼15/2,
13/2, 11/2 and 9/2) transitions for PbPKANDy10 glass.
Transition4F9/2-
lp Dlef f A sðlPÞ bR
Exp. Cal.
6H15/2 486 12.8 259 0.65 0.15 0.146H13/2 576 13.8 1188 5.45 0.72 0.676H11/2 666 17.2 136 0.89 0.07 0.076H9/2 756 11.9 92 1.45 0.05 0.05
AT¼1675 s�1, tR¼597 ms
K. Linganna et al. / Journal of Quantitative Spectroscopy & Radiative Transfer 118 (2013) 40–4844
Author's personal copy
presents Y/B ratio for different Dy3þ-doped glasses[19,28–32,35–39]. It is interesting to note that the Y/Bratio is higher for present glass compared to those ofreported glasses [19,28–32,35–39]. As can be seen fromTable 5, the variation in the Y/B ratio is attributed to thechange in the local environment of the Dy3þ ions in thehost matrix as it involves a hypersensitive transition,4F9/2-
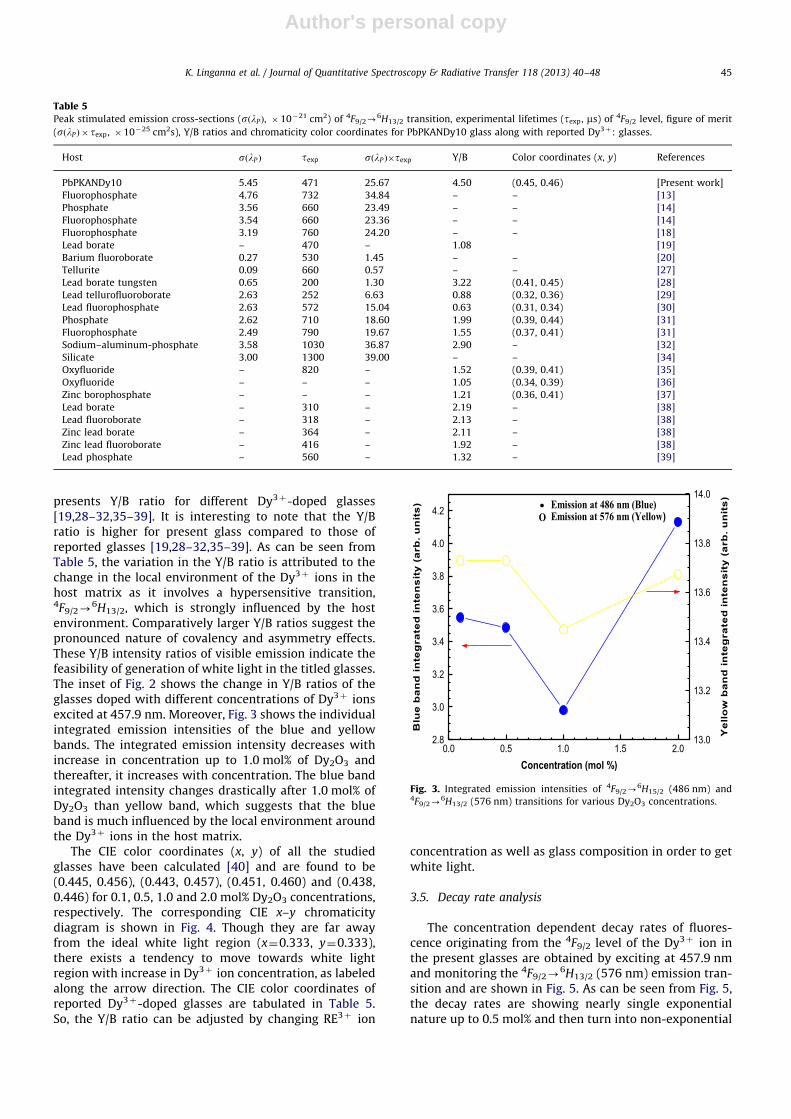
6H13/2, which is strongly influenced by the hostenvironment. Comparatively larger Y/B ratios suggest thepronounced nature of covalency and asymmetry effects.These Y/B intensity ratios of visible emission indicate thefeasibility of generation of white light in the titled glasses.The inset of Fig. 2 shows the change in Y/B ratios of theglasses doped with different concentrations of Dy3þ ionsexcited at 457.9 nm. Moreover, Fig. 3 shows the individualintegrated emission intensities of the blue and yellowbands. The integrated emission intensity decreases withincrease in concentration up to 1.0 mol% of Dy2O3 andthereafter, it increases with concentration. The blue bandintegrated intensity changes drastically after 1.0 mol% ofDy2O3 than yellow band, which suggests that the blueband is much influenced by the local environment aroundthe Dy3þ ions in the host matrix.
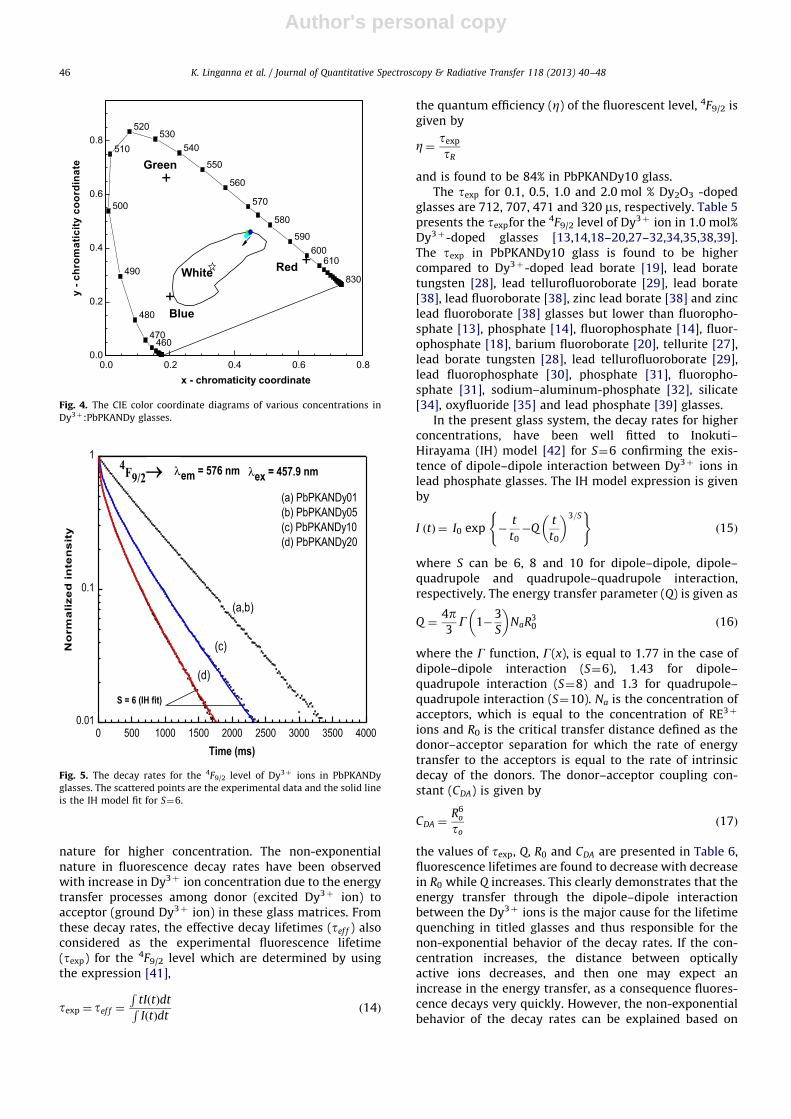
The CIE color coordinates (x, y) of all the studiedglasses have been calculated [40] and are found to be(0.445, 0.456), (0.443, 0.457), (0.451, 0.460) and (0.438,0.446) for 0.1, 0.5, 1.0 and 2.0 mol% Dy2O3 concentrations,respectively. The corresponding CIE x–y chromaticitydiagram is shown in Fig. 4. Though they are far awayfrom the ideal white light region (x¼0.333, y¼0.333),there exists a tendency to move towards white lightregion with increase in Dy3þ ion concentration, as labeledalong the arrow direction. The CIE color coordinates ofreported Dy3þ-doped glasses are tabulated in Table 5.So, the Y/B ratio can be adjusted by changing RE3þ ion
concentration as well as glass composition in order to getwhite light.
3.5. Decay rate analysis
The concentration dependent decay rates of fluores-cence originating from the 4F9/2 level of the Dy3þ ion inthe present glasses are obtained by exciting at 457.9 nmand monitoring the 4F9/2-
6H13/2 (576 nm) emission tran-sition and are shown in Fig. 5. As can be seen from Fig. 5,the decay rates are showing nearly single exponentialnature up to 0.5 mol% and then turn into non-exponential
Table 5
Peak stimulated emission cross-sections (sðlPÞ, �10�21 cm2) of 4F9/2-6H13/2 transition, experimental lifetimes (texp, ms) of 4F9/2 level, figure of merit
(sðlP Þ� texp, �10�25 cm2s), Y/B ratios and chromaticity color coordinates for PbPKANDy10 glass along with reported Dy3þ: glasses.
Host sðlP Þ texp sðlP Þ�texp Y/B Color coordinates (x, y) References
PbPKANDy10 5.45 471 25.67 4.50 (0.45, 0.46) [Present work]
Fluorophosphate 4.76 732 34.84 – – [13]
Phosphate 3.56 660 23.49 – – [14]
Fluorophosphate 3.54 660 23.36 – – [14]
Fluorophosphate 3.19 760 24.20 – – [18]
Lead borate – 470 – 1.08 [19]
Barium fluoroborate 0.27 530 1.45 – – [20]
Tellurite 0.09 660 0.57 – – [27]
Lead borate tungsten 0.65 200 1.30 3.22 (0.41, 0.45) [28]
Lead tellurofluoroborate 2.63 252 6.63 0.88 (0.32, 0.36) [29]
Lead fluorophosphate 2.63 572 15.04 0.63 (0.31, 0.34) [30]
Phosphate 2.62 710 18.60 1.99 (0.39, 0.44) [31]
Fluorophosphate 2.49 790 19.67 1.55 (0.37, 0.41) [31]
Sodium–aluminum-phosphate 3.58 1030 36.87 2.90 – [32]
Silicate 3.00 1300 39.00 – – [34]
Oxyfluoride – 820 – 1.52 (0.39, 0.41) [35]
Oxyfluoride – – – 1.05 (0.34, 0.39) [36]
Zinc borophosphate – – – 1.21 (0.36, 0.41) [37]
Lead borate – 310 – 2.19 – [38]
Lead fluoroborate – 318 – 2.13 – [38]
Zinc lead borate – 364 – 2.11 – [38]
Zinc lead fluoroborate – 416 – 1.92 – [38]
Lead phosphate – 560 – 1.32 – [39]
Fig. 3. Integrated emission intensities of 4F9/2-6H15/2 (486 nm) and
4F9/2-6H13/2 (576 nm) transitions for various Dy2O3 concentrations.
K. Linganna et al. / Journal of Quantitative Spectroscopy & Radiative Transfer 118 (2013) 40–48 45
Author's personal copy
nature for higher concentration. The non-exponentialnature in fluorescence decay rates have been observedwith increase in Dy3þ ion concentration due to the energytransfer processes among donor (excited Dy3þ ion) toacceptor (ground Dy3þ ion) in these glass matrices. Fromthese decay rates, the effective decay lifetimes (tef f ) alsoconsidered as the experimental fluorescence lifetime(texp) for the 4F9/2 level which are determined by usingthe expression [41],
texp ¼ tef f ¼
RtIðtÞdtRIðtÞdt
ð14Þ
the quantum efficiency (Z) of the fluorescent level, 4F9/2 isgiven by
Z¼ texp
tR
and is found to be 84% in PbPKANDy10 glass.The texp for 0.1, 0.5, 1.0 and 2.0 mol % Dy2O3 -doped
glasses are 712, 707, 471 and 320 ms, respectively. Table 5presents the texpfor the 4F9/2 level of Dy3þ ion in 1.0 mol%Dy3þ-doped glasses [13,14,18–20,27–32,34,35,38,39].The texp in PbPKANDy10 glass is found to be highercompared to Dy3þ-doped lead borate [19], lead boratetungsten [28], lead tellurofluoroborate [29], lead borate[38], lead fluoroborate [38], zinc lead borate [38] and zinclead fluoroborate [38] glasses but lower than fluoropho-sphate [13], phosphate [14], fluorophosphate [14], fluor-ophosphate [18], barium fluoroborate [20], tellurite [27],lead borate tungsten [28], lead tellurofluoroborate [29],lead fluorophosphate [30], phosphate [31], fluoropho-sphate [31], sodium–aluminum-phosphate [32], silicate[34], oxyfluoride [35] and lead phosphate [39] glasses.
In the present glass system, the decay rates for higherconcentrations, have been well fitted to Inokuti–Hirayama (IH) model [42] for S¼6 confirming the exis-tence of dipole–dipole interaction between Dy3þ ions inlead phosphate glasses. The IH model expression is givenby
I tð Þ ¼ I0 exp �t
t0�Q
t
t0
� �3=S( )
ð15Þ
where S can be 6, 8 and 10 for dipole–dipole, dipole–quadrupole and quadrupole–quadrupole interaction,respectively. The energy transfer parameter (Q) is given as
Q ¼4p3G 1�
3
S
� �NaR3
0 ð16Þ
where the G function, G(x), is equal to 1.77 in the case ofdipole–dipole interaction (S¼6), 1.43 for dipole–quadrupole interaction (S¼8) and 1.3 for quadrupole–quadrupole interaction (S¼10). Na is the concentration ofacceptors, which is equal to the concentration of RE3þ
ions and R0 is the critical transfer distance defined as thedonor–acceptor separation for which the rate of energytransfer to the acceptors is equal to the rate of intrinsicdecay of the donors. The donor–acceptor coupling con-stant (CDA) is given by
CDA ¼R6
o
toð17Þ
the values of texp, Q, R0 and CDA are presented in Table 6,fluorescence lifetimes are found to decrease with decreasein R0 while Q increases. This clearly demonstrates that theenergy transfer through the dipole–dipole interactionbetween the Dy3þ ions is the major cause for the lifetimequenching in titled glasses and thus responsible for thenon-exponential behavior of the decay rates. If the con-centration increases, the distance between opticallyactive ions decreases, and then one may expect anincrease in the energy transfer, as a consequence fluores-cence decays very quickly. However, the non-exponentialbehavior of the decay rates can be explained based on
0.0 0.2 0.4 0.6 0.80.0
0.2
0.4
0.6
0.8
460470
480
490
500
510
520530
540
550
560
570
580
590600
610
830
x - chromaticity coordinate
y - c
hrom
atic
ity c
oord
inat
e
+
+
Blue
Green
RedWhite
+
Fig. 4. The CIE color coordinate diagrams of various concentrations in
Dy3þ:PbPKANDy glasses.
Fig. 5. The decay rates for the 4F9/2 level of Dy3þ ions in PbPKANDy
glasses. The scattered points are the experimental data and the solid line
is the IH model fit for S¼6.
K. Linganna et al. / Journal of Quantitative Spectroscopy & Radiative Transfer 118 (2013) 40–4846

Author's personal copy
resonant energy transfer as well as cross-relaxationbetween the donor and acceptor ions. As can be seen inFig. 6, the energy separation between 6H15/2 and 6F1/2
levels matches with 4F9/2-6H9/2 transition of adjacent
Dy3þ ion, which indicates that energy transfer can occurthrough 4F9/2þ
6H15/2-6H9/2þ
6F1/2 transitions amongDy3þ ions by means of electric dipole–dipole interaction.As a result, the peak intensity of all transitions in emissionspectrum decreases due to the depopulation of the 4F9/2
level with increase in Dy3þ ion concentration. Moreover,another possibility for non-exponential nature in decayrates is due to cross-relaxation processes between donorand acceptor ions. These cross-relaxation channels areshown in Fig. 6 which are denoted as CR1 and CR2,respectively, in PbPKANDy10 glass and are noted as4F9/2þ
6H15/2 -6H5/2þ(6H7/2, 6F9/2) and 4F9/2þ6H15/2 -
(6F3/2, 6F1/2)þ(6H9/2, 6F11/2).
4. Conclusions
Lead phosphate glasses doped with Dy2O3 have beenprepared and characterized. Using the JO theory, sponta-neous emission probabilities and radiative lifetimes of
Dy3þ ions in titled glasses are determined. A strongdependence of the O2 parameter on the hypersensitivetransition has been noticed. The high stimulated emissioncross-section and branching ratio for the 4F9/2-
6H13/2
transition can be useful for laser action in yellow region.Yellow-to-blue emission intensity ratios and chromaticitycolor coordinates have been evaluated from emissionspectra with varying activator (Dy3þ) concentration andalso confirmed the feasibility to generate white light.Fluorescence decay rates of the 4F9/2 level of Dy3þ ionschange from single exponential to non-exponential nat-ure associated with quenching of lifetimes with increasein Dy3þ ion concentration due to enhancement of energytransfer processes between Dy3þ ions.
Acknowledgments
One of the authors (Mr. K. Linganna) is grateful toUniversity Grants Commission (UGC) for the award ofRajiv Gandhi National Fellowship (RGNF) to pursue Ph.D.degree. This work has also been supported by DAE-BRNS,Govt. of India for the sanction of major research project(No. 2009/34/36/BRNS/3174, dt.12-02-2010) under MoUbetween Bhabha Atomic Research Center, Mumbai andSri Venkateswara University, Tirupati.
References
[1] Matjec V, Kasik I, Pospisilova M. Preparation and optical propertiesof silica optical fibers with an Al2O3-doped core. J Non-Cryst Solids1995;192–193:195–8.
[2] Wei R, Zhang H, Li F, Guo H. Blue-white-green tunable lumines-cence of Ce3þ , Tb3þ co-doped sodium silicate glasses for whiteLEDs. J Am Ceram Soc 2012;95:34–6.
[3] Blasse G, Grabmaier BC. Luminescent Materials. Berlin, Germany:Springer-Verlag; 1994.
[4] Sobczyk M, Starynowicz P, Lisiecki R, Ryba-Romanowski W. Synthesis,optical spectra and radiative properties of Sm2O3:PbO:P2O5 glassmaterials. Opt Mater 2008;30:1571–5.
[5] Liu HS, Chin TS. Low Melting PbO–ZnO–P2O5 glasses. Part. 2. Astructural study by Raman spectroscopy and MAS-NMR. Phys ChemGlasses 1997;38:123–31.
[6] Beni R, Ott WR. Effect of pH on the durability of lithium–zincphosphate glasses. Glass Technol 1981;22:182–5.
[7] El-Egili K, Doweidar H, Moustafa YM, Abbas I. Structure and somephysical properties of PbO–P2O5 glasses. Physica B 2003;339:237–45.
[8] Carnall WT, Goodman GL, Rajnak K, Rana RS. A systematic analysisof the spectra of lanthanides doped into single crystals LaF3. J ChemPhys 1989;90:3443–57.
[9] Weber MJ. Rare earth lasers. In: Gschneidner Jr KA, Eyring L, editors.Handbook on the physics and chemistry of rare-earths, vol. 4.Amsterdam: North-Holland Publishing Co; 1979. p. 275–315.
Table 6
Dy3þ ion concentration (N, �1020 ions/cm3), experimental lifetime (texp, ms), energy transfer parameter (Q), critical transfer distance (R0, A) and donor–
acceptor coupling constant (CDA,�10�42 cm6/s) for various concentrations of Dy3þ:glasses.
Dy2O3 (mol%) PbPKANDy [Present work] PKBAF [13] Lead borate [19]
N texp Q R0 CDA N texp Q R0 CDA N texp Q R0 CDA
0.1 – 712 – – – – – – – – – – – – –
0.5 – 707 – – – – – – – – – – – – –
1.0 2.97 471 0.86 7.31 2.15 2.47 732 0.40 131.1 7.00 1.68 470 0.12 4.58 20
2.0 5.87 320 1.65 7.24 2.02 – 539 0.86 207.0 7.54 3.36 360 0.06 2.89 1.5
Fig. 6. Partial energy level diagram of 1.0 mol% Dy3þ ions in lead
phosphate glass.
K. Linganna et al. / Journal of Quantitative Spectroscopy & Radiative Transfer 118 (2013) 40–48 47
Author's personal copy
[10] Garcia D, Faucher M. Crystal fields in non-metallic (rare earths)compounds. In: Gschneidner Jr KA, Eyring L, editors. Handbook onthe physics and chemistry of rare-earths, vol. 21. Amsterdam:North-Holland Publishing Co; 1995. p. 263–304.
[11] Hufner S. Optical spectra of transparent rare-earth compounds.New York: Academic Press; 1978.
[12] Jayasankar CK, Rukmini E. Spectroscopic investigations of Dy3þ
ions in borosulphate glasses. Physica B 1997;240:273–88.[13] Praveena R, Vijaya R, Jayasankar CK. Photoluminescence and energy
transfer studies of Dy3þ-doped fluorophosphates glasses. Spectro-chim Acta A 2008;70:577–86.
[14] Surendra Babu S, Babu P, Jayasankar CK, Sievers W, Th Troster,Wortmann G. Optical absorption and photoluminescence studies ofEu3þ-doped phosphate and fluorophosphates glasses. J Lumin2007;126:109–20.
[15] Carnall WT. Non-metallic compounds. In: Gschneidner Jr KA,Eyring L, editors. Handbook on the physics and chemistry of rare-earths, vol. 3. Amsterdam: North-Holland Publishing Co; 1979.p. 171–208.
[16] Judd BR. Optical absorption intensities of rare-earth ions. Phys Rev1962;127:750–61.
[17] Ofelt GS. Intensities of crystal spectra of rare-earth ions. J ChemPhys 1962;37:511–20.
[18] Basavapoornima Ch, Jayasankar CK, Chandrachoodan PP. Lumines-cence and laser transition studies of Dy3þ:K–Mg–Al fluoropho-sphates glasses. Physica B 2009;404:235–42.
[19] Pisarska J. Optical properies of lead borate glasses containing Dy3þ
ions. J Phys Condens Matter 2009;21:285101–6.[20] Dwivedi Y, Rai SB. Spectroscopic study of Dy3þ and Dy3þ/Yb3þ
ions co-doped in barium fluoroborate glass. Opt Mater 2009;31:1472–7.
[21] Klimesz B, Dominiak-Dzik G, Zelechower M, Ryba-Romanowski W.Optical study of GeO2–PbO–PbF2 oxyfluoride glass single dopedwith lanthanide ions. Opt Mater 2008;30:1587–94.
[22] Florez A, Jerez VA, Florez M. Optical transition probabilities of Dy3þ
ions in fluoroindate glass. J Alloys Compds 2000;303:355–9.[23] Jorgensen CK, Judd BR. Hypersensitive pseudoquadrupole transi-
tions in lanthanides. Mol Phys 1964;8:281–90.[24] Maruyamma N, Honma T, Komatsu T. Enhanced quantum yield of
yellow photoluminescence of Dy3þ ions in nonlinear opticalBa2TiSi2O8 nanocrystals formed in glass. J Solid State Chem2009;182:246–52.
[25] Dominiak-Dzik G, Ryba-Romanowski W, Palatnikov MN, SidorovNV, Kalinnikov VT. Dysprosium-doped LiNbO3 crystal. Opticalproperties and effect of temperature on fluorescence dynamics.J Mol Struct 2004;704:139–44.
[26] Yang Z, Chen W, Luo L. Dy3þ-doped Ge–Ga–S–-Se glasses for1.3 mm optical fiber amplifiers. J Non-Cryst Solids 2005;351:2513–8.
[27] Rai VK, Rai SB, Rai DK. Optical studies of Dy3þ-doped telluriteglass:observation of yellow–green upconversion. Opt Commun2006;257:112–9.
[28] Jamalaiah BC, Rama Moorthy L, Seo HJ. Effect of lead oxide onoptical properties of Dy3þ ions in PbO–H3BO3–TiO2–AlF3 glasses.J Non-Cryst Solids 2012;358:204–9.
[29] Saleem SA, Jamalaiah BC, Jayasimhadri M, Srinivasa Rao A, Jang K,Rama Moorthy L. Luminescence studies of Dy3þ ion in alkali leadtellurofluoroborate glasses. J Quant Spectrosc Radiat Transfer2011;112:78–84.
[30] Kesavulu CR, Jayasankar CK. White light emission Dy3þ-doped leadfluorophosphate glasses. Mater Chem Phys 2011;130:1078–85.
[31] Upendra Kumar K, Ch Srinivasa Rao, Jayasankar CK, Surendra BabuS, Lucio JL, Valleo H, Miguel A, Ma Alejandrina Martinez Gamez. .Optical properties of Dy3þ-doped P2O5–K2O–MgO/MgF2–Al2O3
glasses. Phys Procedia 2011;13:70–3.[32] Amarnath Reddy A, Chandra Sekhar M, Pradeesh K, Surendra Babu
S, Vijaya Prakash G. Optical properties of Dy3þ-doped sodium–aluminum–phosphate glasses. J Mater Sci 2011;46:2018–23.
[33] Reisfeld R. Radiative and nonradiative transition of rare-earths inglasses. Struct Bonding 1975;22:123–75.
[34] Nagli L, Bunimovich D, Katzir A, Gorodetsky O, Molev V. Lumines-cence properties of Dy-doped high silicate glass. J Non-Cryst Solids1997;217:208–14.
[35] Babu P, Jang KH, Ch Srinivasa Rao, Shi L, Jayasankar CK, Lavin V, SeoHJ. White light generation in Dy3þ-doped oxyfluoride glass andtransparent glass-ceramics containing CaF2 nanocrystals. OptExpress 2011;19:1836–41.
[36] Babu P, Jang KH, Kim ES, Shi L, Seo HJ, Rivera-Lopez F, Rodriguez-Mendoza UR, Lavin V, Vijaya R, Jayasankar CK, Rama Moorthy L.Spectral investigations on Dy3þ-doped transparent oxyfluorideglasses and nanocrystalline glass ceramics. J Appl Phys 2009;105:013516–22.
[37] Jayasimhadri M, Jang K, Lee HS, Chen B, Yi S-S, Jeong J-H. Whitelight generation from Dy3þ-doped ZnO–B2O3–P2O5 glasses. J ApplPhys 2009;106:013105–9.
[38] Jayasankar CK, Venkatramu V, Surendra Babu S, Babu P. Lumines-cence properties of Dy3þ ions in a variety of borate and fluorobo-rate glasses containing lithium, zinc, and lead. J Alloys Compds2004;374:22–6.
[39] Pisarski WA, Zur L, Pisarska J. Optical transitions of Eu3þ and Dy3þ
ions in lead phosphate glasses. Opt Lett 2011;36:990–2.[40] Fred Schubert E. Light-emitting diodes. 2nd ed.Cambridge University
Press; 2006. p. 292–305 [Chapter 17].[41] Nakazawa E. Fundamentals of luminescence. In: Shionoya S, Yen
WM, editors. Phosphor handbook. Boca Raton, FL: CRC Press; 1999.[42] Inokuti M, Hirayama F. Influence of energy transfer by the
exchange mechanism on donor luminescence. J Chem Phys1965;43:1978–89.
K. Linganna et al. / Journal of Quantitative Spectroscopy & Radiative Transfer 118 (2013) 40–4848
Copyright © 2022 FDOKUMEN