The structure and properties of binary zinc phosphate glasses studied by molecular dynamics...
12
The structure and properties of binary zinc phosphate glasses studied by molecular dynamics simulations B.C. Tischendorf a , T.M. Alam b , R.T. Cygan c , J.U. Otaigbe a, * a Department of Materials Science and Engineering, Iowa State University, Gilman Hall, Ames, IA 50011, USA b Department of Organic Materials, Sandia National Laboratories, Albuquerque, NM 87185, USA c Department of Geochemistry, Sandia National Laboratories, Albuquerque, NM 87185, USA Received 26 November 2001; received in revised form 23 May 2002 Abstract In recent years, the use of molecular dynamics (MD) simulations to understand and predict the properties of ma- terials has become an increasingly popular and powerful tool. In this study, MD simulations were used to investigate the structural and physical properties of a binary zinc phosphate glass series, xZnO ð100 xÞP 2 O 5 , (40 6 x 6 70) where x is the mole percent modifier. A newly developed forcefield model incorporating Coulombic, plus two- and three-body interactions was employed, with the model parameters being empirically derived from known zinc–phosphate crystal structures. This zinc–phosphate forcefield model was used to perform MD calculations of densities, glass transition temperatures, T g , average coordination numbers (CN) radial distribution functions, GðrÞ, and pair distribution func- tion, gðrÞ, as a function of Zn concentration. In addition, the effects of computational quenching rates on the simulated densities were also investigated. Overall, the MD simulation results revealed the presence of long-range order in the form of rings and chains near the metaphosphate composition. These extended range structures disappeared beyond the metaphosphate composition, becoming isolated non-bridging phosphate tetrahedron as the Zn concentration ap- proached the pyrophosphate composition. The MD simulations also revealed that the average Zn CN was invariant across the entire Zn concentration range investigated. These results demonstrate that the observed T g behavior does not require an increase in the Zn CN. Ó 2003 Elsevier Science B.V. All rights reserved. 1. Introduction There is considerable interest in determining the local and extended range structure of zinc poly- phosphate glasses. They exhibit higher durability, lower glass transition temperatures (T g ) and a wide glass-forming composition range when compared to other common phosphate glass systems [1–4]. Zinc polyphosphate glasses are used in a number of technologically important applications, includ- ing the manufacturing of glass-polymer compos- ites, optical waveguides, and solid-state laser sources [5,6]. Because zinc phosphate glasses have thermal expansion coefficients similar to that of many metals, they are also used as seals and welds between glassy and metallic parts. * Corresponding author. Present address: School of Polymers and High Performance Materials, University of Southern Mississippi, Box 10076, Hattiesburg, MS 39406-0076, USA. Tel.: +1-601 266 5596; fax: +1-601 266 5504. E-mail address: [email protected] (J.U. Otaigbe). 0022-3093/03/$ - see front matter Ó 2003 Elsevier Science B.V. All rights reserved. PII:S0022-3093(02)01795-7 Journal of Non-Crystalline Solids 316 (2003) 261–272 www.elsevier.com/locate/jnoncrysol
-
Upload
independent -
Category
Documents
-
view
3 -
download
0
Transcript of The structure and properties of binary zinc phosphate glasses studied by molecular dynamics...

The structure and properties of binary zinc phosphateglasses studied by molecular dynamics simulations
B.C. Tischendorf a, T.M. Alam b, R.T. Cygan c, J.U. Otaigbe a,*
a Department of Materials Science and Engineering, Iowa State University, Gilman Hall, Ames, IA 50011, USAb Department of Organic Materials, Sandia National Laboratories, Albuquerque, NM 87185, USA
c Department of Geochemistry, Sandia National Laboratories, Albuquerque, NM 87185, USA
Received 26 November 2001; received in revised form 23 May 2002
Abstract
In recent years, the use of molecular dynamics (MD) simulations to understand and predict the properties of ma-
terials has become an increasingly popular and powerful tool. In this study, MD simulations were used to investigate
the structural and physical properties of a binary zinc phosphate glass series, xZnO � ð100� xÞP2O5, (406 x6 70) where
x is the mole percent modifier. A newly developed forcefield model incorporating Coulombic, plus two- and three-body
interactions was employed, with the model parameters being empirically derived from known zinc–phosphate crystal
structures. This zinc–phosphate forcefield model was used to perform MD calculations of densities, glass transition
temperatures, Tg, average coordination numbers (CN) radial distribution functions, GðrÞ, and pair distribution func-
tion, gðrÞ, as a function of Zn concentration. In addition, the effects of computational quenching rates on the simulated
densities were also investigated. Overall, the MD simulation results revealed the presence of long-range order in the
form of rings and chains near the metaphosphate composition. These extended range structures disappeared beyond the
metaphosphate composition, becoming isolated non-bridging phosphate tetrahedron as the Zn concentration ap-
proached the pyrophosphate composition. The MD simulations also revealed that the average Zn CN was invariant
across the entire Zn concentration range investigated. These results demonstrate that the observed Tg behavior does notrequire an increase in the Zn CN.
� 2003 Elsevier Science B.V. All rights reserved.
1. Introduction
There is considerable interest in determining thelocal and extended range structure of zinc poly-
phosphate glasses. They exhibit higher durability,
lower glass transition temperatures (Tg) and a wide
glass-forming composition range when compared
to other common phosphate glass systems [1–4].Zinc polyphosphate glasses are used in a number
of technologically important applications, includ-
ing the manufacturing of glass-polymer compos-
ites, optical waveguides, and solid-state laser
sources [5,6]. Because zinc phosphate glasses have
thermal expansion coefficients similar to that of
many metals, they are also used as seals and welds
between glassy and metallic parts.
*Corresponding author. Present address: School of Polymers
and High Performance Materials, University of Southern
Mississippi, Box 10076, Hattiesburg, MS 39406-0076, USA.
Tel.: +1-601 266 5596; fax: +1-601 266 5504.
E-mail address: [email protected] (J.U. Otaigbe).
0022-3093/03/$ - see front matter � 2003 Elsevier Science B.V. All rights reserved.
PII: S0022-3093 (02 )01795-7
Journal of Non-Crystalline Solids 316 (2003) 261–272
www.elsevier.com/locate/jnoncrysol
Techniques used to study phosphate glassstructure include X-ray diffraction [7–9], X-ray
photoelectron spectroscopy [10,11], extended X-
ray absorption fine structure [12], Raman spec-
troscopy [13,14], infrared spectroscopy [14], and
nuclear magnetic resonance (NMR) [13–17]. More
recently, as the quality and reliability of interac-
tion forcefields have improved, along with the in-
creases in computation speed, molecular dynamics(MD) simulations have become an important and
inexpensive tool to study the relationships between
glass structure and the measured physical proper-
ties [18–33].
Previous MD studies of glass systems have in-
volved the use of two-body potentials expressed in
a variety of analytical forms [21,22,31,32]. These
studies have been able to predict the structureand density in glass systems, but have had great
difficulty in the prediction of Tg, especially in
phosphate systems due to the anisotropy of the
phosphate bonding environment. Previous MD
simulations of phosphate glass systems have been
reported for NaPO3 [32], Mg(PO3)2, Zn(PO3)2 and
Pb(PO3)2 glasses [22,31], the xCaO � ð100� xÞP2O5
[34], xLi2O � ð100� xÞP2O5 [24], 50Na2O � xAl2O3 �ð50� xÞP2O5, and ð50� x=2ÞNa2O �x Al2O3 � ð50�x=2ÞP2O5 glass series [35]. Only the MD simula-
tions by Liang et al. for the ultraphosphate
xLi2O � ð100� xÞP2O5 glass series attempted to
determine the Tg behavior directly from the MD
simulations [24].
It has also recently been shown that the use of
two-body potentials in conjunction with a series ofthree-body (angle bending) interaction potentials
for the MD forcefield allows for a more accurate
representation of the phosphate glass structure
and properties [18,24]. In this manuscript, these
newly developed three-body forcefield models were
extended to perform MD simulations for a series
of binary zinc phosphate glasses. Changes in the
simulated structural details as a function of Znconcentration are quantified and correlated with
the simulated changes in density and Tg behavior.
It is hoped that the development of these multi-
body forcefield models will eventually allow for the
simulation of the physical properties and long-
range structural order in significantly more com-
plex glass systems.
2. Computational details
2.1. Development of the forcefield model
The reliability of any MD simulation is directly
related to the quality of the energy forcefield
model used to describe the interatomic interac-
tions. The majority of previous MD simulationsof glasses have relied almost exclusively on two-
body interaction potentials. The presence of P–O
bonding anisotropy in phosphate systems, includ-
ing the presence of bridging P–O–P, non-bridging
P–O�, and terminal P@O bonding configurations,
results in significant inaccuracies for MD simula-
tions that utilize models containing only two-body
interactions [24]. To improve the accuracy of thesimulated phosphate glass structure, a previously
reported forcefield model containing a combina-
tion of two- and three-body interaction potentials
was used in the present study [24]. Two separate
interaction terms were used to describe the short-
range two-body interactions. In addition to the
standard Coulombic (electrostatic) interactions, a
Lennard-Jones (LJ) potential energy function (Eq.(1)) was used:
ELJ ¼ D0
r0r
� �12�
� 2r0r
� �6�; ð1Þ
where D0 and r0 are adjustable parameters, and r
represents the interatomic distance. For the LJ
potential only cation–anion and anion–anion in-
teractions make significant contribution to the
overall energy, and therefore are the only LJ in-
teractions explicitly evaluated. The three-body
energy terms in the model describe the O–P–O andP–O–P interactions, and are used to constrain the
tetrahedral angles within the PO4 tetrahedra. The
three-body interaction potential is defined by
Eangle ¼k02ðh � h0Þ2; ð2Þ
where h is either the O–P–O or P–O–P bond angle,
and h0 and k0 are adjustable parameters. For the
O–P–O interaction h0 is fixed to the equilibrium
tetrahedral angle of 109.47�.The parameters in Eqs. (1) and (2) were deter-
mined using known crystal structures of P2O5 [36–
262 B.C. Tischendorf et al. / Journal of Non-Crystalline Solids 316 (2003) 261–272
38] as well as zinc phosphate crystal structures[8,39–45]. The P and O interactions were empiri-
cally parameterized based on three crystalline
forms of P2O5 as has been previously described
[24]. The Zn–O interactions were parameterized
using the following four zinc phosphate crystal
structures [8,39–41]:
(a) The a zinc orthophosphate structure,
Zn3(PO4)2, with monoclinic space group C2/c.It consists of spiral chains of alternating phos-
phate and zinc tetrahedron running parallel to
the twofold screw axis. These chains are then in-
terconnected by a second set of zinc tetrahedral.
(b) The c zinc orthophosphate, Zn3(PO4)2, with
monoclinic space group P21=c. It consists of
sheets of coordinated cation polyhedra with
pairs of tetrahedrally coordinated cations sepa-rated by octahedrally coordinated Zn atoms.
Phosphate atoms bridge the sheets sharing three
oxygen with one sheet and a single oxygen with
the adjacent sheet.
(c) The zinc polyphosphate (metaphosphate),
Zn(PO3)2, with monoclinic space group C2/c.
It consists of sheets of four member rings of
phosphate anions connected to octahedral zincatoms with a second type of octahedral zinc pre-
sent in chains interconnecting the sheets.
(d) The zinc ultraphosphate, ZnP4O11, with
monoclinic space group P121/c1. It consists
of �infinite� sheets of phosphate anions (re-
garded either as interconnected rings or chains),
which are interconnected by octahedral zinc
atoms.These four crystal structures and the General
Utility Lattice Program (GULP [46]) were used to
parameterize the LJ and three-body values noted
above. In order to obtain accurate results for the
Coulombic component of the molecular model,
partial charges were used in place of formal char-
ges. These partial charges were determined both
from the work of Uchino and Yoko [33] as well asfrom our own density functional calculations. The
resulting parameters for the forcefield model are
given in Table 1. Using these parameters, a solid
solution series of six binary zinc glass composi-
tions having compositions xZnO � ð100� xÞP2O5,
(406 x6 70) were constructed and subsequently
studied.
2.2. MD simulations
MD simulations were performed within the
Cerius-2 software and the open forcefield energy
program [47]. For any composition in the series anorthogonal unit cell containing between 500 and
525 atoms was used. Details of the initial cell
parameters are given in Table 2, based on ex-
perimentally determined target densities. After
construction of the unit cell, the positions of the
atoms were randomized to reduce the possibility of
the initial starting position influencing the final
quenched structure. A set of simulations where theatoms types were originally clustered was also
performed to demonstrate that the high tempera-
ture melt was sufficient to remove any effects of the
original configuration (data not shown). The MD
simulations of the simulation cell utilized periodic
boundary conditions to prevent edge effects. The
total energy of the box was then minimized using
the forcefield description of the energy while si-multaneously recalculating the atomic bonding
Table 1
Empirical forcefield parametersa
D0 (eV) r0 (nm)
Two-body interactions
P1:85–O�0:74 0.004251 0.21550
O�0:74–O�0:74 0.012185 0.32743
Zn0:74–O�0:74 0.000827 0.31343
k0 (eV/rad2) h0 (�)
Three-body interactions
O–P–O 3.5401 109.47
P–O–P 20.9326 135.58
a See text for definition of symbols and parameters.
Table 2
Properties of the cells used for the MD simulations of the zinc
phosphate glasses, xZnO � ð100� xÞP2O5
Composition Total #
of atoms
Starting
density
(g/cm3)
Cell dimen-
sions
x ¼ y ¼ z (nm)
40.0ZnO � 60.0P2O5 500 2.80 19.113
50.0ZnO � 40.0P2O5 525 2.85 19.910
55.0ZnO � 45.0P2O5 509 3.05 19.226
60.0ZnO � 40.0P2O5 500 3.30 18.798
65.0ZnO � 35.0P2O5 525 3.48 18.994
70.0ZnO � 30.0P2O5 525 4.01 18.370
B.C. Tischendorf et al. / Journal of Non-Crystalline Solids 316 (2003) 261–272 263
throughout the calculation to ensure proper eval-uation of the three-body energy terms.
The simulation cells were then equilibrated at
3000 K using a constant volume and temperature
(NVT) canonical ensemble, with the temperature
of the simulation cell being maintained using the
Hoover scheme. The cell temperature was main-
tained at 3000 K to achieve active melting for 50
ps, with the Newtonian equations of motion re-calculated in 1 fs time steps. This produced a total
of 50 000 time steps at this temperature, with the
atomic connectivities recalculated every 10 steps
(10 fs) to allow for the breaking and reforming of
the bonds. After the atomic connectivities were
determined (10 fs steps) the two- and three-body
potentials were re-evaluated for the new bonding
environment. Following the initial 50 ps hightemperature (3000 K) melting simulation, the
system was quenched in 500 K steps to 300 K with
an equilibration of 7 ps at each step. The final tem-
perature step was from 500 to 300 K. This quench-
ing scheme corresponds to a cooling rate of
approximately 7� 1011 K/s. In addition, MD simu-
lations were also performed with 250 and 125 K
steps during the quench, corresponding to a effec-tive quench rates of 3:5� 1011 and 1:75� 1011 K/s,
respectively. When the temperature of the simu-
lation cell had been quenched to 300 K, it was then
equilibrated for an additional 100 ps under constant
pressure temperature conditions (NPT) to ensure
that the simulation cell was stable and to allow the
atoms to reach a final equilibrium configuration.
2.3. Determination of the glass transition tempera-
ture, Tg
The glass transition temperature of the simula-
tion cell can be found by monitoring the change in
the slope of the molar volume versus temperature
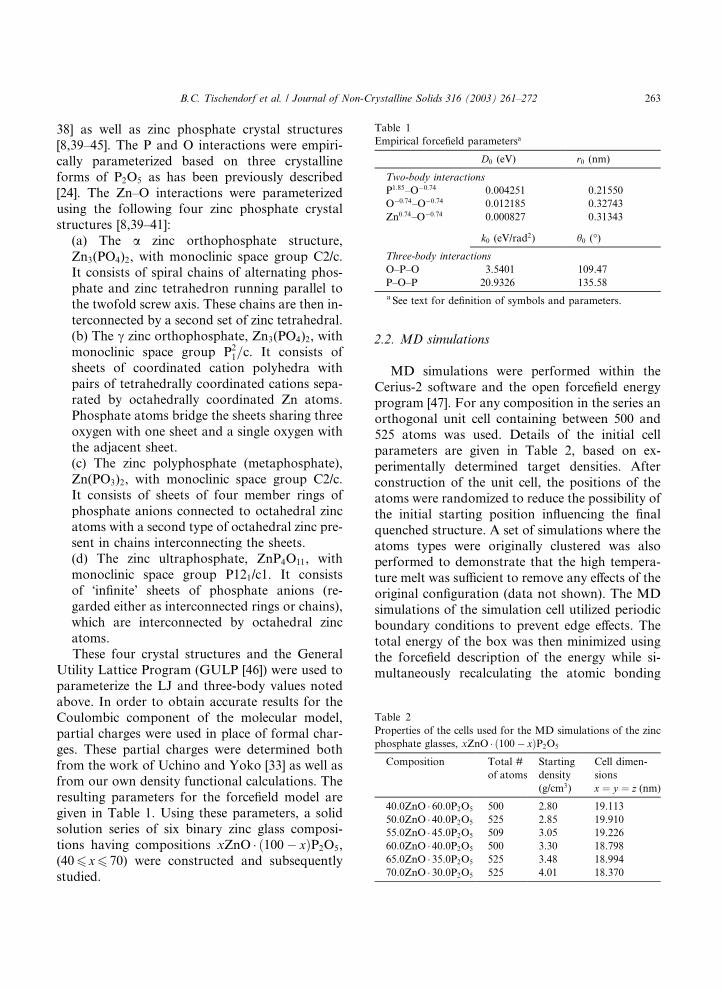
(V–T) relation that occurs as a result of the Tgtransition while maintaining a constant pressure.The Tg simulation procedure is the computational
analog to the experimental determination of Tgusing dilatometry. Determination of this relation-
ship is accomplished through heating the simula-
tion cell in a series of small temperature steps as an
NPT ensemble and allowing for a 50 ps equili-
bration at each step. At the end of each tempera-
ture step the density or molar volume of the box is
calculated. By plotting the change in the molar
volume as a function of temperature, and then
performing linear regressions for the data on eachside of the transition, the intersection of the re-
gression lines allowed the determination of Tg. An
example of the resulting V–T curve and corre-
sponding regression is shown in Fig. 1 for the 65
mol% Zn phosphate glass.
3. Results
The energy forcefield obtained for the P–O, O–
O, P–O–P and O–P–O interactions have previ-
ously been reported for the lithium ultraphosphateglass series [24]. The Zn–O interaction parameters
(Table 1) are the only new parameters required for
the MD simulations described here. The forcefield
parameters for the Zn0:74–O�0:74 (partial charges
noted as superscript) LJ potential (Eq. (1)) pro-
duce a slightly longer equilibrium Zn–O bond
length, and a greater potential well depth than
those for the Li0:37–O�0:74 forcefield parameterspreviously described [24].
3.1. MD simulations of densities
Using the forcefield and simulation procedures
detailed above, the densities obtained from the
Fig. 1. Molar volume of a simulation cell as a function of
temperature. Linear regressions on the two regions provide an
intersection that is the glass transition temperature of the sys-
tem.
264 B.C. Tischendorf et al. / Journal of Non-Crystalline Solids 316 (2003) 261–272
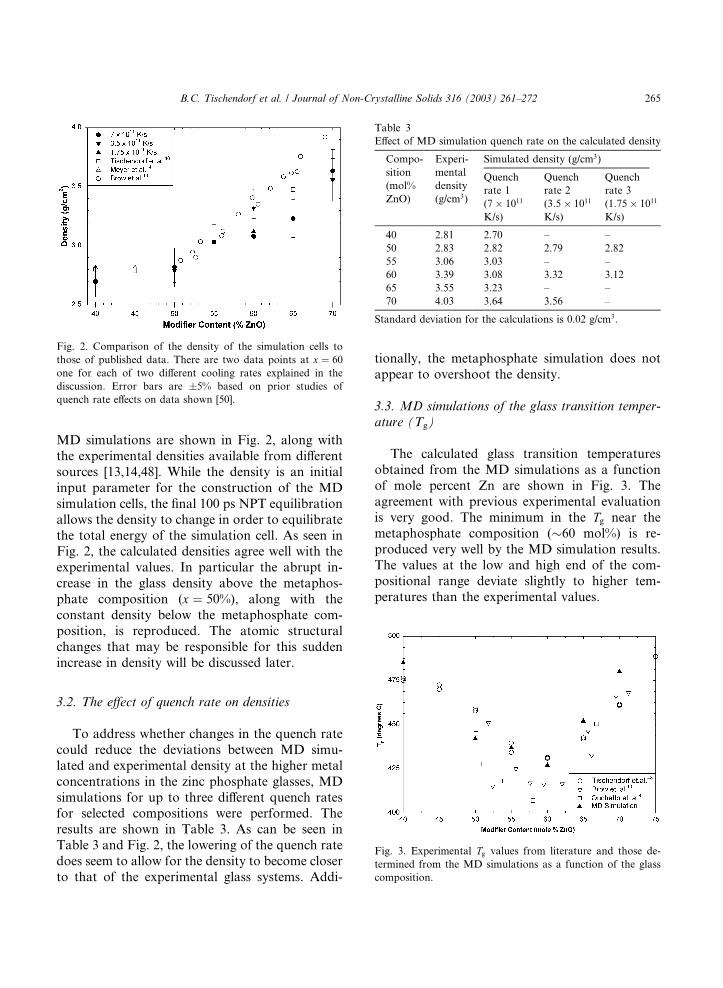
MD simulations are shown in Fig. 2, along with
the experimental densities available from different
sources [13,14,48]. While the density is an initial
input parameter for the construction of the MD
simulation cells, the final 100 ps NPT equilibration
allows the density to change in order to equilibrate
the total energy of the simulation cell. As seen inFig. 2, the calculated densities agree well with the
experimental values. In particular the abrupt in-
crease in the glass density above the metaphos-
phate composition (x ¼ 50%), along with the
constant density below the metaphosphate com-
position, is reproduced. The atomic structural
changes that may be responsible for this sudden
increase in density will be discussed later.
3.2. The effect of quench rate on densities
To address whether changes in the quench rate
could reduce the deviations between MD simu-
lated and experimental density at the higher metal
concentrations in the zinc phosphate glasses, MD
simulations for up to three different quench ratesfor selected compositions were performed. The
results are shown in Table 3. As can be seen in
Table 3 and Fig. 2, the lowering of the quench rate
does seem to allow for the density to become closer
to that of the experimental glass systems. Addi-
tionally, the metaphosphate simulation does not
appear to overshoot the density.
3.3. MD simulations of the glass transition temper-
ature (Tg)
The calculated glass transition temperatures
obtained from the MD simulations as a function
of mole percent Zn are shown in Fig. 3. The
agreement with previous experimental evaluation
is very good. The minimum in the Tg near the
metaphosphate composition (�60 mol%) is re-
produced very well by the MD simulation results.
The values at the low and high end of the com-positional range deviate slightly to higher tem-
peratures than the experimental values.
Fig. 2. Comparison of the density of the simulation cells to
those of published data. There are two data points at x ¼ 60
one for each of two different cooling rates explained in the
discussion. Error bars are �5% based on prior studies of
quench rate effects on data shown [50].
Table 3
Effect of MD simulation quench rate on the calculated density
Compo-
sition
(mol%
ZnO)
Experi-
mental
density
(g/cm3)
Simulated density (g/cm3)
Quench
rate 1
(7� 1011
K/s)
Quench
rate 2
(3:5� 1011
K/s)
Quench
rate 3
(1:75� 1011
K/s)
40 2.81 2.70 – –
50 2.83 2.82 2.79 2.82
55 3.06 3.03 – –
60 3.39 3.08 3.32 3.12
65 3.55 3.23 – –
70 4.03 3.64 3.56 –
Standard deviation for the calculations is 0.02 g/cm3.
Fig. 3. Experimental Tg values from literature and those de-
termined from the MD simulations as a function of the glass
composition.
B.C. Tischendorf et al. / Journal of Non-Crystalline Solids 316 (2003) 261–272 265

3.4. Short-range structure of the Zn phosphate glass
series xZnO � ð100� xÞP2O5
The MD simulations allow the radial distribu-
tion function, GðrÞ, to be easily evaluated. The
individual pair distribution functions, gðrÞ, for thedifferent pairs of nuclei for each simulation can
also be readily determined as shown in Fig. 4 forthe metaphosphate composition. In the total GðrÞthe shorter interatomic distances are well-resolved
allowing evaluation of changes in the short-range
structure via changes in the P–O, Zn–O and O–O
distances. At greater interatomic distances many
of these different gðrÞ curves overlap, obscuring
medium range and long structural changes from a
simple evaluation of the total GðrÞ. One majordifficulty in MD simulations of glasses and amor-
phous structures is the lack of detailed experi-
mental information to verify the accuracy of the
structural model. For Zn phosphate glasses there
are very few published neutron diffraction results.
Only data for the Zn metaphosphate glass has
been reported, allowing a comparison between the
simulated and experimental GðrÞ as shown in Fig.5(a) [19,49]. In addition, a comparison of GðrÞextracted from unpublished neutron diffraction
data for the 60 and 70 mol% Zn phosphate glass is
shown in Fig. 5(b) and (c) [49].
Fig. 6 shows the variation of the MD simulated
radial distribution function GðrÞ, as a function of
Zn concentration for the xZnO � ð100� xÞP2O5
Fig. 4. Calculated individual radial pair distribution functions
for the metaphosphate composition.
Fig. 5. Radial distribution functions of the equilibrated MD
simulations from this work compared to previously published
data and unpublished results for the glass compositions of (a)
x ¼ 50 [19], (b) x ¼ 55 [49], and (c) x ¼ 60 [49] mol% ZnO. In all
graphs the solid line is the simulation data and the dotted line is
the experimental data offset for easier comparison.
266 B.C. Tischendorf et al. / Journal of Non-Crystalline Solids 316 (2003) 261–272
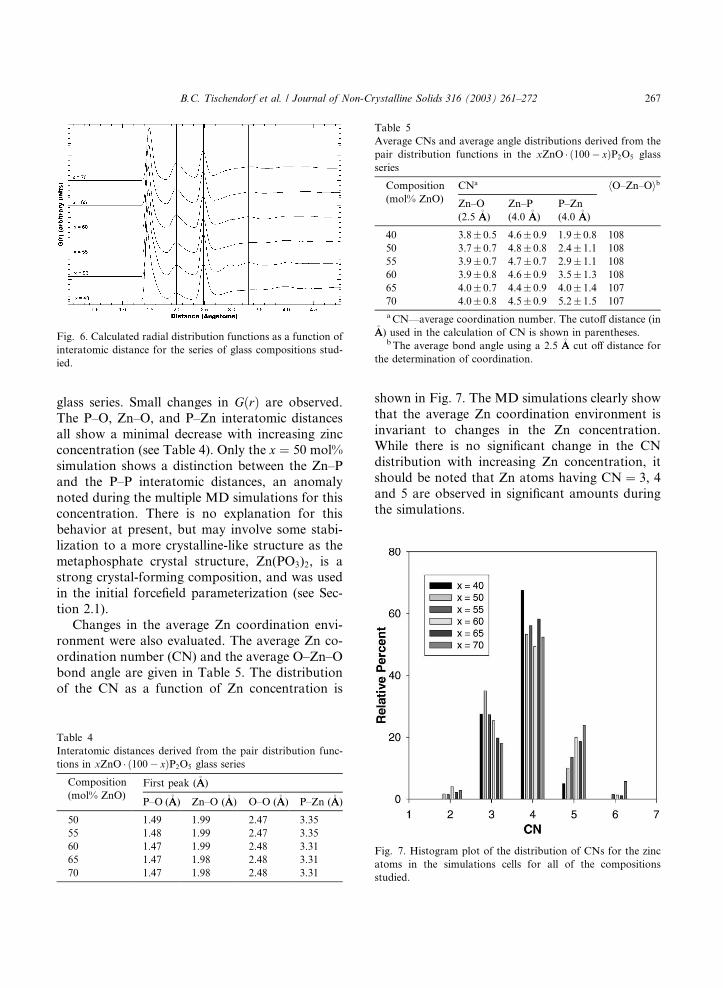
glass series. Small changes in GðrÞ are observed.
The P–O, Zn–O, and P–Zn interatomic distances
all show a minimal decrease with increasing zincconcentration (see Table 4). Only the x ¼ 50 mol%
simulation shows a distinction between the Zn–P
and the P–P interatomic distances, an anomaly
noted during the multiple MD simulations for this
concentration. There is no explanation for this
behavior at present, but may involve some stabi-
lization to a more crystalline-like structure as the
metaphosphate crystal structure, Zn(PO3)2, is astrong crystal-forming composition, and was used
in the initial forcefield parameterization (see Sec-
tion 2.1).
Changes in the average Zn coordination envi-
ronment were also evaluated. The average Zn co-
ordination number (CN) and the average O–Zn–O
bond angle are given in Table 5. The distribution
of the CN as a function of Zn concentration is
shown in Fig. 7. The MD simulations clearly show
that the average Zn coordination environment is
invariant to changes in the Zn concentration.
While there is no significant change in the CN
distribution with increasing Zn concentration, it
should be noted that Zn atoms having CN ¼ 3, 4
and 5 are observed in significant amounts duringthe simulations.
Fig. 7. Histogram plot of the distribution of CNs for the zinc
atoms in the simulations cells for all of the compositions
studied.
Fig. 6. Calculated radial distribution functions as a function of
interatomic distance for the series of glass compositions stud-
ied.
Table 4
Interatomic distances derived from the pair distribution func-
tions in xZnO � ð100� xÞP2O5 glass series
Composition
(mol% ZnO)First peak (�AA)
P–O (�AA) Zn–O (�AA) O–O (�AA) P–Zn (�AA)
50 1.49 1.99 2.47 3.35
55 1.48 1.99 2.47 3.35
60 1.47 1.99 2.48 3.31
65 1.47 1.98 2.48 3.31
70 1.47 1.98 2.48 3.31
Table 5
Average CNs and average angle distributions derived from the
pair distribution functions in the xZnO � ð100� xÞP2O5 glass
series
Composition
(mol% ZnO)
CNa hO–Zn–Oib
Zn–O
(2.5 �AA)
Zn–P
(4.0 �AA)
P–Zn
(4.0 �AA)
40 3.8� 0.5 4.6� 0.9 1.9� 0.8 108
50 3.7� 0.7 4.8� 0.8 2.4� 1.1 108
55 3.9� 0.7 4.7� 0.7 2.9� 1.1 108
60 3.9� 0.8 4.6� 0.9 3.5� 1.3 108
65 4.0� 0.7 4.4� 0.9 4.0� 1.4 107
70 4.0� 0.8 4.5� 0.9 5.2� 1.5 107
aCN––average coordination number. The cutoff distance (in�AA) used in the calculation of CN is shown in parentheses.
b The average bond angle using a 2.5 �AA cut off distance for
the determination of coordination.
B.C. Tischendorf et al. / Journal of Non-Crystalline Solids 316 (2003) 261–272 267

3.5. Medium range order of the Zn phosphate glass
series xZnO � ð100� xÞP2O5
Fig. 8 shows the simulated glass structure at
x ¼ 50, 60, and 70 mol% ZnO. From these snap-
shots, the glass structure can be seen transitioning
from long chains and some rings at the meta-
phosphate composition to that of isolated PO4
tetrahedra within the pyrophosphate region.
4. Discussion
This paper describes use of MD simulations to
understand and predict the structural and physical
properties of a binary zinc phosphate glass series,xZnO�ð100� xÞP2O5, (406 x6 70) where x is the
mole percent modifier. The correspondence be-
tween the simulated and experimental densities
reported in the present paper is very similar to that
observed for the MD simulations of the Na ul-
traphosphate glass series (Liang et al., unpublished
results). It was noted, however, that the MD sim-
ulated densities deviate slightly from experimentalvalues with increasing Zn concentration. One pos-
sibility for this deviation is the inadequate para-
meterization of the Zn–O interactions at higher
Zn concentrations within the forcefield model.
Another possibility is that the conditions (cell size
and quench rate) under which the MD simulations
were performed may have a major impact on the
resulting densities.In a recent paper by Huff et al. it was demon-
strated that the choice of forcefield parameters, the
number of atoms in the simulations, and the ef-
fective quench rate all effect the resulting MD
simulations in vitreous silica [50]. In that study it
was shown that forMD simulations using a smaller
number of atoms within the cell (�650 atoms), that
variations in the density were on the order of 5%,while for simulations using a larger number of at-
oms (�3000 atoms) the variations in the calculated
densities were reduced to �1% [50]. No major
changes in the overall silica structure were observed
for simulations of these different-sized cells. Vari-
ations in the quench rate were also noted to have
distinct changes on the resulting structure, in partic-
ular, the CN distributions, as well as the resulting
Fig. 8. Snapshots of the equilibrated simulation cell for glass
compositions of (a) 50ZnO � 50P2O5, (b) 60ZnO � 40P2O5, and
(c) 70ZnO � 30P2O5.
268 B.C. Tischendorf et al. / Journal of Non-Crystalline Solids 316 (2003) 261–272
average density [50]. This shows that the slowerquench rates allow the systems to reach an equi-
librium position that is closer to that of the actual
glass systems. If, however, error bars are associated
with the data using the 5% error that was observed
by Huff et al. for the effect of cell size, it can be seen
that within this experimental error, there is no real
difference between the different quench rates used
for these systems (see Fig. 2). It also indicates thatwithin the simulation variations there is no differ-
ence between the MD simulated and the experi-
mental data points.
In addition, and following the findings of Huff
et al., there was no observed change in the glass
transition temperatures or the calculated radial
distribution functions of these systems quenched
at a slower rate for the x ¼ 50 and 60 compositionsof the zinc phosphate glass system. While there
were no noticeable changes in glass transition
temperatures with the simulated quench rate, the
overall agreement is much better than that previ-
ously reported for the Li ultraphosphate glass MD
simulations [24]. The agreement in the prediction
of Tg despite having an experimentally unrealistic
quench rate, increases our confidence in the per-formance of this type of interatomic forcefield and
molecular simulation, and the future ability to
investigate more complex phosphate glass systems.
As shown above, there is good agreement be-
tween the simulations and the experimental data,
but there are some distinct differences noted when
the radial distribution functions are studied. The
MD simulations reported here for the Zn phos-phate glasses underestimate the P–O distance and
distribution for the entire range of Zn composi-
tions. A similar underestimation was noted in the
MD analysis in the lithium metaphosphate glass
[18]. It also appears that the MD simulations
slightly overestimate the Zn–O distance for this
series of glasses. While these differences are small,
it does suggest that improvements to the forcefieldmodel can be made for incorporation in future
simulation studies. The majority of these im-
provements would most likely come from further
studies of the crystal systems to provide increased
accuracy of the atomic positions in each crystal.
The intensity differences between the experimental
and calculated plots shown in Fig. 5 are due to
limitations in the software used to calculate theradial distribution functions from the neutron data
to take into account the scattering efficiency of the
atoms within the glass.
In phosphate glass systems the initial decrease
in Tg between the ultraphosphate composition
(x ¼ 0) and the metaphosphate composition
(x ¼ 50) is initially dominated by the reduction of
phosphate tetrahedral crosslinking during theglass depolymerization with increasing modifier
concentration. The ability of the polymer-like
chains to twist and tangle after formation due to
this loss of crosslinking is one of the possible ex-
planations for the Tg increase [51,52]. The struc-
tural variations that cause the increase in the Tgbetween the Zn concentrations of x ¼ 50 and 70
mol% are presently unknown. Analysis of the MDsimulations shows that the Zn phosphate glass
structure undergoes a significant long-range
structural change with increasing zinc content,
consistent with the reported experimental obser-
vations [15,48,53,54].
Recent investigations using double quantum
magic angle spinning NMR, along with high res-
olution NMR techniques, has allowed the phos-phate connectivity for these binary zinc phosphate
glasses to be investigated [48,55]. It has been ar-
gued that the chains formed near the metaphos-
phate composition (x ¼ 50) are responsible for the
increase of Tg up until that composition due to the
structural stabilization produced by the entangle-
ment of these phosphate chains similar to polymer
systems. The MD simulations qualitatively sup-port the argument of chain formation, as linear
chains are clearly observed near the metaphos-
phate glass composition (see Fig. 8(a)). Unfortu-
nately this explanation is not sufficient to explain
the increasing Tg behavior (Fig. 3) at higher Zn
concentrations, where the continued break up of
the phosphate chains to form isolated phosphate
tetrahedra (Fig. 8(c)) is expected to decrease Tg.At higher Zn concentrations the glass modifier
within the system is also expected to play a more
important role in the glass structure. Past work
suggested that the coordinating zinc atoms in the
glass structure begin to change from fourfold to
fivefold as the glass composition approaches that
of the orthophosphate [15,48], and could explain
B.C. Tischendorf et al. / Journal of Non-Crystalline Solids 316 (2003) 261–272 269

the increasing Tg above the metaphosphate com-position. The average coordination of zinc in this
study was found to be 4 although there was a
broad distribution of CNs. A similar coordination
environment was noted during the MD simulation
of the Zn(PO3)2 glass [31]. The distribution of the
O–Zn–O bond distance is also rather broad (not
shown) with the most probable bond angle near
95�, also consistent with the results of Sourial et al.[31]. The average Zn–O bond distance of 1.98 �AA, is
very close to the average Zn–O distance of 1.97 �AAof tetrahedrally coordinated zinc, and significantly
different from the 2.06 �AA of octahedrally coordi-
nated zinc, based on crystal structures [45]. There
are several studies that indicate a zinc CN of near 5
at the metaphosphate composition, while other
work indicates that the CN is very dependent onpreparation conditions and materials [12,19]. The
presence of both fivefold- and sixfold-coordinated
zinc has been shown to occur within the crystal
systems of the binary zinc phosphates possibly due
to these preparation dependencies [45,56]. While
the structure of the crystal systems alone does not
indicate that the same changes occur within the
glass systems, other studies on zinc phosphateglasses have indicated that this coordination en-
vironment is possible [12,19]. Based on the present
MD simulations it appears that the average coor-
dination environment does not change over the Zn
concentration range investigated, but the presence
of non-tetrahedrally coordinated Zn does occur
(see Fig. 7). This indicates that there is a need to
look elsewhere for an explanation of the Tg trends.Our MD simulations, while reproducing the
increasing Tg, do not support this argument that
changes in the Zn CN are the dominant reason. In
previous investigations of the lithium ultraphos-
phate glasses, it was shown that there was a cor-
relation between the coordination of the P and Li
and the change in Tg behavior [18]. The average ZnCN of P (i.e. number of Zn around a given P) isshown in Table 5. This CN is expected to increase
with increasing Zn concentration. In the MD
analysis of the Li ultraphosphate glass system, a
distinct discontinuity in the Li CN of P was noted
at the Tg minimum [18]. A similar change is not
observed for the present MD investigation of the
Zn phosphate glasses.
The average P CN of Zn (i.e. number of Znaround a given P) is shown in Table 5. Interest-
ingly this number is invariant at �4.6 for the entire
Zn concentration range investigated. This CN
would suggest that there is a lack of edge sharing
phosphate tetrahedral present within the glass at
any composition near or above the metaphos-
phate. The Zn atoms within the system have an
average CN of 4 that is invariant throughout thecomposition range studied. The number of phos-
phate atoms within the secondary coordination
sphere (within about 4 �AA around each zinc atom,
however, continually increases as more zinc is
added to the system. It is possible that this pref-
erence of the Zn to link together as many as pos-
sible phosphate tetrahedral leads to the steady
increase in the Tg above the metaphosphate com-position. This continues until approximately 75
mol% zinc at which time the Tg once again drops.
At this point there are no free oxygen atoms left
for the zinc to bond to and the excess Zn must
start to form a network of ZnO within the glass
once again destabilizing the structure.
5. Conclusions
Using known crystal structures, an accurate
energy forcefield model was developed for use with
the binary zinc phosphate glass system,
xZnO � ð100� xÞP2O5 (40 < x < 70). Due to the
special design of the model, it is expected to be
useful for studying more complex glass composi-tions with desirable properties. The structure, glass
transition temperature, and density of the glass
compositions were calculated and compared to
published data. There is very good agreement be-
tween the data, in spite of the large difference in
quench rates between the simulations and the ex-
perimental data. Lowering the quench rate of the
material was found to have a small positive effecton our MD simulations that allowed for an in-
crease in the accuracy of the data. The simulations
incorporate a forcefield model that takes into ac-
count the relatively short-range LJ interactions,
long-range Coulombic interactions, and the ener-
getics of the phosphorous–oxygen bond angles
in the glass system. This study should provide a
270 B.C. Tischendorf et al. / Journal of Non-Crystalline Solids 316 (2003) 261–272

sound atomistic basis for future model develop-ment that can be used to study more complex
phosphate glass systems.
Acknowledgements
Financial support of J.U.O.�s research from the
US National Science Foundation (DMR9733350)
is gratefully acknowledged. Financial support
from the Basic Energy Science program at SandiaNational Laboratories is also acknowledged. In
addition, some of the work (B.C.T.) was per-
formed as part of Sandia�s Student Internship
Program. Sandia is a multiprogram laboratory
operated by the Sandia Corporation, a Lockheed
Martin Company, for the United States Depart-
ment of Energy under contract DE-AC04-
94AL85000. Also, thanks are due to Jian-Jie Liang(SNL) for assistance in use of the MD simulation
software, and to Chun Loong and Jackie Johnson
(Argonne National Laboratory) for experimental
assistance in acquisition of part of the neutron
scattering data.
References
[1] J.R. Van Wazer, Phosphorous and its Compounds, Inter-
science, New York, 1958.
[2] Y. Abe, J. Curley-Joseph, J. Feder, T.O. Henderson, R.L.
Hilderbrand, H.R. Hudson, H.J. Lubansky, in: Topics in
Phosphorus Chemistry, vol. 11, 1983.
[3] J.U. Otaigbe, G.H. Beall, Trends Polym. Sci. (Cambridge,
UK) 5 (1997) 369.
[4] M. Ouchetto, B. Elouadi, S. Parke, Phys. Chem. Glasses 32
(1991) 8.
[5] B.J. Allan, B.V. Hiremath (Eds.), Solid State Optical
Materials, vol. 28, American Ceramic Society, Westerville,
OH, 1992.
[6] C.J. Quinn, P.D. Frayer, G.H. Beall, in: J.C. Salamone
(Ed.), Polymeric Materials Encyclopedia, vol. 4, CRC,
1996.
[7] A. Musinu, G. Piccaluga, G. Pinna, D. Narducci, S.
Pizzini, J. Non-Cryst. Solids 111 (1989) 221.
[8] P.M.T. Averbuch-Pouchot, A. Durif, M. Bagieu-Beucher,
Acta Crystallogr. C 39 (1983) 25.
[9] A. Lai, A. Musinu, G. Piccaluga, S. Puligheddu, Phys.
Chem. Glasses 38 (1997) 173.
[10] R.K. Brow, J. Non-Cryst. Solids 194 (1996) 267.
[11] E.C. Onyiriuka, J. Non-Cryst. Solids 163 (1993) 268.
[12] A. Musinu, G. Piccaluga, G. Pinna, G. Vlaic, D. Narducci,
S. Pizzini, J. Non-Cryst. Solids 136 (1991) 198.
[13] R.K. Brow, D.R. Tallant, S.T. Myers, C.C. Phifer, J. Non-
Cryst. Solids 191 (1995) 45.
[14] K. Meyer, J. Non-Cryst. Solids 209 (1997) 227.
[15] J.W. Wiench, M. Pruski, B. Tischendorf, J.U. Otaigbe,
B.C. Sales, J. Non-Cryst. Solids 263&264 (2000) 101.
[16] M. Feike, C. J€aager, H.W. Spiess, J. Non-Cryst. Solids 223
(1998) 200.
[17] H. Eckert, Prog. NMR Spectrosc. 24 (1992) 159.
[18] T.M. Alam, J.-J. Liang, R.T. Cygan, Phys. Chem. Chem.
Phys. 2 (2000) 4427.
[19] M. Bionducci, G. Licheri, A. Musini, G. Navarra,
G. Piccaluga, G. Pinna, Z. Naturforsch., A 51 (1996)
1209.
[20] G.G. Boiko, N.S. Andreev, A.V. Parkachev, J. Non-Cryst.
Solids 238 (1998) 175.
[21] G.G. Boiko, N.S. Andreev, A.V. Parkachev, Glass Phys.
Chem. 24 (1998) 415.
[22] G. Cormier, J.A. Capobianco, A. Monteil, J. Non-Cryst.
Solids 168 (1994) 115.
[23] A. Karthikeyan, P. Vinatier, A. Levasseur, K.J. Rao, J.
Phys. Chem. B 103 (1999) 6185.
[24] J.J. Liang, R.T. Cygan, T.M. Alam, J. Non-Cryst. Solids
263&264 (2000) 167.
[25] L. Murawski, R.J. Barczynski, A. Rybicka, Proc. SPIE-Int.
Soc. Opt. Eng. 3181 (1997) 136.
[26] K. Parlinski, H. Grimm, Phys. Rev. B 33 (1986) 4868.
[27] K. Parlinski, H. Grimm, Ferroelectrics 79 (1988) 331.
[28] A.G. Shikerkar, Solid State Phys., Proc. DAE Solid State
Phys. Symp. 42nd (2000) 107.
[29] K. Shoji, I. Yasui, J. Non-Cryst. Solids 177 (1994) 125.
[30] R.K. Sistla, M. Seshasayee, Solid State Commun. 113
(1999) 35.
[31] E. Sourial, T. Peres, J.A. Capobianco, A. Speghini, M.
Bettinelli, Phys. Chem. Chem. Phys. 1 (1999) 2013.
[32] A. Speghini, E. Sourial, T. Peres, G. Pinna, M. Bettinelli,
J.A. Capobianco, Phys. Chem. Chem. Phys. 1 (1999)
173.
[33] T. Uchino, T. Yoko, J. Non-Cryst. Solids 263&264 (2000)
180.
[34] D.K. Belashchenko, Inorg. Mater. 33 (1997) 565.
[35] H. Inoue, A. Makishina, T. Kanazawa, T. Nanba, I. Yasui,
Phys. Chem. Glasses 36 (1995) 37.
[36] M. Jansen, B. Luer, Acta Crystallogr. 177 (1986) 149.
[37] E.H. Arbib, B. Elouadi, J. Solid State Chem. 127 (1996)
350.
[38] D. Stachel, I. Svoboda, H. Fuess, Acta Crystallogr. C 51
(1995) 1049.
[39] C. Calvo, J. Phys. Chem. Solids 24 (1963) 141.
[40] C. Calvo, Can. J. Chem. 43 (1965) 436.
[41] C. Baez-Doelle, D. Stachel, Z. Kristallogr. 203 (1993)
232.
[42] B.E. Robertson, C. Calvo, J. Solid State Chem. 1 (1970)
120.
[43] J.S. Stephens, C. Calvo, Can. J. Chem. 45 (1967)
2303.
B.C. Tischendorf et al. / Journal of Non-Crystalline Solids 316 (2003) 261–272 271

[44] A.G. Nord, T. Stefanidis, Mater. Res. Bull. 16 (1981)
1121.
[45] A.G. Nord, P. Kierkegaard, Chem. Scr. 15 (1980) 27.
[46] J.D. Gale, Royal Institiution of Great Britain/Imperial
College, 1992–1994.
[47] OFF Energy Program ed.; Accelrys INC., 2001.
[48] B. Tischendorf, J.U. Otaigbe, J.W. Wiench, M. Pruski,
B.C. Sales, J. Non-Cryst. Solids 282 (2001) 147.
[49] J.U. Otaigbe, C.K. Loong, et al., unpublished neutron
diffraction data.
[50] N.T. Huff, E. Demiralp, T. C�agin, W.A. Goddard III, J.
Non-Cryst. Solids 253 (1999) 133.
[51] N.H. Ray, Inorganic Polymers, Academic Press, New
York, 1978.
[52] C.E. Crowder, J.U. Otaigbe, M.A. Barger, R.L. Sammler,
B.C. Monahan, C.J. Quinn, J. Non-Cryst. Solids 210
(1997) 209.
[53] M. Feike, C. Jager, H.W. Spiess, J. Non-Cryst. Solids 223
(1998) 200.
[54] C. J€aager, P. Hartmann, R. Witter, M. Braun, J. Non-Cryst.
Solids 263&264 (2000) 61.
[55] J.W. Wiench, B. Tischendorf, J.U. Otaigbe, M. Pruski, J.
Molec. Struct. 602&603 (2002) 145.
[56] C. Calvo, Mater. Res. Bull. 16 (1981) 1121.
272 B.C. Tischendorf et al. / Journal of Non-Crystalline Solids 316 (2003) 261–272


![The effect of di]methylsulfoxide on the substrate site of Na +/K +ATPase studied through phosphorylation by inorganic phosphate and ouabain binding](https://static.fdokumen.com/doc/165x107/6323a6724d8439cb620d023f/the-effect-of-dimethylsulfoxide-on-the-substrate-site-of-na-k-atpase-studied.jpg)