Orientational Glasses: NMR and Electric Susceptibility Studies
Upload
khangminh22Category
view
0download
0
applied sciences
Article
Use of Terbium Doped Phosphate Glasses for High DoseRadiation Dosimetry—Thermoluminescence Characteristics,Dose Response and Optimization of Readout Method
Andrzej Gasiorowski 1,* , Piotr Szajerski 1 and Jose Francisco Benavente Cuevas 2
�����������������
Citation: Gasiorowski, A.; Szajerski,
P.; Cuevas, J.F.B. Use of Terbium
Doped Phosphate Glasses for High
Dose Radiation Dosimetry—
Thermoluminescence Characteristics,
Dose Response and Optimization of
Readout Method. Appl. Sci. 2021, 11,
7221. https://doi.org/10.3390/
app11167221
Academic Editors:
Dorota Swiatla-Wojcik,
Yosuke Katsumura and Radosław
A. Wach
Received: 3 July 2021
Accepted: 2 August 2021
Published: 5 August 2021
Publisher’s Note: MDPI stays neutral
with regard to jurisdictional claims in
published maps and institutional affil-
iations.
Copyright: © 2021 by the authors.
Licensee MDPI, Basel, Switzerland.
This article is an open access article
distributed under the terms and
conditions of the Creative Commons
Attribution (CC BY) license (https://
creativecommons.org/licenses/by/
4.0/).
1 Institute of Applied Radiation Chemistry, Lodz University of Technology, Wroblewskiego 15,93-590 Lodz, Poland; [email protected]
2 The Center for Energy, Environmental and Technological Research (CIEMAT), Av. Complutense 40,28040 Madrid, Spain; [email protected]
* Correspondence: [email protected]; Tel.: +48-42-631-3073
Abstract: The phosphate glass samples doped with Tb2O3 oxide (general formula: P2O5-Al2O3-Na2O-Tb2O3) were synthesized and studied for usage in high-dose radiation dosimetry (for example,in high-activity nuclear waste disposals). The influence of terbium concentration on thermolumines-cent (TL) signals was analyzed. TL properties of glasses were investigated using various experimentaltechniques such as direct measurements of TL response vs. radiation dose, Tmax–Tstop and VHR(various heating rate) methods, and glow curve deconvolution analysis. The thermoluminescencedosimetry (TLD) technique was used as the main investigation tool to study detectors’ dose responses.It has been proved that increasing the concentration of terbium oxide in glass matrices significantlyincreases the thermoluminescence yield of examined material. For the highest dose range (up to35 kGy), the dependence of the integrated thermoluminescent signals vs. dose can be consideredas a saturation-type curve. Additional preheating of samples improves linearity of signal vs. dosedependencies and leads to a decrease of the signal loss over time. All obtained data suggest thatinvestigated material can be used in high-dose radiation dosimetry. Additional advantages of the in-vestigated dosimetric system are its potential ability to re-use the same dosimeters multiple times andthe fact that reading dosimeters only requires usage of a basic TL reader without any modifications.
Keywords: dosimetry; ionizing radiation; thermoluminescence; dosimeter; glass; phosphate; terbium
1. Introduction
Fast progress and rising interest in technologies involving interactions of ionizingradiation with matter force the continuous development of dosimetric techniques. Thenumber of dosimetric systems present nowadays on the market is limited, especiallyin the narrow field of high-dose radiation dosimetry (especially in dose ranges up to35 kGy). Many of these systems are based on organic compounds and polymers (alanine,poly-methylmethacrylate, etc.) and have numerous limitations in terms of use in harshenvironments. One of the potential alternatives that may turn out to be complementary toexisting systems is phosphate glasses doped with terbium ions.
Terbium is a lanthanide, belonging to the rare-earth elements (REE) group. REEinclude lanthanum and the f-block elements, cerium through lutetium. Next to the above,scandium and yttrium are included in this group as well, due to the similar ionic radii withthe lighter f-block elements. Moreover, they co-exist together in the same types of ores [1].Lanthanides exhibit an important feature, namely, they can play the role of light-emittingactivators in various matrices. The rare earth phosphors can be divided into two groups:the broad-band-emitting, owing to the 5d→4f transition (Eu2+, Ce3+), and the narrow-band-emitting, owing to the transition between the 4f levels like Tb3+. Terbium ion emits greenlight due to the four sharp peaks arising from 5D4→7FJ transitions, where J = 3, 4, or 6,
Appl. Sci. 2021, 11, 7221. https://doi.org/10.3390/app11167221 https://www.mdpi.com/journal/applsci

Appl. Sci. 2021, 11, 7221 2 of 21
with the strongest emission peak at 550 nm [2,3]. Terbium possesses only one stable isotopeTb-159, characterized by a low nuclear spin value (I = 3/2), and exhibits a relatively simplehyperfine structure of its electronic levels [4].
Terbium ions (Tb3+) are very often used as dopants in order to extend luminescenceproperties in various materials, e.g., in nitridosilicates, glasses, and ceramics [5–8]. Terbiumions are also able to play the role of activators in mechano-luminescence light-emission pro-cesses, often as inorganic salts such as sulphates, carbonates, nitrates, and chlorides [9,10].Terbium dopants have been also used in various types of thermoluminescent (TL) mate-rials. For example, magnesium orthosilicate doped with terbium (Mg2SiO4:Tb) has beeninvestigated in TL dosimetry since 1971, thanks to its high sensitivity and effective atomicnumber of 11 [11,12]. Unfortunately, TL properties of orthosilicates might be unstable,which are strongly influenced by the preparation method [13]. Another group of light-emitting materials that are based on terbium dopant, improving their TL properties, areionic crystals, e.g., CsCl:Tb3+, terbium-doped strontium pyrophosphates (Sr2P2O7:Tb3+),potassium bromide crystals, and terbium-doped double fluorides [14–17]. Moreover, theapplication of terbium oxide as a dopant significantly improved the properties of materialsthat had been already used in TL dosimetry. A straightforward example of such materialsis aluminum oxide doped with terbium and thalium [18]. Lu2O3:Tb,Ta ceramic storagephosphors are also a good example of how the presence of terbium ions can significantlychange the thermoluminescence properties of materials; Tb,Ta ceramics show high overallTL intensity [19]. Despite all the advantages of the crystal-based phosphors, they possessdrawbacks as well. For TL dosimeters based on crystalline systems, one can observean increased light-scattering efficiency, due to their limited transparency. A reasonablygood alternative for these phosphors might be found among dosimetric systems based onglasses, for example, borosilicate glasses [20]. One such example is zinc-lithium-borateglass doped with terbium. Introduction of terbium into the material results in an increaseof TL yield, enhancement of sensitivity of the phosphor, and significant minimization offading behavior [21]. BaO–P2O5 glasses are also an interesting example of influence ofterbium ions on matrices. The analysis of the TL data of BaO–M2O3–P2O5:Tb2O3 glassessuggests that, comparatively, there are high non-radiative losses in In2O3 mixed glasses [22].Another example of the improvement of dosimetric characteristics by the introduction ofterbium into glass hosts is terbium-doped CaO–Al2O3–B2O3 glasses. As in the previouscase, dosimeters were found to exhibit good sensitivity and linearity. Sadly, for thesematerials one can observe more than a 60% decrease in signal intensity in the first 72 h afterirradiation [23].
Phosphate glasses are currently used in various fields of science, technology, andmedicine, such as in matrices for high-level radioactive waste (HLW) immobilization, infast ion conductors, and in bone transplantation [24–26]. Phosphate glasses exhibit lowertransition temperatures, lower viscosity when in a molten state, higher thermal expansioncoefficients, and higher electrical conductivity than borate and silicate glasses [26]. Asshown before, phosphate glasses also possess interesting TL properties suitable for high-dose ionizing radiation dosimetry [27]. Glasses doped with Tb3+ are also used in otherluminescent materials, for example, lasers. [28]. An obvious advantage of phosphate glasssystems is that their synthesis requires significantly lower temperatures and less energy,which makes the process of their preparation economically competitive in comparison withother glasses. In the past, there were some papers dealing with the thermoluminescenceof phosphate glasses doped with rare earth elements such as terbium, but none of theminvestigated in detail thermoluminescence kinetics and the usage of this material in high-dose dosimetry [29,30].
The presented work reports the influence of terbium doping on dosimetric propertiesof phosphate glass by means of thermoluminescence techniques. Here, one investigatedthe influence of terbium concentration on TL signal characteristics and the dependenciesof TL signal intensity vs. dose absorbed in a material. Next to the above, the nature ofthermoluminescence signals was investigated using various methods (such as the Tmax–
Appl. Sci. 2021, 11, 7221 3 of 21
Tstop or VHR methods). Moreover, the paper also proposes the readout method optimal forinvestigated dosimeters and investigates its influence on TL signals, linearity of signalsintensity vs. radiation dose absorbed within the material, and TL signal loss over time.
2. Materials and Methods2.1. Glass Samples Synthesis
The phosphate glass samples were synthesized according to the melt-quench tech-nique from raw materials, such as Na2CO3, NH4H2PO4, Al2O3, and Tb4O7 of highestavailable purity. The details on the synthesis procedure were discussed in previous pa-pers [27]. Four different glass compositions were prepared for this research. The chemicalcompositions of each investigated glass system synthesized differed only due to terbiumoxide concentration, whereas the main components of the glasses remained practicallyunchanged. In order to follow the overall influence of the terbium dopant on TL propertiesof the investigated glasses, for comparison raw (undoped) glass sample was prepared si-multaneously (PPG) and investigated in the same manner as terbium-doped glass samples.The detailed compositions of all investigated phosphate glass samples are presented inTable 1.
Table 1. Compositions of raw and terbium-doped phosphate glasses, in weight (mole) %.
SampleComposition of Phosphate Glass Samples, in Weight (Mole) %
P2O5 Al2O3 Na2O Tb2O3
PPG 56.00 (38.36) 12.00 (11.44) 32.00 (50.20) -PPG_Tb01 55.94 (38.34) 11.99 (11.44) 31.97 (50.19) 0.10 (0.03)PPG_Tb05 55.72 (38.31) 11.94 (11.43) 31.84 (50.13) 0.50 (0.13)PPG_Tb30 54.03 (38.07) 11.54 (11.32) 30.85 (49.79) 3.00 (0.82)
The as-synthesized glass was grounded in a planetary ball mill (Retsch PM100, Haan,Germany) using zirconium oxide (ZrO2) grinding vessel and balls. The obtained powderswere classified using laboratory sieves, to remove remaining coarse fraction.
2.2. XRD and DSC Analysis of Phosphate Glasses
To confirm the glassy state of the phosphate glass samples XRD (X-Ray Diffraction),analysis was performed using powdered samples. The X-ray diffractometer used wasX’Pert Pro MPD (PANanalytical, Almelo, The Netherlands), and measurements wereperformed within 2theta angle between 5–60 deg. Data acquisition was carried out usingCu Kα radiation and scan rate of 6 deg/min, whereas X-ray tube was operating at 40 kVand 30 mA. Next to XRD analysis, one also performed differential scanning calorimetryanalysis of the native and terbium-doped phosphate glasses within 40–550 ◦C temperaturerange using Q200 DSC (TA Instruments, New Castle, DE, USA) with ca. 15 mg samples inaluminum crucibles applying a heating rate of 20 deg/min.
2.3. Preparation of Glass Pellet Dosimeters
To enhance properties of detectors and to facilitate manual operations, powdersof phosphate glass were pressed into pellets. The weighted portions of glass powders(40 mg) were placed in the cylindrical pressing die (hole diameter: 5 mm). Materials werecompressed using a hydraulic press, then pellets were sintered in a laboratory furnace(LE6/11/P300, Nabertherm, Lilienthal, Germany) for 1 h at 420 ◦C. The sintering step wasapplied to improve the mechanical properties of the detectors and to erase any residual TLsignals from the detectors.
2.4. Samples Irradiation
The investigated samples were irradiated using γ and β radiation installed in Instituteof Applied Radiation Chemistry, Lodz University of Technology. Gamma irradiation wasperformed using Co-60 radiation source installed in Ob-Servo-D panoramic irradiator

Appl. Sci. 2021, 11, 7221 4 of 21
(Izotop, Budapest, Hungary), whereas β- irradiation was performed using electron beamfrom linear electron accelerator (ELU-6E), which was able to produce electrons of energyof 6 MeV. The e-beam irradiation was performed in a single-pulse mode (17 ns or 4 µsduration), depending on the required dose. The range of cumulative doses applied tosamples using 17 ns pulses was 0.06–1.0 kGy and 0.33–35 kGy for 4 µs pulses. As a reference,for verification of radiation dose delivered to the samples, e-Scan alanine dosimetry system(Bruker, Karlsruhe, Germany) was used.
2.5. Thermoluminescence (TL) Measurements
TLD reader (Mikrolab TL Ra94, Poland) was used for thermoluminescence emissionmeasurements. The measurements were carried out in the analyzer mode, within thetemperature range of 40–400 ◦C using heating rate of 5 deg/s. Due to excessive lightemission from samples containing terbium, it was necessary to use a shutter with hole(diameter of 0.5 mm) to limit light flux reaching photomultiplier tube.
To estimate influence of the shutter used on thermoluminescence signal integrals,additional experiment was performed. Commercially available LiF dosimeters (MCP-N)were irradiated with different doses and read out with and without shutter. The slopesof the functions integrals vs. dose were calculated. Ratio of slopes between these tworeading conditions determined the ability of the shutter to reduce light. For the shutterused, TL signal intensity was reduced by two orders of magnitude. Due to much lowerlight-emission intensity in case of undoped (raw) phosphate glass, the shutter was notused.
3. Results3.1. Results of XRD and DSC Analysis of Synthesized Glasses
All synthesized samples were analyzed using X-ray powder diffraction technique toensure their glassy state. As one can see from the diffraction patterns presented in Figure 1a,one should consider all phosphate glass samples as fully amorphous materials. The lackof crystalline peaks is observed for all samples, even for PPG_Tb30 sample, containingrelatively high contribution (3.0%, w/w) of Tb2O3 oxide. The presented XRD patterns showthat for all samples only wide scattering peaks (so called “halo”) are observed at ca. 21◦
and 31◦ 2theta angles. In the low range of 2theta angle (5◦ to 16◦), one can also observe anincreased background intensity due to more efficient X-ray scattering in air. Obtained X-raypatterns are similar to those that can be find in literature [31–33]. The results of DSC analysisare presented in Figure 1b. Thermal analyses were carried out within the temperature rangeof 40–550 ◦C and confirmed the glassy nature of the investigated materials by existing of theglass transitions within the temperature range of 407–423 ◦C. For pure, undoped phosphateglass, the glass transition temperature was determined at 423 ◦C, whereas for the terbium-doped samples the transition temperatures were shifted towards lower values between408–410 ◦C. In terms of DSC, for undoped phosphate glass exhibits there was similar Tg tothat reported in literature [34]. Decreasing of Tg temperature for terbium-doped glassesmay be caused by a global weakening of the glass network induced by relatively largeTb3+ ion incorporation, which can be ascribed to the increase in non-bridging oxygens dueto the cleavage of P–O–P bonds to form P-O-Tb2+ [35–38]. However, this issue requiresfurther research using other research methods, for example, NMR.

Appl. Sci. 2021, 11, 7221 5 of 21Appl. Sci. 2021, 11, x FOR PEER REVIEW 5 of 21
Figure 1. XRD patterns (a) and DSC traces (b) of synthesized phosphate glasses.
3.2. Thermoluminescence (TL) Characteristics of Irradiated Glasses The phosphate glass dosimeters samples were irradiated in different modes in order
to investigate the detectors response. For this purpose, both electron beam and gamma photon irradiation were performed on investigated samples.
3.2.1. Electron Accelerator, Pulse Duration 4 μs At first, the native (undoped) and terbium-doped phosphate glass samples were ir-
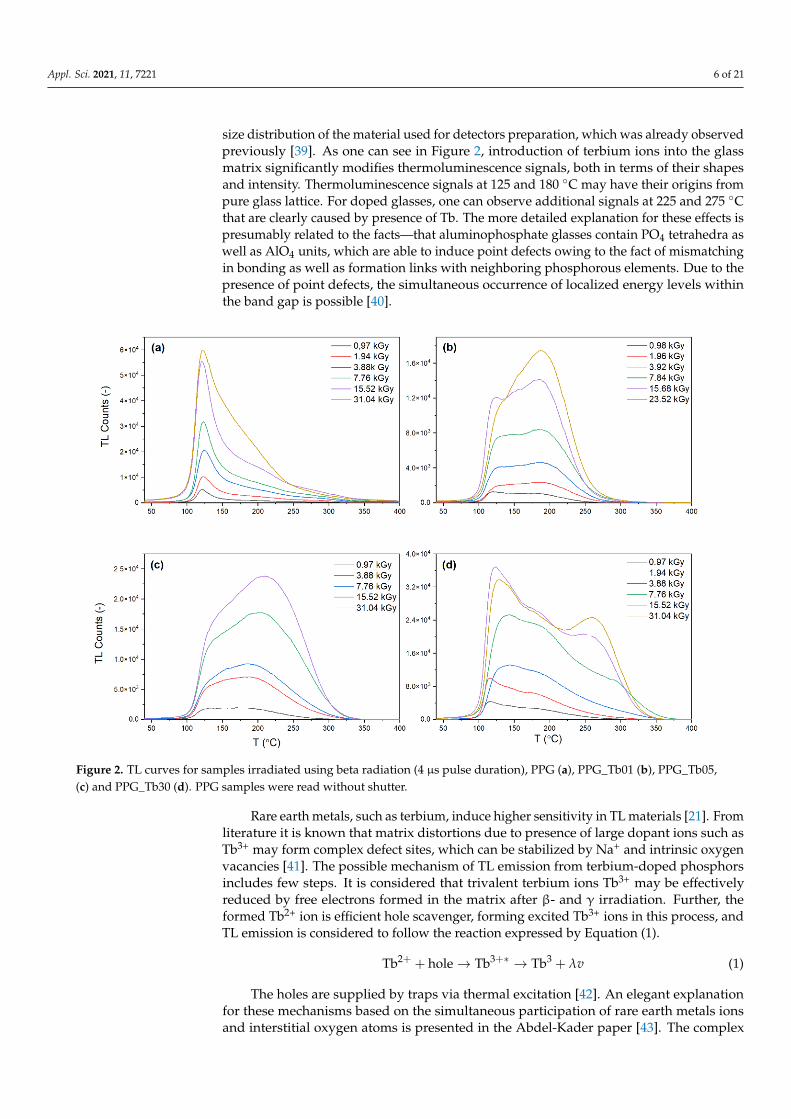
radiated using electron accelerator with pulse duration of 4 μs. The range of radiation doses delivered to the samples was 1–30 kGy. The results of these experiments are de-picted in Figure 2, where TL glow curves for each sample is presented for different radia-tion doses. The undoped phosphate glass already exhibits thermoluminescent properties. The irradiated samples of PPG glass show wide, complex TL signals with maximum emis-sion at ca. 125 °C (cf. Figure 2a). For the higher radiation doses, it is also possible to identify higher temperature peak, which in TL curves is located at ca. 180 °C (Figure 2a). For all terbium-doped samples, special shutter was installed to decrease amount of light reaching PMT tube (ca. 100 times). As one can see in Figure 2b, 0.1% addition of terbium oxide increases the yield of thermoluminescence significantly in comparison with native phos-phate glass. Higher contribution of terbium results in further increasing of TL intensity, which can be clearly observed in Figure 2c,d. For the glass samples doped with 0.5% of terbium oxide, the maximum of signals appears at ca. 225 °C (Figure 2b,c). Further in-creasing of terbium concentration in glass, to 3%, is followed by formation of additional signal at higher temperatures. This is clearly presented in Figure 2d, where one can ob-serve low temperature signal at ca. 125 °C with easily recognized signal at 275 °C. Signal at 125 °C is common for all samples irradiated with different doses, whereas peak at 275 °C appears for radiation doses higher than 8 kGy. Moreover, for radiation dose of 31 kGy one can observed partial degradation of the low temperature signal. Additionally PPG_Tb01and PPG_Tb30 shows an extensive change in the peak positions at higher radi-ation dose than in PPG_Tb05. Such effect may be due to the intensity of glass network modification process caused by introduction of terbium dopant. In case of low content of terbium, one deals only with slight modification of the glass network, whereas when in-creasing terbium oxide concentration one can expect more significant change of glass ma-trix structure and weakening of the glass-network-forming bonds. Such processes may lead to formation of additional trap centers, which can be more easily bleached when ir-radiated with higher doses. For the presented glow curves, one can also observe the slight distortions of the signal shape related to the increasing radiation dose. Nevertheless, the overall character of the presented glow curves remains similar for each glass sample. This
Figure 1. XRD patterns (a) and DSC traces (b) of synthesized phosphate glasses.
3.2. Thermoluminescence (TL) Characteristics of Irradiated Glasses
The phosphate glass dosimeters samples were irradiated in different modes in orderto investigate the detectors response. For this purpose, both electron beam and gammaphoton irradiation were performed on investigated samples.
3.2.1. Electron Accelerator, Pulse Duration 4 µs
At first, the native (undoped) and terbium-doped phosphate glass samples wereirradiated using electron accelerator with pulse duration of 4 µs. The range of radiationdoses delivered to the samples was 1–30 kGy. The results of these experiments are depictedin Figure 2, where TL glow curves for each sample is presented for different radiationdoses. The undoped phosphate glass already exhibits thermoluminescent properties. Theirradiated samples of PPG glass show wide, complex TL signals with maximum emission atca. 125 ◦C (cf. Figure 2a). For the higher radiation doses, it is also possible to identify highertemperature peak, which in TL curves is located at ca. 180 ◦C (Figure 2a). For all terbium-doped samples, special shutter was installed to decrease amount of light reaching PMTtube (ca. 100 times). As one can see in Figure 2b, 0.1% addition of terbium oxide increasesthe yield of thermoluminescence significantly in comparison with native phosphate glass.Higher contribution of terbium results in further increasing of TL intensity, which canbe clearly observed in Figure 2c,d. For the glass samples doped with 0.5% of terbiumoxide, the maximum of signals appears at ca. 225 ◦C (Figure 2b,c). Further increasingof terbium concentration in glass, to 3%, is followed by formation of additional signal athigher temperatures. This is clearly presented in Figure 2d, where one can observe lowtemperature signal at ca. 125 ◦C with easily recognized signal at 275 ◦C. Signal at 125 ◦C iscommon for all samples irradiated with different doses, whereas peak at 275 ◦C appearsfor radiation doses higher than 8 kGy. Moreover, for radiation dose of 31 kGy one canobserved partial degradation of the low temperature signal. Additionally PPG_Tb01andPPG_Tb30 shows an extensive change in the peak positions at higher radiation dose thanin PPG_Tb05. Such effect may be due to the intensity of glass network modification processcaused by introduction of terbium dopant. In case of low content of terbium, one dealsonly with slight modification of the glass network, whereas when increasing terbiumoxide concentration one can expect more significant change of glass matrix structure andweakening of the glass-network-forming bonds. Such processes may lead to formation ofadditional trap centers, which can be more easily bleached when irradiated with higherdoses. For the presented glow curves, one can also observe the slight distortions of thesignal shape related to the increasing radiation dose. Nevertheless, the overall character ofthe presented glow curves remains similar for each glass sample. This effect may be relatedto the possible thermal and geometrical conditions during readout and/or imperfect grain
Appl. Sci. 2021, 11, 7221 6 of 21
size distribution of the material used for detectors preparation, which was already observedpreviously [39]. As one can see in Figure 2, introduction of terbium ions into the glassmatrix significantly modifies thermoluminescence signals, both in terms of their shapesand intensity. Thermoluminescence signals at 125 and 180 ◦C may have their origins frompure glass lattice. For doped glasses, one can observe additional signals at 225 and 275 ◦Cthat are clearly caused by presence of Tb. The more detailed explanation for these effects ispresumably related to the facts—that aluminophosphate glasses contain PO4 tetrahedra aswell as AlO4 units, which are able to induce point defects owing to the fact of mismatchingin bonding as well as formation links with neighboring phosphorous elements. Due to thepresence of point defects, the simultaneous occurrence of localized energy levels withinthe band gap is possible [40].
Appl. Sci. 2021, 11, x FOR PEER REVIEW 6 of 21
effect may be related to the possible thermal and geometrical conditions during readout and/or imperfect grain size distribution of the material used for detectors preparation, which was already observed previously [39]. As one can see in Figure 2, introduction of terbium ions into the glass matrix significantly modifies thermoluminescence signals, both in terms of their shapes and intensity. Thermoluminescence signals at 125 and 180 °C may have their origins from pure glass lattice. For doped glasses, one can observe ad-ditional signals at 225 and 275 °C that are clearly caused by presence of Tb. The more detailed explanation for these effects is presumably related to the facts—that alumino-phosphate glasses contain PO4 tetrahedra as well as AlO4 units, which are able to induce point defects owing to the fact of mismatching in bonding as well as formation links with neighboring phosphorous elements. Due to the presence of point defects, the simultane-ous occurrence of localized energy levels within the band gap is possible [40].
Figure 2. TL curves for samples irradiated using beta radiation (4 μs pulse duration), PPG (a), PPG_Tb01 (b), PPG_Tb05, (c) and PPG_Tb30 (d). PPG samples were read without shutter.
Rare earth metals, such as terbium, induce higher sensitivity in TL materials [21]. From literature it is known that matrix distortions due to presence of large dopant ions such as Tb3+ may form complex defect sites, which can be stabilized by Na+ and intrinsic oxygen vacancies [41]. The possible mechanism of TL emission from terbium-doped phos-phors includes few steps. It is considered that trivalent terbium ions Tb3+ may be effec-tively reduced by free electrons formed in the matrix after β- and γ irradiation. Further, the formed Tb2+ ion is efficient hole scavenger, forming excited Tb3+ ions in this process, and TL emission is considered to follow the reaction expressed by Equation (1). Tb + hole → Tb ∗ → Tb + 𝜆𝑣 (1)
The holes are supplied by traps via thermal excitation [42]. An elegant explanation for these mechanisms based on the simultaneous participation of rare earth metals ions and interstitial oxygen atoms is presented in the Abdel-Kader paper [43]. The complex nature of energy transitions between excited states and ground level of Tb3+ ions involves different transitions between D and F levels (especially 5D4→7F6, 5D4→7F5, 5D4→7F4 and
Figure 2. TL curves for samples irradiated using beta radiation (4 µs pulse duration), PPG (a), PPG_Tb01 (b), PPG_Tb05,(c) and PPG_Tb30 (d). PPG samples were read without shutter.
Rare earth metals, such as terbium, induce higher sensitivity in TL materials [21]. Fromliterature it is known that matrix distortions due to presence of large dopant ions such asTb3+ may form complex defect sites, which can be stabilized by Na+ and intrinsic oxygenvacancies [41]. The possible mechanism of TL emission from terbium-doped phosphorsincludes few steps. It is considered that trivalent terbium ions Tb3+ may be effectivelyreduced by free electrons formed in the matrix after β- and γ irradiation. Further, theformed Tb2+ ion is efficient hole scavenger, forming excited Tb3+ ions in this process, andTL emission is considered to follow the reaction expressed by Equation (1).
Tb2+ + hole→ Tb3+∗ → Tb3 + λv (1)
The holes are supplied by traps via thermal excitation [42]. An elegant explanationfor these mechanisms based on the simultaneous participation of rare earth metals ionsand interstitial oxygen atoms is presented in the Abdel-Kader paper [43]. The complex

Appl. Sci. 2021, 11, 7221 7 of 21
nature of energy transitions between excited states and ground level of Tb3+ ions involvesdifferent transitions between D and F levels (especially 5D4→7F6, 5D4→7F5, 5D4→7F4 and5D4→7F3), which are then responsible for enhanced photon emission from terbium-dopedmaterials [44].
As one can see in Figure 3, dependencies of signal integral vs. dose cannot be con-sidered as linear and are clearly saturation-type curves, which resemble functions ofexponential type. The integrated luminescence intensity (Nint) may be approximated by asimple summation, according to Equation (2) [39]:
Nint =∫ T
T0
Np(T)dT =T
∑T0
Np(T) (2)
where Np is the photon count intensity at point temperature T. For the approximation of theexperimental data presented in Figure 2, the function expressed by Equation (3) can be used:
Nint = Ninf
(1− e−kD
)(3)
where Ninf is the pre-exponential factor dependent on the material properties and related tothe saturation intensity, k is the thermoluminescence yield per unit dose factor or materialsensitivity coefficient, in kGy-1, and D is the radiation dose in kGy. It is obvious thatincreasing the Tb3+ ions concentration has the most pronounced influence on the light-emission efficiency, what is also confirmed by the data provided in the further parts of thiswork. The sensitizing effect of rare earth elements was already discussed in previous papers,where other glass samples containing such types of dopants were investigated [27,45–47].It seems that terbium is one of the most efficient sensitizing agent among rare earth metals.However, for the terbium ions the strongest enhancement of the light-emission efficiency isobserved for the low dopant concentration range to upmost few percent and decrease abovethis value. Above relatively low concentrations of ca. 0.3%, one observed the quenchingeffects due to simultaneous effects of multipolar transitions or these related to the so calledinner effect filter, which were observed already for terbium concentration starting from6 (mole) % [46,47]. The data obtained and presented in this study correlate well with thoseprovided in literature, which is demonstrated by the results provided in Figure 3, such asthe significant increase of TL intensity when shifting from PPG_Tb01 sample to PPG_Tb05and lower efficiency for further transition to PPG_Tb30 glass.
Appl. Sci. 2021, 11, x FOR PEER REVIEW 7 of 21
5D4→7F3), which are then responsible for enhanced photon emission from terbium-doped materials [44].
As one can see in Figure 3, dependencies of signal integral vs. dose cannot be consid-ered as linear and are clearly saturation-type curves, which resemble functions of expo-nential type. The integrated luminescence intensity (Nint) may be approximated by a sim-ple summation, according to Equation (2) [39]:
Nint = N (T)dT = N (T) (2)
where Np is the photon count intensity at point temperature T. For the approximation of the experimental data presented in Figure 2, the function expressed by Equation (3) can be used: Nint = Ninf 1 − e (3)
where Ninf is the pre-exponential factor dependent on the material properties and related to the saturation intensity, k is the thermoluminescence yield per unit dose factor or ma-terial sensitivity coefficient, in kGy-1, and D is the radiation dose in kGy. It is obvious that increasing the Tb3+ ions concentration has the most pronounced influence on the light-emission efficiency, what is also confirmed by the data provided in the further parts of this work. The sensitizing effect of rare earth elements was already discussed in previous papers, where other glass samples containing such types of dopants were investigated [27,45–47]. It seems that terbium is one of the most efficient sensitizing agent among rare earth metals. However, for the terbium ions the strongest enhancement of the light-emis-sion efficiency is observed for the low dopant concentration range to upmost few percent and decrease above this value. Above relatively low concentrations of ca. 0.3%, one ob-served the quenching effects due to simultaneous effects of multipolar transitions or these related to the so called inner effect filter, which were observed already for terbium con-centration starting from 6 (mole) % [46,47]. The data obtained and presented in this study correlate well with those provided in literature, which is demonstrated by the results pro-vided in Figure 3, such as the significant increase of TL intensity when shifting from PPG_Tb01 sample to PPG_Tb05 and lower efficiency for further transition to PPG_Tb30 glass.
Figure 3. Dependencies of TL signal integral vs. dose absorbed for glass dosimeter irradiated with beta radiation (4 μs); for PPG sample, TL glow curves were recorded without shutter.
Figure 3. Dependencies of TL signal integral vs. dose absorbed for glass dosimeter irradiated withbeta radiation (4 µs); for PPG sample, TL glow curves were recorded without shutter.

Appl. Sci. 2021, 11, 7221 8 of 21
Considering samples containing terbium, one can observe that with increasing amountof Tb2O3 in the glass, the yield of luminescence increases. As can be found from dataincluded in Table 2, despite the shutter, samples of terbium-doped glass possess similar oreven higher coefficients than undoped glass that was read without shutter, with observabletendency to increase with the terbium concentration (except of k coefficient value for thesample PPG_Tb01).
Table 2. Parameters of fitted linear functions for glass samples (dose 1–30 kGy).
PPG PPG_Tb01 PPG_Tb05 PPG_Tb30
Ninf (5.4 ± 0.3) × 106 (2.3 ± 1.0) × 106 (4.0 ± 0.5) × 106 (5.3 ± 0.4) × 106
k (6.7 ± 0.8) × 10−2 (7.7 ± 0.6) × 10−2 (5.7 ± 1.3) × 10−2 (12.0 ± 2.0) × 10−2
Adj. R-Square 0.992 0.997 0.980 0.971
3.2.2. Electron Accelerator, Pulse Duration 17 ns
For verification of the behavior of the investigated glasses for the lower dose ranges,samples were irradiated with radiation doses up to 1000 Gy. During this experiment,samples were irradiated by electron accelerator with pulse duration of 17 ns.
As shown in Figure 4a, the raw phosphate glass possesses maximum of TL signal at125 ◦C. For radiation dose of ca. 2 kGy, one can easily find additional maximum, whichappears at ca. 210 ◦C; however, after closer analysis this signal is also observable for thelower doses. For the glass samples containing terbium (Figure 4b–d), one can observe wideTL signals from 100 to 250 ◦C, whose shapes suggest more complex structure. Probablynext to the main signals at 125 ◦C (signal from glass matrix) and at 200 ◦C, other TL peaksalso contribute to the overall emission from terbium-doped glass. This will be furtherdiscussed in Section 3.3.
Appl. Sci. 2021, 11, x FOR PEER REVIEW 8 of 21
Considering samples containing terbium, one can observe that with increasing amount of Tb2O3 in the glass, the yield of luminescence increases. As can be found from data included in Table 2, despite the shutter, samples of terbium-doped glass possess sim-ilar or even higher coefficients than undoped glass that was read without shutter, with observable tendency to increase with the terbium concentration (except of k coefficient value for the sample PPG_Tb01).
Table 2. Parameters of fitted linear functions for glass samples (dose 1–30 kGy).
PPG PPG_Tb01 PPG_Tb05 PPG_Tb30 Ninf (5.4 ± 0.3) × 106 (2.3 ± 1.0) × 106 (4.0 ± 0.5) × 106 (5.3 ± 0.4) × 106 k (6.7 ± 0.8) × 10−2 (7.7 ± 0.6) × 10−2 (5.7 ± 1.3) × 10−2 (12.0 ± 2.0) × 10−2
Adj. R-Square 0.992 0.997 0.980 0.971
3.2.2. Electron Accelerator, Pulse Duration 17 ns For verification of the behavior of the investigated glasses for the lower dose ranges,
samples were irradiated with radiation doses up to 1000 Gy. During this experiment, sam-ples were irradiated by electron accelerator with pulse duration of 17 ns.
As shown in Figure 4a, the raw phosphate glass possesses maximum of TL signal at 125 °C. For radiation dose of ca. 2 kGy, one can easily find additional maximum, which appears at ca. 210 °C; however, after closer analysis this signal is also observable for the lower doses. For the glass samples containing terbium (Figure 4b–d), one can observe wide TL signals from 100 to 250 °C, whose shapes suggest more complex structure. Prob-ably next to the main signals at 125 °C (signal from glass matrix) and at 200 °C, other TL peaks also contribute to the overall emission from terbium-doped glass. This will be fur-ther discussed in Section 3.3.
Figure 4. TL curves for samples irradiated using beta radiation (17 ns pulse duration), PPG (a), PPG_Tb01 (b), PPG_Tb05 (c), and PPG_Tb30 (d). PPG samples were read without shutter.
As one can see in Figure 5, all samples exhibit linear dependencies of TL signal in-tensity vs. dose in the dose range from 50 to 2000 Gy. Analyzing data included in Table 3, one can see that yield of TL emission is directly linked with amount of dopant in the glass, analogical as in case of higher dose ranges, for which the results were presented in Section 3.2.1. With increasing concentration of rare earth oxide, the total TL emission increases significantly.
Figure 4. TL curves for samples irradiated using beta radiation (17 ns pulse duration), PPG (a),PPG_Tb01 (b), PPG_Tb05 (c), and PPG_Tb30 (d). PPG samples were read without shutter.
As one can see in Figure 5, all samples exhibit linear dependencies of TL signalintensity vs. dose in the dose range from 50 to 2000 Gy. Analyzing data included in Table 3,one can see that yield of TL emission is directly linked with amount of dopant in theglass, analogical as in case of higher dose ranges, for which the results were presented

Appl. Sci. 2021, 11, 7221 9 of 21
in Section 3.2.1. With increasing concentration of rare earth oxide, the total TL emissionincreases significantly.
Appl. Sci. 2021, 11, x FOR PEER REVIEW 9 of 21
Figure 5. Dependencies of TL signal integral vs. dose absorbed for glass dosimeter irradiated with beta radiation (17ns); for PPG sample, TL glow curves were recorded without shutter.
Table 3. Parameters of fitted linear functions for glass samples (radiation dose 50–2000 Gy).
PPG PPG_Tb01 PPG_Tb05 PPG_Tb30 Slope (1.6 ± 0.1) × 102 (2.0 ± 0.1) × 102 2.3 ± 0.1) × 102 (3.1 ± 0.1) × 102
Pearson’s r 0.998 0.999 0.999 0.995
3.2.3. Radiation Chamber, Gamma Irradiation (1.5–7.5 kGy) Gamma irradiation was performed using Co-60 source (Ob-Servo-D panoramic irra-
diator). The samples were placed on sources housing surrounding Co-60 radiation sources.
As one can see in Figure 6a, raw phosphate glass possesses maximum of TL signal at 140 °C, that is, at temperature of ca. 15 °C higher in comparison with electron beam irra-diated samples. Additional peaks appear at 210 °C and 280 °C. For samples containing terbium (Figure 6b–d), one can observe a wide TL complex signal from 100 to 300 °C. For samples containing 3% of terbium oxide, additional maximum at 300 °C is observed for doses above 5 kGy. Comparing the data provided in Figures 4 and 6, one can easily find that native PPG glasses exhibit weak or moderate light-emission ability, whereas it is not observed for the terbium-doped samples. Taking this observation under analysis, it is pos-sible to explain such behavior by two effects. On one hand, the PPG glasses were meas-ured without light reducing shutter, due to significantly lower light-emission efficiency as compared to Tb3+ doped glasses, so even weaker signals may be easily observed, espe-cially for higher radiation doses. On the other hand, as a reasonable explanation for the lack of light emission in case of terbium-doped glasses, it is possible that incorporation of the Tb3+ ions into glass matrix modifies the trap structure in such a way that deep traps existing in native PPG glass are converted into traps, which are emptied almost com-pletely at lower temperatures.
Figure 5. Dependencies of TL signal integral vs. dose absorbed for glass dosimeter irradiated withbeta radiation (17ns); for PPG sample, TL glow curves were recorded without shutter.
Table 3. Parameters of fitted linear functions for glass samples (radiation dose 50–2000 Gy).
PPG PPG_Tb01 PPG_Tb05 PPG_Tb30
Slope (1.6 ± 0.1) × 102 (2.0 ± 0.1) × 102 2.3 ± 0.1) × 102 (3.1 ± 0.1) × 102
Pearson’s r 0.998 0.999 0.999 0.995
3.2.3. Radiation Chamber, Gamma Irradiation (1.5–7.5 kGy)
Gamma irradiation was performed using Co-60 source (Ob-Servo-D panoramic irradia-tor). The samples were placed on sources housing surrounding Co-60 radiation sources.
As one can see in Figure 6a, raw phosphate glass possesses maximum of TL signalat 140 ◦C, that is, at temperature of ca. 15 ◦C higher in comparison with electron beamirradiated samples. Additional peaks appear at 210 ◦C and 280 ◦C. For samples containingterbium (Figure 6b–d), one can observe a wide TL complex signal from 100 to 300 ◦C.For samples containing 3% of terbium oxide, additional maximum at 300 ◦C is observedfor doses above 5 kGy. Comparing the data provided in Figures 4 and 6, one can easilyfind that native PPG glasses exhibit weak or moderate light-emission ability, whereas it isnot observed for the terbium-doped samples. Taking this observation under analysis, itis possible to explain such behavior by two effects. On one hand, the PPG glasses weremeasured without light reducing shutter, due to significantly lower light-emission efficiencyas compared to Tb3+ doped glasses, so even weaker signals may be easily observed,especially for higher radiation doses. On the other hand, as a reasonable explanation forthe lack of light emission in case of terbium-doped glasses, it is possible that incorporationof the Tb3+ ions into glass matrix modifies the trap structure in such a way that deep trapsexisting in native PPG glass are converted into traps, which are emptied almost completelyat lower temperatures.

Appl. Sci. 2021, 11, 7221 10 of 21Appl. Sci. 2021, 11, x FOR PEER REVIEW 10 of 21
Figure 6. TL curves for samples irradiated using gamma radiation (irradiation chamber), PPG (a), PPG_Tb01 (b), PPG_Tb05 (c), and PPG_Tb30 (d); PPG samples read without shutter.
As can be seen in Figure 7, all samples doped with terbium oxide exhibit close to linear dependencies of TL signal intensity vs. dose in the dose range from 1 to 8 kGy. One can see in Table 4 that also for gamma irradiation, yield of TL emission is linked with amount of dopant in glass. For all samples, goodness of function fitting is near 1, except for samples of PPG (undoped) glass—this is probably caused by incorrect position of these kinds of detectors during irradiation.
Figure 7. Dependencies of TL signal integral vs. dose absorbed for samples irradiated using gamma radiation (irradiation chamber); for PPG sample, TL glow curves were recorded without shutter.
Figure 6. TL curves for samples irradiated using gamma radiation (irradiation chamber), PPG (a), PPG_Tb01 (b), PPG_Tb05(c), and PPG_Tb30 (d); PPG samples read without shutter.
As can be seen in Figure 7, all samples doped with terbium oxide exhibit close to lineardependencies of TL signal intensity vs. dose in the dose range from 1 to 8 kGy. One can seein Table 4 that also for gamma irradiation, yield of TL emission is linked with amount ofdopant in glass. For all samples, goodness of function fitting is near 1, except for samplesof PPG (undoped) glass—this is probably caused by incorrect position of these kinds ofdetectors during irradiation.
Appl. Sci. 2021, 11, x FOR PEER REVIEW 10 of 21
Figure 6. TL curves for samples irradiated using gamma radiation (irradiation chamber), PPG (a), PPG_Tb01 (b), PPG_Tb05 (c), and PPG_Tb30 (d); PPG samples read without shutter.
As can be seen in Figure 7, all samples doped with terbium oxide exhibit close to linear dependencies of TL signal intensity vs. dose in the dose range from 1 to 8 kGy. One can see in Table 4 that also for gamma irradiation, yield of TL emission is linked with amount of dopant in glass. For all samples, goodness of function fitting is near 1, except for samples of PPG (undoped) glass—this is probably caused by incorrect position of these kinds of detectors during irradiation.
Figure 7. Dependencies of TL signal integral vs. dose absorbed for samples irradiated using gamma radiation (irradiation chamber); for PPG sample, TL glow curves were recorded without shutter. Figure 7. Dependencies of TL signal integral vs. dose absorbed for samples irradiated using gammaradiation (irradiation chamber); for PPG sample, TL glow curves were recorded without shutter.

Appl. Sci. 2021, 11, 7221 11 of 21
Table 4. Parameters of fitted linear functions for glass samples (dose 50–2000 Gy).
PPG PPG_Tb01 PPG_Tb05 PPG_Tb30
Slope (2.9 ± 0.4) × 105 (1.0 ± 0.3) × 105 (1.9 ± 0.7) × 105 (2.1 ± 0.1) × 105
Pearson’s r 0.968 0.998 0.998 0.99
3.3. Analysis and Structure of TL Emission from Phosphate Glasses
As one can find, from the previous data, changing concentration of terbium oxidein phosphate glasses leading to increase of their thermoluminescence yield and also in-fluencing the shapes of TL curves. Because of this, it was necessary to investigate TLmechanism in synthesized glasses. To follow and analyze the impact of terbium dopantand its concentration on TL signal and traps structure, one can apply verified approachbased on the mixed experimental methods and computerized deconvolution of the TLcurves. The substantial question was the selection of the proper traps distribution model,which should be selected for glow curves deconvolution procedure. Thus, at first oneperformed Tmax–Tstop measurements for both pure PPG and terbium-doped glass samplesirradiated with 10 kGy radiation dose, within the temperature ranges of 50–360 ◦C andchanging temperature in 2–6 ◦C steps. The results obtained from these experiments arepresented in Figure 8. From the presented data, one can easily determine the number andnature of traps present in the investigated glasses. For pure PPG glass sample (Figure 8a),the dependence of position of the first maximum present in a glow curve (Tmax) obtainedduring reading the sample after irradiation and preheating to Tstop temperature vs. Tstoprevealed the existence of five trapping centers. The first peak represented by a flat linein region of 50–90 ◦C was characterized as a single first order kinetics (FOK) signal, nextthree signals were identified as defects with continuous distribution of energy (straightincreasing lines in regions 90–140, 140–190, and 190–310 ◦C), whereas the last peak visibleas a flat region followed by an increasing tail gave presumption for existence of a singlegeneral order kinetics (GOK) peak in the region of 280–360 ◦C [48]. Similar analysis of theterbium-doped glass delivered evidence for existence of one FOK peak in the region of50–90 ◦C and five peaks with a continuous trap energy distribution in regions of 90–110,110–130, 130–160, 160–190, and 190–320 ◦C.
Appl. Sci. 2021, 11, x FOR PEER REVIEW 11 of 21
Table 4. Parameters of fitted linear functions for glass samples (dose 50–2000 Gy).
PPG PPG_Tb01 PPG_Tb05 PPG_Tb30 Slope (2.9 ± 0.4) × 105 (1.0 ± 0.3) × 105 (1.9 ± 0.7) × 105 (2.1 ± 0.1) × 105
Pearson’s r 0.968 0.998 0.998 0.99
3.3. Analysis and Structure of TL Emission from Phosphate Glasses As one can find, from the previous data, changing concentration of terbium oxide in
phosphate glasses leading to increase of their thermoluminescence yield and also influ-encing the shapes of TL curves. Because of this, it was necessary to investigate TL mecha-nism in synthesized glasses. To follow and analyze the impact of terbium dopant and its concentration on TL signal and traps structure, one can apply verified approach based on the mixed experimental methods and computerized deconvolution of the TL curves. The substantial question was the selection of the proper traps distribution model, which should be selected for glow curves deconvolution procedure. Thus, at first one performed Tmax–Tstop measurements for both pure PPG and terbium-doped glass samples irradiated with 10 kGy radiation dose, within the temperature ranges of 50–360 °C and changing temperature in 2–6 °C steps. The results obtained from these experiments are presented in Figure 8. From the presented data, one can easily determine the number and nature of traps present in the investigated glasses. For pure PPG glass sample (Figure 8a), the de-pendence of position of the first maximum present in a glow curve (Tmax) obtained during reading the sample after irradiation and preheating to Tstop temperature vs. Tstop revealed the existence of five trapping centers. The first peak represented by a flat line in region of 50–90 °C was characterized as a single first order kinetics (FOK) signal, next three signals were identified as defects with continuous distribution of energy (straight increasing lines in regions 90–140, 140–190, and 190–310 °C), whereas the last peak visible as a flat region followed by an increasing tail gave presumption for existence of a single general order kinetics (GOK) peak in the region of 280–360 °C [48]. Similar analysis of the terbium-doped glass delivered evidence for existence of one FOK peak in the region of 50–90 °C and five peaks with a continuous trap energy distribution in regions of 90–110, 110–130, 130–160, 160–190, and 190–320 °C.
Figure 8. Tmax–Tstop analysis for pure PPG (a) and terbium-doped (b) glass samples; irradiation dose 10 kGy per point, heating rate 2 °C/s.
Direct determination of the exact positions of signals contributing to a complex glow curve with strongly overlapping peaks is always a difficult task, so next to the presented above Tmax–Tstop measurements, one also performed variable heating rate method to facil-itate the resolving of the glow curves structure. The method was applied both for pure phosphate glass (PPG) and for terbium-doped samples within the heating rates between 0.5–10 °C on samples irradiated with 10 kGy radiation dose. Results of these measure-ments are presented in Figure 9. In case of terbium-doped samples, shutter-reducing light
Figure 8. Tmax–Tstop analysis for pure PPG (a) and terbium-doped (b) glass samples; irradiation dose 10 kGy per point,heating rate 2 ◦C/s.
Direct determination of the exact positions of signals contributing to a complex glowcurve with strongly overlapping peaks is always a difficult task, so next to the presented

Appl. Sci. 2021, 11, 7221 12 of 21
above Tmax–Tstop measurements, one also performed variable heating rate method tofacilitate the resolving of the glow curves structure. The method was applied both for purephosphate glass (PPG) and for terbium-doped samples within the heating rates between0.5–10 ◦C on samples irradiated with 10 kGy radiation dose. Results of these measurementsare presented in Figure 9. In case of terbium-doped samples, shutter-reducing light intensityhad to be applied. From the VHR measurements, the shifting of TL emission maxima isevident. For PPG sample (cf. Figure 9a), the most prominent peak maximum moves from98 to 145 ◦C, upon changing heating rate from 0.5 to 10 ◦C/s. Unfortunately, due to thestrong overlapping of peaks, this is the only signal whose position may be unambiguouslydetermined. Nevertheless, the overall shapes of the TL emission curves remain similar,regardless of heating rate applied.
Appl. Sci. 2021, 11, x FOR PEER REVIEW 12 of 21
intensity had to be applied. From the VHR measurements, the shifting of TL emission maxima is evident. For PPG sample (cf. Figure 9a), the most prominent peak maximum moves from 98 to 145 °C, upon changing heating rate from 0.5 to 10 °C/s. Unfortunately, due to the strong overlapping of peaks, this is the only signal whose position may be un-ambiguously determined. Nevertheless, the overall shapes of the TL emission curves re-main similar, regardless of heating rate applied.
Figure 9. TL glow curves of PPG (a) and terbium-doped phosphate glass (b), PPG_Tb05) measured at various heating rates (irradiation dose ca. 10 kGy, terbium-doped glass measured using shutter reducing light intensity ca. 100×).
For terbium-doped glass (0.5% Tb2O3, PPG_Tb05, cf. Figure 9b) and the lowest heat-ing rate of 0.5 °C/s, one can easily determine the low temperature peak position at 101 °C/s and roughly the position of the other, higher temperature peak at ca. 175 °C. Moreover, for terbium-doped glass the much stronger dependence of the overall TL emission curves vs. heating rate can be easily found. Increasing the heating rate, the intensity of the first peak decreases progressively; however, it can be still easily found even in case of the high-est heating rate of 10 °C/s on the lower temperature shoulder of the most prominent TL emission peak, whose maximum is located at ca. 200 °C/s. Very similar results based on the VHR method were observed also for the 0.1 and 3.0% Tb2O3-doped phosphate glasses (PPG_Tb01 and PPG_Tb30).
Due to the significant complexity of the presented TL emissions, it is very difficult to completely analyze the structure of the glow curves and contribution of the particular TL peaks taking into account only results obtained from Tmax–Tstop and VHR measurements. Nevertheless, they can be a starting point for the deconvolution analysis using specialized software with implemented appropriate TL models. Based on the data presented above, one can propose models suitable for resolving observed TL glow curves. For the PPG glass, the model involves mixed contribution of FOK peak, three continuous energy dis-tribution peaks, and GOK signal, according to Equation (4): I (T) = IPeak (T) + IPeak
Cont (T) + IPeak Cont (T) + IPeak
Cont (T) + IPeak5 GOK (T) (4)
where ITL and IPeak (1–5) are total and fractional TL intensities due to the particular peaks contributions. Such a combined approach to TL glow curve analysis has already been ap-plied and reported in literature [49]. The glow peaks following first (FOK) and general order kinetics (GOK) were fitted using Equations (5) and (6) [48,50]: I (T) = I exp EkT − EkT exp − EkT exp EkT − EkT dT (5)
I (T) = I exp EkT − EkT 1 + b − 1b EkT exp EkT − EkT dT (6)
Figure 9. TL glow curves of PPG (a) and terbium-doped phosphate glass (b), PPG_Tb05) measured at various heating rates(irradiation dose ca. 10 kGy, terbium-doped glass measured using shutter reducing light intensity ca. 100×).
For terbium-doped glass (0.5% Tb2O3, PPG_Tb05, cf. Figure 9b) and the lowest heatingrate of 0.5 ◦C/s, one can easily determine the low temperature peak position at 101 ◦C/sand roughly the position of the other, higher temperature peak at ca. 175 ◦C. Moreover, forterbium-doped glass the much stronger dependence of the overall TL emission curves vs.heating rate can be easily found. Increasing the heating rate, the intensity of the first peakdecreases progressively; however, it can be still easily found even in case of the highestheating rate of 10 ◦C/s on the lower temperature shoulder of the most prominent TLemission peak, whose maximum is located at ca. 200 ◦C/s. Very similar results based onthe VHR method were observed also for the 0.1 and 3.0% Tb2O3-doped phosphate glasses(PPG_Tb01 and PPG_Tb30).
Due to the significant complexity of the presented TL emissions, it is very difficult tocompletely analyze the structure of the glow curves and contribution of the particular TLpeaks taking into account only results obtained from Tmax–Tstop and VHR measurements.Nevertheless, they can be a starting point for the deconvolution analysis using specializedsoftware with implemented appropriate TL models. Based on the data presented above,one can propose models suitable for resolving observed TL glow curves. For the PPG glass,the model involves mixed contribution of FOK peak, three continuous energy distributionpeaks, and GOK signal, according to Equation (4):
ITL(T) = IFOKPeak1(T) + ICont
Peak2(T) + IContPeak3(T) + ICont
Peak4(T) + IGOKPeak5(T) (4)
where ITL and IPeak (1–5) are total and fractional TL intensities due to the particular peakscontributions. Such a combined approach to TL glow curve analysis has already been

Appl. Sci. 2021, 11, 7221 13 of 21
applied and reported in literature [49]. The glow peaks following first (FOK) and generalorder kinetics (GOK) were fitted using Equations (5) and (6) [48,50]:
IFOK(T) = Im exp(
EkTm
− EkT
)exp
[− E
kT2m
∫ T
Tmexp
(E
kTm− E
kT′
)dT′]
(5)
IGOK(T) = Im exp(
EkTm
− EkT
)[1 +
(b− 1
b
)E
kTm
∫ T
Tmexp
(E
kTm− E
kT′
)dT′]− b
b−1(6)
where I and Im are TL intensities for a given temperature (T, in K) or at peak maximum(Tm) and temperature linearly increases with time (t) from T0 to T, T(t) = T0 + βt, β (◦C/s)is the linear heating rate; E (eV) is the trap activation energy; k (eV·K−1) is the Boltzmannconstant; and b is the kinetic order parameter. In case of continuous energy distribution oftraps present in material, usually exponential or gaussian functions are used, which can bedescribed by Equations (7) and (8) [49–51]:
nExp(E) =n0
σexp
(−E− E0
σ
)(7)
nGaus(E) =n0√2πσ2
exp
[− (E− E0)
2
2σ2
](8)
where n and no are number of trapping centres of a given energy (E) and total density oftrapped charges (cm−3), E0 is either the shallowest energy in the distribution (exponentialmodel) or the most populated trapping level (gaussian distribution), and σ is the parameterrelated to the width of the distribution. Based on these distributions, two models are gener-ally in use, describing dependencies of TL emission intensity vs. energy and temperatureaccording to Equations (9) and (10):
IExp(T) =∫ +∞
Eos
n0
σexp
(−E− E0
σ
)exp
(− E
kT
)exp
[− sβ
∫ T
Toexp
(− E
kT′
)dT′]
dE (9)
IGaus(T) =∫ +∞
−∞s
n0√2πσ2
exp
(− (E− E0)
2
2σ2
)exp
(− E
kT
)exp
[− sβ
∫ T
To
exp(− E
kT′
)dT′]
dE (10)
where s (s−1) is the frequency coefficient related to the type of defect and other symbolsare as described above. The models described according to Equations (5)–(10) are imple-mented in a dedicated glow curve deconvolution software and are described in severalpapers [49,50]. The software was used for analysis of glow curves obtained during mea-surement of PPG sample, and graphical representation of the obtained results are presentedin Figure 10.
The deconvolution procedure was performed in order to recognize the structure ofthe TL glow curve, structure, and types of defects present in the material and to estimatethe energy levels of the trapping centers related to the particular TL emissions from thematerial. Verification of the proper localization of particular peaks was based on theconsecutive analysis of the experimental data and results obtained from deconvolutionanalysis using the GCA (Glow Curve Analysis) software [50]. The selection betweenexponential and gaussian distributions for continuous type defects was made taking as acriterion the possibly lowest value of FOM (Figure of Merit) parameter, which indicatesthe difference between experimental data and computer-simulated glow curves based onthe parameters obtained during deconvolution procedure. The commonly accepted valuesof FOM are usually below 5%. The results obtained during deconvolution analysis of glowcurves obtained from VHR measurements of PPG glass are presented in Table 5.

Appl. Sci. 2021, 11, 7221 14 of 21
Appl. Sci. 2021, 11, x FOR PEER REVIEW 13 of 21
where I and Im are TL intensities for a given temperature (T, in K) or at peak maximum (Tm) and temperature linearly increases with time (t) from T0 to T, T(t) = T0 + βt, β (°C/s) is the linear heating rate; E (eV) is the trap activation energy; k (eV·K−1) is the Boltzmann constant; and b is the kinetic order parameter. In case of continuous energy distribution of traps present in material, usually exponential or gaussian functions are used, which can be described by Equations (7) and (8) [49–51]: n (E) = nσ exp − E − Eσ (7)
nGaus (E) = n√2πσ exp − (E − E )2σ (8)
where n and no are number of trapping centres of a given energy (E) and total density of trapped charges (cm−3), Eo is either the shallowest energy in the distribution (exponential model) or the most populated trapping level (gaussian distribution), and σ is the param-eter related to the width of the distribution. Based on these distributions, two models are generally in use, describing dependencies of TL emission intensity vs. energy and tem-perature according to Equations (9) and (10): I (T) = s nσ exp − E − Eσ exp − EkT exp − sβ exp − EkT dT dE (9)IGaus (T)= s n√2πσ exp − (E − E )2σ exp − EkT exp − sβ exp − EkT dT dE (10)
where s (s−1) is the frequency coefficient related to the type of defect and other symbols are as described above. The models described according to Equations (5)–(10) are imple-mented in a dedicated glow curve deconvolution software and are described in several papers [49,50]. The software was used for analysis of glow curves obtained during meas-urement of PPG sample, and graphical representation of the obtained results are pre-sented in Figure 10.
Figure 10. Results of deconvolution procedure of TL signal from PPG samples irradiated with 10 kGy radiation dose (electron accelerator, pulse duration 4 μs, heating rate β = 0.5 °C/s).
The deconvolution procedure was performed in order to recognize the structure of the TL glow curve, structure, and types of defects present in the material and to estimate
Figure 10. Results of deconvolution procedure of TL signal from PPG samples irradiated with 10kGy radiation dose (electron accelerator, pulse duration 4 µs, heating rate β = 0.5 ◦C/s).
Table 5. Fitting results and traps parameters obtained for PPG glass samples irradiated with radiation dose of ca. 10 kGyand heating rates (β) of 0.5, 1.0, and 2.0 ◦C/s.
Peak Type β (◦C/s) E (eV) Tm (◦C) s (s−1) σ (eV) b FOM
Peak 1 (Disc:FOK)
0.5
0.79 54.9 5.05 × 10¹⁰ – –
2.17%Peak 2 (Cont:Exp) 2.03 99.7 2.20 × 1026 0.000 –Peak 3 (Cont:Exp) 0.98 103.7 5.14 × 10¹¹ 0.005 –
Peak 4 (Cont:Gaus) 0.67 133.1 4.99 × 10⁶ 0.075 –Peak 5 (Disc:GOK) 0.83 235.9 3.12 × 10⁶ – 2.00
Peak 1 (Disc:FOK)
1
0.79 60.9 5.93 × 10¹⁰ – –
4.48%Peak 2 (Cont:Exp) 2.03 102.7 2.62 × 1026 0.000 –Peak 3 (Cont:Exp) 0.98 112.6 4.87 × 10¹¹ 0.005 –
Peak 4 (Cont:Gaus) 0.64 143.4 2.50 × 10⁶ 0.073 –Peak 5 (Disc:GOK) 0.8 260.8 1.12 × 10⁶ – 2.00
Peak 1 (Disc:FOK)
2
0.79 70.8 5.06 × 10¹⁰ – –
4.99%Peak 2 (Cont:Exp) 2.03 107.6 2.25 × 1026 0.004 –Peak 3 (Cont:Exp) 0.98 123.5 4.08 × 10¹¹ 0.000 –
Peak 4 (Cont:Gaus) 0.58 162 3.41 × 10⁵ 0.054 –Peak 5 (Disc:GOK) 0.86 270.7 6.73 × 10⁶ – 2.00
In Table 5, one presented only data obtained during deconvolution of TL emissioncurves for three lowest heating rates of 0.5, 1.0, and 2.0 ◦C/s. The general conclusion fromthese results is that all sets of data correlate quite well each other for particular peaks. ForPeak 2, one can find relatively high value of the frequency factor; however, this couldbe due to the exponential expression used to obtain this value and based on energy ofthe trapping center, so even small variation in E value may lead to large variation anduncertainty in calculated value of s. It was impossible to correlate all the data obtainedfrom deconvolution procedure with the results from VHR measurements, especially for thehigher heating rates above 2 ◦C/s. It was probably due to a limited thermal conductivityof the samples (ca. 40 mg in weight, 5 mm in diameter, and ca. 1 mm thickness) andin consequence delayed response of the TL emission vs. temperature measured duringsamples reading. Nevertheless, the careful analysis of the available data allowed fordetermination of the positions of the peaks in TL emission curves for which temperature
Appl. Sci. 2021, 11, 7221 15 of 21
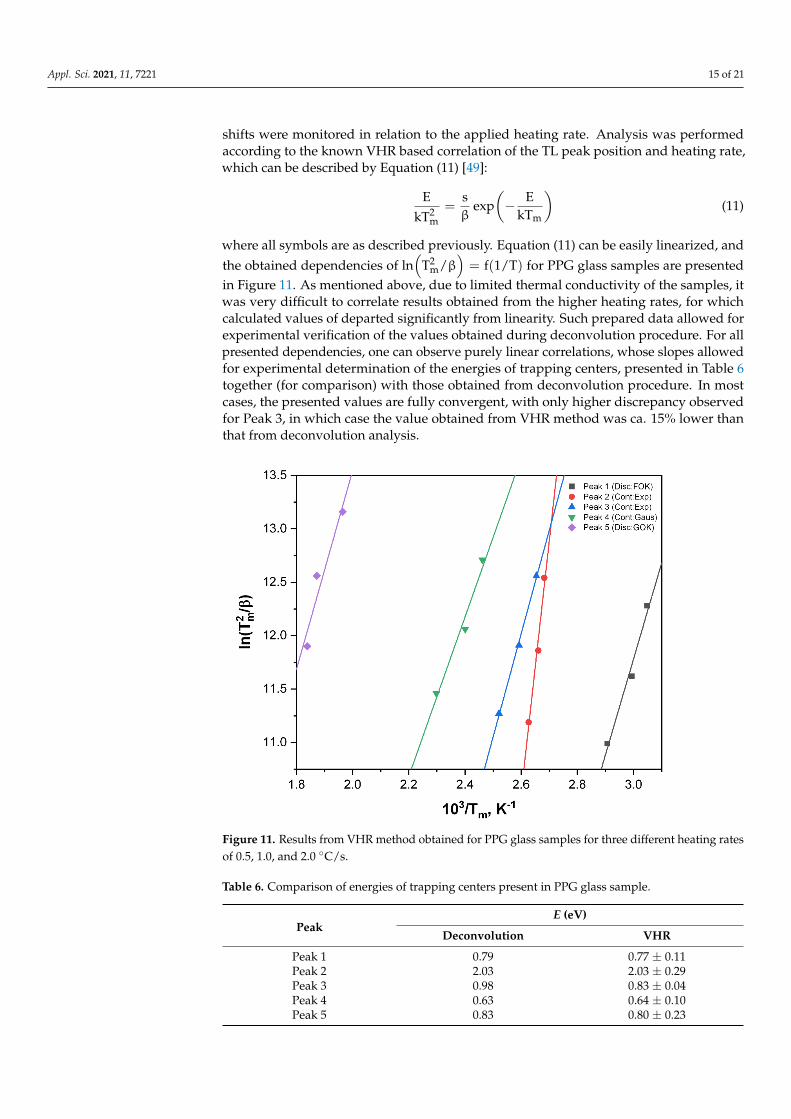
shifts were monitored in relation to the applied heating rate. Analysis was performedaccording to the known VHR based correlation of the TL peak position and heating rate,which can be described by Equation (11) [49]:
EkT2
m=
sβ
exp(− E
kTm
)(11)
where all symbols are as described previously. Equation (11) can be easily linearized, andthe obtained dependencies of ln
(T2
m/β)= f(1/T) for PPG glass samples are presented
in Figure 11. As mentioned above, due to limited thermal conductivity of the samples, itwas very difficult to correlate results obtained from the higher heating rates, for whichcalculated values of departed significantly from linearity. Such prepared data allowed forexperimental verification of the values obtained during deconvolution procedure. For allpresented dependencies, one can observe purely linear correlations, whose slopes allowedfor experimental determination of the energies of trapping centers, presented in Table 6together (for comparison) with those obtained from deconvolution procedure. In mostcases, the presented values are fully convergent, with only higher discrepancy observedfor Peak 3, in which case the value obtained from VHR method was ca. 15% lower thanthat from deconvolution analysis.
Appl. Sci. 2021, 11, x FOR PEER REVIEW 15 of 21
very difficult to correlate results obtained from the higher heating rates, for which calcu-lated values of departed significantly from linearity. Such prepared data allowed for ex-perimental verification of the values obtained during deconvolution procedure. For all presented dependencies, one can observe purely linear correlations, whose slopes allowed for experimental determination of the energies of trapping centers, presented in Table 6 together (for comparison) with those obtained from deconvolution procedure. In most cases, the presented values are fully convergent, with only higher discrepancy observed for Peak 3, in which case the value obtained from VHR method was ca. 15% lower than that from deconvolution analysis.
Figure 11. Results from VHR method obtained for PPG glass samples for three different heating rates of 0.5, 1.0, and 2.0 °C/s.
Table 6. Comparison of energies of trapping centers present in PPG glass sample.
Peak E (eV)
Deconvolution VHR Peak 1 0.79 0.77 ± 0.11 Peak 2 2.03 2.03 ± 0.29 Peak 3 0.98 0.83 ± 0.04 Peak 4 0.63 0.64 ± 0.10 Peak 5 0.83 0.80 ± 0.23
Taking into account the data from Tmax–Tstop and VHR experiments, it seems that structure of the TL signals in terbium-doped phosphate glasses should exhibit similar be-havior as observed in case of pure PPG glass. Because of a vast number of experiments required and calculation works to be performed, one decided that due to the complexity of the thermoluminescence signals from terbium-doped phosphate glasses, this topic de-serves wider discussion and analysis in another separate publication, for which the results presented in this work provide a great introduction.
Figure 11. Results from VHR method obtained for PPG glass samples for three different heating ratesof 0.5, 1.0, and 2.0 ◦C/s.
Table 6. Comparison of energies of trapping centers present in PPG glass sample.
PeakE (eV)
Deconvolution VHR
Peak 1 0.79 0.77 ± 0.11Peak 2 2.03 2.03 ± 0.29Peak 3 0.98 0.83 ± 0.04Peak 4 0.63 0.64 ± 0.10Peak 5 0.83 0.80 ± 0.23

Appl. Sci. 2021, 11, 7221 16 of 21
Taking into account the data from Tmax–Tstop and VHR experiments, it seems thatstructure of the TL signals in terbium-doped phosphate glasses should exhibit similarbehavior as observed in case of pure PPG glass. Because of a vast number of experimentsrequired and calculation works to be performed, one decided that due to the complexityof the thermoluminescence signals from terbium-doped phosphate glasses, this topicdeserves wider discussion and analysis in another separate publication, for which theresults presented in this work provide a great introduction.
3.4. Influence of Preheating before Readout on TL Signals and Signal Loss in Time3.4.1. Influence of Preheating before Readout on TL Signals
Because of the presence of large number of signals at lower temperatures, one canexpect that the signal may be degraded during time due to the random recombinationsand emission processes. After verification, this supposition was positively confirmed inexperiment, whose results are shown further in Section 3.4.2.
Thus, we decided to check the effect of preheating detectors prior to readout and itsinfluence on the obtained TL curves. The preheating and TL signal stability experimentswere performed on the PPG_Tb30 samples. Glass detectors were preheated directly beforereadout. Two temperatures were used for preheating, namely, 120 ◦C and 200 ◦C. Theresults of these experiments are presented in Figure 12. From the data presented in Figure 8,it is evident that preheating erases part of the TL signal, which cannot be obtained again.In case of the not preheated sample PPG_Tb30, at first sight one can observe three mainpeaks, at ca. 120 ◦C, 180 ◦C, and 260 ◦C. During preheating at 120 ◦C, two or even threelow-temperature peaks, as presented in Figure 8b, are cleaned by emptying traps presentedin the material. It is clear that removal of the lower temperature signals leads to situation,in which, after annealing, they do not contribute to the overall TL emission curve. Similarly,preheating to higher temperature of 200 ◦C consequently must lead to emptying of the fivetraps with lower energies existing in the material, as shown in Figure 8.
Appl. Sci. 2021, 11, x FOR PEER REVIEW 16 of 21
3.4. Influence of Preheating before Readout on TL Signals and Signal Loss in Time 3.4.1. Influence of Preheating before Readout on TL Signals
Because of the presence of large number of signals at lower temperatures, one can expect that the signal may be degraded during time due to the random recombinations and emission processes. After verification, this supposition was positively confirmed in experiment, whose results are shown further in Section 3.4.2.
Thus, we decided to check the effect of preheating detectors prior to readout and its influence on the obtained TL curves. The preheating and TL signal stability experiments were performed on the PPG_Tb30 samples. Glass detectors were preheated directly before readout. Two temperatures were used for preheating, namely, 120 °C and 200 °C. The results of these experiments are presented in Figure 12. From the data presented in Figure 8, it is evident that preheating erases part of the TL signal, which cannot be obtained again. In case of the not preheated sample PPG_Tb30, at first sight one can observe three main peaks, at ca. 120 °C, 180 °C, and 260 °C. During preheating at 120 °C, two or even three low-temperature peaks, as presented in Figure 8b, are cleaned by emptying traps pre-sented in the material. It is clear that removal of the lower temperature signals leads to situation, in which, after annealing, they do not contribute to the overall TL emission curve. Similarly, preheating to higher temperature of 200 °C consequently must lead to emptying of the five traps with lower energies existing in the material, as shown in Figure 8.
Figure 12. TL curves for PPG_Tb30 samples irradiated using beta radiation (4 μs pulse duration), no preheating of detector, sample preheated at 120 °C, and at 200 °C; radiation dose applied ca. 30 kGy.
The overall influence of the preheating procedure on the radiation dose and inte-grated TL intensity response is presented in Figure 13. Obviously, the TL signal integrals are more intensive for the non-preheated samples. This is a logical consequence of partial emptying of traps through preheating. Interestingly, preheating also has an influence on the dependencies of TL signal integrals vs. radiation dose absorbed. For the non-pre-
Figure 12. TL curves for PPG_Tb30 samples irradiated using beta radiation (4 µs pulse duration), nopreheating of detector, sample preheated at 120 ◦C, and at 200 ◦C; radiation dose applied ca. 30 kGy.

Appl. Sci. 2021, 11, 7221 17 of 21
The overall influence of the preheating procedure on the radiation dose and integratedTL intensity response is presented in Figure 13. Obviously, the TL signal integrals aremore intensive for the non-preheated samples. This is a logical consequence of partialemptying of traps through preheating. Interestingly, preheating also has an influence onthe dependencies of TL signal integrals vs. radiation dose absorbed. For the non-preheatedsamples, the dose response is of exponential character (saturation-type curve, triangles inFigure 13), for which signal saturation is observed above 15 kGy. For the sample preheatedat 120 ◦C, the dose response is of linear character for lower dose range (up to 15 kGy),and for higher doses exhibits it exponential character (circles in Figure 13). Finally, afterpreheating at 200 ◦C, the presented in Figure 13 data representing the dependence ofTL signal integral vs. dose absorbed remain linear even for the highest dose up to ca.30 kGy. For comparison purposes, in Figure 13 both exponential fittings as well as linearapproximations are shown for a clear presentation of the observed differences and effectsof samples preheating at different conditions. After this analysis it is clear that preheatingefficiently erases part of the lower energy traps, that, as one can observe, affects significantlythe linearity of the dependence of integrated TL signal vs. radiation dose. With increasingof the absorbed dose, the low temperature defects saturate more effectively in comparisonwith those corresponding to higher temperatures. In such case, high-energy defects play amajor role in TL signal generation.
Appl. Sci. 2021, 11, x FOR PEER REVIEW 17 of 21
heated samples, the dose response is of exponential character (saturation-type curve, tri-angles in Figure 13), for which signal saturation is observed above 15 kGy. For the sample preheated at 120 °C, the dose response is of linear character for lower dose range (up to 15 kGy), and for higher doses exhibits it exponential character (circles in Figure 13). Fi-nally, after preheating at 200 °C, the presented in Figure 13 data representing the depend-ence of TL signal integral vs. dose absorbed remain linear even for the highest dose up to ca. 30 kGy. For comparison purposes, in Figure 13 both exponential fittings as well as linear approximations are shown for a clear presentation of the observed differences and effects of samples preheating at different conditions. After this analysis it is clear that pre-heating efficiently erases part of the lower energy traps, that, as one can observe, affects significantly the linearity of the dependence of integrated TL signal vs. radiation dose. With increasing of the absorbed dose, the low temperature defects saturate more effec-tively in comparison with those corresponding to higher temperatures. In such case, high-energy defects play a major role in TL signal generation.
Figure 13. Dependencies of TL signal integral vs. dose absorbed for preheated PPG_Tb30 glass do-simeter irradiated with beta radiation (4 μs pulse duration).
3.4.2. Effect of Preheating on Signal Loss in Time Another important aspect in radiation dosimetry is the stability of signal generated
upon irradiation within the detector used. To investigate the signal loss in time, samples of PPG_Tb30 were irradiated using LINAC with dose of 3.65 kGy. After irradiation, sam-ples were stored in dark and preheated right before readout. To compare the obtained results in a quantitative way, Equation (12) was used: SL = N − N (t )N (t ) ⋅ 100% (12)
where SL is the TL signal loss in time, in %, and Nint and Nint(to) are the integrated TL signal intensities at a given time and just after irradiation.
As one can find from data presented in Figure 14, for the non-preheated samples, nearly 40% of the dosimetric signal is lost during first 24 h after irradiation. Finally, at the
Figure 13. Dependencies of TL signal integral vs. dose absorbed for preheated PPG_Tb30 glassdosimeter irradiated with beta radiation (4 µs pulse duration).
3.4.2. Effect of Preheating on Signal Loss in Time
Another important aspect in radiation dosimetry is the stability of signal generatedupon irradiation within the detector used. To investigate the signal loss in time, samples ofPPG_Tb30 were irradiated using LINAC with dose of 3.65 kGy. After irradiation, samples

Appl. Sci. 2021, 11, 7221 18 of 21
were stored in dark and preheated right before readout. To compare the obtained results ina quantitative way, Equation (12) was used:
SL =Nint −Nint(t0)
Nint(t0)·100% (12)
where SL is the TL signal loss in time, in %, and Nint and Nint(to) are the integrated TLsignal intensities at a given time and just after irradiation.
As one can find from data presented in Figure 14, for the non-preheated samples,nearly 40% of the dosimetric signal is lost during first 24 h after irradiation. Finally, atthe end of the monitored period of time, the signal loss after ca. 160 h (7 days) is roughly63%. For the samples preheated at 120 ◦C, one observes significant improvement, and theobserved signal loss can be estimated for ca. 20–30% during first 160 h. What is interesting,for the samples preheated at highest temperature (200 ◦C), the observed signal loss is theslightest and during 340 h (14 days) was found to be of ca. 19%. Moreover, when analyzingthe shape of signal loss vs. time dependency, one can find that it exhibits a purely linearcharacter. This observation confirms that for the signal loss only recombination of thelower energy traps are responsible, after the emptying of which the main contributorsto the TL signal are relatively stable traps activated at higher temperatures. Both, thedose-dependence of the signal and the decrease of the TL signal intensity over time indicatethat the most optimal method of reading samples is their preheating at 200 ◦C, whichprovides signal linearity for high doses and relative stability of the dosimetric signal overtime. Additionally, in case of the readout method based on preheating at 200 ◦C, one caneasily apply the time-related correction of the dose measurement.
Appl. Sci. 2021, 11, x FOR PEER REVIEW 18 of 21
end of the monitored period of time, the signal loss after ca. 160 h (7 days) is roughly 63%. For the samples preheated at 120 °C, one observes significant improvement, and the ob-served signal loss can be estimated for ca. 20–30% during first 160 h. What is interesting, for the samples preheated at highest temperature (200 °C), the observed signal loss is the slightest and during 340 h (14 days) was found to be of ca. 19%. Moreover, when analyzing the shape of signal loss vs. time dependency, one can find that it exhibits a purely linear character. This observation confirms that for the signal loss only recombination of the lower energy traps are responsible, after the emptying of which the main contributors to the TL signal are relatively stable traps activated at higher temperatures. Both, the dose-dependence of the signal and the decrease of the TL signal intensity over time indicate that the most optimal method of reading samples is their preheating at 200 °C, which pro-vides signal linearity for high doses and relative stability of the dosimetric signal over time. Additionally, in case of the readout method based on preheating at 200 °C, one can easily apply the time-related correction of the dose measurement.
Figure 14. Dependencies of TL signal integral time after irradiation for preheated PPG_Tb30 glass dosimeter irradiated with beta radiation (4μs pulse duration).
4. Discussion The alumino-phosphate glasses doped with terbium with different amounts of REO
(Rare Earth Oxide) were synthesized by melt-quench method. Glass powders were sieved and pelletized in the form of discs. Samples were irradiated using electron accelerator and irradiation chamber (γ and β-) with radiation dose ranges up to 35 kGy. For samples con-taining terbium oxide, special shutter had to be used due too significantly higher light-emission efficiency. Addition of terbium oxide, even in amounts of only 0.1%, improves TL intensity significantly. The observed effect is a concentration-dependent phenomenon, as introduction of higher amounts of terbium results in further increasing of thermolumi-nescence yield. During the performed research, one established that TL signals from irra-diated native and terbium-doped phosphate glasses consist of a combination of different defect types such as first order kinetics (FOK), general order kinetics (GOK), and signals of continuous energy distribution of trapping centers. Verification of the proper localiza-tion of particular peaks was based on the consecutive analysis of the experimental data,
Figure 14. Dependencies of TL signal integral time after irradiation for preheated PPG_Tb30 glassdosimeter irradiated with beta radiation (4µs pulse duration).
4. Discussion
The alumino-phosphate glasses doped with terbium with different amounts of REO(Rare Earth Oxide) were synthesized by melt-quench method. Glass powders were sievedand pelletized in the form of discs. Samples were irradiated using electron acceleratorand irradiation chamber (γ and β-) with radiation dose ranges up to 35 kGy. For samples
Appl. Sci. 2021, 11, 7221 19 of 21
containing terbium oxide, special shutter had to be used due too significantly higher light-emission efficiency. Addition of terbium oxide, even in amounts of only 0.1%, improves TLintensity significantly. The observed effect is a concentration-dependent phenomenon, asintroduction of higher amounts of terbium results in further increasing of thermolumines-cence yield. During the performed research, one established that TL signals from irradiatednative and terbium-doped phosphate glasses consist of a combination of different defecttypes such as first order kinetics (FOK), general order kinetics (GOK), and signals of con-tinuous energy distribution of trapping centers. Verification of the proper localization ofparticular peaks was based on the consecutive analysis of the experimental data, and theresults were obtained from deconvolution analysis using GCA (Glow Curve Analysis)software. Due to the extensive research related to the exact determination of signals decon-volution for glasses studied in this work, one may conclude that this is a very interestingtopic that deserves further research and analysis. Additionally, it was found that simplepreheating of dosimeters before readout influences dosimetric signals and signal loss andallows for optimization of the readout method of the investigated dosimeters, making theTL signal vs. radiation dose response more predictable. The performed research provedthat preheating of the investigated samples at 200 ◦C improves the linearity of integral TLintensity vs. dose absorbed for doses higher than 15 kGy. Moreover, preheating allowsone to minimize relative signal loss in samples over time. An additional advantage of theinvestigated dosimetric system is its ability to read dosimeters using a basic TL readerwithout any modifications. All obtained data suggest that the investigated material hashigh potential for use in high-dose ionizing radiation dosimetry.
Author Contributions: Conceptualization, A.G. and P.S.; methodology, A.G. and P.S.; software, P.S.and J.F.B.C.; validation, A.G., P.S. and J.F.B.C.; formal analysis, A.G. and P.S.; investigation, A.G.and P.S.; resources, A.G. and P.S.; data curation, A.G. and P.S.; writing—original draft preparation,A.G. and P.S.; writing—review and editing, A.G. and P.S. All authors have read and agreed to thepublished version of the manuscript.
Funding: Research financed by the statutory funding of Lodz University of Technology.
Conflicts of Interest: The authors declare no conflict of interest. The funders had no role in the designof the study; in the collection, analyses, or interpretation of data; in the writing of the manuscript; orin the decision to publish the results.
References1. Sugawara, E.; Nikaido, H. Properties of AdeABC and AdeIJK Efflux Systems of Acinetobacter baumannii Compared with Those
of the AcrAB-TolC System of Escherichia coli. Antimicrob. Agents Chemother. 2014, 58, 7250–7257. [CrossRef]2. Nazarov, M.; Noh, D.Y. New Generation of Europium and Terbium Activated Phosphors: From Syntheses to Applications; CRC Press: Boca
Raton, FL, USA, 2012; Available online: https://www.crcpress.com/New-Generation-of-Europium--and-Terbium-Activated-Phosphors-From-Syntheses/Nazarov-Noh/p/book/9789814310772 (accessed on 5 October 2019).
3. Ebendorff-Heidepriem, H.; Ehrt, D. Formation and UV absorption of cerium, europium and terbium ions in different valencies inglasses. Opt. Mater. 2000, 15, 7–25. [CrossRef]
4. Furmann, B.; Stefanska, D.; Chomski, M.; Suski, M.; Wilman, S. Hyperfine structure studies of the odd-parity electronic levels ofthe terbium atom. J. Quant. Spectrosc. Radiat. Transf. 2019, 237, 106613. [CrossRef]
5. Lu, C.-H.; Yang, C.-Y.; Som, S.; Das, S. Structural and luminescence characterization of terbium doped siliconitride phosphors forafterglow applications. Optik 2020, 203, 164030. [CrossRef]
6. Altunal, V.; Guckan, V.; Ozdemir, A.; Yegingil, Z. Radiation dosimeter utilizing optically stimulated luminescence of BeO: Na, Tb,Gd ceramics. J. Alloy. Compd. 2020, 817, 152809. [CrossRef]
7. Guzmán-Olguín, J.; Guzmán-Mendoza, J.; Montalvo, T.R.; García-Hipólito, M.; Baéz-Rodríguez, A.; Falcony, C. Luminescentproperties of terbium doped barium hafnate perovskite: Synthesis and characterization. J. Lumin. 2020, 226, 117459. [CrossRef]
8. Gingasu, D.; Mindru, I.; Ianculescu, A.; Preda, S.; Negrila, C.; Secu, M. Photoluminescence and thermoluminescence properties ofthe Sr3Al2O6: Eu3+/Eu2+,Tb3+ persistent phosphor. J. Lumin. 2019, 214, 116540. [CrossRef]
9. Bunzli, J.-C.; Wong, K.-L. Lanthanide mechanoluminescence. J. Rare Earths 2018, 36, 1–41. [CrossRef]10. Sharipov, G.L.; Tukhbatullin, A.; Abdrakhmanov, A.M. Triboluminescence of crystals and suspensions of inorganic salts of
lanthanides. Prot. Met. Phys. Chem. Surf. 2011, 47, 13–19. [CrossRef]11. Zhao, Y.; Wang, Y.; Cui, M.; Jin, H.; Fan, Z.; Zhao, C.; Wu, X.; Townsend, P. Morphology and thermoluminescence properties of
terbium doped magnesium orthosilicate. Radiat. Meas. 2017, 99, 44–49. [CrossRef]

Appl. Sci. 2021, 11, 7221 20 of 21
12. Prokic, M.; Yukihara, E. Dosimetric characteristics of high sensitive Mg2SiO4: Tb solid TL detector. Radiat. Meas. 2008, 43, 463–466.[CrossRef]
13. Zhao, Y.; Wang, Y.; Jin, H.; Yin, L.; Wu, X.; Ma, Y.; Townsend, P.D. Thermoluminescence Spectra of Rare Earth Doped MagnesiumOrthosilicate. J. Alloys Compd. 2019, 797, 1338–1347. [CrossRef]
14. Selvan, P.C.; Selvasekarapandian, S.; Neelamegam, P. Optical absorption, photoluminescence, and thermally stimulated lumines-cence of CsCl: Tb crystals. Phys. Status Solidi 1996, 194, 747–756. [CrossRef]
15. Lozano, I.; Roman-Lopez, J.; Valverde, M.; Garcia-Hipolito, M.; Díaz-Góngora, J.; Castañeda, J.G.; Alarcon-Flores, G. Ther-moluminescence properties of cerium and terbium doped alpha-strontium pyrophosphate. Radiat. Meas. 2019, 129, 106192.[CrossRef]
16. Bangaru, S.; Muralidharan, G.; Brahmanandhan, G. Thermoluminescence and optical studies on X-irradiated terbium-dopedpotassium bromide crystals. J. Lumin. 2010, 130, 618–622. [CrossRef]
17. Azorin-Nieto, J.; Khaidukov, N.; Sánchez-Rodríguez, A.; Azorín-Vega, J. Thermoluminescence of terbium-doped double fluorides.Nucl. Instruments Methods Phys. Res. Sect. B Beam Interact. Mater. At. 2007, 263, 36–40. [CrossRef]
18. Andrade, M.; Azevedo, W.; Barros, V.; Khoury, H. Thermoluminescence of aluminum oxide co-doped with terbium and thuliumobtained via combustion synthesis. Radiat. Meas. 2011, 46, 1474–1476. [CrossRef]
19. Zych, E.; Bolek, P.; Kulesza, D. On thermoluminescence of Lu2O3: Tb, Ta ceramic storage phosphors. J. Lumin. 2017, 189, 153–158.[CrossRef]
20. Szajerski, P.; Jakubowska, M.; Gasiorowski, A.; Mandowska, E. Dosimetric properties of europium, gadolinium and ceriumborosilicate glasses in application of electron beam dose measurements. J. Lumin. 2017, 182, 300–311. [CrossRef]
21. Saidu, A.; Wagiran, H.; Saeed, M.; Obayes, H.; Bala, A.; Usman, F. Thermoluminescence response of rare earth activated zinclithium borate glass. Radiat. Phys. Chem. 2018, 144, 413–418. [CrossRef]
22. Prasad, S.; Reddy, M.S.; Kumar, V.R.; Veeraiah, N.; Nalluri, V. Specific features of photo and thermoluminescence of Tb3+ ions inBaO–M2O3 (M=Ga, Al, In)–P2O5 glasses. J. Lumin. 2007, 127, 637–644. [CrossRef]
23. Ono, H.; Fujimoto, Y.; Yahaba, T.; Yanagida, T.; Koshimizu, M.; Asai, K. Thermoluminescence properties of Tb3+-doped CaO–Al2O3–B2O3-based glasses. Opt. Mater. 2019, 87, 24–28. [CrossRef]
24. Roberts, C.J. Management and disposal of waste from sites contaminated by radioactivity. Radiat. Phys. Chem. 1998, 51, 579–587.[CrossRef]
25. Honma, T.; Sato, A.; Ito, N.; Togashi, T.; Shinozaki, K.; Komatsu, T. Crystallization behavior of sodium iron phosphate glassNa2−Fe1+0.5P2O7 for sodium ion batteries. J. Non-Cryst. Solids 2014, 404, 26–31. [CrossRef]
26. Jha, P.K.; Pandey, O.; Singh, K. Non-isothermal crystallization kinetics of K2O modified sodium-phosphate glasses. J. Non-Cryst. Solids2016, 440, 76–84. [CrossRef]
27. Gasiorowski, A.; Szajerski, P. Thermoluminescence characteristics and dose response of electron beam and gamma rays irradiatedalumino-phosphate glasses doped with Gd2O3 and Tb2O3. J. Lumin. 2019, 214, 116519. [CrossRef]
28. Sharma, S.; De, M.; Jana, S. Terbium doped sodium phosphate glass: A strong green emitting glass. Optik 2018, 154, 576–580.[CrossRef]
29. Kuro, T.; Okada, G.; Kawaguchi, N.; Fujimoto, Y.; Masai, H.; Yanagida, T. Scintillation properties of rare-earth doped NaPO3-Al(PO3)3 glasses. Opt. Mater. 2016, 62, 561–568. [CrossRef]
30. Kawano, N.; Akatsuka, M.; Kimura, H.; Okada, G.; Kawaguchi, N.; Yanagida, T. Scintillation and TSL properties of Tb-dopedNaPO3-Al(PO3)3 glasses. Radiat. Meas. 2018, 117, 52–56. [CrossRef]
31. Brahmachary, K.; Rajesh, D.; Balakrishna, A.; Ratnakaram, Y.C. Radiative Properties and Energy Transfer Mechanism of Sm3+ Ionin Zinc-Alumino-Sodium-Phosphate (ZANP) Glasses. Int. J. ChemTech Res. 2014, 6, 1705–1707.
32. Babkina, A.; Kulpina, E.; Sgibnev, Y.; Fedorov, Y.; Starobor, A.; Palashov, O.; Nikonorov, N.; Ignatiev, A.; Zyryanova, K.; Oreshkina,K.; et al. Terbium concentration effect on magneto-optical properties of ternary phosphate glass. Opt. Mater. 2020, 100, 109692.[CrossRef]
33. El Mesady, I.; Alawsh, S. Optical and luminescence properties of silicon doped alumino-phosphate-sodium glass system.J. Non-Cryst. Solids 2018, 482, 236–242. [CrossRef]
34. Brow, R.K.; Kirkpatrick, R.J.; Turner, G.L. Nature of Alumina in Phosphate Glass: II, Structure of Sodium AlurninophosphateGlass. J. Am. Ceram. Soc. 1993, 76, 919–928. [CrossRef]
35. Tricot, G.; Revel, B.; Wegner, S. Thermal stability of a low Tg phosphate glass investigated by DSC, XRD and solid state NMR.J. Non-Cryst. Solids 2011, 357, 2708–2712. [CrossRef]
36. Karabulut, M.; Metwalli, E.; Brow, R. Structure and properties of lanthanum–aluminum–phosphate glasses. J. Non-Cryst. Solids2001, 283, 211–219. [CrossRef]
37. Stoch, L.; Stoch, P. Significance of crystallochemical factors in chemical reactions into the structure of solids. J. Therm. Anal. Calorim.2012, 109, 763–766. [CrossRef]
38. Yang, R.; Wang, Y.; Chen, Y.; Hao, X.; Zhan, J.; Liu, S. Glass formation region of the lithium iron phosphate ternary system and theproperties of obtained glasses. Ceram. Silikáty 2010, 54, 352–356.
39. Gasiorowski, A.; Szajerski, P. Particles size increase assisted enhancement of thermoluminescence emission in gadolinium anddysprosium oxide doped phosphate glasses. J. Alloy. Compd. 2020, 839, 155479. [CrossRef]
40. Thomas, S.; Chithambo, M. Thermoluminescence of K-Mg-Al-Zn fluorophosphate glass. Opt. Mater. 2017, 64, 302–309. [CrossRef]

Appl. Sci. 2021, 11, 7221 21 of 21
41. Jin, H.; Zhao, Y.; Wang, Y.; Xi, L.; Yin, L.; Ma, Y.; Townsend, P. Improved thermoluminescence response of terbium dopedmagnesium orthosilicate by co-doping with sodium ions. Opt. Mater. 2019, 98, 109448. [CrossRef]
42. Fukuda, Y. Thermoluminescence in calcium fluoride doped with terbium and gadolinium ions. Radiat. Meas. 2008, 43, 455–458.[CrossRef]
43. Abdel-Kader, A.; El-Mallawany, R.; Elkholy, M.; Farag, H. Thermoluminescence dosimetry of rare-earth doped tellurite phosphateglasses. Mater. Chem. Phys. 1994, 36, 365–370. [CrossRef]
44. Liu, L.; Zhang, Y.; Hao, J.; Li, C.; Tang, Q.; Zhang, C.; Su, Q. Thermoluminescence characteristics of terbium-doped Ba2Ca(BO3)2phosphor. Phys. Status Solidi 2005, 202, 2800–2806. [CrossRef]
45. Kalnins, C.A.G.; Ebendorff-Heidepriem, H.; Spooner, N.A.; Monro, T.M. Enhanced radiation dosimetry of fluoride phosphateglass optical fibres by terbium (III) doping. Opt. Mater. Express 2016, 6, 3692–3703. [CrossRef]
46. Terbium Doped Glasses: Their Optical Properties and Potential Applications—Durham e-Theses, (n.d.). Available online:http://etheses.dur.ac.uk/8176/ (accessed on 22 November 2020).
47. Wang, Y.; Jiang, Y.; Chu, X.; Xu, J.; Townsend, P.D. Thermoluminescence responses of terbium-doped magnesium orthosilicatewith different synthesis conditions. Radiat. Prot. Dosim. 2013, 158, 373–377. [CrossRef] [PubMed]
48. McKeever, S.W.S. Thermoluminescence of Solids; Cambridge University Press (CUP): Cambridge, UK, 1985.49. Benavente, J.; Gómez-Ros, J.; Correcher, V. Characterization of the thermoluminescence glow curve of Li2B4O7: Cu, Ag. Radiat. Meas.
2020, 137, 106427. [CrossRef]50. Benavente, J.; Gómez-Ros, J.M.; Romero, A.M. Thermoluminescence glow curve deconvolution for discrete and continuous trap
distributions. Appl. Radiat. Isot. 2019, 153, 108843. [CrossRef]51. Gómez-Ros, J.M.; Correcher, V.; Garcia-Guinea, J.; Delgado, A. Evolution of the trapped charge distribution due to trap emptying
processes in a natural aluminosilicate. Radiat. Prot. Dosim. 2006, 119, 93–97. [CrossRef]
Copyright © 2022 FDOKUMEN