Amorphous aluminosilicate catalysts for hydroxyalkylation of aniline and phenol
Upload
independentCategory
view
4download
0
JOURNAL OF APPLIED PHYSICS VOLUME 85, NUMBER 12 15 JUNE 1999
Nd2O3 doped low silica calcium aluminosilicate glasses:Thermomechanical properties
M. L. Baesso, A. C. Bento, A. R. Duarte, A. M. Neto, and L. C. M. Mirandaa)
Departamento de Fı´sica, Universidade Estadual de Maringa´, Avenue Colombo 5790, Maringa´-PR,87020-900, Brazil
J. A. Sampaio and T. CatundaInstituto de Fı´sica de Sa˜o Carlos, Universidade de Sa˜o Paulo, Avenue Dr. Carlos Botelho 1465,Sao Carlos-SP 13560-250, Brazil
S. Gama and F. C. G. GandraInstituto de Fı´sica Gleb Wataghin, Universidade Estadual de Campinas, 13083-970 Campinas-SP, Brazil
~Received 14 September; accepted for publication 24 November 1998!
The effects of Nd2O3 doping on the thermal and mechanical properties of vacuum melted, low silica,calcium aluminosilicate glasses are presented. For the doped glasses, the vitrification limit wasfound to correspond to a maximum load of 5 wt % Nd2O3. The influence of the rare earth dopingon the thermal diffusivity, thermal conductivity, and Vickers hardness was such that all thesephysical parameters decreased by roughly the same amount, namely 8%, between the undoped andthe 5 wt % doped sample. The dependence of these parameters, as a function of the Nd2O3 doping,strongly supports the idea that the Nd31 act as network modifiers. ©1999 American Institute ofPhysics.@S0021-8979~99!04705-2#
m
inse
ioo-neo
as-ndtraofs
sar
chlacto
atcam
ten-as
o-the
allowdi-
-ral
per-for
rade
,5 g
,berob-10x,mm
nts.
INTRODUCTION
Despite the fact that the glass-forming ability of calciualuminate has been known since 1909,1 and that the highlyrefractory nature, excellent chemical durability, and highfrared transmission of these silica-free or low silica glaswere also known since the late 1950s,2–4 interest in this fam-ily of glasses has only recently gained considerable attentMost of the papers dealing with low silica calcium aluminsilicate glasses were concerned, up to recently, with expaing the glass-forming field of these materials. It has beshown,5,6 for instance, that the addition of small amountssilica5,6 or barium oxide3 to the base composition of calciumaluminate increases the glass-forming region in the phdiagram, without significantly affecting their infrared tranmission. Furthermore, samples melted under vacuum cotions exhibit excellent transmission in the infrared specrange up to 6mm,5–7 and phonon energies on the order800 cm21, which is lower than that of silicate glassetypically,8,9 on the order of 1000 cm21.
The combination of these properties renders this clasglass of great potential for many optical applications, in pticular, as a glass laser host material.10 Although 37 yearshave passed since the advent of the glass laser, the searnew laser glasses continues with increasing interest. All glasers to date have used trivalent lanthanides as the aions. Neodymium-doped glasses are by far the most thoughly investigated and have the largest experimental dbase. As to the host glass, fluorides, phosphates, and siliglasses have been used, with the phosphates being the
a!Electronic mail: [email protected]
8110021-8979/99/85(12)/8112/7/$15.00
Downloaded 12 Oct 2001 to 143.107.228.173. Redistribution subject to A
-s
n.
d-nf
se
i-l
of-
forssiver-a-tesost
widely used for bulk laser glasses. Despite their great potial as host glass for laser applications, only recently hinterest in the investigation of low silica calcium aluminsilicate glasses doped with rare-earth elements attractedattention of a number of researchers.8,11–15 In particular, ithas been shown11,12 that vacuum melted low silica calciumaluminosilicate glasses doped with Nd2O3 with concentra-tions up to 5 wt % exhibit high quantum efficiencies.
In this paper, we report on the changes in the thermproperties, density and hardness of vacuum melted,silica, calcium aluminosilicate glasses induced by the adtion of varying concentrations of Nd2O3 to the base composition. As is well known, rare earth doping induces structuchanges in the host glass.16,17 It is of utmost importance toknow the dependence of the thermal and mechanical proties as a function of the doping concentration, especiallythe eventual device applications.
EXPERIMENT
The glass samples were prepared from reagent gCaCO3, Al2O3, MgO, SiO2 and Nd2O3 with the followingcompositions~in wt %!: 47.4 CaO, (41.52x) Al2O3, 7.0SiO2, 4.1 MgO, x Nd2O3, wherex50.5, 1.0, 1.5, 2.0, 2.53.0, 3.5, 4.0, 4.5, and 5.0. The batches were melted in 1quantities under vacuum (1023atm) in graphite crucibles forapproximately 2 h at1500 °C. After switching off the heaterthe crucible was moved 60 cm upward to a cooled chamand allowed to cool to room temperature. The samplestained were cut in two different shapes: 3 mm thick disksmm in diameter, with optical finishing, for refractive indemicrohardness and thermal lens measurements, and 2thick disks 6 mm in diameter for specific heat measureme
2 © 1999 American Institute of Physics
IP license or copyright, see http://ojps.aip.org/japo/japcr.jsp
ism
cea
nade
benacer
rensa
tClwoe0g
nts,
callyquep-is aheates ofple.
serthe
helt oftiveex-ureth
era-s ai-in-
. 18. Itof
dif-
sity,ma-of
g.e,
ue,y
8113J. Appl. Phys., Vol. 85, No. 12, 15 June 1999 Baesso et al.
X-ray diffraction and optical microscopy showed that thsample preparation procedure resulted in amorphous, hogeneous, bubble-free transparent glasses with no evidendevitrification. For the current base composition, the vitifiction limit was found to correspond to a maximum Nd2O3
doping concentration of 5 wt %. The doping concentratioin our samples were checked by measuring the opticalsorption coefficient at the peak absorption band centere590 nm. We have also carried out infrared transmission msurements to determine whether the OH absorption haseliminated by the vacuum melting procedure. As additiocomplementary information on the eventual changes induby the neodymium oxide doping, we have measured thefractive index of all samples investigated using an Abbefractometer at the sodium D line, as well as the glass tration temperature Tg , using 150 mg samples insimultaneous thermal analyzer~Netzsch, STA 409-EP!.
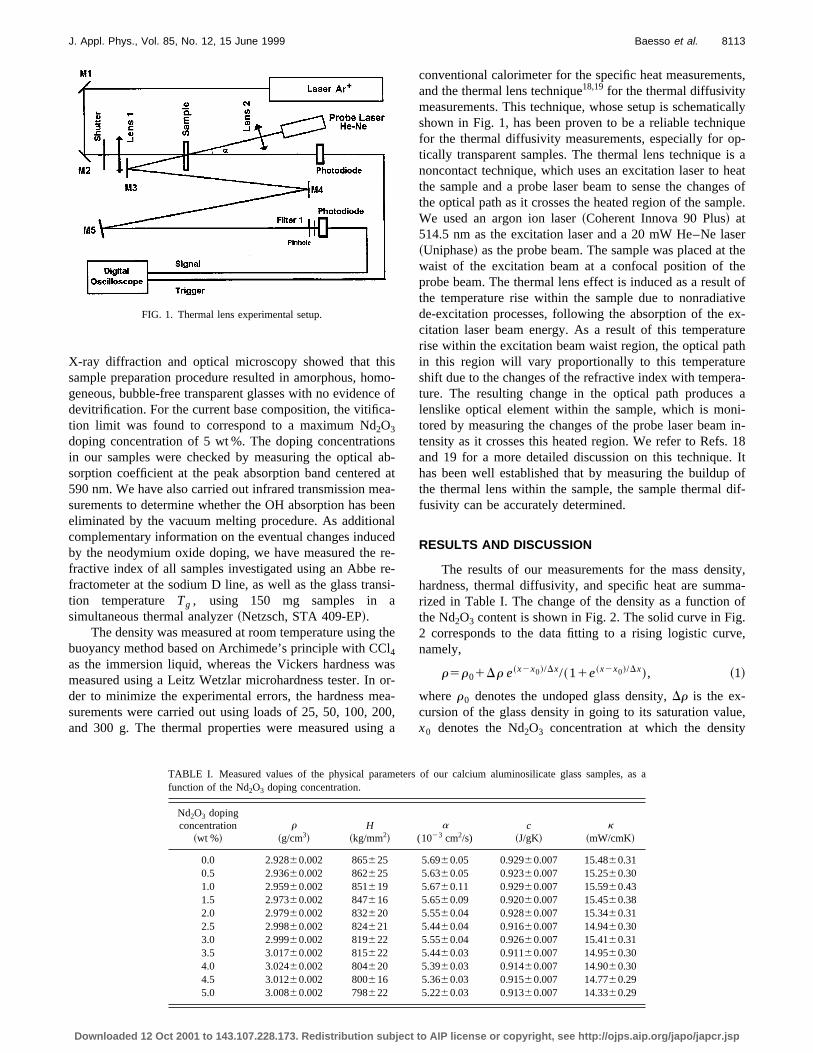
The density was measured at room temperature usingbuoyancy method based on Archimede’s principle with C4as the immersion liquid, whereas the Vickers hardnessmeasured using a Leitz Wetzlar microhardness tester. Inder to minimize the experimental errors, the hardness msurements were carried out using loads of 25, 50, 100, 2and 300 g. The thermal properties were measured usin
FIG. 1. Thermal lens experimental setup.
Downloaded 12 Oct 2001 to 143.107.228.173. Redistribution subject to A
o-of
-
sb-ata-enld
e--i-
he
asr-a-0,a
conventional calorimeter for the specific heat measuremeand the thermal lens technique18,19 for the thermal diffusivitymeasurements. This technique, whose setup is schematishown in Fig. 1, has been proven to be a reliable technifor the thermal diffusivity measurements, especially for otically transparent samples. The thermal lens techniquenoncontact technique, which uses an excitation laser tothe sample and a probe laser beam to sense the changthe optical path as it crosses the heated region of the samWe used an argon ion laser~Coherent Innova 90 Plus! at514.5 nm as the excitation laser and a 20 mW He–Ne la~Uniphase! as the probe beam. The sample was placed atwaist of the excitation beam at a confocal position of tprobe beam. The thermal lens effect is induced as a resuthe temperature rise within the sample due to nonradiade-excitation processes, following the absorption of thecitation laser beam energy. As a result of this temperatrise within the excitation beam waist region, the optical pain this region will vary proportionally to this temperaturshift due to the changes of the refractive index with tempeture. The resulting change in the optical path producelenslike optical element within the sample, which is montored by measuring the changes of the probe laser beamtensity as it crosses this heated region. We refer to Refsand 19 for a more detailed discussion on this techniquehas been well established that by measuring the buildupthe thermal lens within the sample, the sample thermalfusivity can be accurately determined.
RESULTS AND DISCUSSION
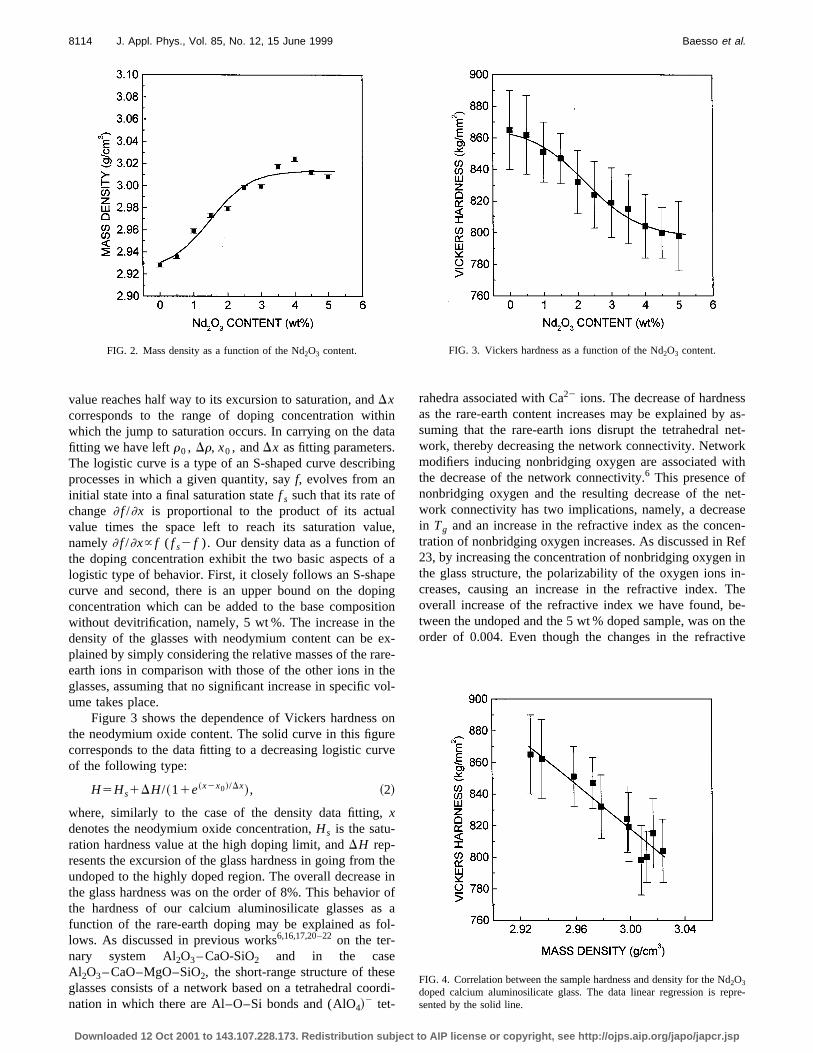
The results of our measurements for the mass denhardness, thermal diffusivity, and specific heat are sumrized in Table I. The change of the density as a functionthe Nd2O3 content is shown in Fig. 2. The solid curve in Fi2 corresponds to the data fitting to a rising logistic curvnamely,
r5r01Dr e~x2x0!/Dx/~11e~x2x0!/Dx!, ~1!
wherer0 denotes the undoped glass density,Dr is the ex-cursion of the glass density in going to its saturation valx0 denotes the Nd2O3 concentration at which the densit
, as a
TABLE I. Measured values of the physical parameters of our calcium aluminosilicate glass samplesfunction of the Nd2O3 doping concentration.Nd2O3 dopingconcentration
~wt %!r
~g/cm3!H
~kg/mm2!a
(1023 cm2/s)c
~J/gK!k
~mW/cmK!
0.0 2.92860.002 865625 5.6960.05 0.92960.007 15.4860.310.5 2.93660.002 862625 5.6360.05 0.92360.007 15.2560.301.0 2.95960.002 851619 5.6760.11 0.92960.007 15.5960.431.5 2.97360.002 847616 5.6560.09 0.92060.007 15.4560.382.0 2.97960.002 832620 5.5560.04 0.92860.007 15.3460.312.5 2.99860.002 824621 5.4460.04 0.91660.007 14.9460.303.0 2.99960.002 819622 5.5560.04 0.92660.007 15.4160.313.5 3.01760.002 815622 5.4460.03 0.91160.007 14.9560.304.0 3.02460.002 804620 5.3960.03 0.91460.007 14.9060.304.5 3.01260.002 800616 5.3660.03 0.91560.007 14.7760.295.0 3.00860.002 798622 5.2260.03 0.91360.007 14.3360.29
IP license or copyright, see http://ojps.aip.org/japo/japcr.jsp
hiat.in
lluff
pepiitihee
arthv
rrv
,
ters
fo
eor
ssy as-net-rkith
net-seen-Refin
in-Thebe-
thetive
dpre-
8114 J. Appl. Phys., Vol. 85, No. 12, 15 June 1999 Baesso et al.
value reaches half way to its excursion to saturation, andDxcorresponds to the range of doping concentration witwhich the jump to saturation occurs. In carrying on the dfitting we have leftr0 , Dr, x0 , andDx as fitting parametersThe logistic curve is a type of an S-shaped curve describprocesses in which a given quantity, sayf, evolves from aninitial state into a final saturation statef s such that its rate ofchange] f /]x is proportional to the product of its actuavalue times the space left to reach its saturation vanamely] f /]x} f ( f s2 f ). Our density data as a function othe doping concentration exhibit the two basic aspects ologistic type of behavior. First, it closely follows an S-shacurve and second, there is an upper bound on the doconcentration which can be added to the base composwithout devitrification, namely, 5 wt %. The increase in tdensity of the glasses with neodymium content can beplained by simply considering the relative masses of the rearth ions in comparison with those of the other ions inglasses, assuming that no significant increase in specificume takes place.
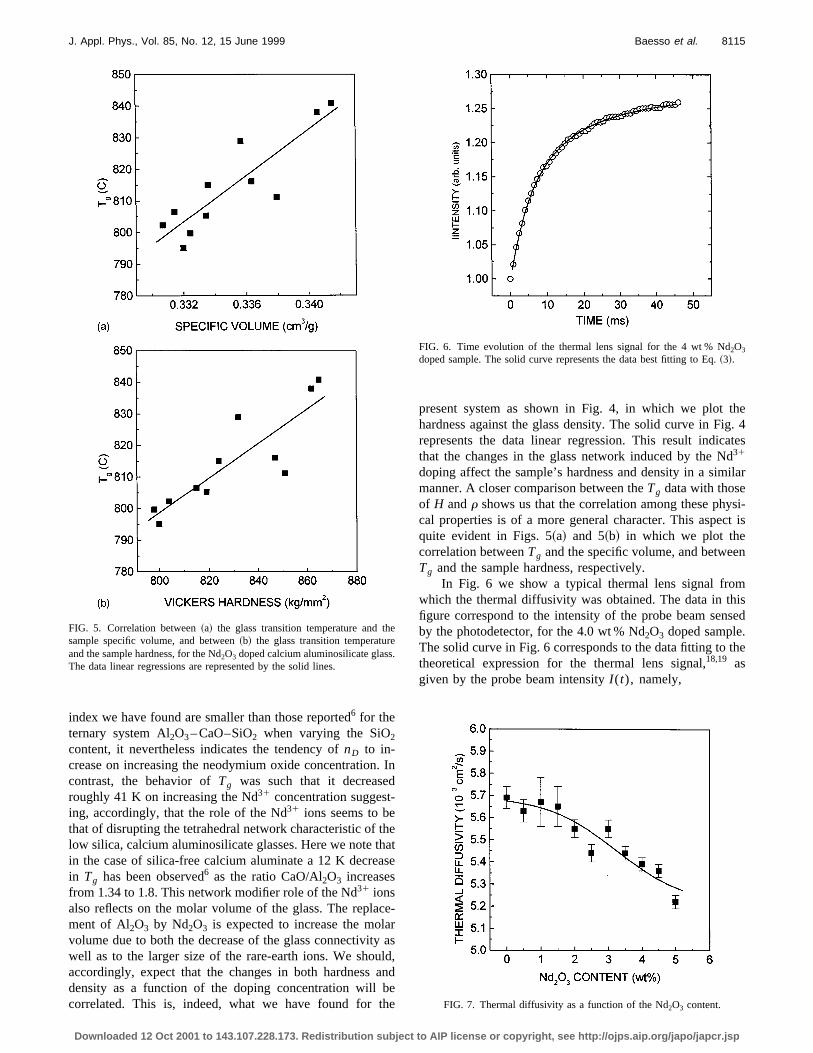
Figure 3 shows the dependence of Vickers hardnessthe neodymium oxide content. The solid curve in this figucorresponds to the data fitting to a decreasing logistic cuof the following type:
H5Hs1DH/~11e~x2x0!/Dx!, ~2!
where, similarly to the case of the density data fittingxdenotes the neodymium oxide concentration,Hs is the satu-ration hardness value at the high doping limit, andDH rep-resents the excursion of the glass hardness in going fromundoped to the highly doped region. The overall decreasthe glass hardness was on the order of 8%. This behaviothe hardness of our calcium aluminosilicate glasses afunction of the rare-earth doping may be explained aslows. As discussed in previous works6,16,17,20–22on the ter-nary system Al2O3– CaO-SiO2 and in the caseAl2O3– CaO–MgO–SiO2, the short-range structure of thesglasses consists of a network based on a tetrahedral conation in which there are Al–O–Si bonds and (AlO4!
2 tet-
FIG. 2. Mass density as a function of the Nd2O3 content.
Downloaded 12 Oct 2001 to 143.107.228.173. Redistribution subject to A
na
g
e,
a
ngon
x-e-eol-
onee
heinofa
l-
di-
rahedra associated with Ca22 ions. The decrease of hardneas the rare-earth content increases may be explained bsuming that the rare-earth ions disrupt the tetrahedralwork, thereby decreasing the network connectivity. Netwomodifiers inducing nonbridging oxygen are associated wthe decrease of the network connectivity.6 This presence ofnonbridging oxygen and the resulting decrease of thework connectivity has two implications, namely, a decreain Tg and an increase in the refractive index as the conctration of nonbridging oxygen increases. As discussed in23, by increasing the concentration of nonbridging oxygenthe glass structure, the polarizability of the oxygen ionscreases, causing an increase in the refractive index.overall increase of the refractive index we have found,tween the undoped and the 5 wt % doped sample, was onorder of 0.004. Even though the changes in the refrac
FIG. 4. Correlation between the sample hardness and density for the N2O3
doped calcium aluminosilicate glass. The data linear regression is resented by the solid line.
FIG. 3. Vickers hardness as a function of the Nd2O3 content.
IP license or copyright, see http://ojps.aip.org/japo/japcr.jsp
.d-
thhaas
caryula
beth
theg. 4atesdilar
si-ct is
n
missed
the
hee.
8115J. Appl. Phys., Vol. 85, No. 12, 15 June 1999 Baesso et al.
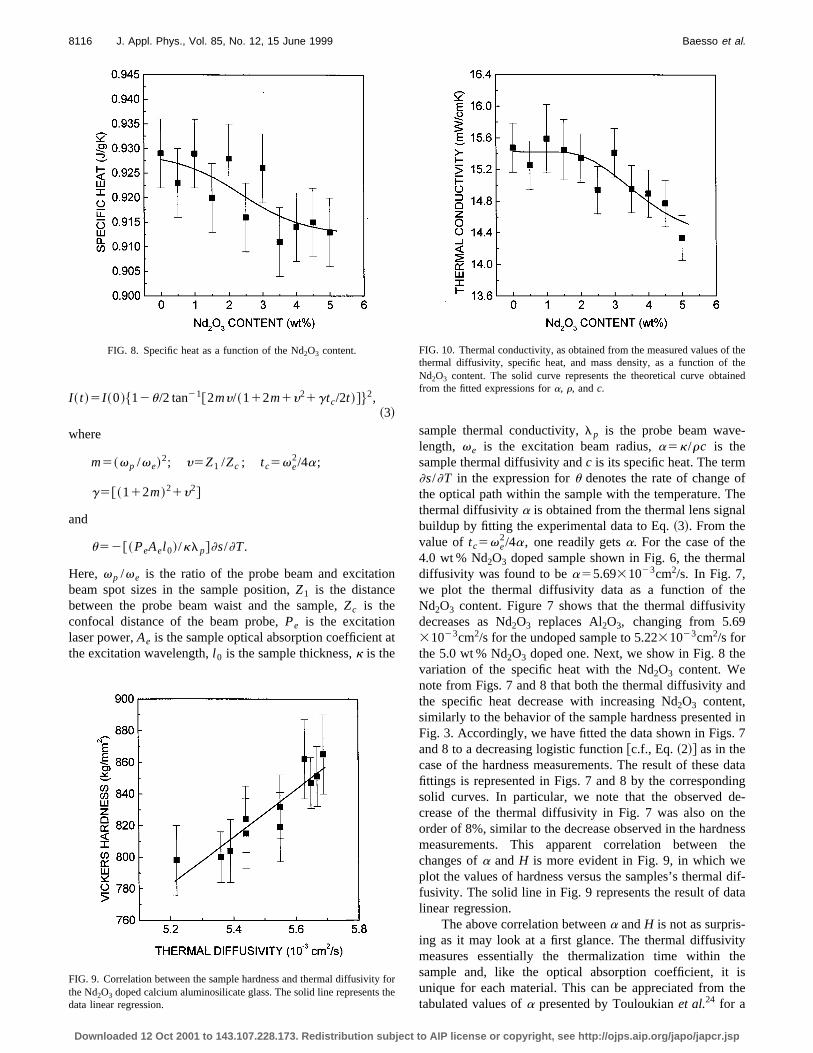
index we have found are smaller than those reported6 for theternary system Al2O3– CaO–SiO2 when varying the SiO2content, it nevertheless indicates the tendency ofnD to in-crease on increasing the neodymium oxide concentrationcontrast, the behavior ofTg was such that it decreaseroughly 41 K on increasing the Nd31 concentration suggesting, accordingly, that the role of the Nd31 ions seems to bethat of disrupting the tetrahedral network characteristic oflow silica, calcium aluminosilicate glasses. Here we note tin the case of silica-free calcium aluminate a 12 K decrein Tg has been observed6 as the ratio CaO/Al2O3 increasesfrom 1.34 to 1.8. This network modifier role of the Nd31 ionsalso reflects on the molar volume of the glass. The replament of Al2O3 by Nd2O3 is expected to increase the molvolume due to both the decrease of the glass connectivitwell as to the larger size of the rare-earth ions. We shoaccordingly, expect that the changes in both hardnessdensity as a function of the doping concentration willcorrelated. This is, indeed, what we have found for
FIG. 5. Correlation between~a! the glass transition temperature and tsample specific volume, and between~b! the glass transition temperaturand the sample hardness, for the Nd2O3 doped calcium aluminosilicate glassThe data linear regressions are represented by the solid lines.
Downloaded 12 Oct 2001 to 143.107.228.173. Redistribution subject to A
In
ete
e-
asd,nd
e
present system as shown in Fig. 4, in which we plothardness against the glass density. The solid curve in Firepresents the data linear regression. This result indicthat the changes in the glass network induced by the N31
doping affect the sample’s hardness and density in a simmanner. A closer comparison between theTg data with thoseof H andr shows us that the correlation among these phycal properties is of a more general character. This aspequite evident in Figs. 5~a! and 5~b! in which we plot thecorrelation betweenTg and the specific volume, and betweeTg and the sample hardness, respectively.
In Fig. 6 we show a typical thermal lens signal frowhich the thermal diffusivity was obtained. The data in thfigure correspond to the intensity of the probe beam senby the photodetector, for the 4.0 wt % Nd2O3 doped sample.The solid curve in Fig. 6 corresponds to the data fitting totheoretical expression for the thermal lens signal,18,19 asgiven by the probe beam intensityI (t), namely,
FIG. 6. Time evolution of the thermal lens signal for the 4 wt % Nd2O3
doped sample. The solid curve represents the data best fitting to Eq.~3!.
FIG. 7. Thermal diffusivity as a function of the Nd2O3 content.
IP license or copyright, see http://ojps.aip.org/japo/japcr.jsp
on
a
-
fhe
al
al
ety
e
nd
d in. 7
dataingde-heessthe
dif-ta
tytheisthe
y fth
f thetheined
8116 J. Appl. Phys., Vol. 85, No. 12, 15 June 1999 Baesso et al.
I ~ t !5I ~0!$12u/2 tan21@2my/~112m1y21gtc/2t !#%2,~3!
where
m5~vp /ve!2; y5Z1 /Zc ; tc5ve
2/4a;
g5@~112m!21y2#
and
u52@~PeAel 0!/klp#]s/]T.
Here, vp /ve is the ratio of the probe beam and excitatibeam spot sizes in the sample position,Z1 is the distancebetween the probe beam waist and the sample,Zc is theconfocal distance of the beam probe,Pe is the excitationlaser power,Ae is the sample optical absorption coefficientthe excitation wavelength,l 0 is the sample thickness,k is the
FIG. 8. Specific heat as a function of the Nd2O3 content.
FIG. 9. Correlation between the sample hardness and thermal diffusivitthe Nd2O3 doped calcium aluminosilicate glass. The solid line representsdata linear regression.
Downloaded 12 Oct 2001 to 143.107.228.173. Redistribution subject to A
t
sample thermal conductivity,lp is the probe beam wavelength, ve is the excitation beam radius,a5k/rc is thesample thermal diffusivity andc is its specific heat. The term]s/]T in the expression foru denotes the rate of change othe optical path within the sample with the temperature. Tthermal diffusivitya is obtained from the thermal lens signbuildup by fitting the experimental data to Eq.~3!. From thevalue of tc5ve
2/4a, one readily getsa. For the case of the4.0 wt % Nd2O3 doped sample shown in Fig. 6, the thermdiffusivity was found to bea55.6931023cm2/s. In Fig. 7,we plot the thermal diffusivity data as a function of thNd2O3 content. Figure 7 shows that the thermal diffusividecreases as Nd2O3 replaces Al2O3, changing from 5.6931023cm2/s for the undoped sample to 5.2231023cm2/s forthe 5.0 wt % Nd2O3 doped one. Next, we show in Fig. 8 thvariation of the specific heat with the Nd2O3 content. Wenote from Figs. 7 and 8 that both the thermal diffusivity athe specific heat decrease with increasing Nd2O3 content,similarly to the behavior of the sample hardness presenteFig. 3. Accordingly, we have fitted the data shown in Figsand 8 to a decreasing logistic [email protected]., Eq.~2!# as in thecase of the hardness measurements. The result of thesefittings is represented in Figs. 7 and 8 by the correspondsolid curves. In particular, we note that the observedcrease of the thermal diffusivity in Fig. 7 was also on torder of 8%, similar to the decrease observed in the hardnmeasurements. This apparent correlation betweenchanges ofa andH is more evident in Fig. 9, in which weplot the values of hardness versus the samples’s thermalfusivity. The solid line in Fig. 9 represents the result of dalinear regression.
The above correlation betweena andH is not as surpris-ing as it may look at a first glance. The thermal diffusivimeasures essentially the thermalization time withinsample and, like the optical absorption coefficient, itunique for each material. This can be appreciated fromtabulated values ofa presented by Touloukianet al.24 for a
ore
FIG. 10. Thermal conductivity, as obtained from the measured values othermal diffusivity, specific heat, and mass density, as a function ofNd2O3 content. The solid curve represents the theoretical curve obtafrom the fitted expressions fora, r, andc.
IP license or copyright, see http://ojps.aip.org/japo/japcr.jsp

hysical
8117J. Appl. Phys., Vol. 85, No. 12, 15 June 1999 Baesso et al.
Downloaded 12 Oc
TABLE II. Comparison of the physical parameters of our base composition calcium aluminosilicate~CA! glass,as reported in the present work, with those of some common optical quality glasses. The values of the pparameters for the common optical glasses quoted above were taken from Ref. 27.
Glassr
~g/cm3!c
~J/gK!k
~mW/cm K!a
~cm2/s!Tg
~K!H
~kg/mm2! nD
CA 2.93 0.929 15.48 0.0057 1114 865a 1.6555BK-7 2.51 0.858 11.14 0.0052 836 520b 1.5168Pyrex 2.23 1.05 11.3 0.0048 560 481b 1.474Fused silica 2.20 0.746 13.8 0.0084 1273 635b 1.4586
aVickers hardness value.bKnoop hardness value.
ityni-hnar,t oo
ngd
es.nthubp
o
re
rdp
r
r tinrin
at
ecansn
du
re-lhepteal
ion,thegly
Thismssis
veess,
ion
q,is
n-
, L.
da,
wide range of materials. Furthermore, the thermal diffusivis extremely dependent upon the effects of compositioand microstructural variables25 as well as processing condtions. In a previous work26 on silicate glasses doped witFe2O3, we have shown that there are two distinct situatioin which the doping controls the behavior of the thermdiffusivity. When the Fe31 ions behave as a network formethe sample thermal diffusivity becomes greater than thathe undoped sample, while when they behave as a netwmodifier the thermal diffusivity decreases with increasidoping concentration. Thus, the decrease of the thermalfusivity with increasing Nd2O3 concentration shown in Fig. 7may be explained as resulting from the network modificharacter of the Nd31 ions in our calcium aluminate glasseThe decrease in the network connectivity due to the preseof rare-earth ions induces additional thermal barriers inglass structure, thereby decreasing the heat diffusion throthe sample. This explanation is also consistent with thehavior of the sample hardness, and is reflected in the apently good correlation we have found betweena and Hshown in Fig. 9. Finally, in Fig. 10, we show the behaviorthe thermal conductivityk as a function of the Nd2O3 con-tent. The thermal conductivity data shown in Fig. 10 wecalculated from the measured values ofa, r, andc, namely,k5arc. The dependence ofk on the Nd2O3 content followsclosely those we have found fora and H. In fact, all threeparameters exhibited a decrease of roughly the same onamely 8%, between the undoped and the 5% doped samThe solid line in Fig. 10 represents the theoretical curve fokobtained using the fitted expressions fora, r, and c. Thisresult suggests that the logistic behavior we have used fodescription of the different data dependence on the dopconcentration is, indeed, a reasonable assumption. Theson for this is that this curve describes processes involvthe transition from an initial state into a final saturation stin a smooth continuous manner.
To conclude, we present in Table II a comparison btween the thermal properties of our base compositioncium aluminosilicate~CA! glass with those of some commooptical quality glasses. For instance, as compared with fusilica, our calcium aluminosilicate exhibits a 33% larger desity, 36% larger hardness, and a 12% larger thermal contivity.
t 2001 to 143.107.228.173. Redistribution subject to A
al
sl
frk
if-
r
ceeghe-ar-
f
er,le.
heg
ea-g
e
-l-
ed-c-
CONCLUSION
In this paper we have investigated the effects of theplacement of Al2O3 by Nd2O3 on the thermomechanicaproperties of low silica calcium aluminosilicate glasses. Tmaximum Nd2O3 that our base composition would accewithout devitrification was found to be 5 wt %. The influencof the rare-earth doping on the thermal diffusivity, thermconductivity, and hardness, all pointed in the same directnamely, a decrease of roughly 8% as we move fromundoped to the 5 wt % doped sample. This result stronsupports the idea that the Nd32 ions act as network modifi-ers, similar to the cases reported for other oxide glasses.explanation for the role played by the rare-earth ions seeto be further supported by complementary thermal analymeasurements on our samples in which a decrease ofTg wasobserved with increasing doping concentration. We haalso found that the observed change of the sample hardnas a function of the Nd2O3 content, is linearly correlated withthe changes of the thermal diffusivity, the glass transittemperature, and the sample mass density.
ACKNOWLEDGMENTS
The authors are grateful to Brazilian Agencies CNPCAPES and FAPESP for partial financial support of thwork.
1E. S. Shepherd, G. A. Rankin, and F. E. Wright, Am. J. Sci.28, 293~1909!.
2J. M. Florence, F. W. Glae, and M. H. Black, J. Res. Natl. Bur. Stand.55,231 ~1955!.
3H. C. Hafner, N. J. Kreidl, and R. A. Weidel, J. Am. Ceram. Soc.41, 315~1958!.
4G. Y. Onoda, Jr. and S. D. Brown, J. Am. Ceram. Soc.53, 311 ~1970!.5J. E. Shelby, J. Am. Ceram. Soc.68, 155 ~1985!.6P. L. Higby, R. J. Ginther, I. D. Aggarwal, and E. J. Friebele, J. NoCryst. Solids126, 209 ~1990!.
7W. A. King and J. E. Shelby, Phys. Chem. Glasses37, 1 ~1996!.8S. Tanabe, T. Ohyagi, T. Hanada, and N. Soga, J. Ceram. Soc. Jpn.101,78 ~1993!.
9K. Hirao, S. Todoroki, and N. Soga, Soc. Espan. Ceram. Vid.81C, 121~1992!.
10M. J. Weber, J. Non-Cryst. Solids123, 208 ~1990!.11M. L. Baesso, A. C. Bento, A. A. Andrade, J. A. Sampaio, E. Pecoraro
A. O. Nunes, T. Catunda, and S. Gama, Phys. Rev. B57, 10545~1998!.12M. L. Baesso, A. C. Bento, A. A. Andrade, J. A. Sampaio, T. Catun
and S. Gama, J. Non-Cryst. Solids219, 139 ~1997!.13W. J. Chung, J. R. Yoo, Y. S. Kim, and J. Heo, J. Am. Ceram. Soc.80,
1485 ~1997!.
IP license or copyright, see http://ojps.aip.org/japo/japcr.jsp
i,
r,
as,
8118 J. Appl. Phys., Vol. 85, No. 12, 15 June 1999 Baesso et al.
14E. V. Uhlmann, M. C. Weinberg, N. J. Kreidl, L. L. Burgner, R. Zanonand K. H. Church, J. Non-Cryst. Solids178, 15 ~1994!.
15X. L. Zou and T. Izumitani, Nippon Ceram. Kyo Gak101, 99 ~1993!.16J. T. Kohli and J. E. Shelby, Phys. Chem. Glasses32, 67 ~1991!.17J. E. Shelby and J. T. Kohli, J. Am. Ceram. Soc.73, 39 ~1990!.18M. L. Baesso, J. Shen, and R. D. Snook, Chem. Phys. Lett.195, 255
~1992!.19M. L. Baesso, J. Shen, and R. D. Snook, J. Appl. Phys.75, 3232~1994!.20C. Oprea, D. Togan, and C. Popescu, Thermochim. Acta194, 165~1992!.21L. Lucas, M. Chanthanasinh, M. Pouain, P. Brun, and M. J. Webe
Non-Cryst. Solids27, 273 ~1978!.
Downloaded 12 Oct 2001 to 143.107.228.173. Redistribution subject to A
J.
22S. K. Chopra and C. A. Tanera, J. Appl. Chem.15, 157 ~1965!.23J. E. Shelby, C. M. Shaw, and M. S. Spess, J. Appl. Phys.66, 1149
~1989!.24Y. S. Touloukian, R. W. Powell, Y. C. Ho, and M. C. Nocalasu,Thermal
Diffusivity ~Plenum, New York, 1973!.25G. Ziegler and D. P. H. Hasselman, J. Mater. Sci.16, 495 ~1981!.26A. M. Mansanares, M. L. Baesso, E. C. Silva, F. C. G. Gandra, H. Varg
and L. C. M. Miranda, Phys. Rev. B40, 7912~1989!.27W. J. Tropf, M. E. Thomas, and T. J. Harris, inHandbook of Optics,
edited by M. Bass~McGraw–Hill, New York, 1995!, Vol. II, p. 33.
IP license or copyright, see http://ojps.aip.org/japo/japcr.jsp
Copyright © 2022 FDOKUMEN