Aqueous corrosion behaviour of Fe–Ni–B metal glasses
17
Accepted Manuscript Title: Aqueous Corrosion Behaviour of Fe-Ni-B Metal Glasses Authors: A. Lekatou, A. Marinou, P. Patsalas, M.A. Karakassides PII: S0925-8388(08)01954-3 DOI: doi:10.1016/j.jallcom.2008.07.217 Reference: JALCOM 18896 To appear in: Journal of Alloys and Compounds Received date: 30-8-2007 Revised date: 2-7-2008 Accepted date: 22-7-2008 Please cite this article as: A. Lekatou, A. Marinou, P. Patsalas, M.A. Karakassides, Aqueous Corrosion Behaviour of Fe-Ni-B Metal Glasses, Journal of Alloys and Compounds (2008), doi:10.1016/j.jallcom.2008.07.217 This is a PDF file of an unedited manuscript that has been accepted for publication. As a service to our customers we are providing this early version of the manuscript. The manuscript will undergo copyediting, typesetting, and review of the resulting proof before it is published in its final form. Please note that during the production process errors may be discovered which could affect the content, and all legal disclaimers that apply to the journal pertain.
Transcript of Aqueous corrosion behaviour of Fe–Ni–B metal glasses
Accepted Manuscript
Title: Aqueous Corrosion Behaviour of Fe-Ni-B Metal Glasses
Authors: A. Lekatou, A. Marinou, P. Patsalas, M.A.Karakassides
PII: S0925-8388(08)01954-3DOI: doi:10.1016/j.jallcom.2008.07.217Reference: JALCOM 18896
To appear in: Journal of Alloys and Compounds
Received date: 30-8-2007Revised date: 2-7-2008Accepted date: 22-7-2008
Please cite this article as: A. Lekatou, A. Marinou, P. Patsalas, M.A. Karakassides,Aqueous Corrosion Behaviour of Fe-Ni-B Metal Glasses, Journal of Alloys andCompounds (2008), doi:10.1016/j.jallcom.2008.07.217
This is a PDF file of an unedited manuscript that has been accepted for publication.As a service to our customers we are providing this early version of the manuscript.The manuscript will undergo copyediting, typesetting, and review of the resulting proofbefore it is published in its final form. Please note that during the production processerrors may be discovered which could affect the content, and all legal disclaimers thatapply to the journal pertain.
Page 1 of 16
Accep
ted
Man
uscr
ipt
1
Aqueous Corrosion Behaviour of Fe-Ni-B Metal Glasses
A. Lekatou*, A. Marinou, P. Patsalas, M.A. Karakassides
University of Ioannina, Department of Materials Science and Engineering, Ioannina 45110, Greece
* Corresponding author: Tel.: +30 26510 97309; fax: +30 26510 97034.
E-mail address: [email protected]
Abstract
The corrosion performance of Fe-40Ni-20B (% at) amorphous ribbons in 7N NaOH and 3.5%
NaCl, at 25oC, is investigated by potentiodynamic polarization, chronoamperometry and Raman
spectroscopy. Immersion in 7N NaOH induces a multiple stage passivation, which is associated with
the successive formation of (Ni,Fe) compounds based on Fe3O4, Ni(OH)2 / NiO, FeOOH / Fe2O3,
Ni(OH)2.2NiOOH and βNiOOH. Fe3O4, NiO, Fe2O3 and βNiOOH are responsible for true passivity.
Although carbonate ions from the environment have penetrated the passive film, the glass is not
susceptible to pitting in 7N NaOH. Despite amorphicity, the glass behaviour in 7N NaOH is governed
by the behaviour of its crystalline metallic constituents. The alloy exhibits a slight susceptibility to
localized corrosion, in 3.5% NaCl.
Keywords: A. Metallic glasses; C. Corrosion; C. Passivity; D. Raman spectroscopy; D. Electrochemical
testing
1. Introduction
Metallic glasses are rapidly quenched alloys with metals as the main constituents. Metalloid
elements (B, C, P, Si) are indispensable components of the metallic glasses, as they largely contribute
to the amorphous phase formation [1]. The Fe-Ni-B glasses are promising materials for various
industrial applications, since they combine interesting properties with low material cost [1,2]. As such,
the subject of their corrosion resistance is of great importance.
Amorphous alloys are expected to have higher corrosion resistance than their metallic
constituents, since they have no grain boundaries, segregates or crystalline defects that may act as
Page 2 of 16
Accep
ted
Man
uscr
ipt
2
corrosion initiation sites. For example, bulk amorphous Ni-Nb-Ta-P alloys exhibited spontaneous
passivity and immunity to pitting, even in 12M HCl [3]. Fe-Ni-Cr-W amorphous sputter deposited alloys
showed excellent pitting resistance to neutral and acidic solutions, which was preserved after
crystallization heat treatment [4]. Mg-Ni-Nd glasses presented low corrosion rates in 0.01M NaCl, due
to NiO and Nd2O3 incorporation in the passive film [5]. Gerbert et al [6] attributed the improved
corrosion properties of amorphous Mg65Cu25Y10 in a highly alkaline electrolyte to the formation of a
homogeneous and dense surface film. Magrini et Matteazzi [7] reported that the corrosion resistance
of amorphous Fe-Ni-Mo-B alloys is enhanced with Ni content, due to an increase in the alloy disorder.
Metalloid elements influence the corrosion behaviour of metal glasses: The corrosion resistance of
amorphous Fe-Cr alloys progressively increased in the order Si, B, C and P, in 0.1N H2SO4, and in the
order B, Si, C, P, in 3% NaCl [8].
The present work is part of a wider study aiming at determining whether Fe-Ni-B glasses have
satisfactory corrosion properties and elucidating on the corrosion mechanisms, in alkaline, neutral and
acid environments.
2. Experimental
Fe-40Ni-20B (% at) ribbons were manufactured by melt-spinning. Rectangular ribbon coupons
were subjected to electrochemical testing in a three electrode corrosion cell (reference electrode:
Ag/AgCl (3.5M KCl), counter electrode: Pt). They were ultrasonically cleaned and encapsulated in
PTFE, leaving a surface area of ~50mm2, to be exposed to aerated 7N NaOH (pH=12.1) and 3.5%
NaCl (pH=6.5), at room temperature. Cyclic potentiodynamic polarization tests (scan rate:10 mV/min)
and potentiostatic polarization tests were performed using the potentiostat/galvanostat GILL AC
(ACM Instruments). The nature of the corrosion products was investigated by Raman spectroscopy
(RM 1000 RENISHAW).
3. Results and discussion
A detailed characterization of the glass by EDS, Auger electron spectroscopy and XRD has
previously been reported [9].
Page 3 of 16
Accep
ted
Man
uscr
ipt
3
3.1. Electrochemical testing
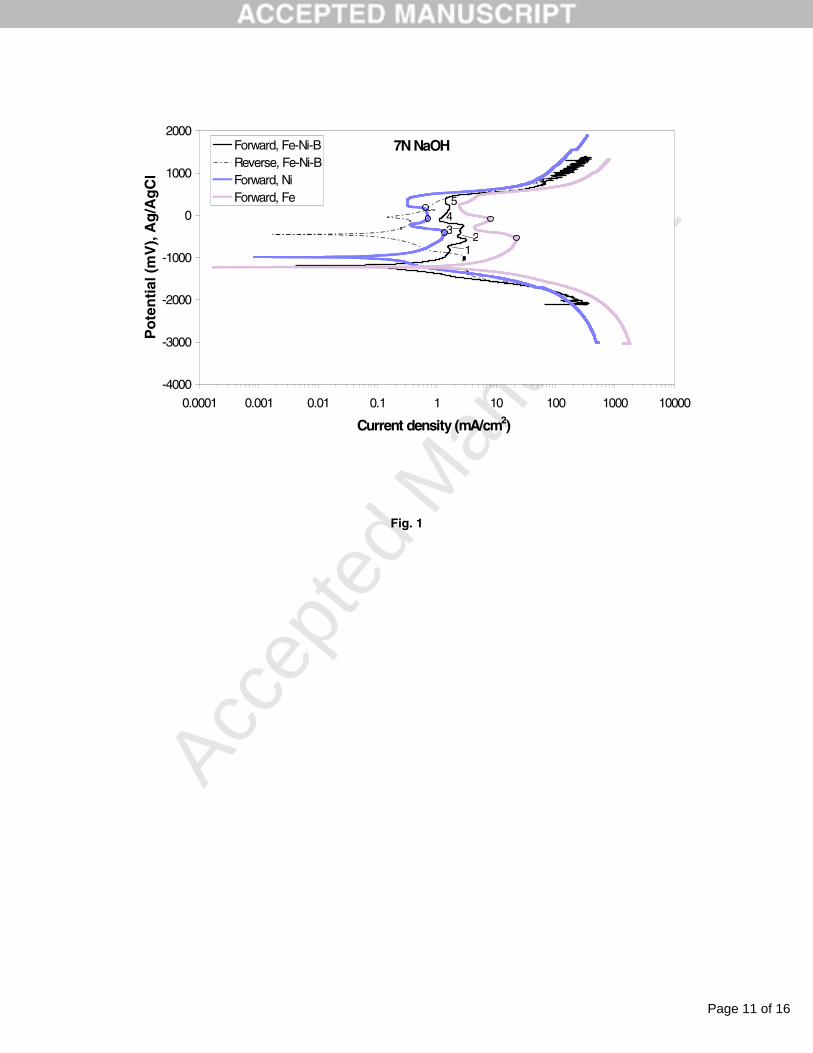
Fig. 1 illustrates the polarization behaviour of Fe-40Ni-20B in 7N NaOH (25oC). A multiple
stage passivity in a wide range of potentials is observed. The large passive current densities indicate
pseudopassive behaviour. The positive hysteresis of the reverse scan (“reverse” current densities
lower than “forward” ones) shows that the alkaline electrolyte does not cause localized corrosion. (It is
well known that caustic solutions do not promote pitting in crystalline alloys. However, cyclic
polarization in aqueous NaOH was carried out, since it was observed (see 3.2) that the passive film
had been penetrated by carbonate ions, which are very aggressive.) In an attempt to clarify the
processes causing multiple stage passivation in the caustic solution, potentiodynamic polarization
tests on pure Ni and Fe were conducted. The respective voltammograms are also included in Fig. 1.
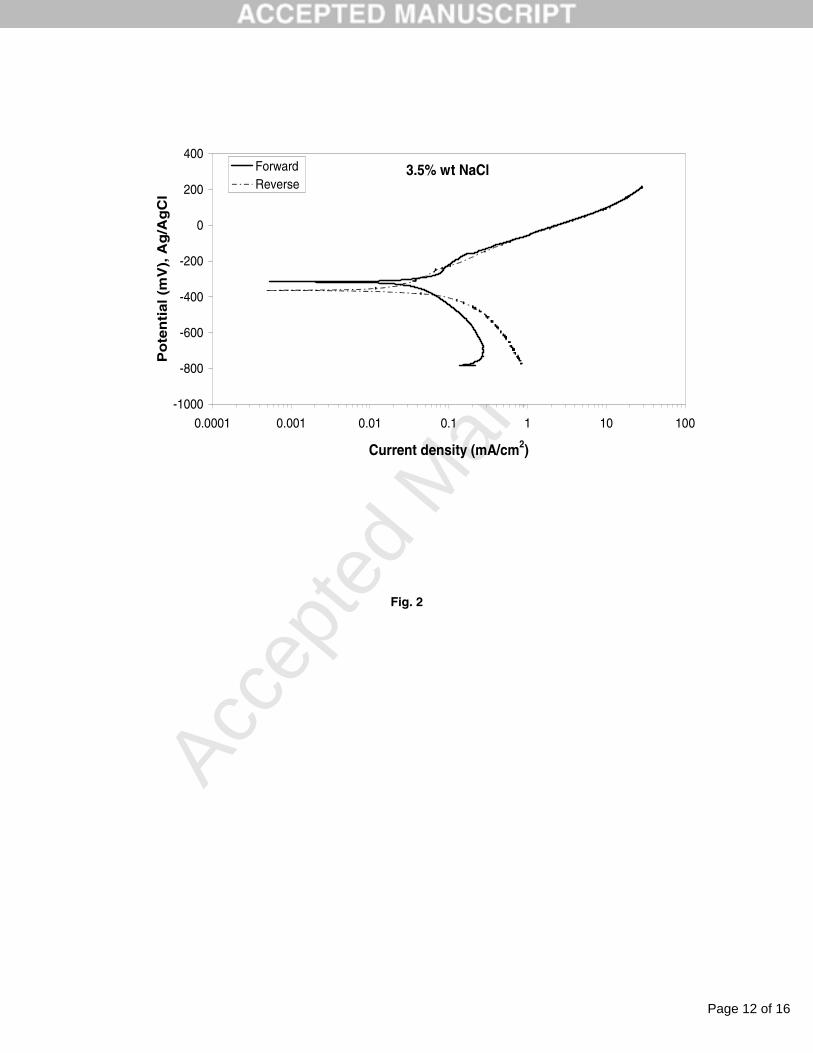
Fig. 2 presents the polarization behaviour of Fe-40Ni-20B in 3.5% NaCl (25oC). The alloy
shows a small susceptibility to pit corrosion, as the slightly higher currents during reverse scanning
suggest. The corrosion potential in 3.5% NaCl (-320 mV vs. Ag/AgCl) is much lower than the corrosion
potential in 7N NaOH (-1160 mV vs. Ag/AgCl). This shows that, from a thermodynamic standpoint, the
alloy is nobler in the saline solution. On the other hand, the high reactivity of the glass in the alkaline
electrolyte is responsible for its passivity.
Passivity in 7N NaOH is further investigated by potentiostatic polarization (Fig. 3). Although,
more analytical discussion on the characteristics of the i-t curves will follow in context with the results
of Raman spectroscopy (section 3.3), some important observations can be reported in this section: (i)
The i-t curve at an active potential shows that the current density initially increases with time, as a
result of active dissolution of the alloy; then, current density very slowly decreases with time,
suggesting deposition of corrosion products on the alloy surface and/or reduction of the available
surface for corrosion. (ii) The i-t curves at higher overpotentials present notably fluctuating transients:
Sharp decreases in current (as a function of time) suggest formation and growth of a film consisting of
oxidized compounds; sharp increases in current suggest film dissolution. (iii) The i-t curve morphology
appears quite different after polarization at -770 V, -50 V and 0 V: Current densities are lower than the
‘active’ ones indicating a truly passive state; absence of fluctuation or low fluctuation of current density
Page 4 of 16
Accep
ted
Man
uscr
ipt
4
vs. time also supports true passivity; long stabilization trends of current vs. time indicate that the
passive film has attained constant thickness.
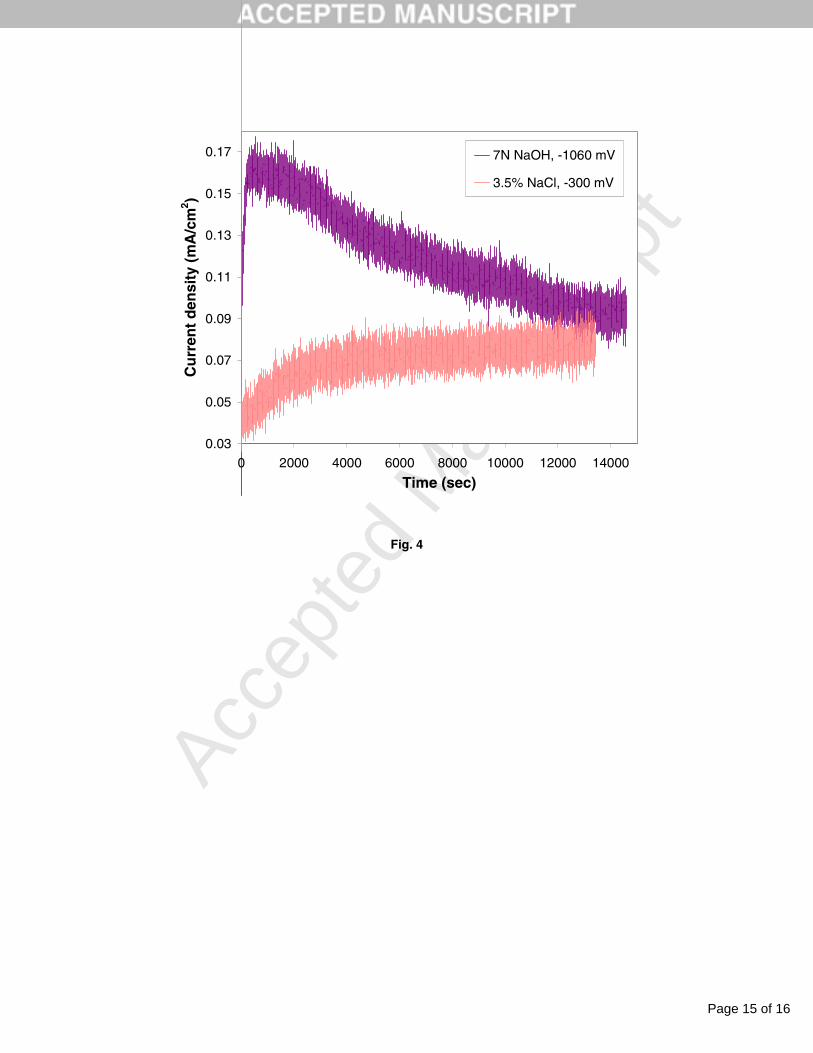
Fig. 4 includes chronoamperometry plots at active potentials, for specimens immersed in 7N
NaOH and 3.5% NaCl. Initially, in both electrolytes, the current density sharply increases, due to
active species dissolution; however, the much faster current increase in 7N NaOH demonstrates the
much higher reactivity of the glass in this electrolyte. Then, in 7N NaOH, the current density smoothly
decreases due to surface depositions. The eventual stabilization trend suggests that equilibrium has
been attained, where dissolution and formation rates equalize. In contrast, in 3.5% NaCl, current
keeps on increasing with time, at a deminishing rate though. The latter also shows formation of
corrosion products and/or reduction of the available surface for corrosion, though at a much lower rate
than that in 7N NaOH.
3.2. Nature of corrosion products
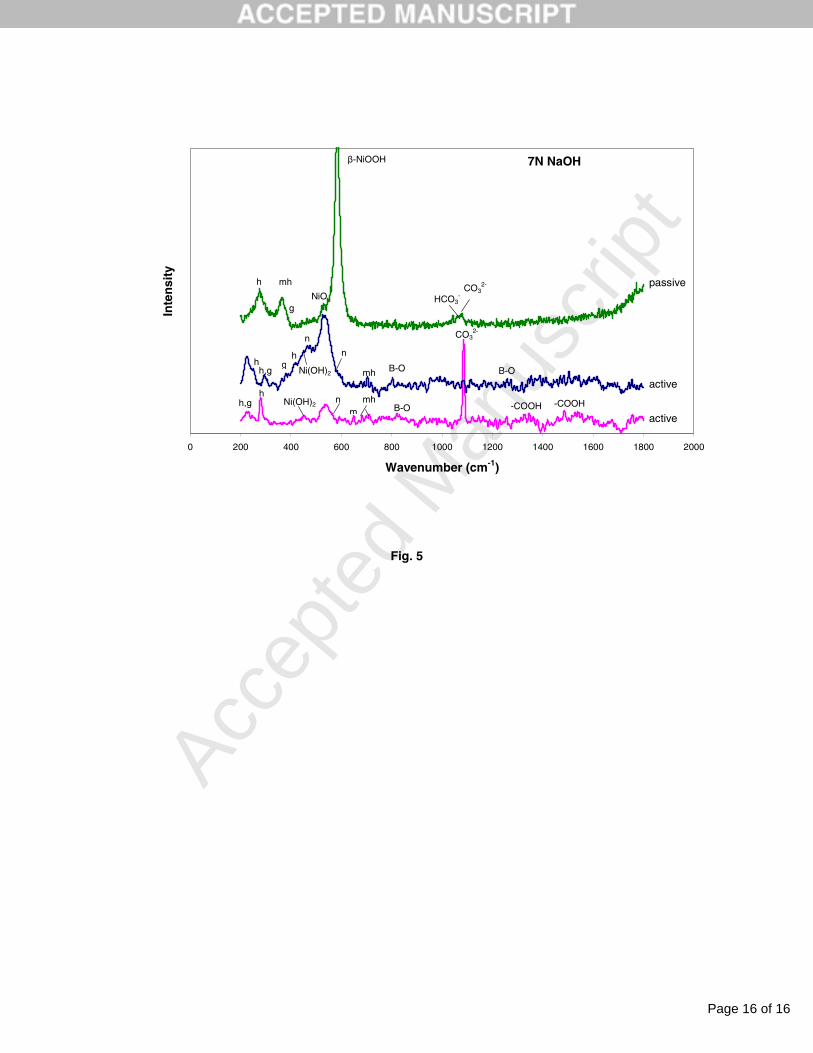
Fig. 5 includes typical Raman spectra of active and “passive” (fifth passive stage) corrosion
products after potensiostatic polarization in 7N NaOH (25oC). In the majority of spectra, regardless of
corrosion state, the two strongest bands correspond to the wavenumbers 536-571 cm-1 (higher
intensity) and 445-473 cm-1 (lower intensity). These bands characterize nickel oxides and hydroxides
(NiO, Ni(OH)2, NiOOH); the lower wavenumber band generates from the Ni-OH stretching vibration,
whilst the higher wavenumber band generates from the Ni-O stretching vibration [10,11]. Various small
peaks in the range 220-720 cm-1, are assigned to iron oxides/hydroxides (α-Fe2O3, γ-Fe2O3, Fe3O4, α-
FeOOH) [12].
The possibility of formation of mixed (Ni,Fe) compounds is strong, as implied by the
simultaneous presence of bands generated from iron and nickel oxides/hydroxides and by the fact
that the Fe-Ni system thermodynamically approaches an ideal solid solution. Indeed, previous works
have shown that exposure of Fe-Ni alloys to caustic and H2SO4 solutions leads to the formation of
passive bi-layered films. The outer layer consists of (Ni,Fe) hydroxides. The inner layer mainly
consists of anhydrous oxides [13,14].
Often, Raman spectra from specimens polarized at active potentials have poorly-defined peaks,
evidence of depositions of very low thickness. Active corrosion products in 7N NaOH are dominated
Page 5 of 16
Accep
ted
Man
uscr
ipt
5
by NiO, αNi(OH)2 and Ni(OH)2.NiOOH, probably incorporating iron in solid solution with nickel. NiO
and αNi(OH)2 are formed at the early oxidation stages of Ni [15]. αNi(OH)2 is amorphous, hydrated and
non-stoichiometric [16].
The participation of NiO and Fe2O3 in the oxidation products indicates that passivation is
caused by the NiO/Fe2O3 inner layer. NiO is generally accepted as a p-type semiconductor and should
have a barrier character [13]. Another compound that should favour passivity is β-NiOOH. β-NiOOH
predominates over the passive corrosion products, in the final passive stage, whereas Ni(OH)2 is
absent. Therefore, Ni oxidation has progressed up to the Ni3+ state. β-NiOOH is the most stable Ni-
hydroxide [17]. The (Ni,Fe)(OH)2 layer does not contribute much to passivity, due to its low thickness
(few monolayers) in all types of electrolytes [13,17]. (It should be noted that the structure of the
passivating layers is complex and highly non-stoichiometric. Therefore, the fore-mentioned chemical
formulae are simplified forms of much more complex -perhaps polymeric- structures.)
Weak bands at 805-820 cm-1, 1210 and 1260 cm-1, are assigned to vibrations of boroxol rings
[18,19]. In this work, boron has been found to participate in both passive and active corrosion products.
Boron has been reported to be present in the passive film of Ni-metallic glasses as borate. It is
considered to negatively affect passivity, by hindering NiO formation in Ni-glasses [20]. Whether its
contribution to the corrosion behaviour of the studied glasses is important, is a matter of a future
investigation.
Intense peaks in the range 1044-1074 cm-1 are ascribed to the stretching vibrations of CO32-[21].
The peak at 1004 cm-1 is assigned to the stretching vibrations of HCO3-. The presence of carbonate
ions makes corrosion attack even more severe, due to the easy penetration of the hydroxide films by
carbonate ions and subsequent formation of carbonate salts. The latter are readily accommodated in
the (Ni,Fe)-hydroxide structure.
Bands in the range 1340-1440 cm-1 and 1550-1650 cm-1 are typical of the carboxylate ion (–
COO(H)), corresponding to the antisymmetric and symmetric stretching vibrations of the –COO– group,
respectively [22].
3.3. Passivity in 7N NaOH
Page 6 of 16
Accep
ted
Man
uscr
ipt
6
The less noble nature of Fe compared to Ni and the higher concentration of iron over nickel at
the ribbon surface [9] indicate that iron oxidation precedes nickel oxidation. The five current limiting
zones during forward polarization (Fig. 1), suggest a passivation mechanism progressing via distinct
stages. These stages relate to the succession of oxidation reactions in the systems Ni-H2O, Fe-H2O
and Fe-Ni-H2O. In Fig. 1, the Ni anodic voltammogram shows three current peaks, each one denoting
the onset of a passivating process. According to the Pourbaix diagram [23], for pH=12, these peaks
correspond to the successive formation of Ni(OH)2 (NiO.H2O), Ni(OH)2.2NiOOH (NiO.Ni2O3.2H2O) and
βNiOOH (Ni2O3.H2O). Similarly, the Fe voltammogram shows two current peaks, which correspond to
the successive formation of Fe(OH)2.2FeOOH (Fe3O4.2H2O) and Fe(OH)3 (Fe2O3.3H2O or
FeOOH.H2O). Therefore, based on the Pourbaix diagrams, the polarization tests on Ni and Fe in 7N
NaOH and relevant literature [15,24,25], it is possible to ascribe the passive/pseudopassive regions
in the anodic curve of Fe-40Ni-20B (Fig. 1), to the growth of the following current limiting depositions:
Stage 1: Fe(OH)2.2FeOOH and Fe3O4
Stage 2: Ni(OH)2 and NiO
Stage 3: FeOOH and Fe2O3
Stage 4: Ni(OH)2.2NiOOH and NiO.Ni2O3
Stage 5: βNiOOH and Ni2O3
(The above formulae are simplified forms of much more complex compounds generated from a
series of complicated oxidation reactions.)
The chronoamperometry plots in Fig. 3 support the above succession: Current densities at the
lower critical passivation potential (-770 mV : active→passive stage 1) are smaller than the active
current densities, reflecting a transpassive state towards true passivity; the latter is attained by the
formation of a Fe3O4–based layer. At the second transpassive stage (-500 mV: passive 1→passive 2),
the current initially increases with time, due to Fe3O4 oxidation. The sharp current fall after ~8600 s
corresponds to Ni(OH)2 and NiO formation. The high current values are owing to the unstable nature
of αNi(OH)2. The exponential decrease in current, at a potential in the beginning of the third passive
stage (-350 mV), suggests passive film formation; the high currents though, indicate pseudopassivity.
The third passive stage has been ascribed to the formation of FeOOH and Fe2O3. Fe2O3 induces
passivity. The high currents probably originate from αNi(OH)2 (in solid solution with Fe(OH)2), which is
heavily hydrated. The i-t curve in the third transpassive stage (-200 mV: passive 3→passive 4) is
Page 7 of 16
Accep
ted
Man
uscr
ipt
7
characterized by an initially increasing current versus time, caused by Ni(OH)2 dissolution. The large
decrease in current after ~5000 s is attributed to the formation of Ni(OH)2.2NiOOH or NiO.Ni2O3. The
chronoamperometry plots at the fourth passivation stage (-50 mV, 0 mV) are typical of a true passive
state, corresponding to the built-up of Ni(OH)2.2NiOOH/NiO.Ni2O3. In particular, true passivity is
mostly credited to compounds based on mixed (Ni,Fe) oxides. The Ni(OH)2.2NiOOH species may also
contribute to true passivity, since their dissolution rate is about half of that of Ni(OH)2 (though, in acidic
electrolytes) [26]. The i-t curve at a potential close to the breakaway potential (365 mV: 5th passive
stage) presents the general trend of passivation. However, the oscillating zones and the high values of
current density are due to the transpassive dissolution of the passive layers. The final transpassive
dissolution probably occurs by the hydroxidation of the passivity inducing oxides.
3.4. Effect of amorphicity on the corrosion behaviour
The homogeneous single glass phase (free of localized defects) would be expected to allow the
growth of a uniform protective film. Of course, the alloy chemistry is also a principal factor for
passivation; both, iron and nickel are passivity inducing metals. A third controlling factor for metal
glass passivation, is the presence of metalloids, which may accelerate active alloy dissolution causing
rapid formation of a passive film [8].
In this work, the second factor appears to be the dominating parameter in the corrosion
performance of the Fe-Ni-B glass. This is seen in Fig. 1: The anodic curve shapes of Fe-Ni-B, Ni and
Fe appear too similar. The passive current density values follow the order Ni<Fe-Ni-B<Fe; the
corrosion potential values follow the order Ni>Fe-Ni-B>Fe. The above sequences are expected for a
crystalline Fe-Ni alloy. However, the passive range of potentials in Fe-Ni-B appears somewhat greater
than the passive range in Ni and Fe (to about 200-300 mV). This can be attributed to the glassy state.
As metastable materials, metallic glasses have greater reactivity than their crystalline analogues. This
reactivity can lead to the rapid formation of a uniform surface film.
4. Conclusions
Page 8 of 16
Accep
ted
Man
uscr
ipt
8
The main conclusions drawn from investigating the behaviour of amorphous Fe-40Ni-20B (% at)
ribbons in aerated 7N NaOH and 3.5% NaCl, at 25oC, are:
1. Immersion in 7N NaOH induces multiple stage passivation, associated with the consecutive
formation of compounds based on Fe(OH)2.2FeOOH and Fe3O4, Ni(OH)2 and NiO, FeOOH and
Fe2O3, Ni(OH)2.2NiOOH, βNiOOH.
2. The main corrosion products are (Ni,Fe) oxides and hydroxides. The main active corrosion
products are based on αNi(OH)2, NiO and Ni(OH)2.2NiOOH. The main passive corrosion products
are based on NiO and βNiOOH. Fe2O3, Fe3O4 and αFeOOH are also among the active and
passive corrosion depositions. Fe3O4, NiO, Fe2O3 and βNiOOH are responsible for true passivity.
3. The glass is not susceptible to pitting in 7N NaOH, despite the incorporation of carbonate ions
from the environment in its passive film. The glass is slightly susceptible to pitting in 3.5% NaCl.
4. Boron participates in the oxidized compounds, but its role in the corrosion mechanism has not
been clarified in this investigation.
5. Despite amorphicity, the corrosion behaviour of the glass in the caustic solution follows the
behaviour of its crystalline metallic constituents. However, a greater range of passive potentials is
attained during glass polarization, as compared to pure Ni and Fe.
Acknowledgements
To Prof. A.R. Yavari for providing the glass ribbons.
References
[1] Y. Waseda, K.T. Aust, J. Mater. Sci. 16 (1981) 2337-2359.
[2] A.R. Yavari, W.J. Botta Filho, C.A.D. Rodrigues, A.L. Greer, J.L. Uriarte, G. Huenen, G.
Vaughan, A. Inoue, J. Non-Cryst. Solids 304 (2002) 44-50.
[3] A. Kawashima, H. Habazaki, K. Hashimoto, Mater. Sci. Eng. A304-306 (2001) 753-757.
[4] Rong Wang, J. Non-Cryst. Solids 61&62 (1984) 613-618.
[5] H.B. Yao, Y. Li, A.T.S. Wee, Electrochim. Acta 48 (2003) 2641-2650.
[6] A. Gebert, U. Wolff, A. John, J. Eckert, L. Schultz, Mater. Sci. Eng. A299 (2001) 125-135.
Page 9 of 16
Accep
ted
Man
uscr
ipt
9
[7] M. Magrini, P. Matteazzi, Mater. Chem. Phys. 13 (1985) 71-83.
[8] M. Naka, K. Hashimoto, T. Masumoto, J. Non-Cryst. Solids 28 (1978) 403-413.
[9] P. Patsalas, A. Lekatou, E. Pavlidou, S. Foulias, M. Kamaratos, G.A. Evangelakis, A.R.
Yavari, J. Alloys and Compounds 434-435 (2007) 229-233.
[10] Yi Ling Lo, Bing Joe Hwang, Langmuir 14 (1998) 944-950.
[11] Dongning Yang, Rongming Wang, Maoshuai He, Jin Zhang, Zhongfan Liu, J. Phys. Chem.
B109 (2005) 7654-7658.
[12] M.A. Legodi, D. de Waal, Dyes and Pigments 74 (2007) 161-168.
[13] H.-W. Hoppe, H.-H. Strehblow, Corros. Sci. 31 (1990) 167-177.
[14] F. Basile, J. Bergner, C. Bombart, B. Rondot, P. Le Guevel, G. Lorang, Surf. Interface Anal.
30 (2000) 154-157.
[15] B.M. Biwer, M.J. Pellin, M.W. Schauer, D.M. Gruen, Surf. Interface Anal. 14 (1989) 635-646.
[16] P. Oliva, J. Leonardi, J.F. Laurent, C. Delmas, J.J. Braconnier, M. Figlarz, F. Fievet, A. de
Guibert, J. Power Sources 8 (1982) 229-255.
[17] R.S. Schrebler Guzmán, J.R. Vilche, , A.J. Arvίa, Corros. Sci. 18 (1978) 765-778.
[18] A.K. Hassan, L.M. Torell, L. Börjesson, H. Doweidar, Phys. Rev. B 45 (1992) 12797-12805.
[19] Hong-Zhang Zhuang, Xian-Wu Zou, Zhun-Zhi Jin, De-Cheng Tian, Phys. Rev. B 52 (1995)
829-832.
[20] M. Mitov, R. Todorova, St. Manev, A. Popov, J. Mater. Sci. Lett. 16(1997) 1712-1715.
[21] S. Simard, M. Odziemkowski, D.E. Irish, L. Brossard, H. Ménard, J. Appl. Electrochem. 31
(2001) 913-920.
[22] H. Jeziorowski, B. Moser, Mikrochimica Acta II /1-2 (1984) 97-102.
[23] M. Pourbaix, Atlas of Electrochemical Equilibria in Aqueous Solutions, NACE, Houston TX,
1974.
[24] M. Vucović, Corros. Sci 37 (1995) 111-120.
[25] S.T. Amaral, I.L. Müller, J. Braz. Chem. Soc. 10 (1999) 214-221.
[26] S.G. Real, J.R. Vilche, A.J. Arvίa, Corros. Sci. 20 (1980) 563-586.
Page 10 of 16
Accep
ted
Man
uscr
ipt
10
Figure captions
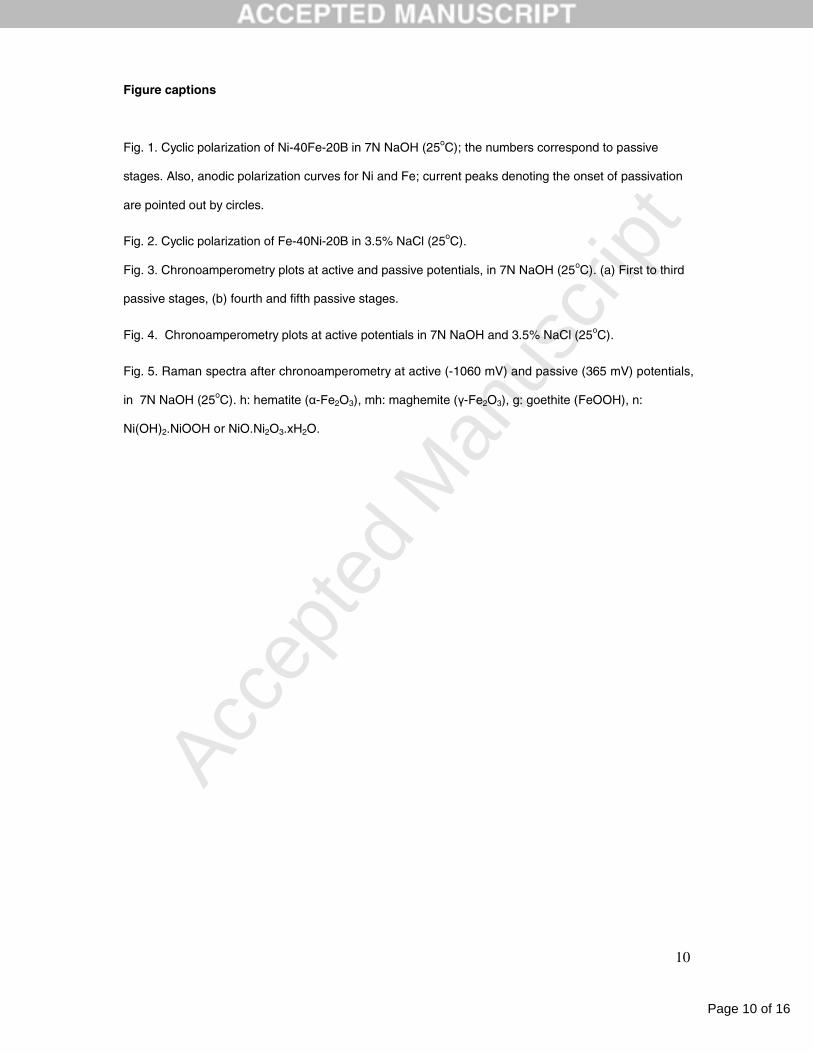
Fig. 1. Cyclic polarization of Ni-40Fe-20B in 7N NaOH (25oC); the numbers correspond to passive
stages. Also, anodic polarization curves for Ni and Fe; current peaks denoting the onset of passivation
are pointed out by circles.
Fig. 2. Cyclic polarization of Fe-40Ni-20B in 3.5% NaCl (25oC).
Fig. 3. Chronoamperometry plots at active and passive potentials, in 7N NaOH (25oC). (a) First to third
passive stages, (b) fourth and fifth passive stages.
Fig. 4. Chronoamperometry plots at active potentials in 7N NaOH and 3.5% NaCl (25oC).
Fig. 5. Raman spectra after chronoamperometry at active (-1060 mV) and passive (365 mV) potentials,
in 7N NaOH (25oC). h: hematite (α-Fe2O3), mh: maghemite (γ-Fe2O3), g: goethite (FeOOH), n:
Ni(OH)2.NiOOH or NiO.Ni2O3.xH2O.
Page 11 of 16
Accep
ted
Man
uscr
ipt
Fig. 1
7N NaOH
-4000
-3000
-2000
-1000
0
1000
2000
0.0001 0.001 0.01 0.1 1 10 100 1000 10000
Current density (mA/cm2)
Po
ten
tial
(m
V),
Ag
/Ag
Cl
Forward, Fe-Ni-BReverse, Fe-Ni-BForward, NiForward, Fe
21
345
Page 12 of 16
Accep
ted
Man
uscr
ipt
Fig. 2
3.5% wt NaCl
-1000
-800
-600
-400
-200
0
200
400
0.0001 0.001 0.01 0.1 1 10 100
Current density (mA/cm2)
Po
ten
tial
(mV
), A
g/A
gC
lForward Reverse

Page 13 of 16
Accep
ted
Man
uscr
ipt
Fig. 3a
0
0.1
0.2
0.3
0.4
0.5
0.6
0.7
0.8
0.9
1
0 2000 4000 6000 8000 10000 12000 14000 16000
Time (sec)
Cu
rren
t d
ensi
ty (
mA
/cm
2 )
active
active
1st transpassive (-770 mV) -770 mV
-200 mV
-200 mV
2nd transpassive (-500 mV)
beginning of 3rd passive(-350 mV)
7N NaOH
3rd transpassive (-200 mV)
-500 mV
-350 mV
(a)

Page 14 of 16
Accep
ted
Man
uscr
ipt
Fig. 3b
0
0.2
0.4
0.6
0.8
1
1.2
0 2000 4000 6000 8000 10000 12000 14000 16000
Time (sec)
Cu
rren
t d
ensi
ty (
mA
/cm
2 )7N NaOH
end of 5th passive (365 mV)
3rd transpassive (-200 mV)
active (-1160 mV)
4th passive 0 mV-50 mV
(b)
Page 15 of 16
Accep
ted
Man
uscr
ipt
Fig. 4
0.03
0.05
0.07
0.09
0.11
0.13
0.15
0.17
0 2000 4000 6000 8000 10000 12000 14000
Time (sec)
Cu
rren
t d
ensi
ty (
mA
/cm
2 )
7N NaOH, -1060 mV
3.5% NaCl, -300 mV
Page 16 of 16
Accep
ted
Man
uscr
ipt
Fig. 5
0 200 400 600 800 1000 1200 1400 1600 1800 2000
Wavenumber (cm-1)
Inte
nsi
ty
Ni(OH)2
n CO32-
B-O
h
h,g
h
mh
-COOH -COOH
B-O
h
h
h,g
mh
NiO
β-NiOOH
ng
g
mhm
HCO3-
B-ONi(OH)2
n
CO32-
active
active
passive
7N NaOH