Evidence of two erbium sites in standard aluminosilicate glass for EDFA
6
Evidence of two erbium sites in standard aluminosilicate glass for EDFA R. Peretti 1 and A.M. Jurdyc 1* and B. Jacquier 1 and E. Burov 2 and A. Pastouret 2 1 Université de Lyon, Université Lyon 1, CNRS/LPCML, Villeurbanne 69622 France 2 Draka, route de Nozay, Marcoussis, 91460, France *[email protected] Abstract: Site distributions of Er 3+ -doped aluminosilicate preforms of standard EDFA were studied by the low temperature Resonant Fluorescence Line Narrowing (RFLN) spectroscopy. Two erbium concentration samples with the same glass base were investigated. At very low erbium concentration, two classes of sites were identified, related to the number of AlO 6 octahedral linked by two oxygen edge-sharing to Er 3+ in the coordination sphere. As erbium concentration is increased, the high AlO 6 coordinated class of sites is smeared out by the optical response of the one AlO 6 coordinated class of sites. ©2010 Optical Society of America Ocis code: (060.2320) Fiber optics amplifiers and oscillators; (060.2290) Fiber materials; (300.2530) Fiber optics amplifiers and oscillators References and links 1. R. Mears, L. Reekie, J. Jauncey, and D. N. Payne, “High-gain rare-earth rare-earth-doped fiber amplifier at 1.54μm,” in Proceedings OFC, Reno, Nevada (1987) 2. L. Bigot, A.-M. Jurdyc, B. Jacquier, L. Gasca, and D. Bayart, “Resonant fluorescence line narrowing measurements in erbium-doped glasses for optical amplifiers,” Phys. Rev. B 66(21), 214204 (2002), http://link.aps.org/abstract/PRB/v66/e214204. 3. M. Yadlowsky, and L. Button, “Pump-mediated inhomogeneous effects in EDFAs and their impact ongain spectral modeling,” Optical Fiber Communication Conference and Exhibit, 1998. OFC '98, Technical Digest -, 35–36 (1998). http://www.opticsinfobase.org/abstract.cfm?URI=OFC-1998-TuG5 4. E. Desurvire, J. Sulhoff, J. Zyskind, and J. Simpson, “Study of spectral dependence of gain saturation and effect of inhomogeneous broadening in Erbium-doped aluminosilicate fiber amplifiers,” IEEE Photon. Technol. Lett. 2(9), 653–655 (1990). 5. R. Peretti, A. Jurdyc, B. Jacquier, E. Burov, and L. Gasca, “Resonant fluorescence line narrowing and gain spectral hole burning in erbium-doped fiber amplifier,” J. Lumin. 128(5–6), 1010–1012 (2008), http://www.sciencedirect.com/science/article/B6TJH-4R9GH1F-1/2/07dbf3f916f8a8d628aba9d36d9252f2. 6. W. Blanc, B. Dussardier, G. Monnom, R. Peretti, A.-M. Jurdyc, B. Jacquier, M. Foret, and A. Roberts, “Erbium emission properties in nanostructured fibers,” Appl. Opt. 48(31), G119–G124 (2009), http://ao.osa.org/abstract.cfm?URI=ao-48-31-G119. 7. B. Ainslie, “A review of the fabrication and properties of erbium-doped fibers for optical amplifiers,” J. Lightwave Technol. 9(2), 220–227 (1991). 8. L. Bigot, B. Pierre, B. Manardo, A.-M. Jurdyc, and B. Jacquier, “Etude de l'influence des codopants sur le profil de fluorescence de l'erbium à 1.5μm,” internal report LPCML (2000). 9. M. J. F. Digonnet, M. K. Davis, and R. H. Pantell, “Rate Equations for Clusters in Rare Earth-Doped Fibers,” Opt. Fiber Technol. 1(1), 48–58 (1994), http://www.sciencedirect.com/science/article/B6WP0-45SJ8JV- 5/2/b4c0d012faba1bda3c0529cdd3e655a5. 10. A. Tesar, J. Campbell, M. Weber, C. Weinzapfel, Y. Lin, H. Meissner, and H. Toratani, “Optical properties and laser parameters of Nd 3+ -doped fluoride glasses,” Opt. Mater. 1(3), 217–234 (1992), http://www.sciencedirect.com/science/article/B6TXP-46JYH7T-12/2/ebb604aa56cedf44ce25f8ad7c54286b. 11. B. R. Reisfeld, and C. Jorgensen, Lasers and Excited States of Rare Earths (Springer-Verlag, 1977). 12. P. Linus, The Nature of Chemical Bond (Cornell University Press, 1989). 13. M. Nogami, T. Nagakura, and T. Hayakawa, “Site-dependent fluorescence and hole-burning spectra of Eu 3+ - doped Al2O3-SiO2 glasses,” J. Lumin. 86(2), 117–123 (2000), http://www.sciencedirect.com/science/article/B6TJH-3YJYG4V-5/2/2c0b7e6bdc228c1b81f4d829a6cecc38. 14. A. M. Jurdyc ans S. Guy, “Deux sites à faibles concentrations pour différents verres de fluorures,” internal report LPCML (2004). 15. S. Guy, L. Bigot, I. Vasilief, B. Jacquier, B. Boulard, and Y. Gao, “Two crystallographic sites in erbium-doped fluoride glass by frequency-resolved and site-selective spectroscopies,” J. Non-Cryst. Solids 336(3), 165–172 (2004), http://www.sciencedirect.com/science/article/B6TXM-4C0TKXW- 2/2/ccff61d3d6adc78710cad5db05b2653a. #130353 - $15.00 USD Received 21 Jun 2010; revised 6 Sep 2010; accepted 7 Sep 2010; published 15 Sep 2010 (C) 2010 OSA 27 September 2010 / Vol. 18, No. 20 / OPTICS EXPRESS 20661
-
Upload
independent -
Category
Documents
-
view
3 -
download
0
Transcript of Evidence of two erbium sites in standard aluminosilicate glass for EDFA
Evidence of two erbium sites in standard aluminosilicate glass for EDFA
R. Peretti1 and A.M. Jurdyc
1* and B. Jacquier
1and E. Burov
2 and A. Pastouret
2
1 Université de Lyon, Université Lyon 1, CNRS/LPCML, Villeurbanne 69622 France 2Draka, route de Nozay, Marcoussis, 91460, France
Abstract: Site distributions of Er3+
-doped aluminosilicate preforms of standard EDFA were studied by the low temperature Resonant Fluorescence Line Narrowing (RFLN) spectroscopy. Two erbium concentration samples with the same glass base were investigated. At very low erbium concentration, two classes of sites were identified, related to the number of AlO6 octahedral linked by two oxygen edge-sharing to Er
3+ in the
coordination sphere. As erbium concentration is increased, the high AlO6 coordinated class of sites is smeared out by the optical response of the one AlO6 coordinated class of sites.
©2010 Optical Society of America
Ocis code: (060.2320) Fiber optics amplifiers and oscillators; (060.2290) Fiber materials; (300.2530) Fiber optics amplifiers and oscillators
References and links
1. R. Mears, L. Reekie, J. Jauncey, and D. N. Payne, “High-gain rare-earth rare-earth-doped fiber amplifier at 1.54µm,” in Proceedings OFC, Reno, Nevada (1987)
2. L. Bigot, A.-M. Jurdyc, B. Jacquier, L. Gasca, and D. Bayart, “Resonant fluorescence line narrowing measurements in erbium-doped glasses for optical amplifiers,” Phys. Rev. B 66(21), 214204 (2002), http://link.aps.org/abstract/PRB/v66/e214204.
3. M. Yadlowsky, and L. Button, “Pump-mediated inhomogeneous effects in EDFAs and their impact ongain spectral modeling,” Optical Fiber Communication Conference and Exhibit, 1998. OFC '98, Technical Digest -, 35–36 (1998). http://www.opticsinfobase.org/abstract.cfm?URI=OFC-1998-TuG5
4. E. Desurvire, J. Sulhoff, J. Zyskind, and J. Simpson, “Study of spectral dependence of gain saturation and effect of inhomogeneous broadening in Erbium-doped aluminosilicate fiber amplifiers,” IEEE Photon. Technol. Lett. 2(9), 653–655 (1990).
5. R. Peretti, A. Jurdyc, B. Jacquier, E. Burov, and L. Gasca, “Resonant fluorescence line narrowing and gain spectral hole burning in erbium-doped fiber amplifier,” J. Lumin. 128(5–6), 1010–1012 (2008), http://www.sciencedirect.com/science/article/B6TJH-4R9GH1F-1/2/07dbf3f916f8a8d628aba9d36d9252f2.
6. W. Blanc, B. Dussardier, G. Monnom, R. Peretti, A.-M. Jurdyc, B. Jacquier, M. Foret, and A. Roberts, “Erbium emission properties in nanostructured fibers,” Appl. Opt. 48(31), G119–G124 (2009), http://ao.osa.org/abstract.cfm?URI=ao-48-31-G119.
7. B. Ainslie, “A review of the fabrication and properties of erbium-doped fibers for optical amplifiers,” J. Lightwave Technol. 9(2), 220–227 (1991).
8. L. Bigot, B. Pierre, B. Manardo, A.-M. Jurdyc, and B. Jacquier, “Etude de l'influence des codopants sur le profil de fluorescence de l'erbium à 1.5µm,” internal report LPCML (2000).
9. M. J. F. Digonnet, M. K. Davis, and R. H. Pantell, “Rate Equations for Clusters in Rare Earth-Doped Fibers,” Opt. Fiber Technol. 1(1), 48–58 (1994), http://www.sciencedirect.com/science/article/B6WP0-45SJ8JV-5/2/b4c0d012faba1bda3c0529cdd3e655a5.
10. A. Tesar, J. Campbell, M. Weber, C. Weinzapfel, Y. Lin, H. Meissner, and H. Toratani, “Optical properties and laser parameters of Nd3+-doped fluoride glasses,” Opt. Mater. 1(3), 217–234 (1992), http://www.sciencedirect.com/science/article/B6TXP-46JYH7T-12/2/ebb604aa56cedf44ce25f8ad7c54286b.
11. B. R. Reisfeld, and C. Jorgensen, Lasers and Excited States of Rare Earths (Springer-Verlag, 1977). 12. P. Linus, The Nature of Chemical Bond (Cornell University Press, 1989). 13. M. Nogami, T. Nagakura, and T. Hayakawa, “Site-dependent fluorescence and hole-burning spectra of Eu3+-
doped Al2O3-SiO2 glasses,” J. Lumin. 86(2), 117–123 (2000), http://www.sciencedirect.com/science/article/B6TJH-3YJYG4V-5/2/2c0b7e6bdc228c1b81f4d829a6cecc38.
14. A. M. Jurdyc ans S. Guy, “Deux sites à faibles concentrations pour différents verres de fluorures,” internal report LPCML (2004).
15. S. Guy, L. Bigot, I. Vasilief, B. Jacquier, B. Boulard, and Y. Gao, “Two crystallographic sites in erbium-doped fluoride glass by frequency-resolved and site-selective spectroscopies,” J. Non-Cryst. Solids 336(3), 165–172 (2004), http://www.sciencedirect.com/science/article/B6TXM-4C0TKXW-2/2/ccff61d3d6adc78710cad5db05b2653a.
#130353 - $15.00 USD Received 21 Jun 2010; revised 6 Sep 2010; accepted 7 Sep 2010; published 15 Sep 2010(C) 2010 OSA 27 September 2010 / Vol. 18, No. 20 / OPTICS EXPRESS 20661
16. A. Saitoh, S. Matsuishi, C. Se-Weon, J. Nishii, M. Oto, M. Hirano, and H. Hosono, “Elucidation of codoping effects on the solubility enhancement of Er3+ in SiO2 glass: striking difference between Al and P codoping,” J. Phys. Chem. B 110(15), 7617–7620 (2006), http://pubs.acs.org/doi/abs/10.1021/jp060702w.
17. A. Monteil, S. Chaussedent, G. Alombert-Goget, N. Gaumer, J. Obriot, S. Ribeiro, Y. Messaddeq, A. Chiasera, and M. Ferrari, “Clustering of rare earth in glasses, aluminum effect: experiments and modeling,” J. Non-Crystalline Solids 348, 44 – 50 (2004). Proceedings of the 6th Brazilian Symposium of Glases and Related Materials and 2nd International Symposium on Non-Crystalline Solids in Brazil, http://www.sciencedirect.com/science/article/B6TXM-4DNRW2C-1/2/a5cbba96ef8f1c59015780c5b635984f.
Introduction
During the two decades since the demonstration of the first Erbium Doped Fiber Amplifier (EDFA) [1], this technology has experienced exponential growth in the commercial market. Moreover, the usage of WDM has increased the need for continued improvement of the optical properties of the glass based amplifiers. Moreover the introduction of Wavelength Division Multiplexing (WDM) into the system increased this need because of wide gain band demand. The strong correlation between the spectral gain bandwidth and the erbium spectroscopic data, such as emission and absorption cross sections and excited state lifetime, makes these parameters the key elements to explore in looking for improved materials. As seen so far, these parameters are predetermined by the Er
3+ local environment in the glass, i.e.
over few nanometers distance scales. The inhomogeneous Distribution of Sites (IDS) for trivalent erbium (Er
3+) in the matrix is
one of these parameters. The inhomogeneous width of the Er3+
1.54µm emission in the aluminosilica standard matrix of EDFA is known to be around 4 times the homogeneous width at room temperature [2]. Thus inhomogeneous broadening is the second of the major parameters, after stark splitting, that gives EDFA its broad gain spectrum. Moreover, inhomogeneous spectral behaviour at room temperature is known to induce effects such as pump-mediated inhomogeneity [3] or gain spectral hole burning [4] for which hole width was definitely related to homogeneous linewidth as reported in our recent work [5].
To improve the spectral gain bandwidth of the EDFA, many studies have investigated new glass chemical compositions; The goal being to modify the local crystal field environment around the erbium ions to affect the Stark energy level and the homogeneous and inhomogeneous linewidths . The linewidth change in different local crystal field is only 1 or 2 nanometers with respect to the standard value of 31nm in aluminosilicate host. This is one of the reasons that we focus our attention to a deeper investigation of the inhomogeneous broadening of the standard aluminosilica glass composition with the idea to better describe the local environment of erbium ions. Small differences in the gain performance of different aluminosilica glass fibres have been detected that may arise from the small change of local crystal field seen by the dopant in the disordered glass. On the other hand, the understanding of the erbium localization as well as the knowledge of the glass structure itself may allow finding alternate chemical or physical route to achieve the desired optical properties. In that sense, nanoscale engineering of the material may be a promising route for future active materials [6].
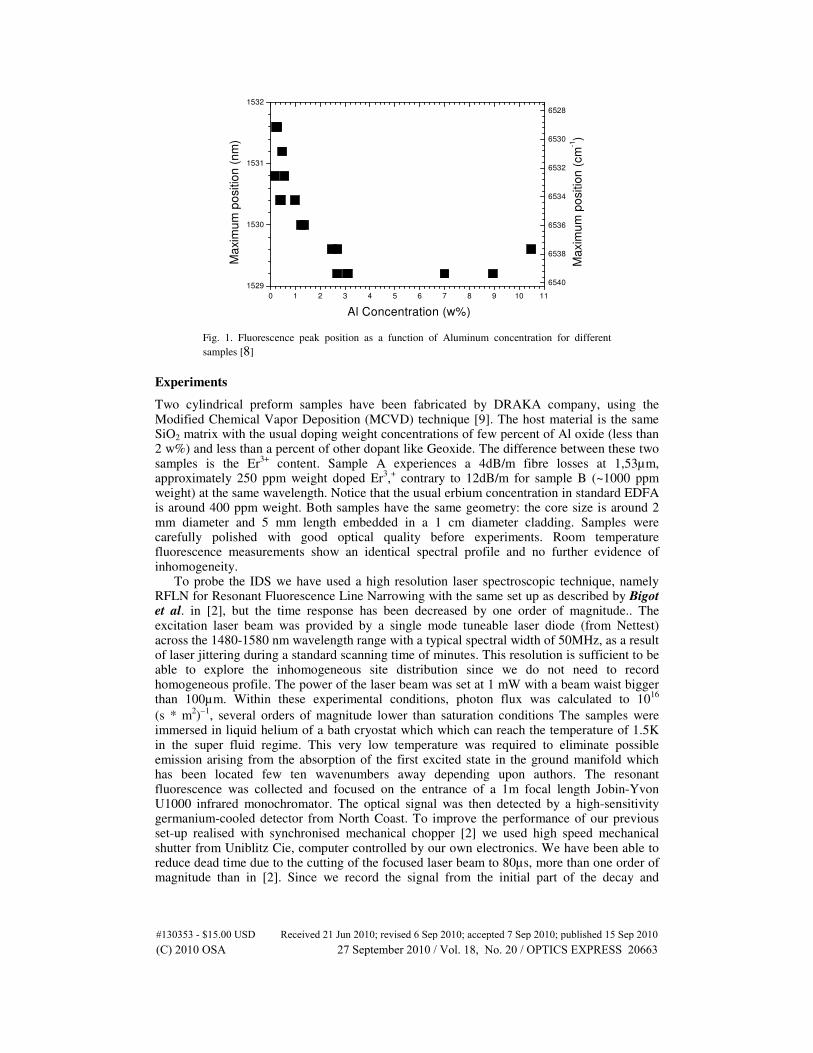
In this letter, we report the Resonant Fluorescence Line Narrowing (RFLN) study of two low erbium-doped optical preforms of standard EDFA where we have been able to detect two sites erbium distributions depending upon erbium concentration. Before describing the new experimental results, we recall that codoping germanosilica glass with alumina enhances erbium solubility in the glass network while it shifts the main erbium fluorescence peak towards high energy and broadens the spectrum at room temperature [7]. Moreover this shift has been studied in great details in aluminosilicate glass perform indicating a strong sensitivity on alumina contents below 2 w% as shown in Fig. 1 [8].
#130353 - $15.00 USD Received 21 Jun 2010; revised 6 Sep 2010; accepted 7 Sep 2010; published 15 Sep 2010(C) 2010 OSA 27 September 2010 / Vol. 18, No. 20 / OPTICS EXPRESS 20662
0 1 2 3 4 5 6 7 8 9 10 11
1529
1530
1531
1532
6540
6538
6536
6534
6532
6530
6528
Ma
xim
um
po
sitio
n (
nm
)
Al Concentration (w%)
Ma
xim
um
po
sitio
n (
cm
-1)
Fig. 1. Fluorescence peak position as a function of Aluminum concentration for different
samples [8]
Experiments
Two cylindrical preform samples have been fabricated by DRAKA company, using the Modified Chemical Vapor Deposition (MCVD) technique [9]. The host material is the same SiO2 matrix with the usual doping weight concentrations of few percent of Al oxide (less than 2 w%) and less than a percent of other dopant like Geoxide. The difference between these two samples is the Er
3+ content. Sample A experiences a 4dB/m fibre losses at 1,53µm,
approximately 250 ppm weight doped Er3,+ contrary to 12dB/m for sample B (~1000 ppm
weight) at the same wavelength. Notice that the usual erbium concentration in standard EDFA is around 400 ppm weight. Both samples have the same geometry: the core size is around 2 mm diameter and 5 mm length embedded in a 1 cm diameter cladding. Samples were carefully polished with good optical quality before experiments. Room temperature fluorescence measurements show an identical spectral profile and no further evidence of inhomogeneity.
To probe the IDS we have used a high resolution laser spectroscopic technique, namely RFLN for Resonant Fluorescence Line Narrowing with the same set up as described by Bigot et al. in [2], but the time response has been decreased by one order of magnitude.. The excitation laser beam was provided by a single mode tuneable laser diode (from Nettest) across the 1480-1580 nm wavelength range with a typical spectral width of 50MHz, as a result of laser jittering during a standard scanning time of minutes. This resolution is sufficient to be able to explore the inhomogeneous site distribution since we do not need to record homogeneous profile. The power of the laser beam was set at 1 mW with a beam waist bigger than 100µm. Within these experimental conditions, photon flux was calculated to 10
16
(s * m2)−1
, several orders of magnitude lower than saturation conditions The samples were immersed in liquid helium of a bath cryostat which which can reach the temperature of 1.5K in the super fluid regime. This very low temperature was required to eliminate possible emission arising from the absorption of the first excited state in the ground manifold which has been located few ten wavenumbers away depending upon authors. The resonant fluorescence was collected and focused on the entrance of a 1m focal length Jobin-Yvon U1000 infrared monochromator. The optical signal was then detected by a high-sensitivity germanium-cooled detector from North Coast. To improve the performance of our previous set-up realised with synchronised mechanical chopper [2] we used high speed mechanical shutter from Uniblitz Cie, computer controlled by our own electronics. We have been able to reduce dead time due to the cutting of the focused laser beam to 80µs, more than one order of magnitude than in [2]. Since we record the signal from the initial part of the decay and
#130353 - $15.00 USD Received 21 Jun 2010; revised 6 Sep 2010; accepted 7 Sep 2010; published 15 Sep 2010(C) 2010 OSA 27 September 2010 / Vol. 18, No. 20 / OPTICS EXPRESS 20663
because we improved the detection system; the signal to noise ratio was increase by much more than one order of magnitude allowing the analyse of lower erbium doped aluminosilicate glass. Finally, to increase the sensitivity of our detection system and because the signal is modulated by a square signal around 15 Hz, we used a lock in amplifier SR830 from Stanford Research.
Results
The electronic transition under investigation by RFLN is between the lowest energy level of the fundamental
4I15/2 level and the lowest energy level of the exited state
4I13/2; notice that at
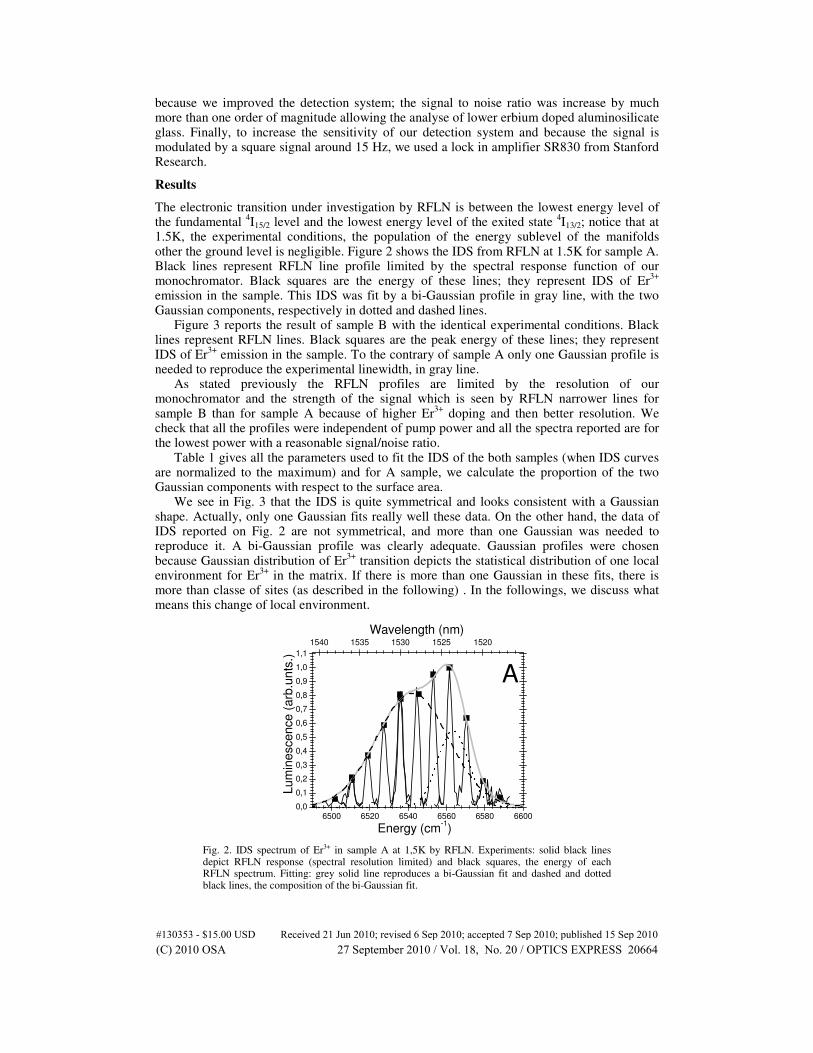
1.5K, the experimental conditions, the population of the energy sublevel of the manifolds other the ground level is negligible. Figure 2 shows the IDS from RFLN at 1.5K for sample A. Black lines represent RFLN line profile limited by the spectral response function of our monochromator. Black squares are the energy of these lines; they represent IDS of Er
3+
emission in the sample. This IDS was fit by a bi-Gaussian profile in gray line, with the two Gaussian components, respectively in dotted and dashed lines.
Figure 3 reports the result of sample B with the identical experimental conditions. Black lines represent RFLN lines. Black squares are the peak energy of these lines; they represent IDS of Er
3+ emission in the sample. To the contrary of sample A only one Gaussian profile is
needed to reproduce the experimental linewidth, in gray line. As stated previously the RFLN profiles are limited by the resolution of our
monochromator and the strength of the signal which is seen by RFLN narrower lines for sample B than for sample A because of higher Er
3+ doping and then better resolution. We
check that all the profiles were independent of pump power and all the spectra reported are for the lowest power with a reasonable signal/noise ratio.
Table 1 gives all the parameters used to fit the IDS of the both samples (when IDS curves are normalized to the maximum) and for A sample, we calculate the proportion of the two Gaussian components with respect to the surface area.
We see in Fig. 3 that the IDS is quite symmetrical and looks consistent with a Gaussian shape. Actually, only one Gaussian fits really well these data. On the other hand, the data of IDS reported on Fig. 2 are not symmetrical, and more than one Gaussian was needed to reproduce it. A bi-Gaussian profile was clearly adequate. Gaussian profiles were chosen because Gaussian distribution of Er
3+ transition depicts the statistical distribution of one local
environment for Er3+
in the matrix. If there is more than one Gaussian in these fits, there is more than classe of sites (as described in the following) . In the followings, we discuss what means this change of local environment.
6500 6520 6540 6560 6580 66000,0
0,1
0,2
0,3
0,4
0,5
0,6
0,7
0,8
0,9
1,0
1,1
1540 1535 1530 1525 1520
A
Wavelength (nm)
Lum
ine
scence
(arb
.un
ts.)
Energy (cm-1)
Fig. 2. IDS spectrum of Er3+ in sample A at 1,5K by RFLN. Experiments: solid black lines depict RFLN response (spectral resolution limited) and black squares, the energy of each RFLN spectrum. Fitting: grey solid line reproduces a bi-Gaussian fit and dashed and dotted black lines, the composition of the bi-Gaussian fit.
#130353 - $15.00 USD Received 21 Jun 2010; revised 6 Sep 2010; accepted 7 Sep 2010; published 15 Sep 2010(C) 2010 OSA 27 September 2010 / Vol. 18, No. 20 / OPTICS EXPRESS 20664

6500 6520 6540 6560 6580 66000,0
0,1
0,2
0,3
0,4
0,5
0,6
0,7
0,8
0,9
1,0
1,11540 1535 1530 1525 1520
B
Wavelength (nm)
Lu
min
escen
ce
(arb
.un
ts.)
Energy (cm-1)
Fig. 3. IDS spectrum of Er3+ in sample B at 1,5K by RFLN. Solid black lines depict RFLN spectra (spectral resolution limited) and black squares, the energy of each RFLN peak. The grey solid line represents the Gaussian fit.
Table 1. Parameters with experimental error bars of the Gaussian curves used to fit IDS data of samples A and B. Furthermore proportion of the two Gaussian bands to the full
profile is indicated as weight parameter based on area measurements.
Sample A Sample B
Fit precision Chi2/DoF 5.10−4 5.10−4
R2 0.997 0.997
First Gaussian
Center (cm−1) 6542 ± 1 6546 ± 1
Width (cm−1) 37 ± 1 41 ± 1 Weight 78% ± 5 100%
Second Gaussian
Center (cm−1) 6563 ± 1
Width (cm−1) 17 ± 1
Weight 22% ± 5
Discussion
In a glass, the disorder makes the interatomic distances and angles between ions of silica network different from one specific Er
3+ environment to another. There is generally a
statistical distribution of environment for which the optical transition energies have a mean value and a broadening that justifies a fit of the RFLN spectra with Gaussian profiles. In that respect such distribution is called “a class of sites”. In the results reported above, it is clearly shown that there are two classes of sites which differ by their mean transition energy and by the width of their distribution in sample A. On the contrary, in sample B there is only one class of sites. Comparing the two Gaussian’s area in sample A, we can say that the occurrence of the high energy class of sites is very low. That is why we call as “minority class of sites” (mCS) the high energy distribution and “majority class of sites” (MCS) the low energy distribution. We have observed that the mCS is no more visible with increasing erbium concentration (sample B). So, we assume that the number of sites in the mCS is limited but that the filling probability of the sites is higher. We believe that these features are the signature of the existence of two different erbium environments with a more ionic character for the high energy distribution in agreement with nephelauxetic effect and optical basicity [10–12]. In literature, the observation of 2 sites for other rare earth in similar glass was already reported in Eu
3+-doped aluminosilicate glass [13] and, in Er
3+-doped fluoride glasses
[14,15] but always at low rare earth concentration In silica glass network of standard optical fibre amplifiers, it is well known that alumina
enhances the solubility of rare earth ions, namely erbium, in silicate. From a structural point of view Al
3+ ions may seat in tetrahedral or octahedral oxygen environments as a result of former
#130353 - $15.00 USD Received 21 Jun 2010; revised 6 Sep 2010; accepted 7 Sep 2010; published 15 Sep 2010(C) 2010 OSA 27 September 2010 / Vol. 18, No. 20 / OPTICS EXPRESS 20665
or modifier of silica glass network respectively. For the given concentrations of 1000ppm mol% erbium (corresponding to 5000 ppm weight) and 1.9 mol% alumina, recent work [16] based on electron spin-echo measurements has demonstrated that the coordination sphere around Er
3+ is a mixture of octahedral Al
3+ ion-bearing coordination (~30%) and Al free
coordination (~70%). However, at very low erbium concentration and high content of alumina as sample A depicts, two classes of sites could be identified for which the structural origin is not yet clear. In pure silica or germanium-doped silica hosts, the room temperature main peak of erbium infrared emission is positioned at wavelength close to 1,54 µm while in pure alumina or alumina doped silica it is shifted towards high energy (~1,53µm) and the spectral profile is broadened. With decreasing temperature, the general high energy shift is mostly caused by population effects together with the slight contraction of the interatomic distances. At “high” erbium concentration (1000ppm weight) and high alumina doping (few mol %), the erbium environments with two oxygen edge-sharing linked with alumina octahedra are predominant but introducing a subsequent disorder due to several possible configurations. In contrast, at a low erbium doping such as in standard EDFA, Er
3+ ions may stand in an
environment with one and more octahedral Al3+
environments. In the latter case, the coordination sphere is no longer the same but increase due to a steering effect and the adjustment with the silica network. The number of these “sites” is limited with respect to the one coordinated with only one Al
3+ octahedral. Because of a probable high oxygen
coordination number resulting in a more ionic environment, their emission is observed at high energy compare to the one of erbium environment involving only one Al
3+ octahedral. As
erbium concentration is increased the probability to find an Er3+
linked to only one alumina octahedral is much larger and then masks the previous class of sites. A more pedagogic description can be proposed depending both on erbium oxide and alumina concentrations. At low alumina concentration whatever the erbium concentration, the emission profile image the one on silica or germanosilicate depending upon the base composition. Room temperature spectra peak at long wavelength. At high alumina content (namely greater than 1wt%) and low erbium concentration, two classes of sites are identified while the high energy distribution is smeared out when the erbium concentration is increased. This description is consistent with the literature. First within [13] the authors attribute the narrow distribution of sites to what they call Al-O rich phase and broad distribution of sites to Al-O poor phase. However our interpretation differs by the position of the transition energy of the two classes of sites. Indeed we attribute the high-energy transition to the Al-O rich phase when they stated the contrary. And second, in [17] the authors modelled an erbium doped aluminosilicate glass, and found 2 aluminium environments for erbium, one with less disorder than the other.
Conclusion
In this report, we pointed out the existence of two classes of sites in the standard telecom erbium-doped glass for EDFA. These two classes of sites are observed only at low erbium concentration and high alumina content. The number of AlO6 polyhedrons linked to Er
3+ ions
in the coordination sphere is suggesting the possible explanation of our observations in close agreement to what reported earlier for Eu
3+ aluminosilicate glass [13]. However, in our case
the high energy “sites” is attributed to the erbium environment for which more than one AlO6 is involved and it smeared out with increasing the erbium concentration. At room temperature, it is generally not clear if this behaviour plays a role in the performances of EDFA but controlling and engineering the erbium environment at the nanometric scale would be very useful to understand and improve the performances of EDFA.
Acknowledgement
The authors are grateful to the reviewers for the help to improve the manuscript.
#130353 - $15.00 USD Received 21 Jun 2010; revised 6 Sep 2010; accepted 7 Sep 2010; published 15 Sep 2010(C) 2010 OSA 27 September 2010 / Vol. 18, No. 20 / OPTICS EXPRESS 20666