Thermal stability and UV–Vis-NIR spectroscopy of a new erbium-doped fluorotellurite glass
15
This article was downloaded by: [197.0.0.33] On: 27 February 2012, At: 05:43 Publisher: Taylor & Francis Informa Ltd Registered in England and Wales Registered Number: 1072954 Registered office: Mortimer House, 37-41 Mortimer Street, London W1T 3JH, UK Philosophical Magazine Publication details, including instructions for authors and subscription information: http://www.tandfonline.com/loi/tphm20 Thermal stability and UV–Vis-NIR spectroscopy of a new erbium-doped fluorotellurite glass El Sayed Yousef a b , Kamel Damak c , Ramzi Maalej d & C. Rüssel e a Physics Department, Faculty of Science, King Khalid University, P.O. Box 9003, Abha, Saudi Arabia b Physics Department, Faculaty of Science, Al Azhar University, Assuit branch, Egypt c Laboratoire Radio Analyses et Environnement, Université de Sfax, ENIS 3038 Sfax, Tunisia d Laboratoire de Physique Appliquée, Groupe de Physique Théorique, Faculté des Sciences de Sfax, Université de Sfax, 3018 Sfax, Tunisia e Otto-Schott-Institut, Jena University, Germany Available online: 29 Nov 2011 To cite this article: El Sayed Yousef, Kamel Damak, Ramzi Maalej & C. Rüssel (2012): Thermal stability and UV–Vis-NIR spectroscopy of a new erbium-doped fluorotellurite glass, Philosophical Magazine, 92:7, 899-911 To link to this article: http://dx.doi.org/10.1080/14786435.2011.634852 PLEASE SCROLL DOWN FOR ARTICLE Full terms and conditions of use: http://www.tandfonline.com/page/terms-and- conditions This article may be used for research, teaching, and private study purposes. Any substantial or systematic reproduction, redistribution, reselling, loan, sub-licensing, systematic supply, or distribution in any form to anyone is expressly forbidden. The publisher does not give any warranty express or implied or make any representation that the contents will be complete or accurate or up to date. The accuracy of any instructions, formulae, and drug doses should be independently verified with primary sources. The publisher shall not be liable for any loss, actions, claims, proceedings,
Transcript of Thermal stability and UV–Vis-NIR spectroscopy of a new erbium-doped fluorotellurite glass

This article was downloaded by: [197.0.0.33]On: 27 February 2012, At: 05:43Publisher: Taylor & FrancisInforma Ltd Registered in England and Wales Registered Number: 1072954 Registeredoffice: Mortimer House, 37-41 Mortimer Street, London W1T 3JH, UK
Philosophical MagazinePublication details, including instructions for authors andsubscription information:http://www.tandfonline.com/loi/tphm20
Thermal stability and UV–Vis-NIRspectroscopy of a new erbium-dopedfluorotellurite glassEl Sayed Yousef a b , Kamel Damak c , Ramzi Maalej d & C. Rüssel ea Physics Department, Faculty of Science, King Khalid University,P.O. Box 9003, Abha, Saudi Arabiab Physics Department, Faculaty of Science, Al Azhar University,Assuit branch, Egyptc Laboratoire Radio Analyses et Environnement, Université deSfax, ENIS 3038 Sfax, Tunisiad Laboratoire de Physique Appliquée, Groupe de PhysiqueThéorique, Faculté des Sciences de Sfax, Université de Sfax, 3018Sfax, Tunisiae Otto-Schott-Institut, Jena University, Germany
Available online: 29 Nov 2011
To cite this article: El Sayed Yousef, Kamel Damak, Ramzi Maalej & C. Rüssel (2012): Thermalstability and UV–Vis-NIR spectroscopy of a new erbium-doped fluorotellurite glass, PhilosophicalMagazine, 92:7, 899-911
To link to this article: http://dx.doi.org/10.1080/14786435.2011.634852
PLEASE SCROLL DOWN FOR ARTICLE
Full terms and conditions of use: http://www.tandfonline.com/page/terms-and-conditions
This article may be used for research, teaching, and private study purposes. Anysubstantial or systematic reproduction, redistribution, reselling, loan, sub-licensing,systematic supply, or distribution in any form to anyone is expressly forbidden.
The publisher does not give any warranty express or implied or make any representationthat the contents will be complete or accurate or up to date. The accuracy of anyinstructions, formulae, and drug doses should be independently verified with primarysources. The publisher shall not be liable for any loss, actions, claims, proceedings,

demand, or costs or damages whatsoever or howsoever caused arising directly orindirectly in connection with or arising out of the use of this material.
Dow
nloa
ded
by [
197.
0.0.
33]
at 0
5:43
27
Febr
uary
201
2

Philosophical MagazineVol. 92, No. 7, 1 March 2012, 899–911
Thermal stability and UV–Vis-NIR spectroscopy of a new
erbium-doped fluorotellurite glass
El Sayed Yousef ab*, Kamel Damakc, Ramzi Maalejd and C. Russele
aPhysics Department, Faculty of Science, King Khalid University, P.O. Box 9003, Abha,Saudi Arabia; bPhysics Department, Faculaty of Science, Al Azhar University, Assuitbranch, Egypt; cLaboratoire Radio Analyses et Environnement, Universite de Sfax,ENIS 3038 Sfax, Tunisia; dLaboratoire de Physique Appliquee, Groupe de PhysiqueTheorique, Faculte des Sciences de Sfax, Universite de Sfax, 3018 Sfax, Tunisia;
eOtto-Schott-Institut, Jena University, Germany
(Received 14 June 2011; final version received 17 October 2011)
A new transparent bulk glass from the system 76TeO2 � 10ZnO �9.0PbO � 1.0PbF2 � 3.0Na2O doped with Er3þ (TZPPN doped with Er3þ)has been prepared using the conventional melt-quenching method. Resultsof differential thermal analysis (DTA) measurements indicate good thermalstability of this glass. The refractive indices at different wavelengths, theoptical energy gap, the Sellmeier gap energy and the dispersion energyhave been estimated. The Judd–Ofelt parameters, �t (t¼ 2, 4, 6) of Er3þ
were evaluated from optical absorption spectra. Electric dipole, magneticdipole type transition probabilities, spectroscopic quality factors, branch-ing ratio and radiative lifetimes of several excited states of Er3þ have beenpredicted using intensity Judd–Ofelt parameters. The spectroscopic prop-erties indicate that TZPPN glass doped with Er3þ is a promising candidatefor laser applications and may be suitable for upconversion fibre opticaldevices.
Keywords: oxyfluoride glasses; thermal stability; Judd–Ofelt analysis
1. Introduction
New tellurium oxide (TeO2)-based glasses exhibit great potential for numerousapplications in photonics, such as optical fibres, optical modulators, nonlinearoptical devices, lasers, display and data storage [1,2]. This is due to advantageousproperties, such as relatively low phonon energy, high refractive index, high dielectricconstant, good corrosion resistance, good thermal and chemical stability and lowmelting point. Rare earth (RE) ions were used to probe the local structural variationsin the host glasses owing to their unique spectroscopic properties resulting from theoptical transition in the 4f shell. Moreover, tellurite glasses doped with rare earthshave achieved efficient fluorescence emissions [3–8]. Er3þ is one of the mostimportant rare earth ions in optical amplifiers for telecommunication networksystems. Moreover, Er3þ ions are suitable to obtain good upconversion emission and
*Corresponding author. Email: [email protected]
ISSN 1478–6435 print/ISSN 1478–6443 online
� 2012 Taylor & Francis
http://dx.doi.org/10.1080/14786435.2011.634852
http://www.tandfonline.com
Dow
nloa
ded
by [
197.
0.0.
33]
at 0
5:43
27
Febr
uary
201
2

sensitization efficiency [9,10]. Er3þ-doped tellurite glasses have been considered as
promising candidates for erbium-doped fibre amplifiers (EDFA). The latter is one of
the key elements in fibre-glass technology. Otherwise, the intense excited state
absorption (ESA) from erbium 4I11/2 level to higher energy excited states in tellurite
glasses reduces the gain and pumping efficiency for 1.5mm emission due to their
lower phonon energy [11,12]. Furthermore, a large emission cross-section in the
1480–1580 nm wavelength range and a broad fluorescence full width at half
maximum (FWHM: �60–80 nm) make Er3þ-doped tellurite glasses interesting
materials for numerous applications, e.g. in high performance fibre amplifiers
[11–16]. Judd–Ofelt approximations are used to calculate 4f transition intensities of
rare earth ions in various hosts. Its application requires the computation of
parameters (Vk, where k¼ 2, 4, 6) by a fitting procedure of experimental data usually
obtained from ground state absorption. These three parameters give information on
the local structure and bonding state of rare earth ions in materials [17,18]. Hence, in
this study, we have focused our attention on the spectroscopic parameters of Er3þ
ions in a new tellurite glass with the composition 76TeO2 � 10ZnO � 9.0PbO �
1.0PbF2 � 3.0Na2O � 1.0Er2O3. The electric dipole type transition probabilities (Aed),
magnetic dipole type transition probabilities (Amd), branching ratios �ð Þ and the
radiative lifetimes �ð Þ of the energy levels of prepared glass were calculated using
Judd–Ofelt theory. The glass transition temperature and thermal stability calculated
using differential thermal analysis (DTA) and the optical energy gap determined
from UV spectra are reported.
2. Theory
2.1. Electric and magnetic dipole line strength
According to the Judd–Ofelt theory [17,18], the electric Scaled
� �dipole line strengths
are calculated from the initial state SLJj i to final state S0L0J0j i using Equation (1):
Scalced SLJ,S0L0J0ð Þ ¼
Xk¼2,4,6
�k SLJ U kð Þ�� ��S0L0J0� ��� ��2 ð1Þ
where �k(k ¼ 2, 4, 6) are the intensity parameters and U kð Þ�� ��� �
are the double-
reduced matrix elements of unit tensor operators for Er3þ, which are considered to
be independent of the host matrix [18–20]. The double-reduced matrix elements were
calculated using the following equation:
SLJ U kð Þ�� ��S0L0J0� �
¼ � S,S0ð Þ �1ð ÞSþL0þJþk
ffiffiffiffiffiffiffiffiffiffiffiffiffiffiffiffiffiffiffiffiffiffiffiffiffiffiffiffiffiffiffiffiffiffi2Jþ 1ð Þ 2J0 þ 1ð Þ
p L k L0
J0 S J
SL U kð Þ�� ��SL0� �
ð2Þ
The reduced matrix elements on the right-hand side of Equation (2) were calculated
using Equation (3):
SL U kð Þ�� ��SL0� �
¼ nX
�
k � � �
0 k � � �
�1ð Þ�Lþkþ3þL
ffiffiffiffiffiffiffiffiffiffiffiffiffiffiffiffiffiffiffiffiffiffiffiffiffiffiffiffiffiffiffiffiffiffiffiffi2Lþ 1ð Þ 2L0 þ 1ð Þ
p 3 L �LL0 3 k
ð3Þ
900 E.S. Yousef et al.
Dow
nloa
ded
by [
197.
0.0.
33]
at 0
5:43
27
Febr
uary
201
2

For the transition between states that meet the rules DS ¼ DL ¼ 0, DJ ¼ 0,�1, thecontribution of magnetic dipole transitions Smd, is given [21,22] by:
Smd SLJ,SLJ0ð Þ ¼h
4 � m c
� �2
SLJ Lþ 2Sk kSLJ0� ��� ��2 ð4Þ
where m is the electron mass, c the velocity of light, h the Planck constant andLþ 2Sk kh i the magnetic dipole matrix elements between LS-coupled states [20–23]:
SLJ Lþ 2Sk kSLJh i ¼ S Sþ 1ð Þ � L Lþ 1ð Þ þ 3J Jþ 1ð Þ½ �2Jþ 1
4J Jþ 1ð Þ
�1=2ð5Þ
SLJ Lþ 2Sk kSLJ� 1h i ¼ Sþ Lþ 1ð Þ2�J2
� � J2 � L� Sð Þ2
4J
� 1=2
ð6Þ
S L J Lþ 2Sk kS L Jþ 1h i ¼ Sþ Lþ 1ð Þ2� Jþ 1ð Þ
2� � Jþ 1ð Þ
2� L� Sð Þ
2
4 Jþ 1ð Þ
� 1=2
ð7Þ
So the measured line strengths Smeased SLJ,S0L0J0ð Þ from the absorption spectrum can
be given by [6]:
Smeased SLJ,S0L0J0ð Þ ¼
9n
n2þ 2ð Þ2
3ch
8�3e22Jþ 1ð Þ
N ���
2:303
L
ZJ!J0
OD �ð Þ d�� n Smd
�ð8Þ
where � (cm) is the mean wavelength of the absorption band, n is the refractive indexof the host with respect to ��, L is the thickness of the sample under study, N is theEr3þ ions concentration, e is the electron charge and
RJ!J0 OD �ð Þd� represents the
experimental integrated optical density in the wavelength range and can be obtainedby calculating the total area under the absorbed band.
A measure of the accuracy of the fit is given by the root mean square (rms)deviation:
�rms ¼
PSmeased � Scal
ed
� �2p� 3ð Þ
!1=2
ð9Þ
where p is the number of spectral bands analysed.
2.2. Radiative properties
Using Equations (1) and (4), the electric (Aed) and magnetic (Amd) dipole radiativetransition probabilities are evaluated from the following expressions:
Aed ¼64 �4
3h 2Jþ 1ð Þ ��3n n2 þ 2� �2
9
!Sed ð10Þ
Amd ¼64 �4
3h 2Jþ 1ð Þ ��3n3 Smd ð11Þ
Philosophical Magazine 901
Dow
nloa
ded
by [
197.
0.0.
33]
at 0
5:43
27
Febr
uary
201
2

The radiative transition probability is given by:
A J! J0ð Þ ¼ Aed þ Amd ¼64 �4
3h 2Jþ 1ð Þ ��3n n2 þ 2� �2
9Sed þ n3 Smd
!ð12Þ
The radiative lifetime �R for an exited state Jð Þ is calculated by:
�R ¼1P
A J! J0ð Þð13Þ
The branching ratio � J! J0ð Þ can be determined from the radiative transition
probability by the following expression:
� J! J0ð Þ ¼A J! J0ð ÞPA J! J0ð Þ
¼ A J! J0ð Þ �R ð14Þ
All above relations were used to compute the various spectroscopic properties
reported in this study.
3. Experimental procedure
A glass with the composition 76TeO2 � 10ZnO � 9.0PbO � 1.0PbF2 � 3.0Na2O � 1.0Er2O3
(denoted as Er3þ-doped TZPPN glass) was prepared by mixing the specified weights
of raw materials. The powder mixture was placed in a covered gold crucible and
heated in a melting furnace to a temperature of 900�C for 30min; the melt was stirred
from time to time. The highly viscous melt was cast at 850�C in a graphite mould.
Subsequently, the sample was transferred to an annealing furnace and kept for 2 h at
270�C (below Tg 15K). Then, the furnace was switched off and the glass sample was
allowed to cool.The prepared glass sample had high homogeneity, was colourless and not
hygroscopic. The glass sample was cut, ground and polished, according to a standard
method, applying H2O as the liquid component.All subsequent measurements were carried out at room temperature. The
densities �, of the glassy samples were measured by a helium pycnometer (AccuPyc
1330 Pycnometer) with an accuracy of �0.0003%.The glass transition temperature (Tg), the softening temperature (Ts), the onset
temperature of crystallization (Tx), the peak temperature of crystallization (Tc) and
the melting temperature (Tm) were obtained using differential thermal analysis
(Shimadzu DTA 50).The absorption spectrum of glass was determined at wavelengths in the range
200–3200 nm using a Shimadzu 3101PC spectrophotometer UV/VIS/NIR with
optical path lengths of 1 and 11mm.From the glassy sample, a prism of the dimension 30� 15� 15mm3 was cut. The
prism was ground and polished using water as the liquid component. The prism was
used to measure the linear refractive indices at wavelengths of 643.8, 589.3, 546.1,
479.98 and 435.8 nm.
902 E.S. Yousef et al.
Dow
nloa
ded
by [
197.
0.0.
33]
at 0
5:43
27
Febr
uary
201
2

4. Result and discussion
4.1. Density and thermal characteristics
The glass with composition 76TeO2 � 10ZnO � 9.0PbO � 1.0PbF2 � 3.0Na2O � 1.0Er2O3
was homogeneous and transparent. The density of the prepared glass is of special
importance and strongly affects their respective structure. The density value is
�¼ 5.788 g cm�3. Figure 1 shows the DTA profile of Er3þ-doped TZPPN glass. The
glass transition temperature (Tg), the softening temperature (Ts), the onset
crystallization temperature (Tx), the melting temperature (Tm), the glass stability
(S) and Hruby’s parameter (Hr) were determined and are summarised in Table 1. The
thermal stability of glasses is an important parameter for glass technology and is a
measure of the degree of disorder in the glassy state. If the glass has poor thermal
stability, then crystallization occurs during heating cycles. The parameter ‘‘glass
stability’’, which is attributed to stability against crystallization, can be determined
from the characteristic temperatures Tg, Tx, and Tm, from the DTA curves. Two
parameters are commonly used to evaluate the thermal stability of glasses (S¼Tx–
Tg) and Hruby’s criterion, (Hr¼ (Tc–Tg)/(Tm–Tc)) [24]. Both parameters give
information on the stability of the glass against devitrification (better stability for
higher values). As shown in Table 1, for Er3þ-doped TZPPN glass with Tg¼ 282�C,
0 200 400 600 800Temperature °C
Tg
Tx
Tc
Tm
Ts
Figure 1. DTA profile of the TZPPN glass doped with Er3þ.
Philosophical Magazine 903
Dow
nloa
ded
by [
197.
0.0.
33]
at 0
5:43
27
Febr
uary
201
2

Ts¼ 335�C, Tx¼ 434�C and Tm¼ 536�C, the values of S and Hr are found to be
152K and 1.46, respectively. The S value is found to be higher than in Er3þ-doped
TeO2–ZnO [25], TeO2–ZnO–Na2O–Er2O3, TeO2–ZnO–Na2O–Er2O3–Yb2O3, TeO2–
ZnO–Na2O3–P2O5–Er2O3 [26], (60–x)TeO2–20ZnO–7.5Na2O–7.5Li2O–5Nb2O5–
xNd2O3 (x¼ 0.1, 1.0 and 2.0) [27] and Er3þ-doped TeO2–BaO(Li2O, Na2O)–La2O3
[28] glasses. So it can be concluded that the Er3þ-doped TZPPN glass shows good
glass-forming tendency and stability against devitrification.
4.2. Optical properties
The measured absorption spectra in the UV–Vis-NIR range of TZPPN glass doped
with Er3þ glass is shown in Figure 2. The optical absorption edge is an important
parameter for describing solid-state materials. The optical absorption edge for
disordered materials is interpreted in terms of direct or indirect transition across an
optical band gap. For absorption by indirect transition, the absorption coefficient,
�ð!Þ, is given by [7]:
�ð!Þ ¼A �h!� Eopt
� �r�h!
ð15Þ
where, �ð!Þ is the absorption coefficient, A is a constant, Eopt is the optical band edge
and �h! is the photon energy of the incident radiation. r is an index which can be
assumed to possess values of 1/2, 3/2, 2 and 3, depending on the nature of the
transition. The optical band edge is obtained by extrapolating from the linear range
in the plots of ��h!ð Þ1=2
versus �h!, as shown in Figure 3. The value of the optical
energy gap for TZPPN doped with Er3þ glass equals 3.1 eV.
Table 1. Density, glass transition, softening temperature, onset crystallization temperature,thermal stability, Hruby‘s criterion, refractive index at different wavelengths, Abbe number,Sellmeier energy gap, dispersion energy and band energy gap of the Er3þ-doped TZPPN glass.
Parameters
Wavelength (nm)
435.84 479.98 546.06 643.8
Density � (g cm�3) 5.788Glass transition temperature Tg (
�C) 282Softening temperature Ts (
�C) 335Onset crystallizationtemperature Tx (
�C)434
S¼Tx–Tg (�C) 152
Melting temperature Tm (�C) 536Hruby’s criterion Hr 1.49Refractive index n0 2.1987 2.1630 2.1290 2.1000Abbe number d 17.9Band gap Eg (eV) 3.1Sellmeier energy gap Es (eV) 6.59Dispersion energy Ed (eV) 20.52
904 E.S. Yousef et al.
Dow
nloa
ded
by [
197.
0.0.
33]
at 0
5:43
27
Febr
uary
201
2

0 500 1000 1500 2000 2500 3000 3500Wavelength (nm)
0.2
0.4
0.6
0.8
1
Abs
orpt
ion
(a.u
.)
1400 1440 1480 1520 1560 1600 1640Wavelength (nm)
0.08
0.12
0.16
0.2
0.24
0.28
Abs
orpt
ion
(a.u
.)
(a) (b)
Figure 2. UV, Vis and NIR transmission spectra of the TZPPN glass doped with Er3þ (samplethickness: 1mm).
2.7 2.8 2.9 3 3.1 3.2 3.3(hν) in eV
1
2
3
4
Figure 3. �hð Þ1=2 as a function of h for the TZPPN glass doped with Er3þ.
Philosophical Magazine 905
Dow
nloa
ded
by [
197.
0.0.
33]
at 0
5:43
27
Febr
uary
201
2

The linear refractive index measured at wavelengths of 435.8, 479.98, 546.1 and643.8 nm as well as the Abbe number are summarised in Table 1. It is observed thatthe prepared glass has a high refractive index (n¼ 2.2123 at 435 nm) and an Abbenumber of d¼ 17.9. The linear refractive index depends on wavelength and wasfound to follow the Wemple relation [29], given as follow:
1
n2ðEÞ � 1¼
Es
Ed�
E2
EsEdð16Þ
where Es is the so-called Sellmeier gap energy and Ed is the dispersion energy.Figure 4 shows a plot of 1/(n2(E)–1) versus E2 for the prepared glass. From the linearregression, values of Es and Ed are obtained. The Ed and Es values equal 20.52 eVand 6.59 eV, respectively.
4.3. Calculation of spectroscopic parameters and discussions
The Judd–Ofelt (JO) theory has been widely used for predicting the possibility oflaser action, as well as optical amplification, through an analysis of the forcedelectric dipole transitions within the 4fn configuration of rare-earth ions in differentisotropic lattices (crystalline and amorphous) [21]. The JO approach is based onmeasured absorption line strengths at room temperature to achieve a maximumpopulation of the Stark sublevels in the ground state, so that the assumption of equalpopulation of such sublevels becomes fulfilled.
Figure 5 shows the absorption spectrum of TZPPN glass doped with Er3þ in thewave number range 5000–26,000 cm�1. Er3þ-doped TZPPN glass has numerousabsorption bands located at 6600, 10,252, 12,450, 15,278, 18,336, 19,121 and
30
2 4 6 8(hn)2 in eV2
0.26
0.27
0.28
0.29
0.3
1/(n
2 –1)
Y = –0.007399181243 * X + 0.3209638316
Coeff. of determination, R-squared = 0.999525
Figure 4. Dependency of the refractive index on the photon energy (illustrated as 1/(n2–1)versus (h)2 of the TZPPN glass doped with Er3þ.
906 E.S. Yousef et al.
Dow
nloa
ded
by [
197.
0.0.
33]
at 0
5:43
27
Febr
uary
201
2
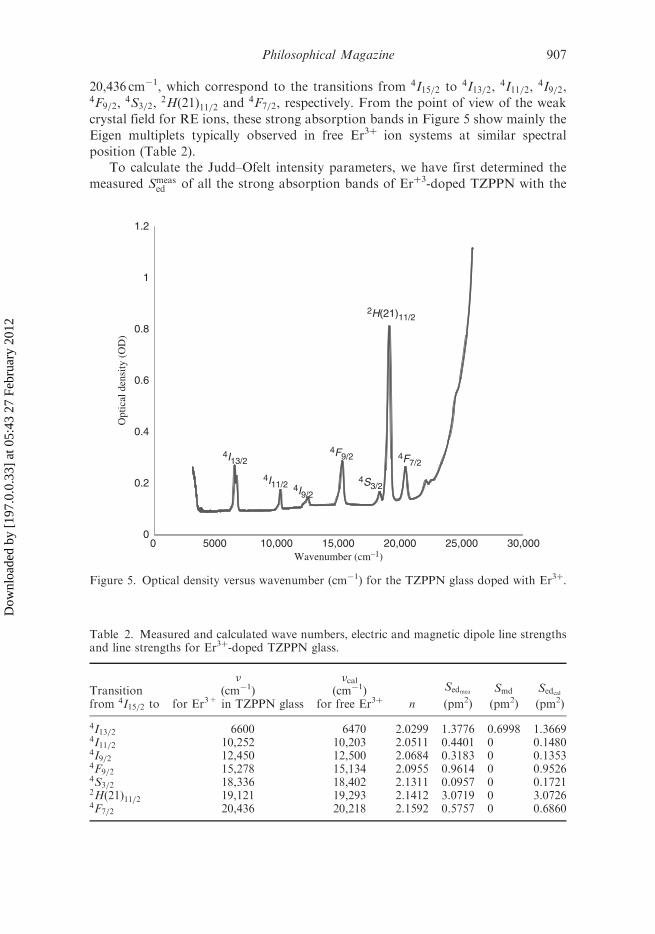
20,436 cm�1, which correspond to the transitions from 4I15=2 to 4I13=2,4I11=2,
4I9=2,4F9=2,
4S3=2,2Hð21Þ11=2 and 4F7=2, respectively. From the point of view of the weak
crystal field for RE ions, these strong absorption bands in Figure 5 show mainly the
Eigen multiplets typically observed in free Er3þ ion systems at similar spectral
position (Table 2).To calculate the Judd–Ofelt intensity parameters, we have first determined the
measured Smeased of all the strong absorption bands of Erþ3-doped TZPPN with the
0
0.2
0.4
0.6
0.8
1
4I13/2
4I11/24S3/2
4F7/2
4F9/2
2H(21)11/2
4I9/2
1.2
0 5000 10,000 15,000 20,000 25,000 30,000
Opt
ical
den
sity
(O
D)
Wavenumber (cm–1)
Figure 5. Optical density versus wavenumber (cm�1) for the TZPPN glass doped with Er3þ.
Table 2. Measured and calculated wave numbers, electric and magnetic dipole line strengthsand line strengths for Er3þ-doped TZPPN glass.
Transitionfrom 4I15=2 to
(cm�1)
for Er3+ in TZPPN glass
cal(cm�1)
for free Er3þ n
Sedmea
(pm2)
Smd
(pm2)
Sedcal
(pm2)
4I13=2 6600 6470 2.0299 1.3776 0.6998 1.36694I11=2 10,252 10,203 2.0511 0.4401 0 0.14804I9=2 12,450 12,500 2.0684 0.3183 0 0.13534F9=2 15,278 15,134 2.0955 0.9614 0 0.95264S3=2 18,336 18,402 2.1311 0.0957 0 0.17212Hð21Þ11=2 19,121 19,293 2.1412 3.0719 0 3.07264F7=2 20,436 20,218 2.1592 0.5757 0 0.6860
Philosophical Magazine 907
Dow
nloa
ded
by [
197.
0.0.
33]
at 0
5:43
27
Febr
uary
201
2

aid of Equation (8) using the integrated absorption values and refractive index of the
glass at the concerned band’s wavelength. To calculate the integrated absorption of
the bands, the base glass corrected absorption spectrum was used after necessary
correction for the overall rise in the base line.Although most of the transitions are electric dipole in nature, in the case of the
transition 4I15=2 to4I13=2, the contribution of magnetic dipole transitions to the total
transition probability is fairly high. So, the magnetic dipole contribution was
included in the expression while calculating the line strength of 4I15=2!4I13=2
transition. Such Smeased values of different transitions are given in Table 2. The three
intensity parameters �k(k ¼ 2, 4, 6) of Er3þ ions in TZPPN glass were calculated
from the measured electric dipole line strengths Smeased by using Equation (1). The
values of the squares of reduced matrix elements for the transitions were taken from
[30]. The best-fitted values obtained are �2¼ 4.4662 pm2, �4¼ 1.3880 pm2 and
�6¼ 0.7882 pm2.These intensity parameters follow the tendency �2 4�4 4�6 found for other
materials containing Er3þ ion [31–34]. It is known that �2 is closely related to the
local symmetry of the ligand field [35] and, therefore, to the hypersensitive
transitions [36]. The �2 parameter is an indication of the extent of covalent bonding
between the rare earth ion and the surrounding ligand atom. An increase in the value
of �2 is attributed to stronger covalent bonding with the host matrix. The larger
number of impurities will thus occupy sites with non-centrosymmetric potential,
which is known to contribute significantly to �2 [37]. The parameter �6 is inversely
proportional to Er–O band covalency, since it is more strongly affected by the
overlap integrals of 4f and 5 d orbitals than �2 and �4 [38]. The �2 parameter is
comparably larger than �4 and �6, and hence it might be due to the4I15=2!
2Hð21Þ11=2 hypersensitive absorption transition. The �4 and �6 parameters
are dominant for the 4I13/2!4I15/2 transition, which is the possible laser transition of
the Er3þ ion in the infrared range. The �2 values of tellurite glasses are larger than
those of other glasses due to the large polarization of Te4þ and the asymmetry of the
structural units in the tellurite glasses. The spectroscopic quality factor �4=�6 of the
present glass is determined to be 1:761, which is better than some values reported
from former studies performed from other compositions TeO2–Nb2O5–Na2O–Er2O3
[39], TeO2–WO3–Bi2O3–Er2O3 [40], TeO2–ZnO–K2O–Er2O3 [41], TeO2–ZnO–Li2O–
Er2O3 [42], TeO2–ZnO–Na2O–Er2O3, TeO2–ZnO–Na2O–Er2O3–Yb2O3, TeO2–
ZnO–Na2O3–P2O5–Er2O3 [43]. The high values of the spectroscopic quality factor
suggest that the described erbium-doped glass can be used as a laser material [11].Using the intensity parameters �k(k ¼ 2, 4, 6) of Er3þ ions in TZPPN glass, it is
also possible to calculate the theoretical values of the electric dipole line strengths
Scalced of different transitions using Equation (1). These are also given in Table 2. The
Sed values are found to be large resulting, from high spontaneous emission
probabilities (Aed). The root mean square deviation �rms of the deviations between
the measured and calculated values of electric dipole line strengths was determined
using Equation (9) to check the reliability of the data. Its value obtained 0.02 X 10⁻²
demonstrates good reliability of the data.The dielectric dipole contribution of Er3þ ions in the TZPPN glass varies with the
host composition and structure, where the �4 and V6 parameters are dominant for
908 E.S. Yousef et al.
Dow
nloa
ded
by [
197.
0.0.
33]
at 0
5:43
27
Febr
uary
201
2

the 4I13/2!4I15/2 transitions, which is the possible laser transition of Er3þ ion in the
infrared range.Using the �k values, various important radiative properties of a respective
radiative transitions, such as the radiative transition probability (A),branching ratios
(�), and the lifetime �r of the radiative transition for various excited states of Er3þ
ions in TZPPN glass were also calculated using Equations (10)–(14). The calculated
values of the above radiative parameters are listed in Table 3. The luminescence
branching ratio (�) is a critical parameter to the laser designer because it
Table 3. Electric dipole type transition probabilities (Aed), magnetic dipole type transitionprobabilities (Amd), branching ratios �ð Þ and the radiative lifetimes �ð Þ of the energy levels ofEr3þ-doped TZPPN glass.
TransitionsAverage
wavenumber (cm�1)
(Aed)
(s�1)
(Amd)
(s�1) � %ð Þ �r (ms)
4I13=2 !4I15=2 6,600 172.7 86.847 100 3.8529
4I11=2 !4I15=2 10,252 250.78 0 88.885 3.5444
! 4I13=2 3652 11.336 20.023 11.1154I9=2 !
4I15=2 12,450 402.19 0 89.676 2.2297
! 4I13=2 5850 41.724 0 9.3032
! 4I11=2 2198 2.2131 2.3667 1.02124F9=2 !
4I15=2 15,278 2356.2 0 81.207 0.34466
! 4I13=2 8678 431.78 0 14.882
! 4I11=2 5026 83.883 14.602 3.3944
! 4I9=2 2828 14.943 0.04268 0.51654S3=2 !
4I15=2 18,336 1080.3 0 72.17 0.66802
! 4I13=2 11,736 283.28 0 18.924
! 4I11=2 8084 92.583 0 6.1847
! 4I9=2 5886 35.736 0 2.3873
! 4F9=2 3058 5.0114 0 0.334782H11=2 !
4I15=2 19,121 13340 0 69.354 0.051988
! 4I13=2 12,521 3745.9 135.49 20.179
! 4I11=2 8869 1331.3 0.74654 6.9248
! 4I9=2 6671 566.52 5.3425 2.973
! 4F9=2 3843 108.31 0.29999 0.56462
! 4S3=2 785 0.9231 0 0.00484F7=2 !
4I15=2 20,436 4726.2 0 65.710 0.13903
! 4I13=2 13,836 1466.8 0 20.392
! 4I11=2 10,184 584.9 0 8.1319
! 4I9=2 7986 282.04 23.882 4.2533
! 4F9=2 5158 75.993 26.477 1.4246
! 4S3=2 2100 5.1284 0 0.0713
! 2H11=2 1315 1.2592 0 0.0175
Philosophical Magazine 909
Dow
nloa
ded
by [
197.
0.0.
33]
at 0
5:43
27
Febr
uary
201
2

characterises the possibility of attaining stimulated emission from specific transi-tions. In the present work, the spontaneous transition probability (Aed), thebranching ratio (�), and the spontaneous radiative lifetime (�r) of
4I13/2!4I15/2 are
equal to 172.7 s�1, 100% and 3.8529ms, respectively.
5. Conclusions
In this study, we report the thermal and optical properties of a new tellurite glasswith the composition 76TeO2 � 10ZnO � 9.0PbO � 1.0PbF2 � 3.0Na2O � 1.0Er2O3. Theprepared glass has a high density of �¼ 5.788 g cm�3 and good thermal stabilities(S¼ 152K). It is observed that the prepared glass has a high refractive index(n¼ 2.2123 at 435 nm) and a high optical energy gap Eg¼ 3.1 eV. The dispersionenergy (Ed¼ 20.52 eV) and Sellmeier energy (Es¼ 6.59 eV) of the present glass havebeen estimated on the basis of the wavelength dependency of the linear refractiveindices, n. From the absorption spectrum, the Judd–Ofelt intensity parameters Vt,Sed, Smd, Aed, Amd, � and �r of Er
3þ ions in TZPPN glass have been calculated. Thespectroscopic quality factor, �4=�6 (¼1.761) and the luminescence branching ratio(�)¼ 100% of the 4I13/2!
4I15/2 transition in Er3þ ions were found to be larger thanthose reported in the literature for other host materials. This leads to largerspontaneous transition probabilities in the studied glass.
Acknowledgments
This research was supported by a Grant of King Abdulaziz City for Science and Technology(Code Number: 10-ADV1160-07) from the King of Saudi Arabia.
References
[1] S.H. Kim and T. Yoko, J. Am. Ceram. Soc. 78 (1995) p.1061.[2] J.S. Wang, E.M. Vogel and E. Snitzer, Opt. Mater. 3 (1994) p.187.[3] U. Hoppe, E. Yousef, C. Russel, J. Neuefeind and A.C. Hannon, Solid State Commun.
123 (2002) p.273.
[4] L. Baia, M. Bolboaca, W. Kiefer, E.S. Yousef, C. Russel, F.W. Breitbarth and
T.G. Mayerhofer, J. Popp, Phys. Chem. Glasses 45 (2004) p.178.[5] U. Hoppe, E. Yousef, C. Russel, J. Neuefeind and A.C. Hannon, J. Phys.: Condens.
Matter 16 (2004) p.1645.[6] E. Yousef, M. Hotzel and C. Russel, J. Non-Cryst. Solids 342 (2004) p.82.
[7] E. Yousef, M. Hotzel and C. Russel, J. Non-Cryst. Solids 353 (2007) p.333.[8] E. Yousef, M. Hotzel and C. Russel, J. Non-Cryst. Solids. 354 (2008) p.4675.[9] V.K. Rai and S.B. Rai, Spectrochim. Acta A 68 (2007) p.1406.[10] M. Letz, U. Peuchert, B. Schreder, K. Senschal and R.S. Hayder, J. Non-Cryst. Solids 352
(2005) p.1067.
[11] J. Coelho, J. Azevedo, G. Hungerford and N. Sooraj Hussain, Opt. Mater. 33 (2011),
p.1167.[12] Y. Yang, Z. Yang, P. Li, Q. Guo and B. Chen, Opt. Mater. 32 (2009) p.133.[13] N.V.V. Prasad, K. Annapurna, N. Sooraj Hussin and S. Buddhudu, Mater. Lett. 57
(2003) p.2071.
910 E.S. Yousef et al.
Dow
nloa
ded
by [
197.
0.0.
33]
at 0
5:43
27
Febr
uary
201
2

[14] H. Chen, Y.H. Liu, Y.F. Zhou and Z.H. Jiang, J. Alloys Compd. 397 (2005) p.286.[15] H. Lin, S. Jiang, J. Wu, F. Song, N. Peyghambarian and E.Y.B. Pun, J. Phys. D: Appl.
Phys. 36 (2003) p.812.[16] P. Nandi and G. Jose, Opt. Commun. 265 (2006) p.588.
[17] B.R. Judd, Phys. Rev. 127 (1962) p.750.[18] B.R. Judd, Proc. Phys. Soc. 74 (1959) p.330.[19] G.S. Ofelt, J. Chem. Phys. 37 (1962) p.511.
[20] W.T. Carnall, P.R. Fields and B.G. Wybourne, J. Chem. Phys. 42 (1965) p.3797.[21] A. Lira, I. Camarillo, E. Camarillo, F. Ramos, M. Flores and U. Caldino, J. Phys.:
Condens. Matter 16 (2004) p.5925.
[22] R. Guo, Y. Wu, P. Fu and F. Jing, Chem. Phys. Lett. 416 (2005) p.133.[23] B.M. Walsh, Judd-Ofelt Theory: Principles and Practices, Advances in Spectroscopy for
Lasers and Sensing, 2006 Springer, Dordrecht, 2006, pp. 403–433.
[24] A. Hruby, Czech, J. Phys. B 22 (1972) p.1187.[25] M.R. Sahar, K. Sulhadi and M.S. Rohani, J. Non-Cryst. Solids 354 (2008) p.1179.[26] I. JIassi, H. Elhouichet, M. Ferid and C. Barthou, J. Lumin. 130 (2010) p.2394.[27] S.S. Babu, R. Rajeswari, K. Jang, C.E. Jin, K.H. Jang, H.J. Seo and C.K. Jayasankar,
J. Lumin. 130 (2010) p.1021.[28] M.J. Weber, J.D. Myers and D.H. Blackburn, J. Appl. Phys. 52 (1981) p.2944.[29] S.H. Wemple, J. Chem. Phys. 67 (1977) p.2151.
[30] R. Maalej, M. Dammak, S. Kamoun, J.-L. Deschanvres and M. Kamoun, J. Lumin. 126(2007) p.165.
[31] A.C. Lira, E. Martın-Rodrıguez, R. Martınez-Martınez, I. Camarillo, G.H. Munoz,
J. Garcia-Sole and U. Caldino, Opt. Mater. 32 (2010) p.1266.[32] M. Di Domenico Jr and S.H. Wemple, J. Appl. Phys. 40 (1969) p.720.[33] Y. Chen, M. Huang, R. Chen and Z. Luo, Opt. Mater. 25 (2004) p.271.[34] R. Rolli, M. Montagna, S. Chaussedent, A. Monteil, V.K. Tikhomirow and M. Ferrari,
Opt. Mater. 21 (2003) p.473.[35] S. Tanabe, T. Ohyagi, N. Soga and T. Hanada, Phys. Rev. B 46 (1992) p.3305.[36] R.D. Peacock, Structure and Bonding 22, Springer, Berlin, 1975, p.83.
[37] R. Reisfeld and C.K. Jorgensen, Excited State Phenomena in Vitreous Materials HandBook on the Physics and Chemistry of Rare Earths, North- Holland, Amsterdam, 1987.
[38] S. Tanabe, T. Ohyagi, S. Todoroki, T. Hanada and N. Soga, J. Appl. Phys. 73 (1993)
p.8451.[39] H. Lin, S. Jiang, J. Wu, N. Peyghambarian and E.Y.B. Pun, J. Phys. D: Appl. Phys. 36
(2003) p.812.
[40] X. Shen, Q. Nei, T. Xu and Y. Gao, Spectrochim. Acta A 61 (2005) p.2827.[41] D.H. Cho, Y.G. Choi and K.H. Kim, ETRI J. 23 (2001) p.151.[42] H. Desirena, E. De la Rosa, A. Shulzgen, S. Shaber and N. Peyghambarian, J. Phys.
D Appl Phys. 41 (2008) p.095102.
[43] C.K. Jorgensen and R. Reisfeld, J. Less Common Metals 93 (1983) p.107.
Philosophical Magazine 911
Dow
nloa
ded
by [
197.
0.0.
33]
at 0
5:43
27
Febr
uary
201
2