Estimation of soil hydraulic properties using proximal spectral reflectance in visible,...
12
Estimation of soil hydraulic properties using proximal spectral reflectance in visible, near-infrared, and shortwave-infrared (VIS–NIR–SWIR) region Priyabrata Santra a , Rabi Narayan Sahoo b , Bhabani Sankar Das a, ⁎, Ravindra Nath Samal c , Ajit Kumar Pattanaik c , Vinod Kumar Gupta b a Agricultural and Food Engineering Department, Indian Institute of Technology, Kharagpur, West Bengal, 721302, India b Division of Agricultural Physics, Indian Agricultural Research Institute, New Delhi,110012, India c Chilika Development Authority, C-11, BJB Nagar, Bhubaneswar, Orissa, 751014, India abstract article info Article history: Received 22 May 2008 Received in revised form 29 April 2009 Accepted 1 July 2009 Available online 24 July 2009 Keywords: Pedotransfer functions Spectrotransfer functions Water retention parameters Saturated hydraulic conductivity Proximal spectral reflectance VIS–NIR–SWIR Characterization of soil hydraulic properties is an important step for assessing soil water regime in agricultural fields. Because direct measurement of soil hydraulic properties at multiple locations is costly and time-consuming, pedotransfer functions (PTF) are conveniently used to estimate these properties from easily measurable basic soil properties. Over the last two decades, several studies have demonstrated that basic soil properties of surface soils may be rapidly estimated by measuring soil spectral reflectance. In this study, we evaluated a PTF approach to use proximal spectral reflectance over the visible, near-infrared, and shortwave- infrared (VIS–NIR–SWIR) region (350–2500 nm) as predictor variable in place of basic soil properties. To develop these transfer functions, spectral reflectance of air-dried and sieved soil samples was measured using a handheld spectroradiometer equipped with a contact probe. Transfer functions in the form of multiple linear regression relationships between soil hydraulic properties and different attributes of measured spectral reflectance were developed. These new transfer functions are called spectrotransfer functions (STF). Both the parametric PTFs and STFs for the parameters of van Genuchten water retention model (α and n) and point PTF for saturated hydraulic conductivity (K s ) were evaluated using the root-mean-squared error (RMSE). Results show that STFs have the similar accuracy as PTFs for estimating hydraulic properties. Specifically, STFs developed with the absorption features of proximal spectral reflectance performed better than the PTFs for estimating α. Among three hydraulic parameters for which the STFs were developed, van Genuchten parameter n is well predicted with comparatively lower values of RMSE. Thus, this study shows that proximal spectral reflectance of soil may be used for rapid estimation of soil hydraulic properties in a large area with accuracy comparable to PTFs. A rigorous testing in different geographical regions is warranted to establish the utility of STFs as a method for estimating soil hydraulic properties. © 2009 Elsevier B.V. All rights reserved. 1. Introduction Water retention characteristics (relationship between volumetric water content, θ and matric potential head, h) and saturated hydraulic conductivity (K s ) are two soil hydraulic parameters required for assessing water regime in saturated and unsaturated soils. These two properties also serve as critical inputs for detailed hydrological models that are used for making water resource planning at various scales. Both these soil properties are spatially and temporally variable (Hills et al., 1992) and depend on a specific measurement method (Lee et al., 1985; Paige and Hillel, 1993). Estimation of hydraulic properties at multiple locations even within an agricultural field is time-consuming and costly (Romano and Palladino, 2002). Over the last few decades, the pedotransfer function (PTF) approach has been advocated as an alternative method for estimating soil hydraulic properties (Bouma, 1989; Rawls et al., 1991; Schaap et al., 1998; Wösten et al., 2001; McBratney et al., 2002; Pachepsky et al., 2006). Typically, PTFs are expressed in terms of linear (Rawls et al., 1982; Vereecken et al., 1989; Tomasella and Hodnett, 1998) or non-linear (Scheinost et al., 1997; Wösten et al., 1999; Hodnett and Tomasella, 2002) regression equations using basic soil properties as predictor variables (Rawls et al., 1982; Vereecken et al., 1989; Tomasella and Hodnett, 1998; Wösten et al., 1999; Schaap et al., 2001). Recently, topographic features (Pachepsky et al., 2001; Romano and Palladino, 2002) and vegetation indices (Sharma et al., 2006) have also been considered as predictor variables in PTFs. Similarly, advanced model- ing techniques such as artificial neural network (ANN) (Schaap et al., 1998; Tamari and Wösten, 1999; Schaap et al., 2001; Minasny and McBratney, 2002; Minasny et al., 2004; Jana et al., 2008) or k-nearest neighborhood (Nemes et al., 2006) approaches have been proposed. Geoderma 152 (2009) 338–349 ⁎ Corresponding author. Tel.: +91 3222 283162; fax: +913222 282244. E-mail address: [email protected] (B.S. Das). 0016-7061/$ – see front matter © 2009 Elsevier B.V. All rights reserved. doi:10.1016/j.geoderma.2009.07.001 Contents lists available at ScienceDirect Geoderma journal homepage: www.elsevier.com/locate/geoderma
-
Upload
johannesburg -
Category
Documents
-
view
0 -
download
0
Transcript of Estimation of soil hydraulic properties using proximal spectral reflectance in visible,...
Geoderma 152 (2009) 338–349
Contents lists available at ScienceDirect
Geoderma
j ourna l homepage: www.e lsev ie r.com/ locate /geoderma
Estimation of soil hydraulic properties using proximal spectral reflectance in visible,near-infrared, and shortwave-infrared (VIS–NIR–SWIR) region
Priyabrata Santra a, Rabi Narayan Sahoo b, Bhabani Sankar Das a,⁎, Ravindra Nath Samal c,Ajit Kumar Pattanaik c, Vinod Kumar Gupta b
a Agricultural and Food Engineering Department, Indian Institute of Technology, Kharagpur, West Bengal, 721302, Indiab Division of Agricultural Physics, Indian Agricultural Research Institute, New Delhi, 110012, Indiac Chilika Development Authority, C-11, BJB Nagar, Bhubaneswar, Orissa, 751014, India
⁎ Corresponding author. Tel.: +91 3222 283162; fax:E-mail address: [email protected] (B.S. Das).
0016-7061/$ – see front matter © 2009 Elsevier B.V. Adoi:10.1016/j.geoderma.2009.07.001
a b s t r a c t
a r t i c l e i n f oArticle history:Received 22 May 2008Received in revised form 29 April 2009Accepted 1 July 2009Available online 24 July 2009
Keywords:Pedotransfer functionsSpectrotransfer functionsWater retention parametersSaturated hydraulic conductivityProximal spectral reflectanceVIS–NIR–SWIR
Characterization of soil hydraulic properties is an important step for assessing soil water regime inagricultural fields. Because direct measurement of soil hydraulic properties at multiple locations is costly andtime-consuming, pedotransfer functions (PTF) are conveniently used to estimate these properties from easilymeasurable basic soil properties. Over the last two decades, several studies have demonstrated that basic soilproperties of surface soils may be rapidly estimated by measuring soil spectral reflectance. In this study, weevaluated a PTF approach to use proximal spectral reflectance over the visible, near-infrared, and shortwave-infrared (VIS–NIR–SWIR) region (350–2500 nm) as predictor variable in place of basic soil properties. Todevelop these transfer functions, spectral reflectance of air-dried and sieved soil samples was measured usinga handheld spectroradiometer equipped with a contact probe. Transfer functions in the form of multiplelinear regression relationships between soil hydraulic properties and different attributes of measuredspectral reflectance were developed. These new transfer functions are called spectrotransfer functions (STF).Both the parametric PTFs and STFs for the parameters of van Genuchten water retention model (α and n) andpoint PTF for saturated hydraulic conductivity (Ks) were evaluated using the root-mean-squared error(RMSE). Results show that STFs have the similar accuracy as PTFs for estimating hydraulic properties.Specifically, STFs developed with the absorption features of proximal spectral reflectance performed betterthan the PTFs for estimating α. Among three hydraulic parameters for which the STFs were developed, vanGenuchten parameter n is well predicted with comparatively lower values of RMSE. Thus, this study showsthat proximal spectral reflectance of soil may be used for rapid estimation of soil hydraulic properties in alarge area with accuracy comparable to PTFs. A rigorous testing in different geographical regions is warrantedto establish the utility of STFs as a method for estimating soil hydraulic properties.
© 2009 Elsevier B.V. All rights reserved.
1. Introduction
Water retention characteristics (relationship between volumetricwater content, θ and matric potential head, h) and saturated hydraulicconductivity (Ks) are two soil hydraulic parameters required forassessing water regime in saturated and unsaturated soils. These twoproperties also serve as critical inputs for detailed hydrological modelsthat are used for making water resource planning at various scales.Both these soil properties are spatially and temporally variable (Hillset al., 1992) and depend on a specific measurement method (Lee et al.,1985; Paige and Hillel, 1993). Estimation of hydraulic properties atmultiple locations evenwithin an agricultural field is time-consumingand costly (Romano and Palladino, 2002). Over the last few decades,
+91 3222 282244.
ll rights reserved.
the pedotransfer function (PTF) approach has been advocated as analternative method for estimating soil hydraulic properties (Bouma,1989; Rawls et al., 1991; Schaap et al., 1998; Wösten et al., 2001;McBratney et al., 2002; Pachepsky et al., 2006).
Typically, PTFs are expressed in terms of linear (Rawls et al., 1982;Vereecken et al., 1989; Tomasella and Hodnett, 1998) or non-linear(Scheinost et al., 1997; Wösten et al., 1999; Hodnett and Tomasella,2002) regression equations using basic soil properties as predictorvariables (Rawls et al., 1982; Vereecken et al., 1989; Tomasella andHodnett, 1998; Wösten et al., 1999; Schaap et al., 2001). Recently,topographic features (Pachepsky et al., 2001; Romano and Palladino,2002) and vegetation indices (Sharma et al., 2006) have also beenconsidered as predictor variables in PTFs. Similarly, advanced model-ing techniques such as artificial neural network (ANN) (Schaap et al.,1998; Tamari and Wösten, 1999; Schaap et al., 2001; Minasny andMcBratney, 2002; Minasny et al., 2004; Jana et al., 2008) or k-nearestneighborhood (Nemes et al., 2006) approaches have been proposed.
339P. Santra et al. / Geoderma 152 (2009) 338–349
The performance of several PTFs has also been compared withavailable measurement methods. For example, Šimunek et al. (1998)compared the hydraulic properties measured with the tensioninfiltrometer with those obtained from class PTFs (Carsel and Parrish,1988) and ANN-based predictions (Schaap et al., 1998) and observedthat the ANN-based approach may be used as an alternative to directmeasurement of soil hydraulic properties. Similarly, Cornelis et al.(2001) showed that the PTFs developed by Vereecken et al. (1989) arebetter than nine different PTFs published in the literature. Morerecently, Jana et al. (2007) coupled the Bayesian ANN with a non-linear bias correction approach to predict soil hydraulic propertiesacross multiple spatial scales. Despite these developments, large setsof input data are still needed to develop reliable PTFs. In addition, thePTFs also needed to be locally developed (Hodnett and Tomasella,2002; Li et al., 2007). Creation of large soil database for region-specific PTF development is time-consuming and costly.
Over the last two decades, proximal spectral reflectance in thevisible, near-infrared, and shortwave-infrared (VIS–NIR–SWIR) region(350–2500 nm) has been successfully used for accurate and rapidestimation of soil properties such as particle size distributions, organicmatter contents, electrical conductivity, etc. (Henderson et al., 1989;Ben-Dor and Banin, 1995; Ben-Dor et al., 1997; Ben-Dor et al., 1999;Chang et al., 2001; Dunn et al., 2002; McCarty et al., 2002; Reeves etal., 2002; Shepherd andWalsh, 2002; Islam et al., 2003; Stevens et al.,2006; Viscara Rosel et al., 2006; Brown et al., 2006; Nanni andDemattê, 2006; Lagacherie et al., 2008). Estimation of soil propertiesvia proximal spectral reflectance is a convenient and rapid field-scalemeasurement approach although it is applicable only to surface soilcharacterization (Ben-Dor et al., 1999). Recently, Ben Dor et al. (2008)reported the use of frequency domain electromagnetic radiation(FDEM) and ground penetrating radar (GPR) in addition to the VIS–NIR–SWIR spectral data for assessing soil salinity of subsurface soil.Inasmuch as basic soil properties may be estimated from proximalspectral reflectance, it is hypothesized that soil hydraulic propertiesmay be related to spectral reflectance. Thus, similar to PTFs, spectro-transfer functions (STFs) may be developed to estimate hydraulicproperties from spectral reflectance. However, STFs are also requiredto be locally developed and should be based on large training datasetson soil hydraulic properties and spectral reflectance data.
Only two studies indicate that hydraulic properties may be relatedto proximal spectral reflectance (Thine et al., 2004; Janik et al., 2007).Both of these studies do not explicitly provide STFs. Thine et al. (2004)characterized soil degradation using relationships between soilhydraulic properties and spectral reflectance over the VNIR regionthrough the partial least square regression (PLSR) technique. Recently,Janik et al. (2007) have calibrated reflectance spectra in mid-infrared(MIR) region to estimate soil water content at various matric pressureheads using the PLSR technique. They also did not include theparametric approach for estimating soil water retention behaviour.Thus, the objective of the present study was to develop STFs for soilhydraulic properties from the proximal spectral reflectance data overthe VIS–NIR–SWIR region and test their performance with PTFs.
2. Materials and methods
2.1. Study area and soil sampling
The experimental data used in this study were collected from the‘Dengei Pahad micro-watershed’ (DPMW) (~42 km2), which is a partof the western catchment of Chilika Lake system in Orissa, India(Santra, 2009). The DPMW lies between 19°49′48″–19°52′8.4″ N and85°13′55.2″–85°14′34.8″ E. with elevations ranging from 27 to morethan 85m abovemean sea level. The land-use classes of thewatershedshow 42% agricultural land, 22% forested area with evergreen anddeciduous trees, and 36% wetlands with natural shrubs. Soil serieslevel data for the study area (NBSS&LUP, 2005) at a scale of 1:250,000
show five dominant soil series with the Nuagarh series occupyingabout 62% area of the watershed. Soils of this watershed are classifiedas Typic Haplustalfs. Surface (0–10 cm depth) soil samples werecollected from the DPMW in five sampling campaigns. Out of a total of100 soil samples collected, 23 samples were collected on a200 m×600 m grid during the first sampling campaign and the restof the samples were collected on a 1–2 km×1–2 km grid. Soils at thissite are generally sandy at high elevation areas and heavy clays at low-lying depression area. Agricultural land is confined to the lower reachof the watershed. Hill tops within the watershed are covered withsparse to dense vegetation.
During each sampling, undisturbed soil cores (5 cm internaldiameter and 6 cm long) and approximately 500 g of loose soil fromtop 10 cm layer were collected from each grid point. Soils were air-dried, ground and shifted through a 2 mm sieve and stored forchemical, physical, and spectral analysis. Processed soils wereanalyzed to determine particle density (ρp), bulk density (ρb), organiccarbon contents (OC) and particle size distribution using pycnometermethod (Flint and Flint, 2002), core method (Blake and Hartge, 1986),the chromic acid digestion method (Walkley and Black, 1934), and theinternational pipette method (Gee and Bauder, 1986), respectively.Soil pH and electrical conductivity (EC) were measured in 1:2.5 soil:water slurry. Saturated hydraulic conductivity (Ks) was determinedusing a constant head permeameter (Eijelkamp Agrisearch Equip-ment, Netherlands) (Klute and Dirksen, 1986). Measurements weretaken both in ‘constant head’ and ‘falling head’ modes depending onsoil texture. For heavy clay soils, only the falling head method wasadopted. For each soil sample, Ks measurements were repeated threetimes.
Water retention behaviour of each soil sample was determinedusing a tempecell setup connected to a pressure plate manifold. Watercontents were measured in soil cores (5 cm in diameter, 6 cm long) atsuccessive equilibrium pressures of 10, 20, 30, 40, 50, 60, 70 and80 kPa. Pressure head-water content (h−θ) data for different soilsamples were fitted to the van Genuchtenwater retention model (VanGenuchten, 1980):
Se =θ − θrθs − θr
� �=
11 + α jh jð Þn
� �1− 1n ð1Þ
where Se is the relative saturation, θr is the residual soil water content(cm3 cm−3), θs is the saturated soil water content (cm3 cm−3), h isthe matric potential head (cm) and α (cm−1) and n are shapeparameters of the water retention curve. Eq. (1) was used to estimatethe van Genuchten retention model parameters θr, α and n for eachsoil sample using the SOLVER function of the EXCEL spreadsheetProgram. Parameter θs was equated to soil porosity and was used as aconstant in Eq. (1).
2.2. Spectral reflectance of soil in VIS–NIR–SWIR region
Proximal spectral reflectance of processed soil samples (air-driedand ground soil samples sifted through 2 mm sieve) were recorded inthe VIS–NIR–SWIR region (350–2500 nm) in the laboratory using aportable spectroradiometer (Model: Field spec®3 FR, AnalyticalSpectral Devices Inc., USA). All spectral measurements were recordedusing a contact probe having 10 mm spot size and its own light sourcewith a 1500 h halogen bulb. The use of contact probe minimizes errorsassociated with stray light during measurements under solarillumination. Proximal spectral reflectance of each soil sample wasrecorded with respect to a 5″×5″ white reference (spectralon) panel(Labsphere, North Sutton, USA). Spectral reflectance data for each soilsample was generated by arithmetic averaging of 60 replicatedmeasurements for that sample. The reference panel reflectance wasmeasured before each sample measurement. Three main features ofthe proximal spectral reflectance spectra were used for analysis: a)
340 P. Santra et al. / Geoderma 152 (2009) 338–349
individual proximal spectral reflectance values [R(λ)] for eachwavelength, b) integrated proximal spectral reflectance values (here-inafter, referred to as band reflectance) for a selected wave bands, andc) continuum removal (CR) factor around absorption bands. The bandreflectance values were estimated by integrating R(λ) values over thebandwidths used in the Enhanced Thematic Mapper Plus (ETM+)sensor onboard Landsat-7 satellite. The ETM+ sensors collect dataover six VIS–NIR–SWIR regions and one thermal region. The spectralbands corresponding to ETM+ bands used in this study are: 450–520 nm (ETM+1), 520–600 nm (ETM+2), 630–690 nm (ETM+3),760–900nm(ETM+4),1550–1750nm(ETM+5), and 2080–2350nm(ETM+7). Hereinafter, these six bands are referred to as band-1 toband-6, respectively. The spectroradiometer-measured R(λ) valueswere integrated over these six bands using the following relationship:
Ri =
Pλliλui
R λð Þ/i λð Þ
Pλliλui
/i λð Þð2Þ
whereRi is the calculated ith band reflectance,λui is the upper boundaryof band i, λli is the lower boundary of band i, R(λ) is the reflectance forwavelength i, ϕ(λ) is the spectral response function of band i.
The raw soil spectra followed the same basic shape as described byother researchers (Ben-Dor et al., 1999; Shepherd and Walsh, 2002)with prominent absorption features around 1400, 1900, and 2200 nm(Chang et al., 2001; Shepherd andWalsh, 2002; Lagacherie et al., 2008).Significant variation in these three absorption features among soilsamples was also observed. The absorption features around 1400 and1900 nm are associated with OH functional group of free water(Shepherd and Walsh, 2002) and the absorption around 2200 nm isassociated with OH functional group of clay lattice (Chabrillat et al.,2002; Lagacherie et al., 2008). As these three absorption features arestrongly related with either free water or lattice water, therefore, thesemay not suitably be used in remotely sensed data where atmosphericwater vapour may weaken the signal/noise ratio or in field conditionwhere soil water content is highly variable. However, these absorptionfeatures for a grounded and air-dried soil may be characteristic ofspecific soil type and, hence, may be linked with the typical waterretention behaviour of a soil. Therefore, we have selected these threeabsorption features to be included as predictor variables for estimationof soil hydraulic properties. The CR factors are a unique way tocharacterize these absorption features (Lagacherie et al., 2008). Beforecalculating the CR factors, λpeak, λmin, and λmax of each absorptionfeature and corresponding reflectance [R(λpeak), R(λmin) and R(λmax)]were identified. The first derivative of spectral reflectance aroundabsorption features of each soil sample showed spikes and lowwithdR/dλ≈0 for a particular wavelength, which is considered as peakwavelength (λpeak). The mean of λpeak for all soil samples showed theabsorption peaks at 1414 nm, 1913 nm, and 2207 nmwavelengths withstandard deviation of ±2 nm. For each absorption feature, two localmaxima (λmin and λmax) on both sides of λpeak were identified using theinflection point of the reflectance spectra (d2R/dλ2). The mean localmaxima corresponding to each absorption feature were observed to be1329 and 1615 nm, 1860 and 2125 nm, and 2125 and 2257 nm,respectively. After identification of λpeak, λmin, and λmax, correspondingreflectance valueswere extracted from spectral data of each soil sample.The position of λpeak, λmin, and λmax for each absorption feature in fewselected reflectance spectra is shown in Fig. 1. The CR factor wascalculated from R(λpeak), R(λmin) and R(λmax) of each absorption bandusing the following relationship:
CRλ = min 1;R λpeak
� �
R λmaxð Þ + λmin − λpeakλmin − λmax
R λminð Þ− R λmaxð Þ½ �
24
35 ð3Þ
where, R(λpeak) is the reflectance at λpeak, R(λmin) is the reflectance atλmin, and R(λmax) is the reflectance at λmax. The calculated CR factors forthreeabsorptionpeaksat1414nm,1913nm, and2207nmare referred toas CR1414, CR1913, and CR2207.
2.3. Development of PTF
Before proceeding to PTF development, descriptive statistics of themeasured soil properties, band reflectance, andCR factorswere calculated.Each variable was checked for normality at 5% level of significance usingthe Kolmogorov–Smirnov (K–S) test statistics. Necessary transformationswere made for the variable, which did not follow normal distribution.Basic soil properties, proximal spectral reflectance, integrated bandreflectance, and CR factors were correlated with soil hydraulic propertiesusing Spearman correlation statistics. Basic soil properties, proximalspectral reflectance, integrated band reflectance, andCR factorswere usedas separate set of predictor variables for PTF/STF development. Besidesthese four sets, integrated band reflectance and CR factors were takentogether in a separate set. Therefore, a total of five sets of predictorvariables were formulated for PTF/STF development.
To reduce the heterodasticity in the dataset, stepwise regressionanalysis and principal component analysis (PCA)were done. In stepwiseregression analysis, important predictor variables were identified at 5%level of significance. Principal component analysis is generally applic-able for data with high dimension and large interdependency betweendata dimensions. Therefore, application of PCA with proximal spectralreflectance and integrated band reflectance spectra is moremeaningful.But to maintain similarity in the analysis, PCAwas applied to each set ofpredictor variables. Principal components, which describe about 95% ofthe total variation in data, were considered in final reduced data. TheEigen value of each principal component indicates the amount ofvariation in the dataset explained by that particular principal compo-nent. To establish the physical significance of the principal components,relationship between original variables and Eigenvectors, commonlyreferred to as factor loadings, were checked (Hair et al., 1995). Theoriginal variables with large absolute value of factor loadings for a givenprincipal component determine its physical significance. As a result ofthe stepwise regression and PCA analysis, each set of predictor variableswas divided into three subsets. The first subset consists of all predictorvariables of main set. The second subset consists of important predictorvariables in stepwise analysis. The third subset consists of majorprincipal components obtained after PCAof all predictor variables in themain set. With full reflectance spectra, only the set of major principalcomponents obtained through PCA were used as predictor variables.Therefore, a total of thirteen subsets of predictor variables (three subsetsfrom each of the first, second, third and fourth set and one from the fifthset) were formulated for PTF development.
The total dataset (N =100)was randomly divided into developmentdataset and validation dataset at a ratio of 3:1. The development datasetwas used for developing the PTFs whereas the validation dataset wasused for testing the performance of the PTFs. A point PTF for ln(Ks) andparametric PTFs for the van Genuchten parameters, α and n, weredeveloped through multiple linear regression equation of the form,
Y = a0 +Xkk=1
akXk ð4Þ
where Y is the dependent variable, Xk is the kth independent variable(input), a0, a1, a2, …, ak are regression coefficients and k is thenumber of independent variable in regression equation. The basic soilproperties and spectral information were taken as independentvariable and the hydraulic properties [In(Ks), ln(α), and n] weretaken as dependent variables in the Eq. (4) for developing PTFs/STFs.The multiple linear regression equations were developed using theregress function of MATLAB software.
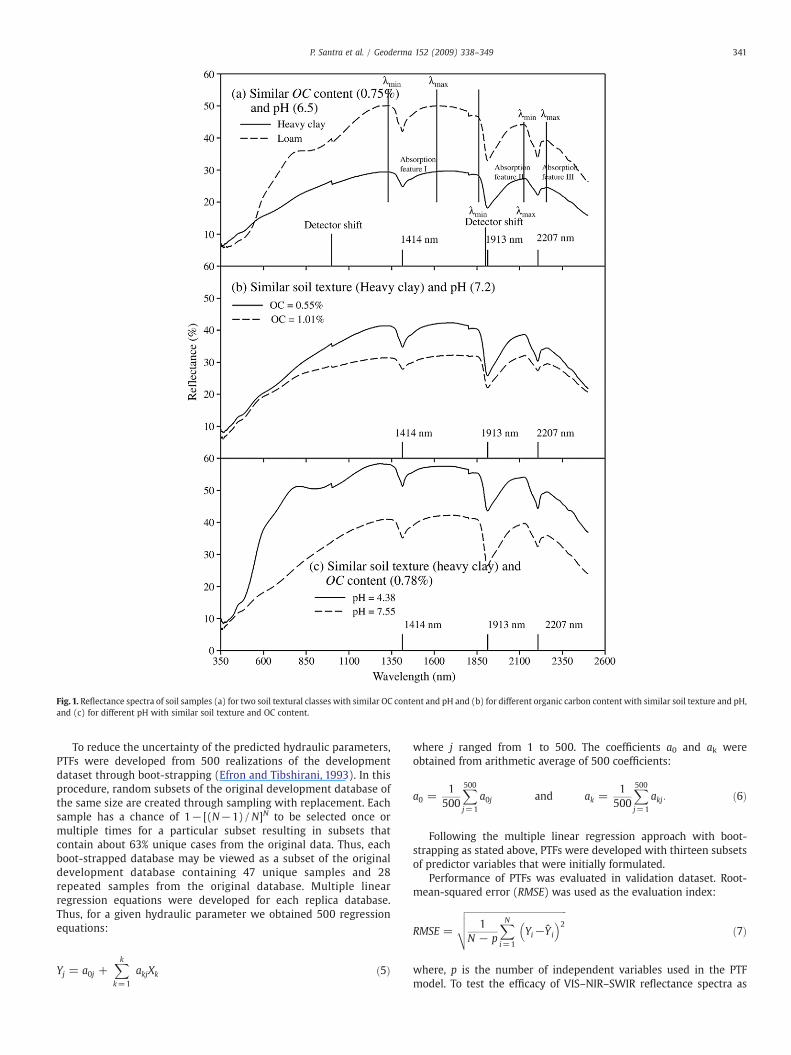
Fig. 1. Reflectance spectra of soil samples (a) for two soil textural classes with similar OC content and pH and (b) for different organic carbon content with similar soil texture and pH,and (c) for different pH with similar soil texture and OC content.
341P. Santra et al. / Geoderma 152 (2009) 338–349
To reduce the uncertainty of the predicted hydraulic parameters,PTFs were developed from 500 realizations of the developmentdataset through boot-strapping (Efron and Tibshirani, 1993). In thisprocedure, random subsets of the original development database ofthe same size are created through sampling with replacement. Eachsample has a chance of 1− [(N−1)/N]N to be selected once ormultiple times for a particular subset resulting in subsets thatcontain about 63% unique cases from the original data. Thus, eachboot-strapped database may be viewed as a subset of the originaldevelopment database containing 47 unique samples and 28repeated samples from the original database. Multiple linearregression equations were developed for each replica database.Thus, for a given hydraulic parameter we obtained 500 regressionequations:
Yj = a0j +Xkk=1
akjXk ð5Þ
where j ranged from 1 to 500. The coefficients a0 and ak wereobtained from arithmetic average of 500 coefficients:
a0 =1
500
X500j=1
a0j and ak =1
500
X500j=1
akj: ð6Þ
Following the multiple linear regression approach with boot-strapping as stated above, PTFs were developed with thirteen subsetsof predictor variables that were initially formulated.
Performance of PTFs was evaluated in validation dataset. Root-mean-squared error (RMSE) was used as the evaluation index:
RMSE =
ffiffiffiffiffiffiffiffiffiffiffiffiffiffiffiffiffiffiffiffiffiffiffiffiffiffiffiffiffiffiffiffiffiffiffiffiffiffiffiffiffiffiffiffiffi1
N − p
XNi=1
Yi−Y i
� �2
vuut ð7Þ
where, p is the number of independent variables used in the PTFmodel. To test the efficacy of VIS–NIR–SWIR reflectance spectra as
342 P. Santra et al. / Geoderma 152 (2009) 338–349
predictor for estimating hydraulic properties, performance of reflec-tance spectra-based PTFs were compared with basic soil property-based PTFs. Hereinafter, the reflectance spectra-based PTFs arereferred to as spectrotransfer functions (STF) for soil hydraulicproperties as suggested by Lagacherie et al. (2008).
3. Results and discussion
3.1. Soil properties and spectral information
Different physical, chemical, and spectral properties of soilscollected from the DPMW watershed are summarized in Table 1.Soils at this site hadwide variation in physical and chemical propertiesas is expected in a hillslope catena. For example, soil ρp ranged from2.40 to 3.00 g cm−3 with the mean ρp (2.55 g cm−3) less than theparticle density (2.65 g cm−3) generally assumed for mineral soils.Similarly, themeanρbwas1.51 g cm−3whileρb ranged from1.80 to2.00 gcm−3 for the red colored soils of high elevation areas and pastures. Veryloose soils of sandy clay loam texture with ρb as low as 1.00–1.20 g cm−3
were also observed for few cultivated areas. Mean OC content of the soilsamples was high (N0.75%) as per the rating for Indian soils (ICAR, 2006).Sand and clay contents also varied widely within the watershed. Sandcontents were observed to increase with elevation and the reverse wastrue for clay contents. Particle density showed the same trend withelevation possibly because of a strong correlation between ρp and sandcontent. A total of seven different textural classes were observed in thiswatershed although the majority of soil samples had either light claytexture having clay content N25% (N=36) or heavy clay texture havingclaycontentN45%(N=25) indicating thepresenceoffine textured soils inthe study area. Soils were generally acidic with pH values being as low as3.44 because of the presence of Fe- and Al-oxides. Saturated hydraulicconductivity also showed wide variation (KsN1000 cm day−1 for coarsetextured soils and Ksb0.1 cm day−1 for heavily textured soils). The vanGenuchten parameter, αwas log-normally distributed with a mean valueof−2.26. The mean value for the other van Genuchten parameter, nwas1.22. Kolmogorov–Smirnov test revealed that except for EC, Ks, and α, allother soil properties were normally distributed at 5% level of significance.
Proximal spectral reflectance for each soil sample generally increasesin the visible range and plateaus to amaximumvalue between 1500 and1700nmbefore it again decreases in the SWIR range. Each spectrumalsoshows characteristic reduction in spectral reflectance around 1414,1913,and 2207 nm wavelength. Fig. 1 shows the specific change in thesecharacteristics as influenced by texture (Fig. 1a), OC content (Fig. 1b),and pH (Fig. 1c). These figures show that the overall brightness
Table 1Descriptive statistics of soil properties and spectral information.
Soil properties and spectral information Minimum Maximum
Particle density (g cm−3) 2.30 3.03Bulk density (g cm−3) 1.11 2.00Organic carbon content (%) 0.07 2.10Sand content (%) 7.85 84.66Silt content (%) 4.40 37.38Clay content (%) 4.60 63.97pH (−) 3.44 8.72ln(EC) (dS m−1) 0.002 1.31ln(Ks) (cm day−1) −0.82 6.26ln(α) (cm−1) −5.81 1.51n (−) 1.03 1.54Band-1 (450–520 nm) 5.11 21.55Band-2 (520–600 nm) 8.73 32.34Band-3 (630–690 nm) 11.83 42.59Band-4 (760–900 nm) 16.96 50.85Band-5 (1550–1750 nm) 19.63 60.40Band-6 (2080–2350 nm) 16.47 54.27CR1414 0.55 0.93CR1913 0.46 0.87CR2207 0.54 0.91
decreases with the increase in fineness in soil texture (Fig. 1a) and pH(Fig.1c). The increase in brightnesswith increase in fineness of particleswas also reported by previous researchers (Ben-Dor et al., 2003;Goldshleger et al., 2004). Greater brightness of the reflection spectra foracidic soils may be due to the red coloration imparted by chromophoreslike Fe- andAl-oxides (Leone and Sommer, 2000). Fig.1b shows that soilOC content influences the reflection spectra primarily in the 1000–1900 nm because of absorption of shortwave infrared (SWIR) radiationby OC content.
Both band reflectance and CR factors obtained from proximalspectral reflectance data were normally distributed as observed fromresults of Kolmogorv–Smirnov test. Wide variation in each of six bandreflectance and three CR factor was observed. Lower value of CR factorwas observed for CR1913 compared to CR1414 and CR2207. Variation ofCR1913 among soil samples is also highest among three CR factors. Thisindicates that CR1913 is the most prominent absorption feature in thereflectance spectra.
3.2. Correlation among reflectance spectra, basic soil properties, andhydraulic properties
The effects of different soil properties on the proximal spectralreflectance are further explored using correlation analysis. Fig. 2shows that soil ρp shows maximum correlation (r=−0.49) with thespectral reflectance at 415 nm (Fig. 2a). Beyond 600 nm, ρp does notshow any correlation with the exception in absorption bands.Similarly, OC contents show maximum correlation (r=0.18) withthe spectral reflectance at 1829 nm. The amount of coarse (sand) andfine (silt and clay) soil particles present in a soil shows goodcorrelation with spectral reflectance (Fig. 2b); the correlationcoefficients were positive for the coarse fraction and negative forthe fine fractions. Fig. 2b shows that an increase in fineness of soiltexture due to dominance of silt and clay particles in soil may decreasespectral reflectance. Similar trend may also be seen in Fig. 1a. Strongercorrelation may also be observed between soil separates and theabsorption bands (Fig. 2b). This result suggests that the proximalspectral reflectance may be used as a substitute variable for sand, silt,and clay content of soil. Similarly, Fig. 2c shows that both soil pH andEC are positively correlatedwith spectral reflectance at the blue regionand negatively correlated for the rest of the spectrum. This figure alsoindicates that a decrease in pH and EC may increase spectralreflectance beyond 700 nm wavelength. The correlation of spectralreflectancewith soil pH and EC also indicates the possible substitutionof soil physiochemical properties with proximally measured spectral
Mean Standard deviation Skewness Kurtosis
2.55 0.14 1.08 4.661.51 0.18 0.09 2.810.93 0.38 0.39 3.46
48.71 17.80 −0.11 2.2616.70 6.02 0.36 3.1534.59 14.77 0.00 2.006.76 1.29 −0.62 2.550.14 1.13 −1.11 6.533.19 1.69 −0.28 2.39
−2.26 1.44 −0.04 2.821.22 0.09 1.00 4.42
13.25 3.71 −0.05 2.6819.02 5.01 0.36 3.0924.61 6.21 0.62 3.3832.04 7.29 0.35 2.7743.07 8.83 −0.14 2.3837.50 8.35 −0.20 2.480.83 0.06 −1.32 6.790.70 0.07 0.13 3.640.81 0.07 −1.12 4.71
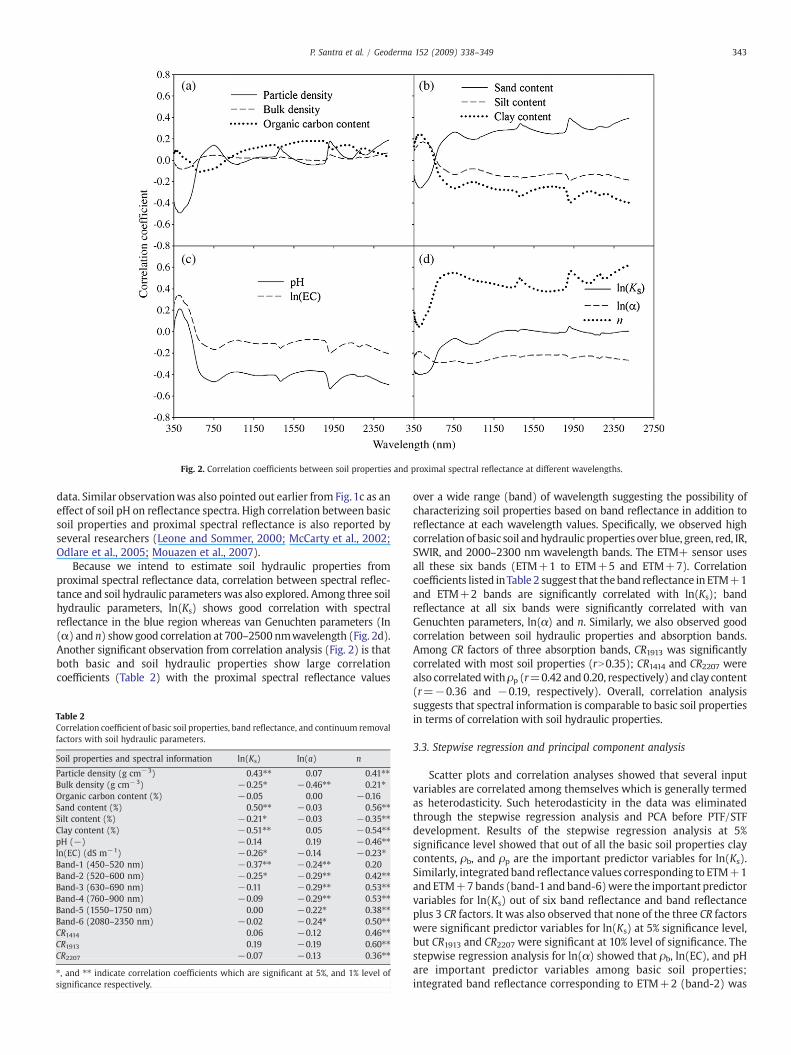
Fig. 2. Correlation coefficients between soil properties and proximal spectral reflectance at different wavelengths.
343P. Santra et al. / Geoderma 152 (2009) 338–349
data. Similar observationwas also pointed out earlier from Fig.1c as aneffect of soil pH on reflectance spectra. High correlation between basicsoil properties and proximal spectral reflectance is also reported byseveral researchers (Leone and Sommer, 2000; McCarty et al., 2002;Odlare et al., 2005; Mouazen et al., 2007).
Because we intend to estimate soil hydraulic properties fromproximal spectral reflectance data, correlation between spectral reflec-tance and soil hydraulic parameters was also explored. Among three soilhydraulic parameters, ln(Ks) shows good correlation with spectralreflectance in the blue region whereas van Genuchten parameters (In(α) and n) showgood correlation at 700–2500 nmwavelength (Fig. 2d).Another significant observation from correlation analysis (Fig. 2) is thatboth basic and soil hydraulic properties show large correlationcoefficients (Table 2) with the proximal spectral reflectance values
Table 2Correlation coefficient of basic soil properties, band reflectance, and continuum removalfactors with soil hydraulic parameters.
Soil properties and spectral information ln(Ks) ln(a) n
Particle density (g cm−3) 0.43⁎⁎ 0.07 0.41⁎⁎Bulk density (g cm−3) −0.25⁎ −0.46⁎⁎ 0.21⁎Organic carbon content (%) −0.05 0.00 −0.16Sand content (%) 0.50⁎⁎ −0.03 0.56⁎⁎Silt content (%) −0.21⁎ −0.03 −0.35⁎⁎Clay content (%) −0.51⁎⁎ 0.05 −0.54⁎⁎pH (−) −0.14 0.19 −0.46⁎⁎ln(EC) (dS m−1) −0.26⁎ −0.14 −0.23⁎Band-1 (450–520 nm) −0.37⁎⁎ −0.24⁎⁎ 0.20Band-2 (520–600 nm) −0.25⁎ −0.29⁎⁎ 0.42⁎⁎Band-3 (630–690 nm) −0.11 −0.29⁎⁎ 0.53⁎⁎Band-4 (760–900 nm) −0.09 −0.29⁎⁎ 0.53⁎⁎Band-5 (1550–1750 nm) 0.00 −0.22⁎ 0.38⁎⁎Band-6 (2080–2350 nm) −0.02 −0.24⁎ 0.50⁎⁎CR1414 0.06 −0.12 0.46⁎⁎CR1913 0.19 −0.19 0.60⁎⁎CR2207 −0.07 −0.13 0.36⁎⁎
⁎, and ⁎⁎ indicate correlation coefficients which are significant at 5%, and 1% level ofsignificance respectively.
over a wide range (band) of wavelength suggesting the possibility ofcharacterizing soil properties based on band reflectance in addition toreflectance at each wavelength values. Specifically, we observed highcorrelation of basic soil andhydraulic properties over blue, green, red, IR,SWIR, and 2000–2300 nm wavelength bands. The ETM+ sensor usesall these six bands (ETM+1 to ETM+5 and ETM+7). Correlationcoefficients listed inTable 2 suggest that theband reflectance in ETM+1and ETM+2 bands are significantly correlated with ln(Ks); bandreflectance at all six bands were significantly correlated with vanGenuchten parameters, ln(α) and n. Similarly, we also observed goodcorrelation between soil hydraulic properties and absorption bands.Among CR factors of three absorption bands, CR1913 was significantlycorrelated with most soil properties (rN0.35); CR1414 and CR2207 werealso correlatedwithρp (r=0.42 and 0.20, respectively) and clay content(r=−0.36 and −0.19, respectively). Overall, correlation analysissuggests that spectral information is comparable to basic soil propertiesin terms of correlation with soil hydraulic properties.
3.3. Stepwise regression and principal component analysis
Scatter plots and correlation analyses showed that several inputvariables are correlated among themselves which is generally termedas heterodasticity. Such heterodasticity in the data was eliminatedthrough the stepwise regression analysis and PCA before PTF/STFdevelopment. Results of the stepwise regression analysis at 5%significance level showed that out of all the basic soil properties claycontents, ρb, and ρp are the important predictor variables for ln(Ks).Similarly, integratedband reflectance values corresponding to ETM+1and ETM+7bands (band-1 and band-6)were the important predictorvariables for ln(Ks) out of six band reflectance and band reflectanceplus 3 CR factors. It was also observed that none of the three CR factorswere significant predictor variables for ln(Ks) at 5% significance level,but CR1913 and CR2207 were significant at 10% level of significance. Thestepwise regression analysis for ln(α) showed that ρb, ln(EC), and pHare important predictor variables among basic soil properties;integrated band reflectance corresponding to ETM+2 (band-2) was
344 P. Santra et al. / Geoderma 152 (2009) 338–349
the only important predictor variable out of six band reflectance andtheir combination with the CR factors. In case of CR factors for ln(α),none was selected at 5% level except CR1913 was important at 10% levelof significance. Similarly, sand content and pHwere observed to be theimportant predictor variables for n among the basic soil properties;band reflectance corresponding to ETM+3 and ETM+1 (band-3 andband-1) were important predictor variables among the six bandreflectance values; and CR1913 and integrated band reflectance forETM+4 (band-4) were the important predictor variables out of thecombination of band reflectance and CR factors. In case of CR factorsfor n, CR1913 was only selected at 5% level of significance.
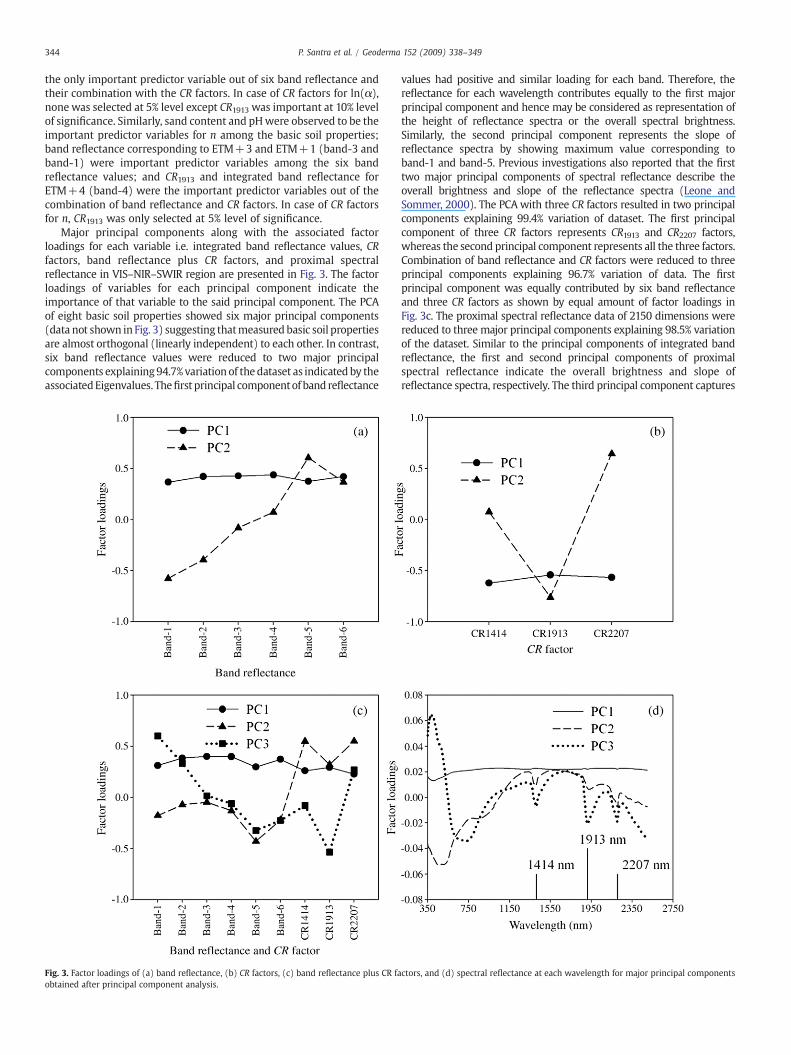
Major principal components along with the associated factorloadings for each variable i.e. integrated band reflectance values, CRfactors, band reflectance plus CR factors, and proximal spectralreflectance in VIS–NIR–SWIR region are presented in Fig. 3. The factorloadings of variables for each principal component indicate theimportance of that variable to the said principal component. The PCAof eight basic soil properties showed six major principal components(data not shown in Fig. 3) suggesting thatmeasured basic soil propertiesare almost orthogonal (linearly independent) to each other. In contrast,six band reflectance values were reduced to two major principalcomponents explaining94.7%variation of thedataset as indicated by theassociatedEigenvalues. Thefirst principal componentof band reflectance
Fig. 3. Factor loadings of (a) band reflectance, (b) CR factors, (c) band reflectance plus CR faobtained after principal component analysis.
values had positive and similar loading for each band. Therefore, thereflectance for each wavelength contributes equally to the first majorprincipal component and hence may be considered as representation ofthe height of reflectance spectra or the overall spectral brightness.Similarly, the second principal component represents the slope ofreflectance spectra by showing maximum value corresponding toband-1 and band-5. Previous investigations also reported that the firsttwo major principal components of spectral reflectance describe theoverall brightness and slope of the reflectance spectra (Leone andSommer, 2000). The PCAwith three CR factors resulted in two principalcomponents explaining 99.4% variation of dataset. The first principalcomponent of three CR factors represents CR1913 and CR2207 factors,whereas the second principal component represents all the three factors.Combination of band reflectance and CR factors were reduced to threeprincipal components explaining 96.7% variation of data. The firstprincipal component was equally contributed by six band reflectanceand three CR factors as shown by equal amount of factor loadings inFig. 3c. The proximal spectral reflectance data of 2150 dimensions werereduced to three major principal components explaining 98.5% variationof the dataset. Similar to the principal components of integrated bandreflectance, the first and second principal components of proximalspectral reflectance indicate the overall brightness and slope ofreflectance spectra, respectively. The third principal component captures
ctors, and (d) spectral reflectance at each wavelength for major principal components
345P. Santra et al. / Geoderma 152 (2009) 338–349
absorption features of reflectance spectra as shown by comparativelyhigher loadings corresponding to absorption peak. Thus, the majorprincipal components of proximal spectral data and the derived spectralindices represent the characteristic features of the reflectance spectra i.e.overall brightness of the spectral reflectance curve, slope of the spectralreflectance curve, and absorption features of the spectral reflectancecurve. Similar typeof relationshipbetweenprincipal components and thecharacteristics features of spectral reflectance curve were reported byLeone and Sommer (2000).
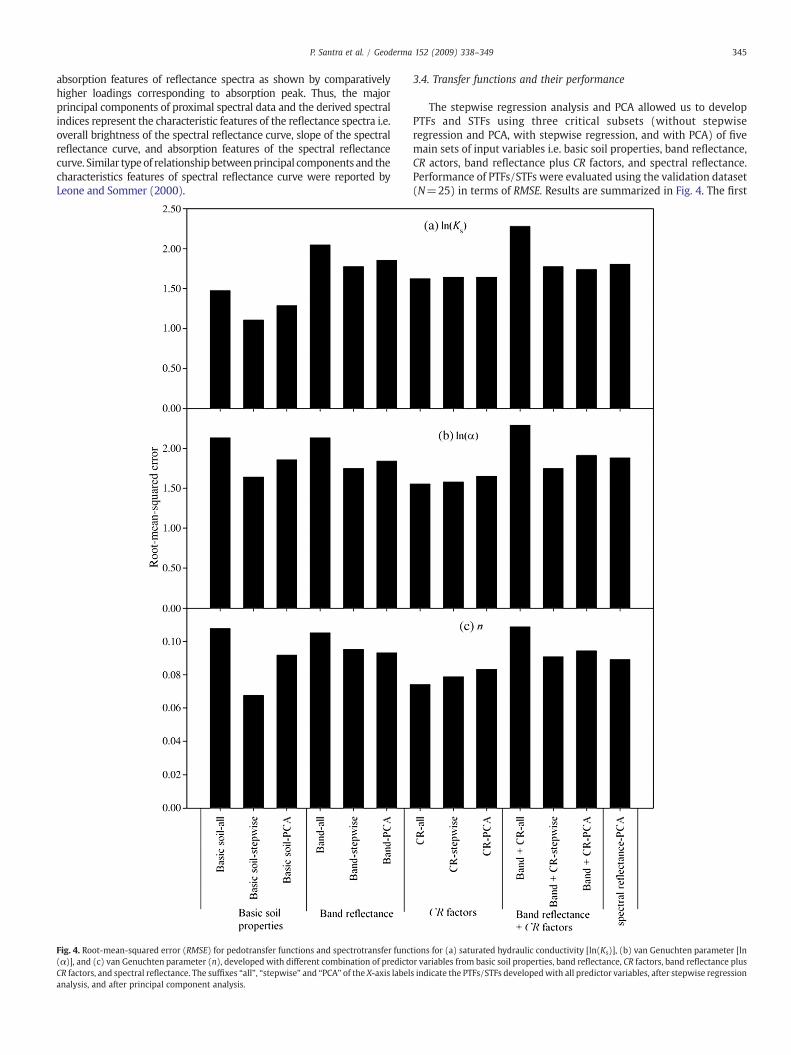
Fig. 4. Root-mean-squared error (RMSE) for pedotransfer functions and spectrotransfer func(α)], and (c) van Genuchten parameter (n), developed with different combination of predictoCR factors, and spectral reflectance. The suffixes “all”, “stepwise” and “PCA” of the X-axis labelanalysis, and after principal component analysis.
3.4. Transfer functions and their performance
The stepwise regression analysis and PCA allowed us to developPTFs and STFs using three critical subsets (without stepwiseregression and PCA, with stepwise regression, and with PCA) of fivemain sets of input variables i.e. basic soil properties, band reflectance,CR actors, band reflectance plus CR factors, and spectral reflectance.Performance of PTFs/STFs were evaluated using the validation dataset(N=25) in terms of RMSE. Results are summarized in Fig. 4. The first
tions for (a) saturated hydraulic conductivity [ln(Ks)], (b) van Genuchten parameter [lnr variables from basic soil properties, band reflectance, CR factors, band reflectance pluss indicate the PTFs/STFs developedwith all predictor variables, after stepwise regression
346 P. Santra et al. / Geoderma 152 (2009) 338–349
group (placed between two vertical line below X-axis) in the left sideof Fig. 4 shows the performances of the PTFs, whereas remaining fourgroups show the performances of STFs. For estimating ln(Ks), PTFsperform better than STFs. This was expected because Ks is largelydependent on ρb and spectral information was poorly correlated withρb in our study (Fig. 2). The PTFs developed with basic soil propertiesobtained through the stepwise regression analysis perform bestamong all PTFs/STFs. The STFs developed with CR factors performnext to PTFs in estimating ln(Ks). For estimating ln(α), the STFsdevelopedwith CR factors performed better than other PTFs/STFs. Thebest performance in estimating ln(α) was observed when all three CRfactors were used for the development of STF. The PTF developed withbasic soil properties obtained through the stepwise regressionanalysis performed next to STFs developed with CR factors. Forestimating n, the PTF developed with basic soil properties obtainedthrough the stepwise regression performed best. The STFs developedwith CR factors performed next to the best PTF in estimating n.Overall, the performances of STFs developed with CR factorsperformed better than other PTFs/STFs. In general, the best perfor-mance was achieved when all three CR factors were considered forPTF development. The PTFs/STFs developed with the set of predictorvariables consisting of both band reflectance and CR factors performedworst because of over-fitting of redundant data.
Comparative study on performance of PTFs/STFs developed withreduced number of predictor variables through the stepwise regres-sion analysis and PCA revealed that the stepwise regression yieldedbetter result than PCA in most cases. Better performance of PTFs/STFsdeveloped with predictor variables obtained in the stepwise regres-sion may be due to removal of predictor variables which are notsignificantly correlated with hydraulic properties and, therefore,eliminating the insignificant variables in the dataset. Although, thereis a possibility of removing theoretically highly correlated variables instepwise analysis, it is preferred for dataset with low dimension.Whenever data dimension is very large, PCA or partial least squareregression may be preferred (e.g., in cases of full reflectance spectra).
In this study, PTFs/STFs were developed with five different sets ofpredictor variables keeping in mind their availability from differentsources for future applications. The PTFs may be used where dataseton specific soil properties are available. For developing countrieswhere soil database is scarce, STFs may be used by utilizing the bandreflectance data collected by the remote sensing satellites. But suchapplication may be restricted in arid or semi-arid regions or for regionwhere large portions of land kept under ploughing condition forcertain period of time (Leone and Sommer, 2000). Specifically, the
Table 3Pedotransfer and spectrotransfer functions for estimating saturated hydraulic conductivity ain visible and near-infrared region.
Hydraulic parameter Predictor variables in PTF/STF
ln(Ks) Basic soil propertiesBand reflectance+CRBand reflectanceCR factorsASD full spectrum
ln(α) Basic soil propertiesBand reflectance+CRBand reflectanceCR factorsASD full spectrum
n Basic soil propertiesBand reflectance+CRBand reflectanceCR factorsASD full spectrum
Sand = sand content (%); Clay = clay content (%); ρb = bulk density (g cm−3); ρp = particl1:2.5 soil solution; Band-1, Band-2, Band-4, and Band-6 are the band reflectance in 450–520first, second, and third principal components respectively obtained after principal componCR2207 are continuum removal factors at 1414 nm, 1913 nm, and 2207 nm respectively.
STFs based on the CR factors obtained from proximally measuredspectral reflectance curve may not be translated with remote sensingdata on spectral because two CR factors (CR1414nm and CR1913nm)considered in this study correspond to water absorption bands andwill be affected by the presence of water vapour in atmosphere.Therefore, CR factors or full reflection spectra may be used as predictorvariables when reflectance spectra are available from the handheld orin some cases, from air-borne sensors. In case of application of STFsinvolving principal components as predictor variables, it may becalculated first by calculating matrix of standard normal variate oforiginal variables followed bymultiplying it with corresponding factorloadings matrix. With this anticipation, we have listed, the best PTF/STF from each five set of predictor variables in Table 3.
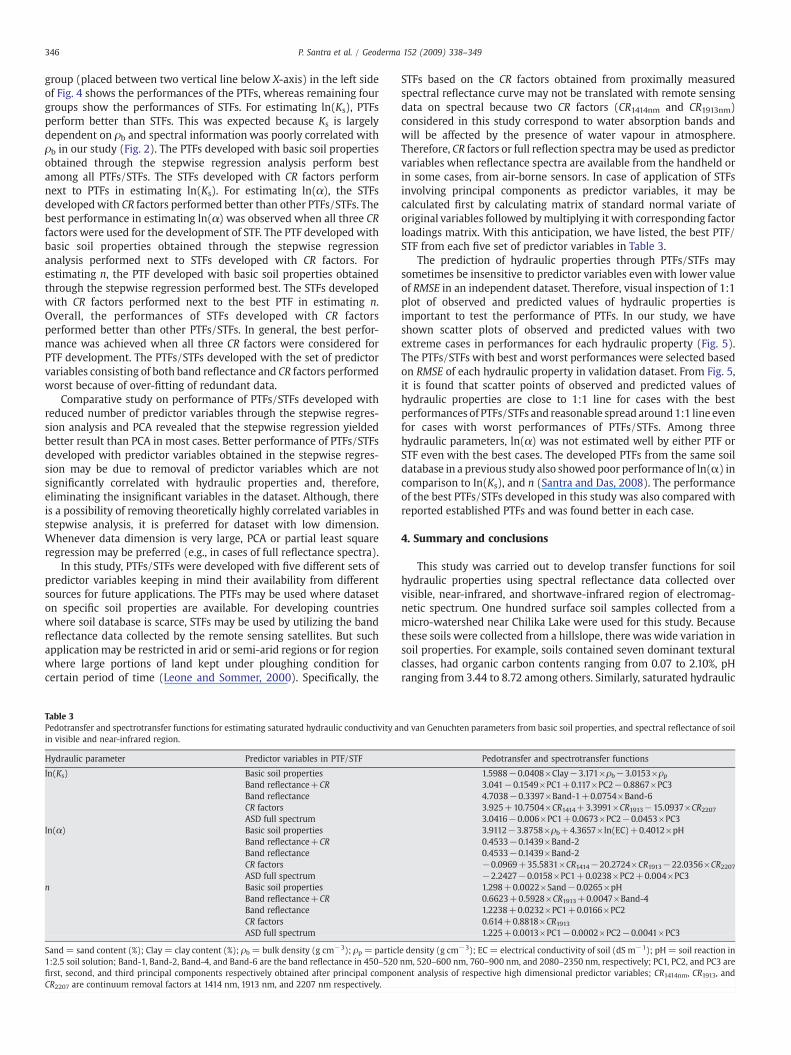
The prediction of hydraulic properties through PTFs/STFs maysometimes be insensitive to predictor variables evenwith lower valueof RMSE in an independent dataset. Therefore, visual inspection of 1:1plot of observed and predicted values of hydraulic properties isimportant to test the performance of PTFs. In our study, we haveshown scatter plots of observed and predicted values with twoextreme cases in performances for each hydraulic property (Fig. 5).The PTFs/STFs with best and worst performances were selected basedon RMSE of each hydraulic property in validation dataset. From Fig. 5,it is found that scatter points of observed and predicted values ofhydraulic properties are close to 1:1 line for cases with the bestperformances of PTFs/STFs and reasonable spread around1:1 line evenfor cases with worst performances of PTFs/STFs. Among threehydraulic parameters, ln(α) was not estimated well by either PTF orSTF even with the best cases. The developed PTFs from the same soildatabase in a previous study also showedpoor performance of ln(α) incomparison to In(Ks), and n (Santra and Das, 2008). The performanceof the best PTFs/STFs developed in this study was also compared withreported established PTFs and was found better in each case.
4. Summary and conclusions
This study was carried out to develop transfer functions for soilhydraulic properties using spectral reflectance data collected overvisible, near-infrared, and shortwave-infrared region of electromag-netic spectrum. One hundred surface soil samples collected from amicro-watershed near Chilika Lake were used for this study. Becausethese soils were collected from a hillslope, there was wide variation insoil properties. For example, soils contained seven dominant texturalclasses, had organic carbon contents ranging from 0.07 to 2.10%, pHranging from 3.44 to 8.72 among others. Similarly, saturated hydraulic
nd van Genuchten parameters from basic soil properties, and spectral reflectance of soil
Pedotransfer and spectrotransfer functions
1.5988−0.0408×Clay−3.171×ρb−3.0153×ρp3.041−0.1549×PC1+0.117×PC2−0.8867×PC34.7038−0.3397×Band-1+0.0754×Band-63.925+10.7504×CR1414+3.3991×CR1913−15.0937×CR22073.0416−0.006×PC1+0.0673×PC2−0.0453×PC33.9112−3.8758×ρb+4.3657×ln(EC)+0.4012×pH0.4533−0.1439×Band-20.4533−0.1439×Band-2−0.0969+35.5831×CR1414−20.2724×CR1913−22.0356×CR2207−2.2427−0.0158×PC1+0.0238×PC2+0.004×PC31.298+0.0022×Sand−0.0265×pH0.6623+0.5928×CR1913+0.0047×Band-41.2238+0.0232×PC1+0.0166×PC20.614+0.8818×CR19131.225+0.0013×PC1−0.0002×PC2−0.0041×PC3
e density (g cm−3); EC = electrical conductivity of soil (dS m−1); pH= soil reaction innm, 520–600 nm, 760–900 nm, and 2080–2350 nm, respectively; PC1, PC2, and PC3 areent analysis of respective high dimensional predictor variables; CR1414nm, CR1913, and
Fig. 5.Observed and predicted values of saturated hydraulic conductivity [ln(Ks)] (a and b), and van Genuchten parameters, ln(α) (c and d), and van Genuchten parameter, n (e and f)with the best performances (left side) and worst performances (right side) among pedotransfer functions and spectrotransfer functions developed with different combination ofpredictor variables for each hydraulic property.
347P. Santra et al. / Geoderma 152 (2009) 338–349
conductivity of soils varied in four orders of magnitude. The vanGenuchten parameter, α was log-normally distributed with a meanvalue of −2.26 with a coefficient of variation 63.72%. The mean valuefor the other van Genuchten parameter, n was 1.22 with a coefficientof variation 7.11%. Such wide variation in basic and soil hydraulicproperties are ideal for developing transfer functions for soil hydraulicproperties (Santra and Das, 2008).
Proximal spectral reflectance of soils at VIS–NIR–SWIR region ofthe spectrum showed three characteristics features: overall brightnessof the reflectance spectra, slope of the reflectance spectra from visibleto near infrared, and three prominent absorption features at 1414 nm,1913 nm, and 2207 nm. These features were well correlated to basicsoil properties. For example, percent reflectance at the wavelength formost regions of reflectance spectra was significantly correlated (|r|=0.3 to 0.6) with particle size distribution, pH, EC, and van Genuchtenparameters. Specifically, we observed high correlation of basic soil and
hydraulic properties with spectral reflectance over blue, green, red, IR,SWIR, and 2000–2300 nmwavelength bands. Such correlation resultsallowed us to develop pedotransfer and spectrotransfer functions forsoil hydraulic properties. Both point PTFs/STFs [for ln(Ks)] andparametric PTFs/STFs [for van Genuchten parameter ln(α) and n]were developed by combining advanced statistical techniques such asstepwise multiple regression, boot-strapping, and principal compo-nent analyses. Developed PTFs/STFs were validated using a validationdataset. Results show that although the performance of STFs is notcomparablewith the PTFs for estimating hydraulic properties, butmaybe applied in case of unavailability of PTFs. In some cases, the STFsperform comparable to PTFs. Specifically, STFs developed with CR1414,CR1913, and CR2207 performed similar to PTFs developed with basic soilproperties; STF developed with CR factors performed better than thePTFs for estimating α. Among three hydraulic properties studied here,van Genuchten parameter n is well predicted by STFs. With
348 P. Santra et al. / Geoderma 152 (2009) 338–349
comparable performance of STFs with PTFs, STFs have the addedadvantage of being more easily developed because of the possibility ofrapidly collecting spectral data compared to basic soil data. Moreover,spectral data may be collected over a large surface area and may besuitable for getting area-averages of hydraulic properties.
A specific limitation of this study is that the STFs were developedusing air-dried and disturbed soil samples collected from top 10 cmsoil surface. True structural attributes of soil are typically not fullyretained in loose and disturbed soil samples. Thus, the STFs developedin this may be applicable only to surface soils. Future work is neededto examine if the STFs may be developed from undisturbed soilsamples. Second, it may be possible that the transfer functions for soilhydraulic properties may be developed from the signatures of non-invasive methods such as FDEM and GPR sensors, which can measuresoil properties in deeper soils (Ben Dor et al., 2008). Furthermore, thesix wave bands selected for the analysis of the proximal reflectancedata are the wave bands used in the ETM+ sensors onboard remotesensing satellites. This suggests that, if rigorously evaluated, themethod outlined here may be suitable for large scale applications viadirect measurements through remote sensing. Finally, a rigoroustesting in different geographical regions is warranted to establish theutility of STFs as a method for estimating soil hydraulic properties.
Acknowledgements
The senior author acknowledges the Indian Council of AgriculturalResearch, New Delhi for granting permission for study leave at IIT,Kharagpur.
References
Ben-Dor, E., Banin, A., 1995. Near infrared analysis as a rapid method to simultaneouslyevaluate several soil properties. Soil Sci. Soc. Am. J. 59, 364–372.
Ben-Dor, E., Inbar, Y., Chen, Y., 1997. The reflectance spectra of organic matter in thevisible near-infrared and short wave infrared region (400–2500 nm) during acontrolled decomposition process. Remote Sens. Environ. 61, 1–15.
Ben-Dor, E., Irons, J., Epema, G., 1999. Soil spectroscopy, In: Rencz, A. (Ed.), Manual ofRemote Sensing, 3rd edn. John Wiley and Sons, New York, pp. 111–188.
Ben-Dor, E., Gollshleger, N., Benyamini, Y., Agassi, M., Blumberg, D.G., 2003. The spectralreflectance properties of soil structural crusts in the 1.2- to 2.5-µm spectral region.Soil Sci. Soc. Am. J. 67, 289–299.
Ben Dor, E., Goldshleger, N., Eshel, M., Mirablis, V., Bason, U., 2008. Combined active andpassive remote sensing methods for assessing soil salinity. In: Metternicht, G.,Zinck, A. (Eds.), Remote Sensing of Soil Salinization: Impact on Land Management.CRC Press, USA, pp. 235–258.
Blake, G.R., Hartge, K.H., 1986. Bulk density. In: Klute, A. (Ed.), Methods of Soil Analysis,Part 1, Agronomy Monograph No. 9. ASA and SSSA, pp. 363–375. Madison, WI.
Bouma, J., 1989. Using soil survey data for quantitative land evaluation. Adv. Soil Sci. 9,117–123.
Brown, D.J., Shepherd, K.D., Walsh, M.G., Dewayne Mays, M., Reinsch, T.G., 2006. Globalsoil characterization with VNIR diffuse reflectance spectroscopy. Geoderma 132,273–290.
Carsel, R.F., Parrish, R.S., 1988. Developing joint probability distributions of soil waterretention characteristics. Water Resour. Res. 24, 755–769.
Chabrillat, S., Goetz, A.F.H., Krosley, S., Olsen, H.W., 2002. Use of hyperspectral images inthe identification and mapping of expansive clay soils and the role of spatialresolution. Remote Sens. Environ. 82, 431–445.
Chang, C., Laird, D.A., Mausbach, M.J., Hurburgh, C.R., 2001. Near-infrared reflectancespectroscopy— principal component regression analyses of soil properties. Soil Sci.Soc. Am. J. 65, 480–490.
Cornelis, W.M., Ronsyn, J., van Meirvenne, M., Hartmann, R., 2001. Evaluation ofpedotransfer functions for predicting the soil moisture retention curve. Soil Sci. Soc.Am. J. 65, 638–648.
Dunn, B.W., Beecher, H.G., Batten, G.D., Ciavarella, S., 2002. The potential of near-infrared reflectance spectroscopy for soil analysis — a case study from the RiverinePlain of south-eastern Australia. Aust. J. Exp. Agric. 42 (5), 607–614.
Efron, B., Tibshirani, R.J., 1993. An introduction to the bootstrap. Monographs onStatistics and Applied Probability, vol. 57. Chapman and Hall, London, UK.
Flint, A.L., Flint, L.E., 2002. Particle density. In: Dane, J.H., Topp, G.C. (Eds.), Methods ofSoil Analysis, Part 4—Physical Methods. Soil Science Society of America, Inc.,Madison, WI, USA, pp. 229–240.
Gee, G.W., Bauder, J.W., 1986. Particle-size analysis. In: Klute, A. (Ed.), Methods of SoilAnalysis Part I, Physical andMineralogical Methods. Soil Science Society of America,Madison, WI, USA, pp. 383–412.
Goldshleger, N., Ben-Dor, E., Benyamini, Y., Agassi, M., 2004. Soil reflectance as a tool forassessing physical crust arrangement of four typical soils in Israel. Soil Sci. 169 (10),677–687.
Hair Jr., J.F., Anderson, R.E., Tatham, R.L., Black, W.C., 1995. Multivariate data analysis.Prentice Hall, Englewood Cliffs, New Jersey.
Henderson, T.L., Szilagyi, A., Baumgardner, M.F., Chen, C.T., Landgrebe, D.A., 1989.Spectral band selection for classification of soil organic matter content. Soil Sci. Soc.Am. J. 53, 1778–1784.
Hills, R.G., Hudson, D.B., Wierenga, P.J., 1992. Spatial variability at the Las Cruces Trenchsite. In: van Genuchten, M.Th., Leij, F.J. (Eds.), Proceedings of the InternationalWorkshop on Indirect Methods for Estimating the Hydraulic Properties ofUnsaturated Soils, Riverside, California, USA, pp. 529–538.
Hodnett, M.G., Tomasella, J., 2002. Marked differences between van Genuchten soilwater-retention parameters for temperate and tropical soils: a newwater-retentionpedotransfer functions developed for tropical soils. Geoderma 108, 155–180.
ICAR, 2006. Soil. Handbook of Agriculture. Indian Council of Agricultural Research, NewDelhi, India.
Islam, K., Singh, B., McBratney, A., 2003. Simultaneous estimation of several soilproperties by ultra-violet, visible, and near infrared reflectance spectroscopy. Aust.J. Soil Res. 41 (6), 1101–1114.
Jana, R.B., Mohanty, B.P., Springer, E.P., 2007. Multiscale pedotransfer functions for soilwater retention. Vadose Zone J. 06, 868–878.
Jana, R.B., Mohanty, B.P., Springer, E.P., 2008. Multiscale Bayesian neural networks forsoil water content estimation. Water Resour. Res. 44, W08408. doi:10.1029/2008WR006879.
Janik, L.J., Merry, R.H., Forrester, S.T., Lanyon, D.M., Rawson, A., 2007. Rapid prediction ofsoil water retention using mid infrared spectroscopy. Soil Sci. Soc. Am. J. 71,507–514.
Klute, A., Dirksen, C., 1986. Hydraulic conductivity and diffusivity: laboratory methods,In: Klute, A. (Ed.), Methods of Soil Analysis. Part 1, 2nd ed.: Agron. Monogr., vol. 9.ASA and SSSA, Madison, WI, pp. 687–734.
Lagacherie, P., Baret, F., Feret, J.B., Madeira Netto, J., Robbez-Masson, J.M., 2008.Estimation of soil clay and calcium carbonate using laboratory, field, and airbornehyperspectral measurements. Remote Sens. Environ. 112 (3), 825–835.
Lee, D.M., Reynolds, W.E., Elrich, D.E., Clothiers, B.E., 1985. A comparison of three fieldmethods for measuring saturated hydraulic conductivity. Can. J. Soil Sci. 65,563–573.
Leone, A.P., Sommer, S., 2000. Multivariate analysis of laboratory spectra for theassessment of soil development and soil degradation in the Southern Apennines(Italy). Remote Sens. Environ. 72, 346–359.
Li, Y., Chen, D., White, R.E., Zhu, A., Zhang, J., 2007. Estimating soil hydraulic properties ofFengiu county soils in the North China Plain using pedotransfer functions.Geoderma 138 (3–4), 261–271.
McBratney, A.B., Minasny, B., Cattle, S.R., Vervoort, R.W., 2002. From pedotransferfunctions to soil inference systems. Geoderma 109, 41–73.
McCarty, G.W., Reeves III, G.B., Reeves, V.B., Follett, R.F., Kimble, J.M., 2002. Mid-infraredand near-infrared diffuse reflectance spectroscopy for soil carbon measurement.Soil Sci. Soc. Am. J. 66, 640–646.
Minasny, B., McBratney, A.B., 2002. The neuro-m method for fitting neural networkparametric pedotransfer functions. Soil Sci. Soc. Am. J. 66, 352–361.
Minasny, B., Hopmans, J.W., Harter, T., Eching, S.O., Tuli, A., Denton, M.A., 2004. Neuralnetwork predictions of soil hydraulic functions for alluvial soils using multistepoutflow data. Soil Sci. Soc. Am. J. 68, 417–429.
Mouazen, A.M.,Maleki,M.R., Baerdemaeker, J.D., Ramon, H., 2007. On-linemeasurementof some selected soil properties using a VIS-NIR sensor. Soil Tillage Res. 93, 13–27.
Nanni, M.R., Demattê, J.A.M., 2006. Spectral reflectance methodology in comparison totraditional soil analysis. Soil Sci. Soc. Am. J. 70, 393–407.
NBSS&LUP, 2005. Soil Series of Orissa. National Bureau of Soil Survey and Land UsePlanning, Nagpur, India.
Nemes, A., Rawls, W.J., Pachepsky, Ya.A., 2006. Use of the non-parametric nearestneighbor approach to estimate soil hydraulic properties. Soil Sci. Soc. Am. J. 70,327–336.
Odlare, M., Svensson, K., Pell, M., 2005. Near infrared reflectance spectroscopy forassessment of spatial soil variation in an agricultural field. Geoderma 126, 193–202.
Pachepsky, Ya.A., Timlin, D.J., Rawls, W.J., 2001. Soil water retention as related totopographical variables. Soil Sci. Soc. Am. J. 65, 1787–1795.
Pachepsky, Y.A., Rawls, W.J., Lin, H.S., 2006. Hydropedology and pedotransfer functions.Geoderma 131, 308–316.
Paige, G.B., Hillel, D., 1993. Comparison of three methods for assessing soil hydraulicproperties. Soil Sci. 155, 175–189.
Rawls, W.J., Brakensiek, D.L., Saxton, K.E., 1982. Estimation of soil water properties.Trans. ASAE 25, 1316–1320.
Rawls, W.J., Gish, T.J., Brakensiek, D.L., 1991. Estimating soil water retention from soilphysical properties and characteristics. Adv. Soil Sci. 16, 213–234.
Reeves, J., McCarty, G., Mimmo, T., 2002. The potential of diffuse reflectance spectro-scopy for the determination of carbon inventories in soils. Environ. Pollut. 116,277–284.
Romano, N., Palladino, M., 2002. Prediction of soil water retention using soil physicaldata and terrain attributes. J. Hydrol. 265, 56–75.
Santra, P. 2009. Delineation and characterization of hydrologically-similar zones basedon spatial distribution of soil hydraulic properties. PhD thesis. Indian Institute ofTechnology, Kharagpur.
Santra, P., Das, B.S., 2008. Pedotransfer functions for soil hydraulic properties developedfrom a hilly watershed of Eastern India. Geoderma 146, 439–448.
Schaap, M.G., Leij, F.J., van Genuchten, M.Th., 1998. Neural network analysis forhierarchical prediction of soil hydraulic properties. Soil Sci. Soc. Am. J. 62, 847–855.
349P. Santra et al. / Geoderma 152 (2009) 338–349
Schaap, M.G., Leij, F.J., van Genuchten, M.Th., 2001. Rosetta: a computer program forestimating soil hydraulic parameters with hierarchical pedotransfer functions.J. Hydrol. 251, 163–176.
Scheinost, A.C., Sinowski, W., Auerswald, A.,1997. Regionalization of soil water retentioncurves in a highly variable soilscape, I. Developing a new pedotransfer function.Geoderma 78, 129–143.
Sharma, S.K., Mohanty, B.P., Zhu, J., 2006. Including topograph and vegetation attributesfor developing pedotransfer functions. Soil Sci. Soc. Am. J. 70, 1430–1440.
Shepherd, K.D., Walsh, M.G., 2002. Development of reflectance spectral libraries forcharacterization of soil properties. Soil Sci. Soc. Am. J. 66, 988–998.
Šimunek, J., Angulo-Jaramillo, R., Schaap, M.G., Vandervaere, J., van Genuchten, M.T.,1998. Using an inverse method to estimate the hydraulic properties of crusted soilsfrom tension-disc infiltrometer data. Geoderma 86, 61–81.
Stevens, A., van Wesemael, B., Vandenshrick, G., Toure, S., Tychon, B., 2006. Detection ofcarbon stock changes in agricultural soil using spectroscopic techniques. Soil Sci.Soc. Am. J. 70, 844–850.
Tamari, S., Wösten, J.H.M., 1999. Using artificial neural networks to developpedotransfer functions of soil hydraulic conductivity. In: van Genuchten, M.Th.,et, al. (Eds.), Proceedings of the International Workshop on Characterization andMeasurement of the Hydraulic Properties of Unsaturated Porous Media. Universityof California, Riverside, CA, pp. 1251–1260.
Thine, C., Shephered, K., Walsh, M., Coe, R., Okwach, G., 2004. Application of GIS andRemote Sensing in Characterization of Soil Hydraulic Properties for Soil PhysicalQuality Assessment. Univeristy of Nairobi, Kenya, pp. 1–18.
Tomasella, J., Hodnett, M.G., 1998. Estimating soil water retention characteristics fromlimited data in Brazilian Amazonia. Soil Sci. 163, 190–202.
Van Genuchten, M.Th., 1980. A close-form equation for predicting the hydraulicconductivity of unsaturated soils. Soil Sci. Soc. Am. J. 44, 892–898.
Vereecken, H., Maes, J., Feyen, J., Darius, P., 1989. Estimating the soil moisture retentioncharacteristics from texture, bulk density and carbon content. Soil Sci. 148,389–403.
Viscara Rosel, R.A., Walvoort, D.J.J., McBratney, A.B., Janik, L.J., Skjemstad, J.O., 2006.Visible, near infrared, mid infrared or combined diffuse reflectance spectroscopy forsimultaneous assessment of various soil properties. Geoderma 131, 59–75.
Walkley, A.J., Black, I.A., 1934. An examination of Degtjareff method for determining soilorganic matter and a proposed modification of the chromic acid titration method.Soil Sci. 37, 29–38.
Wösten, J.H.M., Lilly, A., Nemes, A., Le Bas, C., 1999. Development and use of a databaseof hydraulic properties of European soils. Geoderma 90, 169–185.
Wösten, J.H.M., Pachepsky, Ya.A., Rawls, W.J., 2001. Pedotransfer functions: bridging thegap between available basic soil data and missing soil hydraulic characteristics.J. Hydrol. 251, 123–150.